thermal coal - anglo american plc · thermal coal. in south africa, thermal coal owns and operates...
TRANSCRIPT

THERMAL COALIn South Africa, Thermal Coal owns and operates nine mines. In Colombia, we have a one-third shareholding (with BHP Billiton and Xstrata each owning one-third) in Cerrejón, Colombia’s biggest thermal coal exporter.
Thermal coal is the most abundant source of fossil fuel energy in the world. Exceeding known reserves of oil and gas, it accounts for more than 40% of electricity generation.
FINANCIAL HIGHLIGHTS
2012
2011
2010
2009
Operating margin%
29.0
24.8
33.0
23.0
0 2010 30 40
0 10 3520 40 50 60 70
2011
2012
2010
2009
Anglo American coal production from Thermal Coal Mt
EskomTrade – Thermal South AfricaTrade – Metallurgical South AfricaTrade – Thermal Cerrejón
69.3
68.5
67.8
68.7
2012
2011
2010
2009
Share of Group net operating assets %
4
5
4
4
0 21 543 6
2012
2011
2010
2009
Share of Group operating profit %
15
7
11
13
0 84 1612 20
2012
2011
2010
2009
Underlying earnings $ m
517
512
902
523
0 400200 800600 1,000
Anglo American plc Fact Book 2012/13 52
THERMAL COAL FINANCIAL HIGHLIGHTS
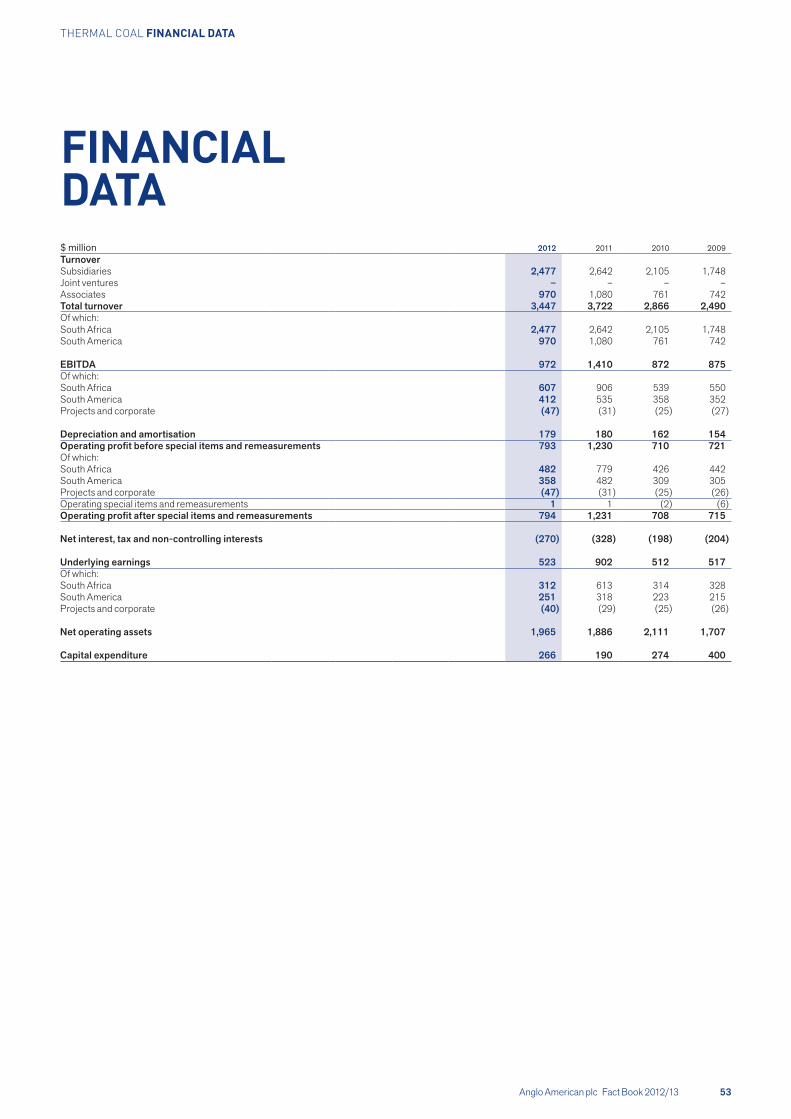
FINANCIAL DATA$ million 2012 2011 2010 2009TurnoverSubsidiaries 2,477 2,642 2,105 1,748Joint ventures – – – –Associates 970 1,080 761 742Total turnover 3,447 3,722 2,866 2,490Of which:South Africa 2,477 2,642 2,105 1,748South America 970 1,080 761 742
EBITDA 972 1,410 872 875Of which:South Africa 607 906 539 550South America 412 535 358 352Projects and corporate (47) (31) (25) (27)
Depreciation and amortisation 179 180 162 154Operating profit before special items and remeasurements 793 1,230 710 721Of which:South Africa 482 779 426 442South America 358 482 309 305Projects and corporate (47) (31) (25) (26)Operating special items and remeasurements 1 1 (2) (6)Operating profit after special items and remeasurements 794 1,231 708 715
Net interest, tax and non-controlling interests (270) (328) (198) (204)
Underlying earnings 523 902 512 517Of which:South Africa 312 613 314 328South America 251 318 223 215Projects and corporate (40) (29) (25) (26)
Net operating assets 1,965 1,886 2,111 1,707
Capital expenditure 266 190 274 400
Anglo American plc Fact Book 2012/13 53
THERMAL COAL FINANCIAL DATA

BUSINESSOVERVIEW
Key financial and non-financial performance indicators
$ million (unless otherwise stated) 2012 2011
Underlying operating profit 793 1,230
South Africa 482 779
Colombia 358 482
Projects and corporate (47) (31)
Underlying EBITDA 972 1,410
Net operating assets 1,965 1,886
Capital expenditure 266 190
Share of Group underlying operating profit 13% 11%
Share of Group net operating assets 4% 4%
Non-financial indicators 2012 2011
Number of fatal injuries 2 2
Lost-time injury frequency rate 0.20 0.19
Total energy consumed in 1,000 GJ 5,742 5,823
Total greenhouse gas emissions in 1,000 tonnes CO2e 1,620 2,583
Total water used for primary activities in 1,000 m3 8,525 8,260
UNDERLYING OPERATING PROFIT(2011: $1,230 m)
$793 mSHARE OF GROUP UNDERLYING OPERATING PROFIT(2011: 11%)
13%UNDERLYING EBITDA(2011: $1,410 m)
$972 m
Our Thermal Coal business operates in South Africa and Colombia. In South Africa, Thermal Coal wholly owns and operates seven mines. It also has a 73% stake in two mines, Kriel and the Zibulo colliery, a multi-product operation which produces thermal coal for both export and Eskom, the state-owned power utility, with the balance held by Inyosi Coal, a broad-based black economic empowerment entity. In addition, Thermal Coal has a 50% interest in the Mafube colliery and Phola washing plant.
Six of the mines collectively supply 23 million tonnes per annum (Mtpa) of thermal coal to both the export and local markets. New Vaal, New Denmark and Kriel collieries are domestic product operations supplying 29 Mtpa of thermal coal to Eskom. Isibonelo mine produces 5 Mtpa of thermal coal for Sasol Synthetic Fuels, the coal-to-liquids producer, under a 20 year supply contract.
Thermal Coal’s South African operations currently route all export thermal coal through the Richards Bay Coal Terminal (RBCT), in which it has a 24.2% shareholding, to customers throughout the Mediterranean-Atlantic and Asia-Pacific regions. Export production volumes are expected to increase in the future owing to yield improvements and increased production of lower calorific value coal.
In Colombia, Anglo American, BHP Billiton and Xstrata each have a one-third shareholding in Cerrejón, the country’s largest thermal coal exporter. In 2011, an expansion (P40)was approved to increase this capacity by 8 Mtpa to 40 Mtpa by 2015 (13.3 Mtpa attributable). Cerrejón owns and operates its own rail and deep water port facilities and sells into the export thermal and PCI markets.
Thermal Coal’s attributable Measured and Indicated Resources (including projects) in addition to Coal Reserves totals some 2.6 billion tonnes.
Anglo American plc Fact Book 2012/13 54
THERMAL COAL BUSINESS OVERVIEW

Key Open cut Underground Open cut and underground Other
1 100% Goedehoop2 100% Greenside3 100% Kleinkopje4 100% Landau5 73% Zibulo6 50% Mafube
7 24.2% Richards Bay Coal Terminal
4 63 15
7
2
1 33% Cerrejón (Colombia)
1
OUR THERMAL COAL EXPORT OPERATIONSMap excludes Domestic and Synfuel operations
South Africa
South America
Anglo American plc Fact Book 2012/13 55
THERMAL COAL BUSINESS OVERVIEW
Thermal coal is the most abundant source of fossil fuel energy in the world. Exceeding known reserves of oil and gas, it accounts for more than 40% of electricity generation. Thermal coal has dominated global energy demand, accounting for 45% of primary energy demand growth from 2011–2012. The near 55% increase in coal demand over the past decade is roughly equivalent to three times US coal consumption on an energy- adjusted basis.
The bulk of coal production is used in power generation; decisions that affect the energy mix of power generation therefore influence coal demand. These include long term industry dynamics for nuclear, gas and renewable power generation and policy decisions on climate/environmental legislation.
In 2012, export seaborne thermal coal accounted for 910 Mt or 17.5% of total coal production, with a large proportion of seaborne production coming from four key basins: Indonesia, Australia, Colombia and South Africa. Demand for seaborne thermal coal has increased by 73.5% since 2001, and is expected to continue to grow for at least the next decade, driven by India and China’s import requirements.
Consequently, the key risks to the medium term growth of export seaborne thermal revolve around the ability of India and China to sustain their rates of economic growth, as well as logistical constraints and cost inflation pressures.
INDUSTRYOVERVIEW
In the last few years, the coal industry has seen growth in US exports, particularly to Europe, due to the availability of low priced US natural gas. In 2012, US exports peaked to 55 Mt from 25 Mt in 2010, driving down export coal prices. US power utilities continue to substitute coal with gas-powered generation; however the long term view is that the natural gas price will remain between $4–6/million British Thermal Unit (mmbtu), at which point most of the coal volumes currently lost to gas should revert to being economically viable.
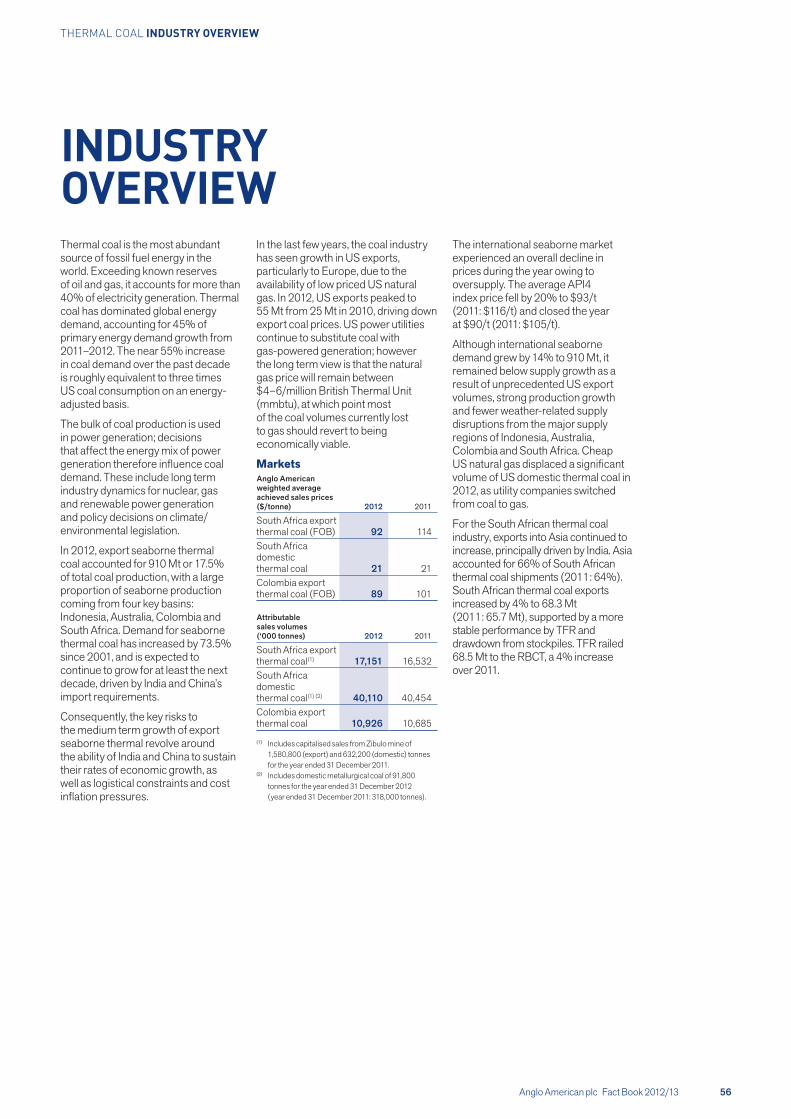
MarketsAnglo American weighted average achieved sales prices ($/tonne) 2012 2011
South Africa export thermal coal (FOB) 92 114South Africa domestic thermal coal 21 21Colombia export thermal coal (FOB) 89 101
Attributable sales volumes (‘000 tonnes) 2012 2011
South Africa export thermal coal(1) 17,151 16,532South Africa domestic thermal coal(1) (2) 40,110 40,454Colombia export thermal coal 10,926 10,685
(1) Includes capitalised sales from Zibulo mine of 1,580,800 (export) and 632,200 (domestic) tonnes for the year ended 31 December 2011.
(2) Includes domestic metallurgical coal of 91,800 tonnes for the year ended 31 December 2012 (year ended 31 December 2011: 318,000 tonnes).
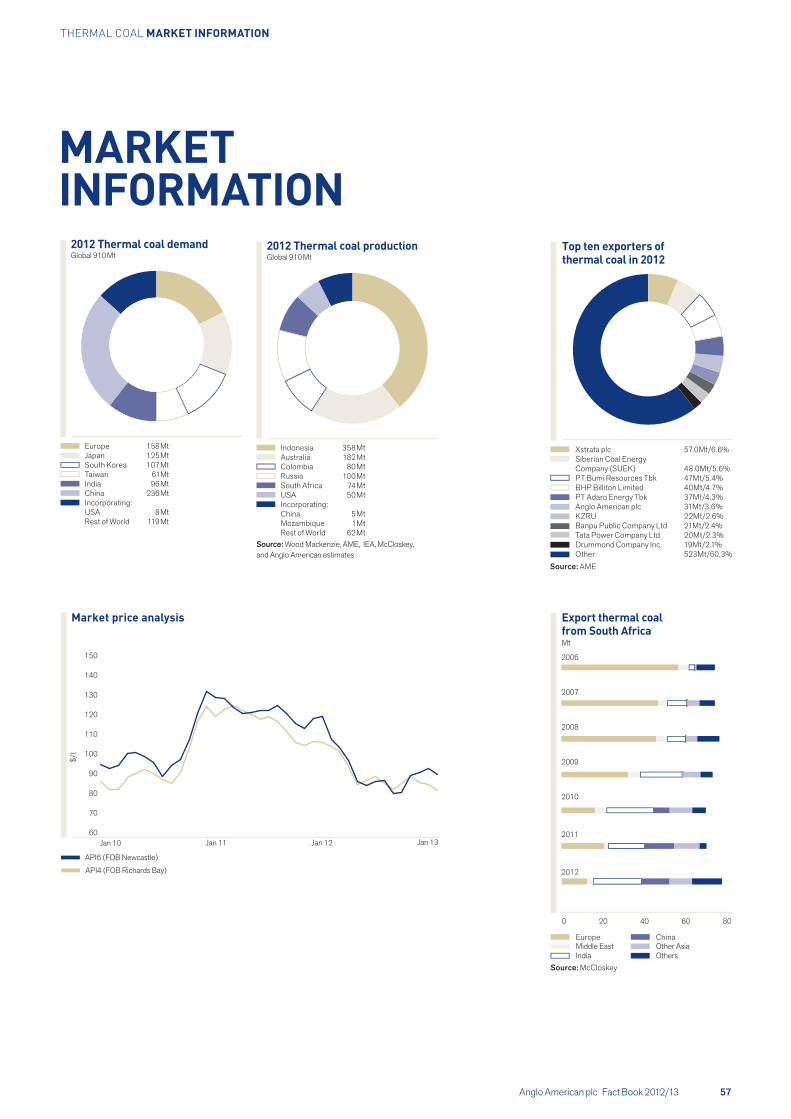
The international seaborne market experienced an overall decline in prices during the year owing to oversupply. The average API4 index price fell by 20% to $93/t (2011: $116/t) and closed the year at $90/t (2011: $105/t).
Although international seaborne demand grew by 14% to 910 Mt, it remained below supply growth as a result of unprecedented US export volumes, strong production growth and fewer weather-related supply disruptions from the major supply regions of Indonesia, Australia, Colombia and South Africa. Cheap US natural gas displaced a significant volume of US domestic thermal coal in 2012, as utility companies switched from coal to gas.
For the South African thermal coal industry, exports into Asia continued to increase, principally driven by India. Asia accounted for 66% of South African thermal coal shipments (2011: 64%). South African thermal coal exports increased by 4% to 68.3 Mt (2011: 65.7 Mt), supported by a more stable performance by TFR and drawdown from stockpiles. TFR railed 68.5 Mt to the RBCT, a 4% increase over 2011.
Anglo American plc Fact Book 2012/13 56
THERMAL COAL INDUSTRY OVERVIEW
MARKET INFORMATION
2012 Thermal coal production Global 910 Mt
Indonesia 358 MtAustralia 182 MtColombia 80 MtRussia 100 MtSouth Africa 74 MtUSA 50 MtIncorporating:China 5 MtMozambique 1MtRest of World 62 Mt
Source: Wood Mackenzie, AME, IEA, McCloskey, and Anglo American estimates
2012 Thermal coal demand Global 910 Mt
Europe 158 MtJapan 125 MtSouth Korea 107 MtTaiwan 61MtIndia 96 MtChina 236 MtIncorporating:USA 8 MtRest of World 119 Mt
Xstrata plc 57.0Mt/6.6%Siberian Coal Energy Company (SUEK) 48.0Mt/5.6%PT Bumi Resources Tbk 47Mt/5.4%BHP Billiton Limited 40Mt/4.7%PT Adaro Energy Tbk 37Mt/4.3%Anglo American plc 31Mt/3.6%KZRU 22Mt/2.6%Banpu Public Company Ltd 21Mt/2.4%Tata Power Company Ltd 20Mt/2.3%Drummond Company Inc. 19Mt/2.1%Other 523Mt/60.3%
Source: AME
Top ten exporters of thermal coal in 2012
0 20 40 60 80
2009
2010
2008
2007
2006
Export thermal coal from South Africa Mt
EuropeMiddle EastIndia
ChinaOther AsiaOthers
2011
2012
Source: McCloskey
Market price analysis
API6 (FOB Newcastle)
API4 (FOB Richards Bay)
$/t
Jan 10 Jan 13Jan 11 Jan 1260
70
80
90
100
150
120
110
130
140
Anglo American plc Fact Book 2012/13 57
THERMAL COAL MARKET INFORMATION
The business is focused on being a high margin producer of thermal coal, while maintaining its domestic market commitments.
Thermal coal demand is being driven by emerging markets’ economic growth and its reliance on low cost, readily available supply. China and India will constitute the majority of thermal coal growth, with demand likely to exceed domestic thermal coal supply, thereby causing an upswing in seaborne thermal coal markets in future years. In South Africa, demand for new coal supply is increasing and is expected to continue to grow in order to supply Eskom’s future coal requirements.
In support of the strategy to maximise the value of its portfolio of operating mines, Thermal Coal’s current primary focus is on implementing asset optimisation initiatives such as Project Khulisa, and integrated mine planning (Project EVO). The goal of Khulisa (meaning ‘to grow’) is to determine the operation’s true performance potential and implement programmes to achieve these targets. In 2012, the project identified and pursued a total of 88 initiatives, ranging from operational improvements to changing mind-sets and behaviours. Project Khulisa will continue in 2013.
In addition to assessing the development and growth options in its existing geographies, Thermal Coal is constantly evaluating potential opportunities in new and strategic geographies.
ProjectsFeasibility studies on the New Largo project were completed in 2012. There are two stages to the project: Stage 1 comprises a 23 kilometre overland conveyor, which will run from an existing coal processing plant to Eskom’s Kusile power station, transporting a secondary product as well as other third-party coal. Stage 2 entails the construction of a new opencast colliery and associated infrastructure. The project is expected to be presented for board approval once all environmental permits have been obtained for both stages of the project and the coal supply and other commercial agreements have been concluded.
The Cerrejón expansion project (P40), to increase the port and logistics chain capacity to handle a total mine output of 40 Mtpa (currently 32 Mtpa), is being implemented and is expected to be delivered on schedule.
STRATEGY
Anglo American plc Fact Book 2012/13 58
THERMAL COAL STRATEGY

Elders multi-product project Overall capex: TBD
CountrySouth Africa
The previously classified Elders open cut and underground projects have now been combined and are being evaluated as a multi-product underground mine, producing export and a lower grade middlings product.
Ownership73% Anglo American Production volume3.1 Mtpa thermalFull project capexTBDFull productionTBD
New Largo Overall capex: TBD
CountrySouth Africa
The New Largo project, currently at feasibility stage, has two main elements: a conveyor which will run from the existing phola processing plant to an Eskom power station and a new opencast mine. Thermal Coal is currently negotiating a coal supply agreement with Eskom for delivery into its Khusile power station. Initial coal is expected in 2016.
Ownership73% Anglo American Production volume11 Mtpa thermalFull project capexTBDFull productionTBD
Cerrejón P40 Overall capex: $<2bn
CountryColombia
P40 project is an expansion of current production from 32 Mtpa to 40 Mtpa at full production. The increase in tonnage will be achieved by systematically eliminating bottlenecks and constraints in the production, processing and transportation of coal. The project was approved by Cerrejón’s three shareholders in the third quarter of 2011. First coal is targeted during the fourth quarter of 2013, with the project expected to achieve full production at the end of 2015.
Ownership33% Anglo AmericanProduction volume8 Mtpa thermal (100%)Full project capex$<2bnFull production2015
PROJECT PIPELINE – KEY PROJECTS
Anglo American plc Fact Book 2012/13 59
THERMAL COAL STRATEGY

PRODUCTION DATAProduction (tonnes) 2012 2011 2010 2009South AfricaEskom 33,706,400 35,296,000 36,403,400 36,225,100Thermal (non-Eskom) 23,351,200 21,388,100 21,612,000(1) 22,185,900(1)
Metallurgical 74,100 323,400 436,500 747,100South Africa Total 57,131,700 57,007,500 58,451,900(1) 59,158,100(1)
South America(2)
Thermal 11,548,800 10,751,700 10,060,100 10,189,600Total Thermal Coal segment 68,680,500 67,759,200 68,512,000(1) 69,347,700(1)
South AfricaGreenside 2,883,200 2,853,100 3,425,000 3,294,600Goedehoop 4,859,900 5,200,800 6,026,200 6,905,000Isibonelo 5,399,200 4,338,200 4,569,100 5,061,900Kriel 8,096,900 8,151,700 9,526,100 11,161,700Kleinkopje 3,765,500 4,400,600 4,423,600 4,414,000Landau 4,272,300 4,171,200 4,085,800 4,231,500New Denmark 3,401,200 4,812,600 5,051,600 3,728,900New Vaal 17,623,300 17,399,700 17,235,300 17,553,700Nooitgedacht – – – 475,000Mafube 1,804,100 2,313,100 2,447,700 2,212,800Zibulo 5,026,100 3,366,500 1,661,500 119,000Total 57,131,700 57,007,500 58,451,900(1) 59,158,100(1)
South AmericaCarbones Del Cerrejón 11,548,800 10,751,700 10,060,100 10,189,600Total 11,548,800 10,751,700 10,060,100 10,189,600
(1) Zibulo commenced commercial production on 1 October 2011. Revenue and related costs associated with 2,155 kt of production in 2011 have been capitalised before commercial production was reached. The 2,155 kt includes Eskom coal of 633 kt and export thermal coal production of 1,522 kt.
Anglo American plc Fact Book 2012/13 60
THERMAL COAL PRODUCTION DATA

THERMAL COAL Coal Reserve and Coal Resource estimates as at 31 December 2012
Anglo American plc Fact Book 2012/13 61
THERMAL COAL COAL RESERVES AND COAL RESOURCES
THERMAL COAL The Coal Reserve and Coal Resource estimates were compiled in accordance with The South African Code for the Reporting of Exploration Results, Mineral Resources and Mineral Reserves, (The SAMREC Code, 2007 Edition as amended July 2009) and the Australasian Code for Reporting of Exploration Results, Mineral Resources and Ore Reserves (The JORC Code, 2004) as applicable. The figures reported represent 100% of the Coal Reserves and Coal Resources, the percentage attributable to Anglo American plc is stated separately. Rounding of figures may cause computational discrepancies. Anglo American Thermal Coal comprises the dominantly export and domestic thermal coal operations, located in Colombia and South Africa.
Thermal Coal – Colombia Operations MineROM Tonnes Yield Saleable Tonnes Saleable Quality
COAL RESERVES(1) Attributable % Life Classification 2012 2011 2012 2011 2012 2011 2012 2011Cerrejón (OC) 33.3 19 Mt Mt ROM % ROM % Mt Mt kcal/kg kcal/kg
Thermal – Export Proved 675.0 718.8 96.7 96.8 652.7 695.5 6,180 6,300Probable 93.2 86.0 97.0 96.8 90.4 83.2 6,110 6,240
Total 768.2 804.8 96.7 96.8 743.1 778.7 6,170 6,290
Thermal Coal – South Africa Operations MineROM Tonnes Yield Saleable Tonnes Saleable Quality
COAL RESERVES(1) Attributable % Life Classification 2012 2011 2012 2011 2012 2011 2012 2011Goedehoop (UG&OC) 100 8 Mt Mt ROM % ROM % Mt Mt kcal/kg kcal/kg
Thermal – Export Proved 30.0 37.4 54.9 53.0 16.8 20.2 6,190 6,230Probable 40.9 48.6 51.6 51.7 21.5 25.6 6,200 6,210
Total 70.9 86.0 53.0 52.3 38.3 45.9 6,200 6,220Greenside (UG) 100 11 kcal/kg kcal/kg
Thermal – Export Proved 21.3 25.8 57.4 58.1 12.7 15.5 6,200 6,200Probable 26.4 21.9 54.0 53.9 14.8 12.3 6,190 6,190
Total 47.7 47.8 55.5 56.2 27.5 27.8 6,190 6,200Isibonelo (OC) 100 15 kcal/kg kcal/kg
Synfuel Proved 70.5 69.9 100 100 70.5 69.9 4,520 4,590Probable – – – – – – – –
Total 70.5 69.9 100 100 70.5 69.9 4,520 4,590Kleinkopje (OC) 100 11 kcal/kg kcal/kg
Thermal – Export Proved 50.8 64.5 33.2 35.9 17.4 23.7 6,190 6,170Probable – 12.0 – 45.9 – 5.6 – 6,180
Total 50.8 76.4 33.2 37.5 17.4 29.3 6,190 6,170kcal/kg kcal/kg
Thermal – Domestic Proved 38.5 33.8 19.6 21.8 4,580 4,550Probable – – – – – –
Total 38.5 28.5 19.6 21.8 4,580 4,550Kriel (UG&OC) 73.0 13 kcal/kg kcal/kg
Thermal – Domestic Proved 40.3 46.0 100 100 40.3 46.0 4,830 4,790Probable 63.8 67.5 100 100 63.8 67.5 4,430 4,430
Total 104.1 113.5 100 100 104.1 113.5 4,580 4,580Landau (OC) 100 6 kcal/kg kcal/kg
Thermal – Export Proved 29.6 36.4 48.4 48.5 14.5 17.8 6,210 6,240Probable 12.1 24.4 46.0 48.5 5.7 11.9 6,210 6,230
Total 41.7 60.7 47.7 48.5 20.2 29.8 6,210 6,240kcal/kg kcal/kg
Thermal – Domestic Proved 12.3 8.8 3.7 3.2 4,040 4,550Probable 18.5 7.3 2.3 1.8 4,370 3,970
Total 14.1 8.2 5.9 5.0 4,170 4,340Mafube (OC) 50.0 14 kcal/kg kcal/kg
Thermal – Export Proved 12.1 24.8 47.5 46.5 5.8 11.6 6,270 6,220Probable 70.7 66.6 33.9 33.1 24.2 22.2 6,260 6,210
Total 82.8 91.3 35.9 36.7 30.0 33.8 6,260 6,210kcal/kg kcal/kg
Thermal – Domestic Proved 19.7 27.1 2.4 6.8 5,360 5,460Probable 29.1 37.3 21.2 25.0 4,970 5,010
Total 27.7 34.5 23.6 31.8 5,010 5,110New Denmark (UG) 100 26 kcal/kg kcal/kg
Thermal – Domestic Proved 30.8 30.2 100 100 30.8 30.2 4,950 4,880Probable 81.2 80.9 100 100 81.2 80.9 5,020 5,120
Total 112.0 111.1 100 100 112.0 111.1 5,000 5,050New Vaal (OC) 100 19 kcal/kg kcal/kg
Thermal – Domestic Proved 348.1 371.8 89.6 93.4 323.8 359.8 3,560 3,490Probable – – – – – – – –
Total 348.1 371.8 89.6 93.4 323.8 359.8 3,560 3,490Zibulo (UG&OC) 73.0 18 kcal/kg kcal/kg
Thermal – Export Proved 91.3 86.1 49.4 49.4 45.6 43.0 6,100 6,090Probable 23.5 28.6 43.9 46.1 10.4 13.3 6,110 6,070
Total 114.9 114.7 48.3 48.6 56.0 56.3 6,100 6,090kcal/kg kcal/kg
Thermal – Domestic Proved 26.6 29.8 25.1 26.4 4,930 4,820Probable 30.4 30.4 7.3 8.9 4,780 4,640
Total 27.4 29.9 32.4 35.4 4,900 4,770
Footnotes appear at the end of the section.
(3) (4) (3) (5)
(2)
(3) (4) (3) (5)
(2)

Anglo American plc Fact Book 2012/13 62
THERMAL COAL Coal Reserve and Coal Resource estimates as at 31 December 2012
THERMAL COAL COAL RESERVES AND COAL RESOURCES
Thermal Coal – South Africa Operations continued COAL RESERVES(1) Attributable %
Mine Life Classification
ROM Tonnes Yield Saleable Tonnes Saleable Quality
2012 2011 2012 2011 2012 2011 2012 2011South Africa Thermal – Export 84.1 Mt Mt Plant % Plant % Mt Mt kcal/kg kcal/kg
Proved 724.9 792.9 52.9 48.2 112.8 131.8 6,160 6,170Probable 318.7 350.5 45.6 45.9 76.5 90.9 6,210 6,190
Total 1,043.6 1,143.3 49.9 47.0 189.3 222.7 6,180 6,180South Africa Thermal – Domestic 92.2 kcal/kg kcal/kg
Proved 87.7 86.9 445.7 494.2 3,910 3,850Probable 88.2 87.2 175.7 184.1 4,780 4,820
Total 87.8 86.8 621.4 678.4 4,150 4,110South Africa Synfuel 100 kcal/kg kcal/kg
Proved 100 100 70.5 69.9 4,520 4,590Probable – – – – – –
Total 100 100 70.5 69.9 4,520 4,590
Thermal Coal – Operations ROM Tonnes Yield Saleable Tonnes Saleable Quality
TOTAL COAL RESERVES(1) Attributable % Classification 2012 2011 2012 2011 2012 2011 2012 2011Thermal – Export 43.6 Mt Mt Plant % Plant % Mt Mt kcal/kg kcal/kg
Proved 1,399.9 1,511.7 90.2 89.1 765.5 827.3 6,180 6,280Probable 411.9 436.5 73.4 70.2 166.9 174.2 6,160 6,210
Total 1,811.8 1,948.2 87.2 85.7 932.4 1,001.4 6,170 6,270Thermal – Domestic 92.2 kcal/kg kcal/kg
Proved 87.7 86.9 445.7 494.2 3,910 3,850Probable 88.2 87.2 175.7 184.1 4,780 4,820
Total 87.8 86.8 621.4 678.4 4,150 4,110Synfuel 100 kcal/kg kcal/kg
Proved 100 100 70.5 69.9 4,520 4,590Probable – – – – – –
Total 100 100 70.5 69.9 4,520 4,590
Mining method: OC = Open Cut, UG = Underground. Mine Life = The extraction period in years for scheduled Ore Reserves comprising Proved and Probable Reserves only. For the multi-product operations, the ROM tonnage figures apply to each product. The Saleable tonnes cannot be calculated directly from the ROM reserve tonnes using the air dried yields as presented since the difference in moisture content is not taken into account. Attributable percentages for country totals are weighted by Saleable tonnes and should not be directly applied to the ROM tonnes. Footnotes appear at the end of the section.
Thermal – Export refers to low- to high-volatile thermal coal primarily for export in the use of power generation; quality measured by calorific value (CV). Thermal – Domestic refers to low- to high-volatile thermal coal primarily for domestic consumption for power generation; quality measured by calorific value (CV). Synfuel refers to a coal specifically for the domestic production of synthetic fuel and chemicals; quality measured by calorific value (CV).
(2)
(3) (4) (3) (5)
(3) (4) (3) (5)
(2)

Anglo American plc Fact Book 2012/13 63
THERMAL COAL Coal Reserve and Coal Resource estimates as at 31 December 2012
THERMAL COAL COAL RESERVES AND COAL RESOURCES
Thermal Coal – Colombia Operations Tonnes Coal Quality
COAL RESOURCES(6) Attributable % Classification 2012 2011 2012 2011Cerrejón (OC) 33.3 MTIS MTIS kcal/kg kcal/kg
Measured 903.6 907.2 6,450 6,460Indicated 160.0 173.9 6,360 6,370
Measured and Indicated 1,063.6 1,081.1 6,440 6,450Inferred (in LOM Plan) 73.8 69.2 6,720 6,750
COAL RESOURCES ARE REPORTED AS ADDITIONAL TO COAL RESERVES.
Thermal Coal – South Africa Operations Tonnes Coal Quality
COAL RESOURCES(6) Attributable % Classification 2012 2011 2012 2011Goedehoop (UG&OC) 100 MTIS MTIS kcal/kg kcal/kg
Measured 83.1 79.8 5,510 5,470Indicated 75.7 75.6 5,470 5,480
Measured and Indicated 158.8 155.4 5,490 5,470Inferred (in LOM Plan) 1.6 – 5,740 –
Greenside (UG) 100 Measured 18.2 11.4 5,590 5,700Indicated 1.4 2.8 5,610 5,430
Measured and Indicated 19.6 14.2 5,590 5,650Inferred (in LOM Plan) 8.3 – 5,790 –
Isibonelo (OC) 100 Measured – – – –Indicated 16.3 20.9 5,250 5,210
Measured and Indicated 16.3 20.9 5,250 5,210Inferred (in LOM Plan) – – – –
Kleinkopje (OC) 100 Measured 30.4 28.5 5,040 4,970Indicated – – – –
Measured and Indicated 30.4 28.5 5,040 4,970Inferred (in LOM Plan) – – – –
Kriel (UG&OC) 73.0 Measured 8.7 9.0 5,290 5,290Indicated 10.2 10.2 4,860 4,860
Measured and Indicated 18.8 19.3 5,060 5,060Inferred (in LOM Plan) – – – –
Landau (OC) 100 Measured 52.0 26.5 5,190 4,810Indicated 42.8 34.3 4,680 5,180
Measured and Indicated 94.8 60.8 4,960 5,020Inferred (in LOM Plan) – – – –
Mafube (OC) 50.0 Measured 56.5 2.5 5,300 5,090Indicated 13.2 7.4 4,530 5,250
Measured and Indicated 69.7 9.9 5,150 5,210Inferred (in LOM Plan) 7.3 17.0 5,150 5,170
New Denmark (UG) 100 Measured – – – –Indicated – – – –
Measured and Indicated – – – –Inferred (in LOM Plan) 16.2 17.0 5,270 5,310
New Vaal (OC) 100 Measured – – – –Indicated – – – –
Measured and Indicated – – – –Inferred (in LOM Plan) – – – –
Zibulo (UG&OC) 73.0 Measured 147.3 136.3 4,960 4,950Indicated 201.7 184.2 4,900 4,880
Measured and Indicated 349.0 320.6 4,920 4,910Inferred (in LOM Plan) 20.4 29.3 5,460 5,470
South Africa – Mine Leases 82.3 Measured 396.2 294.0 5,200 5,120Indicated 361.2 335.4 5,000 5,080
Measured and Indicated 757.4 629.4 5,100 5,100Inferred (in LOM Plan) 53.9 63.3 5,420 5,350
COAL RESOURCES ARE REPORTED AS ADDITIONAL TO COAL RESERVES.
Thermal Coal – OperationsCOAL RESOURCES(6)
Tonnes Coal QualityAttributable % Classification 2012 2011 2012 2011
Total 53.7 MTIS MTIS kcal/kg kcal/kgMeasured 1,299.7 1,201.2 6,070 6,130
Indicated 521.2 509.3 5,410 5,520Measured and Indicated 1,821.0 1,710.6 5,880 5,950
Inferred (in LOM Plan) 127.7 132.4 6,170 6,080COAL RESOURCES ARE REPORTED AS ADDITIONAL TO COAL RESERVES. Footnotes appear at the end of the section.
(2)
(6) (6) (7) (7)
(8)
(2)
(6) (6) (7) (7)
(8)
(8)
(8)
(8)
(8)
(8)
(8)
(8)
(8)
(8)
(8)
(2)
(6) (6) (7) (7)
(8)

Anglo American plc Fact Book 2012/13 64
THERMAL COAL Coal Reserve and Coal Resource estimates as at 31 December 2012
THERMAL COAL COAL RESERVES AND COAL RESOURCES
Thermal Coal – South Africa Projects Tonnes Coal Quality
COAL RESOURCES(6)(8) Attributable % Classification 2012 2011 2012 2011Elders 73.0 MTIS MTIS kcal/kg kcal/kg
Measured 224.3 218.1 5,140 5,110Indicated 107.6 107.9 5,410 5,400
Measured and Indicated 331.8 326.0 5,230 5,210Kriel Block F 100 Measured 36.1 – 5,270 –
Indicated 27.3 62.8 5,410 5,310Measured and Indicated 63.4 62.8 5,330 5,310
Kriel East 73.0 Measured 100.1 81.5 4,940 4,940Indicated 31.4 36.0 4,890 4,950
Measured and Indicated 131.5 117.5 4,930 4,940New Largo 73.0 Measured 429.5 484.9 4,290 4,300
Indicated 178.5 159.3 3,970 3,920Measured and Indicated 608.0 644.3 4,190 4,210
Nooitgedacht 100 Measured 36.4 35.8 5,360 5,310Indicated 10.6 10.6 5,450 5,450
Measured and Indicated 46.9 46.4 5,380 5,340South Rand 73.0 Measured 78.6 78.6 4,850 4,850
Indicated 168.1 168.1 4,770 4,770Measured and Indicated 246.7 246.7 4,800 4,800
Vaal Basin 100 Measured 375.2 208.2 4,330 3,980Indicated 220.4 362.5 4,210 4,140
Measured and Indicated 595.6 570.7 4,290 4,080South Africa – Projects 82.4 Measured 1,280.2 1,107.1 4,590 4,520
Indicated 743.8 907.2 4,540 4,500Measured and Indicated 2,024.0 2,014.3 4,570 4,510
Attributable percentages for country totals are weighted by Measured and Indicated MTIS.
(1) Coal Reserves are quoted on a Run Of Mine (ROM) reserve tonnes basis, which represents the tonnes delivered to the plant. Saleable reserve tonnes represents the product tonnes produced. Coal Reserves (ROM and Saleable) are on the applicable moisture basis.
(2) Attributable (%) refers to 2012 only. For the 2011 Reported and Attributable figures, please refer to the 2011 Annual Report.(3) ROM tonnes quoted on an As Delivered moisture basis, and Saleable tonnes on a Product moisture basis.(4) Yield – ROM % represents the ratio of Saleable reserve tonnes to ROM reserve tonnes and is quoted on a constant moisture basis or on an air dried to air dried basis whereas Plant % is based on
the ‘Feed to Plant’ tonnes. The product yields (ROM %) for Proved, Probable and Total are calculated by dividing the individual Saleable reserves by the total ROM reserves per classification.(5) The coal quality for the Coal Reserves is quoted as either Calorific Value (CV) using kilo-calories per kilogram (kcal/kg) units on a Gross As Received (GAR) basis.
Coal quality parameters for the Coal Reserves for Coking, Other Metallurgical and Export Thermal collieries meet the contractual specifications for coking coal, PCI, metallurgical coal, steam coal and domestic coal. Coal quality parameters for the Coal Reserves for Domestic Power and Domestic Synfuels collieries meet the specifications of the individual supply contracts in the short-term and studies are underway to ensure long term compliance. CV is rounded to the nearest 10 kcal/kg.
(6) Coal Resources are quoted on a Mineable Tonnes In-Situ (MTIS) basis in million tonnes, which are in addition to those resources that have been modified to produce the reported Coal Reserves. Coal Resources are on an in-situ moisture basis.
(7) The coal quality for the Coal Resources is quoted on an in-situ heat content as Calorific Value (CV) using kilo-calories per kilogram (kcal/kg) units on a Gross As Received (GAR) basis. CV is rounded to the nearest 10 kcal/kg.
(8) Inferred (in LOM Plan) refers to Inferred Coal Resources that are included in the life of mine extraction schedule of the respective collieries and are not reported as Coal Reserves. Inferred Coal Resources outside the Life of Mine Plan but within the mine lease area are not reported due to the uncertainty attached to such resources in that it cannot be assumed that all or part of the Inferred Resource will necessarily be upgraded to Indicated or Measured categories through continued exploration, such Inferred Resources do not necessarily meet the requirements of reasonable prospects for eventual economic extraction, particularly in respect of future mining and processing economics.
Summary of material changes (±10%) in estimates at reporting levelGreenside: Coal Resources – Increase due to the inclusion of boreholes from Landau in the geological model resulted in seam thickness changes. The AATC standard software package was also
implemented. Increase in Inferred in Mine Plan resulting from the conversion of the Clydesdale Pan from Inferred in Mine Lease to Mine Plan after the environmental approval was granted.
Isibonelo: Coal Resources – Decrease due to the transfer and conversion of underground resources to opencast reserves.Kleinkopje: Coal Reserves – Decrease due to the transfer between Kleinkopje and Greenside following a mining boundary rationalisation exercise.
Coal Resources – Increase due to seam thickness adjustments resulting from additional drilling and interpretation, adjustments to 5 seam remnants, and reclassification in Pit 2A layout following the reconfiguration exercise.
Landau: Coal Reserves – Decrease due to the downgrade of Schoonie West S2S to resource as the Pre-Feasibility study is not yet approved. Coal Resources – Increase due to transfer of Greenside Resources into the Landau Lifex Project as well as an increase to the resource footprint as a result of Pre-Feasibility option analyses. Mafube: Coal Resources – Increase results from additional drilling, the upgrade of S4 due to the viability of a lower quality product, re-classification of the Pan 2 area in Springboklaagte pending the granting of the environmental approvals and removal of the Rooipan area. Nooitgedacht: Coal Resources – Increase due to planned shaft closure and the re-allocation of the reserves to resources. Coal Resources for 2 + 4 Seam and 5 Seam have been combined and reported under South Africa Coal Projects.Kriel East: Coal Resources – Increase resulting from additional drilling information.Vaal Basin: Coal Resources – Increase resulting from additional drilling information offset by a decrease resulting from downgrade of all resources within the Wetland area.
Assumption with respect to Mineral TenureCerrejón: Reserves are estimated for the area defined by the current approved Mining Right, which expires in 2033. In order to exploit the Coal Resources, a renewal will be applied for at the
appropriate time, Anglo American Thermal Coal has reasonable expectation that such renewal will not be withheld.Mafube: Application for conversion to a Mining Right has been submitted in November 2011; in addition the environmental permitting applications have been submitted in 2012 as per
legislative requirements. There is a reasonable expectation that such conversion will not be withheld.New Largo: The New Largo Mining Right Application was submitted in April 2011. The relevant South African Departments responsible for approvals, as well as key stakeholders, have been
actively engaged with regards to the Colliery’s potential impacts on wetlands. There is a reasonable expectation that such conversion will not be withheld.
Royalty PaymentSouth Africa: Royalty payments commenced in February 2010 in accordance with the Royalties Act (No. 28 of 2008) and have been taken into consideration in economic assessment of
the reserves.
Audits related to the generation of the Coal Reserve and Coal Resource estimates were carried out by independent consultants during 2012 at the following operations and projects: Goedehoop, Greenside, Isibonelo, Kleinkopje, Mafube, Elders and Vaal Basin.
(2)
(6) (6) (7) (7)