thesis for kondwani nyirongo.pdf
TRANSCRIPT

Supervised
by
Associate Professor Mette Wik
Declaration
I, Kondwani Nyirongo, do hereby declare that this thesis, except where duly acknowledged, is a
product of my own research investigations and findings. To the best of my knowledge, this
work has never been previously published or submitted to any other university for any type of
academic degree.
_______________________________________
Kondwani Nyirongo
Ås, May 2011
i

Dedication
This paper is dedicated to all those committed in the fight against malaria to save lives of
innocent children dying from the disease world-wide every passing hour.
ii

Acknowledgement
To God be glory and honour for the gift of life and my success stories for He knew me by name
before I was born. It is my prayer that God will bless Associate Professor Mette Wik
(supervisor), Professor Stein Holden, Dr Hosaena Ghebru, Betty Legasse, fellow 2010/11
NOMA students, enumerators, data entry clerks, humble respondents and Norwegian tax payers
through NOMA program for making this paper a reality.
I am also highly grateful to all members of the Economics Departments at the Norwegian
University of Life Sciences; Bunda College, Malawi; and Mekelle University, Ethiopia for
sharing their knowledge and providing academic support during my two years study period.
Special mention goes to Professor A.K. Edriss for his tutorial advice since the first day I
entered the corridors of University of Malawi.
Gratitude also goes to Martin Mailosi with whom we started the two years journey together
back home in Malawi with late Miriam Nyirenda whom by God’s will has not finished the
journey with us-her soul rest in peace! Special appreciation goes to Christine Menya Kawuma
for sharing with me heartfelt memorable times during the study period.
When all is said and done, final credit goes to Mr. White and Mrs. Dorothy Nyirongo for
making me who I am today. Sharing with them the credit are family members: Agatha, Vysaul,
Masida, and Sella.
iii

Abstract
The broader impact of malaria need not to be over emphasized with the disease claiming life of
a child every 45 seconds and attributed to slow economic growth in malarious areas of the
world. Beyond this broader picture, there has been wavering empirical evidence on the impact
of the disease at micro level especially on households’ consumption expenditures and crop
land-productivity. This study investigated the economic burden of malaria at household level
i.e. the impact of the disease on households’ consumption expenditures (direct cost burden) and
crop land-productivity and the role of ITN interventions in Tigray, Ethiopia. Using equality
mean test on the two years (2006 and 2010) panel data, the study found negligible annual direct
cost burden of malaria (0.69% of consumption expenditure) which is not catastrophic
(significantly less than 10% of consumption expenditure) to household consumption
expenditure. Estimation of the instrumental variable regression on 2010 cross sectional data,
however, unveiled that malaria lowers crop land-productivity by 11.25% through loss of labour
due illnesses and care giving. Most importantly, the study also found that ITN interventions
play an important role in cushioning the economic burden of malaria in the region and doubling
coverage may almost wipe out the burden. The above research findings have important policy
implications on crop land-productivity improvement, design and adoption of malaria control
interventions in Tigray.
Key words: malaria, economic burden, ITN interventions, Tigray, Ethiopia
iv
Table of Content
DECLARATION ...................................................................................................................................................... I
DEDICATION .........................................................................................................................................................II
ACKNOWLEDGEMENT..................................................................................................................................... III
ABSTRACT ........................................................................................................................................................... IV
TABLE OF CONTENT...........................................................................................................................................V
LIST OF TABLE ................................................................................................................................................... VI
LIST OF FIGURES............................................................................................................................................... VI
LIST OF ABBREVIATIONS AND ACRONYMS ............................................................................................VII
1.0 INTRODUCTION ......................................................................................................................................1
2.0 BACKGROUND.........................................................................................................................................3
3.0. LITERATURE REVIEW AND RESEARCH HYPOTHESIS...............................................................7
3.1. LITERATURE REVIEW ...............................................................................................................................7 3.1.1. The Economic Burden of Malaria.......................................................................................................7 3.1.2. Household Direct and Indirect Costs of Malaria................................................................................8 3.1.3. Labour Substitutability........................................................................................................................9 3.1.4. Malaria Shocks, Household Agricultural Labour and Productivity .................................................10 3.1.5. The Impact of Insecticide Treated Bednets (ITN) on Malaria at Household Level...........................11
3.2. HYPOTHESIS ...........................................................................................................................................12
4.0 DATA AND METHODS..........................................................................................................................13
4.1. DATA......................................................................................................................................................13 4.2. DATA COLLECTION CHALLENGES, SHORTFALLS AND REMEDIES TO ENSURE QUALITY .........................14 4.3 METHODS ...............................................................................................................................................15
4.3.1. Model 1: Impact of ITN on Malaria Direct Costs.............................................................................16 4.3.2 Model 2: Impact of Malaria Shocks on Household Crop Productivity and the Role of ITN.............20
4.4. DESCRIPTIVE STATISTICS FOR KEY STUDY VARIABLES .........................................................................24
5.0 RESULTS AND DISCUSSION...............................................................................................................27
5.1. OVERVIEW OF MALARIA SHOCKS AND IMPACTS AT HOUSEHOLD LEVEL ...............................................27 5.2. DIRECT COSTS OF MALARIA AND THE ROLE OF ITNS AT HOUSEHOLD LEVEL .......................................29
5.2.1. Mean Direct Costs of Malaria and Implications on Consumption Expenditure (Direct Cost Burden of malaria).......................................................................................................................................................29 5.2.2. Role of ITN interventions on Direct Costs of Malaria ......................................................................30
5.3. HIDDEN COSTS OF MALARIA: THE IMPACT OF MALARIA ON CROP PRODUCTIVITY AND THE ROLE OF
ITNS 35
6.0 CONCLUSION.........................................................................................................................................39
REFERENCES: ......................................................................................................................................................40
APPENDICES.........................................................................................................................................................45
APPENDIX A: GRAPHICAL FIGURES ......................................................................................................................45 APPENDIX B: PHOTOS ...........................................................................................................................................48 APPENDIX C: TABLES ............................................................................................................................................50 APPENDIX D: CALCULATIONS...............................................................................................................................54 APPENDIX E: STUDY QUESTIONNAIRE ..................................................................................................................56
v
List of Table
Table 4.1: Description of Variables in Model 1....................................................................................................19
Table 4.2: Description of variables in model 2 .....................................................................................................22
Table 4.3: Descriptive Statistics for key variables in analysis of direct costs of malaria..................................25
Table 4.4: Descriptive Statistics for key variables in analysis of indirect costs of malaria ..............................26
Table 5.1: One-sample t test for direct cost burden of malaria ..........................................................................30
Table 5.2: Model 1: The Role of ITN on direct costs of malaria at household level .........................................33
Table 5.3: Model 2: Hidden costs of malaria in crop production and the role of ITNs....................................38
Table C1: Role of ITN on direct costs of malaria at household level .................................................................50
Table C2a: Model 1 under fixed effects estimation with ordinary and robust standard errors......................51
Table C2b: Model 1 under random effects estimation with ordinary and robust standard errors.................52
Table C3: Test for Multicollinearity for model 2 under OLS estimation ..........................................................53
List of Figures
Figure 2.1: Reported Malaria Cases (in100s) and Deaths Tigray during Major Outbreaks .............................3
Figure 2.2: Map of Tigray Region Showing Location of Study Areas .................................................................5
Figure 5.1.1: Kernel Density Distribution of Malaria Episodes at household level by Year............................27
Figure 5.1.2: Kernel Density Distribution of Log of Number of Days Lost due to Malaria Shocks ................28
Figure 5.2.1: Kdensity for Direct Costs of Malaria for Households with & without ITN ................................31
Figure 5.2.2: Graph showing distribution of log of direct costs of malaria by ITN-household ratio ..............32
Figure A1a: Histogram with Normal Curve for Direct Cost of Malaria ...........................................................45
Figure A1b: Histogram with Normal Curve for Log of Direct Costs of Malaria..............................................46
Figure A2: Distribution of distances from homes to malaria breeding places ..................................................47
Figure B1: Households receiving free ITNs in Adi-Menabir, Tigray (photo taken on 21/06/2010).................48
Figure B2: Non-functional ITNs used to cover hay in Debdebo, Tigray (photo taken on 18/06/2010)............49
vi

vii
List of Abbreviations and Acronyms
ETB Ethiopian Birr
HSEP Health Services Extension Program
ITN Insecticide Treated Bednet
IRS Indoor Residual Spray
MOH Ministry of Health
THB Tigray Health Bureau
UN United Nations
UNICEF United Nations International Children's Emergency Fund
US$ United States Dollar

1.0 Introduction
Every 45 seconds a child dies from malaria in Africa (UN 2011). Neither children nor adults
are spared from malaria in Ethiopia. It contributes up to 20% of the 109/10000 under-five
mortality rate (UNICEF 2010) and 22% of deaths in health facilities (MOH 2005-2006).
Malaria also accounts for an annual estimate of 9 million cases for which only 4-5 million are
treated in health facilities (UNICEF 2009). This represents 18% of all outpatient health facility
consultations (MOH 2005-2006) and the largest single cause of morbidity in Ethiopia
(UNICEF 2009).
Malarial burden is shouldered both by households and government through loss of life, illness,
loss of labour and cost of prevention as well as control measures. Chima et el (2003) reported
that household annual expenditure on preventive measures ranges from US$2.88 to US$ 25.20
and expenditure on treatment ranges between US$ 4.92 and US$ 312.00 in Sub-Saharan Africa.
In Rwanda, cost of treating malaria contributed up to 19% of the Ministry of Health operating
budget (Ettling & Shepard 1991). When it comes to malaria and household agricultural labour
supply, Larochelle & Dalton (2006) found a significant negative relationship between the two
for the case of rice production in Mali. At macroeconomic level, studies by McCarthy et al
(2000) in a cross section of countries (dominated by Sub Saharan Countries); Gallup & Sachs
(2001) in malarious and non malarious cross-country analysis; and Asante et al (2005) in
Ghana found that malaria negatively affects annual real national income growth by 0.55%,
1.3% and 0.4%, respectively.
Considering the above mentioned public health and economic concern, the government of
Ethiopia has been implementing a free ITN distribution program under the National 5 years
(2006-2010) strategic plan for malaria prevention and control. Sixteen million ITNs were
distributed in malarious areas between the years 2006 and 2007 (Belay & Deressa 2008).
Tigray region is not spared from malaria hence it benefited from the free ITN distribution
program. Despite the widespread of malaria, and the efforts and resources devoted to fight the
disease in the region, to the knowledge of the author no study has been conducted to establish
1

its economic burden1 at household level and the impact of ITN in terms of reducing the
economic burden. Though Owani (2007) found reduced malaria incidences for individuals who
spent more months using bed nets in the region, no linkage was made to crop land-productivity
and the implication for households’ expenditure. Studies carried out in the region indicate low
household willingness to pay for ITN. Cropper (1999) reported that only 30% of households
were willing to pay for recovery cost of ITN (US$6) despite the fact that this cost was just
0.68% of the mean annual income in the area adjusted for the life span of the bed net. In the
same region, Owani (2007) found out that households were willing to pay for only 15.8% of the
actual cost of unsubsidized ITNs. This raises important questions as whether this is due to low
purchasing power among the households or because malaria prevention is not a priority based
on its economic burden.
This research aimed to investigate the economic burden of malaria at household level and the
role of ITNs distributed through the free ITN distribution program in reducing the burden in
Tigray region. In this study, the economic burden of malaria constituted households’ direct
financial expenditure for malaria prevention and treatment, as well as loss of crop land-
productivity due to loss of household labour for both the patients and care givers. The study,
therefore, attempted to expound the linkage between malaria shocks, preventive interventions
and agricultural production at household level. This was done by answering the following
specific research questions: a) Are direct costs of malaria (direct cost burden) catastrophic to
households’ consumption expenditures? b) Do malaria shocks significantly affect crop land-
productivity at household level? c) Do ITN interventions reduce household malaria direct costs
and crop land-productivity losses?
The rest of this paper is structured as follows: Chapter 2 provides background information for
the study areas. Thereafter, underlying theory and literature is expounded in chapter 3 to
provide the basis for the study hypothesis. Chapter 4 describes data and methods used in testing
the study hypothesis. Afterwards, the study results are discussed in chapter 6 from which
conclusion and policy implications are drawn that constitute chapter 7.
1 Economic burden refers to the effect of malaria attack on household consumption expenditure and/or household crop land-productivity through family labour supply loss
2

2.0 Background
Tigray region, located in the northern part of Ethiopia, is not spared from malaria as about 78%
of the total population (4.5 million) is at risk to the disease (THB 2006). In 2006, malaria
treatment accounted for 28% of all patients treated in the region’s health facilities and was the
number one cause of outpatient diagnosis, admissions and deaths (Paulander et al. 2009).
Malaria is hypo-endemic in areas below 2,200 metres above the sea level with seasonal
transmissions mainly between September and November as well as March through June
following the summer and belg rains, respectively (Ghebreyesus et al. 1996). The construction
of micro-dams in drought prone areas has further prolonged the malaria transmission seasons in
the region (Amacher et al. 2004; Ghebreyesus et al. 1998). The Anopheles gambiae s.1 vectors
Plasmodium falciparum that cause about 60% of malaria infections and Plasmodium vivax that
accounts for the remaining 40% of the infections in the region (Ghebreyesus et al. 1998; Tulu
1993). Tigray region is also prone to malaria outbreaks as evidenced by a wide spread of four
serious outbreaks between 1987and 2006. These outbreaks caused mammoth suffering and
deaths in the western part in 1987, the north-central part in 1990, the whole region in 1991 and
in southern Tigray2 in 2005, as indicated in the figure 2.1.below:
0200400600800
10001200140016001800
1987 1990 1991
Years*
No
.of
ca
se
s('
00
) a
nd
De
ath
s
Cases in 100s
Deaths
Figure 2.1: Reported Malaria Cases (in100s) and Deaths Tigray during Major Outbreaks
Note: Data Source: (Ghebreyesus et al. 1998); *Data for the 2005 outbreak not available
2 See location of these zones in the figure 2.2
3

The rural farming households are the most hit with malaria in the region since they occupy low
lying areas with water ponds, micro-dams and streams where malaria thrives (Amacher et al.
2004; Ghebreyesus et al. 1998) and subsistence farming also flourishes. Malaria imposes extra
household expenditure on both preventive and treatment measures. One malaria episode to an
adult household member causes average loss of 18 labour days while an attack to a child leads
to loss of 2 labour days after adjusting for labour substitution in the region (Cropper et al.
1999). This loss of labour could in turn affect agricultural productivity at household level as
Paulander et al (2009) indicated that malaria epidemics occur during planting and harvesting
periods when labour supply is critical.
The fight against malaria in the region was governed by the national five years strategic plan (2005-
2010) that aimed at reducing the burden by half through early diagnosis and prompt treatment;
selective vector control; and epidemic prevention and control (MOH 2004). Distribution of free
ITNs at household level was the major malaria prevention intervention within the plan
complemented by in-door residual spraying and environmental management (MOH 2008). The
2010 target for ITN coverage and utilization was 80% in the region. By the end of 2006, 32.5% of
the population living in malarious areas of the region were already covered by ITNs (Owani 2007).
This study follows up the sample of Owani (2007) drawn from four malarious districts, namely:
Kara Adiyabo, Debdebo, Tsaeda Ambora and Adi-Menabir (see Figure 2.2). Primary health
care units are the major providers of health services including malaria interventions in the study
areas. All health units in the region are supported by six district hospitals above which five are
zonal hospitals that are further supported by a regional referral hospital located in Mekelle, the
capital of the region (Paulander et al. 2009). Malaria treatment is free of charge in the public
health units except for the fee for the registration card of US$0.37 (2010 ETB to US$ exchange
was 13.5). Some rural households still incur transport costs in seeking malaria treatment from
public health facilities as Ghebreyesus et al (1996) indicated that public health facilities are
located far apart in some communities in the region. This, therefore, may defeat the assertion of
free malaria treatment by the government. There are no ITN selling outlets in the study areas
but almost every household has been provided with at least one free of charge ITN from the
government between 2006 and 2010.
4

Figure 2.2: Map of Tigray Region Showing Location of Study Areas
(Adapted on a map sourced from http://www.reliefweb.int/rw/RWB.NSF/db900SID/SKAR-
64GEB2?OpenDocument)
Subsistence agriculture is the major economic activity in the study areas. The major crops
grown by households are teff, wheat, barley and maize with chat being an important cash crop
in Kara Adiyabo. They also rear animals like donkeys, cattle, camels, goats and chicken.
Agricultural labour demand is mostly met by household own labour supply that is
complemented by oxen which provide drought power for tilling the land. There is limited use
of hired labour (Hagos et al. 2003) amid pervasive labour market inefficiencies in the region
(Holden et al. 2001; Woldenhanna & Oskam 2001). High dependence on household own labour
5

supply, therefore, leaves agricultural production at household level vulnerable to labour risks
due to malaria shocks (Dercon 2002).
6

3.0. Literature Review and Research Hypothesis
3.1. Literature Review
Malaria commands vast literature with diversity not only in terms of area of focus (like
epidemiological and socio-economic) but also methodological approaches. This section reviews
a spectrum of socio-economic studies with differing methodological approaches to synthesize
theory behind the economic burden of the disease as well as the impact of ITNs as preventive
intervention at household level. The broader picture of economic burden of malaria is presented
first, followed by a review of various approaches used in evaluating the burden of the disease
on households, and the challenges faced. The last part of this section reviews impact studies on
ITN interventions at household level.
3.1.1. The Economic Burden of Malaria
Malaria and poverty are intimately connected (Gallup, J.L. & Sachs, J.D. 2001). At
macroeconomic level, studies that used both static (Asante et al. 2005; Gallup, J.L & Sachs, J.D
2001; McCarthy et al. 2000) and dynamic (Gollin & Zimmermann 2007) models have found
that poverty thrives where malaria flourishes through reduced economic growth. The annual
growth reduction due to malaria has been estimated to range between 0.25% (McCarthy et al.
2000) to 1.3% (Gallup, J.L & Sachs, J.D 2001). This intimate relationship between malaria and
poverty has backward linkage to the impact of malaria at household level. Malaria incapacitates
the labour force, causes death and diverts resources from economic growth enhancing activities
to prevention and treatment interventions. Customarily, the economic impact of malaria has
been estimated by summing up direct costs of expenditure on prevention and treatment; and the
indirect costs of productive labour time lost due to malaria morbidity and mortality (Asenso-
Okyere & Dzator 1997; Shepard et al. 1991). Some studies also recognize that suffering and
grief is another category of costs that could be added to the economic burden of the disease
though none of the studies have valued the suffering and grief due to their complexity.
7

3.1.2. Household Direct and Indirect Costs of Malaria
Malaria inflicts direct and indirect costs to households (Chima et al. 2003). Household direct
costs of malaria include financial expenditure incurred in prevention; treatment as well as other
non-medical expenses such as transport costs to and from the health facility and special foods
for the patient. On the other hand, indirect costs are linked to loss of household labour through
sickness and care-giving. This loss of labour force can translate into loss of agricultural
productivity in agricultural based rural economies. Chima et al (2003) indicated that direct and
indirect costs can be summed up to provide total economic costs of malaria at household level.
The methods of estimating the economic cost of malaria at household level have, however,
differed from one study to the other. In addition to methodology, variation in estimated costs of
malaria in different settings is driven by epidemiological and socio-economic factors as well as
timing of surveys.
Direct household costs to malaria accounted for 2% of household expenditure in rural Sri
Lanka, 2.9% in rural Nigeria (Russell 2004) and up to 14.1% in Ghana (Asante et al. 2005). At
national level in Malawi, direct cost of treatment amounted to only 2% of household income
but alarmingly 28% of income amongst very low income earning households (Ettling et al.
1994). These studies were based on reported household expenditures over two or four weeks.
Chima et al (2003) pointed out that the approach mentioned above, do not reflect disparities in
the burden and costs of the disease through out the year.
Leighton & Foster (1993) in Kenya and Nigeria and Attanakaye et al (2000) in Sri Lanka
estimated household indirect costs of malaria by multiplying the average daily income by the
households’ labour days lost through malaria related morbidity. This approach assumed that
households faced the same daily wage rate and productivity of labour. In addition to using
labour loss through morbidity, Shepard et al (1991) incorporated labour loss through mortality
in studies conducted in Burkina Faso, Congo, Chad and Rwanda. With the mortality approach,
labour days lost was estimated by extrapolating age of death to life expectancy. This was a
strong assumption that could have overemphasized indirect cost of malaria at household level.
Results from the above mentioned studies revealed different indirect costs per malaria episode
to households in different countries. The average indirect cost for a malaria episode was highest
8
in Chad (US$12.6) and lowest in Burkina Faso i.e. US$4.61 (Shepard et al. 1991). The above
mentioned studies did not control their results for labour substitution for sick days through both
intra-household replacement and hired labour.
3.1.3. Labour Substitutability
Labour substitutability has been at the centre of controversy in studies trying to estimate the
effects of health shocks on household labour as well as productivity. Sauerborn & Adam (1996)
indicated that labour substitution is one of the reactionary coping mechanisms that households
employ to cushion labour loss through health shocks. The household can replace the lost labour
through both intra-household (Abegunde & Stanciole 2008) and inter-household substitution as
well as the labour market. This replacement, however, depends on household labour
endowments (Sauerborn & Adams 1996), communal relations and how well the labour market
functions in an economy. Chima et al (2003) indicated that intra-household labour substitution
is the most commonly employed coping strategy by households. Cropper et al (1999) found
existence of labour substitution in Ethiopia though there was net loss of labour days due to
malaria attacks at household level. The authors found that about 28% of the lost labour days
due to one malaria episode to an adult household member were replaced through intra-
household labour substitution. Larochelle & Dalton (2006) ascertained that intra-household
labour substitution is only possible for labour endowment rich households and not otherwise in
Mali. Hired labour could also replace family labour lost through illness (Sauerborn & Adams
1996). Labour substitution through the market, however, depends on how well the labour
market functions and the liquidity constraint of households that are hit by malaria shocks.
Cropper et al (1999) found limited evidence of labour replacement through the market in
Tigray, Ethiopia. This is because the labour market in the area is characterized by inefficiencies
due to high transaction costs (Holden et al. 2001) and entry barriers due to liquidity and credit
constraints (Woldenhanna & Oskam 2001). All in all, ignoring labour substitution in estimating
the impact of malaria shocks on household labour supply and output could lead to over-
estimation of the burden.
9

3.1.4. Malaria Shocks, Household Agricultural Labour and Productivity
A malaria attack is accompanied with morbidity to the sick person who sometimes requires
care giving by other household members. This translates into loss of household agricultural
labour supply when the attack infect or/and affects the productive household member and
coincide with agricultural production activities at household level. This loss of household
labour could further negatively affect agricultural production if not replaced for by mechanisms
like intra-household substitution and hired labour as outlined in the section above. In trying to
establish the link between malaria and household agricultural labour supply, Larochelle &
Dalton (2006) estimated the marginal effect of health transient shocks (primarily caused by
malaria and schistosomiasis) on household agricultural labour supply in rice growing areas of
Mali. They estimated a regression model where household labour supply (family and hired)
was the dependent variable and labour lost through health shock was the independent variable
controlled for household characteristics and environmental factors. The authors purposively
included hired labour in the dependent variable (household labour supply) to control for labour
substitution through the market. On the other hand, intra-household labour substitution was
controlled for by inclusion of the household dependence ratio in the band wagon of regressors.
The impact of transient shocks were estimated differently for non-active household members
(age below 15 years and above 60 years) and active members (between 15 and 59 years)
through separate regression models. Both models indicated that transient health shocks
negatively affected labour supply in rice production with no effective intra-household labour
loss substitution. The study further found limited labour substitution through hired labour.
However, it did not establish the implication of the reduced household labour supply on rice
production.
Abegunde & Stanciole (2008) indicated that household productivity could be affected if a
household member is affected by chronic disease. The authors further acknowledged the
possibility of intra-household labour substitution to mitigate productivity losses. The above
results augment the findings of Croppenstedt & Muller (2000) who established that morbidity
status of households negatively affect agricultural productivity in Ethiopia. The fact that
malaria is not a chronic disease and only one of the many contributors of ill health further
complicates its relationship to agricultural productivity at household level. Few studies have
10

been conducted to establish the link between the two. An attempt by Audibert (1986) to
estimate the impact of malaria on rice production in Cameroon using the Cobb-Douglas
production function not only faced insignificance of the parameter estimates but was also
susceptible to biases. These biases originated from the endogenous nature of malaria illnesses
at household level which was used as one of the explanatory variables in estimating the
production function.
Wang’ombe & Mwabu (1993) also ended up with insignificant coefficients in their quest to
estimate the impact of malaria on household income and cassava production in Kenya. One
possible explanation for their results was the practice of labour substitution. Audibert et al
(1999) addressed the complexity of labour substitution by estimating the impact of malaria to
cotton producing households that had at least 25% of active members with higher levels of
parasitaemia in their blood (>500 parasites per ul of blood) in Côte d'Ivoire. This cut-off point
ensured large labour loss that could not be replaced easily by the affected households. Using
the production frontier, they established increasing production inefficiencies with the
increasing percentage (from the threshold of 25%) of active household members found with
higher levels of malaria parasitaemia.
3.1.5. The Impact of Insecticide Treated Bednets (ITN) on Malaria at Household Level
Insecticides treated bednets have been shown to significantly reduce malaria morbidity and child
mortality in short term trials (Lengeler 2003). ITN can reduce under-five child mortality up to 50%
and help reduce re-infection after successful treatment (UNICEF 2009). Findings by Owani (2007)
and Belay& Deressa (2008) also established a positive impact of ITN on malaria incidences shortly
after their introduction during the 2006 malaria epidemic in Tigray region, Ethiopia. The studies
above, however, did not provide the economic value of the bednets on households in terms of the
marginal burden reduced. These studies were also conducted within the first half of ITN lifespan
(within two years after massive distribution of ITNs to households in the region) hence there is no
evidence on the sustainability of the impact to the end of ITN lifespan at household level. This
skepticism is also shared by Smith et al (2009) who indicated that the theoretical basis remains
poorly defined for attributing reduced malaria incidences to ITN in areas where high coverage of
ITN has just been achieved. This cynicism informs the formulation of hypothesis H2 and H4 to
11

investigate the long-term (after more than two years of introduction) impact of ITNs on economic
burden of malaria at household level.
3.2. Hypothesis
The foregoing review of literature induces this study to provide the economic burden of malaria
at household level and the value of insecticide treated bednets to households in terms of the
reduced economic burden of malaria in the long-run. This will be done by testing the following
hypothesis as informed by literature:
H1: Malaria shocks impose stress on household consumption expenditure and household’s own
agricultural labour supply
H2: ITN interventions cushion households from direct costs of malaria
H3: Household labour loss due to malaria attacks negatively affects crop productivity at
household level
H4: Increased ITN coverage lowers crop land-productivity losses due to labour loss caused by
malaria shocks at household level
12
4.0 Data and Methods
The first part of this section describes the data used in terms of types, method of collection and
key variables. Thereafter, shortfalls in the dataset are highlighted, followed by steps employed
to maintain its quality. Then methods used to test study hypotheses (fore stated in the preceding
section) are expounded. This chapter concludes with descriptive statistic for all key variables to
provide a platform for the discussion of the study results in chapter 5.
4.1. Data
The study uses both panel and cross-sectional household level data. The two period panel data
was constructed from randomly sampled 152 households from five malarious communities
(Kara Adiyabo, Debdebo, Tsaeda Ambora and Adi-Menabir3) in Tigray surveyed in 2006 and
2010. The two survey periods had slightly different objectives i.e. the 2010 survey focused on
economic burden of the disease and the impact of ITNs on the same, while the 2006 aimed at
soliciting the households’ commitment to acquire ITNs and their impact on malaria prevalence.
The research hypotheses on the household’s direct malaria costs were tested using the panel
data since both the 2006 and 2010 surveys collected data on key variables for these hypotheses.
On the other hand, testing of hypotheses on indirect malaria costs at household level was
restricted to cross-sectional data because of data limitation for key variables in the 2006 survey
data. Such missing variables included crop output with their prices (for Kara Adishabo) and
number of labour days households lost due to malaria shocks.
Both the 2006 and 2010 surveys were part of a series of five rounds panel data (1998 to 2010)
collected by the Norwegian University of Life Sciences in collaboration with Mekelle
University4 covering 400 randomly selected farm households from a stratified sample of 16
communities (tabias) in the region. The 2010 Tigray data collection exercise was conducted in
the month of June - coinciding with the same period the 2006 data set was collected. It involved
a total of 18 trained enumerators, able to translate research questions from English into local
language (Tigrinya) in the region, employed to conduct household interviews. These
enumerators were closely supervised by a group of thirteen master’s degree students and two
3 See their location in figure 2.2 in chapter 2. 4 Mekelle University is in Tigray, Ethiopia and it hosted the 2010 spring courses for Master Degree Students under NOMA program
13

former NOMA5 students from Mekelle University under the guidance of Professor Holden6
and Dr Hosaena Ghebru7. The team was organized in three sub-teams comprising of six
enumerators and five supervisors. In each sub-group, two enumerators were responsible for
administering the household questionnaire, two for the plot questionnaire, and the remaining
two enumerators were administering the household perception as well as health (malaria)
questionnaires. Each of the three sub-teams had a team leader and a Tigrinya fluent master
student who was in-charge of administering community based checklists to key informants.
These key informants included Land Administration Committee members, local leaders, health
workers and government administrators at local levels. This approach, therefore, ensured
collection of integrated information covering all aspects of the household welfare and the
prevailing economic conditions of the study area.
In case of the malaria questionnaire, key variables included general knowledge of the
household head on malaria; preventive measures being practiced and their costs; frequency of
malaria attacks and their implications on agricultural labour supply at household level;
treatment behaviours and their accompanied costs; coverage and access to malaria-related
health services provided by the government and other non state organizations. In addition to
malaria related variables, this paper also used crop production and basic household
demographic data for its analysis.
4.2. Data Collection Challenges, Shortfalls and Remedies to Ensure Quality
Understanding the local language was the major challenge faced during data collection but it
was circumvented by engaging enumerators that were fluent in the local language. These
enumerators were thoroughly trained in order to enhance their understanding of the
questionnaires to reduce possibilities of interviewer’s bias. This step was complemented by
spot checking of questionnaires right away after interviews where corrections of mistakes and
follow-ups on data gaps were made there and then. There were also daily feedback meetings
between enumerators and supervisors to further sort out mistakes in the data collected. These
5 NOMA program is a collaborative masters program between the north university (Norwegian University of Life Science) and Universities from the south (Ethiopia, Malawi and Uganda) 6 Professor Holden works with the School of Economics, Norwegian University of Life Science 7 Dr Hosaena works with Mekelle University in Tigray, Ethiopia
14

efforts were followed up by massive data cleaning after completion of data entry. All these
steps were taken to ensure data quality. Specifically for malaria data, the major challenge was
to accurately collect data on malaria attacks suffered by households since no blood testing was
made. This challenge, however, was addressed by verifying the reported malaria attacks in the
person’s health registration card at household level. Details on the types of drugs used to cure
the reported illnesses were also used to scrutinize malaria cases from cases of other fevers.
The prominent shortfall in the dataset relate to some differences between the 2006 and 2010
survey tools rendering it difficult to construct a panel that can be used to adequately test all the
research hypotheses. Some households surveyed in 2006 were not interviewed during the 2010
survey because they were not willing to participate. The above mentioned non-responsiveness
of some respondents further shrinked the sample, making it difficult to construct a large panel
data. This study, therefore, uses both panel and cross-sectional data to complement each other
where the above mentioned data shortfalls exists.
4.3 Methods
The study uses a combination of descriptive statistics and regression analysis in testing its
hypotheses. The regression analysis utilized both panel and cross-sectional data approaches
with differing estimation methods for the purposes of testing robustness of the results. Testing
of the first study hypothesis through provision of descriptive statistics provided the bigger
picture of the burden that malaria shocks exert at household level through both direct costs and
loss of agricultural labour supply that may translate into indirect costs if it lower crop land-
productivity. Specifically, test for equality of means was employed to determine whether direct
costs of malaria impose stress on households’ consumption expenditure. The mean for the
proportion of direct malaria costs to consumption expenditure was tested against the
catastrophic threshold mean of 0.10 at household level (Prescott 1999; Ranson 2002) as cited in
Russell (2004). Thereafter, a set of panel data models were used to dig deeper into the direct
costs of malaria at household level. These models were employed to investigate the impact of
ITNs on direct costs of malaria by testing the second research hypothesis. To make the story of
economic burden of malaria at household level complete, the instrumental variable regression
model was estimated on crop production cross-sectional data to analyse the indirect costs of
15

malaria at household level. These models investigated the impact of labour loss due to malaria
on crop productivity and the role of ITN in cushioning the impact. Graphs are also presented
across various analytical approaches to provide visual representation of the results found
through testing of research hypotheses.
4.3.1. Model 1: Impact of ITN on Malaria Direct Costs
Model 1 estimated the long term impact of ITN interventions on direct costs of malaria using
panel methods. This approach was helpful in clearing skepticism on the long term impact of
ITN on malaria as the most widely used preventive intervention (Smith et al. 2009). Data on the
direct costs of malaria8 at household level was collected in a panel of two periods i.e. 2006 and
2010. First, the pooled (population average) estimator which requires satisfaction of ordinary
least squares assumptions (Woodridge 2009) was estimated to establish correlation between
direct malaria costs and ITN interventions at household level. The pooled estimator was
specified as follows:
ititit xy ' (1.1)
Where: i=1,2,3,…,152 (number of households interviewed)
The household time specific idiosyncratic error term ( it ) was assumed to be normally
distributed. In order to ensure satisfying homoskedasticity and normality assumptions, the
dependent variable entered the model as log of direct costs of malaria ( )ity 9. The vector of
explanatory variables (see table 1) was captured by in the model 1.1 with the time periods
2006 and 2010 represented by t where as
'itx
represented the constant term. With the pooled
estimator, however, we could not get random variation in the slope with varying time period in
our dataset and parameter estimates could be less asymptotically efficient as compared to
random effects estimator (Woodridge 2009). This, therefore, prompted the study to also
estimate the model 1 above through the random effects estimator. The random effect estimator
8 Household direct costs of malaria are measured in Ethiopian Birr (June 2010 Birr to US$ exchange was 13.5) 9 Plot of direct cost of malaria shows normal curve when we take the log of the variable as indicated in figure A1a and A1b in the appendices
16

(in equation 1.2 below) allowed random parameter variation where the slope ( i ) for the direct
costs of malaria varied across individual households.
ititiit xy ' (1.2)
The above pooled and random estimators assumed strict exogeneity (Woodridge 2009) which is
very strong assumption for direct malaria costs. This is because there may be individual
household specific unobserved heterogeneities, like genetic factors e.g. sickle cell (Aidoo et al.
2002) and immunity due to extended exposure to malarial parasites (Cohen 1977), leading to
differing susceptibility levels to malaria attacks. This could have translated into unobserved
heterogeneities among households to incurring direct costs of malaria. This problem
necessitated estimating the model 1 using the fixed effects estimator (equation 1.3) to avoid
bias in parameter estimates that could have risen due to correlation between the time invariant
unobserved heterogeneities and the regressors ( )(itx Woodridge 2009). In this case, the fixed
effect approach was perceived to provide consistent parameter estimates as compared to the
pooled and random effects estimators.
ititiit xy ' (1.3)
Where regressors ( itx ) can be correlated with the time invariant component of the
idiosyncratic error term ( it )
After estimating model 1 using the three different approaches, one efficient estimator had to be
selected. The Breusch and Pagan Langrangian test was employed to select the best estimator
between the pooled and random approaches. On the other hand, the Hausman’s specification
test was used to choose the consistent estimator between random effects and fixed effects
specifications. In addition to the above stated steps taken to ensure robustness of the results, all
the estimators were also subjected to standard errors clustered at household level.
17

The treatment variable (ITN intervention) entered the model in three forms: First, the number
of ITN(s) owned by the households as a continuous variable. This helped us to establish
whether the number of ITN owned at household level regardless of household size matters in
reducing the burden. Second, the ratio of ITN to household size was regressed as a continuous
treatment variable in the model. This took into consideration the within-household ITN
coverage in estimating the impact of ITN on the direct costs of malaria. Third, a dummy was
constructed from ITN-household ratios where one represented a ratio of 0.5 and above, zero for
otherwise. This was a proxy indicator for effective coverage of ITN intervention. The above
approaches provided good basis for evaluating the impact of ITN interventions in Tigray where
we did not have enough with and without counterfactual data10 as well as no before and after
ITN counterfactuals11. These ITN treatment variables were controlled for other factors like
distance to health facilities; literacy level of household head; age and sex for household head;
and the status of household dwelling house as indicated in the table 4.1 below.
10 Majority of households at least owned ITN (82.2% and 76.1% in 2006 and 2010, respectively) 11 Mass distribution of free ITNs by government started in 2005 hence no before and after counterfactual data.
18

Table 4.1: Description of Variables in Model 1
Description (Type and Measurement) Hypothesized
Relationship
to Dependent
Variable
Dependent Variable
Household direct costs
of malaria
Household annual expenditure on malaria prevention
and treatment measures. It was measured in Ethiopian
Birr (ETB). The 2006 costs were adjusted for inflation
using the consumer price index12
Independent Variable
Number of ITN(s) owned by households
Ratio of ITN to household size
ITN13 (Appearing in
different forms
alternated in the
estimated model) Ratio of ITN to household Size (1= 0.5 & above;
0=otherwise)
-
Distance to health
facility
Measured in minutes spent to walk from household’s
dwelling place to the nearest health facility. It was a
proxy indicator for access to treatment interventions.
+
Literacy level for
household head
Dummy (1=literate; 0=otherwise). -
Household head sex
(male=1)
Dummy (1=male, 0=otherwise) +
Household dwelling
house
Type of dwelling house as proxy for how well the
households were protected from mosquitoes (vectors of
malaria) through good housing (1=good housing i.e.
iron roofed; o=otherwise)
-
12 CPI data obtained from http://www.tradingeconomics.com/ethiopia/consumer-prices-index-average-imf-data.html 13 Only ITNs that were in functional state (physical and expected lifespan of 4years) were recorded to avoid counting non functional ITNs as shown in figure B2 in the appendices
19

4.3.2 Model 2: Impact of Malaria Shocks on Household Crop Productivity and the Role of
ITN
This model established the household indirect costs of malaria by estimating the impact of
labour days lost through malaria attacks on crop land-productivity. To this end, the value of
crop yield per operational land size was regressed on labour days lost due to malaria shocks,
controlled for some factors of crop productivity14 and produce market access at household
level, through a regression model. The variable on hired labour was also factored in the
regression in order to investigate the role of labour markets in substituting for the lost labour
due to malaria shocks.
Labour loss at household level is, however, endogenously determined by the frequency and
extent of malaria shocks suffered during the agricultural season. The frequency and extent of
malaria shocks could as well be proxy indication of how well or badly the households are
covered by both preventive and treatment interventions. This necessitated estimating the
regression model through instrumental variable approach with a variable each on frequency of
malaria shocks, ITN interventions and access to curative health services used as instruments.
The number of malaria episodes suffered by the household represented the frequency of
malaria shocks. On other hand, the ratio of ITNs to household size gave an indication of
household coverage with preventive interventions while distance to health facility was a proxy
for household access to malaria treatment interventions. This approach both controlled for
endogeneity bias and simultaneously estimated the effect of ITNs as well as treatment
interventions on the estimated impact of labour loss on crop land-productivity. Below is the
formation of the model:
iiii yxy 2*21
'1 (2.1)
ijiii vzxy 2'21
'*2 (2.2)
Where: i=1, 2, 3,…, 137 (households interviewed) & j=1,2,3(instrumental variables)
14 Labour supply (own and hired), draft power (oxen), average distance to plots, fertilizer, proxy for managerial skills (sex and literacy level for household head), irrigation practices and land market participation.
20

In the equation 2.1 above, represented the value of crop yield per operational land
holding, represented a vector of factors that affect crop productivity and market access (see
table 4.2), represented the number of labour days households lost due to malaria episodes
during the year while
iy1
'ix
2y*i
i referred to stochastic error term. The variable was endogenous
hence controlled for through estimation of equation 2.2 where was a vector of exogenous
factors affecting crop productivity and market access in equation 2.1, was a vector of
instrumental variables for the endogenous variable while was the error term in equation
2.2.
*2iy
'2iz
'ix
i*2iy v
The two stage least squares instrumental variable method was used to estimate model 2 where
labour loss was captured in number of days hence a continuous variable. This estimation
allowed conduction of post-estimation tests for endogeneity, strength of instruments and their
validity under the over-identification condition (Greene 2008; Woodridge 2002). With this
regard, Durbin and Wu-Hausman tests were used to determine whether labour loss due to
malaria shocks at household level was endogenous; F-statistic was used to test for joint strength
of the instruments; and Sargan and Basmann tests were employed to test validity of the
research instruments under over-identification restrictions. Use of robust standard errors
ensured robustness of results even under violation of homoscedastic assumption.
Below is table 4.2 that describes variables used in model 2. This description includes how the
variables were measured and the expected sign from the regressions.
21

Table 4.2: Description of variables in model 2
Variables Description (Type and Measurement)
Dependent Variable
Crop Output Value per
tsimdi15 of land
Obtained by multiplying unit crop output per
operational land size (tsimdi) by its price16. This
approach circumvented the problems of mixed-
cropping and varying crop types across different
households 17 (ETB)
Hypothesized
Relationship
to Dependent
Variable
Independent
Variables
Household head sex Dummy (1=male, 0=Otherwise) +
Literacy level for
household head
Dummy (1=literate, 0=otherwise). +
Household own labour
supply
Measured in man days supplied in plowing, weeding,
harvesting and threshing (continuous)
+
Average distance to
plots
Measured in walking minutes18 (continuous) -
Irrigation farming Household had an irrigable plot (Dummy: 1=yes;
0=otherwise). Proxy indicator for participation in
irrigation farming
+
Oxen ownership Dummy (1=own oxen; 0=otherwise). +
Fertilizer Quantity of fertilizer (kilograms) applied during the
season-summation of DAP and UREA (continuous)
+
Hired labour Number of man days supplied by hired labour
(continuous). Indicator for agriculture labour market
participation
+
15 One tsimdi equals one quarter of hectare 16 Each study community had its own average crop prices calculated from the reported household data on crop selling activities 17 Most households grow more than one crop and types of crops vary across households. Crops analysed included barley, wheat, teff, maize, millet, sorghum, field peas and faba beans 18 Averages calculated from total reported distance to all operational plots at household level
22

Land market
participation
Indicate whether the household participated in land
market either as landlord or tenant (dummy variable;
1=participate, 0=otherwise)
?
Access to produce
market
Measured in minutes spent to walk from household’s
dwelling place to the nearest produce market
(continuous)
-
Number of reported days lost due to malaria episodes
aggregated for the reporting period (continuous)
Labour loss
(Endogenous
Variable) Dummy whether the household reported labour loss
(1=yes; 0=otherwise).
-
Instrumental
Variables
Description (Type and Measurement) Hypothesized
Relationship
to
Endogenous
Variable
(Labour loss)
Number of malaria
attacks
This captured total number of malaria episodes19
suffered by household members which gave the
frequency of malaria shocks at household level
(continuous)
+
ITN Ratio of ITN to household size-proxy indicator for
the extent of household coverage with preventive
interventions (zero upwards)
-
Distance to health
facility
Measured in minutes spent to walk from household’s
dwelling place to the nearest health facility. It was a
proxy indicator for access to treatment interventions
+
19 Not all malaria attacks lead to labour loss at household level
23

4.4. Descriptive Statistics for Key Study Variables
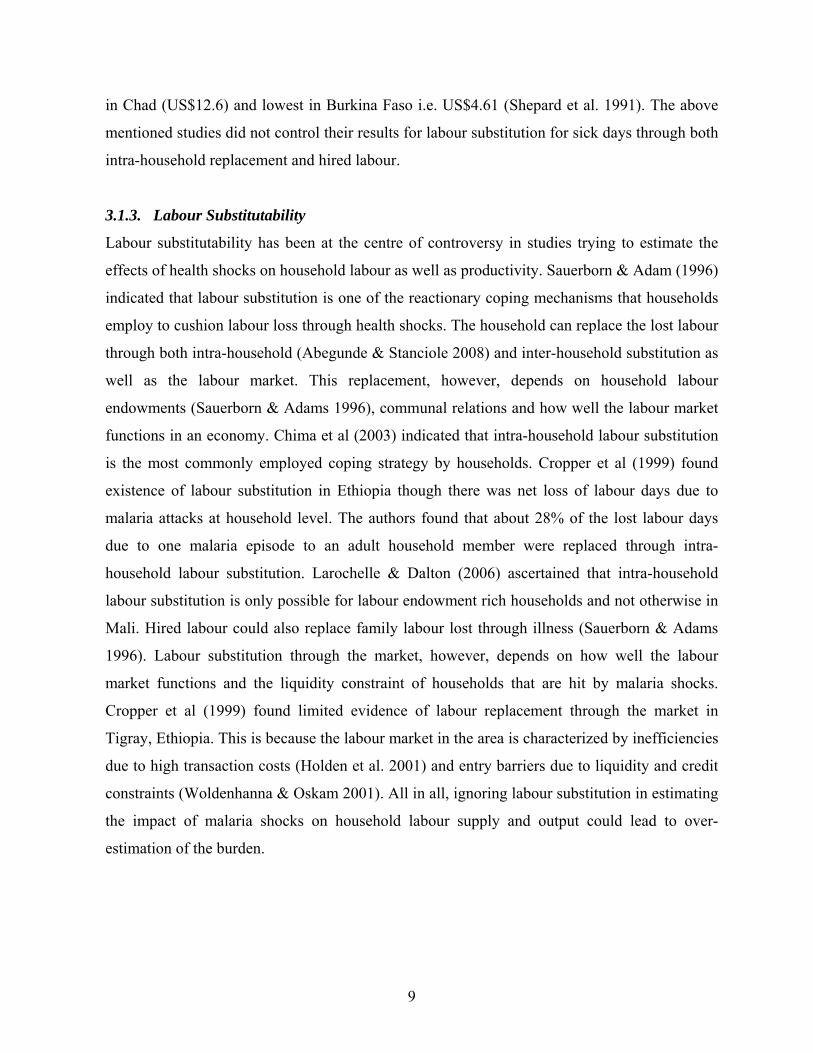
It was imperative for this section to provide descriptive statistics in two sets considering the
fact that two data sets, panel and cross-sectional, were both used in the study. Table 4.3
provides statistics for key variables on direct costs malaria as captured in the panel data set
while statistics for analysis of indirect costs of malaria from cross-sectional dataset are
presented in table 4.4. On a good note, statistics for similar variables (like sex and age of
household head, ITN ownership) for the two datasets for the year 2010 do not significantly
differ despite having different total number of observations hence indicated no attrition biases.
24
Table 4.3: Descriptive Statistics for key variables in analysis of direct costs of malaria
2006 2010 Variables
Obs20. Mean (SD) Obs. Mean (SD)
Age of household head (years) 152 46.71(14.74) 152 50.22 (15.06)
Household size 152 4.92 (2.19) 152 5.07 (2.19)
Distance to mosquito breeding place (walking minutes)
152 11.32 (5.00) 152 10.39 (11.20)
Distance to health facility (walking minutes)
152 48.51 (30.00) 152 54.57 (48.97)
Number ITN owned 152 1.34 (0.91) 151 1.36 (0.96)
Malaria shocks 145 6.10 (19.92) 151 3.38 (5.98)
Direct costs of malaria(ETB) 152 415.29 (1161.74) 152 78.39 (205.67)
Medical Expenditure (ETB) 515.73 (1231.86)
Cash consumption (ETB) 152 5867.06 (1231.86)
Total consumption (ETB) 152 12516.16 (9059.53)
Obs. Frequency (%) Obs. Frequency (%)
Sex of household head (female) 152 43 (28.29) 152 44 (28.95)
Literate household heads 97 55 (36.18) 97 55 (36.18)
Good housing 58 7 (12.07) 152 55 (36.18)
Own ITN 152 125 (82.24) 151 111 (76.16)
ITN-household size ratio of 0.5
& above
152 49 (32.24) 152 33(21.71)
Households suffered malaria shocks
145 96 (66.21) 151 94 (62.25)
20 Obs. means number of observation
25

Table 4.4: Descriptive Statistics for key variables in analysis of indirect costs of malaria
Variable Obs. Mean Standard errors
Value of crop output (ETB)/tsimdi 136 4630.75 6550.09
Average distance to plots (minutes) 137 24.04 26.90
Plot size (tsimdi) 137 5.96 4.49
Own labour supply (man days) 137 85.66 56.07
Hired labor supply (man days) 137 12.19 29.24
Fertilizer (kg) 137 48.09 44.84
Distance to produce market (minutes) 111 95.51 65.65
Labour loss due to malaria shock (man
days)
137
11.99 18.54
Distance to health facility (minutes) 136 48.18 42.49
Malaria shocks(number) 137 3.15 4.52
ITN-household size ratio 137 0.30 0.28
Obs. Frequency (%) Standard Errors.
Sex of household head (female) 137 38 (28.36) 0.04
Literacy level 137 46 (34.33) 0.04
Own oxen 137 69 (51.49) 0.04
Participation in labour market 137 56 (41.79) 0.04
Participation in credit market 137 40 (29.85) 0.04
Participation in land market 137 53 (39.55) 0.04
Own irrigation plot 137 24 (17.91) 0.03
Households with ratio of ITN to household
size of at least 0.5
137 29 (21.64) 0.04
No. of households losing labour days due
to malaria shocks
134 67 (50.00) 0.04
No. of households both losing labour and
hiring labour
70
44 (32.9) 0.21
26

5.0 Results and Discussion
5.1. Overview of Malaria Shocks and Impacts at Household Level
The majority of the households suffered malaria shocks i.e. 66.2% and 62.2% in the two
periods of 2006 and 2010, respectively. The mean number of malaria episodes per household
decreased from 6.2 in 2006 to 3.4 in 2010. This difference is clearly illustrated by kernel
density distributions in the figure 5.1.1 below. The difference in malaria shocks between the
two periods could be attributed to increased knowledge and use of preventive interventions as
scaled-up by the government under the Malaria Roll Back Initiative (MOH 2008). The
relatively higher malaria episodes in 2006 also reflect an epidemic that affected Kara Adiyabo,
one of the study areas.
2006 2010
.4
.2
.3
Den
sity
.1
0
6 2 4Log number of malaria episodes
0
Figure 5.1.1: Kernel Density Distribution of Malaria Episodes at household level by Year
The above mentioned malaria shocks lead to 54.0% and 44.7% of households incurring direct
costs of malaria in 2006 and 2010, respectively. On the other hand, the malaria shocks in 2010
lead to 50% of households to lose a mean of 23.5 man days due to sickness and care giving. On
the overall, the mean number of labour days lost by households due to malaria was 11.99 in the
27
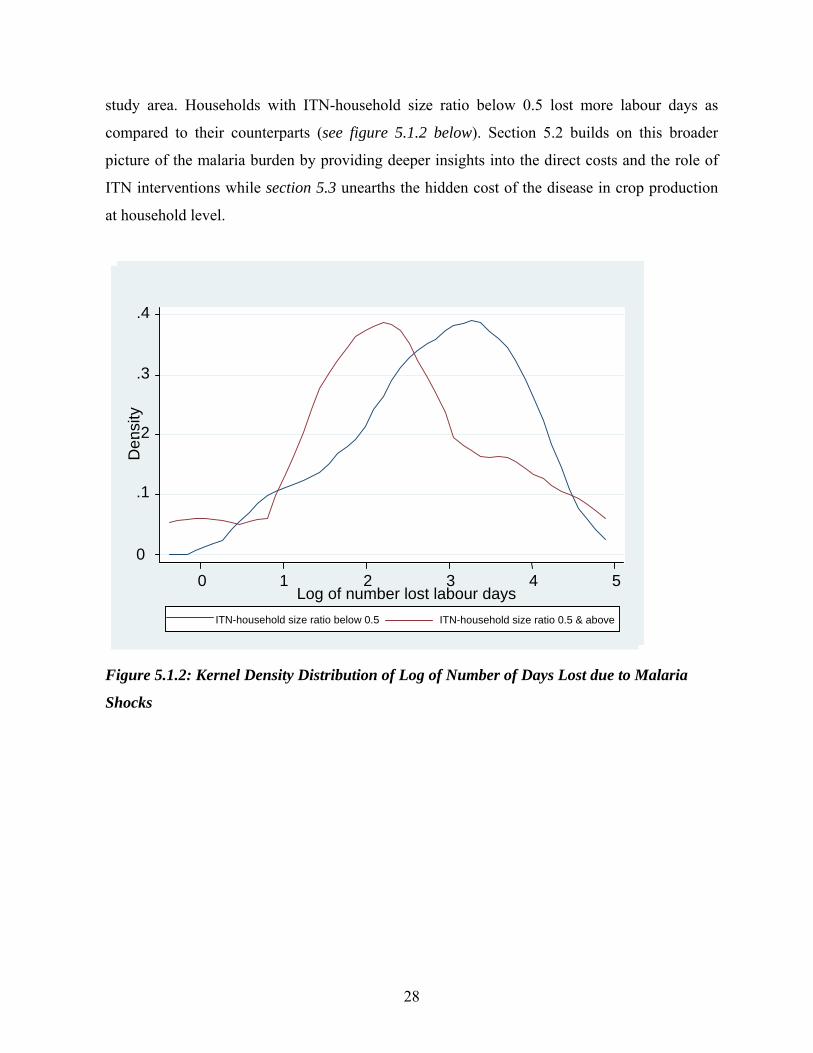
study area. Households with ITN-household size ratio below 0.5 lost more labour days as
compared to their counterparts (see figure 5.1.2 below). Section 5.2 builds on this broader
picture of the malaria burden by providing deeper insights into the direct costs and the role of
ITN interventions while section 5.3 unearths the hidden cost of the disease in crop production
at household level.
ITN-household size ratio 0.5 & above ITN-household size ratio below 0.5
.4
.2
.3
Den
sity
.1
0
5 1 2 3 4Log of number lost labour days
0
Figure 5.1.2: Kernel Density Distribution of Log of Number of Days Lost due to Malaria
Shocks
28
5.2. Direct Costs of Malaria and the Role of ITNs at Household Level
5.2.1. Mean Direct Costs of Malaria and Implications on Consumption Expenditure (Direct
Cost Burden21 of malaria)
The mean annual direct cost of malaria was ETB22 415.29 and ETB 78.39 in 2006 and 2010,
respectively. These costs contributed to 15% of total medical expenditures, 1.34% of cash
consumption expenditure and 0.69% of total annual household expenditure in 201023. The
results from the equality mean tests (see table 5.1 below) indicate that direct cost burden of
malaria of 0.69% is significantly lower than the catastrophic threshold level of 10% of the
household consumption expenditure or income (Prescott 1999; Ranson 2002) as cited in
(Russell 2004). This is contrary to the first study hypothesis that postulated that malaria
imposes stress on household consumption expenditure. This low direct cost burden of the
disease could be an explanation for the households’ low willingness to pay for ITN
interventions found in the area (Cropper et al. 1999; Owani 2007). Interestingly, the direct cost
burden of malaria found above (0.69%) is almost equal to households’ willingness to pay for
ITN reported by Cropper (1999) in the region. Cropper (1999) reported that only 30% of
households were willing to pay for recovery cost of ITN (US$ 6) despite the fact that this cost
was just 0.68% of the mean annual income in the area adjusted for the life span of the bed net.
This result might indicate that households make adoption decisions based on direct costs
without incorporating indirect costs of the disease.
Low direct cost burden on its own, however, does not mean the economic burden of malaria is
insignificant in the area unless indirect costs (hidden costs in crop production) are also negligible,
which is not the case as shown by the results in section 5.3. The direct cost burden of malaria
found in Tigray (0.69%) is lower than in Ghana (Asante et al. 2005), Kenya (Chuma et al.
2006), Malawi, Sri Lanka and rural Nigeria (Russell 2004) at 14.1%, 6.5%, 2%, 2% and 2.9%,
respectively. This lower direct cost burden in Tigray could be explained by the hypo-endemic
nature of malaria transmission (Ghebreyesus et al. 1996), increased access to free malaria
treatment in public health facilities (MOH 2007) and expanded prevention through the free
21 Direct cost burden refers to the percentage of household direct costs of malaria on household expenditure 22 Ethoipian Birr (ETB) to US$ exchange averaged 13.5 during the survey period (Commercial bank of Ethiopia) 23 There was no consumption expenditure data for 2006
29

ITNs government program (MOH 2008). The role of ITNs in mitigating direct costs of malaria at
household level in Tigray is ascertained in the section below.
Table 5.1: One-sample t test for direct cost burden of malaria compared to a threshold of
0.10 (10% of household consumption expenditure)
Details Direct cost burden
Mean (se) 0.0068857 (0.00014769)
t-statistics -63.0488
Degrees of freedom 151
Pr(T<t) 0.0000
5.2.2. Role of ITN interventions on Direct Costs of Malaria
Eighty-two percent of households owned at least one ITN in 2006 as compared to 76.1% in
2010 with median of one and two nets in the two years, respectively. Plotting the direct costs of
malaria using Kernel density in figure 5.1 provides no clear differences for households with
and without ITNs.
30

With ITNWithout ITN
.25
.2
.1
.15
Den
sity
.05
0
10 84 6Log of direct costs of malaria
2 0
Figure 5.2.1: Kdensity for Direct Costs of Malaria for Households with & without ITN
The difference in direct costs, however, becomes clear when household size is taken into
consideration to capture effective coverage of ITN at household level. Figure 5.2.2 clearly
shows that households with ITN-household size ratio of at least 0.5 had lower direct costs than
there counterparts with a ratio smaller than 0.5 which is a proxy for starting point of effective
coverage24 in this study.
24 With ITN-household size ratio of at least 0.5, we are guaranteed that more that half of the household is covered by ITN interventions. The free ITN program in 2010 was distributing one net to households with size below four and two nets to those households with at least four members (see figure B1 in the appendices)
31

ITN-household ratio => 0.5 ITN-household ratio below 0.5
.3
.1
.2
Den
sity
0
10 84 6Log of direct costs of malaria
2 0
Figure 5.2.2: Graph showing distribution of log of direct costs of malaria by ITN-household
ratio
The pictorial results presented above are ascertained by the estimation of model 1 under pooled,
random and fixed effects assumptions. The results indicate that the number of ITNs owned by
the households does not significantly reduce direct costs of malaria until intra-household
coverage is taken into consideration. As the ratio of ITNs to household size increases, direct
cost of malaria significantly (10% level of significance) decreases at the household level. The
decrease in direct costs of malaria becomes more significant for household that have ITN-
household size ratio of at least 0.5 as compared to their counterparts with a ratio below 0.5.
This result is robust across all the three estimators (pooled, random and fixed effects) though
the fixed effects estimator gives consistent parameter estimates compared to random effects
estimator as confirmed by the hausman25 test as indicated in the table 5.2 below. Only results
from the fixed effects estimator are presented in the table 5.2 because of their consistency,
25 The Hausman test is ideal because the model 1 displays normality and homoskedastic as indicated by figure A1b for dependent variable and small differences between ordinary and robust standard errors in tables C2a and C2b in the appendices
32

based on the Hausman Test, while results from the pooled and random models are presented in
table C1 in the appendices.
Table 5.2: Model 126: The Role of ITN on direct costs of malaria at household level (Log of
direct malaria cost was the dependent variable)
Treatment Variable ( ITN Intervention)Entering Models in Three Forms
Number of ITN ITN-Household Size
Ratio
ITN-Household Size Ratio
Dummy (1=0.5 and above,
0=otherwise)model 1.3)
Independent Variables
Fixed Effects
Estimators (b/se)
Fixed Effects
Estimators (b/se)
Fixed Effects Estimators
(b/se)
Distance to health facility 0.036 (0.02) 0.034 (0.02) 0.027 (0.01)**
Age of household head 0.038 (0.06) 0.055 (0.05) 0.039 (0.03)
Sex of household head 5.120 (3.08) 0.470 (3.65) 1.415 (1.75)
Distance to mosquito
breeding place
-0.111 (0.08) -0.064 (0.06) -0.063 (0.03)
Iron roofed dwelling house -7.261 (2.92)* -7.955 (2.62)* -6.155 (1.40)**
ITN Intervention -1.584 (0.79) -8.425 (3.35)* -4.161 (0.76)***
Constant 2.505(5.77) 5.599 (5.65) 3.526 (2.72)
Model Test (Prob>chi2) 0.122 0.070 0.007
Number of Observations 76 76 76
R2 0.834 0.95 0.961
Hausman (P-values) 0.0247 0.0063 0.0000
Note: Significance levels * 0.10; ** 0.05; *** 0.01; **** 0.001 b refers to parameter estimates; se represents standard errors corrected for clustering at household level
The results above show that, improving ITN per capita coverage by 100 points (ratio of 0.1)
would lower direct household costs of malaria by 9.4 times (by 842.5%) in Tigray. For
instance, doubling the current ITN per capita coverage (i.e. 320/1000 to 640/1000 individuals)
would dramatically reduce the annual average direct costs of malaria at household level from 26 The model is estimated under pooled, random and fixed effects estimators with standard errors corrected for clustering at household level. ITN interventions enters in the three different forms i.e. number of ITN owned, ITN-household size ratio and dummy for ITN-household size ratio (1=0.5 & above) in each of the three model estimations. Only estimation model that gave consistent estimates is presented for each ITN category based on the Hausman test. The rest of the models are presented in table C1 in the appendices.
33

ETB78.39 to ETB1.2327. The marginal reduction in the direct costs of malaria, however,
diminishes as ITN coverage per capita increases. For example, at the cut-point of 500/1000
(50% ITN per capita coverage), the difference in direct costs for those equal and above would
only be 5.2 times (416%) lower than their counterparts below. All in all, improving ITN per
capita would bring tremendous reduction in direct cost burden of malaria in Tigray.
In addition to ITN interventions, good housing also significantly reduces direct costs of malaria
at household level in the study area. Good housing lowers direct cost of malaria by 7 (615%) to
9 times (796%) as shown in table 5.2. The magnitude in the reduction of direct costs,
astonishing as it is, can be explained by two reasons. First, good housing (closed eaves and iron
roofed) reduces the likelihood of Anopheles gambiae s.1 (vector of malaria in Tigray) to enter
and rest in homes hence reducing malaria risks. This explanation is consistent with the findings
of Lindsay (2002) who found out that good housing (closed eaves, iron roofed and ceiling) is
associated with fewer mosquitoes indoors than houses without these features in 18 of 20 studies
conducted. Gunawardena et al (1998), specifically, found out that households living in poor
housing in Sri Lanka were 2.5 times more vulnerable to malaria than those with good housing.
Such reduction in malaria risks is likely to have multiplier effects on the reduction of direct cost
of the disease hence big parameter estimates as observed above. Second, the study did not
investigate whether households were covered by indoor residual sprays (IRS) through the
government malaria control program between 2006 and 2010. If this method was really used in
the study area between the two panels then it could be another reason behind large parameter
coefficient for good housing since IRS is more efficient in reducing malaria incidences in long
term under good housing conditions than poor conditions (Konradsen et al. 2003).
Generally, there was no robust evidence that distance to health facilities significantly increases
direct cost burden in Tigray28. This result could be explained by the use of community health
attendants in administering prompt malaria treatment to households under the expanded Health
Services Extension Program (MOH 2007) that could render distances to health facilities not to
27 See detailed calculations in the appendices calculations D1 28 Though it positively correlates with direct cost burden but it is only significant (5%) in one (fixed model) in the 9 models estimated as shown in table C1 in the appendices
34

be a significant variable in the determination of direct costs of malaria. These community
health attendants are located within the vicinities of the rural households.
The pooled and random effects models, though not consistent29, also indicate that living near
mosquito breeding places may lead to higher direct costs of malaria30. The non robustness of
the result could be explained by small variations in the distances to mosquito breeding places
(with mean of 10 walking minutes) in the area (see figure A2 in the appendices) with the
expansion of micro-dams construction under the Sustainable Agriculture and Environmental
rehabilitation Program (Amacher et al. 2004; Ghebreyesus et al. 1998).
5.3. Hidden Costs of Malaria: The Impact of Malaria on Crop Productivity and the
Role of ITNs
Despite the study findings that direct cost burden of malaria are not catastrophic to households’
consumption expenditures, estimation of the instrumental variable model 2 (see table 5.3)
revealed significant hidden costs of malaria in crop production in Tigray. This finding is in
agreement with Croppenstedt & Muller (2000) who established that morbidity status of
households negatively affect agricultural productivity in Ethiopia. Loss of one labour-day by
the household due to malaria shock resulted into loss of about ETB 43.45 worthy of crop value
per tsimdi of cultivated land i.e. US$ 12.74 per hectare31 (second stage estimation in table 5.3).
This implies that malaria, on average, accounts for 11.25%32 of crop-land productivity loss in
malarious areas of the region. Labour shocks due to malaria worsens the already existing labour
shortages at household level as indicated by the significant positive marginal productivity of
own labour supply. This rules out complete cushioning of the hidden malaria costs through
intra-household labour substitution. The above result concurs with the findings of Cropper et al
(1999) who found net labour loss due to malaria attacks at household level despite the existence
of intra household labour substitution in the study area. The labour market, however, proves to
29 Based on the Breusch & Pagan Lagrangian multipliers and Hausman tests 30 As the distances to mosquito breeding places decrease (by one minute walking time), the direct costs increases by 5% to 6%. Significant at 10 % level only (see table C1 in the appendices) 31 One tsimdi =0.25 hectares and the 2010 Birr to US$ exchange rate was 13.5 (Ethiopian Commercial Bank, June 2010) 32 See detailed calculations in the appendices calculations D2.1
35

play a significant role in cushioning the labour losses due to malaria though it is not a perfect
substitute to the lost household labour. This is substantiated by the finding that it takes more
than one hired labour days to completely cushion one lost household labour-day due to the
disease33. Imperfect substitution between the two forms of labour may indicate the existence of
adverse selection and moral hazard in the labour market. Households are also unable to
completely cushion crop land-productivity loss due to malaria shocks through the labour
market as indicated by the positive marginal hired labour productivity in table 5.3 below. This
might entail constrained labour market in the region due to high transaction costs (Holden et al.
2001) exacerbated by liquidity and credit constraints (Woldenhanna & Oskam 2001).
Malaria hidden costs increase as the number of malaria episodes increase at household level.
One malaria episode leads to households losing about two labour days. This situation
significantly worsens as the distances households have to cover to reach their cropping plots
increase. On a good note, these hidden costs of malaria are indirectly cushioned by ITN
interventions34. Improving ITN per capita coverage by 100 points (ratio of 0.1) may reduce the
average household lost labour by 1.76 days hence reducing the average hidden costs by 14.68
percent. The results, ceteris paribus, suggest that doubling the current ITN per capita coverage
(.i.e. from 320/1,000 to 640/1,000) may almost wipe out the hidden costs of malaria in the
region35. Caution, however, should be taken in interpretation of these results considering the
fact they are only significant at 80 percent level of confidence. Possible explanation to the
above result is the observed small variations in the ITN-household size ratio in the sample with
many household having ratios below 0.5 (79.46%). This relates to the targeting mechanism of
free ITNs under the government program that provide one ITN to households with sizes below
four and two ITNs to those households with sizes of at least four36.
As expected, the use of inorganic fertilizer (DAP and UREA) and participation in the credit
market significantly and positively increase crop land-productivity through increased yields in
33 The parameter estimates for hired labour is less than one (in absolute terms) in the first stage estimation of model 2 in table 5.3. 34 Significant at 80% level of confidence (p=0.19) 35 Reduce these costs by 93.9% (from ETB 520.97 to ETB 31.54) as indicated in appendices calculations D2.2d and D2.2g 36 See one of the 2010 ITN distribution functions captured in photos in the figure B1 in the appendices
36

the study area. Participation in the credit market reduces capital constraints hence households
are able to acquire productivity enhancing inputs like fertilizer and improved seeds. With
reduced liquidity constraints, households can also enter the labour market and to some extent
(as discussed above) cushion the labour losses due to malaria shocks.
37

Table 5.3: Model 2: Hidden costs of malaria in crop production and the role of ITNs
(Number of labour days lost due to malaria and value of crop output per tsimdi37 were
dependent variables for first and second stage estimation, respectively)
Variables/Tests First Stage Estimation Second Stage Estimation
b/robust se b/ robust seLabour days lost38 -43.45(19.05)**Average distance to plot 0.12(0.07)* 0.58(4.54)Own oxen 3.72(3.53) 172.29(254.45)Own labour supply 0.60(0.04) 8.72(4.67)*Hired labour -0.11(0.06)* 5.18(7.18)Literacy -1.03(3.60) 88.42(249.14)Credit participation 1.95(3.70) 869.82(325.48)***Land market participation 2.25(3.92) 272.90(285.81)Male headed household 0.39(4.18) 49.40(281.79)Fertilizer (kg) -0.03(0.04) 7.44(2.87)***Distance produce market 0.04(0.03) 1.73(2.36)Own irrigation plot -1.38(3.88) 252.34(402.54)Constant -6.20(5.69) -370.25(488.46)Model Test (Prob > chi2) 0.000 0.002Number of Observations 108.00 108.00R2 0.35 0.24Adjusted R2 0.25Instruments Distance to health facility 0.06(0.04)No. of malaria episodes 1.76(0.48)****ITN-household size ratio -7.97(6.04)Endogeneity Tests Durbin (score) chi2 (1) 4.20**Wu-Hausman F (1,94) 3.54*Test for strength of instruments F-joint statistics 6.50****Test for validity of instruments Score Chi2 (2) 0.22Sargan 0.30Basmann 0.26Note: Significance levels: * 0.10 ** 0.05 *** 0.01 **** 0.001; b refers to parameter estimates; se represents standard errors. There was no multicollinearity in the model as all variables passed the collinearity tests (_rmcoll, __rmdcoll and Variance Inflation Factor (VIF) - see table C3 for results)
37 Measured in Ethiopian Birr (ETB) 38 Endogenous variable (number of labour days lost due to malaria shocks)
38

6.0 Conclusion
The study findings on the economic burden of malaria at household level in Tigray, Ethiopia
are two faced. Pleasingly, the direct cost burden of malaria (0.69% of consumption
expenditure) is insignificant and not catastrophic (much below the limit at 10% of consumption
expenditure) to household consumption expenditure. The above promising result is, however,
eclipsed by the gloomy faced finding that the disease lowers crop land-productivity by 11.25%
through lost labour due to illness and care giving. This is amid the revelation of deficient labour
substitution through constrained labour market and intra-household arrangements. All is not
lost yet as ITN interventions has proven to cushion households from the economic burden of
malaria. This cushioning, however, becomes more significant with increased coverage of ITN
interventions at household level. The cushioning of the direct cost burden is also more
pronounced for households living under good housing conditions than their counterparts with
poor housing conditions. Interestingly, the study findings suggest that doubling the current ITN
per capita coverage (.i.e. from 320/1,000 to 640/1,000) may almost wipe out the average direct
costs39 and hidden costs40 of malaria in the region.
The above research findings have important policy implications towards the fight against
malaria in the region. First, the findings show large scope for crop land-productivity
improvements by scaling up the fight against the disease. Second, the fact that direct cost
burden of malaria is negligible, but hidden costs are significant, entail that messages promoting
the adoption of malaria interventions at household level have to explicitly capture these hidden
costs that are often ignored in their adoption decisions. Third, the above messages should be
followed up by the opening of ITN markets where large sized households could buy (after
being convinced by informative messages above) to complement on ITNs they receive through
the free government distribution programs in order to improve their specific ITN coverage
ratios. Fourth, for targeting purposes of malaria preventive interventions, priority should be
given to those households with poor housing since they are the most vulnerable to the disease
in the region.
39 Reduce direct costs from ETB 78.39 to ETB 1.23 but the marginal reduction decreases as ITN coverage increases. 40 Reduce hidden costs by 93.9 % but only significant at 80% level of confidence hence caution should be taken in interpreting the results.
39

References:
Abegunde, D. O. & Stanciole. (2008). The Economic Impact of Chronic Diseases: How do
Households Respond to Shocks? Evidence from Russia. Social Science and Medicine,
66 (2008): 2296-2307.
Aidoo, M., Terlouw, D. J., Kolczak, M. S., McElroy, P. D., ter Kuile, F. O., Kariuki, S.,
Nahlen, B. L., Lal, A. A. & Udhayakumar, V. (2002). Protective Effects of the Sickle
Cell Gene against Malaria Morbidity and Mortality. The Lancet, 359 (9314): 1311-
1312.
Amacher, G. S., Ersado, L., Grebner, D. L. & Hyde, W. F. (2004). Disease, Micro-Dams and
Natural Resources in Tigray, Ethiopia: Impacts on Productivity and Labour Supplies.
Journal of Development Studies, 40 (6): 122-145.
Asante, F. A., Okyere, K. A. & Kusi, A. (2005). The Economic Impact of the Burden of
Malaria in Ghana, 66. Legon: Isser Technical Publication Series. pp. 1-64.
Asenso-Okyere, W. K. & Dzator, J. A. (1997). Household Cost of Seeking Malaria Care: A
Retrospective Study of two Districts in Ghana. Social Science and Medicine, 47 (5):
659-667.
Attanakaye, N., Fox-Rushby, J. & Mills, A. (2000). Household Costs of Malaria Morbidity: A
Study in Matale District, Sri Lanka. Tropical Medicine and International Health 5: 595-
606.
Audibert, M. (1986). Agricultural Non-Wage Production and Health Status: A Case Study in a
Tropical Environment. Journal of Development Economics, 24: 275-291.
Audibert, M., Mathonnat, J. & Henry, M. C. (1999). Role of Malaria in Technical Efficiency of
Cotton Producers in the North of the Côte d'Ivoire. Review of Economy and
Development, 4 (121-148).
Belay, M. & Deressa, W. (2008). Use of Insecticide Treated Nets by Pregnant Women and
Associated Factors in a Pre-dominantly Rural Population in Northern Ethiopia. Tropical
Medicine & International Health, 13 (10): 1303-1313.
Chima, R. I., Goodman, C. & Mills, A. (2003). The Economic Impact of Malaria in Africa: A
Critical Review of the Evidence. Health Policy, 63: 17-36.
40

Chuma, J., Thiede, M. & Molyneux, C. (2006). Rethinking the Economic Costs of Malaria at
the Household Level: Evidence from Applying a New Analytical Framework in Rural
Kenya. Malaria Journal, 5: 1475-2875.
Cohen, S. (1977). Mechanisms of Malarial Immunity. Transactions of the Royal Society of
Tropical Medicine and Hygiene, 71 (4): 283-286.
Croppenstedt, A. & Muller, C. (2000). The Impact of Farmers' Health and Nutritional Status on
their Productivity and Efficiency: Evidence from Ethiopia. Economic Development and
Cultural Change, 48 (3): 475-502.
Cropper, M. L., Haile, M., Lampietti, J. A., Poulos, C. & Whittington, D. (1999). The Value of
Preventing Malaria in Tembien, Ethiopia. Washington D.C: World Bank. 1-75 pp.
Dercon, S. (2002). Income Risk, Coping Strategies, and Safety Nets. The World Bank Research
Observer, 17 (2): 141-166.
Ettling, M., McFarland, D. A., Schutz, L. J. & Chitsulo, L. (1994). Economic Impact of Malaria
in Malawian Households. Tropical Medicine & Parasitology, 45 (3): 214-218.
Ettling, M. B. & Shepard, D. S. (1991). Economic Impact of Malaria in Rwanda. Tropical
Medicine and Parasitology, 42 (3): 214-218.
Gallup, J. L. & Sachs, J. D. (2001). The Economic Burden of Malaria. Am J Trop Med Hyg, 64
(1_suppl): 85-96.
Gallup, J. L. & Sachs, J. D. (2001). The Economic Burden of Malaria. Massachusetts: Centre
for International Development.
Ghebreyesus, T. A., Alemayehu, T., Bosma, A., Hanna Witten, K. & Teklehaimanot, A.
(1996). Community Participation in Malaria Control in Tigray Region, Ethiopia. Acta
Tropica, 61 (2): 145-156.
Ghebreyesus, T. A., Haile, M., Getachew, A., Alemayehu, T., Witten, K. H., Medhin, A.,
Yohannes, M., Asgedom, Y., Ye-ebiyo, Y., Lindsay, S. W., et al. (1998). Pilot Studies
on the Possible Effects on Malaria of Small-Scale Irrigation Dams in Tigray Regional
State, Ethiopia. Journal of Public Health, 20 (2): 238-240.
Gollin, D. & Zimmermann, C. (2007). Malaria:Disease Impacts and Long-Run Income
Differences. IZA (ed.). Bonn: IZA.
Greene, W. H. (2008). Econometric Analysis. Englewood Cliffs, New Jersey: Prentice-Hall.
Gujarati, D. N. (1995). Basic Econometrics. New York: McGraw-Hill.
41

Gunawardena, D., Wickremasinghe, A., Muthuwatta, L., Weerasingha, S., Rajakaruna, J.,
Senanayaka, T., Kotta, P., Attanayake, N., Carter, R. & Mendis, K. (1998). Malaria
Risk Factors in an Endemic Region of Sri Lanka, and the Impact and Cost Implications
of Risk Factor-based Interventions. Am J Trop Med Hyg, 58 (5): 533-542.
Hagos, F., Pender, J. & Gebreselassie, N. (2003). Land Degradation and Strategies for
Sustainable Land Management in the Ethiopian Highlands: Tigray Region. ILRI (ed.).
Socio-economic and Policy Research Working Paper 25. Nairobi: International
Livestock Research Institute. p. 80.
Holden, S., Shiferaw, B. & Pender, J. (2001). Market Imperfections and Land Productivity in
the Ethiopian Highlands. Journal of Agricultural Economics, 52 (3): 53-70.
Konradsen, F., Amerasinghe, P., Van Der Hoek, W., Ameraisnghe, F., Perera, D. & Piyaratne,
M. (2003). Strong Association between House Characteristics and Malaria Vectors in
Sri Lanka. Am J Trop Med Hyg, 68 (2): 177-181.
Larochelle, C. & Dalton, T. J. (2006). Transient Health Shocks and Agricultural Labor
Demand in Rice-producing Households in Mali. International Association of
Agricultural Economists Conference, Gold Coast Australia: Department of Resource
Economics and Policy, University of Maine.
Leighton, C. & Foster, R. (1993). Economic Impacts of Malaria in Kenya and Nigeria. Health
Financing and Sustainability Project, vol. 6. Maryland: Abt Associates.
Lengeler, C. (2003). Insectcide Treated Bednets and Curtains for Preventing Malaria
(Cochraine Review). In The Cochrane Library. Chichester: John Wiley and Son.
Lindsay, S. W., Emerson, P. M. & Charlwood, J. D. (2002). Reducing Malaria by Mosquito-
Proofing Houses. Trends in Parasitology, 18 (11): 510-514.
McCarthy, D. F., Wolf, H. & Wu, Y. (2000). The Growth Costs of Malaria, Working Paper
7541. Washington, D.C.: National Bureau of Economic Research.
MOH. (2004). Insecticide Treated Nets (ITNs): National Strategic Plan for Going to Scale with
Coverage and Utilization in Ethiopia 2004-2007. Health, F. R. o. E. M. o. Addis Ababa.
MOH. (2005-2006). Health and Health Related Indicators. Department, P. a. P. Addis Ababa.
MOH. (2007). Health Extension Programme in Ethiopia. Addis Ababa: Ministry of Health
42
MOH. (2008). Ethiopia National Malaria National Survey Technicla Report. Addis Ababa:
Federal Democratic Republic of Ethiopia Ministry of Health
Owani, J. (2007). Commitment to Acquire Insecticide Treated Mosquito Bednet and Impacts of
Free Bednet Distribution Following Malaria Epidemic in Tigray Region-Northern
Ethiopia: University of Life Sciences, Norway, Department of Economics and Resource
Management. 65 pp.
Paulander, J., Olsson, H., Lemma, H., Getachew, A. & Sebastian, M. S. (2009). Knowledge,
Attitudes and Practice about Malaria in Rural Tigray, Ethiopia. Global Health Action, 2.
Prescott, N. (1999). Coping with Catastrophic Health Shocks. Conference on Social Protection
and Poverty, Washington DC.
Ranson, K. (2002). Reduction of Catastrophic Health Care Expenditures by a Community-
Based Health Insurance Scheme in Gujarat, India:Current Experiences and Challenges.
Bulletin of World Health Organisation, 80: 613-621.
Russell, S. (2004). The Economic Burden of Illness For Households in Developing Countries:
A Review of Studies Focusing on Malaria, Tuberculosis and Human Immunodeficiency
Virus. The American Society of Tropical Medicine and Hygiene, 71 (supplement 2):
147-155.
Sauerborn, R. & Adams, A. M. (1996). Household Coping with the Economic Costs of Illness.
Social Science and Medicine, 43 (3): 291-301.
Shepard, D. S., Ettling, M. B., Brinkmann, U. & Sauerborn, R. (1991). The Economic Cost of
Malaria in Africa. Tropical Medicine and Parasitology, 42 (3): 199-203.
Smith, D. L., Hay, S. I., Noor, A. M. & Snow, R. W. (2009). Predicting Changing Malaria Risk
after Expanded Insecticide-Treated Net Coverage in Africa. Trends in Parasitology, 25
(11): 511-516.
THB. (2006). Tigray Health Profile. Mekelle: HMIS Unit, Tigray Health Bureau.
Tulu, A. N. (1993). Malaria. In Kloos, H. & Zein, A. Z. (eds) The Ecology of Health and
Disease in Ethiopia, pp. 341-352. Boulder: Westview Press Inc.
UN. (2011). Our-Solutions/Campaigns/Nothing-But-Nets. (accessed: 10 May 2011).
UNICEF. (2009). State of the World’s Children 2009: Case of Ethiopia.
UNICEF. (2010). Unite for Children. Addis Ababa: UNICEF Ethiopia. Available at:
http://www.unicef.org/ethiopia/children.html (accessed: 6/01/2011).
43

Wang’ombe, J. K. & Mwabu, J. M. (1993). Agricultural Land Use Patterns and Malaria
Conditions in Kenya. Social Science and Medicine, 37 (9): 1121-1130.
Woldenhanna, T. & Oskam, A. (2001). Income Diversification and Entry Barriers: Evidence
from the Tigray Region of Northern Ethiopia. Food Policy, 26 (4): 351-365.
Woodridge, J. M. (2002). Econometric Analysiss of Cross Section and Panel Data:
Massachusetts Institute of Technology.
Woodridge, J. M. (2009). Introductory Econometrics: A Modern Approach. 5th ed. New York:
Thomson South-Western.
44

Appendices
Appendix A: Graphical Figures
.002
.0015
.001
Den
sity
5.0e-04
0 8000 4000 6000
Direct Cost of Malaria (Birr) 2000 0
Figure A1a: Histogram with Normal Curve for Direct Cost of Malaria
45
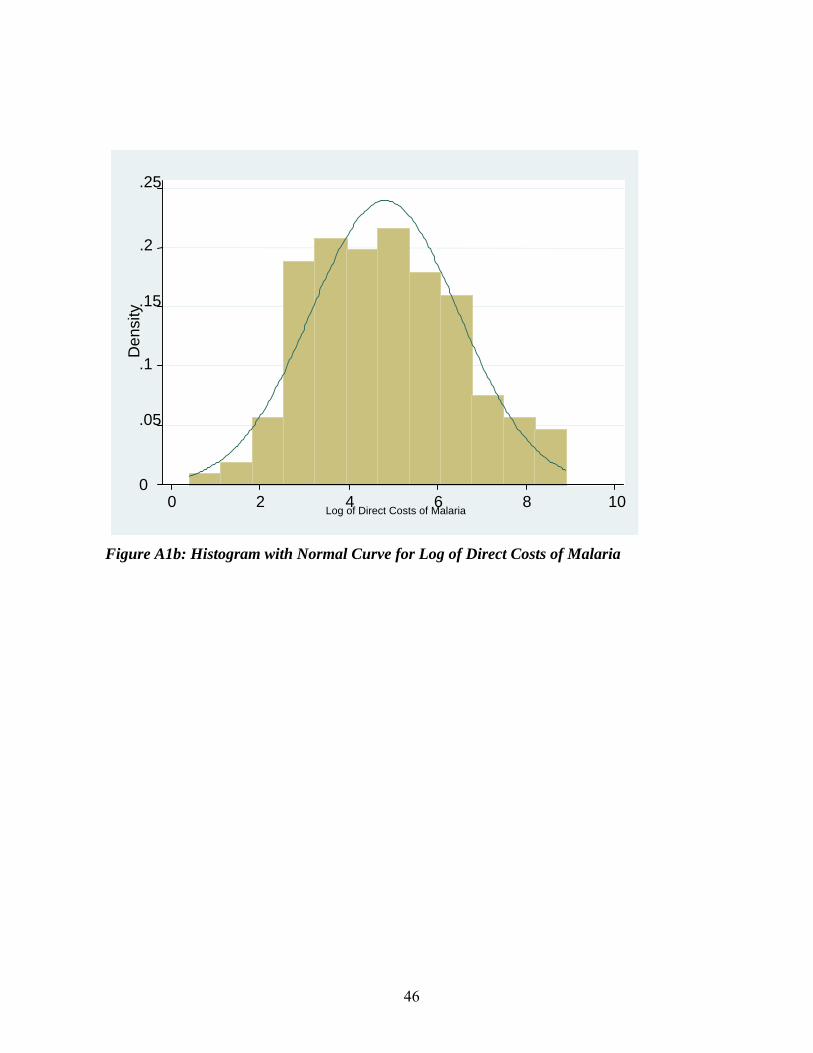
.25
.2
Figure A1b: Histogram with Normal Curve for Log of Direct Costs of Malaria
0
.05
.1
.15
Den
sity
0 2 4 6 8 10 Log of Direct Costs of Malaria
46

.08
.04
.06
Den
sity
.02
0 100 8040 60
Distance (walking minutes)20 0
Figure A2: Distribution of distances from homes to malaria breeding places
47

Appendix B: Photos
Figure B1: Households receiving free ITNs in Adi-Menabir, Tigray (photo taken on
21/06/2010)
48
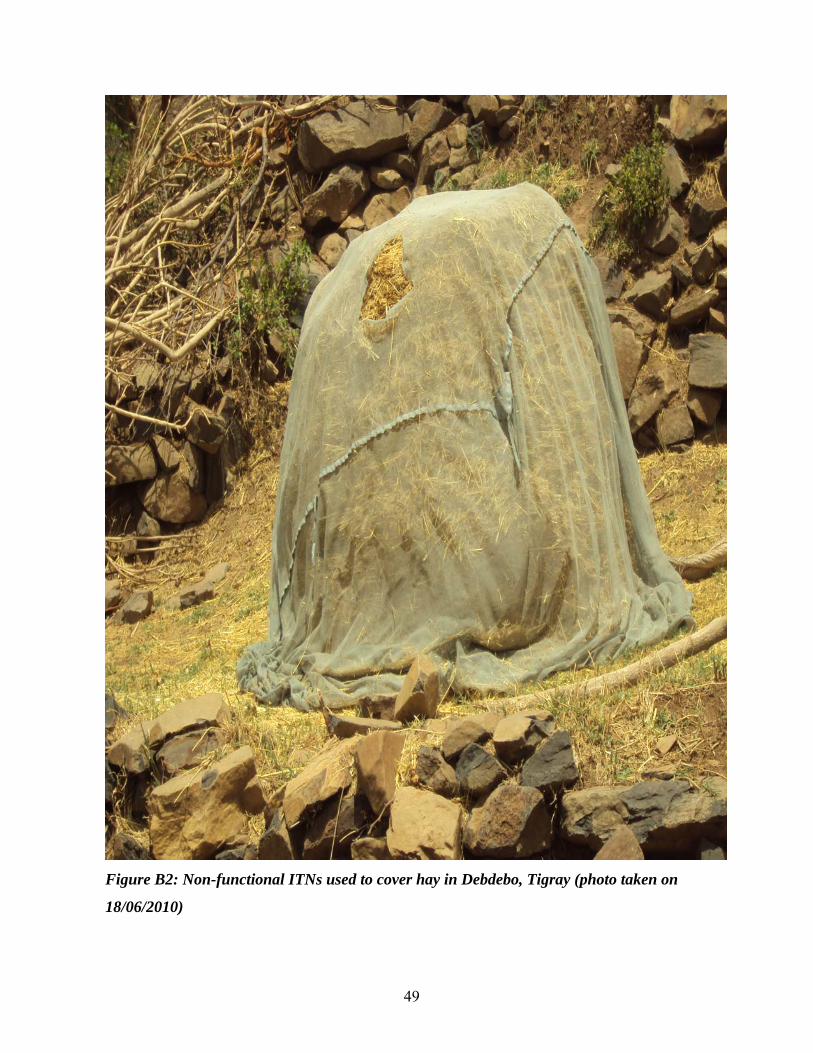
Figure B2: Non-functional ITNs used to cover hay in Debdebo, Tigray (photo taken on
18/06/2010)
49

50
Appendix C: Tables
Table C1: Role of ITN on direct costs of malaria at household level appearing in all three forms of estimations with ITN
interventions entering in three forms (Log of direct malaria cost at household level was the dependent variable)
Number of ITN ITN-household size ratio ITN-Household Ratio Dummy (1=0.5
and above, 0=otherwise)
Independent Variables
Pooled
(b/se)
Random
(b/se)
Fixed
(b/se)
Pooled
(b/se)
Random
(b/se)
Fixed
(b/se)
Pooled
(b/se)
Random
(b/se)
Fixed
(b/se)
0.006 0.006 0.036 0.006 0.007 0.034 0.007 0.007 0.027** Distance to health facility
(0.00) (0.00) (0.02) (0.00) (0.00) (0.02) (0.01) (0.00) (0.01)
0.055 0.055 0.070 0.070 -0.228 -0.228 Literacy
(0.43) (0.43) (0.44) (0.44) (0.47) (0.51)
-0.013 -0.013 0.038 -0.013 -0.013 0.055 0.000 0.000 0.039 Age of household head
(0.01) (0.01) (0.06) (0.01) (0.01) (0.05) (0.02) (0.01) (0.03)
0.281 0.281 5.120 0.309 0.309 0.470 0.429 0.429 1.415 Sex of household head
(0.39) (0.39) (3.08) (0.40) (0.53) (3.65) (0.42) (0.56) (1.75
-0.046 -0.046 -0.111 -0.049 -0.049* -0.064 -0.061* -0.061* -0.063 Distance to mosquito
breeding place (0.03) (0.03) (0.08) (0.03) (0.03) (0.06) (0.04) (0.02) (0.03)
-0.723** -0.723* -7.261* -0.739** -0.739* -7.955* -1.149** -1.172** -6.155** Iron roofed dwelling
house (0.35) (0.35) (2.92) (0.36) (0.40) (2.62) (0.48) (0.44) (1.40)
0.013 0.013 -1.584 -0.287 -0.287 -8.425* -2.278*** -2.278**** -4.161*** ITN interventions
(0.21) (0.21) (0.79) (0.71) (0.89) (3.35) (0.73) (0.55) (0.76)
5.207**** 5.207**** 2.505 5.289**** 5.289**** 5.599 5.069**** 5.069**** 3.526 Constant
(0.90) (0.90) (5.77) (0.88) (0.94) (5.65) (0.90) (0.92) (2.72)
Model Test (Prob>chi2) 0.035 0.171 0.122 0.028 0.144 0.074 0.000 0.000 0.007
Number of Obs. 76 76 76 76 76 76 76 76 76
R2 0.834 0.872 0.961
Hausman 0.0247 0.0063 0.0000
Breusch & Pagan 1.40 0.40 0.2628

51
Lagrangian multipliers
test
Note: Significance levels * 0.10; ** 0.05; *** 0.01; **** 0.001 b refers to parameter estimates; se represents standard errors corrected for clustering at household level
Table C2a: Model 1 under fixed effects estimation with ordinary and robust standard errors (Log of direct malaria cost at
household level was the dependent variable)
ITN-household size ratio ITN-Household Ratio Dummy (1=0.5 and
above, 0=otherwise)
Independent Variables
b/ordinary se b/robust se b/ordinary se b/robust se Distance to health facility 0.034(0.02) 0.034(0.02) 0.026(0.01)** 0.026**
Age of household head 0.055(0.05) 0.055(0.09) 0.039(0.03) 0.039
Sex of household head 0.47(3.65) 0.47(3.32) 1.415(1.75) 1.415
Distance to mosquito breeding place -0.064(0.06) -0.064(0.16) -0.063(0.03) -0.063(0.1)
Iron roofed dwelling house -7.955(2.62)** -7.955(2.84)** -6.151(1.4)** -6.151(0.79)***
ITN interventions -8.425(3.35)* -8.425(5.61) -4.161(0.76)*** -4.161(1.9)*
Constant 5.599(5.65) 5.599(6.82) 3.526(2.72) 3.526(3.26)
Model Test (Prob>chi2) 0.074 0.06 0.007 0
Number of Obs. 76 76 76 76
R2 0.872 0.872 0.961 0.961
Note: Significance levels * 0.10; ** 0.05; *** 0.01; **** 0.001 b refers to parameter estimates; se represents standard errors corrected for clustering at household level

52
Table C2b: Model 1 under random effects estimation with ordinary and robust standard errors (Log of direct malaria cost
at household level was the dependent variable)
ITN-household size ratio ITN-Household Ratio Dummy (1=0.5 and
above, 0=otherwise)
Independent Variables
b/ordinary se b/robust se b/ordinary se b/robust se Distance to health facility 0.006(0.004) 0.006(0.004) 0.007(0.004) 0.007(0.004)
Literate household heads 0.07(0.44) 0.07(0.44) -0.228(0.51) -0.228(0.5)
Age of household head -0.013(0.01) -0.013(0.01) 0(0.01) 0(0.01)
Sex of household head 0.309(0.53) 0.309(0.4) 0.429(0.56) 0.429(0.45)
Distance to mosquito breeding place -0.049(0.03)* -0.049(0.03)* -0.061(0.02)** -0.061(0.03)**
Iron roofed dwelling house -0.739(0.4)* -0.739(0.37)** -1.149(0.44)*** -1.149(0.44)***
ITN interventions -0.287(0.89) -0.287(0.67) -2.278(0.55)**** -2.278(0.61)****
Constant 5.289(0.94)**** 5.289(0.88)**** 5.069(0.92)**** 5.069(0.84)****
Model Test (Prob>chi2) 0.144 0.016 0.000 0.000
Number of Obs. 76 76 76 76
Note: Significance levels * 0.10; ** 0.05; *** 0.01; **** 0.001 b refers to parameter estimates; se represents standard errors corrected for clustering at household level

53
Table C3: Test for Multicollinearity for model 2 under OLS estimation
Variable VIF 1/VIF
Own labour supply 1.85 0.540169
Hired labour 1.73 0.579378
Literacy 1.45 0.690767
Male headed household 1.4 0.713263
Own oxen 1.34 0.747218
Distance produce market 1.29 0.77389
Land market participation 1.24 0.808657
Labour days lost 1.22 0.818831
Fertilizer (kg) 1.21 0.8275
Distance produce market 1.17 0.853107
Credit participation 1.15 0.872439
Own irrigation plot 1.14 0.879438
Mean VIF 1.35
Note: the results show no multicollinearity in the model as all VIF values are less than 10 (Gujarati 1995Gujarati 1995)

Appendix D: Calculations
D1. Effects of doubling current ITN coverage on direct costs of malaria
a)erageITNunitbyratereductionCosterageITNDoubled
malariaoftsdirectMeanerageITNUnithouseholdperinccurtotsdirectofAmount
cov*cov
cos*covcos
b) 23.1.4.9*64.0
39.78*10.0cos ETB
ETBhouseholdperinccurtotsdirectofAmount
c) 16.7723.139.78cos ETBETBETBhouseholdpersavedtsdirectofAmount
d) %4.98)100(39.78
23.1cos
ETB
ETBsavedtsdirectPercentage
D2.1 Current hidden costs of malaria
a) *cos malariatoduelosshouseholdsdayslabournumberMeanlandoftsimdipertshiddenMean
typroductiviofvalueonlossdaylabouroneofeffectinalM arg
b) 97.52045.43*99.11cos ETBETBlandoftsimdipertshiddenMean
c) )100(cos
coslandoftsimdiperyieldcropofvalueMean
landoftsimdipertshiddenMeanmalariaoftshiddenPercentage
d) %25.11)100(75.46330
97.520cos
ETB
ETBmalariaoftshiddenPercentage
D2.2 Effects of doubling current ITN coverage on hidden costs of malaria
a)ratiosizehouseholdITNUnit
ratiosizehouseholdITNUnitofEffectinalMerageITNDoubledhouseholdpersaveddayslabourofNumber
)(arg*cov
b) 264.111.0
76.1*64.0householdpersaveddayslabourofNumber
54
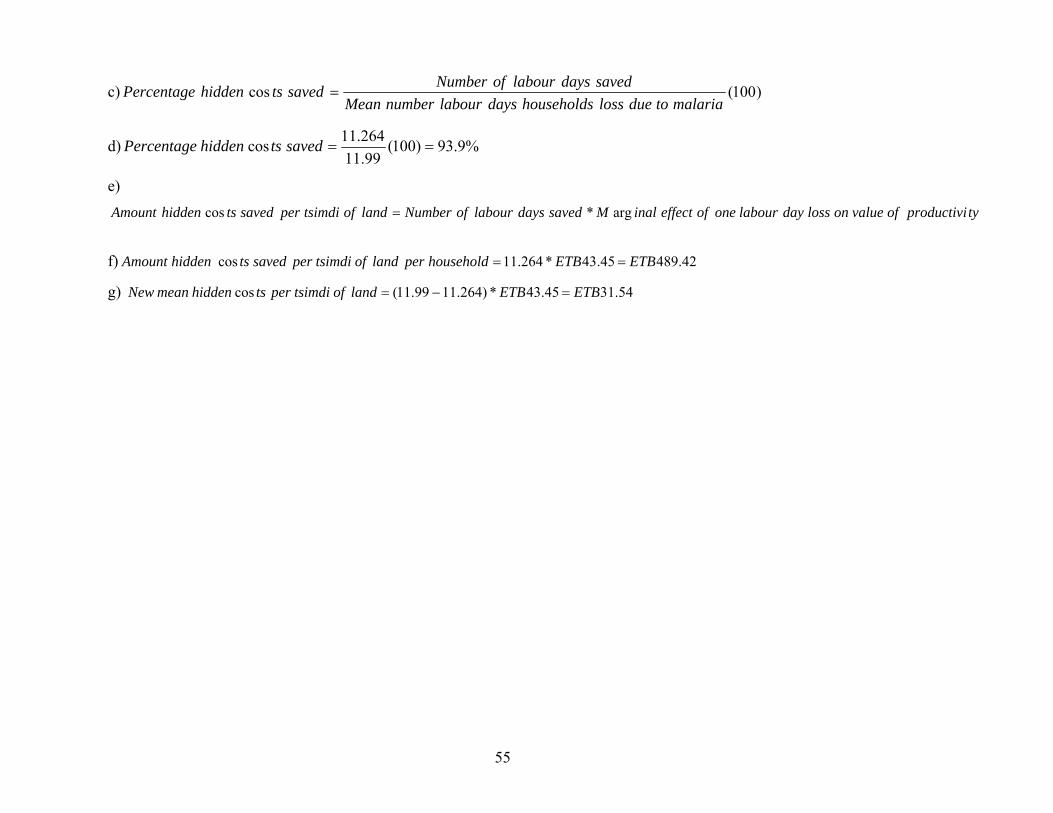
e)
typroductiviofvalueonlossdaylabouroneofeffectinalMsaveddayslabourofNumberlandoftsimdipersavedtshiddenAmount arg*cos
c) )100(cosmalariatoduelosshouseholdsdayslabournumberMean
saveddayslabourofNumbersavedtshiddenPercentage
f) 42.48945.43*264.11cos ETBETBhouseholdperlandoftsimdipersavedtshiddenAmount
g) 54.3145.43*)264.1199.11(cos ETBETBlandoftsimdipertshiddenmeanNew
55
d) %9.93)100(99.11
264.11cos savedtshiddenPercentage

56
Appendix E: Study Questionnaire
E1: Malaria Questionnaire Name of Enumerator: ____________________________________________
Name of Household Head: _______________________ Sex: _____________
Name of person interviewed: ______________________Sex: _____________
Date: __________________________________________________________
Household Location Zone: _________________________________________________________
Woreda: _______________________________________________________
Tabia: _________________________________________________________
Kushet: ________________________________________________________
Household No: __________________________________________________
GPS Coordinates: ________________________________________________

Part II: Malaria situation of the area
104. From which source was the information? (Tick all which apply)
105. What messages(s) did you see or hear? Circle all which apply
Source Yes No Message Yes No
A Radio 1 B A Prevention 1 2
B News paper/Magazine
1 C B Treatment 1 2
C Posters/Notices 1 D C Transmission 1 2
D Friends 1 E D ITN 1 2 E Parents 1 F E Others 1 2
F Health Worker 1 2
G Govt Official 1 2
H Church/Mosque 1 2
101. Have you ever heard of disease called malaria (Agoba)? 1.Yes 2.No → Section 2
102. What is the main cause of malaria that you know? DO NOT PROMPT (Only one answer) 1. Working in the sun 2. From being in the rain 3. From getting cold 4. From drinking dirty water 5. From another person 6. From mosquito bites 7. Other (Specify) 99. DK
103. Have you ever seen or heard malaria educational messages from any source? 1. Yes 2. No →Q.106
I School 1 2
106. Do you think malaria can kill a person? 1. Yes 2. No
107. Are you aware of any way(s) to prevent malaria? 1. Yes 2. No →Q.109
108. What is the best way to prevent yourself/family from malaria (Agoba)? 1. Sleeping under bed nets 2. Avoid being bitten by mosquitoes 3. Prophylaxis 4. Use of coils 5. Avoiding cold 6. Avoid being too long On the sun 7. Drinking clean water 8. Keep household surrounding clean 9. Closing windows at night 10. Others 11. Nothing → 109 99. DK
57

58
Section 1: Household Malaria situation
Household Member (Name) From Head to youngest person
109. Has ……ever been attacked by malaria? 1. Yes 2. No →Go to Next person
110. When was the last malarial attack? 1. 1 week ago 2. 1 Month ago 3. 2 months ago 4. 1 year ago 5. Others 99. DK
111. Where did s/he get treatment? 1. Pharmacy 2. Drug shop 3. General merchandise 4. Tradition healer 5. Public hospital/PHC 6. Private Hospital/clinic 7. Community trained attendant 8. Did not treat
(remove s/he from
Q.113; then next person)
112. Time taken to walk to the source of treatment s/he attended (minutes)
113. What treatment (s) did s/he receive? (check medical form) Circle all which apply 1. Traditional medicine 2. Nivaquine 3. Chloroquine 4. Fansidar 5. Quinine 6. Mephaquine 7. Coartem 8. Aspirin 9. Other (specify) 99. DK
114. Total amount spent for treating the last malarial episode in Birrs (Transport, medical fees, drugs and unplanned dietary change)
115. Frequency of malaria attack within the last 12 months (No of attacks)
116 No. of days didn’t work because suffered from malaria or nursed malaria patient
117 No. of hour the house hold member work in a day
118 Amount House hold member earn when work on labour market for a day (Birr)
119. Frequency of malaria attack within the last 3 months (No of attacks)
1 1 2 1 2 3 4 5 99 1 2 3 4 5 6 7 8 1 2 3 4 5 6 7 8 9 99
2 1 2 1 2 3 4 5 99 1 2 3 4 5 6 7 8 1 2 3 4 5 6 7 8 9 99
3 1 2 1 2 3 4 5 99 1 2 3 4 5 6 7 8 1 2 3 4 5 6 7 8 9 99
4 1 2 1 2 3 4 5 99 1 2 3 4 5 6 7 8 1 2 3 4 5 6 7 8 9 99
5 1 2 1 2 3 4 5 99 1 2 3 4 5 6 7 8 1 2 3 4 5 6 7 8 9 99
6 1 2 1 2 3 4 5 99 1 2 3 4 5 6 7 8 1 2 3 4 5 6 7 8 9 99
7 1 2 1 2 3 4 5 99 1 2 3 4 5 6 7 8 1 2 3 4 5 6 7 8 9 99
8 1 2 1 2 3 4 5 99 1 2 3 4 5 6 7 8 1 2 3 4 5 6 7 8 9 99

Section 2: Mosquitoes
203. Methods used to prevent mosquitoes by your household? (Tick which apply)
204. For the method with direct costs mentioned in Q.207, how many times do you have to use per month (except for bed net)
205. Cost per unit of the method used in the past 12 months
Yes No Method # use per month Method Cost (Birr) A Bed nets 1 2 B B B Insecticide sprays 1 2 F F
C Clearing areas around 1 2 G G
D Closing windows/doors at night 1 2 H H E Lighting fire in the house 1 2 I I F Using coils 1 2 G Apply mosquito repellents on skin 1 2 H Use traditional plants 1 2 I Use cow dung 1 2
201. Are you currently using any method (whether commercial or traditional) to protect your household from mosquitoes? 1. Yes→Q.203 2. No
202. Why don’t you protect your household from mosquitoes? 1. I don’t have money 2. I don’t have time 3. Protective
materials are not available here
4. I can’t be bothered
5. Gov’t’s duty 6. Others (specify) 99. DK
207. Where is the main mosquito breeding place in this area? (Don’t read out options-just tick appropriately) Yes No
208. How far is it from your homestead (one way walk in minutes)?
A Swamp 1 2 B Rice field 1 2 C Forest 1 2 D Ponds 1 2 E Micro-dam 1 2 F Others (Specify) 1 2
206. Think about the methods to protect against mosquitoes Q.207 above. Which one is most suitable for your household? 1. Bed nets 2. Insecticide sprays 3. Cleaning areas around 4. Closing windows/doors at night 5. Lighting fire in the house 6. Using coils 7. Mosquito repellents 8. Traditional plants 9. Use cow dung 10. Other traditional Methods (specify) 11. Other commercial methods (specify) 99. DK
59

60
Section 3: Bed nets: Section A. Ask Q.302 –HCB6 only to Households who currently use bed nets
302. When and where was the source?
305. If Q.304 and Q.305 are unequal in number, Why don’t you have nets on all the beds? Circle all possible answers Yes No
A Gov’t didn’t supply adequately 1 2 B No where to buy additional nets 1 2
C Bed nets are too expensive 1 2
D Not interested in putting them on every bed
1 2
E Only children need nets 1 2
F Only adults need nets 1 2
G Some beds are not occupied 1 2
301. Does your household have any bed net? 1. Yes 2. No →Section B
A. When Month year 1. Jan ….……. 2. Feb…....….. 3. Mar ………. 4. Apr............. 5. May ……… 6. Jun ……… 7. Jul……….. 8. Aug……… 9. Sep………. 10. Oct……… 11. Nov…….. 12. Dec……..
B. Source (s) of bed nets Gov’t 1 NGO 2 Bought 3 Friend 4 Other 5 C. Cost per net from sources above Gov’t ………….. NGO…………... Bought………… Friend……………. Others…………….
303. How many bed nets are there in total? ……………….
304. How many sleeping beds / mats do you have? ………………
H I don’t know how to fit the net on all beds
1 2
306. Whose beds are fitted with bed nets? 1. Household head 2. Spouse 3. Bed shared
with spouse
4. Children 5. Visitors 6. Others
307. Did you personally use a net last night? 1. Yes →Q.309 2. No
310. Why didn’t you use a net? 1. They are few 2. It is too hot 3. Mosquitoes still bite through the net 4. It takes time to tuck the net @ night 5. Difficult to tuck in 6. Suffocates me 7. Other (specify)
311. What is the main reason to use a bed net in your household? One answer only To Prevent: 1. Mosquito bites 2. Malaria 3. Mosquito annoyance 4. Other (specify) 99. DK
311. How did you obtain your bed net(s)? Multiple answers possible 1. Was/were given free 2. Bought it/them 3. Can not remember 4. Other (specify)
312. If bought, where did you obtain/buy net? 1. A shop 2. A pharmacy 3. A drug shop 4. A health centre
313. How many times do you wash your bed nets? …….x a week …….x in 2 week …….x a month …….x in 2 months …….x in 3 months …….x in 6 months …….x in a year

61
Household current bed net use distribution
HCB3 How many times had s/he suffered malaria?
Household member (old to young)
HCB1 Does …… uses bed net 1=Yes 2=NOHCB4
HCB2 Since when did s/he start using bed net? M =Month Y=Year HCB3A
12 months before starting to use a bed net HCB5
HCB3B 12 months after using net (if less than 12 months in use, specify the time period) HCB5
HCB4 For non bed net users, how many times does s/he suffer malaria attack in a year on average?
HCB5 Has there been any change in frequency of malaria attack since he started using bed net? 1=Yes 2=No (Stop) 3=DK (stop)
HCB6 How do you see the frequency of her/his malarial attacks since started using the net? 1=reduces 2=increases 3=No change
1 1 2 M Y 1 2 3 1 2 3 2 1 2 M Y 1 2 3 1 2 3 3 1 2 M Y 1 2 3 1 2 3 4 1 2 M Y 1 2 3 1 2 3 5 1 2 M Y 1 2 3 1 2 3 6 1 2 M Y 1 2 3 1 2 3 7 1 2 M Y 1 2 3 1 2 3 8 1 2 M Y 1 2 3 1 2 3 9 1 2 M Y 1 2 3 1 2 3 10 1 2 M Y 1 2 3 1 2 3 Section B. Ask Q.314 – 318 only to respondents who currently not using bed nets in their households
315.Why are you not using bed nets nowadays?
316. Why have you never used a bed net?
A I’m not bothered by mosquitoes
Yes No
A I’m not bothered by mosquitoes
Yes No
B Feel uncomfortable under a net
1 2 B Feel uncomfortable under a net
1 2
C Too expensive 1 2 C Too expensive 1 2 D Nets are hot 1 2 D Nets are hot 1 2 E I don’t know where to buy
from 1 2 E I don’t know where to
buy from 1 2
F Malaria not serious nowadays-
1 2 F Not aware of Bed net Q. 409
1 2
G Does not protect against malaria
1 2 G Malaria is a recent disease hear
1 2
H Malaria is a recent disease here
1 2
314. Have you ever personally used a bed net? 1. Yes 2.No→Q.317
317. From your own opinion, how much do you think a net should cost (Birrs)? ……………Birr 99. DK
318. What do you think are the problems associated with sleeping under a bed net? 1. Too hot to sleep under 2. Mosquitoes still bite through 3. Disorganises you from getting up at night 4. Deprives you from air 5. I fear getting poisoned 6. Other (specify) 99.DK
62
Section 4: Insecticide Treated Bed nets (ITN)...............FOR HUSBANDS (male respondents) 401 Have you ever heard of ITN? 1. Yes 2. No →Q.408
402. From where was the information? 1. Friend/family 2. Health professional 3. Posters 4. Radio 5. Newspaper 6. Can’t remember 7. Other (specify) IF DON’T HAVE BED NETS GO TO 409
403. Have you ever treated your bed net insecticide? 1. Yes 2. No →Q.408
404. What were the reasons for treating bed nets? 1. To kill mosquitoes 2. To make the net stronger 3. To repel mosquitoes 4. Prevent malaria 5. Others (specify) 99.DK
404 How many times have you treated your net for the past 12 months? ……………………...
405. After how long should the bed nets be retreated? Every------times a month Every--------times a Year 99. DK
406 How much did it cost for each treatment …………Birr
407 Total cost of treatment for all the number of treatments made…………… …………….Birr
408. Where do you get ITN from this area? 1. Shop 2. Pharmacy 3. Health centre/clinic 4. Market 5. Other (specify) 99. DK
409: EXPLAIN THESE STATEMENTS FIRST TO A RESPONDENT INORDER TO ANSWER QUESTIONS BELOW (Q.409-Q.413); SHOW THE PICTURE OF A BEDNET ALSO TO THE RESPONDENT (SEE NEXT PAGE). I am now going to explain to you what an Insecticide Treated Bed net (ITN) is. This explanation will help you to answer the following questions that I am going to ask you. A treated bed net is almost like any other ordinary bed net. The only difference is that it is treated with insecticides. These insecticides are safe to human being, but effectively kill and repel the mosquitoes. This will protect the person sleeping under the bed net against malaria and other insects like bedbugs and cockroaches. The treatment is done by dipping a clean net into a recommended dosage of chemical insecticide solution until it is completely wet. The wet net is then dried on a clean surface. Re-treatment can be done twice or more times a year depending on how frequently the net is washed. Think about the costs of malaria burden to your household (in terms of costs of treatment, lost time, pains (sufferings) and any other costs due to sickness); number of bed nets available to your household; and your household expenditure to be met in the near future, 409A. Are you willing to offer any cash to have this additional bed net if somebody is to supply?
1. Yes→Q.411 2. No 99. DK 409B. What if I ask you to purchase a lottery ticket that costs 1 Birr to win this bed net for your household; given that this organisation will supply 50 bed nets for your village (Kushet)?
1. Yes→Q.412 2. No 99. DK 409C. What if I ask you to sacrifice some of your labour time to work for this bed net?

63
1. Yes→Q.413 2. No 99. DK 410. A. If no or DK in Q.409A, Why are you not willing to offer any cash to have this bed net? All which apply 1. No money at the moment 2. I don’t like using nets 3. Its government role 4.My household has enough bed nets 5. Malaria is not a serious problem here 6.Not aware of this method 7.I don’t believe this method is effective 8. Others (specify) 410. B. If no or DK in Q.409B, why are you not willing to purchase this lottery ticket to win this bed net? All which apply 1. I have no money at the moment 2. I don’t like using nets 3. Its government role 4.My household has enough bed nets 5. My religion does not allow gambling 6. Malaria not a serious problem here 7.Not aware of this method 8. I don’t believe this method is effective 9. Others (specify) 410. C. If no or DK in Q.409C, Why are you not willing to offer your labour to have this bed net? All which apply 1. I have no time 2. I don’t like using nets 3. Its government role. 4. My household has enough bed nets 5. Malaria is not a serious problem here. 6. Not aware of this method. 7. .I don’t believe this method is effective. 8. Others (specify) 411. We would like to determine the maximum amount that you are willing to pay per additional bed net for your household? 411A. If yes in Q.409A, Are you willing to pay 15 Birr for a bed net? 1 = Yes 0 = No→Q.410C 411B. What if the price is 30 Birr would you be willing to pay? (ALL GO TO Q.411D) 1 = Yes 0 = No 411C. What if the price is 7.5 Birr, would you be willing to pay? (ALL GO TO Q.411D) 1=Yes 0=No 411D. What then, is the maximum amount you are willing to pay for a bed net? ------------------------------------------------------- Birr 412. If yes in 409B, what then, is the maximum number of tickets you are willing to buy in order to increase your chances of winning this bed net (Given that one ticket = 1 Birr)?--------------------------------------------------------------------------------------------------tickets 413A. If yes in Q409C, what maximum amount of time can you offer per day to work for a bed net?---------------------------------------hours 413B. How many days can you offer then for a bed net?------------------------------------------------------------------------------------days

64
E2: Household Questionnaire
MASTERS PROGRAM: 2010 NOMA FELLOWS
NORWEGIAN UNIVERSITY OF LIFE SCIENCES
IN COLLABORATION WITH MEKELLE UNIVERSITY
HOUSEHOLD QUESTIONNAIRE The information collected will be used for research purposes. It will be treated as confidential and will not be used by tax authorities or others to assess the need for food aid or other assistance. Zone Woreda
Tabia Kushet Household ID Name of household head Distance to woreda town (walking minutes) Distance to local market (walking minutes) Distance to primary school (walking minutes) Distance to secondary school (walking minutes) Distance to all weather road (walking minutes) Distance to transporatation service (walking minutes) Distance to health center (walking minutes) Distance to grain mill Distance to nursery site Distance to protected water source(walking minutes) Distance to tap water(walking minutes)
Enumerators: Dates interviewed First interview: Second interview:
Third interview:

Farm household survey: Household characteristics Woreda: Interviewer: Household number: Tabia Date of interview: Kushet Household head
name:
Household composition in 2002 (E.C.)
Household members Religion: MNo: Name relationship Sex Age Education Skills Occupation Presence
1 Head
Codes: Relation to household head: 1=wife, 2=child, 3=grand child, 4=brother, 5=sister, 6=hired labour, 7=other, specify
Sex: 1=female, 2=male. Age: Years. Skills: specify
Education: 0=illeterate, 1=read and write, 2= elementary, 3= church education, 4= secondary, 5=others. Occupation: 0=dependent, 1= student (in school), 2=watch after animals, 3=housewife, 4= farming 5=hired labourer, 6=off-farm activity, 7=Tabia/kushet official: specify, 8=other: specify.
PA/village official:specify
Presence: Months staying in the household during last 12 months
Do any of the household members live outside the village this year (EC 1995)? Yes No
Name Place Purpose Since when Coming back when
65

66
HOUSEHOLD NAME:________________________________ HH id:_______________
Farm household survey: Household Expenditures Expenditure on farm inputs EC 1994-95 Item Quantity Own
prod. Purchased Price Unit Tot.
Expend. Where bought
source of cash
Seed, teff Seed, wheat Seed,maize Seed, barley Seed, sorghum Seed, chickpea Seed, Millet Seed, Fava bean Seed, pea Seed, Latyrus Seed, others Seed, vegetables Seed, Pepper Other tree seedling. Fertilizer: Urea Fertilizer: DAP Herbicide Pesticide Tools/equipment Manure Hired oxen Animal salt Animal medicine Animals bought

67
Animal feed: Grass crop residue (hay stover, etc.)
Unit: 1) kg; 2) Shember; 3)Minilik; 4) mishe; 5)others. Specify Where bought: 1: from neighbour, 2: within kushet, 3: local market, 4: woreda market, 5: trader visiting village
Source of cash: 1: ownsavings, 2:formal credit, 3:informal credit,4:sale of own production, 5:sale of assets,6: other specify. Have you obtained credit to pay for farm inputs or for farm investments? 1) YES, 0) NO. A69 If yes, give details for the 3 last years:
Source Year Purpose Amount Repayment conditions
Frequency Duration Interest completedHave you over the last 3 years received credit for Nonagricultural investments
If you want, are you able to obtain credit for
Yes/No Source
Max amount
Interest rate
Duration Comment
a. Investment in farm inputs in oxen purchase in other business b. Consumption c. Family events Yes=1 No=0 If you have already received credit for some purpose, are you able to obtain more loans before paying back what you have already obtained? Yes\no
Are you member of a credit association? If yes, do you prefer to get credit on individual basis? Has any member in your credit group defaulted? If yes, what were the consequences?

68
Does any one in the HH save/put money in any of the following? DECSI Equb Edir Nearby Bank At home Others,specify
HOUSEHOLD NAME:________________________________
HH id:_______________
Farm household survey: Household Consumption Expenditures (last year)
Commodity Quantity Quantity Where Per Price Unit Own
Prod Free food
FFW Bought bought Birr Own prod. Cons. Value
Cash Consump. Expenditure
Total Value of Consumption
Teff Wheat Barley Maize Sorghum Millet Faba Bean Latyrus Chick Pea Pea Linseed Lentile other, specify Fruites Banana Mango Papaya

69
Avocado Guava Vegetables Pepper Cabbage Onion Potato Tomato Other vegetables
Garlic Coffee Spices Quantity: Number of units. Per: 1:week, 2:month, 3:season,4: year. Unit: 1:Kg, 2:pieces, 3:sheets,4:litre, 5:bags, 6:bundles 7:others, specify etc. Total expenditure: Includes value of own production. Cash expenditure: On purchased quantity Own production: Market value (Birr) of own production. Where bought: 1: from neighbour, 2: within Tabia 3: local market, 4: distant market, 5: trader visiting village
Farm household survey: Household Consumption Expenditures (continued) Commodity
Quantity Own Prod
Free food
FFW
QuantityBought
Where bought
Per
PriceBirr
Unit
Own prod. Cons. Value
Cash Consump. Expenditure
Total Value of Consumption
Beef Sheep Goat Chicken Eggs Milk Butter Sugar Cooking oil Salt

70
Tea Clothing Shoes Blanket/bedsheet Umbrella Soap/Wash.p. Fuelwood Kerosene Batteries Mobile phone Radio Corrugated iron Furniture Travel/Transport School fees School books etc. Health/Medicine Income tax Land tax Religious contribution
Ceremonies Jewelry House rent House construction Cigarettes/Tobacco Electricity Wood materials Leisure (drinks, candies, lotteries etc.)
Quantity: Number of units. Per: 1:week, 2:month, 3: season ,4: year.
Unit: 1:Kg, 2:pieces, 3:sheets,4:litre, 5:bags, 6:bundles 7:others, specify etc.

71
Total expenditure: Includes value of own production. Cash expenditure: On purchased quantity Own production: Market value (Birr) of own production. Where bought: 1: from neighbour, 2: within Tabia 3: local market, 4: distant market, 5: trader visiting village
HOUSEHOLD NAME:________________________________
HH id:_______________
Farm household survey: Crop Selling Activities Crop Kushet Local market Woreda market: Qty Price/
unit Month sold
Income Qty Price/ unit
Where? Month sold
Income Qty Price/ unit
Where? Month sold
Income
Teff Wheat Barley Maize Sorghum Millet Oats Faba Bean Latyrus Chick pea Lentile Linseed Pea Pepper Potato Tomato Banana Mango Papaya Avocado Guava Pepper Cabbage Onion

72
Carrot Tomato Garlic Coffee Eucalyptus Means of transport to the different markets:
Local market: Distant market:
Frequency of visit to the different markets:
(Per month) Local market: Distant market:
HOUSEHOLD NAME:________________________________
HH id:______________
Farm household survey: Livestock Production Activities
Animal type Stock Stock Stock Born during
Died during
Slaughtered Bought Sold during
Months in Milk per
2 years ago
1 year ago
Current EC 2001/02
EC 2001/02
EC 2001/02
EC 2001/02
EC 2001/02
milking (2001/02)
day (EC2001/02)
Cattle Milking cow Other cows Oxen Heifer Bulls Calves Sheep Goats Horses Mules Donkeys Camel Chicken Bee hives Source of cash to buy the livestock

73
Farm household survey: Livestock Selling Activities EC 2001-02
Animal/ Village Market Local Market Distant market Product Qty Price/
unit When sold
Income Qty Price/ unit
Where When sold
Income Qty Price/ unit
Where When sold
Income
Cattle Milking cow
Other cows Oxen Heifer Bulls Calves Sheep Goats Horses Mules Donkeys Chicken Butter Milk Meat Eggs Skins Animal dung
Honey/Wax Reasons for selling livestock last year? 1 To cover food expense 4 To cover land tax 2 To cover clothing and schooling expenses 5 Others. Specify 3 For wedding and other social expenses

74
Farm household survey: Livestock Selling Activities EC 2001-02 Animal/ Village Local Market Distant market Product Qty Price/
unit When sold
Income Qty Price/unit
Where When sold
Income Qty Price/ unit
Where When sold
Income
Cattle Milking cow
Other cows Oxen Heifer Bulls Calves Sheep Goats Horses Mules Donkeys Chicken Butter Milk Meat Eggs Skins Animal dung
Honey/Wax Reasons for selling livestock last year? 1 To cover food expense 2 To cover clothing and schooling expenses 3 For wedding and other social expenses 4 To cover land tax 5 Others. Specify

75
Farm household survey: Other Sources of Income 2001 -02 E.C) Source Input
quantity Input costs
Who earned
Where/to whom
When/Period Quantity Price/Wage Income Years of Experience
Hiring out oxen Hire out labour Labour exchange Assistance received
Assistance given Rent out land Employment Cash support Migrant income Remittance Income
Assistance from relatives
Government Transfers
Gifts Sale of firewood Sale of Handicraft Sale of beverages Petty trade Grain mill Other business/services

76
Outoput Quantity (food in kg or days of work) per year
price/wage (price of wheat per kg or daily payment rate of CFW
Total income
Source Number of months/yr worked
how many person in the hh
Who earned (hh member id)
Input quantity (toal labor mandays)
unit quantity unit price Food for Work Food Aid Cash for Work OFSP(Other Food Security Program)
Employment: permanent job locally, Hire out labour: temporary job locally, Migrant income: temporary job outside community member by household Remittance income: Money sent by relatives permanently living elsewhere What durable commodities and implements does the household have? Household Assets Number
now Year bought
Number bought
Price Current value
Latest last year
Need replacement (# of years)
Implements Owned 1998 EC
Source of cash
Farm inplements Plough Donkeycart/ horsecart
Plough parts Hoe Sickle Hammer Ax Spade Wheelbarrow

77
Other production assets:
Irrigation equipment
Irrigation well Irrigation pump Pond Assets Furniture Radio/cassetplayer Wrestwatch Bicycle Stove House with iron roof
Hut Kitchen house toilet* Jewelry Mobile phone Source of cash: 1:Sale of output, 2:Remittances, 3:Credit, 4:Sale of food from FFW, 5:Sale of livestock, 6:Savings, 7:Others, specify *Whether the household has toilet or not should be verified by the interviwer

78
HOUSEHOLD NAME:________________________________ HH id:_____ Farm household survey: Food security and Coping strategies What were your priority in responses (coping strategies) when you faced drought? Activity Response to income
fluctuations (Rank=Priority 1) Sell animals
Sell trees
Obtain food through Food-for-Work
Obtain cash through Cash-for-Work
Withdraw children from school
Search for employment elsewhere in Ethiopia
Rely on existing off-farm income sources
Borrow money from relatives
Borrow money from other sources
Use cash/bank savings
Assistance from relatives
Reduce expenditure on clothing
Reduce expenditure on:
Other, specify:
Is there any changes in your strategy to cope with food insecurity as compared to 8-10 years ago?
If yes, explain why/how:
How strong is your social network (extended family) in terms of providing help in case you face serious problems (e.g. drought, sickness, income failure)? Explain:
79
E3: Plot Level Questionnaire Household Name: Interviewer: GPS Coordinates for home of
household: Altitude (masl)
Household Id. No.: Date of Interview: 1. Kushet: Tabia: 2.
Does the household have a land certificate? 1=Yes 0= No If yes, Year (EC) of receiving the certificate:_________ Land certificate information (copy information from land certificate), If no, why no certificate? 1=Did not collect it, 2=No land at that time, 3=Too small land, 4=Land was not registered, 5=Tabia did not give me, 6=Lost it, 7=Other, specify Registration number on certificate:___________ Full name (owner):______________________________Sex of owner: ______________ Is owner current head of household? Yes No If no, relationship between listed owner and hhhead: HHhead is………………… Family size when land was allocated:____________ The time when the last land allocation was made: ___________________ The number of plots allocated: ___________ Plot No.
The name of the place where the plot is located
Distance (minutes)
Soil depth of the plot (Deep=1, medium=2, or shallow=3)
Plot size in Tsimdi
Measuredplot size in Tsimdi
The plot is Adjacent to…..
GPS Coordi-nates
Alti-tude (Eleva-tion)
Origin of plots
Who decide on plots
Who work on plots
E: _______N: _____ W: _______S: ______
E: ________N: _____ W: _______S: ______
E: ________N: ____ W: _______S: _____
Origin of plots: 1. Husband/Husband’s family, 2. Wife’s family, 3. Government, 4. Tabia, 5. Others, specify…. Who decide on plots (make production and investment decisions): 1.Husband/male head, 2.Wife, 3.Joint husband/wife, 4.Female head, 5.Son, 6.Other, specify: Who work on plots: 1.Husband/male head, 2. Whole family, 3.Joint husband/wife, 4.Female head, 5.Wife, 6.Son, 7. Others, specify:

80
Does the household have plots that are not listed on the certificate? Yes = 1 No = 0 If yes, list the plots Plot No.
The name of the place where the plot is located
Distance (minutes)
Soil depth of the plot (Deep=1, medium=2, or shallow=3)
Plot size in Tsimdi
Measuredplot size in Tsimdi
GPS Coordi-nates
Alti-tude (Eleva-tion)
Origin of plots
Who decide on plots
Who work on plots
Origin of plots: 1. Husband/Husband’s family, 2. Wife’s family, 3. Government., 4. Tabia, 5. Other, specify…. Who decide on plots (make production and investment decisions): 1.Husband/male head, 2.Wife, 3.Joint husband/wife, 4.Female head, 5.Son, 6.Other, specify: Who work on plots: 1.Husband/male head, 2. Whole family, 3.Joint husband/wife, 4.Female head, 5.Wife, 6.Son, 7. Other, specify: Cross/check information with plot level data from our earlier survey rounds: NB! Fill plot number continuing from plot numbers on previous page and use carefully the same plot numbers and order of plots in the following pages.

Household Name: Household Id. No.: Interviewer:
Land rental and partners in rental market Have you rented in or out land during the last year? Yes=1 No=0 If no, skip this page. NB! Keep plot number the same as in land certificate and the following list of plots
Rented-in plot Rented-out plot If the plot is transacted, details about rental partners
Plot No. Plot Name
Tenure status
2000 1=yes 0=no
2001 1=yes 0=no
2000 1=yes 0=no
2001 1=yes 0=no
Reasons for renting out
Name Relationship
Kushet How long has the contract partnership lasted?
Where rental partner lives
Tenure status: 1.Own land with certificate, 2.Own land without certificate, 3.Rented in, 4.Transferred, 5.Inherited, 6. Other,specify: Reasons for renting out: 1= lack of labour, 2= lack of oxen, 3= unable to rent oxen, 4=lack of cash, 5= credit obligation, 6=other, specify…, Relationship: 1=husband’s close relative, 2=wife’s close relative, 3=distant relative, 4=ex-husband/ex-wife, , 5= non-relative, 6=Son/Daughter, 7=other, specify, Where rental partner lives: 1= within the kushet, 2= within the tabia, 3= A closer tabia, 3= distant tabia, 4= other, specify. How long: How many years has the contract partnership lasted
81

Household Name: Household Id. No.: Interviewer:
Land characteristics ! Keep plot number the same as in land certificate and the following list of plots
Plot No.
Plot Name Irrigated? 1=yes, 0=no
Soil Type
Soil Depth
Slope
Land quality
Weed infestation
Susceptibility to erosion
Degree of soil erosion /degradation
Codes: a) Soil type: 1. Baekel, 2. Walka, 3. Hutsa, 4. Mekeyih, Soil depth: 1.Shallow, 2. Medium, 3. Deep Slope: 1. Meda, 2. Tedafat (foothill), 3. Daget (midhill), 4. Gedel (steep hill) Land quality: 1. Poor, 2. Medium, 3. Good, Weed infestation: 1. High, 2. Medium, 3. Low Susceptability to erosion: 1. High, 2. Medium, 3. Low, 4. None Degree of degradation: 1. Highly degraded, 2. Degraded, 3. Moderately degraded, 4. No degradation Number of Visits to Plot (May 2001 – May 2002)
Land preparation Planting
Manuring/Fertilization Weeding
Inspecting/ (scaring birds)
Harvesting
Threshing
If landlord, monitoring visit Plot
No. Plot Name No. Who No. Who No. Who No. Who No. Who No. Who No. Who No. Who
Total No. of visits
No. of Sole visits
No: Number of Visits Who: Persons visited the plot: 1= Husband, 2= Wife/female head, 3= Husband and wife, 4= Husband and Son, 5= Others, specify __
82
83
Land market participation Fill in if household has participated in the land rental market (including sharecropping in or out) during the last year. ! Keep plot number the same as in land certificate and the following list of plots
Household No.: Interviewer: HH name Data of Interview: Kushet: Woreda: Tabia: Zone: Who decides 2006 plot Land rental markets
Byproducts, who get them?
Responsibilities
no Plot Name
Contract
Type
Duration
If duration>3 yrs, specify
Payment
Advance payment
Paid when
Cost-sharing arrangement
Crop residues
Manure
Grasing
New SWC
Maintain SWC
Pay land tax
Contract type
Crop choice
Share rate/ Rent
Contract: 1. Fixed rent (cash), 2. Fixed rent (Kind), 3. Sharecropping (output only), 4. Cost sharing, 5. Output sharing after deduction of (cash) input costs, 6.Other, specify: Type: 1. Oral without witness, 2. Oral with witness, 3. Written and unreported. 4. Written and reported to tabia. Duration: 1. 1 year, 2- 2 years, 3. 3 years, 4. >3 years, specify……………., 5. Open ended. Payment: Fixed rent: cash amount, Sharecropping: Share of output to the landlord (Code: 1. 50%, 2. 33%, 3. 25%, other, specify:…………………… Advance payment: Cash amount in sharecropping contracts. Paid when: 1. Before cultivation, 2. After harvest, 3. Other, specify:………………….. Costsharing arrangement: 1. Landlord pays fertilizer and seed, 2. Landlord and tenant share cash input costs, 3. Other, specify:…………………………… Byproducts, who gets them/Responsibilities/Who decides: 1.Landlord, 2.Tenant, 3.Shared, 4. Open Crop choice: 1. Landlord, 2. Tenant, 3. Follow follwing crop rotation system (specify): ………………..

Crop production and input use
Seeds Number of labor man days Plot no. Sub-
plot
Sea-son Plot
Name Crop grown
Area planted
crop output Kg
Type
Kg
Manure in Kg
Urea in Kg
Dap in Kg
Herb and pesticide Birr
Plow- ing
Weed- ing
Harvest- ing
Thresh- ing
hired labor
Oxen
Season: 1=Meher (rainy season, 2=Dry season 1 (irrigated land), 3=Dry season 2 (irrigated land) Crops grown: C1. Barley, C2. Wheat, C3. Teff, C4. Maize, C5. Millet, C6. Sorghum, C7. Field pea, C8. Bean, C9. Linseed, C10. Lentil, C11. Hanfets Vegetables: V1. Onion, V2. Potato, V3. Tomato, V4. Letus, V5. Cabbage, V6. Carrot, V7. Pepper, V8. Others Perennials:P1. Orange, P2. Banana, P3. Eucalyptus. P4. Guava, P5. Papaya, P6. Coffee, P7. Others, Specify………….. Seed type: 1. Improved, 2. Local, 3. Others, specify Oxen: 1. Own oxen, 2. Shared oxen, 3. Oxen exchange with labour, 4. Borrowed oxen, 5. Rented oxen for cash, 6. Other, specify:
84