thesis the development and implementation of advanced ... · engineering doctorate in...
TRANSCRIPT

Engineering Doctorate in Non-Destructive Evaluation
Thesis
The Development and Implementation of Advanced Ultrasonic Phased Array
Technology
Jonathan Russell
UK Research Centre in NDE, Imperial College, London

_____________________________________________________________________
_____________________________________________________________________ i
Abstract Ultrasonic inspection is the primary technique for the detection of planar flaws within
the nuclear industry. Current inspections are typically limited to the application of
rigid wedge, single element transducers to components with regular surface geometry.
This thesis addresses some of the limitations of this approach and develops new
methods and techniques that are suitable for application in an industrial environment.
Inspection modelling is a cost effective technique for inspection design and
qualification; it can be used to aid understanding of the inspection process, and
provides valuable insight into inspection data interpretation. In this work semi-
analytical and numerical modelling tools have been used to accurately and efficiently
simulate the ultrasonic inspection of large complex components.
Modelling tools have also been applied to aid in the design of a membrane coupled
conformable phased array device. The membrane coupled array is a low-cost, robust
device that uses a conventional phased array coupled to the outer surface of the
component under test via a water path encapsulated by low-loss membrane. Early
design of this device was performed by Long and Cawley at Imperial College,
London. The work reviewed in this thesis discussed the further development of this
membrane coupled device and its application for the inspection of a specific target
application component.
The target application is a safety critical, thick-walled stainless steel section of pipe-
work that contains an austenitic weld. The current inspection of this component is
carried out by first removing the component weld cap and then mechanically raster
scanning a large number of rigid wedge single element transducers. Weld cap
removal is an expensive time consuming task that can lead to excessive wall thinning
and the exposure of small surface breaking defects. The motivation for this work is to
provide complete inspection of the weld and heat affected zone with the weld cap in
place. It is also designed to improve inspection speed and accuracy, and to reduce the
amount of user intervention required to complete the inspection in a hostile
environment.

_____________________________________________________________________
_____________________________________________________________________ ii
Inspection results from the 2nd and 3rd generation membrane coupled device on
multiple test-pieces representative of the target application are presented. These
results demonstrate that the membrane coupled device can be used to detect defects in
locations that cannot be inspected using conventional techniques. The amount of
scanning required can be significantly reduced, simplifying the inspection and helping
to improve inspection speed by over 60% in comparison to the single element
approach.

_____________________________________________________________________
_____________________________________________________________________ iii
Acknowledgements I would like to thank my supervisor, Peter Cawley for his help and guidance. The
level of support that he has provided during my studies has been exceptional and I am
very grateful.
My thanks also go to others within the Imperial College NDT group, particularly
Mike Lowe and Rob Long whose assistance in this project has been invaluable. I am
thankful to Daniel Hesse, Mickael Drozdz and Prabhu Rajagopal for introducing me
to finite element modelling and their patience in answering my many questions.
I am grateful to Rolls-Royce for supporting this work and providing an environment
in which I could learn and develop my knowledge of NDE. I am especially thankful
to Noel Habgood, Lionel Reyes and the following members of the NDE research team
– Chris Greener, Martin Mienczakowski, Dave Duxbury, Chris Reed and Iain Baillie.
I would also like to acknowledge the assistance that I have received from individuals
within the RCNDE. There are too many to name them all but I’d like to thank
everyone involved in the provision of the EngD scheme. I am also grateful to my
fellow Research Engineers for their support and for making the various training
courses so enjoyable.
I thank my friends and family for their encouragement and patience. Particularly, I
want to thank Cathy, without whose support and understanding this would not have
been possible.

_____________________________________________________________________
_____________________________________________________________________ iv
Table of Contents 1. Introduction............................................................................................................1
1.1. Role within Rolls-Royce................................................................................3
1.2. Outline of Thesis............................................................................................8
2. Ultrasonic Inspection ...........................................................................................11
2.1. Background ..................................................................................................11
2.2. Ultrasonic Phased Arrays.............................................................................22
2.3. Inspection of Components with Irregular Surface Geometry ......................31
2.4. Summary ......................................................................................................36
3. Flat Plate, Non-Welded Test-Piece Inspection ....................................................38
3.1. Test-Piece Development ..............................................................................40
3.2. Technique Description .................................................................................45
3.2.1. Corner Echo .........................................................................................46
3.2.2. Transverse-Longitudinal (TL) Skip .....................................................47
3.2.3. Transverse-Longitudinal-Longitudinal (TLL) Skip.............................49
3.3. Inspection Development ..............................................................................52
3.4. Experimental Results ...................................................................................56
3.4.1. Defect 1................................................................................................61
3.4.2. Defect 2................................................................................................63
3.4.3. Defect 4................................................................................................66
3.4.4. Defect 6................................................................................................68
3.5. Summary ......................................................................................................70
4. Ultrasonic Inspection Modelling..........................................................................73
4.1. CIVA............................................................................................................74
4.2. Finite Element Modelling ............................................................................76
4.3. Target Application Modelling......................................................................83
4.3.1. Defect 2................................................................................................87
4.3.2. Defect 4................................................................................................89
4.3.3. Defect 5................................................................................................92

_____________________________________________________________________
_____________________________________________________________________ v
4.4. Summary ......................................................................................................95
5. Membrane Coupled Device Developments .........................................................97
5.1. Second Generation Membrane Probe Design ..............................................97
5.2. Grating Lobe Internal Noise ........................................................................99
5.3. Beam-Spread Internal Noise ......................................................................108
5.4. Optimised 80 Element Device Design.......................................................113
5.5. 3rd Generation Device Design....................................................................117
5.5.1. Coupling.............................................................................................117
5.5.2. 3rd Generation Membrane Device Configurations.............................119
5.6. 3rd Generation Device Performance...........................................................123
5.6.1. Comparison of Irrigation and Immersion Inspection.........................123
5.6.2. Comparison of Different 3rd Generation Membrane Device Designs127
5.7. Internal Noise Signal Amplitude Variation ...............................................133
5.8. Summary ....................................................................................................136
6. Flat Plate Welded Test-Piece Inspection ...........................................................138
6.1. Flat Plate Welded Test-Piece Design.........................................................138
6.2. Technique Description ...............................................................................146
6.2.1. Direct Specular...................................................................................147
6.2.2. Creep Wave........................................................................................147
6.2.3. Corner Echo .......................................................................................148
6.2.4. Transverse-Longitudinal (TL) Skip ...................................................149
6.2.5. Transverse-Longitudinal-Longitudinal (TLL) Skip...........................150
6.3. Chosen Inspection Techniques for Each Defect ........................................151
6.4. Inspection Process......................................................................................156
6.5. Experimental Results .................................................................................164
6.5.1. Direct Specular Through Weld Inspection ........................................165
6.5.2. Creep Wave Inspection ......................................................................170
6.5.3. Corner Echo Inspection......................................................................171
6.5.4. Transverse-Longitudinal (TL) Skip ...................................................175
6.5.5. Transverse-Longitudinal-Longitudinal (TLL) Skip...........................176
6.5.6. Inspection Summary ..........................................................................182
6.6. Membrane Device Inspection Speed Improvements .................................184

_____________________________________________________________________
_____________________________________________________________________ vi
6.6.1. Assumptions.......................................................................................186
6.7. Summary ....................................................................................................189
7. Twin Crystal Membrane Coupled Device .........................................................191
7.1. Twin Crystal Transducers ..........................................................................191
7.2. Inspection Requirements............................................................................193
7.3. Twin Crystal Membrane Coupled Device Design .....................................196
7.4. Inspection Deployment ..............................................................................205
7.5. Twin Crystal Membrane Device Experimental Results.............................208
7.6. Summary ....................................................................................................213
8. Conclusions........................................................................................................214
8.1. Review of Thesis........................................................................................214
8.2. Outline of Main Contributions...................................................................217
8.2.1. Membrane Coupled Phased Array Device.........................................219
8.2.2. Inspection Modelling .........................................................................221
8.2.3. FMC Based Phased Array Inspection ................................................222
8.3. Future Work ...............................................................................................222
8.3.1. Twin Crystal Membrane Device........................................................222
8.3.2. Narrow Phased Array Membrane Device ..........................................223
8.3.3. FMC Inspection .................................................................................223
8.3.4. Inspection Qualification and Implementation....................................224
9. References..........................................................................................................225

_____________________________________________________________________
_____________________________________________________________________ vii
Figures
Figure 2-1 Schematic diagram of a wave at normal incidence to an interface between
two media.....................................................................................................................12
Figure 2-2 Schematic diagram of refraction at a boundary between water and steel. .20
Figure 2-3 The reflection coefficients for longitudinal and shear waves at the
boundary between steel and air, a.) for an incident longitudinal wave and b.) for an
incident shear wave......................................................................................................21
Figure 2-4 Common array transducer configurations: (a) linear array, (b) 2D array and
(c) annular array, figure taken from (Drinkwater & Wilcox, 2006). ...........................23
Figure 2-5 Schematic diagram of the required time delays to generate an angled beam
using a phased array.....................................................................................................25
Figure 2-6 CIVA beam plots for a 2MHz centre frequency contact array on a stainless
steel block producing a 45º shear wave with an element pitch of a.) 1.5mm and b.)
0.75mm. Both images are shown with a dynamic range of 40dB. .............................27
Figure 2-7 Sector scan of three side drilled hole (SDH) defects, figure taken from
(Long & Cawley, 2006). ..............................................................................................28
Figure 2-8 CEA flexible contact array (Chatillon et al, 2000). ...................................32
Figure 2-9 Commercially available flexible arrays produced by Imasonic (Besançon,
France). ........................................................................................................................33
Figure 2-10 1st generation membrane coupled phased array device a. photograph and
b. device schematic diagram (Long & Cawley, 2006).................................................34
Figure 2-11 Second generation membrane probe (Long et al, 2007b). .......................35
Figure 3-1 Diagram of the target application component. ...........................................38
Figure 3-2 Schematic diagram of defects contained in the conformable phased array
non-welded evaluation blocks, a.) defect 1, b.) defect 2, c.) defect 3, d.) defect 4, e.)
defect 5, f.) defect 6. ....................................................................................................43
Figure 3-3 Photograph of the two flat plate, non-welded test-pieces. .........................43
Figure 3-4 Schematic diagram of corner echo technique. ...........................................47
Figure 3-5 The reflection coefficients for longitudinal and shear waves at the
boundary between steel and air for an incident shear wave.........................................49
Figure 3-6 Schematic diagram of the Transverse-Longitudinal (TL) skip inspection
technique. .....................................................................................................................49

_____________________________________________________________________
_____________________________________________________________________ viii
Figure 3-7 Schematic diagram of the Transverse-Longitudinal-Longitudinal (TLL)
skip inspection technique.............................................................................................50
Figure 3-8 Schematic diagram of the self tandem inspection technique. ....................51
Figure 3-9 Photograph of the 2nd generation membrane coupled device and the 48
element rigid wedge linear phased array. ....................................................................53
Figure 3-10 Photograph of the 2nd generation membrane coupled device inspection
showing the scanning frame configuration. .................................................................55
Figure 3-11 Schematic diagram of the Transverse-Transverse (TT) full-skip
inspection technique.....................................................................................................56
Figure 3-12 Schematic diagram of the flat plate non-welded test-piece calibration set-
up..................................................................................................................................58
Figure 3-13 Schematic diagram of the inspection of defect 1 using a.) the 48 element
rigid wedge phased array and b.) the 2nd generation membrane coupled device.........62
Figure 3-14 Schematic diagram of the inspection of defect 2 using a.) the 48 element
rigid wedge phased array and b.) the 2nd generation membrane coupled device.........64
Figure 3-15 B-Scan image produced from a. the null defect inspection, and b.) the
inspection of defect 2 using the 48 element rigid wedge phased array and c.) using the
2nd generation membrane coupled device. ...................................................................65
Figure 3-16 The B-Scan image obtained from the inspection of defect 4 using a.) the
48 element rigid wedge transducer and b.) the 2nd generation membrane coupled
device. In the membrane transducer inspection the internal noise signal is the highest
amplitude signal and corrupts the image obtained, the SNR has been calculated
ignoring this effect. ......................................................................................................68
Figure 3-17 Schematic diagram of the inspection of defect 6 using a.) rigid wedge
phased array transducers in transmission and reception, and b.) a rigid wedge
transmitter probe and the 2nd generation membrane coupled device as a receiver. .....69
Figure 3-18 Comparison of the response from a.) defect 6 and b.) a defect free region.
The top surface of the parent plate of the test-piece occurs at 0mm depth so that the
weld cap material is deposited above this level and the defect signal appears partially
above the component. ..................................................................................................70
Figure 4-1 Schematic diagram of the excitation method used in the FE models. .......79
Figure 4-2 The 5-cycle Hanning-windowed toneburst with centre frequency of
2.25MHz used for nodal excitation of the target application model a) time domain, b)
frequency domain.........................................................................................................79

_____________________________________________________________________
_____________________________________________________________________ ix
Figure 4-3 Schematic diagram of ALID usage, a) conventional usage with linear
quadrilateral mesh, b) modified usage with quadratic triangular mesh. ......................82
Figure 4-4 Schematic diagram of the inspection of defect 2. ......................................88
Figure 4-5 Comparison of the experimental and simulated A-Scans obtained for
defect 2.........................................................................................................................88
Figure 4-6 Schematic diagram of the inspection of defect 4. ......................................90
Figure 4-7 Comparison of the experimental and simulated A-Scans obtained for
defect 4.........................................................................................................................90
Figure 4-8 Schematic diagram of the model for defect 5 - lack of sidewall fusion
defect at the OD. ..........................................................................................................92
Figure 4-9 Comparison of the experimental and simulated A-Scans obtained for
defect 5.........................................................................................................................93
Figure 4-10 Schematic diagram of the beam spread longitudinal-longitudinal wave
interaction with defect 5...............................................................................................95
Figure 5-1a.) Schematic diagram of the inspection technique used for the detection of
defect 3, b.) B-Scan recorded during the inspection of defect 3 using the membrane
probe with FMC, data is post processed to simulate a 65˚ longitudinal wave probe. .98
Figure 5-2 QSonic images based on current membrane probe design a.) No beam
steering, b.) Steering to 0º, c.) Steering to shear wave critical angle.........................101
Figure 5-3 Schematic diagram of the prototype membrane coupled device, showing
the main beam and the two associated grating lobes. ................................................103
Figure 5-4 a.) CIVA beam plot obtained from a 20element aperture using the 2nd
generation membrane probe demonstrating the relative amplitude of the main beam
and the two grating lobes, image is shown with a dynamic range of 30dB, b.) the
echodynamic response along the water/steel interface. .............................................103
Figure 5-5 Schematic diagram of the prototype membrane coupled device, showing
the forward facing grating lobe internal reflection path. ...........................................104
Figure 5-6 Schematic diagrams of the grating lobe reflection path occurring in the 2nd
generation membrane coupled device at different angles of incidence, a.) 0º incidence
angle, 0º longitudinal wave, b.) 10º incidence angle, 45º longitudinal wave, c.) 20º
incidence angle, 45º shear wave. ...............................................................................105
Figure 5-7 Experimental results obtained using the membrane coupled phased array
device, a.) 0º incidence angle, 0º longitudinal wave, b.) 10º incidence angle, 45º
longitudinal wave, c.) 20º incidence angle, 45º shear wave. .....................................107

_____________________________________________________________________
_____________________________________________________________________ x
Figure 5-8. Schematic diagram of the beam spread noise signal in a simple case where
the main beam is steered to normal incidence. ..........................................................109
Figure 5-9. Internal beam spread noise generated in a 0˚ longitudinal wave inspection
for the a.) conventional phased array b.) 2nd generation conformable membrane
coupled device. ..........................................................................................................110
Figure 5-10 Photograph of the bespoke probe jig for internal noise signal
measurements.............................................................................................................111
Figure 5-11 B-Scan image generated for a 0˚ longitudinal wave inspection for the 80
element, 15mm, 30º array configuration....................................................................113
Figure 5-12 Schematic diagram of the 80 element membrane coupled device
transducer a.) side view, b.) plan view.......................................................................115
Figure 5-13. Schematic diagram of the optimised membrane coupled device housing.
....................................................................................................................................115
Figure 5-14. Internal noise signals in the optimised membrane coupled device. ......116
Figure 5-15. Results obtained from the inspection of defect 3 using a.) conventional
phased array, b.) optimised conformable membrane coupled device. .......................117
Figure 5-16 3rd generation membrane probe base plate design. ................................119
Figure 5-17 Photograph of the 3rd generation membrane coupled device showing the
integrated irrigation system........................................................................................119
Figure 5-18 3rd generation membrane probe design, array has an approximate 6mm
first element standoff height and angle of 7º. ............................................................121
Figure 5-19 3rd generation membrane probe design, array has a 20mm first element
standoff height and angle of 18º. ...............................................................................122
Figure 5-20 3rd generation membrane probe design, array has a 6mm first element
standoff height and angle of 25º. ...............................................................................123
Figure 5-21 Schematic diagram of the experimental configuration used to generate a
0º longitudinal wave...................................................................................................128
Figure 5-22 Comparison of the 0º scans generated with beam steering only when
positioned to inspect defect 3 using a.) 80el device, b.) 6mm, 7º 128el device, c.)
6mm, 25º 128el device, d.) 20mm, 18º 128el device.................................................129
Figure 5-23 Comparison of the 0º scans generated with beam steering only when
positioned to inspect a.) defect 1 and b.) defect 3......................................................134
Figure 5-24 Schematic diagrams of the experimental set-up used to inspect a.) defect
1 and b.) defect 3........................................................................................................134

_____________________________________________________________________
_____________________________________________________________________ xi
Figure 5-25 45º shear wave inspection of defect 1 showing variable amplitude. The
defect response occurs over a broad arc due to beam spread. ...................................135
Figure 5-26 Schematic diagrams showing the source of internal noise within the
membrane coupled phased array a.) on a flat surface, b.) on the rising face of the weld
cap. .............................................................................................................................136
Figure 6-1 Photograph of the weld cross-section from the flat plate welded test-pieces.
....................................................................................................................................140
Figure 6-2 Photograph of conformable phased array welded evaluation block 2 (Rolls-
Royce, 2008b). ...........................................................................................................144
Figure 6-3 Schematic diagram of defects contained in the conformable phased array
welded evaluation block 1, a.) defect 1, b.) defect 2, c.) defect 5, d.) defect 6, e.)
defect 7, f.) defect 8, g.) defect 9, h.) defect 12, i.) defect 13, j.) defect 14...............145
Figure 6-4 Schematic diagram of defects contained in the conformable phased array
welded evaluation block 2, a.) defect 3, b.) defect 4, c.) defect 10, d.) defect 11. ....146
Figure 6-5 Schematic diagram of direct specular reflection. .....................................147
Figure 6-6 Schematic diagram of the creep wave inspection technique....................148
Figure 6-7 Schematic diagram of the a.) direct and b.) skip corner echo inspection
technique. ...................................................................................................................149
Figure 6-8 Schematic diagram of the Transverse-Longitudinal (TL) skip inspection
technique. ...................................................................................................................150
Figure 6-9 Schematic diagram of the Transverse-Longitudinal-Longitudinal (TLL)
skip inspection technique, a.) pitch-catch and b.) self tandem (ST). .........................150
Figure 6-10 Weld cap profile of the flat plate welded test-pieces ultrasonically
measured using the membrane device. ......................................................................158
Figure 6-11 CIVA beam plots for 3rd generation membrane coupled array coupled to a
water path using unfocused delay laws with a, a.) 17 element aperture and a, b.) 65
element aperture. Both images are shown over a 60dB dynamic range. ..................163
Figure 6-12 Schematic diagram to illustrate the through weld inspection of defect 3
using a direct 65º longitudinal wave inspection with the 18º, 20mm device.............167
Figure 6-13 60º longitudinal wave B-Scan image obtained from the 17element
aperture inspection of defect 10 through the weld using the 18mm, 20º device. ......168
Figure 6-14 B-Scan image obtained using the secondary through weld scan direction
inspection of defect 11 with the 18mm, 20º 3rd generation membrane device. Suitable

_____________________________________________________________________
_____________________________________________________________________ xii
delay laws have been used to produce 26mm focal depth from an aperture of 31
elements. ....................................................................................................................170
Figure 6-15 Schematic diagram of the inspection of a.) a non-defective root in the flat
plate welded test-pieces and b.) a root defect. ...........................................................173
Figure 6-16 Comparison of the 45º shear wave B-Scan images obtained from a.)
defect 8 and b.) a null defect region of the test-piece. ...............................................174
Figure 6-17 Comparison of the 45º full skip shear wave B-Scan images obtained from
a.) defect 5 and b.) a null defect region of the test-piece. In each image an unfocused
aperture of 17 elements is used and SNR is calculated relative to the background
noise. ..........................................................................................................................175
Figure 6-18 Schematic diagram of the pitch-catch TLL inspection setup.................177
Figure 6-19 Schematic diagram of the through weld 65º longitudinal wave TLL
inspection set for the inspection of defect 4...............................................................180
Figure 6-20 Inspection diagram to detect defect 7 using the 7º, 6mm 3rd generation
128 element membrane probe with a 50º TLL inspection from the positive direction.
....................................................................................................................................182
Figure 7-1. Schematic diagram of a single element 0º longitudinal wave twin crystal
probe. .........................................................................................................................192
Figure 7-2. CIVA representation of an angled twin crystal array transducer a.) front
view, b.) side view, and c.) plan view........................................................................193
Figure 7-3 Schematic diagram of defects considered as part of the twin crystal
membrane coupled phased array development activity , a.) defect 3, b.) defect 4, c.)
defect 5, d.) defect 6, e.) defect 10, f.) defect 11, g.) defect 12, h.) defect 13. ..........196
Figure 7-4 Plan view of the CIVA representation of a 1.5D phased arrays to generate
a variable roof angle twin crystal transducer. ............................................................198
Figure 7-5 CIVA screen capture showing the essential parameters used to design the
twin crystal membrane coupled device......................................................................200
Figure 7-6 CIVA simulation of the beam produced using null delay laws by a 13º tilt
angle twin crystal membrane coupled phased array device with a.) 4º roof angle, b.) 7º
roof angle, c.) 7.5º roof angle. All images are shown over a 60dB range. ...............203
Figure 7-7 A photograph of the 4º roof angle configuration of the twin crystal
membrane coupled device..........................................................................................205
Figure 7-8 The twin crystal membrane coupled device a.) Schematic diagram of the 4º
roof angle configuration, b.) Schematic diagram of the 7º roof angle configuration.205

_____________________________________________________________________
_____________________________________________________________________ xiii
Figure 7-9 Schematic diagram of the surface profile measurement using the twin
crystal membrane coupled device. .............................................................................207
Figure 7-10 Photograph of the twin crystal membrane coupled device and the 48
element rigid wedge linear phased array. ..................................................................208
Figure 7-11 Schematic diagram of the experimental set-up used for the direct specular
through weld detection of defect 3.............................................................................209
Figure 7-12 Comparison of the 65º longitudinal wave B-Scan images obtained using a
17element aperture with unfocused delay laws for the inspection of defect 10 through
the weld using a.) the twin crystal membrane coupled device and b.) the 18mm, 20º
3rd generation linear membrane coupled device. .......................................................211

_____________________________________________________________________
_____________________________________________________________________ xiv
Tables
Table 3-1 Defect Description for flat plate, welded test-pieces...................................42
Table 3-2 Defect Description for first stage of membrane coupled phased array device
inspection development (OD – Outer Diameter). ........................................................52
Table 3-3 SDH calibration experimental data obtained using the 2nd generation
membrane device with 45dB gain and the 48 element rigid wedge phased array with
43.25dB gain. ...............................................................................................................58
Table 3-4 Experimental results for the inspection of defect 1. ....................................63
Table 3-5 Experimental results for the inspection of defect 2. ....................................66
Table 3-6 Experimental results for the inspection of defect 4. ....................................67
Table 3-7 Experimental results for the inspection of defect 6. ....................................70
Table 4-1 Summary of the reduction in the overall model size when using ALID
absorbing regions for FE models to simulate the single element transducer inspection
of defects 1-6................................................................................................................85
Table 4-2 Experimental and simulated TL signals obtained for the inspection of defect
2. The amplitude of each signal has been normalised to unity. ..................................89
Table 4-3 Comparison of the experimental and simulated TLL signals obtained for the
inspection of defect 4. ..................................................................................................91
Table 4-4 Comparison of the experimental and simulated pitch-catch TLL signals
obtained for the inspection of defect 5.........................................................................94
Table 5-1 Summary of the results obtained from the QSonic study to investigate the
grating lobes produced by the 2nd generation membrane coupled device over different
steering angles............................................................................................................102
Table 5-2 Membrane coupled device grating lobe noise band predicted through
geometrical analysis...................................................................................................106
Table 5-3 2nd generation membrane coupled device internal noise band experimental
results. ........................................................................................................................108
Table 5-4 A comparison of the membrane coupled device beam spread noise
predicted through geometrical analysis and found experimentally. ..........................112
Table 5-5 Approximate time range of interest in the inspection of defects 1-6. .......114
Table 5-6 Summary of localised signal to noise ratio for the inspection of defect 1
using a 30 mm aperture with the 7º, 6mm membrane coupled device in immersion,

_____________________________________________________________________
_____________________________________________________________________ xv
irrigation with internal absorbing material and irrigation with no internal absorbing
material. .....................................................................................................................125
Table 5-7 Summary of localised signal to noise ratio for the inspection of defect 2
using a 30 mm aperture with the 7º, 6mm membrane coupled device in immersion,
irrigation with internal absorbing material and irrigation with no internal absorbing
material. .....................................................................................................................125
Table 5-8 Summary of localised signal to noise ratio for the inspection of defect 3
using a 30 mm aperture with the 7º, 6mm membrane coupled device in immersion,
irrigation with internal absorbing material and irrigation with no internal absorbing
material. .....................................................................................................................126
Table 5-9 Summary of localised signal to noise ratio for the inspection of defect 4
using the 7º, 6mm membrane coupled device in immersion, irrigation with internal
absorbing material and irrigation with no internal absorbing material......................126
Table 5-10 Summary of localised signal to noise ratio and signal amplitude for the
inspection of defect 1 using the three different 3rd generation membrane device
designs with a 30 mm aperture. .................................................................................131
Table 5-11 Summary of localised signal to noise ratio and signal amplitude for the
inspection of defect 2 using the three different 3rd generation membrane device
designs with a 30 mm aperture. .................................................................................131
Table 5-12 Summary of localised signal to noise ratio and signal amplitude for the
inspection of defect 3 using the three different 3rd generation membrane device
designs with a 30 mm aperture. .................................................................................131
Table 5-13 Summary of localised signal to noise ratio and signal amplitude for the
inspection of defect 4 using the three different 3rd generation membrane device
designs with a 30 mm aperture. .................................................................................132
Table 6-1 Defect Description for flat plate, welded test-pieces.................................142
Table 6-2 Inspection technique summary for the flat plate, welded test-pieces. .......152
Table 6-3 Membrane coupled device optimum inspection position for defects 1-7.
Inspection of the entire volume of interest is performed from six transducer positions
relative to the weld, each position is indicated by a unique colour. The colour coding
used is discussed in Table 6-4....................................................................................159
Table 6-4 Colour coding system used to position probe in membrane device
inspections..................................................................................................................160

_____________________________________________________________________
_____________________________________________________________________ xvi
Table 6-5 Comparison of 6dB beam width and maximum amplitude obtained from a
17 element aperture and a 65 element aperture using the 3rd generation membrane
device in immersion when using focused and unfocused delay laws........................162
Table 6-6 A comparison of the inspection performance for all defects using a direct
specular detection technique using single element (yellow shading) and optimised
(blue shading) delay laws. Defects that are not detected are indicated by no value for
the SNR......................................................................................................................166
Table 6-7 A comparison of the inspection performance for all defects using the corner
echo inspection technique using single element (yellow shading) and optimised (blue
shading) delay laws....................................................................................................172
Table 6-8 A comparison of the inspection performance for the four defects detected
using the TL skip technique using single element (yellow shading) and optimised
(blue shading) delay laws...........................................................................................176
Table 6-9 A comparison of the inspection performance for all defects using the TLL
inspection technique using single element (yellow shading) and optimised (blue
shading) delay laws. Defects that are not detected are indicated by no value for the
SNR............................................................................................................................178
Table 6-10 Table showing the SNR improvement when using an optimised delay law
inspection in comparison to a 12.5mm aperture, unfocused inspection. Green shading
indicates that it is only possible to detect a defect if optimised delay laws are used.
Orange shading implies that a defect can be detected using both delay law approaches.
Red shading is used to highlight defects that cannot be detected using a given
technique and grey shading indicates where a specific test is not performed. ..........184
Table 6-11 Summary of time required to complete the entire target application
inspection. ..................................................................................................................188
Table 7-1 Inspection technique summary for the flat plate, welded test-pieces using
the twin crystal membrane coupled phased array device. Grey shading indicates that
additional inspection techniques are not deployed. ...................................................195
Table 7-2 Definition of the essential parameters that must be controlled when using
CIVA..........................................................................................................................201
Table 7-3 Comparison of the longitudinal wave refraction angle and beam crossing
point that can be produced using the twin crystal membrane coupled device design
with the use of delay laws..........................................................................................204

_____________________________________________________________________
_____________________________________________________________________ xvii
Table 7-4 A comparison of the inspection performance for the direct specular through
weld inspection of defects 3 and 10 using the 3rd generation linear membrane device
(yellow shading) and the twin crystal membrane device (blue shading). All
inspections are performed using an aperture of 17 elements and unfocused delay laws.
Defects that are not detected are indicated by no value for the SNR. .......................212

_____________________________________________________________________ 1
1. Introduction The Engineering and Physical Sciences Research Council (EPSRC) established the
Engineering Doctorate (EngD) scheme in 1992. The Scheme was established to
address a belief held by industry, that an alternative research degree to the traditional
PhD was required to better prepare researchers for a career in industry. The EngD is a
4 year research degree, which is awarded for industrially relevant research at a level
equivalent to a PhD. The research component of the degree is complemented by a
number of technical and management courses. The program of training is designed to
allow the Research Engineer (RE) to develop the necessary skills to function as an
innovative NDE engineer in the future. The UK Research Centre in Non-Destructive
Evaluation (RCNDE) was established in 2003 as a focal point for research in Non-
Destructive Evaluation (NDE) within the UK. The RCNDE then launched the EngD
program in NDE in 2005; I am one of the first cohort of RE’s to participate in the
programme.
Rolls-Royce is a world-leading supplier of power solutions. The organization is made
up of five individual business units, civil aerospace, defence aerospace, marine,
energy and nuclear. Rolls-Royce is a strong supporter of the EngD scheme and has
provided industrial sponsorship to a large number of EngD students since the
inception of the programme. Rolls-Royce is a full industrial member of the RCNDE,
and is currently supporting multiple RE’s in NDE. My EngD is industrially supported
by Rolls-Royce Submarines, which is part of the nuclear business unit. Rolls-Royce
Submarines is the delegated UK technical authority (TA) for the Nuclear Steam
Raising Plant (NSRP) on all Royal Navy submarines.
My EngD research is part of the Nuclear Propulsion Critical Technology (NPCT)
project. This is a major Ministry of Defence (MoD) funded research initiative within
Rolls-Royce Submarines to research technologies that are essential to the future needs
of the naval submarine fleet. The key aims of the overall research project are to
improve safety, reduce costs, and maximise availability of the submarine fleet. In the
advanced NDE NPCT project Rolls-Royce are working with three RCNDE member
Universities - Imperial College, University of Bristol and University of Strathclyde.
The advanced NDE NPCT project develops conformable phased array devices

Introduction
_____________________________________________________________________ 2
designed to improve the inspection of the NSRP components with irregular surface
geometry. This includes a membrane coupled phased array device and a flexible
matrix phased array device. The overall project includes the development of
advanced post processing algorithms intended to improve inspection speed, versatility
and defect characterisation. Research is also ongoing to develop novel modelling
techniques to improve inspection planning, qualification and data interpretation.
As part of the technical authority role Rolls-Royce is responsible for ensuring the safe
operation of the NSRP. A major part of this role is the development and deployment
of a wide range of NDE based inspections. In-service inspection (ISI) of NSRP
components can be particularly challenging. Access constraints present a major
difficulty within the submarine environment. Inspections must typically be carried
out from the component outer surface only. Also as space on a submarine is very
restricted, the area around the component under test during the inspection process is
limited. Inspections must be performed in a potentially high radiation area; it is
necessary to limit the exposure of personnel to harmful ionising radiation. Therefore
automated inspection techniques are developed wherever practically possible and all
realistic measures are taken to ensure that radiation dose levels are as low as
reasonable practicable (ALARP). The use of automated inspection also helps to
ensure that the high integrity testing is performed in as a short time period as possible
and that an auditable inspection record can be maintained.
A number of components within the NSRP have a complex geometry which can make
inspection even more challenging. Components are designed to fit into a relatively
small space, and typically large, regular surfaces are not available as a platform to
complete inspection. Many components have some form of irregular surface finish;
this can be relatively minor irregularities such slight changes in the surface profile of
a forging or more dramatic such as the presence of an undressed weld cap or a change
in component cross-section. The conformable phased array technology under
development in the advanced NDE NPCT project is specifically designed to address
this inspection requirement. The membrane coupled phased array uses a commercial
array which is then coupled to the outer surface of the component under test via a
water path encapsulated in a low loss rubber membrane. The main focus of my EngD

Introduction
_____________________________________________________________________ 3
is the development of a full inspection capability based on this technology and its
transfer from academia into Rolls-Royce.
1.1. Role within Rolls-Royce
My role within the advanced NDE NPCT project has evolved during the four years of
my EngD degree. The overall aim of my work has been to introduce the membrane
coupled phased array inspection capability into Rolls-Royce. However, I have been
involved in a range of additional tasks and have also gradually assumed greater
responsibility for my own work and that of others. My initial involvement in the
project was to complete a range of finite element (FE) modelling tasks; which will be
discussed in greater technical detail in chapter 4. Inspection modelling is routinely
carried out by engineers within the Rolls-Royce NDE teams. However, previously
this has been limited to the use of simple spreadsheet based models and basic
commercial NDE simulation packages. The spreadsheet based models are limited in
terms of their functionality and cannot be widely used. The commercial packages are
suitable for use in many inspection scenarios but can have limited accuracy. FE
modelling offers a means to accurately simulate a broader range of inspections than
can be achieved with these commercial packages. However, FE modelling is highly
computationally intensive and it can be rather complex to accurately generate
appropriate models. Prior to the completion of my research these techniques had not
been applied to industrially significant inspection problems within Rolls-Royce.
The development of FE modelling techniques and their application within Rolls-
Royce was the primary objective of my research over approximately the first year of
my EngD. Nearing the end of this period a target application was selected for the
membrane coupled phased array; due to security restrictions it is not possible to
provide details of this component and its function in the NSRP. In this report the
component will be referred to as the target application. Details of the work performed
on the initial development of two flat plate, non-welded test-pieces is described in
chapter 3. Upgrades made to the membrane device design based on the results of this
initial testing are then reviewed in chapter 5. Results obtained using this modified
design on two flat plate, welded test-pieces are then discussed in chapter 6. When the
target application was selected, the development of the membrane coupled device
could become much more focused towards specific Rolls-Royce requirements. The

Introduction
_____________________________________________________________________ 4
further development and the transfer of this technology became the primary focus of
my research. My role was to design the inspection of the target application; this
involved the design of suitable test-pieces and development of a primary detection
technique for each of the artificial defects within the test-pieces. I carried out
experimental testing on the test-pieces using single element, conventional phased
array transducers and the membrane coupled device. I also simulated a subset of
these tests using FE modelling the results of which are discussed in chapter 4.
During my doctorate I have gradually taken on greater responsibility for the overall
planning and execution of the entire advanced NDE NPCT project. Initially I
assumed responsibility for the organisation of quarterly review meetings with the
three Universities. At these meetings the university representatives provide a
presentation of the work that they have performed during the previous 3 months. I
arrange and then chair the meetings; I also produce minutes from the meetings and
provide these to all invitees as a permanent record of the discussion. As I took greater
responsibility for the project and as the technologies under development became more
mature I also introduced an interim meeting with each of the universities. Typically I
visit each individual university four times a year; these meetings are held
approximately six weeks after each of the main review meetings. The focus of these
meetings is to allow me to gain a greater appreciation of the research work taking
place and to provide more focussed support to the university based researchers. These
meetings have proved to be a useful tool to ensure that the research remains suitably
focussed on industrially relevant problems and that specific problems are addressed
quickly.
The flexible matrix array, which is under development at the University of
Strathclyde is a relatively immature technology and significant further development
will be required before this technology can be deployed on the NSRP. Although I am
involved in the development of this device it is not part of my EngD research and will
not be reviewed in detail in this document. Likewise much of the research work being
carried out at the University of Bristol to develop advanced full matrix capture (FMC)
based inspection algorithms including autofocus is not part of my doctorate research
and will not be discussed here.

Introduction
_____________________________________________________________________ 5
In addition to the increased responsibility for coordinating the advanced NDE NPCT
project I have also gradually become more involved determining overall NDE
research areas. I have been involved in a number of activities within this role. In
order to develop a coherent NDE strategy across the whole of Rolls-Royce, NDE
Panel meetings are held where stakeholders from across the business attend. When
required I have acted as a secretary at these meetings and published minutes, I have
also presented results from my research at this forum. One aspect of these meetings is
to discuss specific research areas with applicability across Rolls-Royce and how to
most appropriately attract Rolls-Royce funding for this research.
Over the past two years I have provided input into the NDE section of the high-level
component and structural integrity research and technology (R&T) strategy document.
This document has been developed to ensure that the research work within Rolls-
Royce Submarines is suitably coordinated and funded. Through the development of
this strategy document it has been possible to identify a number of areas where
specific research is needed to address future NDE requirements. More recently I have
also been responsible for producing some supporting documentation, briefly
describing all of the current and future research areas to be addressed through the
NDE R&T strategy. This document is used as a basis for discussing research areas
both within and outside the NDE teams.
The main R&T strategy document is updated on an annual basis; based on the result
of this process future research work to be addressed through the R&T programme is
identified. Research work can be funded through the MoD or directly through Rolls-
Royce. In each case in order to obtain funding for a project a proposal document and
a range of associated documentation such as project plans and costs must be
produced. For the past two years I have produced the bid proposal for the advanced
NDE NPCT project which includes all of the University research projects discussed
previously. As part of this process I have been responsible for clearly defining the
long-term objectives of all four of these tasks and demonstrating how these address
the needs of the submarine programme. In the final year of my doctorate my
involvement in the bid process increased and along with Chris Greener (NDE
research, team leader) I was involved in generating the bids for all MoD funded
research work in 2009/2010. The overall research work is a major activity costing

Introduction
_____________________________________________________________________ 6
well in excess of £1million per annum and involving all six members of the NDE
research team as well as a number of third party academic and industrial partners.
Each research task funded through the NPCT project must provide a range of tangible
benefits and these are reported to the MoD in an appropriate manner. In the advanced
NDE NPCT project a detailed report on progress is provided to the MoD on a regular
basis throughout the year. I am responsible for generating the progress report related
to the advanced array inspection project and I have represented the NDE teams at
review meetings with the Rolls-Royce project manager for over two years. I am also
responsible for generating an annual progress report related to the project which has
been the main annual deliverable associated with this work.
Rolls-Royce submarines subcontract NPCT funded research to a number of different
organisations, including other industrial companies as well as academic institutions.
In April 08 the Support and Development (S&D) OBU which includes the NDE
research team started to subcontract some work to Serco Technical Assurance
Services (Serco TAS) (Risley, UK). I am responsible for supervising some aspects of
the work performed by Serco TAS under this contract. In this role regularly meet
face-to-face with Serco TAS representatives to monitor their progress. I also
represent Rolls-Royce on the Inspection Modelling Working Group (IMWG). This is
a sub-group established by Serco TAS specifically to address inspection modelling
requirements. The IMWG includes users of different modelling platforms from Serco
TAS, Rolls-Royce and external experts (Dr R Chapman - British Energy and Prof M.
Lowe - Imperial College). I am the representative from the Rolls-Royce S&D OBU
and I am responsible for ensuring that the IMWG is addressing the needs of the entire
Rolls-Royce department.
The objective of the advanced NDE project is to develop new tools and capabilities
that can improve the inspection of NSRP components. In order to understand the
requirements of the new technology in this type of application it is important to have
an appreciation of the environment in which they are likely to be used. I have spent
time working on a submarine completing existing inspections which has given me an
insight into the unique challenges that the inspection engineers face. This has

Introduction
_____________________________________________________________________ 7
involved completing a number of specific training courses designed to ensure that I
can support the inspection in a safe manner.
The EngD is designed to prepare the RE for a senior career in industry, and the
combination of technical courses, focused research and industrial experience is well
suited to achieving this aim. My research has allowed me to develop a detailed
knowledge of ultrasonic inspection and particularly the use of phased arrays. In
recognition of this expertise I was asked by Rolls-Royce Aerospace to represent this
part of this business in an RCNDE targeted project with University of Bristol,
University of Strathclyde and a range of other industrial sponsors. The targeted
project is intended to develop the use of 2D ultrasonic phased arrays for NDE
applications. This is outside the scope of my EngD but provides an opportunity to
gain an understanding of this area. It also gives me an insight into the main NDE
drivers for Rolls-Royce Aerospace.
The advanced NDE NPCT project has progressed well and it has been identified as an
area that Rolls-Royce would like to support in the future. The scope of this project is
also increasing as more of the research topics become further developed and more
mature. In order to continue to develop the different research areas and to continue
the strong relationship between Rolls-Royce submarines and the RCNDE universities,
Rolls-Royce have decided to support another EngD RE. I was the primary Rolls-
Royce contact for the recruitment of the next RE, gathering and assessing applications
and interviewing the student who was offered the position. The second RE started his
studies in October 2008; I was responsible for outlining the content of his research
and have acted as his industrial supervisor on his EngD studies. In addition to my
mentoring role with the second Rolls-Royce NDE RE I am also responsible for
mentoring Rolls-Royce apprentices as they spend time with the NDE research team. I
am also increasingly involved in the direction of work through other researchers
within the NDE research team. In order to embed the technologies developed through
the advanced NDE NPCT project within Rolls-Royce these capabilities must be
transferred to others within the organisation. As the individual responsible for the
advanced NDE project I must ensure that this transfer process is successful. This will
become increasingly important as the technologies become more mature.

Introduction
_____________________________________________________________________ 8
As stated above, in addition to the MoD funded projects, some research work is
directly funded through Rolls-Royce. I am responsible for the only project that we
currently have funded through this route. This is an RCNDE targeted research project
to “Array imaging of inhomogeneous steel welds by measurement of weld material
maps”. This is a three year research project in collaboration with Imperial College
London, University of Manchester and E.On. It is likely that the second RE now
working on the advanced NDE NPCT project will also support some aspects of this
RCNDE project.
My role within Rolls-Royce is clearly beyond the scope of the typical EngD RE role.
I am responsible for a range of activities throughout Rolls-Royce, many of which are
beyond the scope of my doctorate. In recognition of the significant additional
responsibility that I have taken on during my studies I was offered a position of full-
time employment in October 2008. I accepted this offer and during the final 12
months of my doctorate have worked directly for Rolls-Royce. I have taken on many
of the additional tasks discussed above as part of this role.
1.2. Outline of Thesis
This thesis presents the development of the membrane coupled phased array
inspection capability. The aim of this development activity is to provide an improved
inspection capability for the NDE of components with complex surface geometry
typically found within the nuclear industry. The membrane coupled phased array uses
a commercially available linear phased array. The array is then coupled to the surface
of the component under test via a water path that is encapsulated by a polyurethane
membrane with properties that are well matched acoustically to water.
Chapter 2 provides an overview of ultrasonic inspection techniques. The chapter
begins with the physical principles of this approach and discusses conventional single
element, rigid wedge inspection techniques. Phased array design and usage is then
discussed and the benefits of this approach over single element transducer inspection
are highlighted. Two different phased array transducers that are designed to improve
the inspection of components with an irregular surface geometry are then introduced.
The second of these devices is the membrane coupled phased array device; the focus

Introduction
_____________________________________________________________________ 9
of this thesis is the development of inspection techniques for defect detection using
this device, defect sizing is not considered.
In order to develop the conformable membrane coupled phased array for use within
Rolls-Royce Submarines a specific target application has been selected. The target
application component and the inspection of two flat plate, non-welded test-pieces
designed to replicate the target application component are described in chapter 3.
These test-pieces do not contain an actual weld but do have a representative weld cap.
Inspection results comparing the defect detection performance of a rigid wedge
phased array transducer to the 2nd generation membrane coupled phased array device
are presented and the performance benefits of the flexible array discussed.
In chapter 4 the two primary modelling techniques used in this investigation are
described. Simulation of the target application inspection was carried out using the
CIVA model and using FE modelling. Results from both modelling approaches are
presented and compared to experimental data gathered from the single element
transducer inspection of the flat plate, non-welded test-pieces.
Development of the 3rd generation membrane coupled phased array transducer is
described in chapter 5. In comparison to the 2nd generation design this device
provides a reduced level of internal noise and improved beam forming characteristics.
The 3rd generation device also incorporates an integrated irrigation system which is
required for the deployment of this transducer in a commercial inspection.
Results from the inspection of two flat plate, welded test-pieces using the 3rd
generation membrane coupled device are presented in chapter 6. These test-pieces
contain a weld and weld cap representative of the actual target application component
and 14 different artificial defects. Each defect is inspected using multiple techniques
from both directions either side of the weld. All defects can be positively detected by
at least one of the inspection techniques used.
The internal noise signal that limited the performance of the second generation
membrane coupled device is still evident in the 3rd generation device. This limits the
through weld inspection capability of the 3rd generation membrane coupled device. A

Introduction
_____________________________________________________________________ 10
twin crystal membrane coupled device, designed to eliminate this issue and improve
the inspection of some challenging defects is reviewed and assessed in chapter 7.
Preliminary results obtained using the twin crystal device are presented, which
demonstrate that the internal noise signal has been eliminated and that improved
inspection performance is possible by using this device.
The main conclusions of this thesis and ideas for future work are presented in
chapter 8.

_____________________________________________________________________ 11
2. Ultrasonic Inspection Ultrasonic testing (UT) is a well-established Non-Destructive Evaluation (NDE)
method using high frequency acoustic energy, usually in the range 1-5MHz, to
conduct measurements (Birks & Green, 1991). It is a highly versatile method of
testing and can be used in a number of different situations including flaw
detection/evaluation, dimensional measurements, and material characterization
(Mitsui Babcock, 2005).
Ultrasonic inspection is one of the major NDE techniques used within the nuclear
industry and represents the biggest area of NDE research and development within
Rolls-Royce Submarines. In this chapter, the basic principles of bulk wave ultrasonic
inspection are reviewed, along with the use of phased array inspection techniques and
the use of flexible arrays for the inspection of components with irregular surface
geometry. This is not an exhaustive review of all uses of ultrasonic inspection, but
focuses on the techniques and the applications of these techniques that are relevant to
the nuclear industry.
2.1. Background
Ultrasonic energy is commonly introduced into the material using a piezoelectric
transducer. Piezoelectric materials produce an electrical charge when subjected to a
mechanical stress, equally when electrically excited these materials become stressed
(Auld, 1973; Cheeke, 2002). The direct piezoelectric effect occurs when stress is
applied to the piezoelectric material. In this situation bound electric charges appear at
opposing surfaces of the medium, causing a difference in potential across the medium.
The direct piezoelectric effect is always accompanied by the indirect, or converse
piezoelectric effect. The indirect piezoelectric effect corresponds to the induced stress
in a material when subjected to an applied voltage.
In a simple contact transducer, operating as a transmitter in pulse echo mode an
electrical pulse is sent to the transducer. This produces motion in the piezoelectric
element, via the indirect piezoelectric effect which then generates an acoustic wave in
the component under test. The acoustic wave then propagates through the material
under test. Waves returning to the transducer cause a potential drop across the

Ultrasonic Inspection
_____________________________________________________________________ 12
transducer through the direct piezoelectric effect. This voltage is then detected and
interpretation of these signals is used to infer information related to the component
being inspected.
The ultrasonic energy produced by the transducer propagates through the material
under test until there is a change in acoustic impedance. Acoustic impedance is the
product of the velocity of sound within a material and the density of that material.
When the wave encounters an interface between two different media, reflection and
transmission of the wave occurs. When calculating the behaviour of the wave at the
interface between the two media the boundary conditions must be satisfied. At the
interface the two boundaries are connected and hence there is continuity of the normal
and tangential components of displacement and stress. The simple case of a pressure
wave traveling in the positive x-direction at normal incidence to an infinite interface
at x=0 between two media is shown in the schematic diagram in Fig 2-1.
pi
pt
pr
x=0
Material 1 Material 2
Figure 2-1 Schematic diagram of a wave at normal incidence to an interface between two media.
The three waves shown in Fig 2-1 can be represented as:
)(exp 1xktiAp ii −= ω
)(exp 1xktiAp rr += ω (2.1)
)(exp 2 xktiAp tt −= ω

Ultrasonic Inspection
_____________________________________________________________________ 13
Where p = Pressure
A = Amplitude
ω = Angular frequency
t = Time
k = Wavenumber
Tp = Transmission coefficient for pressure
Rp = Reflection coefficient for pressure
As discussed above, there must be continuity of displacement (velocity) and stress
(pressure); therefore at the boundary it follows that:
tri ppp =+ (2.2)
tri PPP =+ (2.3)
Equations (2.2) and (2.3) can be solved to give the pressure transmission and
reflection coefficients for normal incidence. In each case the phase of the wave is
given by the sign of the coefficient:
21
22ZZ
ZT
PP
Pi
t
+== (2.4)
21
12
ZZZZR
PP
Pi
r
+−
== (2.5)
Where Z1 = Impedance of material 1
Z2 = Impedance of material 2
Therefore from the definition of acoustic intensity:
Z
pI2
2
= (2.6)

Ultrasonic Inspection
_____________________________________________________________________ 14
It follows that the energy transmission and reflection coefficients for normal
incidence are given by equations (2.7) and (2.8) respectively.
221
21
)(4
ZZZZ
TE += (2.7)
2
12
12⎟⎟⎠
⎞⎜⎜⎝
⎛+−
=ZZZZ
RE (2.8)
The transmission and reflection coefficients will also vary with the angle of incidence
and depending on whether the two materials are liquids or solids. All of these cases
are covered by standard texts on ultrasonic waves such as Cheeke (2002), Auld
(1973b) and Schmerr (1998).
The difference in acoustic impedance between a solid and air is very large; therefore
if the wave encounters a crack filled with air almost all of the wave energy will be
reflected. In this scenario, the phase of the reflected wave will also be reversed in
comparison to the incident wave. The presence of a defect can be detected by either
the increase in the reflected signal or the reduction in the transmitted signal. Since the
velocity of sound within the material is known the time taken for the transmitted
signal to propagate through the material and reflect from the defect back to the
receiver can be used to calculate the defect position. By studying the nature of the
signal it is often possible to infer further information concerning the type of defect
present.
Ultrasonic inspection is essentially a point technique; only the region in the immediate
vicinity of the transducer is irradiated with ultrasonic energy. Therefore the
transducer must be scanned over the surface of the specimen under test. This
procedure can be automated or performed manually. Automated scanning provides an
accurate permanent record of the defect but it is time consuming and expensive. It is
also very challenging on curved or complex geometries. Manual scanning is faster
and more flexible but no permanent record of the scanning is available and the
inspection reliability is highly dependent on human factors (Lemaitre et al, 1996). In
the majority of inspections carried out by Rolls-Royce Submarines and within the

Ultrasonic Inspection
_____________________________________________________________________ 15
nuclear industry generally the benefits of completing a high integrity automated
inspection outweigh the cost implications. This approach has been adopted to
generate the experimental data reviewed later in this document.
Under most circumstances a coupling medium is also required between the transducer
and the component. As previously mentioned there is a large acoustic impedance
mismatch between the solid and air. This allows defects to be detected within the
solid material but reduces transmission between the transducer and the component
under test. This air gap must generally be eliminated to effectively couple the
transducer to the component. This can be achieved by immersing the component in a
water tank. However, this is usually unsuitable for particularly bulky specimens or
when the specimen cannot be moved. Alternatively a coupling medium, usually a gel
or water, can be used. Lack of coupling is a common cause of poor results and care
must be taken to ensure good ultrasonic contact is maintained throughout the test.
Ultrasonic energy can travel through a material in a number of different ways. The
main wave modes relevant to this testing will be discussed. If we first consider a
1-dimensional case for a small element of length, l, and density, ρ, undergoing an
elongation of u∂ due to an external force, F in the positive x-direction. The external
stress is given by equation (2.9), where A represents the area of the element:
AFp = (2.9)
Hooke’s law can be written as:
εEp = (2.10)
Where E = Young’s Modulus
ε = Strain

Ultrasonic Inspection
_____________________________________________________________________ 16
Assuming small strains only, then:
xu
lu
∂∂
=∂
=ε (2.11)
Newton’s second law can be written as:
2
2
tu
xp
∂∂
=∂∂ ρ (2.12)
The 1-dimensional wave equation is then obtained by combining Hooke’s law with
equation (2.12):
2
2
2
2
tu
Exu
∂∂
=∂∂ ρ (2.13)
The velocity of the wave is given by:
ρEc = (2.14)
By substituting equation (2.14) into equation (2.13), we can rewrite the wave equation
as:
2
2
22
2 1tu
cxu
∂∂
=∂∂ (2.15)
It is possible to show that this result can be then be extended to 3-dimensions, this is
provided in standard texts (Cheeke, 2002; Schmerr, 1998) and shown in vector
notation in equation (2.16)
2
22 )()(
t∂∂
=•∇∇++∇uuu ρμλμ (2.16)

Ultrasonic Inspection
_____________________________________________________________________ 17
Liquids cannot support shear stresses and therefore only support longitudinal or
compression waves and the bulk modulus of the material should be considered,
whereas solids offer elastic resistance to shearing forces, therefore, solids can support
both longitudinal and shear or transverse waves. In solids, the compression modulus
of the material, which is a combination of the bulk modulus and the shear modulus, is
used. In longitudinal wave propagation the particle displacement is in the same plane
as the direction of wave propagation. In shear waves the particle displacement is
perpendicular to the direction of the wave propagation and can occur in two
orthogonal polarizations. Solids can support both vertically and horizontally
polarized shear waves. However, due to their mode of operation, piezoelectric
transducers typically are used to produce vertically polarized shear waves only and
this type of wave has been used throughout the experimental work detailed in this
thesis.
Separation of the longitudinal and transverse wave modes can be achieved by the
Helmholtz decomposition (Lowe, 1992). The displacement vector is decomposed into
a scalar function Θ to represent the longitudinal wave, and a vector function ψ, to
represent the shear wave.
ψ×∇+Θ∇=u (2.17)
The 3-D wave equation in (2.16) can then be satisfied if the functions Θ and ψ satisfy
the following equations:
012
22 =
∂Θ∂
−Θ∇tcL
(2.18)
012
22 =
∂∂
−∇tcS
ψψ

Ultrasonic Inspection
_____________________________________________________________________ 18
which have two distinct wave speeds, which can be described in terms of the Lamé
constants: λ and µ:
ρμλ 2+
=Lc (2.19)
ρμ
=Sc (2.20)
The Lamé constants are related to Young’s modulus, E, and Poisson’s ratio, ν by the
following equations:
)21)(1( υυ
υλ−+
=E (2.21)
and )1(1 ν
μ+
=E (2.21)
When propagating at a sufficient distance from the material boundaries that no
interaction between the wave and material boundaries occurs, both shear and
longitudinal waves act as in an infinite medium and are known collectively as bulk
waves.
Solid materials also support Rayleigh waves which travel along the surface of the
solid. Rayleigh waves propagate with a mixture of longitudinal and shear wave
motion. Therefore, the particle motion of a Rayleigh wave is elliptical, with the major
axis of particle displacement perpendicular to the direction of propagation. Rayleigh
waves are constrained to exist in only 2-dimensions and only extend a distance
approximately equal to one wavelength into the material. Rayleigh waves follow the
surface geometry of a part; the waves can travel long distances but are damped by
surface roughness and by any moisture that is present on the material surface (Auld,
1973b; Cheeke, 2002; Krautkramer & Krautkramer, 1983; Schmerr, 1998).

Ultrasonic Inspection
_____________________________________________________________________ 19
Ultrasonic waves obey Snell’s law at a material interface. Snell’s law is provided in
equation (2.22).
2
1
2
1
sinsin
vv
=θθ (2.22)
Where θ1 = Angle in material 1
θ2 = Angle in material 2
v1 = Propagation velocity in material 1
v2 = Propagation velocity in material 2
The angle of refraction within a given material is different for each of the different
types of wave modes that propagate through a material. This is because each of the
different wave modes propagates with a different velocity through the material.
Therefore different modes can be excited within a component by changing the angle
of incidence of the transducer. This is shown the schematic diagram in Fig 2-2 for an
inspection in immersion where the incident angle is given by θi, and the angle of the
longitudinal and shear waves are θl and θs respectively. The generation of a shear
wave within a solid from an incident longitudinal wave is known as refractive mode
conversion. In immersion testing this is achieved by simply moving the transducer
relative to the component. In contact testing a wedge of material (typically Perspex or
similar) is introduced between the transducer and the component. The relative
intensity of the different wave modes within a solid is dependent on the angle of
incidence. The incidence angle of the transducer can be optimized to detect a certain
type and position of the defect.

Ultrasonic Inspection
_____________________________________________________________________ 20
θi θi
θs
θl
Water
Steel
Figure 2-2 Schematic diagram of refraction at a boundary between water and steel.
If the angle of the incident longitudinal wave is gradually increased the angle of the
refracted longitudinal wave also gradually increases. At a certain angle, known as the
first critical angle, the angle of the refraction of this wave is equal to 90º. At this
incident angle only a bulk shear wave is generated in the material. If the angle of
incidence is increased further the refracted shear wave will also eventually reach 90º,
this point is known as the second critical angle. As the refraction angle is increased
further still the Rayleigh wave angle is reached, at this point there is only a surface
wave generated within the material. The first and second critical angles can be
readily calculated from equation (2.22). At an angle just below the first critical angle
a creep wave or subsurface longitudinal wave is generated in the material.
Within the solid test medium, reflective mode conversion can occur at the boundary
of the component. If a longitudinal wave is incident on a boundary at a given angle of
incidence then a longitudinal wave will be reflected at an angle equal to the angle of
incidence; a shear wave will also be generated at a different angle. As in the refracted
case the relative intensity of the two reflected waves will depend on the angle of
incidence. The same phenomenon occurs for an incident shear, both shear and

Ultrasonic Inspection
_____________________________________________________________________ 21
compression waves being reflected from the surface at different angles and intensities.
The reflection coefficients for longitudinal and shear waves at the boundary between
steel and air is provided in Fig 2-3. These reflection coefficients have been calculated
using the software package Spectrum (Spectrum; Pialucha, 1992). The case for an
incident longitudinal wave is shown in Fig2-3a and that for an incident shear wave is
provided in Fig 2-3b.
a.)
b.)
Figure 2-3 The reflection coefficients for longitudinal and shear waves at the boundary between steel and air, a.) for an incident longitudinal wave and b.) for an incident shear wave.
0
0.2
0.4
0.6
0.8
1
1.2
1.4
1.6
1.8
2
0 10 20 30 40 50 60 70 80 90Shear Wave Angle of Incidence (Degrees)
Ref
lect
ion
core
ffici
ent
Reflected Longitudinal Wave (RL)
Reflected Shear Wave (RS)
SteelAir
S RS
RLθ
0
0.2
0.4
0.6
0.8
1
1.2
0 10 20 30 40 50 60 70 80 90Longitudinal Wave Angle of Incidence (degrees)
Ref
lect
ion
Coe
ffici
ent
Reflected Longitudinal Wave (RL)
Reflected Shear Wave (RS)
θLRS
RL
SteelAir

Ultrasonic Inspection
_____________________________________________________________________ 22
Further information on ultrasonic wave propagation and testing is provided in
standard reference textbooks (Birks & Green, 1991; Drury; 1983; Henneke et al,
1991; Krautkramer & Krautkramer, 1983).
2.2. Ultrasonic Phased Arrays
Historically ultrasonic inspection has been performed using individual transducers;
these have been reviewed in a range of texts (Krautkramer & Krautkramer, 1983;
Birks & Green, 1991). A single transducer can be used to complete testing in pulse-
echo where the transducer is used as both a transmitter and receiver. Pitch-catch and
through transmission inspections have also been developed where separate transmitter
and receiver probes are used. In each of these techniques fixed angle transducers are
used, which insonify a limited inspection volume within the component under test.
All of these are point techniques and the probes must be mechanically scanned to
build up an image of the component. If defects can occur at different orientations, as
is commonly the case in metallic structures, then the inspection must be repeated with
a number of different angle probes.
Phased arrays are arrangements of small individual transducers, which are referred to
as the elements of the array. The arrangement of the elements within the array
controls its basic operation. Linear arrays, shown in Fig 2-4a, are also referred to as
1D arrays; this type of array allows beam steering and focusing anywhere within a 2D
imaging plane. Planar or mosaic arrays, shown in Fig 2-4b, contain a number of
elements that are arranged in a 2D grid, some work has been done on the optimization
of the grid configuration (Martinez et al, 2003; Norton, 1992; Mondal et al, 2005).
This type of array allows beam steering and focusing anywhere in a 3D inspection
volume. Annular arrays, shown in Fig 2-4c, are circular, these arrays do not allow
beam steering but they do provide variable focal depth capability. Different array
designs are reviewed in detail elsewhere (Drinkwater & Wilcox, 2006; Shung, 2002).

Ultrasonic Inspection
_____________________________________________________________________ 23
Figure 2-4 Common array transducer configurations: (a) linear array, (b) 2D array and (c) annular array, figure taken from (Drinkwater & Wilcox, 2006).
The manufacture and operation of 2D arrays is relatively complex, thus increasing
cost and difficulty of production. Also limitations in array controller technology and
computing power mean that the size of arrays is currently limited to a relatively small
number of elements. Therefore, although some applications have been reported
(Casula et al, 2005; Akhnak et al, 2002), they are yet to find widespread use in
industry. In many inspections defects can occur at a range of angles. Beam steering
is therefore important and so annular arrays find limited application. At the current
time linear arrays are by far the most commonly used in industrial NDE.
Linear arrays typically contain a number of rectangular array elements arranged side
by side. Elements within the array are normally relatively long and narrow so that
they behave approximately like line sources. A perfect line source would generate a
semi-cylindrical wavefront. However, the element has a finite width, this reduces the
amount of beam spread and hence the width of the beam generated. The length of the
element, the y-dimension in Fig 2-4, is significantly greater than the wavelength thus
minimizing acoustic beam-spread in this dimension.
Elements within the transducer array are typically made from a similar
piezocomposite material to their modern single element counterparts. Each element

Ultrasonic Inspection
_____________________________________________________________________ 24
in the phased array is electrically isolated from its neighbours. This is achieved by
connecting each element with an individual electrical delay line; these delay lines are
then all connected to a multiplexer. This allows each element to be independently
addressed, providing beam steering and focusing in both transmission and reception.
As the ultrasound is generated in the same way as for single element probes, similar
requirements exist to couple the ultrasound into the component. Testing must once
again be performed using some form of suitable coupling medium to prevent large
interface reflections.
The beam profile generated by a single element probe is controlled by the mechanical
design of the probe. The field generated by the probe is fixed and cannot be changed.
Phased array transducers are much more flexible, and they can typically be used to
mimic the fields generated from a range of different single element probes. This
flexibility means that a wide range of testing regimes can be implemented with a
single phased array transducer. Individual elements or a group of elements (termed
the aperture) can be fired in-phase with one another to generate a plane wave within a
component. Alternatively different delays can be applied to each element to steer or
focus the beam. A different set of delay laws (or focal laws) is required for each
different test case.
The array operation is shown for the simple case of beam steering in the schematic
diagram provided in Fig 2-5. In order to generate the plane wavefront indicated by
the solid blue line in Fig 2-5 the timing delays applied to two adjacent elements must
be suitably controlled to ensure that constructive interference occurs along this line.
The signal from the first element must travel a distance a calculated from equation
(2.23) before the second element is fired. The time delay t, required for a wave to
travel this distance at a velocity c, within the test medium is then found from equation
(2.24)
θcospa = (2.23)
c
pt θcos= (2.24)

Ultrasonic Inspection
_____________________________________________________________________ 25
Figure 2-5 Schematic diagram of the required time delays to generate an angled beam using a phased array.
To allow a phased array to be used to detect small scattering objects in pulse-echo
mode, a sharp, narrow pulse of ultrasonic energy is required in the time domain. To
achieve this desired output, a wide bandwidth transducer is typically used, containing
a large range of frequencies. The ultrasonic output of the array is controlled through
the transducer design and control of the electrical signal used to excite the transducer.
The individual elements within the phased array transducer operate in the thickness
mode. Therefore individual elements are prepared so that the thickness of the element
corresponds to half the ultrasonic wavelength of the desired operation. Therefore the
fundamental operating frequency, f0, of the phased array is given by equation (2.26).
The drive signal used to generate the ultrasonic signal should be well matched to both
the centre frequency and the bandwidth of the array to ensure efficient ultrasonic
wave generation and optimum performance.
dcf
20 = (2.26)
Where c = Velocity
d = Thickness

Ultrasonic Inspection
_____________________________________________________________________ 26
One potential issue found when using phased array transducers is the appearance of
grating lobes. These can occur in arrays with regularly spaced elements and are due
to constructive interference between the signals transmitted from each element.
Grating lobes are a characteristic of any phased array transducer and depend on
element pitch, frequency and bandwidth (RD Tech, 2004). The angle at which the
grating lobes exist is given by equation (2.27) (Wooh & Shi, 1999).
⎟⎟⎠
⎞⎜⎜⎝
⎛−= −
pm
steeringgratingλθθ sinsin 1 (2.27)
Where θsteering = Array steering angle (in radians)
m = Integer (±1, ±2, …)
λ = Wavelength
p = Element pitch
The critical element pitch to ensure that no grating lobes exist is then given by
equation (2.28). In order to eliminate grating lobes under all operational conditions
an element pitch of ≤λ/2 must be adopted.
max)sin(1 steeringcriticalp
θλ
+= (2.28)
The effect of grating lobes can be clearly seen in the CIVA screen shots shown in
Fig 2-6. In Fig 2-6 a 2MHz centre frequency, 64 element contact phased array
transducer on a stainless steel load is simulated. The longitudinal wavelength (λL) in
stainless steel at the centre frequency of the transducer is approximately 2.9mm and
the shear wavelength (λS) is 1.5mm. In all of the simulations suitable delay laws are
selected to generate a 45º shear wave in the stainless steel component, which
represents a challenging inspection for this type of transducer. In Fig 2-6a an element
pitch of 1.5mm or λS is simulated; and a grating lobe is clearly observed. The image
in Fig 2-6b shows the performance of an array with an element pitch of 0.75mm or
λs/2, this array meets the critical element pitch requirement and no grating lobes are
observed.

Ultrasonic Inspection
_____________________________________________________________________ 27
a.)
b.)
Figure 2-6 CIVA beam plots for a 2MHz centre frequency contact array on a stainless steel block producing a 45º shear wave with an element pitch of a.) 1.5mm and b.) 0.75mm. Both images are shown with a dynamic range of 40dB.
When using single element transducers the probes must be mechanically scanned
across the surface of the component to provide complete test coverage. Mechanical
scanning of a component is a laborious and time-consuming task. The accuracy and
repeatability of the scanning process can be improved through automation. Data
collection and storage can also be automated, which improves the overall reliability of
the inspection procedure. However, the scanning process must still be carried out for
each scan angle and the overall time requirement remains high. The scanning process
can be made significantly faster and more flexible by using a phased array transducer.
Scanning can be performed electronically by sequentially addressing different
Main Beam
150mm
0mm
Main Beam Grating Lobe
80mm
0mm
80mm
0mm
150mm
0mm

Ultrasonic Inspection
_____________________________________________________________________ 28
elements with a set of delay laws. Electronic scanning is only limited by the pulse
repetition frequency (PRF) associated with the inspection. The PRF is the maximum
rate at which consecutive excitation pulses can be generated. Because of this,
electronic scanning is typically an order of magnitude faster than mechanical scanning
(RD Tech, 2004).
Phased array transducers can also be used to inspect components in ways that are not
typically possible using standard single element transducers. Applying a set of delay
laws to an aperture generates a beam at a given angle. By updating the delay laws the
angle of the beam generated can be modified, this process can be repeated to complete
an angular sweep, or a sector scan. An example of a sector scan is shown in Fig 2-7
for the inspection of three SDH defects (Long & Cawley, 2006). This is particularly
useful if defects can occur over a range of angles within the component. However,
the phased array must be mechanically raster scanned so that each region of the
component is insonified by beams at a range of different angles. This approach
ensures that defects with different tilts can be detected. If only a particular region of
the component is of interest then inspection performance can be further improved by
modifying the delay laws further to provide some focusing.
Figure 2-7 Sector scan of three side drilled hole (SDH) defects, figure taken from (Long & Cawley, 2006).
The beam characteristics of phased array transducers are dependent on a number of
parameters. Each of these parameters must be carefully controlled in order to
optimize the performance of the array in a given application. Wooh and Shi (1999)
and Azar et al (1998) have reviewed the influence of each of these parameters. This
demonstrates that control of element width, inter-element spacing and number of
SDH defect response
Backwall signal

Ultrasonic Inspection
_____________________________________________________________________ 29
array elements is essential. These parameters are typically controlled during array
manufacture and cannot be adjusted at a later time. The practical uses of any array
are therefore limited; given these limitations array manufacturers have developed
guidelines for use of their product (RD Tech, 2004). When high angled beams are
required it is typically recommended to angle the transducer relative to the component
test surface in the same manner as used for single element transducers.
There are similar practical restrictions to beam focusing. As with single element
transducers there is a near field length associated with a phased array transducer. The
near field length for a circular transducer can be found from the relationship shown in
equation (2.29), this simplifies when the aperture diameter is much greater than the
wavelength of operation (Krautkramer & Krautkramer, 1983). It is only possible to
focus at distances less than this near field length. It is possible to increase the
potential focal length of the array by using a larger aperture or larger array but due to
access restrictions this is not always possible in practice. The maximum size of the
array is also limited by the number of channels that can be addressed by the phased
array controller and the element pitch.
λ
λλ
4
42
22
Dz
Dz
≈
−=
(2.29)
Where z = Near field length
D = Aperture diameter
λ = Wavelength
Typically phased arrays are used to replicate single element transducer inspection
procedures. A set of fixed delay laws are used to replicate each angle beam and a
specific acoustic parameter is recorded at each measurement position. A trained NDT
practitioner monitors the data recording process in real time. Although faster than the
equivalent single element transducer inspection this approach remains slow and must
be repeated for each desired parameter. In addition, using an ultrasonic phased array
in this way does not exploit the full potential of the array technology. Holmes et al

Ultrasonic Inspection
_____________________________________________________________________ 30
(2005) have reported a new approach to industrial array inspections, which uses a
technique known as Full Matrix Capture (FMC). This approach has been used in the
seismic field for some time (Berkhout, 1986) but until recent research work it has not
been used in the NDE field.
When operating in FMC mode the full matrix of time domain signals (A-Scans) from
each transmitter-receiver pair within the array is captured and stored. All data
processing can then be performed offline in post processing. By using this approach
it is only necessary to capture a single set of data, different algorithms can then be
applied to this data set in order to simulate each different test mode. This approach
also future proofs the inspection; as more advanced algorithms are developed they can
be applied to the same data set.
As part of this research activity algorithms have been developed that emulate
conventional phased array testing (Long et al, 2008). However, additional algorithms
that can only be practically implemented in post processing have also been developed.
The first of these is the total focusing method (TFM), in this technique the inspection
volume is discretized into a grid with a given resolution, the FMC data is then
processed to provide an effective focus at every point within the inspection volume
(Holmes et al, 2005). This could be achieved using a conventional approach but the
delay law calculation and the acquisition of data would be extremely time consuming.
One potential drawback of the FMC technique is degradation in the signal to random
noise ratio (SNR) due to the low acoustic power of the transmit signal for each
transmitter-receiver pair. Experimental work is ongoing within the Advanced NDE
NPCT project to quantify this effect and understand the potential benefits of
averaging to reduce this issue (Duxbury, 2009).
The TFM approach is particularly appropriate for small point like reflectors and has
been shown to out-perform other approaches in this type of inspection (Holmes et al,
2005). The TFM has been developed further into the vector TFM (VTFM) algorithm
(Wilcox et al, 2007). This allows the angular reflectivity characteristics of any point
in the inspection volume to be investigated. This provides valuable insight into the
orientation of any defect within the inspection volume and assists with defect
characterization. Another algorithm that has been developed using FMC data that
Ultrasonic Inspection
_____________________________________________________________________ 31
cannot be implemented using single element transducers is the Almost Total Focusing
Method (ATFM) (Long et al, 2008). The ATFM technique provides a fully-focused
B-Scan image from an aperture within the array. Hunter et al (2009) have
demonstrated that for the inspection of planar defects occurring over a limited range
of angles the ATFM algorithm provides an improved inspection capability in
comparison to the TFM technique.
2.3. Inspection of Components with Irregular Surface
Geometry
In industrial situations non-destructive inspections must often be performed on
components with complex geometries. In the target application, discussed in greater
detail in chapter 3, a circumferential pipe weld is to be inspected. In this type of
component defects may occur that are associated with the welding procedure. These
defects typically occur at a range of angles and have significant through-wall extent.
Inspection for this type of defect is usually carried out using fixed angle, rigid wedge
coupled transducers. A series of scans are performed using probes with different
angles optimized for the detection of different defects. As previously mentioned
phased array probes could be used to reduce the amount of axial scanning and the
number of different probes required. This would improve the speed, and potentially
the reproducibility of the inspection. However, phased array transducers typically
have a significantly larger footprint than single element transducers. Maintaining a
uniform couplant layer between a rigid phased array and the component under test can
therefore be challenging, especially on rough or irregular surfaces.
When inspecting pipe welds of the type in the target application some inspection
techniques require the transducer to be placed above the weld itself. It is not possible
to effectively couple rigid, wedge-coupled transducers to this region due to the curved
nature of the weld cap. Typically, inspection coverage is achieved by removing the
weld cap from the weld region. Weld cap removal is an expensive, time-consuming
task that can compromise the integrity of safety critical pipe-work. In some cases it is
also possible that even when the weld cap has been removed that the inspection
surface is not completely flat due to material distortion caused as part of the weld
process. The optimum inspection would use a conformable phased array; this would

Ultrasonic Inspection
_____________________________________________________________________ 32
deliver the benefits derived from a phased array inspection without the need to
remove the weld cap. The phased array delay laws would need to be updated to
account for changes in the beam steering and focusing due to the presence of the weld
cap. It has been shown that severe degradation in inspection performance occurs if
delay laws are not correctly updated to accommodate irregular surface profiles (Long
& Cawley, 2006; Roy et al, 2002).
One approach developed by the Commissariat à l’Energie Atomique (the French
atomic energy commission) (CEA List, Saclay, France) uses a flexible contact array
(Chatillon et al, 2000); this is shown in Fig 2-8. In this device 28 array elements with
a centre-to-centre separation (pitch) of 1.4mm are arranged along two flexible wires.
The individual elements are then able to conform in the vertical direction to an
irregular profile. However, issues have been encountered with the degree of
flexibility that can be achieved using this device (Hunter et al, 2009; EPRI, 2004).
The location of the elements is measured using 7 linear profilometers positioned along
the length of the array. The delay laws for each individual element are updated based
on the surface profile measurements from the profilometers.
Figure 2-8 CEA flexible contact array (Chatillon et al, 2000).
The measurement of the surface profile of the component under test using the
profilometer technology from the CEA is patented. Imasonic (Besançon, France)
have recently obtained an exclusive licence for the use of this patent, which allows
Imasonic to design and manufacture the flexible contact transducers. Imasonic have

Ultrasonic Inspection
_____________________________________________________________________ 33
improved the robustness of the transducer and made it more suitable for industrial
application, an example of the Imasonic transducer is shown in Fig 2-9. It is also now
possible to readily replace elements if damage does occur during operation. Arrays
with centre frequency of 2 and 4MHz are now available with up to 32 elements.
(a)
(b)
Figure 2-9 Commercially available flexible arrays produced by Imasonic (Besançon, France).
An alternative approach using a membrane coupled phased array device has been
developed and was originally reported by Long and Cawley (2006). The development
of the membrane coupled phased array has been supported by Rolls-Royce and the
further development of this device along with its transfer to Rolls-Royce has formed a
significant part of my EngD research. In the membrane coupled device a standard
ultrasonic phased array is used but the rigid wedge is replaced by a water filled
standoff encapsulated within a low-loss rubber membrane. A photograph of the 1st
generation probe is shown in Fig 2-10a and a schematic diagram is provided in
Fig 2-10b. In this approach the surface profile is measured using the phased array
itself, the delay laws are then updated to accommodate the varying geometry. Long
and Cawley have shown that the delay law calculation using this approach is slightly
more complex but that the probe is significantly cheaper and more robust than the
CEA/Imasonic flexible probe (Long & Cawley, 2006).

Ultrasonic Inspection
_____________________________________________________________________ 34
(a)
(b)
Figure 2-10 1st generation membrane coupled phased array device a. photograph and b. device schematic diagram (Long & Cawley, 2006).
The membrane probe developed by Long and Cawley was designed to operate using
FMC data acquisition. When using the membrane coupled device a surface profile
measurement of the component under test must first be performed. This test is done
using the membrane probe itself. The surface profile can strongly influence the nature
of the ultrasonic beam pattern within the component. It is then possible to apply each
of the algorithms referenced above to the matrix of data obtained. The delay laws
used to generate each beam type must be updated to accommodate the nature of the
surface profile. The performance of a first generation membrane probe has been
demonstrated on a range of machined samples provided by Rolls-Royce (Long et al,
2007c).
The first generation membrane probe device contained a constant volume of water.
This approach ensures that there are no air bubbles within the water standoff and no
water movement to disrupt the transmission of ultrasonic energy. However, using this
approach the membrane cavity seal must be very high quality to prevent leakage of
water. When scanning the device on a pipe the force required to ensure good
coupling between the transducer and the component would vary depending on the
orientation of the transducer relative to the pipe. This would become an issue on a
horizontally oriented pipe when the transducer is scanning upside down. If the
membrane was highly pressurised it would also not be possible to maintain the angle
of the transducer relative to the component when scanning on and off the weld cap.
This approach has therefore not been used in the 2nd generation device. The 2nd
generation membrane probe (Long & Cawley, 2006; Long et al, 2007b), shown in
Fig 2-11 has been designed to maintain a constant water pressure within the standoff;
Fluid
Delrin housingPhased Array
Elastomer Membrane Non return valve

Ultrasonic Inspection
_____________________________________________________________________ 35
a header tank arrangement is used to achieve this. The 2nd generation membrane
device uses a linear 80 element, 1.25mm pitch, 2MHz centre frequency transducer.
The bespoke transducer design from Imasonic was modified to include an extended
flange, which was used to improve the seal between the array and the probe housing,
and ensure no leakage from the device during operation.
Figure 2-11 Second generation membrane probe (Long et al, 2007b).
The membrane used in the first generation membrane probe was a low-loss rubber,
sold commercially for use in ultrasonic wheel probes. The rubber was only available
in a limited range of thicknesses, none of which were ideal for the membrane probe
application. In the second-generation probe a polyurethane membrane is used; this
material can be cast into thin sheets of the desired thickness. The housing has also
been updated and improved to make the device more robust and to make changing the
membrane faster and more straightforward. Subsequent testing of the membrane
coupled device concept has been carried out on a specific target application, which is
discussed in chapter 3.
Weld Cap profile
Membrane Delrin housing
Linear Phased Array
Header tank feed

Ultrasonic Inspection
_____________________________________________________________________ 36
2.4. Summary
Ultrasonic inspection is a very well established NDE technique and is widely used for
a variety of measurements throughout industry. Typically existing inspection
techniques use rigid wedge single element transducers to produce a fixed angle and
focal depth ultrasonic beam. This is a point technique and the transducer must be
laboriously mechanically scanned over the component surface to build up an image of
the component volume. This scanning process must be performed with range of
different angled probes to provide information on defects with a range of orientations.
Ultrasonic phased array probes contain a number of individual transducer elements,
each of which is connected to an electrical delay line. By controlling the time delay
of the electrical signal to the individual elements it is possible to replicate the
performance of many different single element transducers using a single phased array
probe. It is also possible to generate an ultrasonic beam from an aperture within the
array and then electronically scan the component. This approach offers significant
improvements in terms of speed over conventional single element transducer
inspection. An alternative approach to phased array inspection is to use FMC data
acquisition. In this technique all of the possible inspection data from each transmitter-
receiver pair within the array is captured. Different beam forming algorithms can
then be applied to the dataset in post-processing. This approach allows the use of
inspection methods that cannot be applied using conventional techniques and provides
a mechanism to future-proof an inspection against further algorithm development.
Phased array transducers are typically much larger than single element transducers;
this allows a large area of the component under test to be scanned electronically from
a single transducer position. However, in order to provide a high quality inspection
the entire footprint of the array must be in intimate contact with the component under
test. This becomes very challenging on components with irregular surfaces. A
typical inspection problem that must be addressed by engineers at Rolls-Royce is the
inspection of welded components where the weld cap has not been removed. It is not
possible to scan rigid wedge-coupled transducers over this weld cap region. There are
two main alternatives to address this inspection requirement. The first is a flexible
contact array developed by the CEA and Imasonic. This device is commercially

Ultrasonic Inspection
_____________________________________________________________________ 37
available but issues have been encountered with the degree of flexibility that can be
achieved, the robustness of the transducer and its price. The alternative approach is
the membrane coupled phased array; this low cost, robust device uses a conventional
linear array which is coupled to the surface of the component under test via a water
path encapsulated in a low loss polyurethane membrane. This thesis focuses on work
carried out on the development of this membrane coupled device.
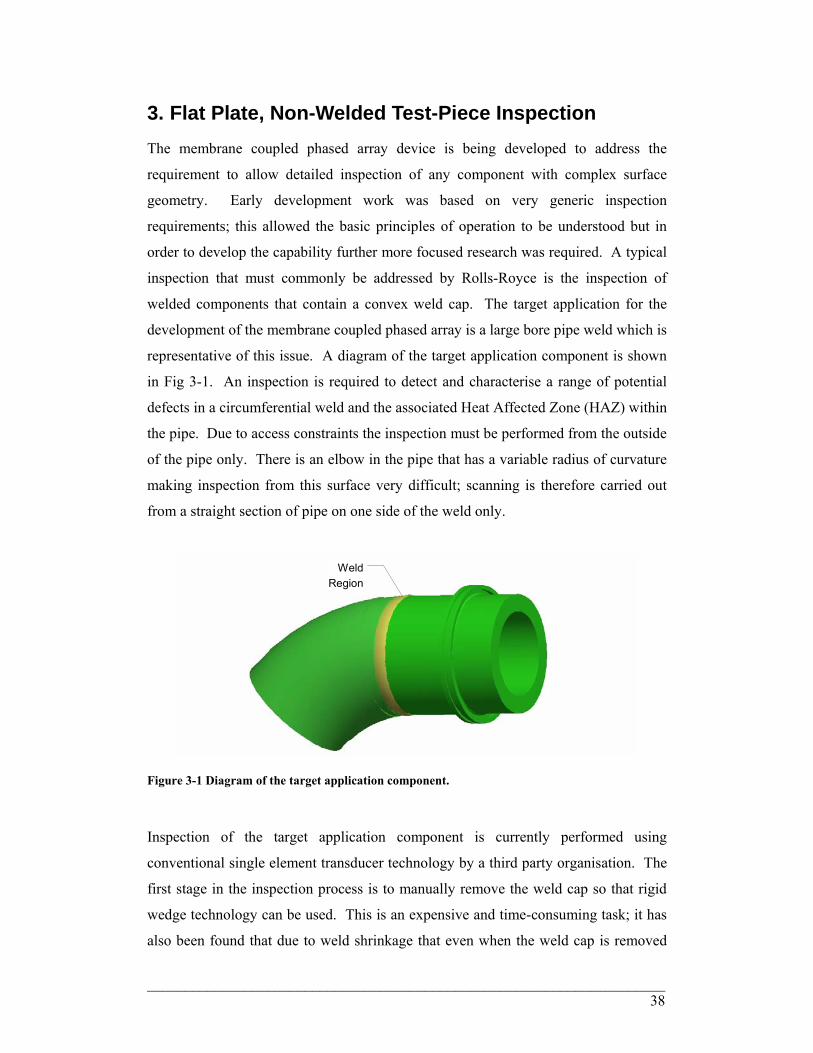
_____________________________________________________________________ 38
3. Flat Plate, Non-Welded Test-Piece Inspection The membrane coupled phased array device is being developed to address the
requirement to allow detailed inspection of any component with complex surface
geometry. Early development work was based on very generic inspection
requirements; this allowed the basic principles of operation to be understood but in
order to develop the capability further more focused research was required. A typical
inspection that must commonly be addressed by Rolls-Royce is the inspection of
welded components that contain a convex weld cap. The target application for the
development of the membrane coupled phased array is a large bore pipe weld which is
representative of this issue. A diagram of the target application component is shown
in Fig 3-1. An inspection is required to detect and characterise a range of potential
defects in a circumferential weld and the associated Heat Affected Zone (HAZ) within
the pipe. Due to access constraints the inspection must be performed from the outside
of the pipe only. There is an elbow in the pipe that has a variable radius of curvature
making inspection from this surface very difficult; scanning is therefore carried out
from a straight section of pipe on one side of the weld only.
WeldRegion
Figure 3-1 Diagram of the target application component.
Inspection of the target application component is currently performed using
conventional single element transducer technology by a third party organisation. The
first stage in the inspection process is to manually remove the weld cap so that rigid
wedge technology can be used. This is an expensive and time-consuming task; it has
also been found that due to weld shrinkage that even when the weld cap is removed

Flat Plate, Non-Welded Test-Piece Inspection
_____________________________________________________________________ 39
the top surface of the component is still slightly irregular. This prevents complete test
coverage and increases the time and cost associated with the inspection. Once the
weld cap has been removed the current inspection is then performed using a large
number of different single element probes to generate beams with a range of angles
and focal lengths.
The time and cost associated with completing the inspection of the target application
could potentially be improved by using a conventional rigid wedge phased array.
This would allow multiple beams to be generated using a single phased array probe.
Electronic scanning could also be used in place of some mechanical axial scanning to
increase inspection speed. However, the weld cap would still need to be removed to
allow inspection coverage. The larger footprint associated with the conventional
phased array would make it more challenging to maintain a uniform couplant layer
due to weld shrinkage. Therefore in order to achieve the benefits associated with
phased array inspection but maintain, and ideally improve, the inspection coverage
with the weld cap in place the membrane coupled phased array has been developed.
The target of this work is also to minimise the amount of mechanical axial scanning
required to complete the inspection; this will improve inspection speed and potentially
reduce manipulator complexity. To achieve this aim a large footprint phased array
transducer is used.
In this chapter the inspection development process will be reviewed, this includes the
design and manufacture of suitable flat plate, non-welded test-pieces. These test-
pieces did not contain an actual weld but did have weld metal deposited on their
surfaces to produce a weld cap representative of that found in the target application.
During the early phase of development the non-welded test-pieces were used as this
eliminated many of the additional challenges caused by the presence of austenitic
weld material. However, because these test-pieces did contain a representative weld
cap it allowed the mechanical challenges of conforming to the complex geometry of
the component to be addressed in isolation. A detailed review of the inspection
techniques used to detect each of the defects embedded into the flat plate, non-welded
test-pieces will then be carried out. A comparison between the performance of the
membrane coupled device and conventional inspection techniques is then provided in
section 3.4.

Flat Plate, Non-Welded Test-Piece Inspection
_____________________________________________________________________ 40
3.1. Test-Piece Development
Development of the 2nd generation membrane coupled device was performed by
producing inspection procedures to achieve complete inspection of the target
application component. I started this development process by completing a thorough
review of the current inspection procedure used on the target application and on
similar inspections (Rolls-Royce, 2001a; Rolls-Royce 2002b). In the current
inspection the weld cap must be removed in order to provide the required test
coverage (Rolls-Royce, 2001b). Removal of the weld cap is a time consuming,
manual process which can also impact the structural integrity of the component.
Removal of the weld cap can expose small buried flaws which subsequently must be
removed by further grinding. Weld metal is also typically softer than the parent
material leading to a potential risk of undercut and an unacceptable reduction in
component wall thickness. Weld cap removal when the component is already in
service can be even more difficult due to reduced access to the component. It is
therefore desirable to test the components in service with the weld cap in place.
As shown in Fig 3-1 the target application is a stainless steel section of pipe-work that
contains an austenitic weld with a convex weld cap. The presence of the austenitic
weld introduces two main areas of complexity in terms of the ultrasonic inspection.
The first challenge is associated with the irregular surface geometry of the component
under test and the second issue is related to the grain structure within the weld.
Therefore in order to simplify the inspection development process two flat plate non-
welded test-pieces were produced. These test-pieces were manufactured from a single
plate of stainless steel with a wall thickness of greater than 50mm. The wall thickness
of the flat plate test-pieces was selected to replicate that of the actual target
application component. Unfortunately, due to security restrictions associated with
this development work it is not possible to provide further details of the component
geometry. Specifically it is not possible to provide the exact wall thickness or
diameter of the pipe-work. Weld metal was deposited onto the surface of the two flat
plates to produce an undressed weld cap representative of that found in the target
application. A tungsten inert gas (TIG) welding process was used that is
representative of the actual weld procedure (BAE Systems, 1986). Two test-pieces
were produced so that each individual test-piece could be manually moved. The

Flat Plate, Non-Welded Test-Piece Inspection
_____________________________________________________________________ 41
target application pipe surfaces are assumed to have internal and external surfaces
machined concentrically and to have a surface roughness of 6.4μm or better. The flat
plate, non-welded test pieces will be machined to a similar surface roughness.
The goal of this inspection is to reliably detect and size all the defects described in the
defect description document (Rolls-Royce, 2006c) with the undressed weld-cap in
place. The defect description document describes nine different defect types
including both planar and volumetric defects of different sizes. The two flat plate
non-welded test-pieces have been designed to include examples of the worse case
planar defects considered credible based on the defect description document.
The amplitude of the ultrasonic response from planar defects is highly dependent
upon the angle at which ultrasound impinges upon the defect. Therefore in order to
accurately detect planar defects the ultrasonic technique must be carefully controlled.
Detection of the volumetric defects such as porosity and inclusions is generally
simpler because the ultrasonic beam to defect orientation is much less critical.
However, volumetric defects such as porosity are often small, also in the case of
inclusions there is only a small change in acoustic impedance between the defect and
the parent material, therefore the amount of ultrasonic energy reflected from the
defect can be limited. In both cases this leads to a defect signal with low amplitude.
These are fundamental limitations of ultrasonic inspection and are not specific to the
membrane coupled device. This issue is not being specifically addressed at this stage
in the development of the conformable array. It is also not possible to intentionally
embed volumetric defects into the non-welded test-pieces and this type of defect has
not been included in the test-pieces developed at this stage. Planar defects with
significant through wall dimensions are considered to be a greater risk from a
structural integrity standpoint. Therefore only planar defects are included in the two
flat plate, non-welded test-pieces.
All of the defects included in the test-pieces are described in Table 3-1. The
postulated shape of all defects is elliptical with a 2:1 aspect ratio (length to
through-wall extent) and it is assumed that elliptical flaws have their major axis
parallel to the direction of the weld (Rolls-Royce, 2006c). The through-wall extent of
the defects is based on the approximate height of two weld beads. Based on the

Flat Plate, Non-Welded Test-Piece Inspection
_____________________________________________________________________ 42
welding procedure document (BAE Systems, 1986) two weld beads equates to
approximately 3-4.2mm. The choice of 4mm as the target through-wall defect size is
therefore somewhat arbitrary but is chosen to provide a challenging target for the
ultrasonic phased array system. Schematic diagrams of the six different defects are
provided in Fig 3-2, defects 1-3 are contained within evaluation block 1 (Rolls-Royce,
2006a) and defects 4-6 are contained in evaluation block 2 (Rolls-Royce, 2006b). In
both test-pieces the defects are separated from the side-wall of the test-piece by at
least 60mm, each defect is then also separated from its nearest neighbour by 60mm.
This approach ensures that each defect can be imaged individually which simplifies
the data interpretation process. A photograph of the two test-pieces is shown in Fig 3-
3. Defects 1, 2 5 and 6 are elliptical with a size of 4mm x 8mm and have been
produced by electro-discharge machining (EDM). In the case of the two mid-weld
defects artificial flat bottomed hole (FBH) defects were drilled into the test pieces
with a diameter of 5.6mm. This approach produces a defect with a comparable cross
sectional area to the elliptical 4mm x 8mm defects. This drill hole is indicated by the
dotted line in Fig 3-2c and 3-2d.
Table 3-1 Defect Description for flat plate, welded test-pieces
Defect Number Type of Defect Location Tilt Skew
1 Lack of root fusion Centreline of simulated weld region - inner surface breaking 0° 0°
2 Lack of sidewall fusion Along lower simulated weld fusion face - inner surface breaking 25° 0°
3 Lack of sidewall fusion Along lower simulated weld fusion face - at highest point of 25° prep angle from inner surface 25° 0°
4 Lack of sidewall fusion Along upper simulated weld fusion face - at lowest point of 10° prep angle from outer surface 10° 0°
5 Lack of sidewall fusion Along upper weld fusion face - outer surface breaking 10° 0°
6 Structurally significant planar defect derived
from LEFM1
Centreline of simulated weld - under weld cap with ligament of 2-5mm to outer surface 0° 0°
Notes
1. LEFM – Linear Elastic Fracture Mechanics

Flat Plate, Non-Welded Test-Piece Inspection
_____________________________________________________________________ 43
a.)
4.0
Defect 1
Weld Profile
b.)
Defect 2
4.0
Weld Profile
c.)
Defect 35.6
Weld Profile Drill hole
d.)
Defect 4
Weld Profile5.6 Drill hole
e.)
Defect 5
4.0Weld
Profile
f.)
Defect 6
4.0Weld
Profile
Figure 3-2 Schematic diagram of defects contained in the conformable phased array non-welded evaluation blocks, a.) defect 1, b.) defect 2, c.) defect 3, d.) defect 4, e.) defect 5, f.) defect 6.
Figure 3-3 Photograph of the two flat plate, non-welded test-pieces.
Each of the defects described in Table 3-1 was artificially introduced into the non-
welded test-pieces during manufacture. Defects 1-4 and 6 were introduced prior to
adding the weld cap, in the case of defects 1-4 this approach made manipulation of the
test-pieces more straightforward, whereas defect 6 had to be added before welding to
Evaluation Block 2
Evaluation Block 1

Flat Plate, Non-Welded Test-Piece Inspection
_____________________________________________________________________ 44
produce the required ligament. Defect 5 was embedded after the artificial weld cap
had been deposited to ensure that the defect occurred at the weld toe. All of the EDM
work and the deposition of the weld cap were performed by Rolls-Royce personnel.
The width of the surface breaking flaws is the separation (“gape”) between the flaw
faces. It is assumed that these faces are not under any significant compressive stress;
this assumption is valid given the manufacturing process. When developing the test-
pieces to demonstrate the techniques described in this document a best endeavour
attempt was made to accurately produce these flaws with a gape as described in the
defect description document (Rolls-Royce, 2006c). However, the actual gape of each
defect within the test-pieces is dictated by the machining technique used. The gape of
the defects produced by EDM is likely to be approximately 300µm for all of the
defects. Mid-wall defects in non-welded components can only be produced by
drilling a FBH at a suitable angle. However, by using this technique the gape of the
flaw will no longer be representative of the actual defect. More realistic embedded
defects will be used in the manufacture of flat plate welded test-pieces. The
inspection of these welded test-pieces is discussed in Chapter 6.
The defect description document (Rolls-Royce, 2006c) states that all defects will have
a roughness of 13-37µm. Surface roughness tends to reduce the amplitude of any
specular reflection but can also improve defect detection when insonified at oblique
incidence. This is because the defect has facets at a range of different angles, some of
which may be orientated favourably for detection. Surface roughness only causes a
significant reduction in the surface reflectivity if the roughness is greater than
approximately 10% of the wavelength (Ogilvy, 1991). Even when considering the
maximum frequency content, and hence minimum wavelength, of the ultrasonic pulse
used in the inspection the maximum surface roughness is expected to be 2.5% of the
longitudinal wavelength and 5% of the shear wavelength. Therefore the expected
defects can be considered ultrasonically smooth and the artificial defects included in
the test-pieces can be considered representative.
Flaws occurring in the actual target application can occur at a range of tilts and skews.
If the major axis of the flaw is taken to lie in the plane of the flaw, such that it is
parallel to the direction of the weld, the tilt is then measured as a rotation of the flaw
Flat Plate, Non-Welded Test-Piece Inspection
_____________________________________________________________________ 45
about its major axis. Skew is measured as a rotation of the major axis about the local
surface normal. A longitudinal (circumferential) flaw is taken to have 0º skew. The
orientation of all of the flaws in the non-welded test pieces is accurately known.
Although the exact tilt and skew of the six defects in the flat plate test piece are
known the inspection techniques developed must be capable of dealing with a variety
of defect orientations. Defects have been produced within the flat plate, non-welded
test-pieces at a range of tilts but all defects have a nominal skew of 0˚. This approach
was used because it is postulated that all possible defects within the target application
component will occur along the weld and the defect skew will not vary.
Consideration of defects with different skew angles is therefore not included in this
thesis. When using transducers with a finite aperture size to detect real planar defects
of finite size and imperfect smoothness a specular reflection will occur over a small
range of angles. Toft (Toft, 1987) has shown experimentally that defect
misorientation of about 15º tilt or skew gives a defect response within 6dB of the
response obtained from a defect with perfect orientation. Scanning at additional
angles was therefore not performed on the flat plate, non-welded test-pieces. One of
the benefits of the phased array test approach is that scanning at more angles can
easily be incorporated with minimal increase in time and without adding any
additional scanning requirements or capital cost to the inspection, particularly if FMC
data acquisition is used. The use of FMC data acquisition was discussed in detail in
chapter 2. However, scanning additional angles using a single element test approach
necessitates the use of additional scan for each new test angle and the purchase of a
new wedge to generate each of the different angles.
3.2. Technique Description
At the start of the inspection development process I identified a primary detection
technique for each of the defects present within the flat plate, non-welded test-pieces.
The focus of this work is to develop the membrane coupled device inspection
capability and defect sizing has not been considered as part of this activity. These
detection techniques represent a subset of the range of techniques employed in the
current single element transducer inspection. The primary detection technique for
each of the critical defects was chosen with two major considerations in mind. The
test pieces used do not contain an actual weld, therefore any inspection techniques
that traverse the weld region were not considered. Secondly the test pieces have been

Flat Plate, Non-Welded Test-Piece Inspection
_____________________________________________________________________ 46
designed to allow single sided access; this is equivalent to the inspection of straight
pipe to elbow welds. Therefore all testing of the flat plate, non-welded test-pieces
was performed from one side of the simulated weld region only. No testing was
carried out from left to right on the test-pieces shown in Fig 3-3. Despite the
test-pieces not containing an anisotropic austenitic weld, the goal of this testing was to
develop inspection techniques that could in the long-term be applied to welded
structures. Shear waves are very highly attenuated and scattered by austenitic weld
material and are therefore not typically used for stainless steel weld inspection. The
primary detection techniques were selected with this inspection limitation in mind so
that longitudinal wave inspections have been used where possible.
The primary detection methods used to detect defects 1-6 in the flat plate, non-welded
test-pieces essentially represent three different ultrasonic inspection techniques. These
techniques are described below:
1. Corner echo
2. Transverse-Longitudinal (TL) skip
3. Transverse-Longitudinal-Longitudinal (TLL) skip
3.2.1. Corner Echo
Surface breaking defects oriented normal to the component surface are typically
detected using the corner echo technique. Ordinarily a 45º shear wave is used as this
gives the strongest indication from this type of interaction (Krautkramer &
Krautkramer, 1983); this type of inspection is shown in the schematic diagram in
Fig 3-4. The shear wave is not expected to traverse any weld material in this type of
inspection technique, so attenuation and scattering of the shear wave is not an issue.

Flat Plate, Non-Welded Test-Piece Inspection
_____________________________________________________________________ 47
Figure 3-4 Schematic diagram of corner echo technique.
3.2.2. Transverse-Longitudinal (TL) Skip
The Transverse-Longitudinal (TL) mode conversion skip technique is a type of
indirect specular reflection. The technique involves a beam of ultrasound insonifying
the defect specularly after a reflection with a surface within the component. In this
situation a reflection occurs at the backwall of the component; this represents the
inner diameter of the target application pipe-work. This technique is analogous to the
full-skip inspection commonly applied in shear wave inspection of ferritic welds
where a transverse-transverse inspection technique is employed (British Standards
Institution, 1998b).
Due to the orientation of the defects to be detected it is necessary to use a high angle
ultrasonic beam to achieve a normal incidence specular reflection. A longitudinal
wave is used to minimise the potential effects of scattering and beam steering when
considering an actual welded component. Access is limited to the outer surface of the
component only; therefore a suitably angled longitudinal wave can be generated using
two different techniques. The first is to use a high angled longitudinal wave
transducer positioned appropriately so that the longitudinal leg reflects from the
backwall and impinges specularly on the defect. This technique is ineffective due to
high mode conversion losses at the backwall reflection and a very broad beam width.
As a consequence of generating an angled longitudinal beam, an associated angled
shear wave is also generated. The second inspection technique uses this angled shear

Flat Plate, Non-Welded Test-Piece Inspection
_____________________________________________________________________ 48
wave, upon reflection from the backwall the shear wave mode converts into both an
angled compression wave and an angled shear wave. The compression wave
generated through this mode-conversion is at the same angle as the original
compression wave produced by the transducer.
The amplitude of this mode-converted longitudinal wave is appreciable. The
reflection coefficient for shear and longitudinal waves at a boundary between steel
and a vacuum for an incident shear wave are provided in Fig 2-3b and is reproduced
in Fig 3-5. The diagram in Fig 3-5 shows how the amplitude of the reflected shear
and longitudinal wave varies at a steel/air interface for different angles of incident
shear wave. As the angle of the incident shear wave is increased the amplitude of the
reflected shear wave rapidly decreases, whilst the amplitude of the mode-converted
compression wave undergoes a corresponding increase in amplitude. Due to the high
amplitude of the mode-converted longitudinal wave it can be used for defect
detection. The mode-converted longitudinal wave is specularly reflected from the
defect, a further mode-conversion into a shear wave then occurs at the backwall and
the transducer records a signal from the shear wave. This technique is used for the
detection of a range of defects; it is shown in the schematic diagram in Fig 3-6.

Flat Plate, Non-Welded Test-Piece Inspection
_____________________________________________________________________ 49
Figure 3-5 The reflection coefficients for longitudinal and shear waves at the boundary between steel and air for an incident shear wave.
Defect
Transverse Wave
Mode Converted Longitudinal Wave
Longitudinal Wave
Figure 3-6 Schematic diagram of the Transverse-Longitudinal (TL) skip inspection technique.
3.2.3. Transverse-Longitudinal-Longitudinal (TLL) Skip
There is a requirement to detect planar defects of through-wall orientation (0º tilt) and
defect at tilts of ± 10º relative to the through-wall orientation. These types of defects
give low signals at the highest practicable direct beam angle of approximately 70º.
An alternative technique to generate a reliable specular reflection is therefore
required. A Transverse-Longitudinal-Longitudinal (TLL) skip technique can be used
0
0.2
0.4
0.6
0.8
1
1.2
1.4
1.6
1.8
2
0 10 20 30 40 50 60 70 80 90Shear Wave Angle of Incidence (Degrees)
Ref
lect
ion
core
ffici
ent
Reflected Longitudinal Wave (RL)
Reflected Shear Wave (RS)
SteelAir
S RS
RLθ

Flat Plate, Non-Welded Test-Piece Inspection
_____________________________________________________________________ 50
to provide a suitable defect response. Using this technique two high angle
compression probes are used in a pitch-catch arrangement. The transmitting probe
generates a compression wave and an associated transverse wave. When the
transverse wave interacts with the backwall it generates a mode-converted
compression wave and a reflected transverse wave. The mode-converted compression
wave can then be reflected from a through-wall orientated defect and detected using
the receiving probe. This detection technique is shown in the schematic diagram in
Fig 3-7. By controlling the separation between the transmitting and receiving probes
it is possible to change the depth of optimum sensitivity. Therefore the separation
used must be optimised to ensure that each different defect is detected.
DefectTransverse
WaveMode Converted Longitudinal Wave
Longitudinal Wave
Receiver Transmitter
Figure 3-7 Schematic diagram of the Transverse-Longitudinal-Longitudinal (TLL) skip inspection technique.
The TLL skip technique is a more general description of the self-tandem (ST)
technique. The ST technique is simply the TLL with zero probe separation; this is
shown in Fig 3-8. It is possible that in some scenarios it would be possible to use the
TLL technique as ST. This would be dependent on defect through wall position and
probe size.

Flat Plate, Non-Welded Test-Piece Inspection
_____________________________________________________________________ 51
Defect
Transverse Wave
Mode Converted Longitudinal Wave
Longitudinal Wave
Figure 3-8 Schematic diagram of the self tandem inspection technique.
A summary of the primary detection technique used to detect each of the six defects
in the flat plate, non-welded test-pieces for each of these is provided in Table 3-2.
Defect 1 is detected from the corner echo response using a 45º shear wave. The
inspection of defect 2 and 3 is performed using the same 65º longitudinal wave TL
mode conversion technique. Defect 4 is detected using a 65º longitudinal wave TLL
mode conversion technique, there is a small separation between the optimum position
of the transmit and receive paths but typically a self tandem approach can be used.
The inspection of defects 5 and 6 is again performed using a single technique, for
these two defects a pitch-catch TLL mode conversion approach is used. A rigid
wedge 48 element phased array transducer is used as a transmitter. The 80 element
membrane transducer, discussed in chapter 2, is positioned over the weld cap and is
used as a receiver only. All experimental testing has been carried out using a Peak
NDT (Derby, UK) MicroPulse 5PA phased array controller with 128 parallel
channels. The pitch-catch configuration used to detect defects 5 and 6 is the largest
number of elements that can be addressed using this equipment. The size of the two
flat plate, non-welded test-pieces has been designed to ensure that the primary
detection technique for each of six defects can be suitably deployed. The length of
evaluation block 2 is therefore greater than evaluation block 1 to accommodate the
phased array pitch-catch arrangement. This difference in the size of the two test-
pieces is clear from the photograph in Fig 3-3.

Flat Plate, Non-Welded Test-Piece Inspection
_____________________________________________________________________ 52
Table 3-2 Defect Description for first stage of membrane coupled phased array device inspection development (OD – Outer Diameter).
Defect Description Tilt° Primary Detection Technique 1 Lack of root fusion 0 Corner echo using 45° shear
2 Lack of sidewall fusion 25 Transverse – longitudinal (TL) using 65° compression
3 Lack of sidewall fusion 25 Transverse – longitudinal (TL) using 65° compression
4 Lack of sidewall fusion 10 Self tandem, transverse –
longitudinal - longitudinal (TLL) using 65º compression
5 Lack of sidewall fusion 0 Pitch-catch, transverse –
longitudinal - longitudinal (TLL) using 65° compression
6 Structurally significant
planar defect derived from LEFM1
0 Pitch-catch, transverse –
longitudinal - longitudinal (TLL) using 65° compression
Notes
1. LEFM – Linear Elastic Fracture Mechanics
3.3. Inspection Development
The current inspection of the target application component is performed using 15
different single element transducers in five different probe pans (Rolls-Royce, 2002b).
When completing this inspection a large amount of mechanical raster scanning must
typically be performed to provide maximum coverage of the inspection volume. The
scanning speed using this approach is limited which leads to a long inspection time.
When completing a phased array inspection it is possible to replicate the single
element transducer performance by exciting an aperture within the array and
electronically scanning this aperture along the array. As discussed in chapter 2 this
approach is typically 10 times faster than mechanical raster scanning (RD Tech,
2004). It is also possible to use different delay laws to steer the beam generated by
the transducer over a range of angles. This allows multiple different single element
transducers to be replaced with a single phased array probe. Ideally all of the single
element transducers would be replaced by a single phased array probe. This is
impractical for an inspection as complex as that required on the target application but
would be possible in some circumstances. The focus for this development work is to
reduce the number of phased array probes required as far as possible and to simplify
the inspection procedure. The 80 element, 2nd generation membrane probe, which has

Flat Plate, Non-Welded Test-Piece Inspection
_____________________________________________________________________ 53
been discussed in chapter 2, was therefore designed with a large footprint to minimize
the amount of axial scanning required.
The inspection of the flat plate, non-welded test-pieces was performed using different
phased array based approaches. Multiple phases of testing were performed, but in
each case data was collected using FMC with a 128 channel Peak NDT MicroPulse
5PA. Testing was primarily performed with a 2MHz centre frequency, 1.25mm pitch,
48 element, linear phased array with a Perspex rigid wedge and the 80 element, 2nd
generation membrane coupled device. In both the Perspex wedge and the 2nd
generation membrane coupled device the wedge angle was controlled to produce a
longitudinal wave with a natural angle of 65º in stainless steel. A photograph of both
probes is shown in Fig 3-9.
Figure 3-9 Photograph of the 2nd generation membrane coupled device and the 48 element rigid wedge linear phased array.
The rigid Perspex wedge contains irrigation channels but suitable fixtures to connect
to these channels were not available. The 2nd generation membrane coupled device
also does not provide any means of irrigation. Therefore all inspection testing with
both probes was carried out in contact immersion. In this type of inspection the
component is placed in an immersion bath with sufficient water to just submerge the
component. This approach eliminates issues related to variable coupling between the
transducer and the component under test. This technique still involves use of the
48 element rigid wedge transducer
2nd Generation Membrane
coupled device Evaluation
Block 1

Flat Plate, Non-Welded Test-Piece Inspection
_____________________________________________________________________ 54
membrane material itself and allows appraisal of the performance of membrane
device but is not fully representative of the way the device will be used on an actual
application. The inspection was performed in an automated x-y scanning frame using
a custom jig mechanism. The jig was specifically designed for development of the
membrane probe inspection capability and offers a high degree of flexibility in terms
of controlling the transducer position and height. Lionel Reyes (Rolls-Royce, Senior
Design Engineer) assisted in producing the final design for this scanning mechanism.
The ride height of the membrane coupled device, defined as the distance between the
base of the metal picture frame and the flat plate outer surface must be controlled to
accommodate the weld cap. In the target application the weld cap is not expected to
exceed 4mm in height relative to the parent material. A ride height of 6mm is
therefore selected to ensure sufficient clearance between the probe and the
component.
As discussed previously the 2nd generation probe uses a constant pressure design,
however, it is not possible to rely on the pressure within the membrane cavity to
support the weight of the transducer and the jig assembly. An alternative approach is
therefore required to ensure that a constant ride height is maintained. Ideally the
scanning frame assembly would include the capability to control this ride height and
allow the membrane device to be fixed a set distance away from the component under
test. This approach will be adopted when a bespoke pipe-manipulator is designed.
However, this is not possible using the current x-y scanning frame and an alternative
technique is required. In the x-y scanning frame a weight is used to force the
transducer into contact with the component. In order to prevent the metal picture
frame contacting with the component a second, rigid wedge transducer is used to
control the ride height. This configuration is shown in the photograph in Fig 3-10.
The membrane device jig assembly ensures that the height of the membrane device
can be accurately controlled.

Flat Plate, Non-Welded Test-Piece Inspection
_____________________________________________________________________ 55
Figure 3-10 Photograph of the 2nd generation membrane coupled device inspection showing the scanning frame configuration.
As discussed the inspection techniques used to detect defects 2 and 3 is identical. In
order to optimize the technique for the detection of each defect the transducer position
relative to the centre of the weld must be changed. However, by using a large phased
array transducer in the membrane coupled device it is possible to minimize the
amount of transducer movement required. Results from the inspection of defect 2
only will be discussed in this thesis. The inspection of defects 5 and 6 is also the
same and only results from the inspection of defect 6 are included in this thesis. Both
of these defects represent a major challenge when using the primary detection
technique with conventional rigid wedge transducers. However, when using
conventional probe technology defect 5 can be detected by using a full skip corner
echo technique. This technique is shown in the schematic diagram in Fig 3-11.
Defect 6 cannot be detected using this technique because it is inappropriately
positioned to provide a corner echo. Without the removal of the weld cap it is not
possible to detect defect 6 using conventional rigid wedge transducers. However, it is
possible to detect this defect using the 2nd generation membrane device and results
from this inspection will be presented.
48 element rigid wedge transducer
Scanning frame mechanism
Fixed ride height
2nd generation membrane coupled device

Flat Plate, Non-Welded Test-Piece Inspection
_____________________________________________________________________ 56
Defect
Transverse Wave
Figure 3-11 Schematic diagram of the Transverse-Transverse (TT) full-skip inspection technique.
When using conventional single element transducers the probe must be mechanically
scanned to achieve the maximum coverage of the inspection volume. By using a
phased array it is possible to achieve coverage from a single transducer position. In
both cases when displaying the experimental results obtained from an inspection it is
necessary to be able to correctly position the ultrasonic responses within the
inspection volume. In conventional ultrasonic testing the index point of the
transducer is typically used, where the index point refers to the centre of the ultrasonic
beam. The index point of the transducer is found experimentally during calibration
(British Standards Institution, 2001). When using FMC based inspection all possible
inspection data is collected in a single acquisition and an image of the inspection
volume is produced in post-processing. It is not possible to measure the index point
for the ultrasonic beam during the data collection phase. Therefore an alternative
reference point is required that can be easily measured by the operator when setting
up the inspection. The back of the probe housing is used as this reference point. The
offset between the back of this housing and the index point of the actual beam
generated is then calculated so that the ultrasonic signals are suitably positioned.
3.4. Experimental Results
The performance of the 2nd generation membrane coupled device can be quantified by
comparing the results obtained for the inspection of the two flat plate, non-welded
test-pieces to those achieved using conventional rigid wedge technology. In order to
make a direct comparison between the two different approaches a calibration
procedure is required. FMC data acquisition is relatively immature technology, so no
standards exist governing the use of this approach and a recognised calibration routine

Flat Plate, Non-Welded Test-Piece Inspection
_____________________________________________________________________ 57
does not yet exist. Rolls-Royce is keen to address this limitation and I am leading the
project to develop a full calibration routine. This work is being performed in
collaboration with researchers at Imperial College, University of Bristol and engineers
at Serco TAS. However, this development activity is ongoing and has not yet been
finalised. An alternative approach to calibration has therefore been adopted in this
work.
A fixed gain of 45dB has been used to collect all FMC data with the 2nd generation
membrane coupled device. This gain is selected as it provides a good defect response
from a single element without saturating the single element signal from reflectors
within the test-piece. The front wall echo does saturate but this is gated out in the
time domain when processing the FMC data and does not affect the accuracy of the
results. A baseline comparison between the membrane device results and those
obtained from the 48 element rigid wedge transducer is then made using the response
from a single 3mm diameter SDH defect. Calibration testing was performed on a
stainless steel test-piece containing a range of SDH defects. This test-piece was
selected because it had approximately the same material properties as the two flat
plate, non-welded test-pieces and a similar wall thickness. A schematic diagram of
the test-piece and the experimental set-up using the membrane device is shown in
Fig 3-12. In each case the transducer is positioned so that the centre of the array is
positioned appropriately to provide an optimum response from the 35mm deep SDH
defect with a direct 65º longitudinal wave. This SDH defect was selected because it is
relatively isolated from the other features within the block and hence could be used as
a single reference point for the calibration. The full matrix of A-Scan data was
acquired using both transducers and processed using the Imperial College FMC
processing software. For each transducer the FMC data is processed to produce an
unfocused direct 65º longitudinal wave inspection of the test-piece using a 10 element
(12.5mm) aperture. The first step in the calibration procedure was to acquire and
process the 2nd generation membrane probe data with a fixed gain of 45.0dB. The
data was processed and the 35mm deep SDH response was recorded as shown in
Table 3-3. The relative amplitude of the signal is automatically calculated by the
FMC post processing software. The SNR is measured by gradually reducing the
dynamic range of the image until the background noise is removed; this approach is
representative of that used elsewhere within industry. An iterative approach was then

Flat Plate, Non-Welded Test-Piece Inspection
_____________________________________________________________________ 58
used to set the gain when completing the SDH test-piece inspection using the
48 element rigid wedge transducer. By using this approach it was found that
approximately the same amplitude SDH response could be obtained when using a
gain of 43.25dB with the 48 element array. The amplitude and SNR of the 35 mm
deep SDH signal is again shown in Table 3-3. All subsequent testing with the
48 element array was therefore performed using a gain of 43.25dB.
10.020.0
35.0
55.0
65º Direct Longitudinal Wave
Figure 3-12 Schematic diagram of the flat plate non-welded test-piece calibration set-up.
Table 3-3 SDH calibration experimental data obtained using the 2nd generation membrane device with 45dB gain and the 48 element rigid wedge phased array with 43.25dB gain.
Beam Steering Transducer
Aperture Size
(Elements) SNR (dB) Max Amplitude (A.U.)
2nd generation membrane 10 20 12
48 element rigid wedge 10 17 12
This approach to calibration ensures that if each of the two arrays is in a suitable
position to ensure that the centre of the array insonifies the defect then the flaw
response measured will be is approximately equal. However, the results indicate there
is likely to be some difference in the response from different regions of the array.

Flat Plate, Non-Welded Test-Piece Inspection
_____________________________________________________________________ 59
Table 3-3 shows that the SNR of the response from the 35mm deep SDH defect is
slightly worse when using the 48 element rigid Perspex wedge array than the 2nd
generation membrane coupled array. However, the level of difference between the
two devices is relatively small and this is not considered to be an issue. The region of
the test-piece that is insonified using the 48 element device from a single position is
significantly less than when using the 2nd generation membrane device. This is
because the overall size of the rigid wedge array is less than that of the 2nd generation
device. Correct positioning of the 48 element rigid wedge array is therefore more
critical than for the 2nd generation device.
All experimental testing with the membrane coupled device and the rigid wedge array
was completed with between 4 and 8 averages. This approach was taken to reduce the
level of incoherent noise, thus improving SNR without excessively increasing the
time required to complete the measurements. Testing was completed at a 25 MHz
sampling rate, which is well in excess of the Nyquist frequency for the array signal.
A comparison of the results obtained using both transducers for the four defects
considered are discussed below. As stated previously the acquisition and processing
of FMC data is relatively immature and when this testing was carried out it was not
possible to capture and process encoded scan data. Commercially available phased
array controllers are not designed to perform this type of inspection, bespoke software
is required to acquire this type of data and process it. This requirement is being
addressed in the next phase of this project and will be used in the future. At this stage
in development it is only possible to collect inspection data from a single probe
position. However, this is not a significant limitation in this study and meaningful
comparison between the performance of the 2nd generation membrane device and
conventional technology can still be made. The use of a large footprint array also
allows coverage of much of the inspection volume from a single transducer position
and scanning the transducer is less critical.
In the comparison of results discussed below, each transducer is positioned in
approximately the correct position so that energy from the centre of the array
impinges on the defect. Small variations in the position of the array relative to the
component under test is the main source of error within the experimental

Flat Plate, Non-Welded Test-Piece Inspection
_____________________________________________________________________ 60
measurement and this contributes to the predicted variation of up to ±1 dB in the
results. The FMC data is then acquired and suitably processed using the Imperial
College FMC post-processing suite. A direct comparison can then be made between
the two B-Scans obtained. This approach does not allow a comparison of the defect
length sizing (circumferential extent) using the two different transducers. However
length sizing is typically carried out using the 6dB drop technique (British Standards
Institution, 2008) and is dependent on the lateral beam width. The width of the array
element is the same in both transducers and hence the beam width is comparable. The
defect length measured using both transducers will therefore be very similar.
In order to make meaningful comparison between the two different transducers the
FMC data has been processed in a number of different ways. Initial comparison is
made using a 10 element or 12.5mm aperture with both a focused and an unfocused
beam. When completing a focused inspection, a single focal depth is used
corresponding to the centre of the defect. A phased array can only be used to focus a
beam within the near field of the array aperture used for the inspection. For
inspections with a long path length such as many of those performed in testing the flat
plate, non-welded test-pieces a large aperture must be used to provide effective
focusing. A second comparison is therefore made using an aperture of 24 elements or
30mm. This aperture size is limited by the overall size of the rigid wedge transducer
and is selected as a compromise between increasing the focal range of the array being
used and limiting the B-Scan width from a single transducer position.
A comparison was carried out of the maximum amplitude of each defect signal and of
the localised SNR around the defect. The value of the maximum amplitude signal is
automatically provided by the post processing software, this gives a measure of the
relative beam intensity at different steering angles and hence a measure of inspection
quality. It is important when completing this comparison that the maximum signal in
the image is due to the defect signal and not a spurious signal. In order to achieve this
it is necessary at times to consider a smaller image region. The signal to noise ratio
for each inspection is assessed by eye from the images generated. This approach is
somewhat subjective but is in line with that used currently when interpretation
engineers use platforms such as the British Energy (British Energy Group PLC, East
Kilbride, UK), Graphical User Interface Data Evaluation (GUIDE) and is accepted

Flat Plate, Non-Welded Test-Piece Inspection
_____________________________________________________________________ 61
within the broader nuclear industry. Also I am a qualified Level II GUIDE user and
have received training in this interpretation process.
3.4.1. Defect 1
Defect 1 is inspected using a 45º shear wave corner echo technique; this technique is
shown using the two different transducers in the schematic diagram provided in
Fig 3-13. In order to generate this beam angle suitable delay laws must be generated
to steer the ultrasonic beam away from the natural angle of the transducer. When
using this approach it can be seen from the results in Table 3-4 that both transducers
can be used to detect the defect using both aperture sizes considered. However, there
is a major difference between the amplitude of the response using the two different
transducers. The relative time delay between the firing of adjacent elements in the
two probes is different because of the disparity in ultrasonic velocity in the two
different wedge materials used. This gives rise to differences in the amplitude of the
beam and leads to the variation in the amplitude of the response. The improved defect
SNR that is achieved when using the 48 element transducer is due to a reduction in
the background noise within the rigid wedge design. When the aperture size is
increased the amount of energy impinging upon the defect also increased, this leads to
a higher amplitude response. There is an improvement in the performance of the
inspection when using a focused beam with the larger aperture using both transducers.
This is because the larger aperture allows effective focusing at the depth of the defect.
The use of single depth focusing with the 24 element aperture at the centre of the
defect (corresponding to 56mm depth) improves the SNR performance of the 2nd
generation transducer so that the performance is comparable to the rigid wedge
transducer.
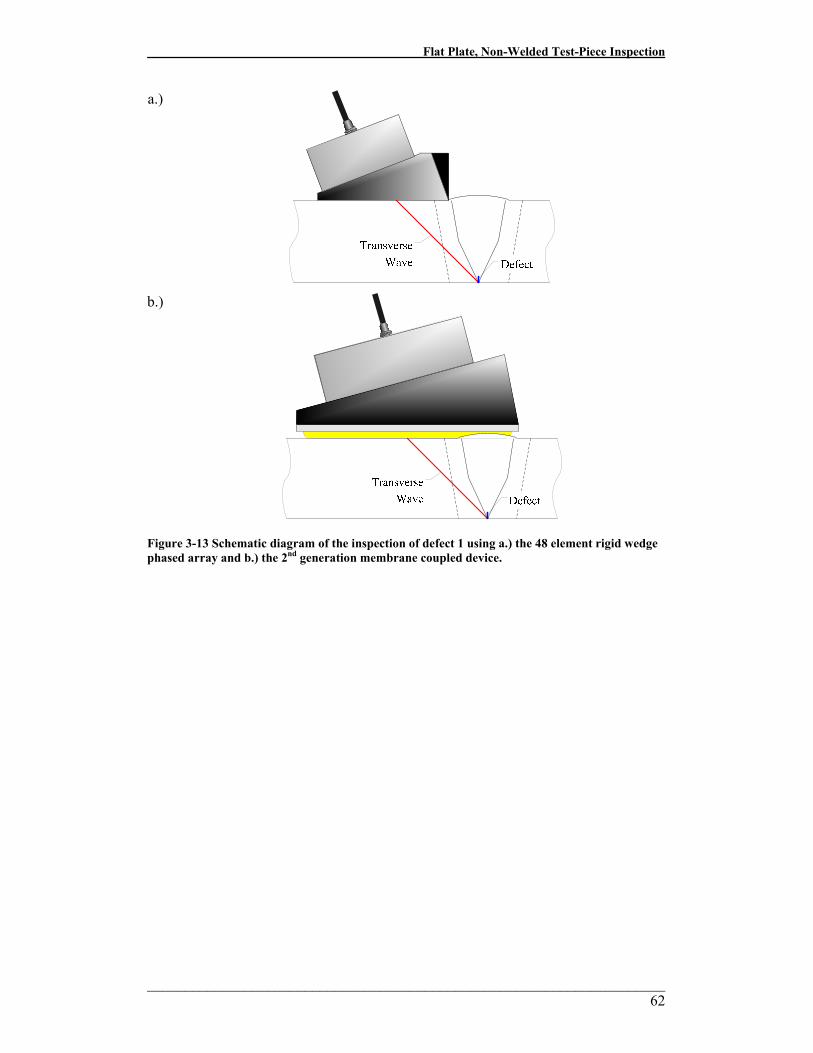
Flat Plate, Non-Welded Test-Piece Inspection
_____________________________________________________________________ 62
a.)
b.)
Figure 3-13 Schematic diagram of the inspection of defect 1 using a.) the 48 element rigid wedge phased array and b.) the 2nd generation membrane coupled device.

Flat Plate, Non-Welded Test-Piece Inspection
_____________________________________________________________________ 63
Table 3-4 Experimental results for the inspection of defect 1.
Beam Steering 56mm focal length
Transducer Aperture
Size (elements)
SNR (dB ± 1 dB)
Max Amplitude
(A.U.)
SNR (dB ± 1 dB)
Max Amplitude
(A.U.) 2nd
generation membrane
10 23 147 24 159
2nd generation membrane
24 25 326 31 645
48 element rigid wedge 10 28 74 29 85
48 element rigid wedge 24 28 192 31 321
3.4.2. Defect 2
Defect 2 is detected using a TL mode conversion technique with a 65º longitudinal
wave. This technique is also used for the detection of defect 3; however, the detection
of defect 2 is more challenging because of the presence of the weld cap. A schematic
diagram of the inspection technique used to detect defect 2 is shown in Fig 3-14. The
presence of the weld cap is a particular issue when using the rigid wedge transducer.
The image provided in Fig 3-14a indicates that only energy from elements at the very
front of the array impinges upon the defect. When using the rigid wedge array the
amount of energy reaching the defect is very low and hence the defect cannot be
detected. Defect detection could be improved if it was possible to position the array
closer to the defect location. This loss of inspection coverage is a major limitation of
the rigid wedge design and provides motivation for the development of the membrane
device. As shown in Fig 3-14b when using the 2nd generation membrane coupled
device the membrane can conform to the surface geometry of the component under
test. This allows the device to be optimally positioned for detection of the defect.

Flat Plate, Non-Welded Test-Piece Inspection
_____________________________________________________________________ 64
a.)
Defect 2
Longitudinal Wave
Transverse Wave
Mode-ConvertedLongitudinal Wave
b.)
Defect 2
Longitudinal Wave
Transverse Wave
Mode-ConvertedLongitudinal Wave
Figure 3-14 Schematic diagram of the inspection of defect 2 using a.) the 48 element rigid wedge phased array and b.) the 2nd generation membrane coupled device.
The B-Scan obtained from the inspection of defect 2 using the two different
transducers is provided in Fig 3-15. The data shown in Fig 3-15 has been produced
without using any focusing with a 10 element aperture. The data in Fig 3-15a shows
the null defect case using the rigid wedge transducer. This data is taken away from
the defect 2 position to demonstrate the level of background noise. The image in Fig
3-15b shows the B-Scan obtained from the inspection of defect 2 using the rigid
wedge transducer. A comparison of Fig 3-15a and 3-15b indicates that it is not
possible to detect defect 2 using the rigid wedge, 48 element transducer. There are
some minor differences between the two images but these cannot be reliably
attributed to the presence of the defect. It is also important to note that the null defect
data was taken with the transducer positioned away from the weld cap. Therefore any

Flat Plate, Non-Welded Test-Piece Inspection
_____________________________________________________________________ 65
signals due to weld cap interactions are omitted from the image. The B-Scan obtained
using the 2nd generation membrane coupled device is provided in Fig 3-15c. The
optimum positioning of the defect signal within the B-Scan is possible because the
membrane device is positioned over the weld cap. The image provided in Fig 3-15c
has then been produced by using delay laws that compensate for the irregular surface
geometry if the flat plate, non-welded test-piece. The other signal that is clearly
evident in Fig 3-15c is an internal noise band. The noise band signal is well removed
from the signals of interest in the inspection of defect 2. However, in the inspection
of some defects this is not the case and the presence of this band of noise is an issue
with the 2nd generation membrane coupled device. The origin of this noise and the
work performed to reduce the effect of this noise will be discussed in detail in
chapter 5.
a.)
b.)
c.)
Figure 3-15 B-Scan image produced from a. the null defect inspection, and b.) the inspection of defect 2 using the 48 element rigid wedge phased array and c.) using the 2nd generation membrane coupled device.
The inspection performance of the 48 element rigid wedge phased array and the 2nd
generation membrane coupled device for the inspection of defect 2 is provided in
Table 3-5. Comparison of the membrane device results from defect 2 in Table 3-5
Internal Noise Band Defect 2 TL
Signal
Background Noise Background
Noise

Flat Plate, Non-Welded Test-Piece Inspection
_____________________________________________________________________ 66
and those from defect 1 shown in Table 3-4 demonstrate that the amplitude of the
defect 2 signal is approximately a factor of 3 lower than that from defect 1. The
inspection mechanism used to detect the two defects is different and hence the
amplitude of the response also varies. The SNR for defect 2 has been calculated
ignoring the presence of the internal noise signal. Although defect 2 is still clearly
observed against the background material noise the SNR is less than that achieved
with defect 1.
Table 3-5 Experimental results for the inspection of defect 2.
Beam Steering 56mm focal length
Transducer Aperture
Size (elements)
SNR (dB ± 1 dB)
Max Amplitude
(A.U.)
SNR (dB ± 1 dB)
Max Amplitude
(A.U.) 2nd
generation membrane
10 14* 52 16* 57
2nd generation membrane
24 15* 105 17* 185
48 element rigid wedge 10 - - - -
48 element rigid wedge 24 - - - -
Notes
* Defect SNR is calculated ignoring the effects of the internal noise signal.
3.4.3. Defect 4
The inspection of defect 4 is relatively challenging due to the position and the
orientation of the defect. A self tandem TLL technique is employed to detect the
defect using a 65º longitudinal wave. The results obtained in this inspection using
both the 48 element rigid wedge transducer and the 2nd generation membrane coupled
device are provided in Table 3-6. Despite the challenges associated with this
inspection it is possible to reliably detect the defect using both transducers with each
of the two aperture sizes considered. The path length associated with this inspection
is relatively long. The maximum focal length of an inspection is governed by the near
field and hence size of the array aperture used for the inspection. Therefore focusing
has very little effect in the inspection performance using both the rigid wedge phased
array and the 2nd generation membrane coupled device when using a 10 element

Flat Plate, Non-Welded Test-Piece Inspection
_____________________________________________________________________ 67
aperture. This is because the path length is beyond the near field length of the
aperture and focusing is not possible. When using a larger aperture size of
24 elements the SNR of the defect response is improved using both probes when
focused inspection is used. The 2nd generation membrane coupled device again
provides better inspection performance than the 48 element rigid wedge transducer.
The larger footprint associated with the membrane coupled device also allows the
entire defect to be imaged and characterised even when using larger aperture sizes.
The amplitude of the response in each case is much lower than that obtained from
either defect 1 or 2. This is because the path length of the defect 4 inspection is
relatively long and the beam is broad when it impinges upon the defect.
Table 3-6 Experimental results for the inspection of defect 4.
Beam Steering 30mm focal length
Transducer Aperture
Size (elements)
SNR (dB ± 1 dB)
Max Amplitude
(A.U.)
SNR (dB ± 1 dB)
Max Amplitude
(A.U.) 2nd
generation membrane
10 16* 20 16* 20
2nd generation membrane
24 16* 39 19* 52
48 element rigid wedge 10 9 6 9 6
48 element rigid wedge 24 10 7 15 26
Notes
* Defect SNR is calculated ignoring the effects of the internal noise signal.
The internal noise signal observed in the inspection of defect 2 using the 2nd
generation membrane coupled device is again present, as shown in the B-Scan data
provided in Fig 3-16. The data shown in Fig 3-16 provides a comparison of the
performance using the two different transducers, in each case the B-Scan has been
generated using a 10 element aperture with a 30mm focal depth. When using the
48 element rigid wedge transducer some background noise is present, however, the
most prominent feature within the B-Scan is due to the defect. The comparison
provided in Table 3-6 demonstrates that if this internal noise is ignored that the 2nd
generation membrane device performs well in comparison to the 48 element rigid
wedge device. However, in the 2nd generation membrane coupled device inspection

Flat Plate, Non-Welded Test-Piece Inspection
_____________________________________________________________________ 68
the internal noise signal occurs at a higher amplitude than the defect signal. The
internal noise signal is approximately 11dB higher amplitude than the defect signal.
The defect SNR has been estimated by ignoring this high amplitude noise signal.
Therefore the data is displayed on a 0-29dB dynamic range in Fig 3-15 but the defect
SNR is only 18dB. This approach is only possible because the defect signal and the
internal noise signal do not occur at the same location in the B-Scan. However, if
these two signals did overlap it may not be possible to detect the presence of the
defect.
a.)
b.)
Figure 3-16 The B-Scan image obtained from the inspection of defect 4 using a.) the 48 element rigid wedge transducer and b.) the 2nd generation membrane coupled device. In the membrane transducer inspection the internal noise signal is the highest amplitude signal and corrupts the image obtained, the SNR has been calculated ignoring this effect.
3.4.4. Defect 6
When testing with rigid transducer wedges it is only possible to scan the transducer up
to, but not over, the weld cap and maintain coupling. It is therefore not possible to
detect defect 6 with the weld cap in place using a rigid transducer. However, by using
the membrane coupled device it is possible to scan the entire length of the test piece.
This is shown in the schematic diagram provided in Fig 3-17.
Internal Noise Band
Defect 4 TLL Response
Defect 4 TLL Response

Flat Plate, Non-Welded Test-Piece Inspection
_____________________________________________________________________ 69
a.)
b.)
Figure 3-17 Schematic diagram of the inspection of defect 6 using a.) rigid wedge phased array transducers in transmission and reception, and b.) a rigid wedge transmitter probe and the 2nd generation membrane coupled device as a receiver.
The inspection results obtained from defect 6 using the rigid wedge transducer and
using the 2nd generation membrane device is provided in Table 3-7. In each case the
48 element rigid wedge transducer is used to transmit an unfocused plane wave. The
use of focused delay laws in reception once again provides a significant improvement
in inspection performance and it is only possible to detect the defect when using the
membrane device with suitable delay laws to focus at the outer surface of the
component under test. The delay laws used have been corrected to compensate for
the irregular surface profile of the test-piece. A B-Scan of the inspection of defect 6
is shown in Fig 3-18(a) using an aperture of 10 elements. Interpretation of this B-
Scan signal is difficult because of the high amplitude weld toe signal. However,
comparison between the B-Scan of defect 6 with a defect free case shown in Fig
3.18(b) clearly demonstrates the presence of a defect signal. The amplitude of the
weld toe signal is higher than that obtained from the defect, so the data is shown on a
0-24dB dynamic range but the defect SNR is only 10dB. This SNR is lower than

Flat Plate, Non-Welded Test-Piece Inspection
_____________________________________________________________________ 70
ideal but it is acceptable in an industrial inspection when a priori knowledge of the
weld toe signal is available.
Table 3-7 Experimental results for the inspection of defect 6.
Beam Steering 0mm focal length
Transducer Aperture
Size (elements)
SNR (dB ± 1 dB)
Max Amplitude
(A.U.)
SNR (dB ± 1 dB)
Max Amplitude
(A.U.) 2nd
generation membrane
10 - - 10* 29
2nd generation membrane
24 - - 11* 56
48 element rigid wedge 10 - - - -
48 element rigid wedge 24 - - - -
Notes
* Defect SNR is calculated ignoring the effects of the weld toe signal.
a.)
b.)
Figure 3-18 Comparison of the response from a.) defect 6 and b.) a defect free region. The top
surface of the parent plate of the test-piece occurs at 0mm depth so that the weld cap material is
deposited above this level and the defect signal appears partially above the component.
3.5. Summary
A specific target application was selected to provide an industrial focus for the
development of the conformable membrane coupled phased array device. This target
application is a section of large bore stainless steel pipe-work that contains an
austenitic weld. This is a typical component inspected within the nuclear industry and
is a specific component of interest to Rolls-Royce submarines. In the current
Weld Toe Signal
Defect 6 TLL Response
Weld Toe Signal

Flat Plate, Non-Welded Test-Piece Inspection
_____________________________________________________________________ 71
inspection of this component a large number of rigid wedge single element
transducers are mechanically raster scanned over the component. In order to
maximise the coverage of the current inspection the weld cap must be removed. Weld
cap removal is a time consuming mechanical process that can damage the structural
integrity of the component. The overall inspection process is slow, the inspection
techniques used are limited and coverage of the inspection volume is restricted. The
goal of the membrane coupled device development activity is to improve the
inspection of this component.
Two flat plate, non-welded test-pieces that are representative of the target application
component were designed and manufactured. These test-pieces do not contain an
actual weld but do have a weld cap that is designed to mimic the weld cap on the
actual target application component. The absence of an austenitic weld simplifies the
inspection process by eliminating signal scattering and refraction effects due to the
weld material. A phased array inspection of these two test-pieces has been designed
and the performance of a 48 element rigid wedge phased array transducer and the 80
element 2nd generation membrane coupled device is compared and assessed. The
performance of the two different approaches is compared on four different defects.
Both the rigid wedge transducer and the 2nd generation membrane coupled device
were successfully used to detect defects 1 and 4 and the performance of both
transducers is comparable but the membrane device slightly outperforms the rigid
wedge device. Defects 2 and 6 could only be detected using the membrane device
because of the presence of the weld cap. When using the rigid wedge transducer
coupling cannot be maintained between the transducer and the component in the weld
cap region.
Unfortunately when using the membrane coupled device a prominent internal noise
signal was also observed. This internal noise signal was an issue in the detection of
defect 4 and to a lesser extent the inspection of defect 2. In the inspection of defect 2
this noise signal was at a lower amplitude than the defect response and occurred away
from the defect region. However, in the inspection of defect 4, the defect response
occurs at a point in the B-Scan that is much closer to this noise signal. In addition the
signal from defect 4 is relatively low amplitude and the noise signal is more
prominent within the B-Scan. Although the 2nd generation membrane coupled device

Flat Plate, Non-Welded Test-Piece Inspection
_____________________________________________________________________ 72
can be successfully used in inspection of defects that cannot be detected using
conventional transducer technology this noise signal is a limitation in the
performance. The source of this noise signal must be understood and actions taken to
reduce and ideally eliminate its effect. This activity and the subsequent design of a 3rd
generation membrane coupled device is documented in chapter 5.

_____________________________________________________________________ 73
4. Ultrasonic Inspection Modelling The non-destructive inspection of safety critical components is carried out to ensure
that the components are fit for purpose. Before an inspection can be performed it
must be suitably qualified; this provides an assurance that an inspection will meet its
objectives. Inspection Qualification (IQ) within Rolls-Royce Submarines is
performed in line with European Network for Inspection and Qualification (ENIQ)
(JRC Petten, 2007). ENIQ documentation provides information on the way in which
different aspects of a qualification can be developed and implemented.
Using ENIQ methodology an inspection system must be designed specifically to find
the type and size of significant defects in the component under test. The capability of
the inspection technique to detect these defects must then be demonstrated. This
capability has traditionally been demonstrated theoretically using simple
trigonometric models and then supported with a significant body of experimental data.
However, in order to demonstrate inspection capability on all types of defects of
different sizes and orientations the expense and time required in this approach
becomes prohibitive. By simulating an inspection, the cost associated with the
development of expensive samples and the time and cost of experimental testing can
both be reduced. The desirability of using suitable models in IQ has been recognised
by ENIQ and it has published guidelines on their use (JRC Petten, 1999). The
performance of any model used in the IQ process must be validated against
experimental data to ensure its accuracy. It is therefore expected that modelling will
only form part of the process of generating the technical justification for an
inspection.
Modelling can also be used as an alternative to round robin testing such as the
European Programme for the Inspection of Steel Components (PISC II) (Lemaitre et
al, 1996) to understand the performance capability and limitations of an inspection
(Schmitz et al, 1995). Once an appropriate model framework has been developed
then defects of different sizes and orientations can be introduced at any position
within the model. The flexibility of this approach also allows the introduction of a
combination of defects so that complex defect interaction can be investigated.

Ultrasonic Inspection Modelling
_____________________________________________________________________ 74
There are a wide range of different approaches that can be adopted to solve the
inspection modelling requirement. Historically Rolls-Royce has relied on the basic
spreadsheet based trigonometric models. However, through the Advanced NDE
NPCT project and a Nuclear Technology and Sustainability (NTS) project, which is
designed to develop an IQ framework for phased array inspection (Shipp et al, 2008;
Rolls-Royce, 2009) Rolls-Royce engineers have started to implement a much broader
range of modelling techniques. The use of these models is still not widespread and
through my EngD studies I have been heavily involved in promoting the use of the
different modelling techniques within Rolls-Royce. The two inspection models
discussed below do not represent an exhaustive list of all of the modelling packages
available or used within industry. This review is limited to the main models that I
have implemented as part of my research and it represents the two models that I have
demonstrated within Rolls-Royce. In section 4.1 I will discuss the CIVA modelling
package. In section 4.2 I will then review the use of finite element (FE) analysis for
modelling ultrasonic inspection. In section 4.2 I will also review the specific FE
development work that I carried out to address the needs of this project to allow the
simulation of the flat plate, non welded test-piece inspections. Then in section 4.3 I
will demonstrate the use of both packages and present modelling results obtained to
simulate the detection of defects within the target application component. I will also
comment on the applicability of each of the two approaches for industrial application.
4.1. CIVA
CIVA is a semi-analytical model developed by CEA in France and marketed by
CEDRAT (Meylan, France) The software is used by a range of industrial and
academic groups as a rapid inspection planning and data interpretation model. CIVA
contains ultrasonic, electromagnetic and radiographic inspection models. However,
my work has focused on ultrasonic inspection and this review is limited to the
ultrasonic inspection module within the CIVA platform. In CIVA the probe beam
model is based on a wave theory developed by Deschamps (Deschamps, 1972). The
transducer is discretized into a number of point sources, each source is assumed to
radiate a hemispherical wavelet of energy. The beam propagation and defect
interaction is then estimated using the pencil method (Gengembre & Lhemery, 2000).
A pencil is a collection of rays emanating from the point source and diverging
slightly, the wavefront produced is then characterized using matrix representation. In
Ultrasonic Inspection Modelling
_____________________________________________________________________ 75
this approach the propagation of the rays emitted by the source and centered on the
geometrical path linking the source and the computation point are considered. This
approach allows CIVA to simulate the effects of reflection and refraction through
multiple material layers with arbitrary geometry. It is therefore possible to simulate
ultrasonic beam propagation into complex geometrical structures such as the target
application. The pencil approach also makes it possible to simulate the beam
produced by an arbitrary transducer. It is therefore possible to simulate single
element transducers as well as 1D and 2D phased arrays. This functionality has been
used extensively to simulate the membrane coupled device performance and assist in
the development of this transducer.
CIVA also contains a number of flaw/beam interaction models. The ultrasonic beam
is calculated based on the pencil method; it is then assumed that the interaction
between the beam and the defect can be simulated as the sum of several separate
echoes corresponding to the different possible ultrasonic paths (Calmon et al, 1998).
Depending on the inspection situation to be simulated CIVA uses the Kirchhoff
approximation, the Geometrical Theory of Diffraction (GTD) or the Born
approximation (Calmon et al, 2004). The Kirchhoff approximation is based on
Huygens principle and the field scattered from a defect is calculated by summing the
responses from a large number of point sources positioned on the surface of the defect
(Kirchoff, 1891). GTD is a ray theory originally developed for optics by Keller
(Keller, 1957); which was later applied to elastodynamics by Achenbach and
Gautesen (Achenbach & Gautesen, 1977). The theory provides a correction to
geometrical elastodynamics to predict the response from a defect due to rays
diffracting from the edge of the defect as well as that due to the specular surface
reflection. Both the Kirchoff theory and GTD are high frequency approximations and
should not be used for predicting the response from defects smaller than
approximately two ultrasonic wavelengths (Chapman, 1990). Also in both cases the
approximations should only be used in the far-field of the defect. The Kirchhoff
approximation is used to simulate the response from component boundaries and
calibration reflectors such as side drilled holes and flat bottomed holes. Depending on
the exact inspection scenario GTD or the Kirchhoff approximation are used to predict
the response from cracks. Typically Kirchhoff is preferred for normal or near-normal
incidence and GTD is used for off-specular directions.

Ultrasonic Inspection Modelling
_____________________________________________________________________ 76
A slightly modified form of the low frequency Born approximation (Gubernatis &
Domany, 1977) has been included into the CIVA platform relatively recently to
predict the response of solid inclusions (Darmon et al, 2003). The use of this type of
approximation is valid for weak scatterers such as inclusions where energy is reflected
from the front and back surface of the defect. Although it is possible that this type of
defect may occur with the target application component weld (Rolls-Royce, 2006c) it
is considered less critical than the planar flaws included in the test-pieces developed.
The Kirchhoff approximation and GTD have been extensively validated against exact
theoretical solutions and experimental results by the Central Electricity generating
Board (Chapman, 1984; Chapman, 1990). This work demonstrated a good level of
agreement and highlighted the range of validity of both approaches. The low
frequency Born approximation has been validated against analytical solutions (Ying
& Truell, 1956) and experiment for alumina inclusions in steel (Darmon et al, 2003).
The CEA also has its own validation centre, which has a substantial ongoing
programme of validation work and regularly participates in model benchmarking
exercises (Cinquin et al, 2006; Lonné et al, 2006). In general, CEA have reported
good agreement with experiment and the CIVA platform has outperformed other
modelling packages available.
4.2. Finite Element Modelling
The range of inspection scenarios that can be simulated using commercially available
software is fundamentally limited by the range of validity of the approximations
underpinning the model. An alternative to these analytical models is to use a
numerical approach, such as the finite difference (FD) or finite element (FE) methods.
Numerical inspection modelling can be used in a much wider range of scenarios to
provide an accurate simulation of the inspection. The early part of my EngD was
focused on the development of the FE modelling techniques to simulate a range of
different ultrasonic inspection scenarios. The focus of this work was to develop my
understanding of the experimental and simulation techniques and to demonstrate the
application of FE modelling in an industrial context. I performed a range of
modelling tasks including the development of an inner diameter creep wave model for
the inspection of a narrow bore section of pipework and a SDH response model. This

Ultrasonic Inspection Modelling
_____________________________________________________________________ 77
modelling work was performed using FE simulations because the most up to date
version of CIVA available at that time did not account for creep wave behaviour. The
creep wave response was critical in both of the small bore pipe and SDH defect
inspection and was a significant restriction in terms of CIVA modelling. These
models are included in my 6-month, 12-month and 24-month reports (Russell, 2006a;
Russell, 2006b; Russell, 2007b) but are not relevant to this thesis and will not be
included in this discussion.
In the finite element method (FEM) a structure is divided into a number of small
pieces, these pieces are known as elements. Individual elements are linked at their
boundaries by nodes; typically nodes exist at the corner of elements but nodes can
also be introduced on the element edges or at their centre. The pattern of the elements
within the model is known as the mesh. Each element is sufficiently small that its
individual behaviour can be calculated using relatively straightforward analysis. By
combining the behaviour of all of the elements within the structure it is possible to
approximate the overall behaviour of the structure. Therefore complex problems with
no analytical solution can be solved using this approach. The FEM does not provide
an exact solution, but through careful control of the material properties, the applied
loads and the pattern of the mesh it is possible to extract accurate solutions using the
method (Lowe & Hansen, 2008).
The FE modelling technique can be highly computationally intensive. The structure
must be broken down into a number of small elements. In the simulation of ultrasonic
inspection the maximum element size that can be used is limited by the shortest
wavelength of inspection. The Rayleigh wavelength must therefore be considered at
the highest frequency of interest within the model (Kishore et al, 2000; Pavlakovic,
1998). To ensure model accuracy the required mesh density estimates range between
8 and 20 nodes per wavelength (Schmid, 1997; Alleyne, 1991; Ansys, 1992). The
time step used within the model is also critical to maintain stability. The exact
criterion has been expressed in different ways by other authors (Alleyne, 1991;
Kishore et al, 2000; Pavlakovic, 1998; Drozdz, 2008). However, it is essentially
necessary to ensure that energy cannot propagate across an entire element within the
model in a single time period. The maximum time step that is allowed within the
model is therefore governed by the fastest wave within model.

Ultrasonic Inspection Modelling
_____________________________________________________________________ 78
In realistic structures the number of elements required to generate an accurate model
can rapidly become prohibitive and a series of approximations must be made to limit
the overall model size. All of the models discussed in this thesis are 2-dimensional
and assume plane strain conditions. This approximation is valid as the thickness of
the component is large in comparison to the beam width. However, the widths of the
defects contained in the target application test-pieces are comparable to the width of
the ultrasonic beam, which reduces the accuracy of the approach. In order to limit the
shortest wavelength in the model to the Rayleigh wavelength in stainless steel the
transducer is omitted. The transducer used in this type of inspection uses a Perspex
wedge; ultrasound propagates in Perspex with a short wavelength. In order to
accurately model the actual transducer wedge the element density would need to be
increased which in turn would increase the overall complexity of the model. The
transducer input is therefore simulated using Huygens’ principle. The wavefront was
generated by applying a load to individual nodes on the upper surface of the model.
This is shown for a small number of nodes within the FE model in the schematic
diagram provided in Fig 4-1; the length of the arrow indicates the relative time delay
between each adjacent node. The load applied was modelled using a 5-cycle
Hanning-windowed toneburst, as shown in Fig 4-2 for a 2.25MHz transducer. These
tonebursts were delayed relative to one another in time giving rise to the angled
wavefront. In each model the time delays used were controlled to simulate the
different angles required.

Ultrasonic Inspection Modelling
_____________________________________________________________________ 79
Figure 4-1 Schematic diagram of the excitation method used in the FE models.
a.)
b.)
Figure 4-2 The 5-cycle Hanning-windowed toneburst with centre frequency of 2.25MHz used for nodal excitation of the target application model a) time domain, b) frequency domain.

Ultrasonic Inspection Modelling
_____________________________________________________________________ 80
To reduce the model size further only a section of the component is simulated.
Unfortunately this approach introduces artificial boundaries into the model. Some
signals of interest from the scatterer can be corrupted by reflections from these
artificial boundaries and a sufficiently large model must be generated to eliminate this
issue. Despite the use of all of these approximations it was not possible to accurately
simulate the inspection of the target application using this conventional approach. It
was not possible to increase the overall size of the model sufficiently and the
boundary reflections occurred at a similar time period to some of the signals of
interest from the defect, so an alternative modelling approach was required. The
approach used in this work was the Absorbing Layers using Increasing Damping
(ALID) technique. This approach can be implemented around the model boundaries
in the time domain within ABAQUS (Drozdz et al, 2005; Drozdz et al, 2006; Drozdz,
2008; Liu & Quek Jerry, 2003). The absorbing region is made of a material that has
the same properties as those within the main body of the model apart from having a
gradually increasing damping.
A harmonic plane wave travelling in the x-direction can be defined as:
)exp(),( 0 ikxtiAtxA +−= ω (4-1)
Where A = Amplitude
A0 = initial amplitude
k = Wave number
ω = Frequency
t = Time
When considered in the frequency domain the ALID technique uses the concept of a
complex compression modulus (or just shear modulus for shear waves) or density. If
either of these quantities are complex then this leads to a complex wave number.
Equation (4-1) then becomes:
)](exp[ '''0 xkxiktiAA −+−= ω (4-2)

Ultrasonic Inspection Modelling
_____________________________________________________________________ 81
where k’ = Real wave number
k’’ = Imaginary wave number
The imaginary part, k’’ represents the viscoelastic material properties which is
responsible for the decay of the wave in the absorbing layer (Drozdz et al, 2006;
Ansys, 1992).
The absorbing region is then defined as a series of layers; as the distance between the
layer and the model boundary is increased the damping parameter is also increased.
This change in the wave number between the area of study and the absorbing layer
causes a change in impedance, which can cause some reflections. In order to
minimise these reflections the change in damping between each layer must be kept
small. To enable the dissipation of sufficient energy within the absorbing region and
prevent significant reflections from the model boundary re-entering the region of
interest it may be necessary to use a relatively large number of layers. Although small
spurious reflections can still occur, these can be controlled to acceptable levels. In
this work a reflection of less than -60dB or 0.1% of the incident energy pulse is
considered acceptable.
Typically when using FE models to simulate ultrasonic inspection a uniform linear
quadrilateral mesh is used, and I had adopted this approach in the development of
some early models. The conventional use of the ALID absorbing regions also
depends on this type of deployment. However, the target application component
contains a curved weld cap and a range of defects at different angles. The uniform
linear quadrilateral mesh does not readily conform to this complex geometry. One
solution to address this limitation is to use a very fine mesh and a “staircase”
approach around the weld cap and defect regions (Rajagopal et al, 2008). However,
this approach would significantly increase the computational complexity of the model
and prevent the simulation of the target application. In order to simulate the
inspection of the target application component I adopted a quadratic triangular
element mesh. A schematic diagram of the boundary between the main model and the
ALID region is shown in Fig 4-3; this shows a comparison of the typical usage and
the modified usage of the ALID region.

Ultrasonic Inspection Modelling
_____________________________________________________________________ 82
a) Model Elements -Linear rectangularelements (CPE4R)
ALID Elements -Linear rectangularelements (CPE4R)
b)
Model Elements -Quadratic triangularelements (CPE6M)
ALID Elements -Linear rectangularelements (CPE4R)
Figure 4-3 Schematic diagram of ALID usage, a) conventional usage with linear quadrilateral mesh, b) modified usage with quadratic triangular mesh.
Since the completion of my initial research, further work has been performed by
Drozdz et al (2007) and Rajagopal et al (2008) to improve this approach. In my initial
research the transition between the quadratic triangular elements in the main section
of the model and the linear quadratic elements in the absorbing boundary led to some
spurious reflections. Although these reflections were very low level they were still
present. Subsequent research has developed an approach to generate ALID absorbing
regions using automatically generated quadratic triangular elements. This eliminates
the transition between two different element types and hence reduces the amplitude of
the boundary reflection. It also allows further automation of the model production
and hence improves model development speed. The work by both Drozdz et al and
Rajagopal et al is also funded through the NPCT project and I have provided some
assistance in the development of this approach. This research is also generating a set
of user guidelines for the development of accurate FE models using automatically
generated triangular mesh elements. In the longer term this will assist with the
implementation of FE modelling capability within Rolls-Royce Submarines.

Ultrasonic Inspection Modelling
_____________________________________________________________________ 83
4.3. Target Application Modelling
The inspection of the target application component was simulated using both CIVA
and FE modelling techniques. The approximations discussed in section 4.2 were used
to produce FE models for the inspection of the target application component. In each
case a 2D plane strain model is produced. The transducer has been omitted and the
ultrasonic energy is simulated by using a series of time delayed 5-cycle Hanning
tonebursts, as shown in Fig 4-2. In this approach the probe is modelled using a simple
piston transducer approximation which is a reasonable representation of the single
element inspection of the target application component or an aperture in a contact
array. This approach can also be used to represent an inspection performed using a
single aperture within a wedge coupled phased array. However, due to beam spread
in the wedge the performance of different apertures within an array of this type is not
identical. Simulation of the entire membrane coupled device inspection in FE would
be very time-consuming. A separate simulation for each aperture within the array
would need to be run which would require a substantial amount of computation time
on specialist computer facilities. FE simulation of a scanned single element
inspection to build up a B-Scan image of the inspection volume would require a
similar time investment. This is impractical in an industrial environment and remains
a major limitation of the FE modelling technique. The CIVA modelling package can
be used to simulate this type of scenario and phased array or scanned single element
transducer inspection can be simulated. However, the motivation of this work was to
demonstrate the use of CIVA and FE modelling within the industrial context, to
compare the performance of each simulation technique and to provide a better
understanding of the inspection techniques being used.
To simplify the FE modelling, and to allow comparison between experimental and
both sets of simulated results, all comparisons were carried out with the transducer in
a single position. The transducer position corresponded to the theoretical optimum
location, based on a geometrical study, for maximum defect response for each of the
flaws embedded in the flat plate, non-welded test-pieces. A comparison was then
made between the A-Scan response obtained using the three different techniques. The
transducer used experimentally is a Krautkramer MSWQC ½” diameter circular
single element probe, the same size transducer was also simulated using the CIVA

Ultrasonic Inspection Modelling
_____________________________________________________________________ 84
model. As discussed previously the FE models were simplified by using a 2D
approximation, the width of the element corresponds to the diameter of the transducer.
However, the FE model does not take into account the overall shape of the transducer,
this is a potential source of error in the FE model.
In the FE models produced as part of this work around 16 nodes per wavelength have
been used, which satisfies the maximum node spacing criteria discussed in section
4.2. However, Rajagopal et al (2008) have subsequently performed a more detailed
study of modelling accuracy using this type of mesh. This work concluded that it is
possible to achieve a negligible error in the displacement field from the defect with a
mesh density of 20 nodes per wavelength. However, a mesh density of at least 30
nodes per wavelength is required to ensure a wave propagation velocity error of less
than 1%. In a recent modelling study by Velichko et al (2009) a mesh density of 40
nodes per wavelength were used to reduce errors further in the predicted defect
response. Based on the study performed by Rajagopal et al (2008) the FE models
generated to simulate the inspection of the target application will suffer from a
velocity error of approximately 2% due to the coarseness of the mess used.
Unfortunately, it is not possible to simulate the inspection of the two flat plate, non-
welded test-pieces using a significantly finer mesh because of the geometrical size of
the component. When completing FE modelling of this type of component a
compromise must be reached between model size and accuracy. The target
application component is unexceptional in terms of its geometrical size and much
larger components are routinely inspected within the nuclear industry. The limitation
in terms of modelling accuracy for the inspection of large components is a major
drawback. FE modelling is unlikely to be widely adopted within the nuclear industry
until these limitations can be overcome. Current NPCT research in collaboration with
Imperial College is addressing this limitation and a hybrid ray-tracing/FE model is
under development. I manage this project on behalf of Rolls-Royce and I will be
directly involved in the transfer of this technology into Rolls-Royce when it reaches a
mature level of development.
It is possible to significantly reduce the geometrical size of the FE models by using
ALID absorbing regions. The modified ALID usage described in section 4.2 and
shown in the schematic diagram in Fig 4-3 was used in all of the models generated.

Ultrasonic Inspection Modelling
_____________________________________________________________________ 85
In fact in many cases it is only actually possible to generate the desired FE model by
using absorbing regions. In each of the models, 300 layers have been used within the
ALID regions. The reductions in the model size that can be achieved by using ALID
absorbing regions are significant, and these are summarised for each defect model in
Table 4-1.
Table 4-1 Summary of the reduction in the overall model size when using ALID absorbing regions for FE models to simulate the single element transducer inspection of defects 1-6.
Inspection Size Reduction (%)
Approximate Final Model Size (million elements)
Defect 1 45 2.6 Defect 2 41 2.2 Defect 3 50 3.3 Defect 4 27 3.6 Defect 5 60 5.7 Defect 6 65 5.2
When generating FE models using Abaqus CAE the coordinates of each node and
each element is individually assigned and listed in the input file. This rapidly
increases the size of the input file that must then be manipulated in a text editor
program. It was found that standard text editors (winedt, wordpad, notepad) are not
capable of handling the size of file produced using this approach for the larger models
considered in this work. However, by using an upgraded PC with additional RAM
and Textpad software to manipulate the text file it was possible to generate a
sufficiently large model to simulate the inspection of all of the defects within the
target application test-pieces. Also, despite the use of these approximations the
processing times for these models remains substantial requiring a number of hours,
therefore processing was typically carried out overnight. The use of absorbing
regions is also essential. Without the use of ALID it would not be possible to
generate a model to simulate many of the inspections performed, particularly the
inspection of defects 5 and 6.
The experimental testing has been performed with a high quality transducer with a
short ring down time. The experimental input pulse is clearly observed in each of the
inspections completed. This input pulse has been omitted from both the FE and
CIVA modelling results provided in this thesis.

Ultrasonic Inspection Modelling
_____________________________________________________________________ 86
The FE model structure was generated using the Abaqus CAE with an automatically
generated mesh. When simulating the inspection using CIVA the geometry of the
models was generated using the built-in CIVA drawing package. In both the FE and
the CIVA models the defects were included as isolated geometrical features and in
each case the defect gape was 0.3mm. In these models the faces of the defect are
perfectly parallel and have well defined corners. Mid-wall, non-surface breaking
defects, such as defects 3 and 4, were also generated in this way. However, in the
actual flat plate, non-welded test-pieces these defects are drilled as FBH defects. This
difference in geometry between the experimental and simulated testing is a potential
source of error in both models. In each approach to modelling the through-wall extent
of the mid-wall defect is 5.6mm which accurately represents the diameter of the FBH.
This defect provides an equivalent area to an 8mm x 4mm elliptical defect, which
corresponds to the critical defect size in the component. This approach is taken
because it is a robust and reliable means of ensuring that approximately the same
proportion of the beam energy is reflected by the FBH as would be expected from the
defect.
When obtaining the results experimentally and using the two different approaches to
simulation, standard material property values have been used. In each case these
material properties are used to calculate the propagation velocity of ultrasound in the
component. This ensures that the same values have been used in all three approaches.
The use of standard values and not measured results is routinely used during
experimental testing and allows calibration to be performed on a standard SDH
test-piece prior to testing on the actual component of interest. This approach also
represents the technique typically employed within Rolls-Royce when completing
simulation of an inspection. However, it is possible that the actual material properties
of the calibration test-piece and the two flat plate, non-welded test-pieces are slightly
different from these standard values. This discrepancy in material properties between
the predicted and actual values can lead to errors in the arrival times of the defect
signal.
A comparison of the results obtained experimentally and using the two different
modelling techniques for defects 2, 4 and 5 is provided below. The inspection
modelling results from these three defects provide an insight into the accuracy of the

Ultrasonic Inspection Modelling
_____________________________________________________________________ 87
different simulation techniques. The amplitude of the signals obtained from all three
defects are normalised to that obtained from defect 2, which represents the highest
amplitude signal. This technique allows direct comparison between all three sets of
results. Further details of the development work performed to produce these models
and the results obtained are provided in my 24-month and 30-month reports (Russell,
2007b; Russell 2008a). These results have also been published at the 34th Annual
Review of Progress in Quantitative NDE (Russell et al, 2007) and at NDT 2007, the
46th annual conference of the British Institute of Non-Destructive Testing (BINDT).
4.3.1. Defect 2
A schematic diagram of the inspection of defect 2 is shown in Fig 4-5. A comparison
of the experimental and simulated results obtained from this defect is shown in
Fig 4-6. The experimental calibration of the single element transducer was performed
in-line with BS EN 583-2 (British Standards Institution, 2001); this calibration
demonstrated that the probe angle was not exactly as expected. The wedge used in
this experiment actually generated a 67º longitudinal wave. A transducer producing a
67º longitudinal wave and the associated 29.5º shear wave was simulated in all of the
modelling results presented below. There is a close agreement between the three sets
of results, and a strong Transverse-Longitudinal (TL) response is seen in each case.
The origin of the additional, unlabeled, low amplitude signals seen in the
experimental data is unclear and do not appear in the simulated data. The three sets of
data have been normalised so that the TL signal has an amplitude of unity, this allows
direct comparison between the responses for three different defects considered. There
is a small discrepancy in the defect response arrival time prediction between the three
sets of results. This leads to a difference in arrival time of the TL signal and the
greater separation between the TL signal and the transverse (T) wave response in the
experimental results. Some of this difference may be due to the material property
values used; there is also an additional error in the FE prediction due to the relatively
coarse mesh used. The amplitude of the L-wave tip diffraction signal predicted using
the FE model is very similar to that seen experimentally; however, the signal
predicted using the CIVA modelling approach has a significantly lower amplitude.
This is a limitation of the CIVA model prediction and demonstrates the value of the

Ultrasonic Inspection Modelling
_____________________________________________________________________ 88
using different modelling approaches. The results provided in Table 4-2 demonstrate
that there is close agreement in the predicted signal arrival times obtained using both
models.
Figure 4-4 Schematic diagram of the inspection of defect 2.
Figure 4-5 Comparison of the experimental and simulated A-Scans obtained for defect 2.

Ultrasonic Inspection Modelling
_____________________________________________________________________ 89
Table 4-2 Experimental and simulated TL signals obtained for the inspection of defect 2. The amplitude of each signal has been normalised to unity.
Defect 2 Signal Data Source Amplitude (A.U.) Arrival Time (µs) Experimental 1.00 44
FE Model 1.00 46 CIVA Model 1.00 45
4.3.2. Defect 4
The schematic diagram of the inspection of defect 4 is shown in Fig 4-7. The same
67º longitudinal wave transducer was once again used to gather these results and the
simulations have been performed appropriately to model this behaviour. A prominent
TLL signal is seen in both the simulated and the experimental data obtained from the
inspection of defect 4, this is shown in Fig 4-8. There is once again close agreement
between the positions of the TLL response in each case; this can be seen from the
comparison of the results provided in Table 4-3. In all cases the amplitude of the
main defect TLL response signal recorded using this technique from defect 4 is
significantly lower than that measured from defect 2. This reduction in signal
amplitude is attributable to the longer path length which leads to a much wider beam
at the defect and also the beam offset at the transducer. The amplitude prediction of
the main TLL defect response using both modelling approaches is reasonable,
although both models provide a slight underestimate. The amplitude prediction of the
FE model is closer to the experimental result than that achieved using the CIVA
model.

Ultrasonic Inspection Modelling
_____________________________________________________________________ 90
Figure 4-6 Schematic diagram of the inspection of defect 4.
Figure 4-7 Comparison of the experimental and simulated A-Scans obtained for defect 4.

Ultrasonic Inspection Modelling
_____________________________________________________________________ 91
Table 4-3 Comparison of the experimental and simulated TLL signals obtained for the inspection of defect 4.
Defect 4 Signal Data Source Amplitude (A.U.) Arrival Time (µs) Experimental 0.29 53
FE Model 0.26 56 CIVA Model 0.19 56
In addition to the main signal predicted, a number of additional beam spread signals
also occur because of additional interactions along alternative propagations paths
within the component. These beam spread signals are more prominent in the
simulated results than in the experimental data. In both modelling techniques
background noise has not been included. The material noise in both of the flat plate,
non-welded test pieces is expected to be low, but some grain scatter is inevitable and
this increase in noise leads to the reduction in the experimental signal to noise ratio.
The beam spread signals cannot be distinguished against this background noise in the
experimental case. The discrepancy in the predicted amplitude of the beam spread
signals is also linked to the approximations that have been made when producing the
two modelling results. In both models the transducer has been simulated as a simple
piston, this leads to off-axis beams appearing at a higher amplitude than measured in
experiment.
The lower amplitude signal and the greater uncertainty in the A-Scan indicate the
issues with interpreting data from this type of inspection. In the current inspection of
the actual target application component this technique is used as a secondary detection
technique to confirm the findings of other scans. However, these alternative
techniques rely on techniques that traverse the weld material. As there is no weld
present in the test-pieces used for this testing an inspection technique that traverses
the weld is inappropriate. Inspection of this type of defect through the weld material
will be addressed in chapter 6.

Ultrasonic Inspection Modelling
_____________________________________________________________________ 92
4.3.3. Defect 5
A schematic diagram of the model generated to simulate the inspection of defect 5 is
shown in Fig 4-9. The experimental scanning equipment used only allows a limited
number of probe offsets to be used. Experimental testing has been performed with the
probe index points approximately 154 mm apart. The receiving transducer is placed
as close as possible to the weld without scanning over the weld cap. This ensures that
the maximum coverage is achieved without losing couplant and hence inspection
performance. The probe separation in this inspection is relatively large; this increases
the geometrical size of the model that is required and increases the modelling
complexity. This is particularly challenging in generating the FE model and it is only
possible to model this case with the use of ALID absorbing regions.
Figure 4-8 Schematic diagram of the model for defect 5 - lack of sidewall fusion defect at the OD.
The simulated A-Scans from the FE model and the CIVA model are compared to the
experimental A-Scan recorded for defect 5 in Fig 4-10. Once again the amplitude of
the A-Scan has been normalised to that obtained for the inspection of defect 2. The
amplitude response from this type of inspection is very low and the data is therefore
plotted over a reduced scale in Fig 4-10. Due to the presence of the weld cap the
receiver position used in this inspection is compromised, and this leads to a low level
of defect response. This type of inspection cannot be used experimentally to reliably
detect flaws such as that represented by defect 5. The industrial value of this
technique using standard single element transducers for the inspection of defect 5 is
therefore limited. This issue is one of the motivations for development of the

Ultrasonic Inspection Modelling
_____________________________________________________________________ 93
membrane probe concept. The origin of the low amplitude signal that occurs at a
slightly earlier time to the direct longitudinal wave response in both the FE and CIVA
simulations is unclear. The signal is not observed experimentally and further study of
the interaction mechanism causing this signal was not considered industrially
worthwhile when performing this work.
Figure 4-9 Comparison of the experimental and simulated A-Scans obtained for defect 5.
A comparison of the experimental results to the simulated results obtained using the
FE model and CIVA is provided in Table 4-4. Table 4-4 demonstrates that there is a
reasonable level of agreement between the simulated and the experimental results.
The predicted timing of the main TLL defect response signal is very accurate in both
simulations and a maximum error of 1µs is measured between the models and the
experimental result. There is a discrepancy in the amplitude prediction of the main
TLL response from the FE model; the amplitude prediction of the CIVA model for
this wave mode is more accurate. However, the relative amplitude of the different

Ultrasonic Inspection Modelling
_____________________________________________________________________ 94
signals observed in the FE model is better than that obtained from the CIVA
prediction. The FE model uses a 2D approximation so that the transducer and defect
are both considered infinitely wide. In the CIVA model a more accurate 3D
representation of the inspection is used. It is likely that this leads to differences in the
prediction obtained from the two different modelling approaches.
Table 4-4 Comparison of the experimental and simulated pitch-catch TLL signals obtained for the inspection of defect 5.
Defect 4 Signal Data Source Amplitude (A.U.) Arrival Time (µs) Experimental 0.13 49
FE Model 0.23 48 CIVA Model 0.12 49
Once again noise has been omitted from the simulated results and a number of low
amplitude signals can be clearly observed. Typically a video output can be generated
from the FE model; this can be used to assist in the data interpretation process.
Unfortunately this cannot be done with models of this size, and this reduces some of
the benefits of the modelling process. A video cannot be generated because the size
of the output file generated exceeds the maximum file size that can be processed. An
investigation into the origin of the additional signals arising from the inspection has
therefore been carried out using a basic time of flight calculation technique. The
direct longitudinal wave response arises from an off-axis region of the longitudinal
wave. The longitudinal wave is incident upon the backwall of the model; reflection at
the backwall occurs and generates both a longitudinal wave and a mode converted
shear wave. The mode-converted shear wave is not detected because it does not occur
at a suitable angle. However, the longitudinal wave is reflected back up towards the
defect and the receiver. The reflected longitudinal wave interacts with the defect and
the response is detected by the receiver. This interaction is shown in the schematic
diagram provided in Fig 4-11. The direct transverse wave response observed in each
of the results shown in Fig 4-10 is also due to an off-axis transverse wave reflection
from the backwall of the component impinging on the defect. This interaction is
similar to that shown in Fig 4-11 but occurs at a later time because of the slower
velocity of the transverse wave.

Ultrasonic Inspection Modelling
_____________________________________________________________________ 95
Figure 4-10 Schematic diagram of the beam spread longitudinal-longitudinal wave interaction with defect 5.
4.4. Summary
Modelling is fast, cost effective method of supporting the development of new non-
destructive inspections for safety critical components found within the nuclear
industry. In this chapter I have reviewed the CIVA modelling platform and the FE
method applied to ultrasonic inspection. CIVA is a semi-analytical model developed
by the CEA and used by a wide range of academic and industrial users. CIVA
contains a beam computation model to visualise the ultrasonic field produced by a
transducer and a defect response model that can be used to predict the response from
different defects. CIVA incorporates a drawing package that allows the user to design
different test-piece configurations and to embed complex defect shapes. The CIVA
model contains the Kirchhoff approximation, the Geometrical Theory of Diffraction
(GTD) and the Born approximation and automatically selects the most appropriate
model for the inspection of a given defect. CIVA has been designed to provide a
rapid modelling capability even in relatively complex inspection scenarios. The
CIVA platform is supported by a large team of engineers and scientists and is
constantly being improved. My personal experience with CIVA platform is that the
functionality and usability of the platform have been enhanced significantly in recent
years. However, the defect response approximations within CIVA are not suitable for
use in the near field of the defect or for small defects. CIVA does not offer any
warning messages when it is being used outside its range of validity and relies on the
user being aware of the model’s capability. Although the CIVA model is under
constant development it still does not support some types of inspection.

Ultrasonic Inspection Modelling
_____________________________________________________________________ 96
FE modelling offers an alternative to the CIVA platform and can be used to simulate
inspection techniques not supported by CIVA. FE modelling offers a potentially
accurate method to simulate the inspection of small, complex defects using a wide
range of different techniques. However, FE modelling is relatively complex and
difficult to implement and the quality of the FE model is highly dependent on the skill
of the user. Modelling complexity increases with size and this severely limits the
applicability of the technique in industry. Techniques such as the use of the ALID
absorbing regions help to reduce the overall model size but further research is
required to develop more accessible approaches to FE modelling.
The results comparison between experimental testing and CIVA and FE simulations
demonstrates a reasonable level of agreement between both types of model and
experiment. However, neither of the models offers an entirely accurate simulation of
the inspection, and some differences exist between the simulated and experimental
results. The CIVA simulation models were more easily produced and much faster to
run than the FE simulations. Given the comparable performance of the two different
approaches CIVA modelling is typically considered to be more appropriate in the
industrial context but care must be exercised to ensure the accuracy of the results
produced.
The CEA are working to incorporate the ability to simulate the response from small
and complex defects using FE within the CIVA package. In release 10 of the CIVA
platform it will be possible to buy Athena which is a bespoke FE package and has
been embedded into the CIVA model. Rolls-Royce is also working with the CEA and
researchers at Imperial College to develop a hybrid ray-tracing/FE inspection model
using Abaqus, which is a commercially available FE model. The use of this
combined model will also improve the accuracy of the simulations. The ability to
utilise the strengths of both modelling approaches will be very beneficial and is likely
to facilitate the adoption of modelling tools within industry.

_____________________________________________________________________ 97
5. Membrane Coupled Device Developments In the experimental results presented in chapter 3 there was an internal reflection that
occurs within the 2nd generation membrane probe design. This internal noise signal
corrupts the quality of the inspection data obtained using the 2nd generation membrane
coupled device. In order to deploy the membrane coupled device in a commercial
application the origin of this internal noise signal had to be fully understood and
removed from the inspection image. Analysis of this signal and subsequent redesign
of the 3rd generation membrane coupled device was reported in my 30 month and
36 month reports (Russell, 2008a; Russell, 2008b) and formed the basis for papers
presented at the 35th Annual Review of Progress in Quantitative NDE (Russell et al,
2008) and at NDT 2008, the 47th annual conference of the British Institute of Non-
Destructive Testing (BINDT). A detailed discussion of this work is provided in this
chapter. Firstly, the presence of this internal noise signal within the inspection
volume of interest will be presented. This will be followed by a discussion of the
modelling and experimental work performed to identify the two actual sources of
noise. The first noise source is due to the presence of grating lobes within the 2nd
generation membrane device water path due to the large element pitch used in the
array. The second source of noise, which is the most significant in the 2nd generation
design and which occurs in all phased array wedges, is due to a beam spread signal
within the transducer wedge. I will then discuss the optimisation of the 2nd
generation, 80 element membrane coupled device and the subsequent design changes
that were made in the 3rd generation 128 element device. The performance of the
three different 3rd generation designs in comparison to the 2nd generation will then be
compared considering the inspection of the flat plate non-welded test-pieces.
5.1. Second Generation Membrane Probe Design
In the inspection of some defects contained within the flat plate, non-welded test
pieces, the internal echo signal occurs at a similar time to a signal of interest. This
leads to noise being observed within the data and can prevent accurate defect
detection. This was shown in the results provided previously in Chapter 3. This issue
is particularly significant for defects 2, 3 and 4 where the defect signal occurs at
relatively long time periods. The inspection of defect 3 in the non-welded test-pieces
is shown in Fig 5-1, a schematic diagram of the TL mode conversion technique used

Membrane Coupled Device Developments
_____________________________________________________________________ 98
to detect this type of defect is shown in Fig 5-1(a) and the result obtained using this
technique is shown in Fig 5-1(b).
a.)
Defect 329
65
T L
L
b.)
Figure 5-1a.) Schematic diagram of the inspection technique used for the detection of defect 3, b.) B-Scan recorded during the inspection of defect 3 using the membrane probe with FMC, data is post processed to simulate a 65˚ longitudinal wave probe.
The presence of this noise signal severely degrades the performance of the membrane
coupled phased array, and reducing its effect is critical to the success of the
membrane coupled device development project. Unfortunately it is not possible to
simulate this reflection using CIVA; this is because CIVA was not intended for use as
a transducer wedge design tool and does not simulate multiple reflections within the
wedge. Modelling this reflection using a FE simulation is also not straightforward; a
very fine mesh density would be required because the acoustic wavelength in water is
short. It is therefore not possible to produce an accurate mesh of the entire 80 element
80el membrane probe
TL Response
Internal Noise Band
TLL Response
Weld Cap

Membrane Coupled Device Developments
_____________________________________________________________________ 99
membrane probe housing and a reduced size probe housing must therefore be
considered. In order to generate an accurate model the material properties of the
medium under test must be accurately represented so that the propagation of acoustic
energy can be precisely modelled. Validation of the model produced would also be
required to demonstrate that it accurately represented the physical inspection. It is
achievable to generate validated models of this type, but due to the time associated
with this activity it is not considered viable in an industrial environment. Alternative
modelling approaches were therefore considered to investigate the origin of the
membrane device internal noise.
5.2. Grating Lobe Internal Noise
An initial simulation of the membrane coupled device performance was performed
using QSonic. QSonic is a relatively crude model developed by Imasonic to assist
with the design of phased array transducers. The model has not been extensively
validated (Shipp et al, 2008) but can be used to quickly generate an approximate
solution. QSonic can be used to rapidly understand the nature of the beam transmitted
into the component under test and to assess whether any grating lobes are generated
by the array in both the water wedge and the stainless steel component.
The software was used to investigate the presence and nature of grating lobes within
the membrane coupled device. Grating lobes were discussed in chapter 2 and are a
characteristic of any phased array transducer. The membrane coupled phased array
can be used to generate acoustic energy over a wide range of angles. There is a large
difference in the acoustic impedance of water and stainless steel. Therefore only
energy produced by the membrane probe over a limited angular range can propagate
into the stainless steel component. The 2nd critical angle for propagation of any
ultrasound into stainless steel using the membrane coupled phased array is
approximately 29º. This corresponds to the absolute maximum required steering
angle when using the membrane probe approach. By substituting this value into
equation (2.28) an element pitch of approximately ≤2λ/3 must be used to eliminate
any grating lobes. This larger element pitch is acceptable because the overall steering
range is relatively limited. In order to eliminate grating lobes under all operational
conditions an element pitch of ≤λ/2 must be adopted.

Membrane Coupled Device Developments
_____________________________________________________________________ 100
The 2nd generation 80 element membrane coupled device design was selected to allow
the complete inspection of the flat plate, non-welded test-pieces from the minimum
number of axial transducer positions. In order to achieve this objective a
comparatively large footprint device was required and a device with a relatively large
element pitch was selected. The pitch of the 80 element array violates the 2λ/3 rule
when coupled to the water filled wedge. Equations (2.27) and (2.28) along with
QSonic were used to quantify this issue and to understand whether the internal
reflection observed in the testing performed using the 2nd generation device is related
to the presence of a grating lobe.
In order to generate these results the probe configuration must be input to QSonic via
a graphical user interface. The number of elements, the element width and pitch, the
array angle and the steering angle are all required along with the ultrasonic velocity in
the wedge and test material. The images in Fig 5-2 have been obtained by simulating
the 2nd generation membrane coupled device using QSonic, in each case the main
beam is shown in red and the grating lobes are shown in blue. In all cases a 2MHz,
80 element array with a water wedge angle of 13.5º, an element pitch of 1.25mm and
element width of 1mm is modelled. In Fig 5-2a there is no beam steering and a
longitudinal wave at the natural angle of the array is produced. In Fig 5-2b the beam
is steered to produce a 0º longitudinal wave in stainless steel. Finally in Fig 5-2c a
high angle shear wave is produced with an angle of incidence at the outer surface of
28.7º which corresponds to the shear wave critical angle between water and stainless
steel. This study demonstrates that at least two grating lobes are present in the
membrane device at all beam angles and that a third grating lobe is observed when
steering over a large angular range. The results presented in Fig 5-2 also demonstrate
that when the array is steered over large angles grating lobes can exist within the steel
component. These extreme cases were not used in the inspection of the two flat plate
non-welded test-pieces but are required to provide a complete inspection capability.
A summary of the grating lobes and the angles at which these are generated is
included in table 5-1.

Membrane Coupled Device Developments
_____________________________________________________________________ 101
a.)
b.)
c.)
Figure 5-2 QSonic images based on current membrane probe design a.) No beam steering, b.) Steering to 0º, c.) Steering to shear wave critical angle.
Water/Steel Interface
Array Aperture
Main Beam in Water
Grating Lobe
Longitudinal Wave
Array Aperture
Water/Steel Interface
Main Beam in Water
Grating Lobe
Longitudinal Wave
Shear Wave
Grating LobeArray Aperture
Water/Steel Interface
Grating Lobe in Steel

Membrane Coupled Device Developments
_____________________________________________________________________ 102
Table 5-1 Summary of the results obtained from the QSonic study to investigate the grating lobes produced by the 2nd generation membrane coupled device over different steering angles.
Angle of incidence
Grating lobe angles relative to main beam in water (º)
Grating lobe angles relative to main beam in steel (º)
13.5 -22.8 49.8 - - 0.0 -42.1 34.5 85.4 - 28.7 -5.8 -53.7 72.2 -12.0
The data obtained concerning the membrane coupled device using QSonic was then
used to support a theoretical analysis. The prototype membrane coupled device was
designed to generate a longitudinal wave with a natural angle of 65º in stainless steel;
this beam angle is used in the majority of the flat plate, non-welded test-piece
inspections. Therefore, in order to carry out the theoretical study the natural angle
inspection configuration was considered, which is shown in the schematic diagram in
Fig 5-3. It can be seen that in this configuration two grating lobes are generated, these
occur at approximately ±36º relative to the main beam, or -23º and +50º relative to the
surface normal. QSonic does not provide any information regarding the relative
amplitude of the different grating lobes. However, CIVA can be used to provide this
data and the relative amplitude of the three beams can be observed in the CIVA beam
propagation model shown in Fig 5-4a. In this simulation an aperture of 20 elements
has been used to generate the image. The CIVA plot demonstrates that the amplitude
of the grating lobes is very small in comparison to the amplitude of the main beam.
An echodynamic response generated along the water/steel interface in the CIVA plot
is also included in Fig 5-4b. The echodynamic is a plot of the signal amplitude along
this interface. Analysis of this result demonstrates that the highest amplitude grating
lobe signal is approximately 19dB lower in amplitude than the main beam at the
component interface.

Membrane Coupled Device Developments
_____________________________________________________________________ 103
Figure 5-3 Schematic diagram of the prototype membrane coupled device, showing the main beam and the two associated grating lobes.
a.)
b.)
Figure 5-4 a.) CIVA beam plot obtained from a 20element aperture using the 2nd generation membrane probe demonstrating the relative amplitude of the main beam and the two grating lobes, image is shown with a dynamic range of 30dB, b.) the echodynamic response along the water/steel interface.
Main BeamBackward Facing
Grating Lobe
Forward Facing Grating Lobe
Simulated Array
Active Aperture
0mm 100mm 0mm
45mm

Membrane Coupled Device Developments
_____________________________________________________________________ 104
As the inspection angle is electronically steered, the angle of each grating lobe is
fixed relative to the main beam. Therefore in the 2nd generation prototype membrane
coupled device when a 65º longitudinal wave is generated in steel, the forward facing
grating lobe at water occurs at 50º relative to the component surface normal. This
water wedge grating lobe reflects from the outer surface of the component under test
and propagates towards the front face of the wedge housing. A schematic diagram of
the grating lobe path is shown in Fig 5-5. The angle of the front face of the
membrane device housing has been suitably selected to minimise the amount of
energy associated with this beam that is reflected back towards the active aperture.
The amplitude of the beam associated with this reflection path is therefore expected to
be very low. The path length of this signal is also long and varies depending on the
active aperture. Therefore any signal that does return to the active aperture will occur
at a delayed point in time and will not interfere with the defect signals of interest
within the inspection. Due to the variable path length this reflection does not form a
single well defined signal and this reflection path does not contribute to the internal
noise band observed in Fig 5-1(b).
Main Beam Path50
Grating LobePath
Figure 5-5 Schematic diagram of the prototype membrane coupled device, showing the forward facing grating lobe internal reflection path.
As previously stated the backward facing grating lobe occurs at -36º from the main
beam, or -23º from the surface normal. The angle of the grating lobe relative to the
component outer surface therefore changes depending on the inspection angle
selected. A geometrical study of the grating lobe path using the 2nd generation
prototype membrane coupled device was performed for different angles of incidence;
schematic diagrams of the configurations considered are shown in Fig 5-6 for angles
of incidence between approximately 0º and 20º. The path length is calculated for
energy at the centre of the beam through measurement based on the schematic

Membrane Coupled Device Developments
_____________________________________________________________________ 105
diagrams assuming a wave velocity in water of 1483ms-1. This reflection path was
not considered in the design of the 2nd generation membrane coupled device and
hence the probe was not designed to avoid this issue. It is clear from these figures
that the path length of the grating lobe reflection changes significantly with the
steering angle used. If the grating lobe reflection causes the internal noise band
observed in the data then the time and hence position of the noise band would vary
with changing angle of incidence. A geometrical analysis of the predicted time
associated with the grating lobe noise band for each beam shown in Fig 5-6 is
provided in Table 5-2. Once again this analysis has been performed assuming a 20
element aperture so that the minimum length reflection path corresponds to elements
1-20 and the maximum corresponds to elements 61-80. The effective noise path
length is the difference in time between the noise path and the main beam. This
corresponds to the time at which any noise would be measured experimentally.
a.)
Main Beam Path
Grating Lobe Path
b.)
Main Beam Path
Grating Lobe Path
c.)
Main Beam Path
Grating LobePath
Figure 5-6 Schematic diagrams of the grating lobe reflection path occurring in the 2nd generation membrane coupled device at different angles of incidence, a.) 0º incidence angle, 0º longitudinal wave, b.) 10º incidence angle, 45º longitudinal wave, c.) 20º incidence angle, 45º shear wave.
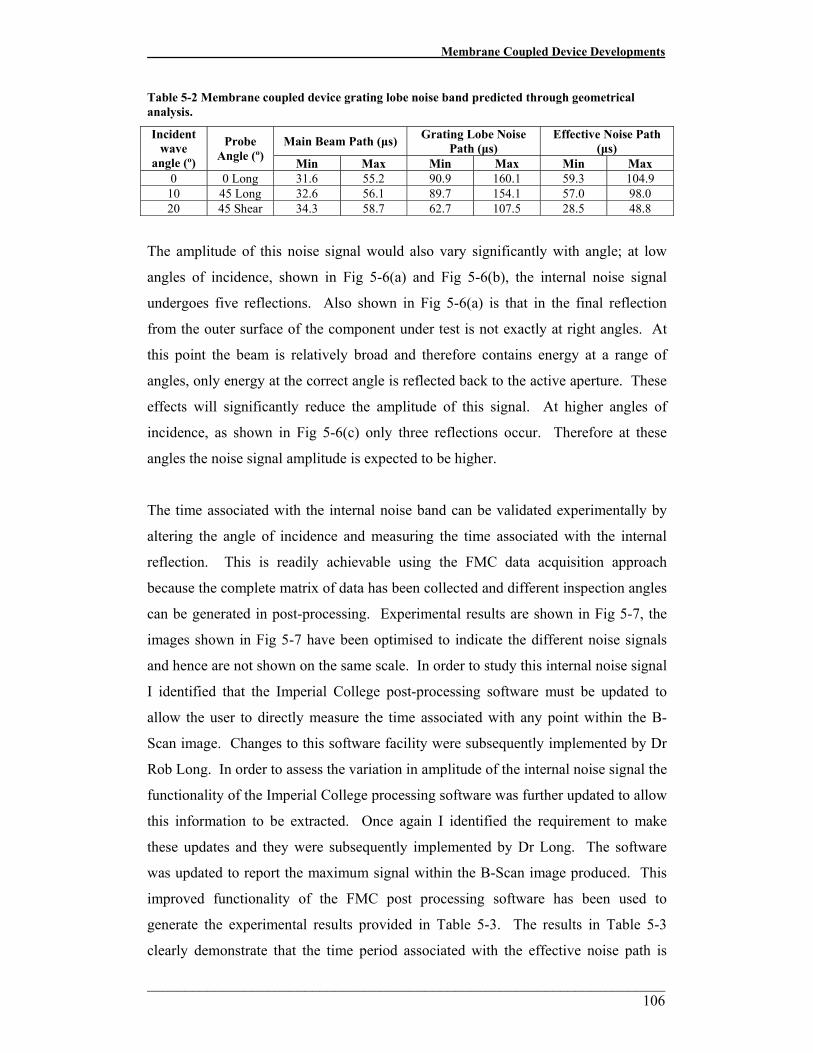
Membrane Coupled Device Developments
_____________________________________________________________________ 106
Table 5-2 Membrane coupled device grating lobe noise band predicted through geometrical analysis.
Main Beam Path (μs) Grating Lobe Noise Path (μs)
Effective Noise Path (μs)
Incident wave
angle (º)
Probe Angle (º) Min Max Min Max Min Max
0 0 Long 31.6 55.2 90.9 160.1 59.3 104.9 10 45 Long 32.6 56.1 89.7 154.1 57.0 98.0 20 45 Shear 34.3 58.7 62.7 107.5 28.5 48.8
The amplitude of this noise signal would also vary significantly with angle; at low
angles of incidence, shown in Fig 5-6(a) and Fig 5-6(b), the internal noise signal
undergoes five reflections. Also shown in Fig 5-6(a) is that in the final reflection
from the outer surface of the component under test is not exactly at right angles. At
this point the beam is relatively broad and therefore contains energy at a range of
angles, only energy at the correct angle is reflected back to the active aperture. These
effects will significantly reduce the amplitude of this signal. At higher angles of
incidence, as shown in Fig 5-6(c) only three reflections occur. Therefore at these
angles the noise signal amplitude is expected to be higher.
The time associated with the internal noise band can be validated experimentally by
altering the angle of incidence and measuring the time associated with the internal
reflection. This is readily achievable using the FMC data acquisition approach
because the complete matrix of data has been collected and different inspection angles
can be generated in post-processing. Experimental results are shown in Fig 5-7, the
images shown in Fig 5-7 have been optimised to indicate the different noise signals
and hence are not shown on the same scale. In order to study this internal noise signal
I identified that the Imperial College post-processing software must be updated to
allow the user to directly measure the time associated with any point within the B-
Scan image. Changes to this software facility were subsequently implemented by Dr
Rob Long. In order to assess the variation in amplitude of the internal noise signal the
functionality of the Imperial College processing software was further updated to allow
this information to be extracted. Once again I identified the requirement to make
these updates and they were subsequently implemented by Dr Long. The software
was updated to report the maximum signal within the B-Scan image produced. This
improved functionality of the FMC post processing software has been used to
generate the experimental results provided in Table 5-3. The results in Table 5-3
clearly demonstrate that the time period associated with the effective noise path is

Membrane Coupled Device Developments
_____________________________________________________________________ 107
very consistent over different incident angles. In table 5-3 the amplitude of the
internal noise signal is estimated by reducing the size of the B-Scan image produced
by the post processing software so that only the noise signal is present. The values
reported in Table 5-3 are therefore only indicative of the signal amplitude of the
region of the internal noise signal imaged. The amplitude of the internal noise signal
gradually decreases as the angle of the ultrasonic beam generated is increased. If the
internal noise signal were due to the grating lobe signal the opposite effect would
occur. As the angle of the ultrasonic beam is increased the grating lobe beams
undergo less reflections and an increased amplitude signal is expected. The analysis
of the time and amplitude of the internal noise signal demonstrates that the grating
lobe noise band does not significantly contribute to the noise observed in the
experimental data.
a.)
b.)
c.)
Figure 5-7 Experimental results obtained using the membrane coupled phased array device, a.) 0º incidence angle, 0º longitudinal wave, b.) 10º incidence angle, 45º longitudinal wave, c.) 20º incidence angle, 45º shear wave.
Internal Noise
3rd Backwall Reflection
Component Surface
Phased Array
Component Surface
Internal Noise
Phased Array
Component Surface
Internal Noise
2nd Backwall Reflection
Phased Array

Membrane Coupled Device Developments
_____________________________________________________________________ 108
Table 5-3 2nd generation membrane coupled device internal noise band experimental results.
Effective Noise Range (μs) Incident wave
angle (º) Probe
Angle (º) Min Max
Signal Amplitude
(A.U.) 0 0 Long 80 120 40 10 45 Long 80 120 19 20 45 Shear 80 120 15
5.3. Beam-Spread Internal Noise
A source of internal noise, which occurs in all phased array wedges, is due to beam
spread within the wedge material. In the majority of phased array inspections an
aperture within the phased array is used to generate the ultrasonic beam. The beam
generated by this aperture is not perfectly collimated and some beam spread due to the
effects of diffraction is observed. Some energy is generated at the correct angle to
reflect from the component outer surface, back up to the phased array. It impinges
normally on the phased array and then follows the same path in reverse back to the
active aperture. This reflection path is shown for a simple 0˚ longitudinal wave
inspection using the membrane probe in the schematic diagram in Fig 5-8. As shown
in Fig 5-8 it is the beam energy that occurs at an angle equivalent to the wedge angle
that contributes to this internal noise signal. The effect of the internal noise signal is
highly dependent upon the aperture size used. As the aperture size is increased the
beam generated becomes more collimated in nature and the amount of beam spread
reduces. The amplitude of the beam spread noise signal therefore decreases and
inspection performance improves. This implies that if the array design cannot be
controlled to completely remove the internal noise signal from the region of interest
then a large aperture should be used to mitigate the deleterious effects of the beam
spread noise signal.

Membrane Coupled Device Developments
_____________________________________________________________________ 109
Figure 5-8. Schematic diagram of the beam spread noise signal in a simple case where the main beam is steered to normal incidence.
As stated, this beam-spread reflection occurs in all angled wedge phased arrays, this is
indicated in the experimental results provided in Fig 5-9. In Fig 5-9(a) a 48 element,
1.25mm pitch linear array with a conventional rigid Perspex wedge has been used.
The Perspex wedge has a 6mm first element standoff and an angle of approximately
21˚, which is used to generate a longitudinal wave with a natural angle of 65˚ in
stainless steel. In Fig 5-9(b) the 80 element 2nd generation membrane probe with a
13˚ wedge angle and a 25mm first element standoff is used. The beam spread internal
signal in the 48 element Perspex wedge transducer occurs between approximately
18µs and 38µs which corresponds to a region between the front wall and back wall
echoes. The beam spread signal in the 2nd generation membrane coupled device
occurs between approximately 80µs and 120µs which corresponds to a range between
the 2nd and 3rd back wall signals. This difference in time associated with the internal
beam spread noise signal is due to the higher velocity of sound in the Perspex in
comparison to the water. The time measurements performed have been made directly
from the highest amplitude part of the signal in B-Scan images shown in Fig 5-9.
This approach is slightly subjective and the times are only approximate but it does
provide an indication of the time associated with the signal. It is clear that the
amplitude of the signal in Fig 5-9(b) is higher than that seen in Fig 5-9(a). A similar
approach to that described in section 5.2 can be taken to assess the difference in the
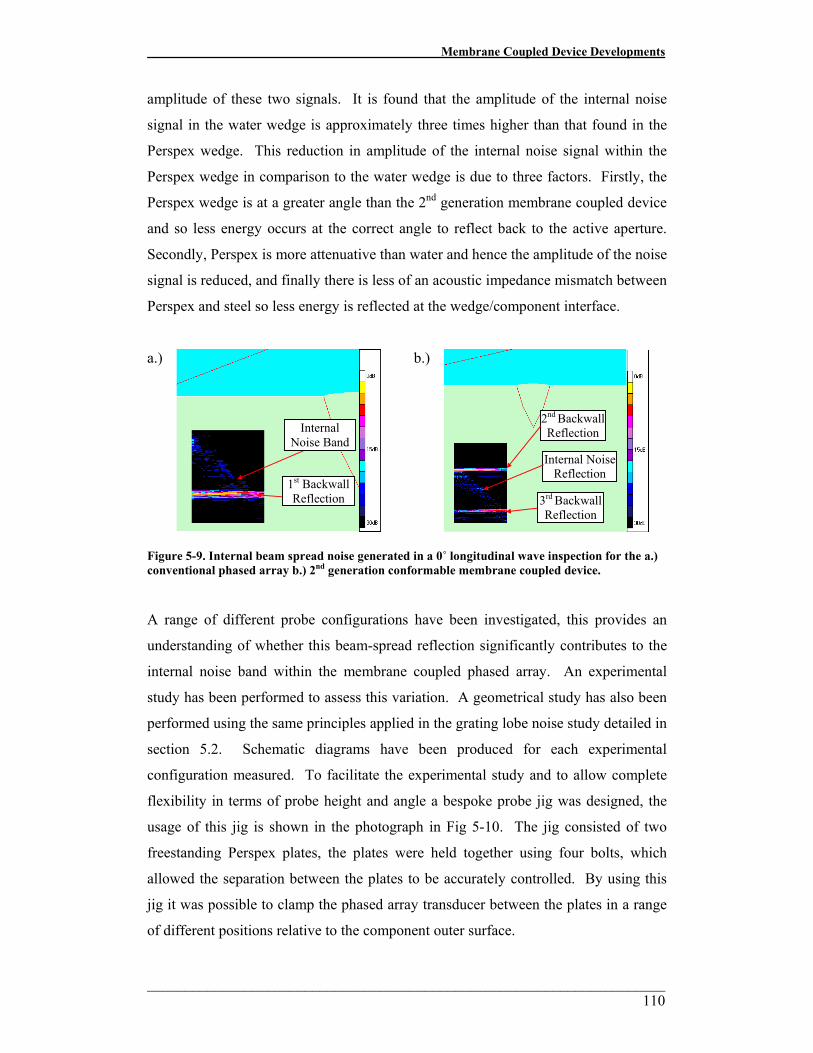
Membrane Coupled Device Developments
_____________________________________________________________________ 110
amplitude of these two signals. It is found that the amplitude of the internal noise
signal in the water wedge is approximately three times higher than that found in the
Perspex wedge. This reduction in amplitude of the internal noise signal within the
Perspex wedge in comparison to the water wedge is due to three factors. Firstly, the
Perspex wedge is at a greater angle than the 2nd generation membrane coupled device
and so less energy occurs at the correct angle to reflect back to the active aperture.
Secondly, Perspex is more attenuative than water and hence the amplitude of the noise
signal is reduced, and finally there is less of an acoustic impedance mismatch between
Perspex and steel so less energy is reflected at the wedge/component interface.
a.)
b.)
Figure 5-9. Internal beam spread noise generated in a 0˚ longitudinal wave inspection for the a.) conventional phased array b.) 2nd generation conformable membrane coupled device.
A range of different probe configurations have been investigated, this provides an
understanding of whether this beam-spread reflection significantly contributes to the
internal noise band within the membrane coupled phased array. An experimental
study has been performed to assess this variation. A geometrical study has also been
performed using the same principles applied in the grating lobe noise study detailed in
section 5.2. Schematic diagrams have been produced for each experimental
configuration measured. To facilitate the experimental study and to allow complete
flexibility in terms of probe height and angle a bespoke probe jig was designed, the
usage of this jig is shown in the photograph in Fig 5-10. The jig consisted of two
freestanding Perspex plates, the plates were held together using four bolts, which
allowed the separation between the plates to be accurately controlled. By using this
jig it was possible to clamp the phased array transducer between the plates in a range
of different positions relative to the component outer surface.
1st Backwall Reflection
Internal Noise Band
2nd Backwall Reflection
3rd Backwall Reflection
Internal Noise Reflection

Membrane Coupled Device Developments
_____________________________________________________________________ 111
Figure 5-10 Photograph of the bespoke probe jig for internal noise signal measurements.
All experimental results have been obtained using an aperture of 20 elements, which
corresponds to 25mm. As in the grating lobe internal noise study, the minimum
length reflection path corresponds to elements 1-20 and the maximum corresponds to
elements 61-80. The minimum and maximum experimental values have again been
measured directly from the B-Scan image produced using the FMC post processing
software. The theoretical beam path lengths have been predicted based on the
schematic diagrams by considering energy at the centre of the beam. A comparison
of the results obtained to assess the time associated with the internal noise signal
using both the geometrical study and experimentally is provided in Table 5-4. In
order to produce the results in Table 5-4 the gain used in the experimental set-up must
be changed so that internal noise signal is at a sufficiently high level for accurate
measurements to be taken. This variable gain has been compensated for when
calculating the amplitude of the internal noise signal measured experimentally.
Evaluation Block 2
Phased array transducer
Flexible probe jig

Membrane Coupled Device Developments
_____________________________________________________________________ 112
Table 5-4 A comparison of the membrane coupled device beam spread noise predicted through geometrical analysis and found experimentally.
Theoretical Effective
Noise path (μs)
Experimental Effective
Noise path (μs)
Wedge Material
Number of
Elements
Probe Angle
(˚)
1st Element Height (mm) Min Max Min Max
Experimental Internal Noise
Amplitude (A.U.)
Water 80 13 14 44 86 42 86 4.2 Water 80 13 21 62 104 60 104 4.2 Water 80 13 35 96 140 98 142 4.2 Water 80 18 21.5 62 118 64 128 3.8 Water 80 18 38.5 102 144 106 150 3.8 Water 80 5 11.0 32 50 35 54 20.9 Water 80 10 11.5 36 70 40 72 6.2 Water 80 15 12.5 40 88 46 92 3.5 Water 80 20 13.5 42 102 42 108 3.1 Water 80 25 14.0 42 112 Not visible1 Not visible1 Water 80 30 15.0 42 116 Not visible1 Not visible1
Perspex 48 21 9.0 16 38 18 38 2.9 Notes 1 The internal noise signal is not observed even when the experimental gain used is increased.
It is clear based on the results provided in Table 5-4 that there is generally a very
good agreement between the times associated with the theoretical and experimental
effective noise band. This indicates that the noise signal observed during the
inspection of the flat plate, non-welded test pieces is due to beam spread noise. There
are some minor discrepancies between the two results; much of this is due to
experimental measurement inaccuracy and the positioning of the array relative to the
component surface. The amplitude of the internal reflection is also relatively low and
occurs over a finite time period, as stated above there is therefore some subjectivity in
the exact time associated with this noise.
The amplitude of the internal noise signal is highly dependent upon the angle of the
array relative to the component outer surface. This effect is clearly seen from the
experimentally measured signal amplitude for each array configuration in Table 5-4.
The results provided in Table 5-4 demonstrate that when the angle of the array is
increased, the amplitude of the noise signal decreases and that when the water wedge
angle is increased to 25˚ or greater that no internal noise signal is observed. Therefore
at high array angles the impact of the noise band diminishes. This effect can be seen
in the B-Scan image in Fig 5-11; this image has been produced using the 15mm, 30º,

Membrane Coupled Device Developments
_____________________________________________________________________ 113
80 element array configuration. The image provided in Fig 5-11 has been produced
using a large dynamic range of 40dB but the internal noise signal is not discernible
against the background noise.
Figure 5-11 B-Scan image generated for a 0˚ longitudinal wave inspection for the 80 element, 15mm, 30º array configuration.
5.4. Optimised 80 Element Device Design
The investigations detailed above provide an insight into the use of wedge-coupled
phased arrays, this improved understanding can be used to optimise the device design
and improve performance of the membrane probe. As stated previously one method
of reducing the amplitude of the internal noise band would be to increase the angle of
the array. However, in this configuration the array must be steered over a wide angle
in order to generate energy at the required beam angle. This leads to a deterioration in
beam performance and decreases the effectiveness of the inspection. An alternative
approach is to control the time associated with the internal noise band so that the
signal occurs outside the region of interest for the inspection. There is a particular
region of interest in the inspection of each of the defects present in the flat plate, non-
welded test pieces. The approximate time period associated with the main defect
signal is provided for each defect in Table 5-5. The internal noise band can be moved
in two ways, either by reducing or increasing the time at which the reflection occurs.
In order to increase the time associated with the internal reflection the height of the
array must also be increased. Unfortunately a prohibitively large device would be
required to delay the noise signal sufficiently to provide a suitable inspection for all
six defects. Also as the height of the array is increased the footprint must also be
2nd Backwall signal
3rd Backwall signal
1st Backwall signal

Membrane Coupled Device Developments
_____________________________________________________________________ 114
extended in order to avoid further internal reflections. This would be an issue in the
actual target application where the large footprint would compromise performance on
the elbow section of the pipe work and where access is limited. A more appropriate
approach is to reduce the height of the array so that the internal reflection occurs as
early as possible.
Table 5-5 Approximate time range of interest in the inspection of defects 1-6.
Approx Range of Interest (μs) Defect Min Max 1 45 60 2 40 55 3 65 75 4 50 60 5 60 75 6 60 75
When using the membrane coupled device the minimum standoff between the first
element and the component outer surface is determined by the ride-height of the array.
In turn this is governed by the weld cap height that must be dealt with during the
inspection. In the current application a ride-height of approximately 6mm is used to
ensure that any anticipated variations in weld cap height can be accommodated. The
80 element transducer used in the current membrane probe design has a “skirt” which
extends 5mm around the footprint of the array; this skirt is used to ensure that a seal
can be maintained between the array and the probe housing. A schematic diagram of
the probe design is shown in Fig 5-12. The skirt and the transducer ride-height
requirement limits the minimum array height. When using this array, the minimum
element height that can be attained is approximately 7mm. This design allows the
target application weld cap, which is approximately 3-4mm in height, to be
accommodated. The optimised array configuration using this array height and a
transducer angle of approximately 8º is shown in the schematic diagram in Fig 5-13.

Membrane Coupled Device Developments
_____________________________________________________________________ 115
a.)
b.)
Figure 5-12 Schematic diagram of the 80 element membrane coupled device transducer a.) side view, b.) plan view.
7mm8°
Figure 5-13. Schematic diagram of the optimised membrane coupled device housing.
In the optimised 80 element membrane coupled device design the beam spread and
grating lobe noise signals still exist but occur much earlier in time, this is shown
experimentally in Fig 5-14. The arrival time of the beam spread noise signal in the
optimised design coincides with the first backwall signal and is comparable to that
found when using the Perspex wedge, shown previously in Fig 5-9(a). In the result
shown in Fig 5-14 the grating lobe noise signal is also clearly seen. In the optimised
design both of the noise signals occur before the inspection time period of interest,
which allows an accurate inspection to be performed.

Membrane Coupled Device Developments
_____________________________________________________________________ 116
Figure 5-14. Internal noise signals in the optimised membrane coupled device.
The inspection results obtained from defect 3 using the conventional 48 element
Perspex wedge transducer and the optimised 80 element membrane coupled device
are shown in Fig 5-15. The result shown in Fig 5-15(b) has been obtained using the
optimised membrane probe configuration; this result clearly demonstrates that the
noise band has been removed from the region of interest. This result shows that
through the optimisation of the design the performance of the membrane coupled
device can be improved so that it is in line with conventional technology. The signal
to noise ratio of the results shown in Fig 5-15(b) is comparable to that shown for the
conventional array in Fig 5-15(a).
1st Backwall Reflection
Beam Spread Noise2nd Backwall
Reflection
Grating Lobe Noise

Membrane Coupled Device Developments
_____________________________________________________________________ 117
a.)
Figure 5-15. Results obtained from the inspection of defect 3 using a.) conventional phased array, b.) optimised conformable membrane coupled device.
5.5. 3rd Generation Device Design
5.5.1. Coupling
The 2nd generation membrane probe housing design did not incorporate any system
for irrigation, therefore in order to ensure good coupling was constantly maintained
between the probe and the component immersion testing has been used. In immersion
testing the membrane is not actually required; however, testing using this approach
has allowed the probe performance to be verified without the potential issue of
variable coupling. Unfortunately immersion testing is typically not possible in
submarine applications because in-situ testing must be performed on large
components. In submarine inspections coupling is typically maintained by providing
water irrigation either through the probe itself or through the probe holder assembly.
TLL Signal
TL Response
TLL Signal
TL Response

Membrane Coupled Device Developments
_____________________________________________________________________ 118
In the 3rd generation membrane coupled device design self-irrigation was investigated.
The simplest mechanical solution to provide coupling would have been to puncture
the membrane material itself. This technique would provide coupling to the
membrane interface but would also increase the likelihood of damaging the
membrane. It may also become challenging to ensure sufficient water flow to achieve
coupling whilst maintaining the required membrane pressure and not introducing air
into the membrane probe cavity. An alternative approach was to integrate an
irrigation system into the probe housing. A separate water flow is then used to
maintain membrane pressure and to provide coupling. In the 3rd generation design
water is injected through the metallic base plate to maximise coupling between the
membrane and the component, this is shown in the schematic diagram in Fig 5-16. In
this design water will be delivered to the membrane – component interface through
eight 2mm diameter tubes. Each of the housing designs discussed below use this
same base-plate, this allows component re-use if required. A photograph of one of the
3rd generation membrane devices in use is provided in Fig 5-17. The main water feed
into the front of the device is clearly seen being split into the eight individual feed
pipes. This is a prototype design, which as will be discussed in detail below has
proved successful at providing sufficient coupling between the membrane and the
component under test. However, the overall size of the device is increased
significantly by the inclusion of these tubes. Subsequent probe designs will
incorporate irrigation channels in the delrin probe housing to reduce the overall probe
size.

Membrane Coupled Device Developments
_____________________________________________________________________ 119
BasePlate
Membrane
Water Flow
Figure 5-16 3rd generation membrane probe base plate design.
Figure 5-17 Photograph of the 3rd generation membrane coupled device showing the integrated irrigation system.
5.5.2. 3rd Generation Membrane Device Configurations
The transducer used in the non-destructive inspection of a component is optimised for
the specific application. Current development of the membrane coupled phased array
device is focussed on the target application inspection. The target application is a
relatively large, thick walled section of pipe work. In order to minimise the amount
of axial mechanical scanning required a large footprint array is used; this improves
the inspection speed and can be used to provide high levels of focusing at long

Membrane Coupled Device Developments
_____________________________________________________________________ 120
distances. However, the number of array elements that can be supported is limited
due to the phased array controller and the complexity of designing and manufacturing
very large arrays. This trade-off leads to the element pitch used in the array
exceeding the λ/2 element spacing rule and grating lobes exist which contribute to the
internal noise as discussed in chapter 3. The 1.25mm element pitch used in the 2nd
generation membrane coupled device design gave rise to at least two grating lobes
within the probe housing at all steering angles. In this design, grating lobes can also
exist within the component when generating some beam angles. Grating lobes within
the component cannot reliably be compensated for in all inspection scenarios.
Therefore in the 3rd generation design a smaller element pitch was selected. Analysis
using QSonic indicates that no grating lobes can exist in the component if an element
pitch of 0.75mm is selected. Grating lobes still exist within the water wedge but these
are low amplitude and occur at an angle of approximately ±81º to the main beam, thus
reducing the potential source of noise.
The phased array controller units that have been used to acquire data and to support
the membrane probe development work are limited to 128 channels. This limits the
active aperture of the 3rd generation device to approximately 96mm, which is
comparable to the 80 element device used previously. Therefore all of the techniques
that have been used to date should also be appropriate for the welded test piece
inspection. The inspection of these test-pieces and the results obtained will be
discussed in detail in chapter 6. This also implies that a similar approach to that
discussed in chapter 3 can again be used to minimise the effect of noise in these
inspections. In the 3rd generation device the transducer skirt was moved to the upper
edge of the probe. This allows the first element height to be reduced as much as
possible and reduces the time associated with the internal noise signals as much as
possible. A schematic diagram of this probe design is shown in Fig 5-18.

Membrane Coupled Device Developments
_____________________________________________________________________ 121
a.)
b.)
Figure 5-18 3rd generation membrane probe design, array has an approximate 6mm first element standoff height and angle of 7º.
The 3rd generation membrane coupled device has been designed to support the
inspection of two flat plate welded test-pieces that are designed to representative of
the target application component. In the welded test piece inspection a number of
additional defects and inspection techniques will be considered. This will include a
number of direct specular techniques; these techniques traverse the austenitic weld
material and are commonly used to minimise the ultrasonic path length in noisy
materials such as stainless steel. These techniques use longitudinal waves because
this wave mode is less affected than vertically polarised shear waves by the material
variations within the austenitic weld. The membrane coupled device design shown in
Fig 5-18 is inappropriate for this type of inspection because the internal noise signal
will overlap with the time period of interest. Two different designs were considered
to address these inspections, in the first design a 20mm first element standoff and an
array angle of 18º was implemented. This increased standoff delays the internal noise
reflection in time, making it suitable for the direct specular inspection techniques. The
array angle is selected to minimise the amount of steering required in each of the
techniques used, thus optimising beam performance; this design is shown in the
schematic diagram provided in Fig 5-19. The final design used a 6mm first element
standoff and a 25º array angle and is shown in Fig 5-20. In this configuration the
noise signal still occurs at an early time period, as in the 6mm standoff, 7º design, but

Membrane Coupled Device Developments
_____________________________________________________________________ 122
the amplitude was reduced significantly. However, as stated previously in section 5.3
the beam produced using this design has to be steered over a large angle in each of the
inspections. This will potentially degrade the beam quality and limit the inspection
performance. This was investigated experimentally and will be discussed in section
5.7.
a.)
MembraneIrrigation feed
18°
b.)
20mm
Linear Phased Array
Figure 5-19 3rd generation membrane probe design, array has a 20mm first element standoff height and angle of 18º.

Membrane Coupled Device Developments
_____________________________________________________________________ 123
a.)
MembraneIrrigation feed
25°
b.)
Linear Phased Array
6mm
Figure 5-20 3rd generation membrane probe design, array has a 6mm first element standoff height and angle of 25º.
Imasonic were once again selected as the most appropriate vendor to manufacture the
128 element array. Through consultation with transducer design experts at Imasonic
an element width of 15mm was chosen as most appropriate for the 3rd generation
design to ensure good electrical impedance matching between the array controller and
the transducer elements. This design maximises transducer sensitivity and minimises
ringing. A 15mm width also ensures a suitably collimated beam is generated with
minimal beam spread in the lateral dimension.
5.6. 3rd Generation Device Performance
5.6.1. Comparison of Irrigation and Immersion Inspection
All testing performed with the 80 element 2nd generation membrane coupled phased
array device was performed in immersion. The 3rd generation probe was
manufactured to include an irrigation system. This is required in most industrial
inspection scenarios where it is impractical to complete testing in immersion.
However, it is important to establish that the inspection performance of the device is
not degraded by moving from an immersion technique to an irrigated approach. The

Membrane Coupled Device Developments
_____________________________________________________________________ 124
probe design had also been updated to include a layer of AptFlex F28 absorbent
rubber (Precision Acoustics, Dorset, UK) on all of the internal faces of the probe
housing. A comparison of the performance of the 6mm stand-off, 7º device was
performed to understand any shifts in performance due to these design changes. This
configuration was selected as the internal noise signal investigation discussed
previously in this chapter had demonstrated that this approach was likely to deliver a
high quality inspection for the flat plate, non-welded test-pieces. Three phases of
testing were performed, immersion testing with the absorbent rubber, and irrigated
testing with and without the rubber. All testing was performed on the two flat plate,
non-welded test-pieces, these test-pieces and the inspection methods used to detect
each of the embedded defects are discussed in chapter 3.
In order to make comparison possible, all FMC data was collected using a fixed gain
of 45dB and in each case an aperture of 30mm was used; this corresponds to
40 elements in the 3rd generation array. A comparison of the results for defects 1-4
only has been performed and is presented below, because pitch-catch inspection of
defects 5 and 6 is not performed with a single 128 element array. A comparison is
performed of the maximum amplitude of each defect signal and of the localised SNR
around the defect. This is similar to the approach that was taken previously and is
discussed in chapter 3. However, in this comparison a single aperture of 30mm has
been used to provide improved focusing at longer path lengths. Once again the FMC
data has been processed to provide beam steering and fixed focal depth inspection.
The results from this testing are summarised for defect 1-4 in Table 5-6 – Table 5-9
below.

Membrane Coupled Device Developments
_____________________________________________________________________ 125
Table 5-6 Summary of localised signal to noise ratio for the inspection of defect 1 using a 30 mm aperture with the 7º, 6mm membrane coupled device in immersion, irrigation with internal absorbing material and irrigation with no internal absorbing material.
Beam Steering Only 56mm Focal Depth Housing Design
SNR (dB ± 1 dB)
Amplitude (A.U.)
SNR (dB ± 1 dB)
Amplitude (A.U.)
Immersion 24 94 27 140 Irrigation
and absorbing material
25 104 31 204
Irrigation without
absorbing material
26 128 28 164
Table 5-7 Summary of localised signal to noise ratio for the inspection of defect 2 using a 30 mm aperture with the 7º, 6mm membrane coupled device in immersion, irrigation with internal absorbing material and irrigation with no internal absorbing material.
Beam Steering Only 56mm Focal Depth Housing Design
SNR (dB ± 1 dB)
Amplitude (A.U.)
SNR (dB ± 1 dB)
Amplitude (A.U.)
Immersion 11 34 15 54 Irrigation
and absorbing material
14 28 18 50
Irrigation without
absorbing material
12 32 17 57

Membrane Coupled Device Developments
_____________________________________________________________________ 126
Table 5-8 Summary of localised signal to noise ratio for the inspection of defect 3 using a 30 mm aperture with the 7º, 6mm membrane coupled device in immersion, irrigation with internal absorbing material and irrigation with no internal absorbing material.
Beam Steering Only 30mm Focal Depth Housing Design
SNR (dB ± 1 dB)
Amplitude (A.U.)
SNR (dB ± 1 dB)
Amplitude (A.U.)
Immersion 13 22 13 19 Irrigation
and absorbing material
12 19 13 21
Irrigation without
absorbing material
15 26 15 27
Table 5-9 Summary of localised signal to noise ratio for the inspection of defect 4 using the 7º, 6mm membrane coupled device in immersion, irrigation with internal absorbing material and irrigation with no internal absorbing material.
Beam Steering Only 30mm Focal Depth Housing Design
SNR (dB ± 1 dB)
Amplitude (A.U.)
SNR (dB ± 1 dB)
Amplitude (A.U.)
Immersion 5 10 10 14 Irrigation
and absorbing material
4 9 10 16
Irrigation without
absorbing material
6 10 14 16
A comparison of the results in Table 5-6 to 5-9 demonstrates that there are some
differences between the results obtained using the three configurations of the 7˚, 6mm
3rd generation membrane coupled device. However, it is clear that the performance of
the device is not significantly degraded by using the integrated irrigation system.
There is no consistent variation in the results obtained and the performance of the
inspection in both irrigation and immersion is comparable. There is also no
significant degradation or improvement in the performance of the device when the
attenuative rubber material is used. This indicates that the level of internal noise is
relatively low; if large internal signals were reverberating around within the probe
cavity the addition of the absorbent material would reduce the amplitude of these.

Membrane Coupled Device Developments
_____________________________________________________________________ 127
The variation in the performance of the three different configurations is due to the
repeatability of the inspection capability. Between each of these tests the probe has
been completely removed from the device housing and the device has been
reconfigured. This far exceeds normal use and it inevitably leads to the probe set-up
being not identical on each occasion. All testing was performed from a single
transducer position because scanned FMC inspection is not currently possible with the
inspection set-up used. When reconfiguring the inspection system the position of the
transducer relative to the defect therefore also changes slightly. When considering a
small defect such as those in the flat plate, non-welded test-pieces this change in
position can cause variation in the defect response. There is also some movement
within the membrane device scanning jig that could contribute to further variability in
the results. However, despite all of these sources of variability the localised defect
SNR only changes by ±2dB and by only using a fixed gain no attempt has been made
to compensate for changes in the device configuration through calibration. The
reproducibility of the results is considered acceptable within an industrial NDE
environment.
5.6.2. Comparison of Different 3rd Generation Membrane Device
Designs
A comparison of the performance level of each of the three different 3rd generation
membrane probe designs was also performed. Again testing was based on the
inspection of the flat plate, non-welded test-pieces. This testing was performed to
provide a baseline of performance of each device. As discussed in chapter 3 there is
no recognised FMC calibration procedure and so very accurate comparison between
the results is not possible. Work to address this situation is ongoing as part of a
second EngD project within Rolls-Royce Submarines (Duxbury, 2009). In order to
make as accurate a comparison as possible all 3rd generation design testing was
performed using the MicroPulse 5PA phased array controller. Once again all
MicroPulse data was collected using a fixed gain of 45dB; this was found to provide
suitable results for each probe design. This approach is valid because in each
situation the same size aperture has been used and the attenuation of water is low,
therefore small changes in array standoff have relatively little effect on the signal

Membrane Coupled Device Developments
_____________________________________________________________________ 128
amplitude. The effect of beam spread is minimised by using a relatively large
aperture of 30mm, which leads to a collimated beam.
The first comparison was performed between 0º longitudinal scans. This information
can be used to highlight any discrepancies in the position and amplitude of the
internal noise signal and the general level of background noise. In each case this data
has been collected with the back edge of the phased array probe housing positioned
approximately 165mm from the weld cap centre line, which corresponds to the
optimum inspection position to detect defect 3 in the flat plate non-welded test-piece,
this is shown in the schematic diagram in Fig 5-21. This configuration is used so that
the weld cap geometry does not affect the result.
165
0º Longitudinal Wave
Figure 5-21 Schematic diagram of the experimental configuration used to generate a 0º longitudinal wave.
Results from the 0º longitudinal scans are shown in Fig 5-22; for comparison, a result
from the 80 element 2nd generation array is shown in Fig 5-22(a). The A Scan gate
start and end points used in each of the images in Fig 5-22 has been optimised for the
theoretical position of the internal noise signal in each case. Therefore the B-Scan
image shown in Fig 5-22 for each of the four different devices is not an identical size.

Membrane Coupled Device Developments
_____________________________________________________________________ 129
a.)
b.)
c.)
d.)
Figure 5-22 Comparison of the 0º scans generated with beam steering only when positioned to inspect defect 3 using a.) 80el device, b.) 6mm, 7º 128el device, c.) 6mm, 25º 128el device, d.) 20mm, 18º 128el device.
Each of the images in Fig 5-22 have been generated using beam steering only and are
shown over a 30dB dynamic range. This approach allows side by side comparison of
the data volume of interest using each approach. It is clear from Fig 5-22(b) that the
6mm stand-off, 7º probe configuration demonstrates a relatively strong internal
reflection signal which corresponds in time with the first back-wall signal. This
correlates well with the internal noise investigation performed using the 2nd
generation configuration (Russell et al, 2008) and demonstrates that this signal occurs
earlier than in the 2nd generation probe. This suggests that the 6mm stand-off, 7º
probe configuration will provide good results when considering the non-welded
test-piece inspections and the equivalent inspections using the welded flat plate test-
pieces. The internal noise signal with the 6mm stand-off, 25º device and 20mm
stand-off, 18º device configurations are low amplitude and not readily observed in the
results shown in Fig 5-22(c) and 5-22(d) respectively. This lower amplitude is
expected, as is the increased level of general background noise. As discussed above,
as the probe angle is increased, the intensity of the internal noise signal decreases but
2nd Backwall Reflection
3rd Backwall Reflection
Internal Noise Reflection
Internal Noise Reflection
1st Backwall Reflection
Grating lobe signal
2nd Backwall Reflection
4th Backwall Reflection
3rd Backwall Reflection
2nd Backwall Reflection
1st Backwall Reflection

Membrane Coupled Device Developments
_____________________________________________________________________ 130
the shape of the main beam deteriorates, leading to the behaviour observed. The
prominent noise signal seen in the 6mm stand-off, 25º probe is likely to be due to a
grating lobe signal. In this device design, when steering the main beam to 0º, a
forward facing grating exists at approximately 59º to the normal, which is allowed to
interact with the internal front surface of the probe housing and may lead to this type
of signal. However, when using a phased array in a practical inspection it is not
necessary to steer a beam to 0º and this is not a limitation of the design. The
increasing background noise observed in both of these steeper angle designs is also
likely to be due to the deterioration in the beam generated over large steering angles.
This effect is seen later when comparing performance of the three different designs
for longitudinal wave inspection.
Changing the focal length of the beam produced by each of the arrays has a strong
effect on the relative amplitude of the internal noise signal. By focusing close to the
array the beam is increasingly divergent at longer time periods. The beam then no
longer propagates normal to the component surface and multiple, high amplitude
backwall signals are less likely to be observed. However, because the noise signal is
due to an internal wedge reflection it still exists with a relatively high amplitude at all
focal depths. This effect is also observed in the inspection of the flat plate target
application test-pieces. Particularly when considering low amplitude defect signals,
this effect can lead to limitations in the inspection capability.
Experimental testing was then performed with each of the three different probe
configurations on defects 1-4 in the flat plate, non-welded test-pieces. All scans are
generated using, where possible, identical setup parameters; this is the typical mode of
operation that would be used in an actual inspection situation where specific defect
locations and orientations are not known. The data generated using this approach is
typically worse than the optimised results generated using prior knowledge of the
defect nature. Once again, although direct comparison between the performance of
the three 3rd generation device designs is possible, quantitative comparison between
the 2nd generation 80 element array and the three different 3rd generation, 128 element
array results is not possible. This is because this data was collected at different times,
and variations in the set up conditions have been used. In all comparison testing
reviewed in this chapter of the thesis an aperture of 30mm has again been used. A

Membrane Coupled Device Developments
_____________________________________________________________________ 131
summary of this comparison for defects 1-4 using the three different membrane
coupled device designs is provided in Table 5-10 – 5-13. Results from the 7˚, 6mm
device in irrigation with absorbing material have been used. This design is considered
the most robust for a range of different inspections. It is also comparable to the set-up
used in both the other configurations used in this testing.
Table 5-10 Summary of localised signal to noise ratio and signal amplitude for the inspection of defect 1 using the three different 3rd generation membrane device designs with a 30 mm aperture.
Beam Steering Only 56mm Focal Depth Housing Design SNR
(dB ± 1 dB) Amplitude
(A.U.) SNR
(dB ± 1 dB) Amplitude
(A.U.) 7º, 6mm 25 104 32 204 25º, 6mm 26 143 31 254
18º, 20mm1 21 87 27 177 Notes 1 Beam spread noise band obscures defect signal
Table 5-11 Summary of localised signal to noise ratio and signal amplitude for the inspection of defect 2 using the three different 3rd generation membrane device designs with a 30 mm aperture.
Beam Steering Only 56mm Focal Depth Housing Design SNR
(dB ± 1 dB) Amplitude
(A.U.) SNR
(dB ± 1 dB) Amplitude
(A.U.) 7º, 6mm 14 28 18 50 25º, 6mm 11 27 15 44 18º, 20mm 7 19 13 32
Table 5-12 Summary of localised signal to noise ratio and signal amplitude for the inspection of defect 3 using the three different 3rd generation membrane device designs with a 30 mm aperture.
Beam Steering Only 30mm Focal Depth Housing Design SNR
(dB ± 1 dB)Amplitude
(A.U.) SNR
(dB ± 1 dB) Amplitude
(A.U.) 7º, 6mm 12 19 13 21
25º, 6mm1 8 16 9 17 18º, 20mm1 6 18 6 17
Notes 1 Beam spread noise band obscures defect signal

Membrane Coupled Device Developments
_____________________________________________________________________ 132
Table 5-13 Summary of localised signal to noise ratio and signal amplitude for the inspection of defect 4 using the three different 3rd generation membrane device designs with a 30 mm aperture.
Beam Steering Only 30mm Focal Depth Housing Design SNR
(dB ± 1 dB) Amplitude
(A.U.) SNR
(dB ± 1 dB) Amplitude
(A.U.) 7º, 6mm 4 9 10 16 25º, 6mm 5 9 8 10
18º, 20mm1 6 9 10 16 Notes 1 Beam spread noise band obscures defect signal
The results obtained for the inspection of all four defects using the 18º, 20mm device
are typically worse than for the other two designs. In the case of the defect 1, 3 and 4
inspections, the location of the internal noise signal approximately corresponds to the
defect signal. However, this device configuration is designed for direct specular
inspection techniques and this limitation is expected. The results obtained using this
design for the inspection of defects 2, 3 and 4 are also poor because the beam is being
steered over a large angle to complete these inspections and being used in a non-ideal
manner. This design is inappropriate for the four different inspection techniques used
for the defects in the in flat plate non-welded test-piece. However, use of this design
is appropriate for the detection of some defects included in the flat plate welded
test-pieces. The inspection of these test-pieces is considered in greater detail in
chapter 6.
A comparison of the performance of the 7˚, 6mm and the 25˚, 6mm design is more
complex. When considering the inspection of defect 1 the localised defect SNR is
comparable, but typically better using the 7˚, 6mm design. However, the signal
amplitude is greater when using the steeper angled array. The difference in the SNR
performance is because of the increased noise observed previously in the 25˚, 6mm
design. However, the defect response is higher because the beam produced by this
array is closer to its natural angle. When considering the inspection of defects 2-4,
the 7˚, 6mm design out-performs both of the other configurations because of the low
noise levels and the array is being used close to its natural angle. This high level of
performance was expected from the experimental testing discussed in section 5.4
related to the optimised design of the 2nd generation device. It is clear from these
results that although still highly effective, the performance of the 25˚, 6mm design is

Membrane Coupled Device Developments
_____________________________________________________________________ 133
not as good as the other two configurations. The 25˚, 6mm device was not used in
further testing of the flat plate welded test-pieces.
The results provided in Table 5-10 to Table 5-13 demonstrate that generally the
inspection performance improves with the use of focusing. The amplitude of the
defect response increases as the amount of energy impinging on the defect increases.
The SNR of the defect response also increases when focusing is used. The
background noise level expected in these test-pieces is low therefore all of the energy
from a large aperture is incident upon the defect and a high quality signal response is
observed.
The path length associated with the inspection of defect 3 is relatively long. It is only
possible to focus a phased array within the near-field of the array aperture used. The
inspection path length for defect 3 is beyond the maximum focal length of the
30 element aperture. This explains why the improvements in the inspection
performance observed for the other three defects considered is not attained using this
configuration for defect 3. A larger aperture must be used to provide the optimum
performance for this type of inspection. Ideally a larger aperture size would also be
used for the inspection of defect 4, but since the path length for the inspection of this
defect is shorter than that for defect 3, some inspection performance improvement is
still observed with the smaller aperture.
5.7. Internal Noise Signal Amplitude Variation
The amplitude of the internal noise band signal changes depending on the position of
the array relative to the weld cap. This can clearly be seen in the 0º longitudinal wave
scans performed using the 7º, 6mm stand-off device in Fig 5-23. In this comparison
the device is positioned appropriately to detect defect 1 in Fig 5-23(a) and then moved
back to a position appropriate for the inspection of defect 3 in Fig 5-23(b). In each of
these figures a 30mm aperture with unfocused delay laws has been used. The internal
noise signal occurs at a slightly different range in each of the images. This difference
is caused by small variation in the ride height of the array. There is a large difference
in the ultrasonic velocity in water and steel, therefore a small change in the ride height
can have significant impact on the position of the internal noise signal. A schematic
diagram of the set-up used in each case is shown in Fig 5-24. The effect of this

Membrane Coupled Device Developments
_____________________________________________________________________ 134
variable amplitude internal noise signal is then shown for the inspection of defect 1
using this device in Fig 5-25.
a.)
b.)
Figure 5-23 Comparison of the 0º scans generated with beam steering only when positioned to inspect a.) defect 1 and b.) defect 3.
a.)
b.)
Figure 5-24 Schematic diagrams of the experimental set-up used to inspect a.) defect 1 and b.) defect 3.
1st Backwall Reflection
Internal Noise Signal
Weld cap effect
Internal Noise Signal
1st Backwall Reflection

Membrane Coupled Device Developments
_____________________________________________________________________ 135
Figure 5-25 45º shear wave inspection of defect 1 showing variable amplitude. The defect
response occurs over a broad arc due to beam spread.
When the transducer is positioned well away from the weld cap so that the entire
array is over the flat region of the test-piece the internal noise signal has uniform
amplitude. When the array is moved closer to the weld cap there is a localised
increase in the amplitude of the internal noise signal. The amplitude of the internal
noise signal in the region nearest to the weld-cap increases by approximately 4dB
relative to the rest of this signal. As discussed previously the source of the internal
noise signal is energy from the main beam impinging on the component outer surface
and reflecting back to the transducer. Energy that propagates at an angle
perpendicular to the front face of the transducer is then reflected back along the same
path to the active aperture of the array. This path is shown in Fig 5-26(a) for the
general case where the transducer is positioned over the flat component geometry. In
this location it is energy at the edge of the beam which impinges on the component at
the correct angle to generate the internal noise signal. The internal noise signal when
the transducer is positioned over the weld cap profile is shown in Fig 5-26(b). In this
situation some of the energy from the centre of the main beam is reflected at the
correct angle to cause the internal noise signal. The intensity at the centre of the beam
is significantly greater than at the edge which leads to an increase in the amplitude of
the internal noise signal. The time associated with the beam spread internal noise
signal can be controlled but this signal cannot be removed. Care must be taken when
designing the transducer to complete a given inspection to ensure that the beam
spread internal noise signal occurs at a time outside the region of interest. This is
particularly important when scanning over the weld cap because as demonstrated here
Internal Noise Signal
Weld cap effect
Defect 1 response

Membrane Coupled Device Developments
_____________________________________________________________________ 136
this can lead to a noise signal with increased amplitude which could obscure the
response from an actual flaw.
a.)
b.)
Figure 5-26 Schematic diagrams showing the source of internal noise within the membrane coupled phased array a.) on a flat surface, b.) on the rising face of the weld cap.
5.8. Summary
In the inspection of the two flat plate, non-welded test-pieces an internal noise signal
within the 2nd generation membrane coupled phased array device led to a degradation
in inspection performance. This chapter considers the investigation performed to
understand the source of this internal noise signal and subsequent improvements to
the membrane coupled device design. Two sources of noise are identified within the
2nd generation membrane coupled device, a grating lobe noise signal and a beam
spread signal. The 2nd generation device was designed to have a large footprint to
minimize the amount of axial scanning required. However, the maximum number of
channels is limited and by increasing the footprint, the element pitch of the
80 element array had to be increased. This gave rise to a grating lobe signal within
the 2nd generation device cavity. The beam spread internal noise signal occurs in all
phased array wedges including conventional rigid wedges. The beam spread signal
occurs when energy from the active aperture within the array reflects on the surface of
the component under test back to the array. Energy impinging normally on the array
is then reflected back along the same path to the active aperture where it is detected.

Membrane Coupled Device Developments
_____________________________________________________________________ 137
The amplitude of the internal noise signal rapidly decreases as the angle of the array is
increased relative to the outer surface of the component under test. The array angles
used with Perspex wedges are typically larger than when using water wedges,
therefore the internal noise signal is a greater issue in water wedges than in Perspex.
The internal noise signal is also higher in water wedges because of low attenuation
and the large difference in ultrasonic velocity between water and steel causing a high
proportion of the energy to be reflected at the interface.
A 3rd generation membrane coupled device has been designed. This device uses a
128 element, 0.75mm pitch 2MHz centre frequency array. The reduced element pitch
still provides a relatively large footprint so that array scanning is minimized whilst
also reducing the effects of grating lobes. Three different 3rd generation designs are
considered, the first design uses a 6mm, 7º array which shortens the time associated
with the beam spread noise. This device is designed for use in inspections with a
relatively long path length. A 20mm, 18º device was also produced, in this design the
beam spread signal occurs at longer path lengths making the device suitable for direct
specular inspection techniques. Finally a 6mm, 25º device was designed; this was
intended as a compromise between the other two devices for general use.
Experimental testing demonstrated that the most appropriate approach to inspection of
the target application component was to complete inspection using both of the first
two designs. The 3rd generation device design incorporates an integrated irrigation
system. Experimental testing was performed to demonstrate that the performance of
the device was not degraded by using this irrigation system.

_____________________________________________________________________ 138
6. Flat Plate Welded Test-Piece Inspection All of the experimental testing discussed previously using the membrane coupled
phased array devices has been performed on two flat plate, non-welded test-pieces.
The two flat plate non-welded test-pieces had weld metal deposited on their surfaces
to produce a weld cap representative of the actual target application component.
However, the target application for this technology is a section of stainless steel pipe-
work that contains an austenitic weld. The presence of austenitic weld material
introduces a number of ultrasonic inspection challenges. In order to demonstrate the
performance of the membrane coupled phased array device in this application more
representative test-pieces are required. Two flat plate welded test-pieces were
produced, the test-pieces are made from representative stainless steel and both contain
an austenitic weld with an undressed weld-cap.
In this chapter, the inspection of the two flat plate welded test-pieces representative of
the target application component will be reviewed. In section 6.1 the design and
manufacture of the two test-pieces will be discussed. This will be followed by an
overview of the inspection process used to detect each of the embedded defects. The
experimental results obtained from the inspection of the flat plate welded test-pieces
using the 3rd generation membrane coupled device will then be presented. A
theoretical study of the potential inspection speed improvements that can be achieved
using the membrane coupled device has also been performed and this will be
discussed in section 6.6.
6.1. Flat Plate Welded Test-Piece Design
The non-welded test-pieces described in section 3.1 did not contain an actual weld
and only contained a subset of the range of possible flaws. The inspection of the non-
welded test-pieces was restricted to a single inspection technique for each defect type.
This earlier work demonstrated that the membrane coupled phased array provides an
improved inspection capability over conventional techniques for this type of
component. However, substantially more development was needed before the
membrane device could be deployed. To develop the membrane probe inspection
capability further, two flat plate, welded stainless steel test-pieces were designed and
manufactured.

Flat Plate Welded Test-Piece Inspection
_____________________________________________________________________ 139
Stainless steel is used in NSRP components because it has high fracture toughness
(Cui & Lundin, 2007), resistance to brittle fracture (Ford & Hudgell, 1987) and
provides excellent resistance to corrosion and oxidation (Harker et al, 1990). The
presence of austenitic weld material introduces a number of ultrasonic inspection
challenges. The large columnar grain structure, typical of this type of weld, leads to
scattering and beam steering of the ultrasound (Halkjær et al, 2000; Hudgell et al,
1989). The scattering effects occur from the grain boundaries, whereas the beam-
steering is due to locally varying material properties across the different grains within
the weld, which in turn leads to changes in the acoustic velocity (Connolly, 2009). To
fully understand the membrane coupled device inspection capability when applied to
the target application it was necessary to design and manufacture suitably
representative test-pieces. Two flat-plate, welded test-pieces have been manufactured
in order to limit the size and weight of the test-pieces and simplify the scanning
process (Rolls-Royce, 2008a; Rolls-Royce, 2008b). The two welded test-pieces have
a wall thickness and a surface roughness that is representative of the actual target
application component.
The original intention of this work was to manufacture the welded test-pieces within
Rolls-Royce. This approach would ensure that the weld composition and structure
were fully representative of that found within the actual NSRP component.
Manufacture of these test-pieces would also assist in the development of a Rolls-
Royce capability to manufacture welded test-pieces that contained embedded flaws.
Unfortunately due to resource constraints this approach could not be taken and the
test-pieces were manufactured by Sonaspection (Lancaster, UK). Sonaspection have
a defect inclusion process and a strong track-record in test-piece manufacture.
However, Sonaspection were unable to produce a TIG welding process which was
fully representative of that used on the target application component. In the two test-
pieces an electric boat (EB) insert has been fused using a heating process without any
weld filler metal, the bottom 6mm of the weld has then been produced using a manual
metal arc (MMA) welding technique. The remainder of the weld has been built up
using a representative TIG process. The welding process used in the manufacture of
these test-pieces is likely to present a more challenging inspection than the actual
target application weld, particularly in the root region. The intention of this
development activity is focused on improving the membrane coupled device
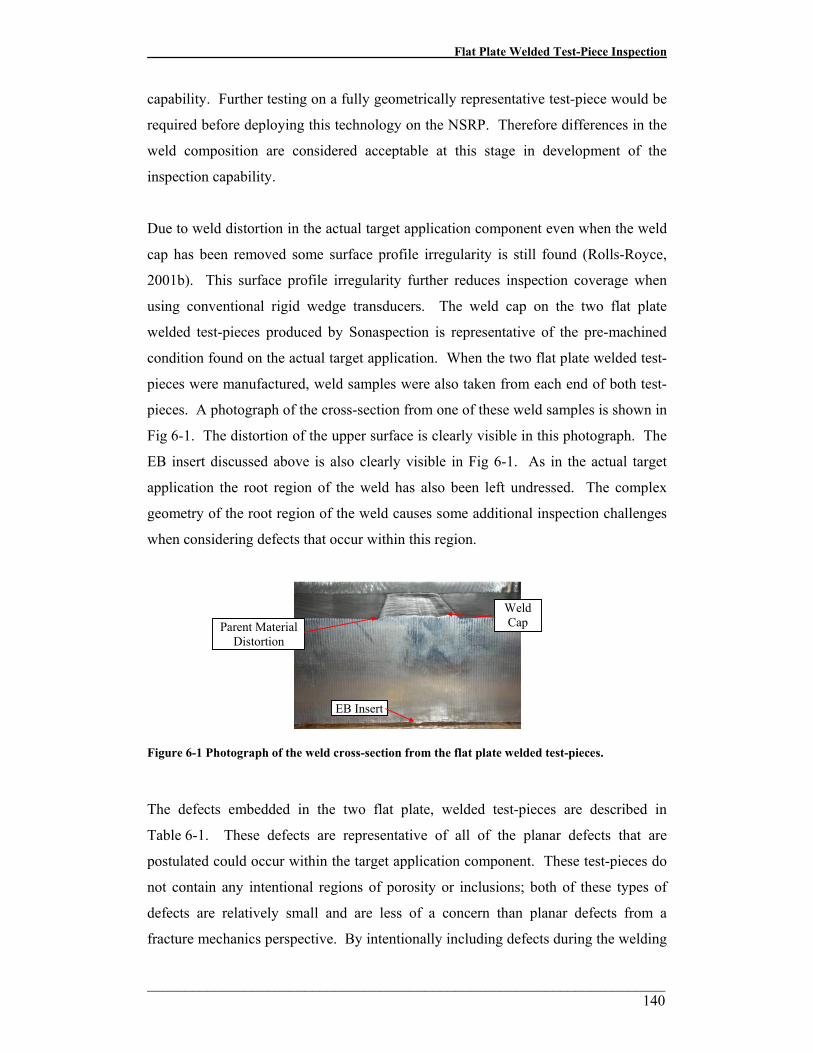
Flat Plate Welded Test-Piece Inspection
_____________________________________________________________________ 140
capability. Further testing on a fully geometrically representative test-piece would be
required before deploying this technology on the NSRP. Therefore differences in the
weld composition are considered acceptable at this stage in development of the
inspection capability.
Due to weld distortion in the actual target application component even when the weld
cap has been removed some surface profile irregularity is still found (Rolls-Royce,
2001b). This surface profile irregularity further reduces inspection coverage when
using conventional rigid wedge transducers. The weld cap on the two flat plate
welded test-pieces produced by Sonaspection is representative of the pre-machined
condition found on the actual target application. When the two flat plate welded test-
pieces were manufactured, weld samples were also taken from each end of both test-
pieces. A photograph of the cross-section from one of these weld samples is shown in
Fig 6-1. The distortion of the upper surface is clearly visible in this photograph. The
EB insert discussed above is also clearly visible in Fig 6-1. As in the actual target
application the root region of the weld has also been left undressed. The complex
geometry of the root region of the weld causes some additional inspection challenges
when considering defects that occur within this region.
Figure 6-1 Photograph of the weld cross-section from the flat plate welded test-pieces.
The defects embedded in the two flat plate, welded test-pieces are described in
Table 6-1. These defects are representative of all of the planar defects that are
postulated could occur within the target application component. These test-pieces do
not contain any intentional regions of porosity or inclusions; both of these types of
defects are relatively small and are less of a concern than planar defects from a
fracture mechanics perspective. By intentionally including defects during the welding
EB Insert
Parent Material Distortion
Weld Cap

Flat Plate Welded Test-Piece Inspection
_____________________________________________________________________ 141
process it is possible to embed a far greater range of flaws than was achievable in the
non-welded test-pieces. The six defect types included in the non-welded test-pieces
have again been included in the welded test-pieces. However, a seventh mid-wall,
mid weld defect normal to the backwall is also included. Two defects of each type
have been included in the welded test-pieces. The first defect of each type is the same
through-wall size as in the non-welded test-pieces; the second is twice this size. Two
different size defects are included because accurate detection and characterisation of
small defects is very difficult when the beam steering effects of austenitic weld are
considered. Therefore, defects 8-14 are also included with a through-wall extent of
8mm. Defects 8-14 are still smaller than the validation defect size required in the
current single element transducer inspection (Rolls-Royce, 2001a). Therefore if these
defects can be reliably detected using the membrane coupled device, the performance
of the inspection capability will exceed the minimum detectability requirements of the
inspection. The two flat plate, welded test-pieces have been produced by welding two
large sections of flat plate together. This allows the inspection of each defect from
both scan directions. By using this approach during this development, it means that
thorough characterisation of the membrane coupled device capability has been
performed. This is a more cost efficient approach than manufacturing test-pieces that
simulate single sided weld access.

Flat Plate Welded Test-Piece Inspection
_____________________________________________________________________ 142
Table 6-1 Defect Description for flat plate, welded test-pieces
Defect Number Type of Defect Location Tilt Skew
1 Lack of root fusion Centreline of weld - inner surface breaking 0° 0°
2 Lack of sidewall fusion Along lower weld fusion face - inner surface breaking 25° 0°
3 Lack of sidewall fusion Along lower weld fusion face - at highest point of 25° prep angle from inner surface 25° 0°
4 Lack of sidewall fusion Along upper weld fusion face - at lowest point of 10° prep angle from outer surface 10° 0°
5 Lack of sidewall fusion Along upper weld fusion face - outer surface breaking 0° 0°
6 Structurally significant planar defect derived
from LEFM1
Centreline of weld - under weld cap with ligament of 2-5mm to outer surface 10° 0°
7 Structurally significant planar defect derived
from LEFM1
Centreline of weld - equidistant from inner and outer surfaces 0° 0°
8 Lack of root fusion Centreline of weld - inner surface breaking 0° 0°
9 Lack of sidewall fusion Along lower weld fusion face - inner surface breaking 25° 0°
10 Lack of sidewall fusion Along lower weld fusion face - at highest point of 25° prep angle from inner surface 25° 0°
11 Lack of sidewall fusion Along upper weld fusion face - at lowest point of 10° prep angle from outer surface 10° 0°
12 Lack of sidewall fusion Along upper weld fusion face - outer surface breaking 0° 0°
13 Structurally significant planar defect derived
from LEFM1
Centreline of weld - under weld cap with ligament of 2-5mm to outer surface 10° 0°
14 Structurally significant planar defect derived
from LEFM1
Centreline of weld - equidistant from inner and outer surfaces 0° 0°
Notes
1. LEFM – Linear Elastic Fracture Mechanics
Each of the artificial defects described in Table 6-1 were introduced into the welded
test-pieces during manufacture. As in the non-welded test-piece a best endeavour
approach is taken to reproduce the postulated defect gape, however it is likely that the
actual gape of each defect will again be approximately 300µm. The inclusion of
realistic, elliptical defects is difficult; therefore rectangular defects of an equivalent
area to the postulated elliptical defects have been included in both test-pieces. The
through-wall dimension of the defect is the most critical in terms of generating a

Flat Plate Welded Test-Piece Inspection
_____________________________________________________________________ 143
safety justification. Therefore the through-wall size of the artificial defect is
maintained at 4mm for defects 1-7 and 8mm for defects 8-14. The length of the
artificial defects is reduced to 6.3mm and 12.6mm for defects 1-7 and 8-14
respectively in order to maintain the cross-sectional area of the final defect. As with
the non-welded test-pieces, all defects can be assumed to be ultrasonically smooth.
The orientation of all of the flaws in the welded test pieces will be accurately known.
These defects will cover a range of tilt angles at different points within the weld
volume but all defects will have a nominal skew of 0˚ ±5˚, which corresponds to the
Sonaspection manufacturing tolerance. The focus of the current research work is to
further develop the membrane probe and to demonstrate its value in comparison to
conventional rigid wedge techniques. This work is not intended to demonstrate
detection of all possible defect types; therefore defects of different skews are not
included in the test-pieces. Treatment of defects with different skews is being
considered as an extension to this development activity and is due for completion in
2010. This additional development activity is beyond the scope of my doctorate
studies and will not be discussed further in this document.
A photograph of the conformable phased array welded evaluation block 2 is provided
in Fig 6-2, the configuration of this test-piece is essentially the same as for the welded
evaluation block 1. The weld cap height and width dimensions are comparable to the
actual component. The defects contained in evaluation block 1 are shown in the
schematic diagrams in Fig 6-3 and the corresponding diagrams for block 2 are
provided in Fig 6-4. The defects are positioned approximately 50mm apart along the
weld to ensure that when the transducer is positioned in-line with the centre of the
defect, only a single defect response is measured.

Flat Plate Welded Test-Piece Inspection
_____________________________________________________________________ 144
Figure 6-2 Photograph of conformable phased array welded evaluation block 2 (Rolls-Royce, 2008b).

Flat Plate Welded Test-Piece Inspection
_____________________________________________________________________ 145
a.)
4.0
Defect 1
WeldProfile
f.)
8.0
Defect 8
WeldProfile
b.)
Defect 2
4.0
WeldProfile
g.)
Defect 9
8.0
WeldProfile
c.)
Defect 5
4.0Weld
Profile
h.)
Defect 12
8.0Weld
Profile
d.)
Defect 6
4.0Weld
Profile
i.)
Defect 13
8.0Weld
Profile
e.)
Defect 7
4.0
WeldProfile
j.)
Defect 148.0
WeldProfile
Figure 6-3 Schematic diagram of defects contained in the conformable phased array welded evaluation block 1, a.) defect 1, b.) defect 2, c.) defect 5, d.) defect 6, e.) defect 7, f.) defect 8, g.) defect 9, h.) defect 12, i.) defect 13, j.) defect 14.

Flat Plate Welded Test-Piece Inspection
_____________________________________________________________________ 146
a.)
c.)
Defect 10
8.0
WeldProfile
b.)
Defect 4
WeldProfile
4.0
d.)Weld
Profile8.0
Defect 11
Figure 6-4 Schematic diagram of defects contained in the conformable phased array welded evaluation block 2, a.) defect 3, b.) defect 4, c.) defect 10, d.) defect 11.
6.2. Technique Description
The detection methods chosen in this work essentially represent five different UT
inspection techniques:
a) Direct specular
b) Creep wave
c) Corner echo
d) Transverse-longitudinal (TL) skip
e) Transverse-longitudinal-longitudinal (TLL) skip
Three of these techniques were used in the inspection of the flat plate, non-welded
test-pieces and have been discussed previously in chapter 3; these will only briefly be
reviewed here. In the inspection of the flat plate, non-welded test-pieces, techniques
that relied on a direct specular reflection from a defect through the weld region were
not considered because of the absence of a representative weld. These techniques
have been included in the inspection of the welded test-pieces and are discussed in
detail below. Shear waves are strongly scattered and attenuated in austenitic weld
material; therefore any techniques that traverse a large weld region are implemented
using a longitudinal wave.
Defect 3
4.0
WeldProfile

Flat Plate Welded Test-Piece Inspection
_____________________________________________________________________ 147
6.2.1. Direct Specular
Direct specular reflection occurs when the ultrasonic wave is incident upon a defect
without first interacting with any other surface within the component under test.
Typically specular detection of a planar defect requires the ultrasound to impinge on
the defect at an angle within ± 10º to the normal of the defect. When this condition is
met, a high amplitude response can be observed from the defect allowing accurate
defect detection. Direct specular reflection of a defect is shown in the schematic
diagram in Fig 6-5. This technique is used for the direct through weld inspection of
defects within the flat plate, welded test-pieces.
Figure 6-5 Schematic diagram of direct specular reflection.
6.2.2. Creep Wave
As the incident angle of the ultrasonic probe used in an inspection is increased, the
resultant beam angle of the refracted waves also increases. Both longitudinal and
transverse waves are generated until the first critical angle is reached. This critical
angle corresponds to the point where the longitudinal wave is totally reflected within
the probe. Immediately before the first critical angle is reached an outer-diameter
(OD) creep wave is produced (Baby et al, 2003), in stainless steel this point is reached
at approximately 75-80º and occurs with an associated shear wave at 32-33º. The
creep wave has been reported in the literature with a number of different names,
Langenberg et al use the descriptor subsurface longitudinal wave (Langenberg et al,
1990), Ermolov terms it a head wave (Ermolov, 2004) whereas Bray and Tang discuss

Flat Plate Welded Test-Piece Inspection
_____________________________________________________________________ 148
a critically refracted longitudinal wave (Bray & Tang, 2001). The creep wave travels
at the same velocity as the longitudinal wave, the wave constantly mode converts to a
shear wave, and this process radiates energy into the component under test. The shear
wave generated in this process again occurs at approximately 32-33º. Due to this
effect the creep wave is highly attenuated and relatively short lived. Assuming that
the creep wave exists with sufficient amplitude it can be used to detect surface and
slightly sub-surface defects on the component outer surface. To achieve this
condition the transducer must be placed as close as possible to the defect location. A
schematic diagram of the creep wave inspection is provided in Fig 6-6. It is
challenging to generate this type of wave using a single element transducer and this
technique was not used in the inspection of the flat plate non-welded test-pieces.
Deployment of this type of technique on components with irregular surface
geometries is not typically possible using rigid wedge transducers.
Figure 6-6 Schematic diagram of the creep wave inspection technique.
6.2.3. Corner Echo
The corner echo technique is used to detect surface breaking defects orientated
normal, or near normal to the surface. The maximum amplitude corner echo response
is achieved using a 45º shear wave (Krautkramer & Krautkramer, 1983) although
other wave angles can also be used. The direct corner echo inspection technique is
shown in Fig 6-7(a). This technique can also be used after reflection from the
backwall and the skip corner echo technique is shown in Fig 6-7(b).

Flat Plate Welded Test-Piece Inspection
_____________________________________________________________________ 149
a.)
b.)
Figure 6-7 Schematic diagram of the a.) direct and b.) skip corner echo inspection technique.
6.2.4. Transverse-Longitudinal (TL) Skip
The Transverse-Longitudinal (TL) skip technique is a type of in-direct specular
reflection. The technique involves a beam of ultrasound insonifying the defect
specularly after a reflection with a surface within the component. In the inspection of
both the non-welded and welded test-pieces this technique is used to achieve an in-
direct specular defect reflection using a high angle longitudinal wave mode converted
after reflection from the backwall. The TL skip technique is shown in the schematic
diagram in Fig 6-8.

Flat Plate Welded Test-Piece Inspection
_____________________________________________________________________ 150
Figure 6-8 Schematic diagram of the Transverse-Longitudinal (TL) skip inspection technique.
6.2.5. Transverse-Longitudinal-Longitudinal (TLL) Skip
The Transverse-Longitudinal-Longitudinal (TLL) skip technique can be used to
provide a suitable defect response from defects oriented with approximately ±10º tilt
to the backwall normal. Depending on the depth of the defect to be detected and the
angle of the beams used either a pitch-catch or self-tandem (ST) approach can be
used. Both of these inspection techniques are shown in the schematic diagrams
provided in Fig 6-9.
a.)
b.)
Figure 6-9 Schematic diagram of the Transverse-Longitudinal-Longitudinal (TLL) skip inspection technique, a.) pitch-catch and b.) self tandem (ST).

Flat Plate Welded Test-Piece Inspection
_____________________________________________________________________ 151
6.3. Chosen Inspection Techniques for Each Defect
A primary and secondary detection technique is used to detect each of the 14 artificial
defects included in the flat plate, welded test-pieces when scanning from each
direction either side of the weld cap. These techniques are summarised in Table 6-2.
When a defect occurs in the centre of the weld, symmetrical inspection techniques are
used. In order to distinguish between these directions, the through weld inspection is
considered to be from the positive scan direction (i.e. left to right in Fig 6-3 and
Fig 6-4) and near side weld inspection is considered as the negative scan direction.
Each defect is therefore typically inspected using two different inspection techniques
from each scan direction and is insonified from a number of different locations. This
approach provides additional information regarding the nature of any defects found
within a structure and allows the data interpretation engineer to postulate a possible
cause of the defect. It also safeguards the inspection against potentially missing a
defect because it occurs at a slightly different position or orientation to that expected.
However, using this approach with conventional single element transducers is time-
consuming. Reducing the time associated with this type of inspection provides some
of the motivation for developing the membrane coupled device. The tests performed
represent all of the main techniques used in the target application inspection. In the
actual target application inspection further component scans with different focal
lengths are carried out to provide complete through thickness inspection coverage.
These tests are not required on the flat plate, welded test-pieces because defects are
not included in these locations and a null defect response would be measured.

Flat Plate Welded Test-Piece Inspection
____________________________________________________________________________________________________________________ 152
Table 6-2 Inspection technique summary for the flat plate, welded test-pieces.
Through Weld Inspection Techniques Near Side Inspection Techniques I.D. Defect Type Length
(mm)
Through-wall size
(mm)
Ligament to ID (mm)
Tilt Angle
(˚) Primary Secondary Primary Secondary
1 Lack of root fusion 6.3 4 0 0 45 Shear (Corner Effect) 60 Shear (Corner Effect /
Specular) Mid-weld defect – symmetrical detection techniques
2 Lack of side wall fusion 6.3 4 0.5 25 65 Comp (Specular) 65 Shear (Specular) 65 Comp (TL) 45 Shear (Corner
Effect/TT)
3 Lack of side wall fusion 6.3 4 24.5 25 65 Comp (Specular) 60 Comp (Specular) 65 Comp (TL) -
4 Lack of side wall fusion 6.3 4 28.5 10 65 Comp (TLL) 70 Comp (Specular) 65 Comp (TLL) 45 Comp (TLL)
5 Lack of side wall fusion 6.3 4 54 -10 65 Comp (TLL, pitch-
catch) OD Creep Wave 65 Comp (TLL, pitch-catch)
45 Shear (Skip - Corner Effect)
6 Mid-weld planar 6.3 4 54 0 65 Comp (TLL, pitch-catch) OD Creep Wave Mid-weld defect – symmetrical detection techniques
7 Mid-weld planar 6.3 4 27 0 60 Comp (TLL, ST) 70 Comp (TLL, ST) Mid-weld defect – symmetrical detection techniques
8 Lack of root fusion 12.6 8 0 0 45 Shear (Corner Effect) 60 Shear (Corner Effect /
Specular) Mid-weld defect – symmetrical detection techniques
9 Lack of side wall fusion 12.6 8 0.5 25 65 Comp (Specular) 65 Shear (Specular) 65 Comp (TL) 45 Shear (Corner
Effect/TT)
10 Lack of side wall fusion 12.6 8 20.5 25 65 Comp (Specular) 60 Comp (Specular) 65 Comp (TL) -
11 Lack of side wall fusion 12.6 8 28.5 10 65 Comp (TLL) 70 Comp (Specular) 65 Comp (TLL) 45 Comp (TLL)
12 Lack of side wall fusion 12.6 8 50 -10 65 Comp (TLL, pitch-
catch) OD Creep Wave 65 Comp (TLL, pitch-catch)
45 Shear (Skip - Corner Effect)
13 Mid-weld planar 12.6 8 50 0 65 Comp (TLL, pitch-catch) OD Creep Wave Mid-weld defect – symmetrical detection techniques
14 Mid-weld planar 12.6 8 25 0 60 Comp (TLL, ST) 70 Comp (TLL, ST) Mid-weld defect – symmetrical detection techniques

Flat Plate Welded Test-Piece Inspection
_____________________________________________________________________ 153
The inspection technique used to identify the presence of each defect within the flat
plate, non-welded test-pieces is again used for the inspection of the corresponding
defects in the welded test-pieces. However, a number of other techniques are also
used in the inspection of the welded test-pieces.
Defects 1 and 8 (lack of root fusion)
Defects 1 and 8 (see Fig 6-3a, f) occur approximately in the middle of the weld. This
type of defect is detected using the same two techniques from both inspection
directions, and both techniques rely on the corner echo response from this type of
surface breaking defect. The two different wave angles used are selected to provide a
suitable response from defects at slightly different tilts. A shear wave is used, despite
the fact that the wave must propagate through a small region of weld material. This
approach is taken because the corner echo response from shear waves is much higher
than longitudinal waves (Krautkramer & Krautkramer, 1983). Hence, even if the
wave is slightly attenuated by the weld, a strong response is likely to be observed
because the amount of weld material that must be crossed is relatively small and the
likely reduction in signal amplitude is small.
Defects 2 and 9 (lack of side wall fusion)
Defects 2 and 9 (see Fig 6-3b, g) occur at a tilt of 25º to the backwall normal, different
techniques must therefore be adopted from each side of the weld. When scanning
from the near side of the weld, this type of defect is equivalent to defect 2 in the
non-welded test-pieces and the same primary inspection technique is used. This type
of defect also produces a strong corner echo/transverse-transverse (TT) response and a
45º shear wave is used as a secondary inspection technique. Direct specular
techniques are used for the through weld inspection of this type of defect. Suitably
angled beams are generated to impinge on the defect at 90º to the defect surface; this
approach is used to produce the maximum amplitude response. The primary
inspection technique uses a 65º longitudinal wave because this is not likely to be
excessively attenuated by the austenitic weld material. A 65º shear wave is used as in
secondary inspection, the interpretation of the data obtained from this inspection is
potentially simpler than from the primary inspection because only one wave mode

Flat Plate Welded Test-Piece Inspection
_____________________________________________________________________ 154
exists but the amplitude of the signal is likely to be lower because of higher levels of
scattering through the weld.
Defects 3 and 10 (lack of side wall fusion)
The inspection of defects 3 and 10 (see Fig 6-4a, c) for the near side of the weld scan
direction is equivalent to the inspection of defect 3 in the non-welded test-pieces. The
65º longitudinal wave TL mode conversion technique that has been described
previously in chapter 3 is once again used to detect this defect. There are only limited
techniques available to detect this type of defect and no secondary technique is used
from this scan direction. Two different angled beams are used to detect this type of
defect through the weld. It is expected that the defect occurs along the weld fusion
face, so the highest amplitude response is anticipated to be produced by using a direct
65º longitudinal wave inspection. However, the ultrasonic beam is typically steered
during this type of inspection (Bann, 2005). A secondary inspection is therefore
performed using a 60º longitudinal wave as this was found to provide a suitable defect
response. Shear wave inspection of defects of this type is not performed through weld
due to excessive attenuation of the beam.
Defects 4 and 11 (lack of side wall fusion)
The primary inspection technique used for the detection of defects 4 and 11 (see
Fig 6-4b, d) from both scan directions is the 65º longitudinal wave TLL mode
conversion technique that was used for the inspection of defect 4 in the non-welded
test-pieces. However, because the defect occurs on the fusion face, it is tilted and the
beam path from each scan direction is slightly different. Therefore the relative
positions of the transmit and receive paths are not identical. When this inspection is
performed from the near side of the weld, a self tandem technique is used. However,
when completing the inspection through the austenitic weld, there is a large offset
between the transmit and receive paths. The secondary inspection from the near side
of the weld also uses the TLL technique but a 45º longitudinal wave beam angle is
used. Through weld inspection of this type of defect is relatively challenging. It is
not possible to generate a high amplitude longitudinal wave that propagates normal to
the defect surface. The highest angle longitudinal wave that can be reliably produced

Flat Plate Welded Test-Piece Inspection
_____________________________________________________________________ 155
is a 70º beam and this is used but it is recognised that the likely amplitude of the
response will be low because of the mis-orientation of the beam.
Defects 5 and 12 (lack of side wall fusion)
Defects 5 and 12 (see Fig 6-3c, h) are outer surface breaking defects and occur along
the upper fusion face. The near side inspection of both defects is equivalent to defect
5 in the flat plate non-welded test-piece. The same pitch-catch TLL primary
inspection technique is once again used to detect this type of defect. Due to the
position of the defect, there is a large separation between the transmit and receive
paths and a pitch-catch configuration must be used. All of the pitch-catch inspection
techniques implemented on the welded test-pieces use the same transducer
configuration as in the non-welded test-piece inspection. The 2nd generation
membrane coupled device and the 48 element rigid wedge transducer are used in all
pitch-catch testing. A maximum of 128 elements can be addressed using the current
Peak NDT MicroPulse 5PA array controller. It is therefore not possible to complete
pitch-catch testing using the 128 element 3rd generation probe design. Defects 5 and
12 are surface breaking defects and will produce a strong corner echo response when
using a suitably oriented beam. The secondary near side inspection technique used
for this type of defect is a full-skip 45º shear wave technique. The primary inspection
technique for the through weld inspection of defects 5 and 12 again uses the same
pitch-catch 65º longitudinal wave TLL mode conversion technique as for the near side
inspection. This inspection is challenging because the ultrasonic path passes through
a large region of the austenitic weld. The secondary through weld inspection
technique uses an OD creep wave.
Defects 6 and 13 (planar defect normal to the backwall)
Defects 6 and 13 (see Fig 6-3d, i) occur under the weld cap in the centre of the weld;
the same two detection techniques are therefore used from both scan directions. This
type of defect is equivalent to defect 6 in the flat plate, non-welded test-pieces and the
same pitch-catch 65º longitudinal wave TLL mode conversion technique is once again
used as the primary detection technique. This type of defect has a short ligament to
the outer surface and will not produce a corner echo response. The OD creep wave is

Flat Plate Welded Test-Piece Inspection
_____________________________________________________________________ 156
therefore used as the secondary detection technique for this type of defect from both
scan directions.
Defects 7 and 14 (planar defect normal to the backwall)
The mid-wall, mid-weld defect represented by defects 7 and 14 (see Fig 6-3e, j) was
not included in the non-welded test-pieces. This type of defect cannot be introduced
except during the welding process. This is a very challenging type of defect to detect
and only a limited range of inspection techniques are available. Typically the main
technique that can be used to detect this type of defect is the TLL technique (British
Standards Institution, 2004a), depending on the beam angles used this can be a pitch-
catch or a self tandem (ST) inspection. The beam angle that produces the highest
amplitude response is dependent on the welding procedure used. It is therefore
desirable to be able to consider the response from this inspection over a range of
different beam angles. This cannot practically be achieved using conventional data
acquisition techniques and only a limited range of angles can be considered. The
primary inspection technique uses a 60º longitudinal wave and the secondary
technique uses a 70º longitudinal wave. The defect occurs in the centre of the weld;
therefore the same technique can be adopted from both scan directions.
6.4. Inspection Process
The footprint of the 3rd generation membrane coupled phased array is relatively large
and it is possible to achieve complete coverage of the inspection volume from a
limited number of transducer positions relative to the weld centre line. When
processing inspection data from an aperture within the array, the A-Scan produced is
plotted along a line projected from the centre of the aperture. A B-Scan image is then
produced by “stacking” these A-Scans next to one another. The inspection coverage
that can be achieved from a single transducer position is therefore dependent on the
aperture size used to generate each A-Scan. The number of inspection positions
required to achieve complete inspection coverage of the component under test is
therefore dependent on the maximum aperture size to be used. Care must be taken to
ensure that the entire inspection volume is covered when using all of the inspection
techniques to be implemented on a component.

Flat Plate Welded Test-Piece Inspection
_____________________________________________________________________ 157
When designing a new inspection it is necessary to decide upon the maximum
aperture size to be used. The maximum aperture size used will dictate the minimum
scan pitch of the inspection. By using electronic scanning from a single probe
position, a region in the component can be imaged. The size of the region is dictated
by the aperture size used; as the aperture is increased the volume of the region
inspected from that scan position reduces. In order to ensure that the entire
component is suitably insonified, an appropriate mechanical scan pitch must therefore
be selected. The mechanical scan pitch will also limit the algorithms that can be
applied to the inspection data collected in the future. A compromise must be made
between future proofing the inspection data and reducing time and limiting the overall
amount of data collected during the inspection. Coverage of the entire target
application inspection volume has been achieved by using the membrane device to
complete six scans at different positions relative to the weld. This number of scans
allows a suitably large aperture to be used for the inspection of all defects and
provides some overlap of data from one scan position to the next.
The first scan of the target application component is performed with the membrane
device directly over the weld cap. The FMC data gathered when the transducer is
located in this position is then processed to provide a surface profile measurement of
the weld cap region. In subsequent inspections when the membrane device is
positioned partially over the weld, this information can then be used to update the
delay laws used in each of these inspections. This approach is used because the most
effective profile measurement technique is to position the transducer centrally on the
weld cap and then to use a 0˚ longitudinal wave inspection (Long & Cawley, 2007).
It is not possible to obtain sufficient information regarding the weld profile when
steering the beam generated away from normal incidence because the reflected wave
is no longer incident on the array. When using this approach it is essential that the
position of the transducer is accurately known so that the correct surface profile
information is used to update the delay laws.
A measured surface profile from the flat plate welded test-pieces is shown in
Fig 6-10; this image has been produced using the 6mm, 7º device positioned directly
over the weld cap. An aperture of 20 elements has been used and the data is displayed
on a scale of 0-20dB although some variation does occur this image is representative

Flat Plate Welded Test-Piece Inspection
_____________________________________________________________________ 158
of the weld cap along the entire length of the test-pieces. The image clearly shows the
distortion of the parent material either side of the weld as seen in the photograph in
Fig 6-1.
Figure 6-10 Weld cap profile of the flat plate welded test-pieces ultrasonically measured using the membrane device.
The optimum transducer position using the 3rd generation device for each of the
different techniques to detect defects 1-7 is summarised in Table 6-3. The transducer
positions used to detect defects 8-14 are identical to those used for the smaller defects.
The optimum position for the central aperture of the probe to detect each of the
defects is slightly different but as discussed, complete coverage is achieved using six
scans. Each of the six scans performed is indicated by a different colour within Table
6-3. Inspection of the flat plate welded test-pieces has been performed using the
6mm, 7º design and the 20mm, 18º design. As discussed in chapter 5, these two
designs are considered the most appropriate to provide complete inspection coverage
of the test-pieces. The 6mm, 25º device has not been used due to the limited
performance of this design.
Approximate weld profile
Parent Material Distortion
Weld cap region

Flat Plate Welded Test-Piece Inspection
_____________________________________________________________________________________________________________________ 159
Table 6-3 Membrane coupled device optimum inspection position for defects 1-7. Inspection of the entire volume of interest is performed from six transducer positions relative to the weld, each position is indicated by a unique colour. The colour coding used is discussed in Table 6-4.
Approximate Optimum Aperture Centre Offset to Centre of Weld (mm)
Through Weld Inspection Techniques Near Side Inspection Techniques I.D. Defect Type Length
(mm)
Through-
wall size
(mm)
Ligament
to ID (mm)
Tilt Angle
(˚) Primary Secondary Primary Secondary
1 Lack of root
fusion 6.3 4 0 0 58 100 58 100
2 Lack of side
wall fusion 6.3 4 0.5 25 124 124 36 58
3 Lack of side
wall fusion 6.3 4 24.5 25 64 52 106 -
4 Lack of side
wall fusion 6.3 4 28.5 10 55 71 113 61
5 Lack of side
wall fusion 6.3 4 54 -10 152 11 152 116
6 Mid-weld
planar 6.3 4 54 0 152 11 152 11
7 Mid-weld
planar 6.3 4 27 0 66 96 66 96

Flat Plate Welded Test-Piece Inspection
_____________________________________________________________________ 160
The colour coding adopted in Table 6-3 and how this relates to the position of both of
the different 3rd generation probes used is provided in Table 6-4. The offset between
the probe centre position provided in Table 6-3 and the probe reference point
provided in Table 6-4 for the two different probe designs has been calculated by direct
measurement from the engineering drawings of the two probe designs.
Table 6-4 Colour coding system used to position probe in membrane device inspections.
Membrane probe reference point to weld centre line offset (mm) Probe centreline –
weld centreline offset 7º, 6mm 18º, 20mm
0 79 76 30 109 106 60 139 136 90 169 166 120 199 196
Pitch-catch technique
When the membrane coupled device is used to inspect the actual target application
component it will be mechanically scanned in the circumferential direction and FMC
data will be acquired every 2mm around the circumference of the pipe. This step size
is used in the current single element transducer inspection as a compromise between
inspection speed and accuracy. By using a linear array in the membrane probe design
the lateral defect sizing performance is not affected (this dimension is referred to as
the length of the defect in Table 6-3) so that this step size is again appropriate. As
previously discussed in the inspection of the non-welded test-pieces it was not
possible to acquire full encoded scan data using FMC with existing phased array
controllers available within Rolls-Royce. Therefore in this comparison testing, data is
once again collected from a single position for each defect and in each case the
transducer is positioned approximately in-line with the defect centre line.
Although FMC data has been acquired in a large range of locations only the relevant
data has then been processed to provide the required inspection image. Inspections
based on FMC data acquisition are very versatile; by collecting a single FMC data set
it is possible to subsequently process the data in a variety of different ways. In this
comparison the inspection data has been processed using different focal depths and
aperture sizes. In order to baseline the performance of each technique, an unfocused

Flat Plate Welded Test-Piece Inspection
_____________________________________________________________________ 161
test has been produced using an aperture of 12.5mm (17 elements). This is equivalent
to the aperture used previously in the 2nd generation device inspection of the two flat
plate, non-welded test-pieces reported in chapter 3. This technique is also
representative of the likely performance that could be achieved using a conventional
off-the-shelf single element transducer. This approach provides a baseline in
performance for the inspection.
When using a phased array it is only possible to focus within the near field of the
transducer. However, it is typically not possible to focus ultrasound either with an
array or a mechanically focused single element transducer to a single point. In reality
a given aperture will produce a beam with a finite width at all depths. Therefore a
single aperture can be used to provide a high quality, reliable inspection over a range
of different focal depths. A comparison of the beam characteristics when using a
17 element aperture and a 65 element aperture with the 3rd generation array is
provided in Table 6-5. These results have been produced using CIVA to simulate the
longitudinal wave produced with the array in immersion. A comparison of the
unfocused beam produced by each aperture is provided in Fig 6-11. This comparison
demonstrates that the beam shape produced by each aperture is very complex;
however, it also demonstrates that the larger aperture has a longer near field length
and can be used to provide a high degree of focusing over a long distance. The larger
aperture produces a broad beam and the use of focused delay laws is essential to
ensure that only a small region of the component is insonified during an individual
inspection. Applying appropriate delay laws to focus the ultrasonic energy also has a
far greater impact when using the larger aperture.

Flat Plate Welded Test-Piece Inspection
_____________________________________________________________________ 162
Table 6-5 Comparison of 6dB beam width and maximum amplitude obtained from a 17 element aperture and a 65 element aperture using the 3rd generation membrane device in immersion when using focused and unfocused delay laws.
Beam Characteristics
Unfocused Focused Inspection
Range (mm
of water)
Aperture
size
(elements)
6dB beam
width
(mm)
Maximum
Amplitude
(A.U.)
6dB beam
width
(mm)
Maximum
Amplitude
(A.U.)
50 17 12 12.4 4 20.5
50 65 46 12.2 2 47.3
100 17 9 16.1 7 18.1
100 65 46 17.8 2 55.8
200 17 24 9.5 17 9.9
200 65 38 15.9 3 35.6
400 17 33 4.3 33 4.4
400 65 68 4.1 18 7.9

Flat Plate Welded Test-Piece Inspection
_____________________________________________________________________ 163
a.)
b.)
Figure 6-11 CIVA beam plots for 3rd generation membrane coupled array coupled to a water path using unfocused delay laws with a, a.) 17 element aperture and a, b.) 65 element aperture. Both images are shown over a 60dB dynamic range.
Calculation of the near field length with many of the complex techniques used in the
inspection of the target application component is not straight-forward. An iterative
approach was taken to determine the optimum aperture size to use for the focused
beam inspection of each of the defects. As discussed above the aperture size used in a
given inspection dictates the region of the component that is insonified from a single
transducer position. Without mechanically scanning the transducer it is desirable to
use the minimum possible aperture size to ensure that the largest possible region can
be imaged from a given transducer position. Processing was initially performed with
100mm 100mm0mm 0mm
0mm0mm
400mm 400mm

Flat Plate Welded Test-Piece Inspection
_____________________________________________________________________ 164
a large aperture size to ensure that the defect was in the near field of the aperture used.
A measurement of the defect through-wall extent was then performed from the
B-Scan image obtained. This provided a measure of the maximum possible focusing
that could be achieved. The aperture size was then gradually decreased until the
measured through-wall size increased. This provided the minimum aperture size to
achieve optimum defect detection. This approach is only acceptable when conducting
an inspection on components with known defects such as the two flat plate, welded
test-pieces. An alternative approach must therefore be developed before FMC based
inspection can be deployed in industry. Work is ongoing to determine the optimum
aperture size and delay laws for each inspection technique used and the best technique
to combine the inspection data obtained. I lead this project within Rolls-Royce but
this activity is beyond the scope of my doctorate and will not be reported in this
thesis.
All of the experimental testing of the two flat plate, welded test-pieces was performed
using an automated approach in a standard x-y scanning frame. As discussed in
chapter 5 the 3rd generation membrane probe design has been updated to allow direct
irrigation. Based on the comparison testing discussed previously, the membrane
coupled device performs well when using this irrigation system and this approach has
been used to provide the couplant required in all of the experimental testing
performed in this inspection.
6.5. Experimental Results
Inspection of the flat plate, welded test-pieces has been performed using the 6mm, 7º
and the 20mm, 18º, 3rd generation membrane coupled devices. Testing has also been
performed using a pitch-catch arrangement; as discussed above the 80 element 2nd
generation membrane device and the 48 element rigid wedge transducer were used to
complete this testing. This configuration was used due to limitations in the total
number of channels available within the MicroPulse 5PA phased array controller.
The FMC data acquired from each of the 14 defects has been analysed using the range
of different techniques listed in Table 6-2. A comparison of the SNR response from
the defect using each of the different inspection techniques has then been performed.

Flat Plate Welded Test-Piece Inspection
_____________________________________________________________________ 165
A range of different focal regimes have been used in the welded test-piece inspection.
When using a single depth of focus, the focal depth is optimised to detect the defect
considered. Specific inspection techniques are used for the detection of surface
breaking defects. Therefore when using this approach a single focal depth is
appropriate and can be rapidly deployed. However, the depth of any embedded
defects within the actual target application component is unknown and hence focusing
throughout the inspection volume is required to provide complete inspection
coverage. In an actual inspection multiple processing steps would be required at a
range of focal depths and this is readily achievable with FMC data but processing this
data would be time-consuming. An alternative approach is to use the ATFM
algorithm, which produces a “fully-focused” B-Scan. Details of the ATFM algorithm
are provided in section 2.2.
A very large amount of experimental data has been captured related to the inspection
of the two flat plate welded test-pieces and it is inappropriate to review all of the
results generated here. In sections 6.5.1 to 6.5.5 an overview of the performance of
each of the main inspection techniques used will be provided. A comparison of the
inspection performance when using the membrane device with delay laws to simulate
a conventional off-the-shelf single element transducer inspection and the results
obtained from the optimised inspection is then provided in section 6.5.6. This
comparison quantifies the major improvements that can be achieved using the
optimised inspection approach.
6.5.1. Direct Specular Through Weld Inspection
Direct specular through weld inspection is used to detect a range of defects within the
target application component. A comparison of the inspection performance for all
defects detected using this type of technique is shown in Table 6-6. When using an
aperture of 17 elements and delay laws to simulate off-the-shelf single element
transducer performance a beam steering only approach is used without any focusing.
These results are shaded in yellow in Table 6-6. When using the optimised delay law
inspection with variable aperture size ATFM focusing is used for all of the tests
performed, these results have been shaded in blue in Table 6-6.

Flat Plate Welded Test-Piece Inspection
_____________________________________________________________________ 166
Table 6-6 A comparison of the inspection performance for all defects using a direct specular detection technique using single element (yellow shading) and optimised (blue shading) delay laws. Defects that are not detected are indicated by no value for the SNR.
Defect Array Aperture
size (elements)
Beam Type Primary / Secondary Technique
Inspection Performance
SNR (dB ± 1 dB) 2 6mm, 7º 17 65º, Long Primary 6 2 6mm, 7º 17 65º, Shear Secondary - 3 20mm, 18º 17 65º, Long Primary - 3 20mm, 18º 17 60º, Long Secondary - 4 20mm, 18º 17 70º, Long Secondary - 2 6mm, 7º 39 65º, Long Primary 9 2 6mm, 7º 39 65º, Shear Secondary 4 3 20mm, 18º 38 65º, Long Primary - 3 20mm, 18º 38 60º, Long Secondary - 4 20mm, 18º 31 70º, Long Secondary - 9 6mm, 7º 17 65º, Long Primary 11 9 6mm, 7º 17 65º, Shear Secondary 15
10 20mm, 18º 17 65º, Long Primary 10 10 20mm, 18º 17 60º, Long Secondary 9 11 20mm, 18º 17 70º, Long Secondary - 9 6mm, 7º 39 65º, Long Primary 18 9 6mm, 7º 39 65º, Shear Secondary 17
10 20mm, 18º 38 65º, Long Primary 15 10 20mm, 18º 38 60º, Long Secondary 15 11 20mm, 18º 31 70º, Long Secondary 6
Through weld inspection of components containing an austenitic stainless steel weld
is challenging and this is demonstrated by the number of defects that cannot be
detected in Table 6-6. When using the direct specular inspection approach the
transducer must often be located over the weld cap region. Therefore, without
removing the weld cap or using a conformable array, particularly when using a large
footprint array, it is not even possible to insonify the inspection region. Even when
using a small array or a conventional single element transducer inspection coverage is
limited. This is illustrated in the schematic diagram shown in Fig 6-12 for the through
weld inspection of defect 3 using the 18º, 20mm device. This diagram indicates that
when using a similar size array with a rigid wedge for the inspection of this defect, the
weld cap would have to be removed to provide suitable coupling.

Flat Plate Welded Test-Piece Inspection
_____________________________________________________________________ 167
Figure 6-12 Schematic diagram to illustrate the through weld inspection of defect 3 using a direct 65º longitudinal wave inspection with the 18º, 20mm device.
Even when using the membrane coupled device technology to allow inspection
through the weld cap region the anisotropic nature of the austenitic weld material
makes inspection very difficult. This is a general limitation of through weld
inspection and is not specific to the membrane coupled device approach. It was not
possible to detect defects 3 and 4 using either the single element or optimised delay
laws. However, as discussed previously these defects are significantly smaller than
the validation defect size for the target application. Therefore, although desirable, the
detection of this size of defect is not essential in this application.
Through weld inspection of defect 10 uses the same techniques as for defect 3 and
uses the type of technique shown in Fig 6-12. The inspection of defect 10 was also
challenging due to the presence of the austenitic weld material and the defect response
is mis-placed within the weld volume due to the anisotropic nature of the weld.
However, the inspection performance was also limited by an internal noise signal in
the 18º, 20mm design. This issue was predicted with the low height profile design
and hence this device was not used in the inspection but this issue was not expected in
the 18º, 20mm device. The effect of the internal noise signal for the through weld
inspection of defect 10 using the 18º, 20mm device, can be seen in the B-Scan image
provided in Fig 6-13. The image produced in Fig 6-13 has been generated using an
aperture of 17 elements and unfocused delay laws to generate a 60º longitudinal wave.

Flat Plate Welded Test-Piece Inspection
_____________________________________________________________________ 168
The SNR of the response from defect 10 provided in Fig 6-13 has been calculated by
ignoring the effects of the internal noise signal. This approach has also been taken for
all of the results provided in Table 6-6.
Figure 6-13 60º longitudinal wave B-Scan image obtained from the 17element aperture inspection of defect 10 through the weld using the 18mm, 20º device.
The presence of this noise signal in the inspection region of interest is due to a
variation in the actual probe configuration from that expected. When completing an
inspection using conventional rigid wedge transducers the transducer is forced into
contact with the outer surface of the component under test. This ensures that
appropriate coupling is maintained between the transducer and the component.
Assuming that the component has a regular geometry then this approach also
guarantees the height and angle of the transducer relative to the inspection surface.
As discussed in section 3.3 this approach cannot be used when completing an
inspection using the membrane coupled device. The array angle and height must be
controlled by the scanning mechanism used so that the membrane can conform to the
surface geometry of the component under test. The array can then be used to generate
the surface profile of the component as shown in Fig 6-10.
During the non-welded test-piece inspection discussed in chapter 3, manual user
intervention was used to optimise the inspection configuration for each of the
embedded defects. When testing with the 3rd generation device, an approach which is
more representative of that expected in industrial application has been used. In this
study a procedure has been developed to set-up the membrane device scanning jig.
This process has been developed so that the probe angle and stand-off are as
reproducible as possible and all probe positioning is relative to a single datum
Defect Response Internal
Noise Signal

Flat Plate Welded Test-Piece Inspection
_____________________________________________________________________ 169
position. The flow of water couplant used in each measurement has been maintained
at the same level using a standard peristaltic pump. Once the initial probe set-up has
been performed there has been no further user intervention and scanning of the entire
test-piece has been performed using a semi-automated approach. This proceduralised
technique has allowed data collection to be performed by a number of Rolls-Royce
employees. This has facilitated improved technology transfer into Rolls-Royce and
helped to accelerate the commercialisation of membrane device approach and FMC
based phased array inspection. However, this approach places additional challenges
on the mechanical design of the scanning mechanism and further improvements to
this design are required before a commercial membrane coupled device inspection can
be developed. The required improvements will be considered when subsequent
testing is performed on a fully geometrically representative test-piece in the future.
The variation in the array position can be compensated for by completing a
measurement of the array position relative to the outer surface prior to subsequent
processing of the experimental data. By completing this additional processing step it
is possible to fully characterise the transducer position and optimise the performance
of the inspection for each individual file. When using the current software this is a
manual process, which increases the time associated with processing the data.
Software development work is ongoing to automate this process but this will not be
performed during the timeframe of my doctorate. This variation in the array position
relative to the component is not a major limiting factor in the performance of the
transducer because the actual height and angle can be readily measured. However, it
does lead to some variation in the position of the internal noise signal which can
potentially decrease the effectiveness of a given inspection.
As discussed in section 6.3 the direct specular through weld inspection of defects 4
and 11 is also limited because of the high degree of mis-orientation between the
defect and the main beam angle. It was only possible to reliably and consistently
detect defect 11 using this technique with the 18º, 20mm device. Unfortunately, the
internal noise signal associated with this device that was seen to be an issue in the
inspection of defect 10 once again corrupted the B-Scan obtained. This is evident in
the B-Scan obtained from this inspection using a 31 element aperture and a single
focal depth of 26mm, shown in Fig 6-14. The defect SNR in the B-Scan provided in

Flat Plate Welded Test-Piece Inspection
_____________________________________________________________________ 170
Fig 6-14 is approximately 6dB. Although the performance of this technique is
limited, it does provide a useful confirmation of presence of the defect if detected
using one of the other inspection techniques. This technique is also likely to provide a
better quality defect response if the defect occurred with a slightly different tilt. The
use of this technique as a secondary inspection is therefore valid but caution should be
applied when using this approach.
Figure 6-14 B-Scan image obtained using the secondary through weld scan direction inspection of defect 11 with the 18mm, 20º 3rd generation membrane device. Suitable delay laws have been used to produce 26mm focal depth from an aperture of 31 elements.
Due to the presence of the internal noise signal the through weld inspection
performance for this type of defect is limited using both of the 3rd generation
membrane coupled phased array designs. An attempt has been made to address this
limitation through the design and manufacture of a twin crystal membrane coupled
phase array device. In the twin crystal array there is a separate transmit and receive
aperture, the beam spread internal noise signal is therefore not present and does not
corrupt the B-Scan image. The twin crystal membrane coupled device is discussed in
chapter 7.
6.5.2. Creep Wave Inspection
All of the testing performed using the creep wave technique used the 20mm, 18º, 3rd
generation membrane device design. When using an aperture of 17 elements and
delay laws to simulate off-the-shelf single element transducer performance, a beam
steering only approach is used without any focusing. When using the optimised delay
law inspection an aperture of 40 elements was used along with delay laws to focus at
Defect Response
Internal Noise Signal

Flat Plate Welded Test-Piece Inspection
_____________________________________________________________________ 171
0 mm depth within the component. This type of technique can only be used to detect
surface breaking, and near surface breaking defects so through thickness focusing is
not required. Unfortunately it was not possible to detect any of the outer surface
breaking defects using the creep wave inspection technique. When using this
approach multiple signals were observed. Some of these signals were related to the
weld cap geometry and it is possible that others were due to the defect itself.
However, it was not possible to reliably distinguish the actual defect from these
signals. As discussed previously the direct creep wave inspection of any near surface
defects using a conventional pulse-echo transducer is an issue because of the dead-
zone associated with the transducer. It is therefore possible that the creep wave
inspection performance can be improved by using the twin crystal membrane coupled
device. The design of this device is discussed in detail in chapter 7.
6.5.3. Corner Echo Inspection
The corner echo inspection technique is used to detect the surface breaking defects
embedded within the welded test-pieces. A comparison of the inspection performance
for all defects detected using this type of technique is shown in Table 6-7. Once again
when using an aperture of 17 elements and delay laws to simulate off-the-shelf single
element transducer performance a beam steering only approach is used without any
focusing; and is shown shaded in yellow in Table 6-7. In this case when using the
optimised delay law inspection with a variable aperture size, single depth focusing is
used at a depth corresponding to the surface of the test-piece, these results are shaded
in blue in Table 6-7. This focusing approach is suitable because a strong corner echo
response is only obtained from surface breaking or very near surface breaking defects.
The depth of the defect is therefore known and single depth focusing delay laws can
be processed faster than the ATFM algorithm. Defects 1 and 8 occur centrally within
the weld; therefore the convention adopted previously to describe the scan direction
has been used, and scanning from left to right in Fig 6-3 is considered to be the
through weld inspection direction. Although some small differences in inspection
performance from the two different directions are observed these are relatively small
and are due to the non-symmetrical nature of the root region.

Flat Plate Welded Test-Piece Inspection
_____________________________________________________________________ 172
Table 6-7 A comparison of the inspection performance for all defects using the corner echo inspection technique using single element (yellow shading) and optimised (blue shading) delay laws.
Defect Array Aperture size (elements)
Beam Type
Primary / Secondary Technique
Scan Direction
Inspection Performance SNR
(dB ± 1 dB)
1 6mm, 7º 17 45º, Shear Primary Through-Weld 13 1 6mm, 7º 17 60º, Shear Secondary Through-Weld 8 1 6mm, 7º 17 45º, Shear Primary Near side 8 1 6mm, 7º 17 60º, Shear Secondary Near side 9 2 6mm, 7º 17 45º, Shear Secondary Near side 16
5 20mm, 18º 17 45º, Shear
(full-skip) Secondary Near Side 16
1 6mm, 7º 26 45º, Shear Primary Through-Weld 14 1 6mm, 7º 41 60º, Shear Secondary Through-Weld 10 1 6mm, 7º 26 45º, Shear Primary Near side 11 1 6mm, 7º 41 60º, Shear Secondary Near side 10 2 6mm, 7º 39 45º, Shear Secondary Near side 19
5 20mm, 18º 42 45º, Shear
(full-skip) Secondary Near Side 18
8 6mm, 7º 17 45º, Shear Primary Through-Weld 21 8 6mm, 7º 17 60º, Shear Secondary Through-Weld 9 8 6mm, 7º 17 45º, Shear Primary Near side 8 8 6mm, 7º 17 60º, Shear Secondary Near side 11 9 6mm, 7º 17 45º, Shear Secondary Near side 15
12 20mm, 18º 17 45º, Shear
(full-skip) Secondary Near Side 20
8 6mm, 7º 26 45º, Shear Primary Through-Weld 22 8 6mm, 7º 41 60º, Shear Secondary Through-Weld 12 8 6mm, 7º 26 45º, Shear Primary Near side 10 8 6mm, 7º 41 60º, Shear Secondary Near side 16 9 6mm, 7º 39 45º, Shear Secondary Near side 24
12 20mm, 18º 42 45º, Shear
(full-skip) Secondary Near Side 24
The corner echo inspection of defect 1 in the flat plate, non-welded test-pieces was
very straight forward. In the non-welded test-pieces a simple notch defect was
introduced into the parent material and a strong corner echo reflection was observed,
with a high amplitude signal in comparison to the background noise. Inspection of
the root region in real welds is much more challenging and this is clear from the
results obtained for all of the root region defects in the welded test-pieces. The root
region of the flat plate welded test-pieces has a relatively complex geometry because
of the EB insert; as is shown in Fig 6-15. Even when no defect is present there are a
number of possible paths that allow ultrasonic energy to return to the transducer. A
schematic diagram of the main, non-defective, root signal for a 45º shear wave
inspection is shown in Fig 6-15(a). Due to the curved nature of the EB insert this type
of reflection can take place over a relatively wide range of aperture positions and

Flat Plate Welded Test-Piece Inspection
_____________________________________________________________________ 173
beam angles. The EB insert signal can be compared to the signal that could be
obtained from an actual defect using a corner echo is shown in the schematic diagram
in Fig 6-15(b). Similar interactions can occur when considering the other corner echo
inspection techniques used to detect root region defects.
a.)
EB Insert
Test-pieceLower Surface
Ultrasonic Beam Path
b.)
EB Insert
Test-pieceLower Surface
Ultrasonic Beam Path
Defect
Figure 6-15 Schematic diagram of the inspection of a.) a non-defective root in the flat plate welded test-pieces and b.) a root defect.
The presence of these root signals makes correct interpretation of the inspection data
critical. The non-defective root signals are distinguished from an actual defect signal
by considering the inspection range and the relative amplitude of the two different
signals. These differences in the measured ultrasonic signal can be quite subtle which
makes accurate data display essential. However, some difference in range and a
significantly reduced amplitude of the root signal can be readily observed for all four
of the defects considered in this region of the test-piece. This allows all of the root
region defects to be reliably detected using each of the techniques considered. The
45º shear wave corner echo provides a significantly higher amplitude signal and better
SNR that the 60º technique. This is expected because the corner echo effect is
strongest with 45º shear waves. The B-Scan image obtained from defect 8 using a 45º
shear wave inspection from the positive scan direction is shown in Fig 6-16(a). This
can be compared to the defect free case shown in Fig 6-16(b). This result illustrates

Flat Plate Welded Test-Piece Inspection
_____________________________________________________________________ 174
the challenges in terms of data interpretation. In Fig 6-16(b) a root signal is observed,
this signal occurs over a slightly broader range of times than the defect signal. The
6mm, 7º membrane configuration is more suitable for the inspection of the root region
defects because the internal beam spread noise signal is well removed from the defect
signal. The data shown in Fig 6-16 has been generated using the 6mm, 7º device with
an aperture of 12.5mm (17 elements) and processed to produce an unfocused shear
wave. The amplitude of the response from defect 8 in Fig 6-16(a) is approximately
four times greater than the defect free root response shown in Fig 6-16(b). This is
indicated by the decrease in the SNR of the root signal relative to the background
noise in comparison to the actual defect signal.
a.)
b.)
Figure 6-16 Comparison of the 45º shear wave B-Scan images obtained from a.) defect 8 and b.) a null defect region of the test-piece.
Detection of defect 5 and 12 using the full-skip 45º shear wave technique is relatively
straightforward and a high amplitude signal is observed using both the single element
and optimised delay laws. However, another strong geometrical feature is observed in
the null defect case due to the toe of the weld cap. In a similar way to the inspection
of the defects within the root region of the test-piece the data interpretation engineer
must distinguish a defect signal from this geometrical response. Once again this is
achieved by carefully monitoring the amplitude and the exact position of the signal.
The interpretation engineer is typically provided with a detailed description of the
component under test and would expect a signal from the toe of the weld. However,
this is also one of the potential positions where the interpretation engineer is likely to
anticipate a defect could occur. The 18 º, 20mm design is the most appropriate device
to use for this inspection because it has a more optimised natural beam angle and
hence provides a higher amplitude and better SNR than the low height profile design.
Defect Response Root Signal

Flat Plate Welded Test-Piece Inspection
_____________________________________________________________________ 175
A comparison of the response from defect 5 and a defect free region of the test-piece
is provided in Fig 6-17. The images in Fig 6-17 have been generated using the 18 º,
20mm device with a 17 element aperture and unfocused delay laws. The amplitude of
the response from defect 5 is double that observed from the defect free location and
has a SNR 7dB higher than the defect free toe signal. The difference in the type of
response measured from a defect and a defect free region can also be clearly seen in
Fig 6-17.
a.)
b.)
Figure 6-17 Comparison of the 45º full skip shear wave B-Scan images obtained from a.) defect 5 and b.) a null defect region of the test-piece. In each image an unfocused aperture of 17 elements is used and SNR is calculated relative to the background noise.
6.5.4. Transverse-Longitudinal (TL) Skip
The transverse-longitudinal (TL) skip technique is used to detect lack of side wall
fusion defects on the 25º weld fusion face without the beam traversing the weld
region. A comparison of the inspection performance for the four defects detected
using this type of technique is shown in Table 6-8. In all cases the inspection is
performed using the 6mm, 7º array with delay laws to generate a 65º longitudinal
wave from the near side of the weld. When using an aperture of 17 elements and
delay laws to simulate off-the-shelf single element transducer performance a beam
steering only approach is used without any focusing. The optimised delay law
inspection with a variable aperture size again uses the ATFM technique to provide
through thickness focusing using a single set of delay laws. Results produced using
the delay laws to simulate single element transducer inspection are shaded in yellow
and the results produced using optimised delay laws are shaded in blue.
Defect Response Weld Toe Signal

Flat Plate Welded Test-Piece Inspection
_____________________________________________________________________ 176
Table 6-8 A comparison of the inspection performance for the four defects detected using the TL skip technique using single element (yellow shading) and optimised (blue shading) delay laws.
Defect Aperture
size (elements)
Primary / Secondary Technique
Scan Direction
Inspection Performance
SNR (dB ± 1 dB) 2 17 Primary Near Side 14 3 17 Primary Near Side 9 2 39 Primary Near Side 18 3 65 Primary Near Side 10 9 17 Primary Near Side 17 10 17 Primary Near Side 16 9 39 Primary Near Side 19 10 65 Primary Near Side 18
The TL inspection of these defects in the welded test-pieces is essentially identical to
the inspection of defects 2 and 3 in the non-welded test-pieces and as would be
anticipated the results are comparable. These results demonstrate that defects of this
type can be reliably detected using the membrane coupled device. However, due to
the similarity between these results and those discussed in chapter 3 and chapter 5 this
provided very limited additional information regarding the performance of this
technology.
6.5.5. Transverse-Longitudinal-Longitudinal (TLL) Skip
As stated in section 6.2 the main inspection mechanism for the detection of mid-wall
planar defects that occur approximately normal to the component surface is the
transverse-longitudinal-longitudinal (TLL) technique. This technique is more
complex to use than the techniques discussed above. A comparison of the inspection
performance for all defects detected using this type of technique is shown in
Table 6-9. All of the testing performed using this technique uses the 6mm, 7º 3rd
generation membrane device design or a pitch-catch arrangement using the
80 element device along with the 48 element rigid wedge transducer. When using the
pitch-catch inspection technique the membrane device is used as a receiver only and
positioned directly above the weld cap as shown in Fig 6-18. In all inspections of this
type the entire 48 element rigid wedge array is used to generate the transmitted plane
wave. Different size apertures are then used with the membrane probe to compare the
predicted single element transducer inspection performance to the optimised
inspection. When using an aperture of 17 elements and delay laws to simulate

Flat Plate Welded Test-Piece Inspection
_____________________________________________________________________ 177
off-the-shelf single element transducer performance a beam steering only approach is
used without any focusing. Results obtained using these delay laws are shaded in
yellow in Table 6-9. When using the optimised delay law inspection with a variable
aperture size, ATFM is used to produce the results that are shaded in blue in
Table 6-9. The use of ATFM based inspection ensures that the through thickness
inspection capability is maintained. In order to distinguish between the two different
scan directions when considering defects that occur in the centre of the weld the
convention adopted previously has once again been used. Scanning from left to right
in Fig 6-3 is considered to be the through weld inspection direction in the inspection
results provided in Table 6-9.
Defect 6 Longitudinal Wave
Transverse Wave
Mode-ConvertedLongitudinal Wave
Figure 6-18 Schematic diagram of the pitch-catch TLL inspection setup.

Flat Plate Welded Test-Piece Inspection
_____________________________________________________________________ 178
Table 6-9 A comparison of the inspection performance for all defects using the TLL inspection technique using single element (yellow shading) and optimised (blue shading) delay laws. Defects that are not detected are indicated by no value for the SNR.
Defect Array Aperture
size (elements)
Beam Type
Scan Direction
Primary / Secondary Technique
Inspection Performance
SNR (dB ± 1 dB)4 6mm, 7º 17 65º, Long Through Weld Primary - 4 6mm, 7º 17 65º, Long Near Side Primary 8 4 6mm, 7º 17 45º, Long Near Side Secondary 9 5 Pitch-Catch 17 65º, Long Through-Weld Primary - 5 Pitch-Catch 17 65º, Long Near Side Primary 5 6 Pitch-Catch 17 65º, Long Through-Weld Primary 6 6 Pitch-Catch 17 65º, Long Near Side Primary -
7** 6mm, 7º 17 50º, Long Through-Weld Primary - 7** 6mm, 7º 17 50º, Long Near Side Primary 6
4 6mm, 7º 46 65º, Long Through Weld Primary - 4 6mm, 7º 46 65º, Long Near Side Primary 12 4 6mm, 7º 46 45º, Long Near Side Secondary 15 5 Pitch-Catch 17 65º, Long Through-Weld Primary - 5 Pitch-Catch 17 65º, Long Near Side Primary 6 6 Pitch-Catch 17 65º, Long Through-Weld Primary 9 6 Pitch-Catch 17 65º, Long Near Side Primary *
7** 6mm, 7º 44 50º, Long Through-Weld Primary 5 7** 6mm, 7º 44 50º, Long Near Side Primary 8 11 6mm, 7º 17 65º, Long Through Weld Primary - 11 6mm, 7º 17 65º, Long Near Side Primary 10 11 6mm, 7º 17 45º, Long Near Side Secondary 11 12 Pitch-Catch 17 65º, Long Through-Weld Primary 7 12 Pitch-Catch 17 65º, Long Near Side Primary 9 13 Pitch-Catch 17 65º, Long Through-Weld Primary 10 13 Pitch-Catch 17 65º, Long Near Side Primary 7
14** 6mm, 7º 17 50º, Long Through-Weld Primary 5 14** 6mm, 7º 17 50º, Long Near Side Primary 7 11 6mm, 7º 46 65º, Long Through Weld Primary - 11 6mm, 7º 46 65º, Long Near Side Primary 18 11 6mm, 7º 46 45º, Long Near Side Secondary 18 12 Pitch-Catch 17 65º, Long Through-Weld Primary 8 12 Pitch-Catch 17 65º, Long Near Side Primary 11 13 Pitch-Catch 17 65º, Long Through-Weld Primary 13 13 Pitch-Catch 17 65º, Long Near Side Primary 9
14** 6mm, 7º 44 50º, Long Through-Weld Primary 9 14** 6mm, 7º 44 50º, Long Near Side Primary 9
Notes * Low level signal observed but inconclusive as to origin
** Optimum inspection of defect 7 and 14 uses a 50deg TLL technique with 34mm offset between transmit and receive paths
When using the TLL inspection technique there is often an offset between the
transmit and receive paths. When completing the inspection using conventional
single element transducers the offset between the two paths is controlled during the
inspection planning phase and cannot be varied during the actual inspection.

Flat Plate Welded Test-Piece Inspection
_____________________________________________________________________ 179
Typically two individual probes are used with a fixed stand-off between them, or as in
the actual target application inspection, a bespoke probe is produced. A number of
different probe separations must be used to provide complete coverage of the entire
inspection volume. It is not practicably possible to provide a focused inspection with
an optimised set-up for every possible defect position and orientation and hence the
inspection performance can be compromised. Inspection coverage can be restricted
further due to the presence of the irregular weld cap and typically it is once again only
possible to detect some types of defect by mechanically grinding the weld cap off.
The membrane coupled conformable phased array device uses a large footprint array,
and this approach minimises the amount of axial mechanical scanning that is required.
Using this device in conjunction with the FMC data acquisition approach also allows
a high degree of flexibility in terms of the exact inspection configuration used. It is
possible to complete a wide range of TLL inspections using a self tandem (ST)
technique. When post processing the inspection data it is then possible to vary both
the angle of the inspection and the offset between the transmit and receive paths to
ensure that the optimum inspection configuration is used. By utilising the versatility
of the membrane coupled device approach and optimising the delay laws for a given
type of defect, it is possible to detect the mid-wall defects present in the welded test-
pieces.
The inspection of defects 4 and 11 in the welded test-pieces using the TLL inspection
with a 65º longitudinal wave from the near-side direction is equivalent to the
inspection of defect 4 in the non-welded test-pieces. As expected, the inspection
performance is comparable to the results obtained from the inspection of the non
welded test-piece, which are reported in Chapters 3 and 5. The secondary inspection
technique from the near side of the weld is very similar but uses a 45º longitudinal
wave. When using this wave angle there is a separation between the transmit and
receive paths and this must be accounted for during the processing of the FMC data.
This can be readily achieved using the Imperial College FMC processing software and
reliable detection of this type of defect is again possible using both sets of delay laws.
The inspection performance improves significantly when using the large aperture with
focused delay laws.

Flat Plate Welded Test-Piece Inspection
_____________________________________________________________________ 180
The through weld inspection of both defects 4 and 11 using the TLL inspection
technique is much more challenging. As shown in the schematic diagram provided in
Fig 6-19 for the inspection of defect 4, the mode-converted longitudinal wave must
propagate through the austenitic weld material. The austenitic weld causes a large
amount of scattering and beam steering and it is not possible to reliably detect this
type of defect even when using the optimised delay laws. As discussed in section
6.5.1 the secondary through weld inspection technique for this type of defect is a
direct specular reflection using a 70º longitudinal wave. Due to the slight
mis-orientation of the defect to the beam it is only possible to detect defect 11 using
this approach. Therefore, the through weld detection of defect 4 is not possible using
either of the techniques considered. This is a limitation of the inspection technique
used, however, defect 4 is smaller than the validation defect size for the actual target
application inspection and as such is not essential for the safe operation of the plant.
29
Defect 4
65
Figure 6-19 Schematic diagram of the through weld 65º longitudinal wave TLL inspection set for the inspection of defect 4.
In the inspection of outer surface breaking defects, the strong geometrical signal from
the weld toe discussed in section 6.6.2 is once again observed. Due to the presence of
this geometrical signal it is not always possible to reliably detect the presence of the
defect. Detection of this type of defect is likely to be easier when processing of
scanned data becomes possible. In the current approach comparison between the
defect region and a single non-defective region is performed. However, when using
scanned data, the interpretation engineer can monitor trends in the inspection data and
is less reliant on point measurements.

Flat Plate Welded Test-Piece Inspection
_____________________________________________________________________ 181
Detection of defects 6 and 13 is extremely difficult when using conventional rigid
wedge transducers and is only possible if the weld cap is removed. Due to the
distortion of the parent plate even when the weld cap is removed this is still a very
difficult inspection. Conversely, when using the membrane coupled device approach,
detection of this type of defect can be reliably achieved with the weld cap in place.
Defect detection is possible using both approaches used in this study. However, the
inspection performance using the optimised delay laws demonstrated a significant
improvement over the single element delay laws. When using the current, single
point measurement technique, it is typically easier to detect mid weld defects than
defects at the weld toe because the defect signal occurs well away from the high
amplitude geometrical signals. Low level signals were observed in many of the
inspections performed using the optimised delay laws. The origin of these signals is
unclear and the presence of these signals prevents a reliable inspection from being
performed. Therefore both of the mid-weld outer surface defects were only reliably
detected using the pitch-catch inspection techniques.
Defects 7 and 14 represent mid-wall, mid weld, planar flaws perpendicular to the
component back-wall. It is only possible to artificially introduce this type of defect
during the welding process and hence this type of defect was not included in the flat
plate, non-welded test-pieces. The inspection techniques used to detect these defects
are very similar to those used in the inspection of defects 4 and 11 but the inspection
angles used are slightly different. When I designed the test program for the inspection
of this type of defect I based the techniques used on the current inspection procedure
(Rolls-Royce, 2002a). These techniques could be used to detect each of the two
defects but the inspection performance was limited. When processing the data I found
that the highest amplitude and best SNR signal could be obtained using a slightly
different beam angle to that used in the current target application inspection. The
actual inspection technique used to detect this type of defect is shown in Fig 6-20.
This technique uses delay laws to generate a 50º longitudinal wave and an offset of
34 mm between the transmit and receive paths. The use of FMC data processing was
essential in the identification of this optimum inspection technique and demonstrates
the potential benefits that can be achieved by using this approach.

Flat Plate Welded Test-Piece Inspection
_____________________________________________________________________ 182
24
YX
Z
50
Defect 7
139
35
Figure 6-20 Inspection diagram to detect defect 7 using the 7º, 6mm 3rd generation 128 element membrane probe with a 50º TLL inspection from the positive direction.
The large separation between the transmit and receive paths means that the internal
noise signal is not present within the B Scan generated from the data. Detection of
the defect through the austenitic weld is challenging and the SNR of the defect
response is relatively low. However, when using the inspection technique shown in
Fig 6-20 it is possible to detect both defects 7 and 14. Both defects can be detected
using the unfocused delay laws; however, inspection performance is improved by
using the optimised delay laws with a larger aperture.
6.5.6. Inspection Summary
The inspection performance improvements that can be achieved by using the
membrane coupled device with optimised delay laws in comparison to the small
aperture, unfocused delay laws is significant in some cases. This is illustrated by the
results provided in Table 6-6 to Table 6-9 and have been discussed in the preceding
sections of this thesis. A summary of the inspection performance benefits that can be
achieved using an optimised inspection is provided in Table 6-10. Critically the
membrane device allows the reliable detection of some defects that are undetectable
using delay laws which mimic the commercially available single element transducers.
In Table 6-10 inspection techniques that can only be used to reliably detect a given
defect using optimised delay laws are highlighted in green. Inspection techniques that

Flat Plate Welded Test-Piece Inspection
_____________________________________________________________________ 183
can be used for defect detection using both approaches are highlighted in orange and
techniques that do not provide a reliable inspection for a given defect using either
approach are indicated in red. In many cases where a defect cannot be detected using
a certain technique it is only the smaller defect of that type which cannot be reliably
detected. The 4mm through wall defects embedded within the target application
component are smaller than the current validation size defect within the actual target
application component. These defects were included in the flat plate, welded
test-pieces to discover the potential performance of the membrane device technology
and detection of these defects is not essential for the safe operation of the component.
The most common reason for inconclusive detection of the defects highlighted in red
in Table 6-10 is the very challenging nature of through austenitic weld inspection.
This is a general issue related to this type of inspection and it is not specifically
associated with the use of the membrane coupled device. In situations where no
secondary inspection technique has been performed for a given defect this is shown in
grey. An additional inspection technique may be considered for these specific defects
in the future. When a defect occurs in the centre of the weld through weld inspection
is considered to be from the positive scan direction (i.e. left to right in the images
provided in Fig 6-3 and Fig 6-4) and near side weld inspection is considered as the
negative scan direction. In all cases the SNR improvement that can be achieved when
using the optimised delay laws is provided. The inspection performance can be
improved for all defects, even when the defect can be detected using the single
element transducer approach. These results graphically quantify the inspection
performance improvement using the 3rd generation membrane coupled device with
optimised delay laws.

Flat Plate Welded Test-Piece Inspection
_____________________________________________________________________ 184
Table 6-10 Table showing the SNR improvement when using an optimised delay law inspection in comparison to a 12.5mm aperture, unfocused inspection. Green shading indicates that it is only possible to detect a defect if optimised delay laws are used. Orange shading implies that a defect can be detected using both delay law approaches. Red shading is used to highlight defects that cannot be detected using a given technique and grey shading indicates where a specific test is not performed.
Inspection Technique SNR Performance (dB ± 1 dB)
Through Weld Near Side Defect Primary
Technique Secondary Technique
Primary Technique
Secondary Technique
1 1 2 3 1
2 3 4 4 3
3 - - 1
4 - - 4 6
5 - - 1 2
6 3 - - -
7 5 2
8 1 3 2 5
9 7 2 2 9
10 5 6 2
11 - 6 8 7
12 1 - 2 4
13 3 - 2 -
14 4 2
6.6. Membrane Device Inspection Speed Improvements
The reliable detection of a number of the defects within the two flat plate welded
test-pieces requires the use of the conformable phased array membrane device. This
is illustrated by the inspection technique diagrams shown for defect 3 in Fig 6-12 and
for defect 7 in Fig 6-20. These examples demonstrate that the complete inspection
coverage of the target application component without the removal of the weld cap is
only possible by using a conformable transducer. The experimental results reviewed
in section 6.5 also indicate that it is only possible to reliably detect some of the
defects that it is postulated could occur in the target application by using focused
inspection techniques. This can only practically be implemented by using phased

Flat Plate Welded Test-Piece Inspection
_____________________________________________________________________ 185
array transducers. The membrane coupled phased array device satisfies both of these
requirements. The use of phased array transducers can also provide dramatic
inspection speed improvements. I have performed a theoretical study to quantify the
potential inspection speed improvement. This study considers the inspection of the
actual target application component. At this stage in the development of the
membrane coupled device inspection it is not possible to complete this study
experimentally because a suitable geometrically representative test-piece has not been
produced. However, an estimate of the time associated with the overall inspection
can be accurately established based on knowledge of the required testing and the time
required to complete smaller scale laboratory tests.
In the current single element transducer inspection, scans with five separate probe
pans and 15 probe configurations must be performed. The technique document
(Rolls-Royce, 2002b) provides details of the raster scan performed with each probe
pan and these values have been used in this study. In the membrane device inspection
it is anticipated that three different probe configurations are used and six
circumferential scans are performed. In each probe configuration all of the 128
channels available on the MicroPulse 5PA will be used. The first probe configuration
will use the low height profile linear array, the second will be based on the 20mm
stand-off device, finally a pitch–catch scan using the 2nd generation membrane device
and the 48 element rigid wedge transducer will be performed.
Accurate and repeatable calibration of the different probes used is critical to provide a
high quality inspection. Calibration of the single element transducers is performed in
line with BS EN 1713 (British Standards Institution, 1998a). There is currently no
calibration standard for FMC phased array inspection, a technique is under
development as part of the NPCT project but this needs further clarification
(Duxbury, 2009). The current proposed FMC calibration process will characterise the
performance of the array on an element-by-element basis, the different beam
requirements will then again be assessed by using the post-processing software. FMC
calibration is likely to be more complex than calibration of conventional transducers
and a conservative estimate of the time required to complete this process has been
used.

Flat Plate Welded Test-Piece Inspection
_____________________________________________________________________ 186
A second comparison is also made where the “ultimate” membrane coupled device
inspection is considered. This comparison assumes that the data transfer rate between
the array controller and the host PC for FMC inspection is negligible. As computer
processing speeds improve this condition will become more achievable. These
conditions are also more likely to be met as controller architecture is optimised for
FMC inspection.
6.6.1. Assumptions
In order to complete the theoretical study of the time required carrying out the
inspection of the target application a number of assumptions have been made. These
assumptions are summarized here:
o The target application component only allows single sided inspection access,
therefore the full range of inspection techniques are required.
o When circumferentially scanning around the pipe a 2mm step size is used.
o All of the necessary mechanical movement of the transducer is performed at
5mm/s, in both the axial and circumferential directions and no allowance is
made for acceleration and deceleration.
o A complete FMC scan is performed using the membrane coupled device at
each scan position; inspection speed could be significantly improved by using
half matrix capture and omitting duplicate scan data but this has not yet been
validated for use within Rolls-Royce.
o In the single element transducer inspection the minimum amount of raster
scanning is performed to provide the maximum possible inspection coverage.
o The time required for data transfer for the single element transducer inspection
is assumed to be zero. This is likely to underestimate the inspection time,
particularly when complex probe pans are considered.
o The time required to calibrate and setup each single element transducer scan is
considered to be the same and is assumed to take approximately 1hour.
o The time required to calibrate and setup each membrane device scan is
considered to be the same and is assumed to take approximately 2 hours.

Flat Plate Welded Test-Piece Inspection
_____________________________________________________________________ 187
o All phased array inspections are performed using FMC, the time required to
complete this scan is based on experimental evidence using the MicroPulse
5PA array controller.
o All phased array inspections are performed using a 25 MHz sampling rate.
This is a higher sampling rate than required to provide Nyquist sampling of
the signal. However, the sampling rate is limited by the MicroPulse 5PA
controller.
o For each membrane probe inspection two scans are performed, one with a
20µs gate length to record the surface profile. The second scan is to inspect for
the defect and uses a 100µs gate.
o At this stage in the development process the manipulator set-up time can not
be accurately estimated and therefore this effect is ignored. When using the
membrane probe fewer probe changes are required and the manipulator setup
process is significantly simpler than in the single element transducer case.
This assumption is therefore likely to be highly conservative.
o The time required to analyze the data using each different transducer approach
is the same, and is omitted from the speed calculation.
o Neither the single element nor the FMC data is averaged
A summary of the predicted inspection times for each of the three different
approaches is shown in Table 6-12. This study demonstrates that in addition to the
improved inspection coverage, SNR and increased inspection flexibility it is also
possible to achieve significant speed improvements by using the membrane coupled
phased array device.

Flat Plate Welded Test-Piece Inspection
_____________________________________________________________________ 188
Table 6-11 Summary of time required to complete the entire target application inspection.
Single
element transducer
Current membrane device
performance
“Ultimate” membrane device performance
In-service inspection Time (hrs) 12.7 8.9 0.6
Calibration time (hrs) 23.0 6.0 6.0
Total in-service inspection time (hrs) 35.7 14.9 6.6
Improvement (%) NA 58% 82%
Weld cap removal (hrs) 6.0 0.0 0.0
Pre-service inspection time (hrs) 41.7 14.9 6.6
Total improvement (%) NA 64% 84%
To complete a thorough single element transducer inspection of the target application
component the weld cap must be removed. The pre-service inspection time for the
single crystal technique includes 6hrs that are estimated to be required to allow this
removal process to be performed. The membrane coupled device allows complete
inspection coverage to be performed without removal of the weld cap and this
requirement is omitted from the inspection time. Based on the theoretical study
performed the PSI time using the current device inspection equipment is almost three
times faster than the equivalent single element transducer inspection. If the potential
improvements that could ultimately be achieved are also included then the membrane
probe PSI time can be reduced by well over 80%.
The single element transducer in-service inspection (ISI) time does not include the
time required to remove the weld cap, it is assumed that this weld cap has been
removed at manufacture. The single crystal ISI time is therefore less than the time
required to complete the PSI. However, the membrane device approach can still
deliver significant inspection speed benefits. The current inspection capability is still
predicted to reduce the ISI time by almost 60% and after improvements to the process
of FMC data acquisition and processing a time reduction of over 80% could be
achieved. These speed improvements can significantly help to improve the
availability of the Submarine platform and reduce the cost of ownership to the MoD.

Flat Plate Welded Test-Piece Inspection
_____________________________________________________________________ 189
These inspection speed improvements are also likely to be an underestimate because
the manipulator setup times have been omitted. The results also demonstrate that
even for a large component such as the target application the time required to
complete calibration of the equipment is significant. The calibration time estimate is
also a source of potential error in these estimates. Finally the time required to
complete the membrane probe inspection is strongly dependent on the data transfer
speed from the controller to the host PC. Performance is only likely to approach the
“ultimate” inspection speed if a powerful computer processor is used.
6.7. Summary
Two flat plate, welded test-pieces that contain a weld and weld cap that are
representative of the target application component were designed and manufactured.
These test-pieces contain a total of 14 defects at a range of different positions and
orientations through-out of the weld region. These defects are designed to replicate
all of the planar defects that it is postulated could occur within the actual target
application component. A primary and secondary inspection technique from both
sides of the weld has been designed. Implementation of these techniques on the
welded test-pieces enable a thorough characterisation of the membrane coupled
device inspection capability.
An inspection of the two welded test-pieces has been performed using three different
membrane device transducer configurations. A proceduralised approach has been
developed that has allowed experimental data to be gathered by a number of
Rolls-Royce engineers. This approach has been adopted to accelerate the technology
transfer process into Rolls-Royce and to rigorously assess the membrane device
capability. The three different device configurations are complementary to one
another and provide the optimum overall inspection coverage. By using this
approach, coverage of the entire target application inspection volume, using each of
the primary and secondary defect detection techniques, can be achieved by carrying
out six circumferential scans of the component. Completion of testing on the flat
plate test-pieces demonstrates that all of the artificial defects embedded into the
test-pieces can be detected by at least one inspection technique. FMC data acquisition
is highly versatile and a single data set can be processed using a wide range of
different inspection techniques. This allows the use of delay laws that are optimised

Flat Plate Welded Test-Piece Inspection
_____________________________________________________________________ 190
for a given inspection. The results provided in this chapter demonstrate that these
optimised delay laws provide an improved inspection performance in comparison to
that achievable using delay laws to replicate conventional single element transducer
inspection. The use of optimised delay laws provides an improvement in the SNR of
the defect response in every inspection performed. However, in some cases the
standard delay law inspection is already good and the level of improvement using
optimised delay laws is limited. The use of ATFM provides a fully focused B-Scan
image and reduces the overall amount of data processing required in comparison to
completing multiple single focal depth processing steps. This approach will help to
reduce the overall inspection time in industrial applications.
A theoretical study has been performed to assess the potential speed improvements
associated with the membrane coupled device inspection. This study demonstrates
that through the development of suitable software, currently available equipment can
be used to reduce single element transducer inspection time of the target application
component by over 60%. Improvement of the data acquisition and processing
techniques would allow further reductions to be realised leading to a potential speed
improvement of over 80% in comparison to conventional single element techniques.

_____________________________________________________________________ 191
7. Twin Crystal Membrane Coupled Device Linear phased array probes offer a number of benefits over conventional single
element transducers. These include inspection speed, and the ability to steer and
focus the beam within a 2D region. However, in both single element and linear array
transducers when the initial ultrasonic pulse impinges on the outer surface of the
component under test a dead zone occurs. This dead-zone represents the region
within the component under test where discontinuities cannot be reliably detected.
The length of the dead zone can be reduced by selecting a high quality transducer
with a short pulse duration and a suitable level of damping for the application
(Krautkramer & Krautkramer, 1983). Another approach, often used within industrial
NDE, is to use a transmit-receive longitudinal (TRL) or twin crystal transducer (Birks
& Green, 1991).
The inspection of small lack of sidewall fusion defects and near surface defects within
the flat plate non-welded and welded test-pieces has proved very difficult using the
linear membrane coupled phased array device. In order to address this issue a twin
crystal membrane coupled device has been designed and manufactured. In this
chapter the use of twin crystal transducers is reviewed and the requirements of the
twin crystal array inspection capability are briefly assessed. The design of the twin
crystal membrane coupled device will then be discussed. Finally some preliminary
results obtained using this device will be presented. The use of this type of membrane
device was not originally envisaged at the start of this project and extensive testing
and characterisation of the transducer has not yet been performed.
7.1. Twin Crystal Transducers
Twin crystal transducers use a separate transmitter and receiver that are positioned
side by side in a single housing. A schematic diagram of a simple 0º longitudinal
wave twin crystal probe is shown in Fig 7-1. This specific type of transducer is
commonly used in industry for wall-thickness measurement (British Standards
Institution, 2004b). The receiving element is unaffected by the ring down time
associated with the transmitting element and near surface features can be detected.
The transmit and receive elements are acoustically isolated from one another by
introducing an absorbent material, such as cork between the two delay lines. Each

Twin Crystal Membrane Coupled Device
_____________________________________________________________________ 192
element is tilted at the “roof angle” of the transducer, this controls where the energy
from the transmit and receive elements intersect. This beam crossing point provides a
pseudo-focusing effect and the maximum sensitivity can be achieved at this point.
Angled delay line
TransmitReceive
Absorbent Material
Transducer
Roof Angle
Figure 7-1. Schematic diagram of a single element 0º longitudinal wave twin crystal probe.
Angled twin crystal transducers can also be produced using both single elements and
phased arrays. In this type of probe the angle of the ultrasonic energy produced is
controlled by the tilt angle and the roof angle of the two transducers. A diagram of
this type of transducer produced using the CIVA model is shown in Fig 7-2.
Typically the roof angle and the tilt angle are fixed when the probe is manufactured
and are the same for both the transmitter and the receiver. This type of probe design
is more complex to manufacture and control than the simple linear transducers
considered previously in this thesis.

Twin Crystal Membrane Coupled Device
_____________________________________________________________________ 193
a.)
b.)
13°
Tilt Angle
c.)
Figure 7-2. CIVA representation of an angled twin crystal array transducer a.) front view, b.) side view, and c.) plan view.
Angled twin crystal transducers have found application in industry, particularly for
near surface and austenitic weld inspection. The use of twin single element
transducers for near surface and through wall defect inspection is described by
Edelmann (1981). This type of twin crystal transducer has been shown to provide
SNR improvements in comparison to conventional single probe techniques (Dombret,
1991). Twin crystal single element and phased array transducers have been used to
successfully detect SDH defects in austenitic stainless steel welds produced using
different welding techniques (Dupond, 2006). Finally the use of CIVA to model twin
crystal array inspection performance for coarse grained stainless steel components has
been reported by Mahaut et al (2004).
7.2. Inspection Requirements
The membrane coupled phased array concept is very versatile and it is not limited to
use with single linear arrays. A twin crystal linear phased array has been designed;
specifically to address some of the limitations in the 3rd generation membrane coupled
device inspection of the two flat plate welded test-pieces. The inspection results
provided in chapter 6 demonstrate that the direct through weld inspection of the
mid-wall lack of sidewall fusion defects was relatively poor. The use of a twin crystal

Twin Crystal Membrane Coupled Device
_____________________________________________________________________ 194
phased array is intended to improve the SNR performance in this type of inspection
through austenitic weld material. Isolation of the transmitting array from the receiver
array will also eliminate the issue of the beam spread internal noise signal within the
membrane cavity.
The results in chapter 6 also demonstrate that the near surface defect inspection
performance using the linear membrane approach is limited because it is not possible
to generate an effective creep wave. Through suitable selection of the array tilt and
roof angles, a twin crystal probe could also be used to generate this type of wave and
improve the inspection of this type of defect. A twin crystal membrane device could
therefore be used for the inspection of a range of defects within the target application
and further improve the inspection capability associated with the conformable array
approach.
The goal of this development work was to design a twin crystal transducer to provide
satisfactory performance for the inspections detailed in Table 7-1. Only the defects
that are currently being considered for detection with the twin crystal membrane
coupled device have been included in Table 7-1. The eight defects within the flat
plate, welded test-pieces that will be inspected have been discussed in detail in
chapter 6, schematic diagrams of these defects are provided again in Fig 7-3. Only
two different inspection techniques are currently being used in this inspection; direct
through weld specular defect detection and the creep wave inspection technique.
Details of these inspection techniques used are provided in section 6.2. The
alternative inspections that were performed for the defects of interest will not be
repeated with the twin crystal device. These alternative inspections are not included
in Table 7-1 and are indicated by the grey shading.

Twin Crystal Membrane Coupled Device
____________________________________________________________________________________________________________________ 195
Table 7-1 Inspection technique summary for the flat plate, welded test-pieces using the twin crystal membrane coupled phased array device. Grey shading indicates that additional inspection techniques are not deployed.
Through Weld Inspection Techniques Near Side Inspection Techniques I.D. Defect Type Length
(mm) Through-wall
size (mm) Ligament to
ID (mm)
Tilt Angle
(˚) Primary Secondary Primary Secondary
3 Lack of side wall fusion 6.3 4 24.5 25 65 Comp (Specular) 60 Comp (Specular)
4 Lack of side wall fusion 6.3 4 28.5 10 70 Comp (Specular)
5 Lack of side wall fusion 6.3 4 54 -10 OD Creep Wave
6 Mid-weld planar 6.3 4 54 0 OD Creep Wave Mid-weld defect – symmetrical detection techniques
10 Lack of side wall fusion 12.6 8 20.5 25 65 Comp (Specular) 60 Comp (Specular) -
11 Lack of side wall fusion 12.6 8 28.5 10 70 Comp (Specular)
12 Lack of side wall fusion 12.6 8 50 -10 OD Creep Wave
13 Mid-weld planar 12.6 8 50 0 OD Creep Wave Mid-weld defect – symmetrical detection techniques

Twin Crystal Membrane Coupled Device
_____________________________________________________________________ 196
a.) e.)
Defect 10
8.0
WeldProfile
b.)
Defect 4
WeldProfile
4.0
f.) Weld
Profile8.0
Defect 11
c.)
Defect 5
4.0Weld
Profile
g.)
Defect 12
8.0Weld
Profile
d.)
Defect 6
4.0Weld
Profile
h.)
Defect 13
8.0Weld
Profile
Figure 7-3 Schematic diagram of defects considered as part of the twin crystal membrane coupled phased array development activity , a.) defect 3, b.) defect 4, c.) defect 5, d.) defect 6, e.) defect 10, f.) defect 11, g.) defect 12, h.) defect 13.
7.3. Twin Crystal Membrane Coupled Device Design
The refraction angle of the ultrasonic energy produced by a conventional dual element
twin crystal transducer is dictated by the tilt angle and also the roof angle of the
wedge. However, in a phased array twin crystal transducer the refraction angle of the
wave produced can also be varied by suitable control of delay laws. The roof angle of
the twin crystal transducer controls the depth of the beam crossing point. This beam
crossing provides a pseudo-focusing effect and the maximum sensitivity of the device
corresponds to the point at which the two beams intersect. The sensitivity of this type
of transducer decreases at depths less than and greater than the beam crossing point.
Typically the performance of a twin crystal transducer is considered acceptable
Defect 3
4.0
WeldProfile

Twin Crystal Membrane Coupled Device
_____________________________________________________________________ 197
between half and twice the beam crossing depth (Krautkramer & Krautkramer, 1983).
The target application component has a relatively thick wall and it is clear from Table
7-1 that there is a large difference between the depth of the lack of sidewall fusion
defects and the near surface defects. It is therefore not possible to design a single,
fixed roof angle, twin crystal array that provides satisfactory complete through-
thickness inspection performance.
There are a number of ways in which it is possible to effectively produce a variable
roof angle twin crystal transducer. By using this approach a single transducer can be
used to produce a range of refraction angle beams and different beam crossing points.
One option to achieve this is to use a full 2D matrix transducer. A 2D matrix
transducer uses a regular grid of elements which provides control of the ultrasonic
beam within the 3D volume and hence a great deal of inspection flexibility. I lead a
collaborative project between Rolls-Royce and University of Strathclyde to produce a
flexible 2D matrix phased array (Harvey et al, 2009). This work is beyond the scope
of my thesis and will not be discussed in detail here but the development of this
device is focused on a different application where 2D conformability is required.
An alternative is to mount two 1.5D arrays onto a fixed angle wedge (Maes &
Richard, 2008; Delaide & Dumas, 2005). A 1.5D array typically uses rectangular
elements as shown in the schematic diagram produced using CIVA in Fig 7-4. The
dimensions provided in Fig 7-4 provide an indication of the size of this type of
transducer; however, the exact dimensions would be dependent upon the inspection
application. The front and side elevations of this type of transducer are essentially
identical to the standard twin crystal array transducer, shown in the schematic diagram
in Fig 7-2. Therefore only the plan view of the 1.5D twin crystal array transducer is
included in Fig 7-4. In this type of transducer a small fixed roof angle is typically
used (Maes & Richard, 2008; Delaide & Dumas, 2005) to provide some mechanical
control of the beam crossing point. The element delay laws are then controlled to
further modify the beam crossing point and to change the refraction angle of the
ultrasonic wave. The use of rectangular elements provides limited control of the
effective roof angle but greater control of the tilt angle whilst maintaining the amount
of ultrasonic energy that can be produced by the transducer. As discussed in chapters
2 and 5 in order to maintain the required steering capability and limit the production

Twin Crystal Membrane Coupled Device
_____________________________________________________________________ 198
of secondary maxima the element pitch used within the array must be relatively small.
Defects can typically exist over a range of different tilt angles the ability to steer and
focus the beam through-out the entire wall thickness of the component is therefore
essential. Hence a large number of small elements is required to provide the
necessary level of control. However, acceptable inspection performance can be
achieved by using only a limited number of different beam crossing points. Therefore
the roof angle must only be varied over a relatively small range of angles and only
limited control of the beam in this direction is required. This allows a smaller number
of relatively large, directional, elements to be used. Therefore the use of rectangular
elements provides the best compromise in terms of overall array performance.
Figure 7-4 Plan view of the CIVA representation of a 1.5D phased arrays to generate a variable roof angle twin crystal transducer.
The fundamental issue with 2D matrix transducers and 1.5D twin crystal transducers
that reduce their applicability to the target application inspection is that the overall
size of the transducer is significantly reduced. This increases the amount of axial
mechanical scanning that is required and increases inspection time. It also reduces the
near field length of the transducer and limits the focal range. The results provided in
chapter 6 demonstrate that the use of focusing is essential for optimum defect
detection in the target application. The use of a small number of fixed roof angle
~50mm
~50mm

Twin Crystal Membrane Coupled Device
_____________________________________________________________________ 199
transducers optimized for through thickness beam steering and focusing is therefore
necessary in the target application.
When using a twin crystal phased array the energy generated by each element within
the array strikes the component outer surface at a compound angle. The propagation
angle of the ultrasonic wave in the component under test is therefore more complex
than in a simple linear array. The required tilt and roof angles of the two arrays for
the detection of both the lack of sidewall fusion defects and the surface breaking
defects have therefore been modelled using release 9.1 of the CIVA simulation
package. This version of the CIVA platform does not accurately simulate creep wave
propagation; it does however provide a notification if any of the beams produced by
the array are approaching a critical angle. The accuracy of the CIVA model is
therefore not guaranteed and caution must be exercised when using CIVA as a design
tool for this type of application.
The Peak NDT MicroPulse 5PA phased array controller unit used in this development
activity has 128 parallel data channels. Therefore the twin crystal design is limited to
a maximum of 128 elements and simulation of two 64 element linear arrays was
performed. The array element pitch and width used in the 3rd generation linear
membrane device design has previously proved very successful and has once again
been used in the design of the twin crystal device. Design of the twin crystal
membrane coupled device was also performed in close collaboration with Lionel
Reyes (Rolls-Royce, Senior Design Engineer) to ensure that the proposed twin crystal
design could be manufactured.
When completing the design of the twin crystal, membrane coupled device a number
of physical parameters describing the proposed transducer geometry were input into
CIVA. The CIVA model was then used to understand the effect of changing these
parameters on the resulting beam angle and the beam crossing point. This calculation
is performed at a single emission point from the centre of the array. The exact beam
characteristics will vary depending on the array aperture used because of the variable
water path.

Twin Crystal Membrane Coupled Device
_____________________________________________________________________ 200
A CIVA screen capture is provided in Fig 7-5 showing the essential parameters that
must be controlled to design the twin crystal membrane coupled device when using
the CIVA modeling tool. These essential parameters are defined in Table 7-2 and
where appropriate the values used within the CIVA simulation are provided. During
the design phase the front and back length and the width (L1, L2 and L3 in Fig 7-5) of
the transducer were set to relatively large values to ensure that no internal reflections
would occur from either end of the transducer cavity. In addition the height of the
transducer (L4) was fixed to ensure that the ride-height could be suitably controlled to
allow the membrane device to conform to the weld cap geometry and that the device
could be manufactured.
Figure 7-5 CIVA screen capture showing the essential parameters used to design the twin crystal membrane coupled device.
As discussed in section 7.1 the transmit and receive arrays must be physically
separated using a high loss acoustic barrier. This design constraint limits the
minimum separation (L6, in Fig 7-5) that can be achieved between the two arrays. I
proposed to again use the AptFlex F28 attenuative rubber (Precision Acoustics Ltd)
which was used in the 3rd generation device and was discussed in chapter 5. The twin
crystal membrane device design was therefore performed to allow a 10mm thick piece
of the rubber to be inserted between the transmit and receive arrays to minimise noise.
To maintain manufacturability and allow this rubber material to be inserted between
the arrays a fixed separation distance must be maintained. The distance between the
centreline of the transmitting array and the centreline of the receiving array is
controlled to be approximately 35mm, which corresponds to a value of 20mm for L6
within the CIVA model. The roof and tilt angles of the twin crystal transducer design
End View Side View

Twin Crystal Membrane Coupled Device
_____________________________________________________________________ 201
were then varied within the modelling environment to determine the different
refraction angles and beam crossing points that could be produced.
Table 7-2 Definition of the essential parameters that must be controlled when using CIVA.
Parameter Description Value
L1 Front length – distance from array index point to front of the probe housing. 40mm
L2 Back length – distance from array index point to back of the probe housing. 40mm
L3 Width of probe – overall width of probe housing. 60mm
L4 Array height – perpendicular distance from the centre of the array to the outer surface
of the component under test. 16mm
L5 Beam crossing depth – Vertical distance
between the base of the probe and the beam crossing point.
Variable
L6 Minimum separation - distance between the transmit and receive arrays. 20mm*
R Refraction angle – The beam angle produced by the probe. Variable
Note
* Corresponds to a centre-to-centre separation of 35mm
As discussed in section 7.2, at this stage in the development of the twin crystal device
two main designs are required to implement the two different inspection techniques
being considered. The first probe design is for the detection of mid-wall, lack of
sidewall fusion defects. The second design must be suitable for the creep wave
detection of near surface defects. The inspection requirements listed in Table 7-1
show that a 60º longitudinal wave is the lowest angle beam that is required to
complete both of these inspections. When considering a simple linear array, a water
wedge tilt angle of 13º gives a refraction angle in steel of approximately 61º. This tilt
angle was also successfully used in the 2nd generation membrane coupled device
described in chapter 2. Therefore a twin crystal membrane coupled device with a
fixed tilt angle of 13º was designed.
Ultrasound produced by the transmitting array in the twin crystal probe impinges on
the outer surface of the component under test at a compound angle. The effect of the
tilt angle can be somewhat compensated for by suitable control of the delay laws, and

Twin Crystal Membrane Coupled Device
_____________________________________________________________________ 202
hence a single tilt angle can be accommodated. However, the refraction angle of the
longitudinal wave produced and the depth of the beam crossing point is very sensitive
to small changes in the roof angle and this cannot be readily compensated for by
varying the delay laws. The roof angle of the membrane coupled device must
therefore be carefully controlled. An iterative approach was used to find the best roof
angle for the inspection of each type of defect listed in Table 7-1. The most
appropriate roof angle for the direct specular through weld inspection of the lack of
side wall fusion defects is 4º. The ultrasonic beam produced from a 4º roof angle twin
crystal membrane coupled device simulated in CIVA using null delay laws is
provided in Fig 7-6a. The beam plot shown is calculated on a 2D plane along the
centreline of the twin crystal device. The most appropriate roof angle for the
generation of a creep wave for the inspection of the outer surface defects in the flat
plate, welded test-pieces is slightly more complex. As previously discussed the
version of CIVA being used to assist in the design of the twin crystal membrane
coupled device does not accurately predict creep wave behaviour. The performance
of the CIVA model in prediction of behaviour around the first critical angle is
potentially limited. As the roof angle is increased it was found that near the first
critical angle the predicted beam behaviour changed very rapidly. Therefore two
different roof angles were predicted to be potentially appropriate; 7º and 7.5º. A
CIVA beam plot using null delay laws for both roof angles is provided in Figure 7-6.
Once again the beam plot is provided along the centreline of the twin crystal
membrane coupled device. Experimental validation is required to assess which of
these two designs is most appropriate for the inspection of the outer surface defects in
the flat plate, welded test-pieces.

Twin Crystal Membrane Coupled Device
_____________________________________________________________________ 203
a.)
b.)
c.)
Figure 7-6 CIVA simulation of the beam produced using null delay laws by a 13º tilt angle twin crystal membrane coupled phased array device with a.) 4º roof angle, b.) 7º roof angle, c.) 7.5º roof angle. All images are shown over a 60dB range.
A comparison of angle of the refracted beam and the beam crossing point for twin
crystal membrane coupled device predicted by CIVA with the three different roof
angles considered is provided in Table 7-1. The results provided in Figure 7-6 and in
Table 7-1 demonstrate that a twin crystal device with a 13º tilt angle can be used to
generate the required beam angles and crossing points. The results provided
correspond to the natural angle of the resultant beam in steel using the entire array
Phased array - null delay laws
Longitudinal wave
Phased array -null delay laws
Phased array -null delay laws
Longitudinal wave
0mm
45mm0mm 100mm
Potential shear wave path – not
modelled
100mm 0mm 20mm
0mm
Longitudinal wave – beyond 1st critical
angle
100mm 0mm 20mm
0mm
Potential shear wave path – not
modelled
Potential shear wave path – not
modelled

Twin Crystal Membrane Coupled Device
_____________________________________________________________________ 204
aperture. It may be possible to further optimise the performance of the twin crystal
membrane device through the use of variable apertures and delay laws.
Table 7-3 Comparison of the longitudinal wave refraction angle and beam crossing point that can be produced using the twin crystal membrane coupled device design with the use of delay laws.
Roof Angle (º)
Longitudinal Wave Refraction Angle in Steel (º)
Beam Crossing Depth in steel (mm)
4.0 65 25 7.0 80 5 7.5 90 0
To improve the likelihood of producing a twin crystal membrane device that can be
used to successfully produce a suitable beam angle, a variable angle design has been
adopted. The three different transducer configurations can therefore be generated
using a single array housing. A photograph of the twin crystal membrane device,
showing the variable roof angle is provided in Fig 7-7. The twin crystal membrane
coupled device has a non-parallel top surface; the roof angle can be altered with the
angle adjustment bolt, labelled in Fig 7-7. Once a suitable roof angle has been
selected the array is secured in place using the roof angle fixing bolt. This process is
repeated for each of the two arrays independently, care must be taken to ensure that
the final array configuration is symmetrical. The tilt angle of the device is fixed at 13º
but the roof angle can be varied to control the actual beam angle produced. The
design ensures that the emission point of the transmit array relative to the receiving
array is fixed and that the roof angle can be varied between approximately 3º and 9º.
Schematic diagrams of the 4º and 7º roof angle twin crystal membrane coupled
devices are provided in Fig 7-8

Twin Crystal Membrane Coupled Device
_____________________________________________________________________ 205
Figure 7-7 A photograph of the 4º roof angle configuration of the twin crystal membrane coupled device
a.)
b.)
10
7
Rear View
Transducer
Roof Angle
Acoustic Barrier
10
Transducer
13Tilt Angle
Side View
Figure 7-8 The twin crystal membrane coupled device a.) Schematic diagram of the 4º roof angle configuration, b.) Schematic diagram of the 7º roof angle configuration.
There is a potential crosstalk noise path within the twin crystal membrane coupled
device. Ideally the AptFlex F28 absorbent rubber, which is used as an acoustic barrier
to isolate the transmit and receive arrays, would be in contact with the outer surface of
the component under test. The rear view of the both the 4º and 7º twin crystal
Phased array transducer
Angle adjustment Roof angle fixing bolt

Twin Crystal Membrane Coupled Device
_____________________________________________________________________ 206
membrane coupled devices provided in Fig 7-8 show that this is not the case. The
AptFlex F28 rubber is relatively rigid and it is not possible to use this material as an
acoustic barrier and maintain conformability. The experimental results provided in
section 7.5 indicate that this does lead to the presence of some background noise.
However, through suitable control of the set-up parameters used this noise can be kept
to an acceptable level. It may also be possible to alter the acoustic barrier material in
future design iterations to reduce the level of this noise still further.
7.4. Inspection Deployment
When using the twin crystal membrane device it will still be necessary to update the
delay laws used when scanning over components with complex surface geometries.
Long and Cawley (2006) demonstrated that if the surface profile is known to
±0.25 mm the largest predicted loss in SNR is 3dB. The twin crystal membrane
device is designed to minimise cross-talk between the transmit and receive arrays.
Therefore it is not possible to measure the surface profile of the component under test
by firing the transmitter and monitoring the response on the receiver. When using the
twin crystal membrane coupled device with a low roof angle it is possible to use a
single array in both transmission and reception; this is shown in the schematic
diagram provided in Fig 7-9. When using the twin crystal device to measure the
surface profile, measurements must be performed using both arrays individually to
accurately map the surface profile for each inspection position. However, as the roof
angle is increased less of the energy produced by the each individual array can be
detected using the same array and an alternative approach is required. As discussed in
section 6.4 it is possible to accurately map the surface profile of the component under
test using the 3rd generation linear membrane coupled device. When using the 3rd
generation device a proceduralised approach is used so that the first scan is performed
with the membrane device directly over the weld cap surface. This information is
subsequently used to update the inspection delay laws on later scans. The surface
profile information gathered using the linear membrane coupled device can also be
used to update the delay laws during the twin crystal membrane coupled device
inspection. When using this approach it is once again essential that the position of the
transducer is accurately known so that the correct surface profile information is used.
Sufficiently accurate positioning of the transducer is readily achievable when using
automated inspection techniques.

Twin Crystal Membrane Coupled Device
_____________________________________________________________________ 207
Figure 7-9 Schematic diagram of the surface profile measurement using the twin crystal membrane coupled device.
The twin crystal membrane device once again incorporates an integrated irrigation
system. When designing the transducer housing the goal was to remove the tubes
taking the irrigation feed and injecting coupling between the membrane and the
component under test. The tubes used in the third generation device design are
relatively long. There is a risk that these tubes could become caught and obstruct the
movement of the membrane probe during scanning or become dislodged leading to a
loss of couplant. The intention with the twin crystal design was to introduce irrigation
channels into each side of the membrane housing and deliver couplant through the
housing itself. This design is entirely possible but unfortunately due to the scanning
frame design it was not possible to design the required irrigation channels in a cost
effective way for manufacture of the prototype twin crystal device. The same
irrigation system implemented on the 3rd generation device has therefore once again
been used in the twin crystal transducer.
The height and angle of the twin crystal membrane coupled device is also once again
controlled in the same way as that adopted with the 2nd and 3rd generation membrane
coupled devices. The approach used is discussed in greater detail in section 3.3. In

Twin Crystal Membrane Coupled Device
_____________________________________________________________________ 208
order to accommodate the larger footprint twin crystal device into the scanning frame
jig, it was necessary to complete some mechanical changes. These were performed
with the assistance of Lionel Reyes (Rolls-Royce, Senior Design Engineer) and are
shown in Fig 7-10. As with the 3rd generation device the twin crystal probe contains
128 elements, the 48 element rigid wedge transducer is used to control the ride height
and angle of the array only and it is not electrically connected to the MicroPulse 5PA.
The ride height of the array is controlled so that base of the picture frame on the array
is approximately 6mm above the parent plate material using the procedure discussed
in chapter 6.
Figure 7-10 Photograph of the twin crystal membrane coupled device and the 48 element rigid wedge linear phased array.
7.5. Twin Crystal Membrane Device Experimental Results
The twin crystal membrane coupled device has initially been designed specifically for
the inspection of a limited range of defects within the target application component.
The defects and the inspection techniques to be considered are provided in Table 7-1.
The use of all of the inspection techniques implemented with the 3rd generation
membrane coupled device is therefore not required at this stage in the development of
the twin crystal membrane device.
The development of the twin crystal device is still ongoing and limited experimental
testing has been performed. The experimental testing performed at this time has
focused on the through weld inspection of defects 3 and 10 using the direct specular
48 element rigid wedge phased array
Scanning mechanism
Fixed height offset
Twin crystal membrane coupled
device

Twin Crystal Membrane Coupled Device
_____________________________________________________________________ 209
technique with the roof angle of the transducer set to approximately 4º. A schematic
diagram of the inspection configuration used is provided in Fig 7-11, the same
configuration is adopted in the inspection of both defects. Inspection of each defect is
performed from a single location with the transducer positioned as shown in Fig 7-11
and approximately in line with the centre of the defect.
Figure 7-11 Schematic diagram of the experimental set-up used for the direct specular through weld detection of defect 3.
In order to process the FMC data acquired using the twin crystal device the Imperial
College post processing software suite has been updated. I have worked with Dr Rob
Long at Imperial College to implement these changes. I have determined the required
techniques and Dr Long has been responsible for implementing these changes in the
software. I have then performed some preliminary validation of these updates based
on the experimental data acquired.
When using the configuration shown in Fig 7-11 it is possible to reliably detect
defect 10 using the twin crystal membrane coupled device. The B-Scan image
obtained from the direct specular 65º longitudinal wave inspection of defect 10 using
the twin crystal device is shown in Fig 7-12(a). The inspection of defect 10 using the

Twin Crystal Membrane Coupled Device
_____________________________________________________________________ 210
18º, 20mm configuration of the 3rd generation linear membrane coupled device is
provided in Fig 7-12(b). The B-Scans provided in Fig 7-12 have been generated using
an aperture of 17 elements (12.5mm) with unfocused delay laws. The result provided
in Fig 7-12(a) using the twin crystal membrane device is very encouraging. The
internal noise signal that is clearly evident in Fig 7-12(b) and which limits the
performance of the linear membrane coupled device has been eliminated. A low
amplitude ultrasonic cross-talk signal is observed but as discussed in section 7.3 the
source of this noise is understood and can be reduced further by using a more
appropriate acoustic barrier material to isolate the two arrays. The SNR of the defect
response using the twin crystal device with unfocused delay laws is approximately
11dB which is comparable to the 10dB SNR obtained using the linear membrane
coupled device. This indicates that the SNR performance of the two different
approaches is very similar. However, the B-Scan obtained using the 3rd generation
linear device, which is shown in Fig 7-12(b), has to be plotted on a different dynamic
range because the internal noise signal appears at a higher amplitude than the defect
signal.

Twin Crystal Membrane Coupled Device
_____________________________________________________________________ 211
a.)
b.)
Figure 7-12 Comparison of the 65º longitudinal wave B-Scan images obtained using a 17element aperture with unfocused delay laws for the inspection of defect 10 through the weld using a.) the twin crystal membrane coupled device and b.) the 18mm, 20º 3rd generation linear membrane coupled device.
A complete comparison of the inspection performance for the through weld inspection
of defects 3 and 10 using the 3rd generation 18º, 20mm linear membrane coupled
device and the twin crystal membrane device is provided in Table 7-4. All of the
results in Table 7-4 have been produced using an aperture size of 17 elements
(corresponding to 12.5mm) and unfocused delay laws. The 3rd generation linear
membrane coupled device results are highlighted using yellow shading and the twin
crystal device results are shaded blue. The SNR performance of the 3rd generation
device has been calculated by ignoring the effect of the internal noise signal. Even
when this noise is ignored the twin crystal device provides some improvement in
defect SNR. However, despite the removal of the internal noise signal it is still not
possible to detect defect 3 through the austenitic weld using a small aperture with
unfocused delay laws.
Defect Response Internal
Noise Signal
Defect Response
Ultrasonic Cross-talk Signal

Twin Crystal Membrane Coupled Device
_____________________________________________________________________ 212
Table 7-4 A comparison of the inspection performance for the direct specular through weld inspection of defects 3 and 10 using the 3rd generation linear membrane device (yellow shading) and the twin crystal membrane device (blue shading). All inspections are performed using an aperture of 17 elements and unfocused delay laws. Defects that are not detected are indicated by no value for the SNR.
Defect Array Aperture
size (elements)
Beam Type Primary / Secondary Technique
Inspection Performance
SNR (dB) 3 20mm, 18º 17 65º, Long Primary - 3 20mm, 18º 17 60º, Long Secondary - 3 Twin Crystal 17 65º, Long Primary - 3 Twin Crystal 17 60º, Long Secondary -
10 20mm, 18º 17 65º, Long Primary 10* 10 20mm, 18º 17 60º, Long Secondary 9* 10 Twin Crystal 17 65º, Long Primary 11 10 Twin Crystal 17 60º, Long Secondary 10
Note
* SNR performance of the 3rd generation linear device is calculated by ignoring the
presence of the internal noise signal
As discussed in chapter 6, when completing the direct specular through weld
inspection of defects 3 and 10 using optimised delay laws with the 3rd generation
device an aperture size of 38 elements was used. Unfortunately due to the relatively
short length of the twin crystal device it is not possible to duplicate this approach from
a single transducer location. In order to use a large aperture size and focused delay
laws the twin crystal membrane coupled device would need to be scanned along the
outer surface of the component under test. As discussed previously it is currently not
possible to acquire scanned FMC data. This is a limitation of the current FMC
inspection process and is being addressed through the development of a bespoke
software suite within Rolls-Royce. However, this software suite is still under
development and is beyond the scope of my doctorate. It is likely that when scanned
inspection data can be acquired and suitably processed, that the twin crystal device
can be used to provide further improvements to the through weld inspection
performance. The performance of the twin crystal, membrane coupled device is very
promising. The removal of the internal noise signal is a significant improvement and
demonstrates the potential benefits of this approach.

Twin Crystal Membrane Coupled Device
_____________________________________________________________________ 213
7.6. Summary
The 3rd generation linear membrane coupled phased array device has been
successfully used to detect a wide range of defects within the flat plate, welded
test-pieces. However, the 3rd generation device design is not well suited to the
through weld inspection of small lack of side wall fusion defects and the creep wave
inspection of outer surface defects. The reliable detection of both of these types of
defect is essential in the target application component and this provided the
motivation for developing a twin crystal membrane coupled device. Rigid wedge
single element and array twin crystal transducers have been successfully deployed
within industry to detect this type of defect and the twin crystal membrane device is
based on these standard transducers.
The CIVA modelling platform has been used to assess the most appropriate array tilt
and roof angles to provide the required beam angles and beam crossing points. Based
on this modelling, a twin crystal membrane coupled phased array has been designed
with a fixed tilt angle of 13º and a variable roof angle. This design allows a single
transducer housing to be used during the device development phase and to detect both
defect types of interest. The initial focus for this development activity is to develop
an improved through weld inspection capability for small lack of sidewall fusion
defects.
A twin crystal membrane configuration using a roof angle of approximately 4º has
been produced and shown to be capable of successfully detecting defect 10 through
the weld within the flat plate welded test-pieces. The twin crystal membrane device
eliminates the internal noise signal that limits the performance of the linear membrane
coupled devices and provides an improved inspection capability. However, the
acquisition of scanned inspection data is essential to allow the full potential of this
inspection technology to be realised. Some further development work is also required
to investigate the ability of the twin crystal transducer to generate a creep wave and to
assess the performance of the device in the inspection of outer surface breaking
defects.

_____________________________________________________________________ 214
8. Conclusions The work presented in this thesis has reviewed a range of advanced ultrasonic NDE
inspection techniques, discussed developments of each of these techniques and
reviewed the framework for introducing these new technologies into the industrial
environment.
In the concluding chapter of this thesis a brief summary of the research performed and
the results obtained is provided. The main contributions of this work are then
reviewed and the impact of this work on NDE within Rolls-Royce is discussed.
Finally some suggested areas of future work are summarised.
8.1. Review of Thesis
In Chapter 1 I have outlined the structure of the EngD in NDE scheme. I have then
introduced the industrial environment in which I have performed the research
presented in this thesis and described the main motivations and objectives of this
research and development activity. I have also discussed the project environment
within Rolls-Royce and my role within this project. During the course of my EngD
studies I have also taken on a range of additional responsibilities within Rolls-Royce
beyond the scope of my studies. Although this work has not contributed to my
research project it has helped to provide a thorough education in NDE and a solid
foundation for a career in industry.
The basic principles and applications of conventional ultrasonic inspection are
introduced in Chapter 2. Different types of ultrasonic phased arrays are then
discussed and the benefits of this type of inspection such as improved speed and
versatility are reviewed. One of the main motivations for this research is to improve
the ultrasonic inspection of components with irregular surface geometry. Inspection
of this type of component causes a number of specific challenges which currently
limit the use of ultrasonic techniques on this type of component. This is a particular
issue within the nuclear industry and it is a problem that Rolls-Royce has addressed
by sponsoring this project. In many current inspections the component surface is
machined during manufacture, however, this is expensive and time-consuming; it can
lead to excessive wall thinning and can expose additional defects of concern. It is

Conclusions
_____________________________________________________________________ 215
therefore desirable to eliminate this machining process. Also in this chapter an array
from the CEA is reviewed and evaluated. The first generation membrane coupled
phased array device, developed by Dr Rob Long and Prof Peter Cawley at Imperial
College is then discussed. The membrane coupled phased array device is designed to
use FMC data acquisition techniques to measure the surface profile of the component
under test. This measurement is then used to update delay laws and improve the
performance of the inspection. Finally the basic design of the second generation
membrane device, which was the first device with significant input from me and
Rolls-Royce engineers, is introduced.
Chapter 3 discusses the early work performed to transfer the membrane coupled
device technology from academia to Rolls-Royce. In order to continue the
development of the membrane device approach and to make this research industrially
relevant to Rolls-Royce, a thick-walled stainless steel section of pipe-work containing
an austenitic weld was identified as a suitable target application. All further
improvement of the membrane device has then focused on the development of
techniques to thoroughly inspect this component. The first phase in this development
process was to design two flat plate, non-welded test-pieces. An inspection procedure
using the membrane coupled device with FMC data acquisition was then developed.
The performance of the 2nd generation membrane device was assessed by comparing
the inspection results obtained using the array and conventional rigid wedge
transducers. This study demonstrates that the membrane probe was capable of
providing complete inspection coverage from a limited number of scan positions. The
membrane device could be used to detect all defects within the test-pieces, whereas
the conventional techniques could only reliably detect four of the six defects.
Modelling is a key part of the inspection development and qualification process, it can
be used to provide valuable insight into the performance of an inspection technique
and aids the data interpretation process. Different modelling techniques have been
used to support the further development of the membrane device and FMC based
inspection. The basic modelling tools used in this research are introduced in
Chapter 4. The CIVA modelling platform has been extensively used throughout this
project to design and evaluate array configurations as well as to assist in inspection
development. The appropriateness of CIVA to each of these applications is assessed.

Conclusions
_____________________________________________________________________ 216
The early part of my doctorate focussed on the development of FE modelling
techniques for the inspection of large components with irregular geometry. The use
of FE models and particularly absorbing boundaries to improve the efficiency of these
models are then discussed. CIVA models and FE models were also generated for the
inspection of each of the six defects. This work demonstrated the accuracy of both
modelling approaches and provided an improved understanding of the detection
mechanism.
Although the 2nd generation membrane device was capable of detecting all of the six
defects within the flat plate, non-welded test-pieces there were some limitations to the
performance of the device. In particular a strong internal noise signal was observed in
some of the experimental results that corrupted the quality of the inspection. In
chapter 5 the origin of this noise signal is explained. The subsequent redesign of the
array configuration is then discussed and three 3rd generation designs are introduced.
Results obtained using each of these designs to inspect four of the defects within the
flat plate, non-welded test-pieces are then presented and the performance of each
design is evaluated. The 3rd generation device design also incorporates an integrated
irrigation system and testing to demonstrate the performance of the device is
unaffected by using this approach is provided.
Testing of the flat plate, non-welded test-pieces was very successful, however, the
inspection of these test-pieces is significantly simpler than the inspection of the actual
target application component. The target application component contains an
austenitic weld. Inspection through this weld is challenging due to the high noise
levels and anisotropic nature of the grain structure within the weld. Two flat plate,
welded test-pieces were designed and manufactured with, as far as possible, a fully
representative weld. Inspection of these flat plate test-pieces was then performed with
two different designs of the 3rd generation membrane coupled device. Two designs
were used to provide optimum coverage and to remove the effects of the internal
noise signal from the inspection image. Chapter 6 reviews the manufacture of these
test-pieces and the design of the inspection techniques used to detect the embedded
defects. The test-pieces contain seven different types of flaw; and two different sizes
of each defect are included. The smaller defects are approximately 4mm through-wall
which represents an extremely challenging defect to detect in a thick-walled stainless

Conclusions
_____________________________________________________________________ 217
steel structure. The larger defects are 8mm through-wall which, although less
challenging, is still smaller than the validation size of the current inspection
performed on this component. Results from the membrane device inspection testing
are then reviewed and the performance of each device is assessed using a variety of
inspection techniques. The experimental results demonstrate that complete inspection
coverage of the flat plate test-pieces without removal of the weld cap can be achieved
by using the conformable array transducer. Every defect is detected using at least one
of the inspection techniques used and many of the defects are observed with a number
of redundant beams. The inspection speed benefits associated with the use of the
membrane coupled device in comparison to conventional single element transducer
inspection are then reviewed. It is found that using existing controller technology and
a desk-top PC, the scanning time can be improved by over 60%.
The flat plate, welded test-pieces contain a small number of defects that proved very
difficult to detect using the 3rd generation linear membrane coupled device. The
through weld inspection of small lack of sidewall fusion defects is not possible using
the 3rd generation membrane device design due to the effects of the austenitic weld.
The proposed inspection of a number of outer surface defects is to use a direct creep
wave inspection technique. It was not possible to produce a reliable creep wave
inspection using the 3rd generation linear membrane coupled design. A twin crystal
membrane coupled phased array transducer has been designed and produced to
address these limitations. In chapter 7, the use of twin crystal transducers for through
weld and near surface defect detection is reviewed. The use of the CIVA modelling
platform to assist in the design of the twin crystal membrane device is then discussed.
The final design of the probe is then presented along with some preliminary results
from the through weld inspection of the lack of sidewall fusion defects.
8.2. Outline of Main Contributions
The main areas of novel work associated with my doctorate relate to the adaptation
and further development of academic research tools, and the application of these new
technologies within Rolls-Royce. Much of this development has been a collaborative
exercise with researchers at Imperial College. However, this project and my research
specifically represent a major departure from existing practice within Rolls-Royce;
transfer of this new capability into Rolls-Royce has been facilitated by my role as a

Conclusions
_____________________________________________________________________ 218
Research Engineer. The main contributions of this thesis are summarised in the
following section. The areas of this research work that are unique have been
presented at a range of national and international conferences and published in
proceedings, these publications are summarised below:
• Lead Author:
o Russell, J., Cawley, P., Drozdz, M., Lowe, M., Habgood, N. (2007)
Finite Element Modelling of Elastic Wave Propagation and Defect
Interaction in Large, Complex Components. In: Thompson, D.O. &
Chimenti, D.E. (eds.) Review of Progress in QNDE. American Institute
of Physics: Melville, New York, 27, pp. 99-106
o Russell, J., Long, R., Cawley, P., Habgood, N. (2008) Inspection of
Components with Irregular Surfaces Using a Conformable Ultrasonic
Phased Array. In: Thompson, D.O. & Chimenti, D.E. (eds.) Review of
Progress in QNDE, American Institute of Physics: Melville, New
York, 28, pp. 792-799
o Russell, J., Long, R., Cawley, P. (2009) Development of a membrane
coupled conformable phased array. In: Bièth, M. & Whittle, J. (eds.)
7th International Conference on NDE in Relation to Structural Integrity
for Nuclear and Pressurised Components. European Commission Joint
Research Centre, Netherlands, 6, In Press.
o Russell, J., Long, R., Cawley, P. (2009) Development of a membrane
coupled conformable phased array inspection capability. In:
Thompson, D.O. & Chimenti, D.E. (eds.) Review of Progress in
QNDE, American Institute of Physics: Melville, New York, 29, In
Press
• Co-Author:
o Long, R., Russell, J., Cawley, P., Habgood, N. (2007) Non-Destructive
Inspection of Components with Irregular Surfaces using a
Conformable Ultrasonic Phased Array. In: Bièth, M. & Whittle, J.
(eds.) 6th International Conference on NDE in Relation to Structural
Integrity for Nuclear and Pressurised Components. European
Commission Joint Research Centre, Netherlands, 6, pp 564-572.

Conclusions
_____________________________________________________________________ 219
o Long, R., Russell, J., Cawley, P., Habgood, N. (2008) Ultrasonic
Phased Array Inspection of Flaws on Weld Fusion Faces using Full
Matrix Capture. In: Thompson, D.O. & Chimenti, D.E. (eds.) Review
of Progress in QNDE, American Institute of Physics: Melville, New
York, 28, pp. 848-855.
o Long, R., Russell, J., Cawley, P. (2009) Ultrasonic phased array
inspection of welded pipes using waves mode-converted at the inner
surface of the pipe. In: Bièth, M. & Whittle, J. (eds.) 7th International
Conference on NDE in Relation to Structural Integrity for Nuclear and
Pressurised Components. European Commission Joint Research
Centre, Netherlands, 6, In Press
o Long, R., Russell, J., Cawley, P (2009) Ultrasonic phased array
through weld inspection using full matrix capture. In: Thompson, D.O.
& Chimenti, D.E. (eds.) Review of Progress in QNDE, American
Institute of Physics: Melville, New York , 29, In press.
8.2.1. Membrane Coupled Phased Array Device
A major part of my research work has been the further development of the membrane
coupled phased array device. This novel technology provides a range of inspection
benefits on components with irregular surface geometry and has not been successfully
implemented before. I was involved in the design of the 2nd generation device. I also
designed the flat plate, non-welded test-pieces that were used to evaluate the
performance of this device. I then performed most of the experimental testing
required to assess the performance of the 2nd generation device in the inspection of the
two flat plate, non-welded test-pieces. I performed a substantial amount of data
processing using the Imperial College FMC processing software. This work
illustrated the potential benefits associated with the membrane device technology but
also highlighted some of the limitations of the second generation design. I carried out
the necessary modelling and experimental testing to understand the origin of the
internal noise signals within the 2nd generation device and to remove this from the
inspection image in subsequent designs. This investigation led to the design of the 3rd
generation membrane devices.

Conclusions
_____________________________________________________________________ 220
I designed and purchased the 3rd generation membrane device probes. An initial
assessment of the performance of the three different 3rd generation designs was then
performed on the flat plate non-welded test-pieces. This testing demonstrated the
improved performance that could be achieved using the 3rd generation devices. I
designed and purchased two flat plate, welded test-pieces that contained a broad range
of planar defects representative of those that could occur with the actual target
application. A range of different inspection techniques based on the membrane
coupled device technology were identified which provided complete and thorough
inspection coverage of these welded test-pieces without the removal of the weld cap.
I then performed some experimental testing of these test-pieces myself and trained
others to use this inspection technology and lead the project to acquire the full range
of experimental data.
The 3rd generation membrane coupled phased array device provides dramatic
inspection improvements over conventional rigid wedge technology. When using a
rigid wedge probe the transducer cannot be scanned over the irregular geometry of the
weld cap, even with the weld cap removed the final surface profile is still irregular
which limits inspection coverage and compromises performance. The membrane
coupled phased array device provides complete inspection coverage with the weld cap
in place. The membrane coupled device is used with FMC data acquisition which
allows the surface profile of the component under test to be accurately measured.
Delay laws are then applied in post-processing to compensate for the irregular surface
profile and maintain inspection performance on components with an irregular surface.
The use of this novel approach to inspection is essential to realise all of the benefits
associated with the membrane coupled device technology.
The use of FMC also allows advanced algorithms to be used which cannot be
implemented by using conventional data acquisition and processing. This provides an
improved defect detection capability and future-proofs the inspection. The 3rd
generation membrane coupled device utilises a large footprint phased array, this
allows a large aperture to be used which provides excellent control over the beam
angle and focal length. Processing of the inspection data was performed using two
different approaches. Initial processing was performed using simple unfocused delay

Conclusions
_____________________________________________________________________ 221
laws, using this approach some of the defects could not be detected. Data processing
was also performed using optimised delay laws with larger apertures and a range of
different focal regimes. When using the optimised delay laws every defect within the
welded test-pieces was successfully detected. This demonstrates that the membrane
coupled device is highly effective and major improvements in defect detection that
can be achieved by using this device. The use of a large footprint array also reduces
the amount of mechanical scanning required so that inspection scanning time can be
significantly reduced. The overall time required to complete the inspection scanning
using the membrane coupled device is shown to be reduced by over 70% in
comparison to conventional rigid wedge single element transducers.
Although every defect with the two flat plate, welded test-pieces could be detected
using the 3rd generation membrane coupled device, some further inspection
performance improvements are possible. The results of my testing using the
membrane coupled device technology highlighted the specific inspections of concern.
I then researched the alternative inspection techniques that could be used to address
these limitations which led to the design of the twin crystal membrane coupled device.
The twin crystal membrane coupled device is my design and I worked with the Rolls-
Royce mechanical designers to generate suitable engineering drawings that have now
been used to manufacture the probe. Preliminary data acquisition and processing has
been performed using the twin crystal device to inspect the flat plate welded test-
pieces. The results obtained illustrate that the internal noise signal that effects linear
phased array devices has been removed leading to the improved through weld
inspection of lack of side wall fusion defects. Further work is required to fully
characterise the capabilities of the twin crystal array design and the collection of
scanned FMC data is essential to realise the full potential of this technology.
8.2.2. Inspection Modelling
Prior to the start of my EngD Rolls-Royce inspection engineers used a very limited
range of basic modelling tools. I introduced FE based inspection modelling
techniques and demonstrated the use of these techniques on industrial applications. I
also performed the initial study of using triangular elements and an automatically

Conclusions
_____________________________________________________________________ 222
generated mesh with ALID absorbing regions to rapidly and accurately model
complex geometries. I have also introduced many aspects of the CIVA modelling
platform to Rolls-Royce. I have worked with the NDE implementation engineers to
introduce the use of CIVA into their inspection planning, qualification and data
interpretation process.
8.2.3. FMC Based Phased Array Inspection
Phased array inspection techniques based on the acquisition of FMC data are very
promising. However, they have not yet found application in industry. Through my
research I have demonstrated the benefits associated with this type of inspection and
established a framework within Rolls-Royce to implement this on industrial
applications.
8.3. Future Work
8.3.1. Twin Crystal Membrane Device
The twin crystal membrane coupled device has been designed and manufactured, and
some preliminary testing with this device has been performed. The results from this
preliminary testing are very encouraging but further development is required. The
internal noise signal that corrupts the B-Scan inspection image obtained using linear
phased array transducers has been removed leading to improved defect detection. The
performance of the twin crystal transducer has also been shown to be marginally
better than the 3rd generation membrane coupled device for through weld inspection
of lack of side wall fusion defects. In order to fully exploit all of the potential
inspection improvements that can be achieved by using the twin crystal device the
acquisition of scanned FMC data is essential. A bespoke software suite is currently
under development within Rolls-Royce to address this requirement. When this is
available complete validation of the FMC post processing algorithms using the twin
crystal membrane coupled device will then be possible. An investigation of the
through weld inspection of lack of sidewall fusion defects and of the creep wave
detection of near surface defects will then be carried out.
Conclusions
_____________________________________________________________________ 223
8.3.2. Narrow Phased Array Membrane Device
In this work I have demonstrated that the current membrane coupled phased array
device can be used to improve the detection of defects. The use of FMC data also
allows a single data set to be processed in a variety of ways so that different
inspection techniques can be used to accurately characterise a given defect. However
the current approach does not provide any improvements in terms of the lateral sizing
of defects. I have already performed preliminary modelling work on a new narrow
phased array leading to a finalised design which has now been purchased. This array
uses the same element pitch as the third generation array but the elements are much
narrower. These elements produce a wide beam profile in the lateral dimension. By
using this device and the synthetic aperture focusing technique (SAFT) it may be
possible to improve lateral defect sizing. Further development of the FMC post-
processing software will be required to facilitate this additional processing step.
8.3.3. FMC Inspection
Phased array inspection using FMC data acquisition is very versatile and it has great
potential to radically improve automated array inspection techniques. However, it is
still relatively immature and considerable further effort is required before this
technique can be deployed within the nuclear industry. Many of these further
developments have been touched on previously in this work but will also be briefly
reviewed here. A recognised technique for the calibration of FMC data must be
established. In order to achieve this, techniques for gathering and storing FMC data
from an encoded scanning frame or manipulator are required. The quantity of data
collected during a FMC inspection of a large, complex component such as those
found in the nuclear industry is considerable. Techniques such as half matrix capture
(HMC), which uses the theory of reciprocity to reduce the amount of inspection data
to be collected and up-sampling of data must be investigated to minimise the data
transfer requirements. Rolls-Royce is addressing each of these requirements with a
view to commercialising phased array inspection using FMC in the near future.

Conclusions
_____________________________________________________________________ 224
8.3.4. Inspection Qualification and Implementation
The ultimate goal of this research work is to develop the advanced inspection tools to
a sufficiently high level that they can be deployed in industrial applications. This is a
complex process, particularly in the nuclear industry, however, a project plan has now
been developed to progress the modelling work, the membrane coupled device and
FMC inspection techniques to a sufficiently mature stage that they can go through
inspection qualification and ultimately be used on industrial plant. The use of the
membrane coupled device and FMC data acquisition represents a massive
improvement in ultrasonic inspection capability. Rolls-Royce intends to utilise the
potential benefits of this inspection capability to reduce the amount of radiographic
inspection that must be performed during the manufacture of the target application
component. The use of radiography leads to the requirement for large exclusion
zones, this increases the time associated with the manufacturing process and increases
cost. The membrane coupled device will allow ultrasonic inspection to be carried out
without the need for subsequent machining of the component. The application of
advanced delay laws to the FMC data acquired during the inspection will assist in
replicating the current inspection sensitivity to small defects that cannot typically be
detected using conventional ultrasonic inspection.

_____________________________________________________________________ 225
9. References
Achenbach, J.D., Gautesen, A., K. (1977) Geometrical theory of diffraction for three-
D elastodynamics, J. Acoust. Soc. Am. Volume 61, Issue 2, pp. 413-421.
AGR Field Operations, Technology Design, Winsford, Cheshire, UK.
www.technologydesign.co.uk.
Akhnak, M., Martinez, O., Ullate, L.G., Montero de Espinosa, F. (2002) 64 elements
two-dimensional piezoelectric array for 3D imaging, Ultrasonics, 40, 139-143.
Alleyne, D.N. (1991) The non-destructive testing of plates using ultrasonic lamb
waves. PhD thesis. University of London, Imperial College of Science Technology
and Medicine.
Auld, B.A., (1973a) Acoustic Fields and Waves in Solids - Volume 1 Chapters 4 and
8, Robert E. Krieger Publishing Company, Malabar FL.
Auld, B.A., (1973b) Acoustic Fields and Waves in Solids - Volume 2 Appendix 4,
Robert E. Krieger Publishing Company, Malabar FL.
Azar, L., Shi, Y., Wooh, S-C. (2000) Beam focussing behaviour of linear phased
arrays, NDT & E International, 33, pp.189-198.
Baby, S., Balasubramanian, T., Pardikar, R.J. (2003) Ultrasonic study for detection of
inner diameter cracking in pipeline girth welds using creeping waves. International
journal of Pressure Vessels and Piping. 80, 139-146.
BAE Systems (1986) Orbital TIG Welding of Type 304L Stainless Steel Pipe with
consumable Root Insert and wire Fill, PN 1217, DGS/GS/3003.
Bann, T. (2005) Presentation to the Stainless Steel Fabrication in the Nuclear
Industry, Testing and Inspection of Stainless Steel Components.

References
_____________________________________________________________________ 226
Berkhout, J. (1986) The seismic method in the search for oil and gas: Current
techniques and future developments, Proc. IEEE, 74, pp. 1133-1159.
Birks, A.S., Green Jr, R.E. (eds.) (1991) Ultrasonic Testing. ASNT Nondestructive
Testing Handbook, 7 Columbus, USA: American Society of Nondestructive Testing.
Bray, D.E., Tang, W. (2001) Subsurface stress evaluation in steel plates and bars
using the LCR ultrasonic wave. Nuclear Engineering and Design, 207, 231-240.
British Energy Group Plc, East Kilbride, UK, www.british-energy.com.
British Energy. (2002) GUIDE NT v1.13, Data Interpretation Guide Course Notes.
British Standards Institution (1998a) BS EN 1713:1998 Non-destructive testing of
welds - Ultrasonic testing - Characterization of indications in weld. London: BSI.
British Standards Institution (1998b) BS EN 1714:1998, Non-destructive testing of
welds - Ultrasonic testing of welded joints, London: BSI.
British Standards Institution (2001) BS EN 583-2:2001 Non-destructive testing —
Ultrasonic examination — Part 2: Sensitivity and range setting standard. London:
BSI.
British Standards Institution (2004a) BS EN 583-4:2002 Non-destructive testing —
Ultrasonic examination — Part 4: Examination for Discontinuities perpendicular to
the surface standard. London: BSI.
British Standards Institution (2004b) BS EN 14127:2004, Non-destructive testing.
Ultrasonic thickness measurement, London: BSI.
British Standards Institution (2008) BS EN 583-5:2001 Non-destructive testing –
Ultrasonic examination - Part 5: Characterization and sizing of discontinuities,
London: BSI.
References
_____________________________________________________________________ 227
Calmon, P., Lhémery, A., Lecoeur-Tabi, I., Raillon, R., Paradis, L. (1998) Models for
the computation of ultrasonic fields and their interaction with defects in realistic NDT
configurations, Nuclear Engineering and Design, 180, pp. 271-283.
Calmon P., Leberre S., Sollier S., Benoist P. (2004) CIVA, an integration software
platform for the simulation and processing of NDT data, Proceedings 16th World
Conference on NDT.
Casula, O., Poidevin, C., Cattiaux, G., Dumas, Ph., (2006) Control of Complex
components with smart flexible phased arrays, Ultrasonics, 44, pp. 647-651.
CEA List, Saclay, France, www-list.cea.fr.
CEDRAT Group, Meylan, France, http://www.cedrat.com.
Chapman R.K. (1984) Ultrasonic scattering from smooth flat cracks: an
elastodynamic Kirchhoff diffraction theory (main report), CEGB Report
NWR/SSD/84/0059/R.
Chapman, R.,K. (1990) A system model for the ultrasonic inspection of smooth planar
cracks. Journal of Nondestructive testing, Vol . 9, No. 2/3, 197-210.
Chatillon, S., Cattiaux, G., Serre, M., Roy, O. (2000) Ultrasonic non-destructive
testing of pieces of complex geometry with a flexible phased array transducer.
Ultrasonics, 38, 131-134.
Cheeke, J.D.N, (2002) Fundamentals and Applications of Ultrasonic Waves, CRC
Press LLC.
Cinquin, M., Le Ber, L., Lonné, S., Mahaut, S. (2006) Results of 2006 UT modelling
benchmark obtained with CIVA at CEA: beam modelling and flaw signal prediction.
Thompson, D.O. & Chimenti, D.E. (eds.) Review of Progress in QNDE, American
Institute of Physics, Melville, NY, 26, pp.1870-1877.

References
_____________________________________________________________________ 228
Connolly, G.D. (2009) Modelling of elastic wave propagation in generally
anisotropic media and austenitic steel welds. PhD Thesis. University of London,
Imperial College of Science Technology and Medicine.
Cui, Y., Lundin, C.D. (2007) Austenite-preferential corrosion attack in 316 austenitic
stainless steel weld metals. Materials & Design 28, (1), 324-328.
Darmon, M., Calmon, P., Bele, B. (2003) Modelling of the ultrasonic response of
inclusions in steel. In: Thompson, D.O. & Chimenti, D.E. (eds.) Review of Progress
in QNDE, American Institute of Physics: Melville, New York, 23, pp 101-108.
Delaide, M., Dumas, Ph. (2005) Application of Piezocomposite Twin, Side by Side,
Phased Array UT Probes for the Inspection of Stainless Steel, In: Thompson, D.O. &
Chimenti, D.E. (eds.) Review of Progress in QNDE, American Institute of Physics:
Melville, New York, 25, pp. 930-937.
Deschamps G.A. (1972) Ray techniques in electromagnetics, Proceedings of the
I.E.E.E. Vol 60, pg 1022.
Dombret, Ph. (1991) Methodology for the ultrasonic testing of austenitic stainless
steel, Nuclear Engineering and Design, 131, (3), 279-284.
Drinkwater, B.W., Wilcox, P.D. (2006) Ultrasonic Arrays for Non-Destructive
Evaluation: A Review, NDT&E International, 39, 525-541.
Drozdz, M., Moreau, L., Castaings, M., Lowe, M.J.S., Cawley, P. (2005) Efficient
numerical modelling of absorbing regions for boundaries of guided wave problems.
In: Thompson, D.O. & Chimenti, D.E. (eds.) Review of Progress in QNDE. American
Institute of Physics: Melville, New York, 25, pp.126-133.
Drozdz, M. (2006) Efficient numerical modelling of ultrasound reflection from cracks
and corrosion. Transfer report. University of London, Imperial College of Science
Technology and Medicine.

References
_____________________________________________________________________ 229
Drozdz, M., Skelton, E., Craster, R.V., Lowe, M.J.S. (2007) Modelling bulk and
guided waves in unbounded elastic media using absorbing layers in commercial FE
packages. In: Thompson, D.O.& Chimenti, D.E. (eds.) Review of Progress in QNDE.
American Institute of Physics: Melville, New York, 26, pp. 87-94.
Drury, J.C. (1983) Ultrasonic Flaw Detection for Technicians, Salesbury Press Ltd,
UK.
Drury, J.C. (2005) Ultrasonics, part 3: refraction and mode conversion, Insight, 47(1),
44-46.
Dupond, O., Chassignole, B., Doudet, L. (2006) Welding Process Effect on Ultrasonic
Testing Austenitic Stainless Steel Welds, In: Bièth, M. & Whittle, J. (eds.) 5th
International conference on NDE in relation to structural integrity of Nuclear and
Pressurised components, European Commission Joint Research Centre, Netherlands,
5, pp 1041-1050.
Duxbury, D., (2009) A calibration routine for Full Matrix Capture (FMC),
RRMP34160.
Edelmann, X. (1981) Application of ultrasonic testing techniques on austenitic welds
for fabrications and in-service inspection, NDT International, 14, (3), 125-133.
EPRI (2004) Evaluation of Flexible Arrays for Ultrasonic Examination of Piping
Welds with Uneven Surfaces: Interim Report, 1009643.
Ermolov, I.N. (2004) Progress in the theory of ultrasonic flaw detection problems and
prospects. Russian Journal of Nondestructive Testing, 40, (10), 655-678.
Ford, J., Hudgell, R.J. (1987) A final report on the performance achieved by non-
destructive testing of defective butt welds in 55mm thick type 316 stainless steel,
NDT Development & Applications Department, Risley Nuclear Power Development
Laboratories.

References
_____________________________________________________________________ 230
Gengembre N., Lhémery A. (2000) Pencil method in elastodynamics: application to
ultrasonic field computation, Ultrasonics, 38, pp. 495-499.
Gubernatis J.E., Domany, E., (1977) The Born approximation in the theory of the
scattering of elastic waves by flaws, J. Appl. Phys. Vol 48, Issue 7, pp. 2812-2819.
Halkjær, S., Sørensen, M.P., and Kristensen, W.D. (2000) The propagation of
ultrasound in an austenitic weld, Ultrasonics, Vol 38, pp. 256-261.
Harker, A.H., Ogilvy, J.A., Temple, J.A.G. (1990) Modelling Ultrasonic Inspection of
Austenitic Welds. Journal of NDE, 9 (2/3), 155-165.
Harvey, G., Gachagan, A., Mackersie, J.W., McCunnie, T., Banks, R. (2009) Flexible
Ultrasonic Transducers Incorporating Piezoelectric Fibres, IEEE Trans. Ultrason.
Ferroelec. Freq. Contr., 56, pp. 1999-2009.
Henneke II, E., Chimenti, D., Papadakis, E. (eds.) (1991) Fundamental Principles of
Ultrasonic Wave Propagation Nondestructive Testing Handbook, 7 Columbus, USA:
American Society of Nondestructive Testing.
Holmes, C., Drinkwater, B., Wilcox, P. (2005) Post-processing of the full matrix of
ultrasonic transmit–receive array data for non-destructive evaluation. NDT & E
International, 38, 701-711.
Hudgell, R.J., Worral, G.M., Ford, J., Gray, B.S. (1989) Ultrasonic characterisation
and inspection of austenitic welds, Int. J. Pressure Vessels & Piping, Vol 39, pp 247-
263.
Hunter, A.J., Drinkwater, B.W., Wilcox, P.D. (2009) Ultrasonic Imaging using a
Flexible Array: Improvements to the Maximum Contrast Autofocus Algorithm. In:
Thompson, D.O.& Chimenti, D.E. (eds.) Review of Progress in QNDE, American
Institute of Physics: Melville, New York, 29, In press.

References
_____________________________________________________________________ 231
Imasonic, Besançon, France. www.imasonic.com.
JRC Petten (1999) EUR 19071 EN, ENIQ Recommended Practice 6: The use of
modelling in inspection qualification. ENIQ Report No. 15.
JRC Petten (2007) EUR 22906 EN, European Methodology for Qualification of Non-
Destructive Testing, ENIQ Report No. 31.
Kapranos, P.A. and Whittaker, V.N., “Ultrasonic inspection of fatigue cracks in
austenitic 316 and 347 weldments,” Brit. J. NDT 24(3): 129-134 (1982).
Keller, J.B. (1957) Diffraction by an Aperture, J. Appl. Phys., 28, 426.
Kirchoff, G.R. (1891) Vorlesung uber Mathematische Physik vol II (Leipzig: Tueber).
Kishore, N.N., Sridhar I., Iyengar N.G.R. (2000) Finite element modelling of the
scattering of ultrasonic waves by isolated flaws. NDT&E International, 33, 297-305.
Krautkramer, J., Krautkramer, H. (1983) Ultrasonic Testing of Materials, 3rd Edition.
London, Springer-Verlag.
Langenberg, K.J., Fellinger, P., Marklein, R. (1990) On the Nature of the So-called
Subsurface Longitudinal wave and/or the surface Longitudinal “Creeping” Wave.
Research in Nondestructive Evaluation, 2, 59-81.
Lemaitre, P., Koble, T. D., Doctor, S., (1996), Summary of the PISC round robin
results on wrought and cast austenitic steel weldments, part II: wrought-to-cast
capability study, Int. J. Pres. Ves. & Piping, 69, pp. 21-32.
Liu, G.R. & Quek Jerry, S.S. (2003) A non-reflecting boundary for analysing wave
propagation using the finite element method. Finite Elements in Analysis and Design,
39, 403-417.

References
_____________________________________________________________________ 232
Long, R., Cawley, P. (2006) Phased Array Inspection of Irregular Surfaces In:
Thompson, D.O. & Chimenti, D.E. (eds.) Review of Progress in QNDE. American
Institute of Physics: Melville, New York, 26, pp. 814-821.
Long, R., Cawley, P., (2007a) Further Development of a Conformable Phased Array
Device for the Inspection of Irregular Surfaces. In: Thompson, D.O. & Chimenti, D.E.
(eds.) Review of Progress in QNDE. American Institute of Physics: Melville, New
York, 27, pp. 754-761.
Long, R., Russell, J., Cawley, P., Habgood, N. (2007b) Non-Destructive Inspection of
Components with Irregular Surfaces using a Conformable Ultrasonic Phased Array.
In: Bièth, M. & Whittle, J. (eds.) 6th International Conference on NDE in Relation to
Structural Integrity for Nuclear and Pressurised Components. European Commission
Joint Research Centre, Netherlands, 6, pp 564-572.
Long, R., Drozdz, M., Lowe, M., Cawley, P., Wilcox, P., Drinkwater, B., Thomas, R.,
Gaghagan, A., Mackersie, J., (2007c) Improved Inspection of Reactor Components
Using Ultrasonic Arrays, ICRR AR 04-2007.
Long, R., Russell, J., Cawley, P., Habgood, N. (2008) Ultrasonic Phased Array
Inspection of Flaws on Weld Fusion Faces using Full Matrix Capture. In: Thompson,
D.O. & Chimenti, D.E. (eds.) Review of Progress in QNDE, American Institute of
Physics: Melville, New York, 28, pp. 848-855.
Long, R., Russell, J., Cawley, P (2009) Ultrasonic phased array through weld
inspection using full matrix capture. In: Thompson, D.O. & Chimenti, D.E. (eds.)
Review of Progress in QNDE, American Institute of Physics: Melville, New York, 29,
In press.
Lonné S. de Roumilly, L., Le Ber, L., Mahaut, S., Cattiaux, G. (2006) Experimental
validation of CIVA ultrasonic simulations. In: Bièth, M. & Whittle, J. (eds.) 5th
International conference on NDE in relation to structural integrity of Nuclear and
Pressurised components, European Commission Joint Research Centre, Netherlands,
5, pp 356-363.

References
_____________________________________________________________________ 233
Lowe, M.J.S., (1992) Plate Waves for the NDT of Diffusion Bonded Titanium, PhD
thesis, Mechanical Engineering Department, Imperial College of Science, Technology
and Medicine.
Lowe, M.J.S., Hansen, U. (2008) Finite Element Analysis Short course for EngD
Research Engineers.
Mitsui Babcock, (2005) Replacement of Radiography by Ultrasonic Inspection,
Health and Safety Executive Research Report, 301.
Maes, G., Richard, D. (2008) On the Use of Advanced UT Phased Array
Methodology and Equipment, Proceedings 17th World Conference on NDT.
Mahaut, S., Godefroit, J-L., Roy, O., Cattiaux, G. (2004) Application of phased array
techniques to coarse grain components inspection, Ultrasonics, 42, 791-796.
Martinez, O., Akhnak, M., Ullate, L.G., de Espinosa, F.M. (2003) A small 2D
ultrasonic array for NDT applications, NDT&E International, 36, pp. 57-63.
Mondal, S., Wilcox, P.D., Drinkwater, B.W. (2005) Design of two-dimensional
ultrasonic phased array transducers, ASME-J Pressure Vessel Technology, 127, pp.
336-344.
Norton, S.J. (1992) Annular array imaging with full-aperture resolution, J Acoust Soc
Am, 92, pp. 3202-3206.
Ogilvy, J.A., (1991) Theory of wave scattering from random rough surfaces, IoP
Publishing, UK.
Pavlakovic, B.N. (1998) Leaky Guided Ultrasonic waves for NDT. PhD thesis.
University of London, Imperial College of Science Technology and Medicine
Peak NDT, Derby, UK, www.peakndt.com.

References
_____________________________________________________________________ 234
Pialucha, T. P. (1992) The reflection coefficient from interface layers in NDT of
adhesive joints, PhD thesis Mechanical Engineering Department, Imperial College
London
Precision Acoustics Ltd. (n.d.) AptFlex F28. [Online] Available from: http://www.acoustics.co.uk/products/aptflex-f28 [Accessed on 20/11/09].
Rajagopal, P., Drozdz, M., Lowe, M.J.S. (2008), Towards Improved Finite Element
Modeling of the Interaction of Elastic Waves with Complex Defect Geometries, In:
Review of Progress in Quantitative NDE, D.O.Thompson and D.E. Chimenti (eds.),
American Institute of Physics: Melville, New York, 28, pp. 49-56.
RD Tech (2004) Introduction to Phased Array Ultrasonic Technology Applications.
Canada, Olympus NDT.
Rolls-Royce (2001a) Confidential Document.
Rolls-Royce (2001b) Confidential Document.
Rolls-Royce (2002a) Confidential Document.
Rolls-Royce (2002b) Confidential Document.
Rolls Royce (2006a) Conformable Phased Array Evaluation Block 1. Rolls Royce
Drawing number: 55053/DT/064685.
Rolls Royce (2006b) Conformable Phased Array Evaluation Block 2 Rolls Royce.
Drawing number: 55053/DT/064689.
Rolls-Royce (2006c) Confidential Document.
Rolls Royce (2008a) Conformable Phased Array Welded Evaluation Block 1. Rolls
Royce Drawing number: SUB3000032.

References
_____________________________________________________________________ 235
Rolls Royce (2008b) Conformable Phased Array Welded Evaluation Block 2. Rolls
Royce Drawing number: SUB3000033.
Rolls-Royce (2009) Confidential Document.
Roy, O., Mahaut, S. & Casula, O. (2002) Control of the ultrasonic beam transmitted
through an irregular profile using a smart flexible transducer: modelling and
application. Ultrasonics, 40, 243-246.
Russell, J.D. (2006a) Engineering doctorate in non-destructive evaluation 6 month
report.
Russell, J.D. (2006b) Engineering doctorate in non-destructive evaluation 12 month
report.
Russell, J.D (2007a) Engineering doctorate in non-destructive evaluation 18 month
report.
Russell, J.D. (2007b) Engineering doctorate in non-destructive evaluation 24 month
report.
Russell, J.D. (2007c) Conformable Phased Array Target Application Non-Welded
Test-piece Design Basis Document.
Russell, J., Cawley, P., Drozdz, M., Lowe, M., Habgood, N. (2007) Finite Element
Modelling of Elastic Wave Propagation and Defect Interaction in Large, Complex
Components. In: Thompson, D.O. & Chimenti, D.E. (eds.) Review of Progress in
QNDE. American Institute of Physics: Melville, New York, 27, pp. 99-106.
Russell, J.D. (2008a) Engineering doctorate in non-destructive evaluation 30 month
report.

References
_____________________________________________________________________ 236
Russell, J.D. (2008b) Engineering doctorate in non-destructive evaluation 36 month
report.
Russell, J., Long, R., Cawley, P., Habgood, N. (2008) Inspection of Components with
Irregular Surfaces Using a Conformable Ultrasonic Phased Array. In: Thompson,
D.O. & Chimenti, D.E. (eds.) Review of Progress in QNDE, American Institute of
Physics: Melville, New York, 28, pp. 792-799.
Russell, J., Habgood, N. (2008) Advanced Array NPCT Project Plan.
Schmerr Jr, L.W. (1998) Fundamentals of Ultrasonic Non-Destructiev Evaluation – A
Modelling Approach, Plenum Press, New York
Schmid. (1997) Ultrasonic testing of austenitic and dissimilar metal welds. [Online]
Available from: http://www.ndt.net/article/pow1297/schmid/schmid1.htm [Accessed
20/11/09].
Schmitz, V., Langenberg, K.J., Kappes, W., Kroning, M., (1995) Inspection procedure
assessment using modelling capabilities, Nuclear Engineering and Design, 157, pp.
245-255.
Serco Technical Assurance Services, Risley, UK, http://www.serco.com/.
Shipp, R., Schneider, C., Bird, C., Nageswaran, C. (2008) Handbook for Qualification
of Ultrasonic Phased Array Inspection. TWI Report 17575/1/08.
Shung, K.K., (2002) Technical Note: The Principle of Multidimensional Arrays, Eur J
Echocardiography, 3, pp. 149-153.
Silk, M. (1980) Ultrasonic Techniques for Inspecting Austenitic Welds. Research
Techniques in NDT 4 (11), 393-449.
Simulia. (2006) ABAQUS v6.6 Analyis User’s Manual. [Online] Available from:
http://www.simulia.com/support/documentation.html [Accessed 20/11/09].

References
_____________________________________________________________________ 237
Sonaspection International, Lancaster, UK, http://www.sonaspection.com/index.html.
Spectrum, [Online] Imperial College, London. Available from
http://www3.imperial.ac.uk/nde/products%20and%20services/spectrum [Accessed
10/05/10].
Swanson Analysis. (1992) ANSYS user’s manual for revision 5.0. Houston, TX:
Swanson Analysis Systems.
Toft, M.W., (1987) Experimental Studies of ultrasonic reflection from various type of
misorientated defect, CEGB report number: OED/STN/87/20060/R,
PWR/MWG/NDT/P(86)39.
Velichko, A., Wilcox, P.D. (2009) Modeling Elastodynamic Scattering Using Finite
Elements In: Thompson, D.O. & Chimenti, D.E. (eds.) Review of Progress in QNDE,
American Institute of Physics: Melville, New York, 29, In Press.
Wilcox, P.D., Holmes, C., Drinkwater, B.W., (2007) Advanced Reflector
Characterisation with Ultrasonic Phased Arrays in NDE Applications, IEEE Trans.
Ultrason. Ferroelec. Freq. Contr., 54, pp. 1541-1550.
Wooh, S-C., Shi, Y. (1999) Optimum Beam Steering of Linear Phased Arrays. Wave
Motion, 29, 245-265.
Ying C.F., Truell R. (1956). Scattering of a plane longitudinal wave by a spherical
obstacle in an isotropically elastic solid, J. Appl Phys. 27, pp. 1086-1097.
Zetec Inc, Snoqualmie, WA, USA: www.zetec.com.