thf4 mtchanism dial13tes insipidus · mechanism of polyuria of diabetes insipidus in man point in...
TRANSCRIPT

THf4 MtCHANISM OF POLVURIA OF DIAl13tES INSIPIDUS INMAN. THE EFFECT OF OSMOTICLOADING
BY WILLIAM A. BRODSKYX ANDS. RAPOPORT
(From the Children's Hospital Research Foundation and the Department of Pediatrics, Uni-versity of Cincinnati College of Medicine, Cincinnati)
(Submitted for publication July 1, 1950; accepted, December 21, 1950)
INTRODUCTION
Although there is general agreement on the roleof the hypothalamic-hypophyseal region in thegenesis of diabetes insipidus (1), the nature ofthe renal defect which results in the excretion ofa copious and dilute urine has remained obscure.The excretion of a hypotonic urine in diabetes in-sipidus may be explained by any of three hy-potheses: (a) the delivery of a hypotonic fluidfrom the proximal tubule, or (b) an isotonic proxi-mal urine with solute reabsorption in the distaltubule, and (c) an isotonic proximal urine withwater secretion in the distal tubule.
A complete decision with regard to these hy-potheses is not at hand. Hypothesis (a), assum-ing a hypotonic proximal fluid (2), although pre-sumably based on the observations of Walker andhis associates (3) would require a much greaterhypotonicity than ever observed in order to ex-plain the low urinary osmolarity of diabetes in-sipidus. Hypothesis (b) (4), most widely ac-cepted at present, holds that the polyuria is dueto lack of water reabsorption in the distal renaltubule. Normally 7/8 of the glomerular filtrate isreabsorbed isotonically in the proximal tubule,while %, under the hormonal control of the hy-pothalamic-hypophyseal region, may be reabsorbedin the distal tubule. Lack of hormone results ina maximum diuresis of about Y8 of the glomerularfiltration rate. This hypothesis, in order to ex-plain the dilute urine of diabetes insipidus, re-quires the assumption of solute reabsorption in thedistal tubule, with a distal reabsorbate of un-specified but hypertonic osmolarity. Hypothesis(c), popular before the general acceptance of theglomerular filtration theory, has for its major ob-jection the demonstrated proportionality betweenurine flow and arterial pressure in the isolatedkidney (5).
1Present address: University of Louisville, School ofMedicine, Department of Pediatrics, Louisville, Ky.
It appeared that osmotic diuresis in patientswith diabetes insipidus might offer a means oftesting the three hypotheses. Given an unchangedglomerular filtration rate, and assuming withShannon (2) that the urine formed in diabetesinsipidus resembles that which is delivered to thedistal tubule, no significant change in urinary os-molarity should occur after loading. The predic-tions of hypothesis (b) depend on the nature ofthe distal reabsorptive process assumed. Hypothe-sis (c) would require that, given a constant rateof secretion of hypotonic urine prior to loading,the increment of urine flow during osmotic diuresis,representing additional proximal fluid, be nearlyisotonic with plasma.
Osmotic diuresis with mannitol loading wasproduced in three subjects with diabetes insipidus.The rates of urine flow and solute excretion be-fore and during loading as well as those of glo-merular filtration and renal plasma flow werestudied.
EXPERIMENTAL
The subjects of the present study were one woman,19 years, and two boys, six and 12 years of age, withdiabetes insipidus. They had abstained from food anddrink for four to eight hours, and from pitressin medi-cation for two to three days preceding the test.
Mannitol, in 25% solution, was administered as theloading solute. Two priming injections, the first of 180and the second of 90 milliosmoles (mOsm.) per 1.73 M',calculated to add 20 and 10 mOsm., respectively, perliter of distribution volume, were given, followed by amaintenance infusion in the amount of %lo of the primingdose per minute. All infusion fluids had sufficient para-aminohippurate (PAH) added to maintain a plasma levelof about 3 mgm./100 cc., for the measurement of renalplasma flow. After a 20 minute period of equilibrationfollowing the priming infusion, urine was collected fortwo or three periods of 15-20 minutes each at both load-ing levels and blood samples were drawn at appropriateintervals. The urine and blood were analysed for man-nitol, urea, sodium, potassium, chloride, and PAH. Os-motic activity was determined directly by the freezing
282
MECHANISMOF POLYURIA OF DIABETES INSIPIDUS IN MAN
point in urine, and calculated from the determinedsolutes in blood. The analytical techniques used have beendescribed (6).
Toward the end of the test periods, the patients be-came weak and listless and the skin felt cold to touch.One patient, D. S., complained of headache, and anothervomited repeatedly when he drank water after the test.
The tests were repeated on two of the patients, D. E.and I. W., after an interval of three to four weeks, whilethey were receiving pitressin. Five-tenths cc. of an
aqueous solution of pitressin (10 pressor units) was givenintramuscularly every three hours for 20 hours preceding,and every two hours during the test. On pitressin, thepatients were able to withstand 16 hours of water depriva-tion, and experienced no untoward symptoms during theloading procedure.
20smotic Activity of Plasma = [2(Na + K) -8 +Urea + Mannitol] X y, where y, the activity coefficient ofplasma, was assumed to be 0.92.
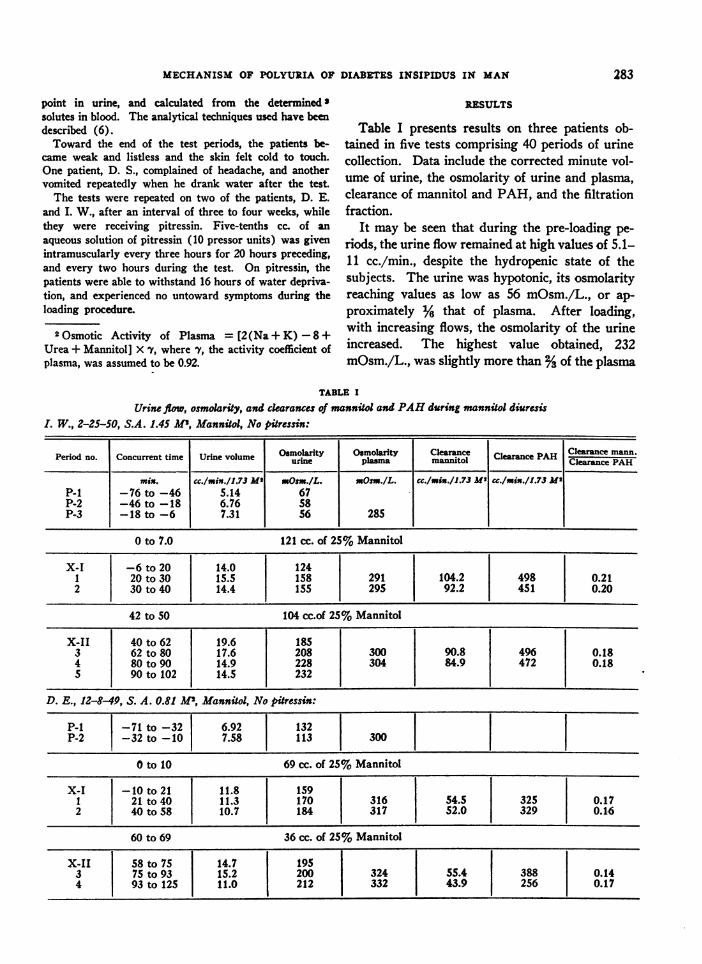
RESULTS
Table I presents results on three patients ob-tained in five tests comprising 40 periods of urinecollection. Data include the corrected minute vol-ume of urine, the osmolarity of urine and plasma,clearance of mannitol and PAH, and the filtrationfraction.
It may be seen that during the pre-loading pe-
riods, the urine flow remained at high values of 5.1-11 cc./min., despite the hydropenic state of thesubjects. The urine was hypotonic, its osmolarityreaching values as low as 56 mOsm./L., or ap-
proximately % that of plasma. After loading,with increasing flows, the osmolarity of the urineincreased. The highest value obtained, 232mOsm./L., was slightly more than %of the plasma
TABLE I
Urine flow, osmolarity, and clearances of mannitol and PAHduring mannitol diuresisL W., 2-25-50, S.A. 1.45 Al, Mannitol, No pitressin:
Period no. Concurrent time Urine volume Osmolarity Osmolarity Clearance Clearance PAH Clearance mann.us-ine plasma mannitol Clearace PAH
min. cc./min./1.73 M2' Osm./L. =Osm./L. CC./msn./1.73 MI c./mix./1.73 MeP-1 -76 to -46 5.14 67P-2 -46 to -18 6.76 58P-3 -18 to -6 7.31 56 285
0 to 7.0 121 cc. of 25% Mannitol
X-I -6 to 20 14.0 1241 20 to 30 15.5 158 291 104.2 498 0.212 30 to 40 14.4 155 295 92.2 451 0.20
42 to 50 104 cc.of 25% Mannitol
X-II 40 to 62 19.6 1853 62 to 80 17.6 208 300 90.8 496 0.184 80 to 90 14.9 228 304 84.9 472 0.185 90 to 102 14.5 232
D. E., 12-8-9, S. A. 0.81 1 ', Mannitol, No pitressin:
p-I -71 to -32 6.92 132P-2 -32 to -10 7.58 113 300
O to 10 69 cc. of 25% Mannitol
X-I -10 to 21 11.8 1591 21 to 40 11.3 170 316 54.5 325 0.172 40 to 58 10.7 184 317 52.0 329 0.16
60 to 69 36 cc. of 25% Mannitol
X-II 58 to 75 14.7 195 1 -l l3 75 to 93 15.2 200 324 I 55.4 388 0.144 93 to 125 11.0 212 332 43.9 256 0.17
283

WILLIAM A. BRODSKYAND S. RAPOPORT
TABLE I-ConinuedD. S., 2-6-50, S. A. 0.83 M2, Mannitol, No pitressin:
Period no. Concurrent time Urine volume uOmolarity Osmlar Clearance|mntce PAH Clearance PAH
msn. cc./min./1.73 M2 mOsm./L. mOsm.IL. cc./min./1.73 Ms cc./min./1.73 M'P-1 -69 to -37 10.7 56
0 to 10 71 cc. of 25% Mannitol I.V.
X-I -37 to 16 13.1 791 16 to 26 27.9 1302 26 to 37 18.8 135
39 to 49 37 cc. of 25% Mannitol
X-II 37 to 50 19.8 1473 50 to 59 21.0 146
D. E., 1-11-50, S.A. 0.82 M2, Mannitol, Pitressin:
P-i -94 to -46 1.15 777P-2 -46 to -12 1.52 747 263
0 to 7.4 61 cc. of 25% Mannitol
X-I -12 to 35 5.91 5831 35 to 60 6.50 605 269 145.5 597 0.242 60 to 78 6.18 602 271 135.2 554 0.24
79 to 84 40 cc. of 25% Mannitol
X-II 78 to 102 8.29 5513 102 to 130 8.31 538 277 118.5 513 0.234 130 to 157 8.84 511 277 132.8 469 0.28
I. W., 3-25-50, S.A. 1.45 M2, Mannitol, Pitressin:
P-i -73 to -40 0.43 605P-2 -40 to -3 0.76 677 303
0 to 11 121 cc. of 25% Mannitol
X-I -3 to 25 3.50 606 |.1 25 to 35 3.62 606 307 95.6 565 0.17
2 35 to 54 1 4.15 611 1 307 107 606 0.18
58 to 69 104 cc. of 25% Mannitol
X-II 54 to 79 4.83 6243 79 to 89 5.33 608 3i4 95.5 405 0.244 89 to 99 6.45 605 318 104 510 0.20
osmolarity. Urine flows increased two- to three- formed on patients D. E. and I. W. while theyfold over the preliminary rates to values of 15-28 were under the influence of pitressin. During thecc./min. These effects are the reverse of those pre-loading periods, the urine flow varied betweenobserved in normal hydropenic subjects during 0.43 to 1.15 cc./min." After loading, with flowssolute loading, where with increasing flows uri- attaining values as high as 8.8 cc./min., urinarynary osmolarity decreased but remained greater - h . .
- s~~~~~~~~~~~The high preliminary flows observed in patient D. E.than that of plasma (6). perhaps may be explained by a mild electrolyturetic ac-
The last two tests shown in the table were per- tion of the pitressin.
284
MECHANISMOF POLYURIA OF DIABETES INSIPIDUS IN MAN
osmolarity decreased to a value of 511 mOsm./L.The results were essentially the same as those ob-served in normal hydropenic subjects after man-nitol loading (6).
The clearances of mannitol and PAHwere lowin patient D. E., a 12 year old dwarfed boy. Whenthe test was repeated with the patient on pitressin,the clearance of mannitol increased three-fold andthat of PAH, two-fold, with an increase in thefiltration fraction. Decreases in filtration rate havebeen observed in dogs with diabetes insipidus (7).In the case of patient I. W., the clearances of bothmannitol and PAH were normal and did notchange significantly after pitressin administration.
It is evident that in each patient, the clearancevalues remained unchanged during the tests. Al-though no clearances were determined in the pre-liminary periods, one may assume that theychanged little with loading both from the constancyof the clearances at different levels of loading and
of
2
IsU
0U-wz2x
from data in the literature on normal subjects anddogs (8).
The independence of urine flow from changesof filtration rate or renal plasma flow is evidentfrom the data shown in the table.
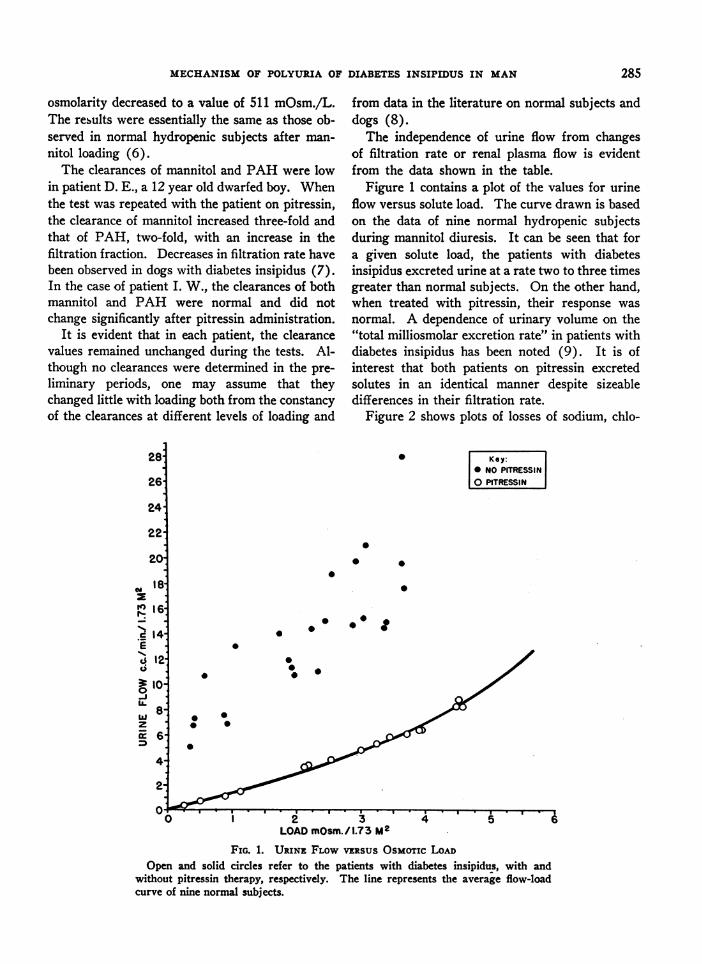
Figure 1 contains a plot of the values for urineflow versus solute load. The curve drawn is basedon the data of nine normal hydropenic subjectsduring mannitol diuresis. It can be seen that fora given solute load, the patients with diabetesinsipidus excreted urine at a rate two to three timesgreater than normal subjects. On the other hand,when treated with pitressin, their response wasnormal. A dependence of urinary volume on the"total milliosmolar excretion rate" in patients withdiabetes insipidus has been noted (9). It is ofinterest that both patients on pitressin excretedsolutes in an identical manner despite sizeabledifferences in their filtration rate.
Figure 2 shows plots of losses of sodium, chlo-
Key:* NO PITRESSIN
PITRESSINj
0
00
0
000
.0~
0
0
0
LOADmOsm./ 1.73 M2
FIG. 1. URINE FLOWVERSUSOsMoTIc LOADOpen and solid circles refer to the patients with diabetes insipidus, with and
without pitressin therapy, respectively. The line represents the average flow-loadcurve of nine normal subjects.
285

WILLIAM A. BRODSKYAND S. RAPOPORT
K
00
toP o 0
* NO PITRESSIN0 PITRESSIN
I
, l- LOi 2 3 i n
4
oLOAD-mosmJmWnJ1.73Mt5
Ci
0
0
0 0 0.700
0X&0.60.
6'01%
1* 8~~
hi 0o5oI
*~~~~~~~40 '~~~~s0.40-
a0I0.20
0
0.0-
No0
0
/0
00
0
12 3 4 S 6 0162 3 4 5 6LOAD mOsm./minA7 3 M2 LOADmOsm./min/173 MI
FIG. 2. POTASSIUM, CHLORIDE AND SODIUM LOSSES vERsus OSMOTICLOAD DURING MANNITOLLOADING
The symbols have the same meaning as in Figure 1.
ride, and potassium versus total solute load. Thelines represent linear regressions calculated fromnine normal hydropenic subjects under conditionsof osmotic loading with mannitol. It can be seen
that the data group themselves about the lines in a
fairly satisfactory manner. The pattern of salt losswas the same in both pitressin-treated and un-
treated patients, despite the wide disparity inurine flows. Solute loading had little effect on
potassium excretion in the subjects of the presentstudy as observed previously in normal subjects(10). Mannitol excretion, not plotted, accountedfor the same percentage of urinary solutes (50-60%b) as it did in normal subjects (6).
The linear relation of sodium, chloride, andmannitol to the total solute load indicates that theper cent composition of the urine in patients withdiabetes insipidus during solute loading is similarto that of normal subjects. It also suggests thatthe final solute load destined for excretion is as-
sembled in a portion of the tubule proximal to thesite of concentration or dilution of the urine.
DISCUSSION
The observed two- to four-fold increase of uri-nary osmolarity in patients with diabetes insipidusafter osmotic loading appears incompatible witha hypothesis which requires the delivery of a hypo-tonic fluid from the proximal tubule. The con-
verse hypothesis, namely, the flow of an isotonicproximal fluid, may be tested, given the additionalassumption that there exists a basal, dilute urineflow, that observed in the preliminary periods,which changes little throughout the experiment.After loading, the increment of urinary volume andload above the control level should consist of iso-tonic proximal fluid. This may be calculated as
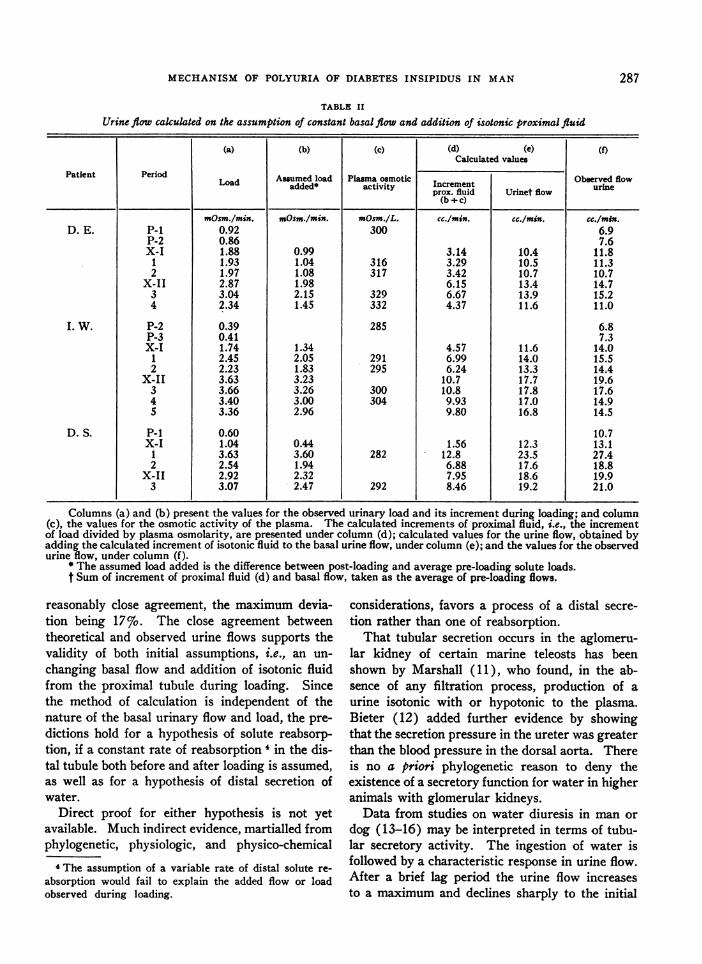
the increment of urinary load divided by the plasmaosmolarity. Table II contains the calculations ofthe urine flow based on these assumptions, com-
pared with the observed values. The data repre-sent 23 periods of urine collection, of which 18were obtained during loading. It can be seen thatthe calculated and observed rates of flow were in
" 0.20
X "I 0.10-
mS O-
0.701
a Q60F)r-1.a
w'i 0.40I
o 030
Q 0.20
0.l10
286
MECHANISMOF POLYURIA OF DIABETES INSIPIDUS IN MAN
TABLE II
Urine flow cakulated on the assumption of constant basal flow and addition of isotonic proximal fluid
(a) (b) (c) (d) (e) (f)Calculated values
Patient Period Asumed load Plma osmotic Obwrved flowLoad added* activity Increment seurineprox. fluid Urinet flow urn
(b +c)
mOsm./min. mOsm./min. mOsm./L. cc/mis. cc./min. cc./min.D. E. P-i 0.92 300 6.9
P-2 0.86 7.6X-I 1.88 0.99 3.14 10.4 11.8
1 1.93 1.04 316 3.29 10.5 11.32 1.97 1.08 317 3.42 10.7 10.7
X-II 2.87 1.98 6.15 13.4 14.73 3.04 2.15 329 6.67 13.9 15.24 2.34 1.45 332 4.37 11.6 11.0
I. W. P-2 0.39 285 6.8P-3 0.41 7.3X-I 1.74 1.34 4.57 11.6 14.0
1 2.45 2.05 291 6.99 14.0 15.52 2.23 1.83 295 6.24 13.3 14.4
X-II 3.63 3.23 10.7 17.7 19.63 3.66 3.26 300 10.8 17.8 17.64 3.40 3.00 304 9.93 17.0 14.95 3.36 2.96 9.80 16.8 14.5
D. S. P-i 0.60 10.7X-I 1.04 0.44 1.56 12.3 13.1
1 3.63 3.60 282 12.8 23.5 27.42 2.54 1.94 6.88 17.6 18.8
X-II 2.92 2.32 7.95 18.6 19.93 3.07 2.47 292 8.46 19.2 21.0
Columns (a) and (b) present the values for the observed urinary load and its increment during loading; and column(c), the values for the osmotic activity of the plasma. The calculated increments of proximal fluid, i.e., the incrementof load divided by plasma osmolarity, are presented under column (d); calculated values for the urine flow, obtained byadding the calculated increment of isotonic fluid to the basal urine flow, under column (e); and the values for the observedurine flow, under column (f).
* The assumed load added is the difference between post-loading and average pre-loading solute loads.t Sumof increment of proximal fluid (d) and basal flow, taken as the average of pre-loading flows.
reasonably close agreement, the maximum devia-tion being 17%o. The close agreement betweentheoretical and observed urine flows supports thevalidity of both initial assumptions, i.e., an un-changing basal flow and addition of isotonic fluidfrom the proximal tubule during loading. Sincethe method of calculation is independent of thenature of the basal urinary flow and load, the pre-dictions hold for a hypothesis of solute reabsorp-tion, if a constant rate of reabsorption 4 in the dis-tal tubule both before and after loading is assumed,as well as for a hypothesis of distal secretion ofwater.
Direct proof for either hypothesis is not yetavailable. Much indirect evidence, martialled fromphylogenetic, physiologic, and physico-chemical
4The assumption of a variable rate of distal solute re-absorption would fail to explain the added flow or loadobserved during loading.
considerations, favors a process of a distal secre-tion rather than one of reabsorption.
That tubular secretion occurs in the aglomeru-lar kidney of certain marine teleosts has beenshown by Marshall (11), who found, in the ab-sence of any filtration process, production of aurine isotonic with or hypotonic to the plasma.Bieter (12) added further evidence by showingthat the secretion pressure in the ureter was greaterthan the blood pressure in the dorsal aorta. Thereis no a priori phylogenetic reason to deny theexistence of a secretory function for water in higheranimals with glomerular kidneys.
Data from studies on water diuresis in man ordog (13-16) may be interpreted in terms of tubu-lar secretory activity. The ingestion of water isfollowed by a characteristic response in urine flow.After a brief lag period the urine flow increasesto a maximum and declines sharply to the initial
287

WILLIAM A. BRODSKYAND S. RAPOPORT
URINE DILUTIONIN
DISTAL TUBULE
INTRALUMINALFLUID
PROXIMAL
TUBULE
300mOsm/L.__-'____ _ _ __
DISTALTUBULE
(LEVEL I)
DISTALTUBULE
(LEVEL fI)
200mOsm/L.
50 mOsm/L.
PEFEXTR
CELL
- --o DISTAL SOLUTE RE
<- - DISTAL WATER SEC
FIG. 3. SCHEMATIC COMPARISONOF SREABSORPTIVE PROCESSESOF URINE DILTDISTAL TUBULE
It is assumed that the proximal and pericellular fluids are both isotonic with plasrtonic to the distal fluid. The assumed o&designated in the diagram. The tonicity ofhas been takern as Y6 that of plasma. Thetoward the left represent energy potentialsess of secretion with the production of a fing water in composition. The lines pointiirepresent energy potentials for an assumdistal solute reabsorption which requiresreabsorbate. Two levels of the distal tubulprogressive stages of urine dilution, are Idefinite value is assumed for the tonicityfor the reabsorptive process. Alternativethe cell to the extracellular fluid are drawisorbate, solid lines representing a procesof a hypertonic fluid, and interrupted one.intracellular dilution.
level. Variations in the amount or in the mode ofadministration of water do not affect the patternor extent of the diuresis, provided the dose
IITUBULARis in excess of 1%7o of the body weight (15b).
tACELLULAR Even while water absorption in the intestine orFLUID injection by vein still continues (16b, 17), the
typical decline of diuresis takes place. Throughout
300 mOsm/L. the entire course of water diuresis, the filtration_ _ __ _ rate remains essentially unchanged (18-20).
Hormonal and nervous factors, i.e., pituitrin,epinephrine, thyroxine, and painful or emotionalstimuli, have profound effects on both the courseand amount of the diuresis (21, 22).
This behavior resembles that of secretory glands.Their function is characterized by a specific pat-tern often rhythmical in nature (23, 24). Thevolume of secretion may vary independently of theblood flow (25). Nervous and hormonal factors
300 mOsm/L profoundly affect their activity. Hypotonicity ofsecretions is well known, sweat and saliva beingthe outstanding examples (26).
Some of the thermodynamic implications of theproduction of hypotonic urine, according to thealternate assumptions of distal secretion of wateror distal reabsorption of solutes, may be exam-ined. Figure 3 is a schematic presentation of theassumed energy relations and fluid concentrations
:ABSORPTION at two levels of the distal tubule. At any level inthe distal tubule the concentration gradient be-
CRETION tween peri-tubular fluid and the secretion is 300
mOsm./L., while that between intra-luminal and
UTION IN THEperi-tubular fluids increases progressively. Withrespect to an assumed process of solute reabsorp-tion, the less the volume of water reabsorbed, the
na,ubuta eyera more hypertonic must be the reabsorbate. Nosmolarities are specific assumptions are available for the volumethe final urine of fluid delivered to or reabsorbed from the distallines pointing tubule. For simplicity, a constant rate of solute
s for the proc- reabsorption at all levels in the distal tubule hasfluid approach- been assumed. Whatever volume of a hypertonicng to the right reabsorbate is postulated, its production will re-aed process of quire more energy than that of a dilute secretion.5a hylpertonic
le, representing 'The energy expenditure in the production of diluteportrayed. No urine by the distal tubule, assuming a single stage physicalwithin the cell process, may be calculated according to the equation ofpathways from von Rhorer (27).n for the reab- 1) W= VRT (Uln U/P + P-U)is of extrusion The limitations of and justifications for such a method ofs, a process Of ccalculation of osmotic work have been discussed in detail
elsewhere (10).The volume of water secreted or reabsorbate removed to
288

MECHANISMOF POLYURIA OF DIABETES INSIPIDUS IN MAN
Inspection of the diagram reveals that the con-centration gradient between lumen and reabsorb-ate at any level in the tubule is greater than thatbetween peri-tubular fluid and a dilute secretion.Furthermore, the gradient increases progressivelyas the urine becomes more dilute. Whether thehypertonic reabsorbate per se is extruded intothe peri-tubular space or whether it is diluted toisotonicity in the tubular cell, the process of distal
dilute a given amount of isotonic proximal fluid may becalculated as follows:
It is easily seen that2) (Op- OQ)n
is the number of solutes removed in the process of forma-tion of dilute urine from an isotonic fluid, be it peri-tubular, extracellular or proximal tubular fluid, whereOp = plasma osmolarity, Ou urine osmolarity, and n theobserved rate of urine flow. Then,
Opthe volume of a secretion of water added to a given amountof isotonic proximal fluid, and
4)O- O,,) Vr
the volume of a reabsorbate of osmolarity 0r, removedfrom a given amount of isotonic proximal fluid.
It follows that,5) Vr = Dp Va.5)
In the case of distal secretion, the concentration gradientis from peri-tubular to secretion fluid. Substituting inequation 1), U is the concentration of the secretion, and Pthat of the peri-tubular fluid. In the case of solute reab-sorption, the gradient is from distal fluid to reabsorbate,so that U would represent the assumed osmolarity of re-absorbate and P, that of the distal fluid. As a first ap-proximation, the osmolarity of the secretion may be takenas zero. For the reabsorbate, a series of values in multiplesof plasma osmolarity are assumed. The osmolarity of theperi-tubular fluid is taken to be 300, and the final urine,60 mOsm./L. Substituting these values in equation 1)gives a series of relative work units which permit a com-parison of energy expenditure in terms of a given volume ofisotonic fluid cleared of solutes as is shown in the followingtable:
TABLE III
Energy expenditure for secretory and reabsorptive process inthe distal tubule
Vol. of secretion Osmol. per-tub. Osmol. of Work unitsfluid secretion
cc./min. mOsm. IL. mOsm. /L. WIRTVI 300 0 300 V,
Vol. reabsorbate fluid reabOsmol.
V./2 60 600 420 V,V./3 60 900 536 V,V./4 60 1,200 615 V,V,/10 60 3,000 876 V.
solute reabsorption would seem uneconomical com-pared to that of distal secretion.
According to the postulate that there is a distalsecretion, water is transported from an isotonicperi-tubular fluid to the tubular lumen. Such aprocess may be experimentally produced and isknown as "negative anomalous osmosis." The fac-tors responsible for negative osmosis dependchiefly on the characteristics of the membrane(28). A similar process of negative osmosismight result in movement of water from hyper-tonic distal to isotonic peri-tubular fluids, ac-counting for the concentration of urine in normalhydropenic subjects or in patients with diabetesinsipidus when they receive pitressin. No funda-mental change in membrane permeability wouldhave to be assumed to account for either concen-tration or dilution of the urine by the kidney.
The large volume of glomerular filtrate rendersdifficult any attempt to establish the existence ofa tubular secretory function. Perhaps the onlyacceptable direct evidence would consist of demon-stration of a rate of urine flow in excess of that offiltration, under conditions of extreme reductionof filtration rate.
SUMMARY
Osmotic diuresis was produced by mannitolloading in three patients with diabetes insipidus.
During hydropenia, a flow of copious and diluteurine persisted. After loading, osmolarity of theurine rose but remained below that of plasmawhile the urine flow increased more than two-fold.For a given solute load the rate of excretion ofurine was two to three times that of normal sub-jects. The urine flow was independent of changesof filtration rate or blood flow. After administra-tion of pitressin, the relation of urine flow andsolute excretion became essentially normal.
The per cent composition of urinary solutes inpatients with diabetes insipidus during mannitolloading was similar to that of normal subjectssuggesting that the final solute load destined forexcretion is assembled in a portion of the tubuleproximal to the site of concentration or dilution ofthe urine.
The data on urinary flow and solute load indicatethat there exists a basal, dilute urine flow in dia-betes insipidus, and that the increased flow ob-
289
WILLIAM A. BRODSKYAND S. RAPOPORT
served during loading is due to the delivery ofadditional isotonic fluid from the proximal tubule.
It is postulated, on indirect evidence, that thedistal tubule may be a special organ of watertransport and that the production of hypotonicurine is due to water secretion, that of a hyper-tonic urine to water reabsorption, in the distaltubule.
REFERENCES
la. Fisher, C., Ingram, W. R., and Ranson, S. W., Dia-betes Insipidus and the Neuro-hormonal Control ofWater Balance: A Contribution to the Structureand Fur,ction of the Hypothalamico-HypophysealSystem. Edwards Bros., Ann Arbor, Mich., 1938.
b. Harris, G. W., Neural control of the pituitary gland.Physiol. Rev., 1948, 28, 139.
2. Shannon, J. A., The control of renal excretion of wa-ter. I. The effect of variations in the state of hy-dration on water excretion in dogs with diabetesinsipidus. J. Exper. Med., 1942, 76, 371.
3. Walker, A. M., Bott, P. A., Oliver, J., and Mac-Dowell, M. C., The collection and analysis of fluidfrom single nephrons of the mammalian kidney.Am. J. Physiol., 1941, 134, 580.
4a. Smith, H. W., The Physiology of the Kidney.Oxford University Press, New York, 1937.
b. Smith, H. W., The excretion of water (MorrisHerzstein lecture). Bull. New York Acad. Med.,1947, 23, 177.
c. Wesson, L. G., Jr., Anslow, W. P., Jr., and Smith,H. W., The excretion of strong electrolytes. Bull.New York Acad. Med., 1948, 24, 586.
Sa. Richards, A. N., and Plant, 0. H., Urine formationin the perfused kidney. The influence of alterationson renal blood pressure on the amount and com-position of the urine. Am. J. Physiol., 1922, 59, 144.
b. Verney, E. B., and Starling, E. H., On secretion bythe isolated kidney. J. Physiol., 1922, S6, 353.
c. Dreyer, N. B., and Verney, E. B., The relative im-portance of the factors concerned in the formationof the urine. J. Physiol., 1923, 57, 451.
6. Rapoport, S., Brodsky, W. A., West, C. D., andMackler, B., Urinary flow and excretion of solutesduring osmotic diuresis in hydropenic man. Am.J. Physiol., 1949, 156, 433.
7. Handley, C. A., and Keller, A. D., Changes in renalfunctions associated with diabetes insipidus pre-cipitated by anterior hypothalamic lesions. Am.J. Physiol., 1950, 160, 321.
8. West, C. D., and Rapoport, S., The glomerular filtra-tion rate and renal blood flow during mannitol load-ing in hydropenic dogs. Unpublished.
9. Beaser, S. B., Renal excretory function and diet indiabetes insipidus. Am. J. M. Sc., 1947, 213, 441.
10. Rapoport, S., West., C. D., and Brodsky, W. A., Ex-cretion of solutes and osmotic work during osmotic
diuresis of hydropenic man. The ideal and theproximal tubular work; the biological maximumof work. Am. J. Physiol., 1949, 157, 363.
11. Marshall, E. K., Jr., A comparison of the functionof the glomerular and aglomerular kidney. Am.J. Physiol., 1930, 94, 1.
12. Bieter, R. N., The secretion pressure of the aglomeru-lar kidney. Am. J. Physiol., 1931, 97, 66.
13a. Priestley, J. G., The regulation of excretion of waterby the kidneys. J. Physiol., 1916, 50, 304.
b. Priestley, J. G., The regulation of the excretion ofwater by the kidneys. J. Physiol., 1921, 55, 305.
14. Rioch, D. M., Water diuresis. J. Physiol., 1930, 70,45.
15a. Heller, H., and Smirk, F. H., Studies concerningthe alimentary absorption of water and tissue hy-dration in relation to diuresis. J. Physiol., 1932,76, 1.
b. Heller, H., and Smirk, F. H., Tissue hydration anddiuresis. II. The influence of binding an animal, ofits body temperature, and of extrarenal losses ofwater upon diuresis. J. Physiol., 1932, 76, 23.
c. Baldes, E. J., and Smirk, F. H., The effect of waterdrinking, mineral starvation, and salt administrationon the total osmotic pressure of the blood in man,chiefly in relation to the problems of water ab-sorption and water diuresis. J. Physiol., 1934, 82,62.
16a. Klisiecki, A., Pickford, M., Rothschild, P., andVerney, E. B., The absorption and excretion ofwater by the mammal. I. The relation between ab-sorption of water and its excretion by the in-nervated and denervated kidney. Proc. Roy. Soc.,London, 1933, 112B, 496.
b. Klisiecki, A., Pickford, M., Rothschild, P., andVerney, E. B., The absorption and excretion ofwater by the mammal. II. Factors influencing theresponse of the kidney. Proc. Roy. Soc., London,1933, 112B, 521.
17. Newton, W. H., and Smirk, F. H., The effect of theintravenous administration of water upon the rateof urine formation. J. Physiol., 1933, 78, 451.
18. Walker, A. M., Schmidt, C. F., Elsom, K. A., andJohnston, C. G., Renal blood flow of unanesthetizedrabbits and dogs in diuresis and antidiuresis. Am.J. Physiol., 1937, 118, 95.
19. Verney, E. B., Absorption and excretion of water;antidiuretic hormone (Sharpey Schafer memoriallecture, abridged). Lancet, 1946, 2, 739 and 781.
20. Marshall, E. K., Jr., The influence of diuresis on theelimination of urea, creatinine, and chloride. J.Pharm. & Exper. Therap., 1920, 16, 141.
21. Verney, E. B., The antidiuretic hormone and thefactors which determine its release (Croonian lec-ture). Proc. Roy. Soc., London, 1947, 135B, 25.
22. Pickford, M., Control of the secretion of antidiuretichormone from the pars nervosa of the pituitarygland. Physiol. Rev., 1945, 25, 573.
290

MECHANISMOF POLYURIA OF DIABETES INSIPIDUS IN MAN
23. Albert, R. E., and Palmes, E. D., Pulsatile evaporativerates from small skin areas as measured by an infra-red gas analyzer. Federation Proc., 1949, 8, 1.
24. Franke, F. E., Randall, W. C., Smith, D. E., andHertzman, A. B., Vasomotor and sudomotor pat-terns in the skin of the finger and forearm. Fed-eration Proc., 1947, 6, 105.
25. Cowgill, G. R., The salivary glands and their di-gestive action, in Howell, W. H., Howell's Text-
book of Physiology, edited by Fulton, J. F. W. B.Saunders, Philadelphia, 1946, p. 1032.
26. Shohl, A. T., Mineral Metabolism (American Chem-ical Soc. Monograph Series). Reinhold Publish-ing Corp., New York, 1939.
27. von Rhorer, L., Ueber die osmotische Arbeit derNieren. Arch. f. d. ges. Physiol., 1905, 109, 375.
28. Hober, R., Physical Chemistry of Cells and Tissues.The Blakiston Co., Philadelphia, 1945.
291