tim callan, karina doorley and michael savage april 2018 · approach of bargain and callan (2010),...
TRANSCRIPT
EM 10/18
Inequality in EU crisis countries. How effective were automatic stabilisers? Tim Callan, Karina Doorley and Michael Savage April 2018

Inequality in EU crisis countries.
How effective were automatic stabilisers?*
Tim Callan a,b,c
Karina Doorley a,b,c
Michael Savage d
a Economic and Social Research Institute
b Trinity College Dublin c Institute of Labor Economics
d Bank of Ireland
Abstract
The Great Recession and the widespread adoption of fiscal austerity policies have
heightened concern about inequality and how well tax-benefit systems redistribute. We
examine how the distribution of income in the EU countries which were hardest hit during
the recession evolved over this time. Using and extending a recently developed
framework (Savage et al., 2017), the overall change in income inequality is decomposed
into parts attributable to the change in market income inequality, changes in discretionary
tax-benefit policy and automatic stabilisation effects. We implement this approach using
the microsimulation software, EUROMOD, linked to EU-SILC survey data. Automatic
stabilisation effects, particularly through benefits, are found to play an important role in
reducing inequality in all the crisis countries. Their role is less important if we focus on
the working age population only, due to the relative importance of old-age benefits in
southern European welfare systems. Discretionary policy changes also contributed to
reductions in inequality, but to a much lesser extent.
JEL: H24, D31, D63
Keywords: inequality, decomposition, Great Recession, discretionary policy, automatic
stabilisation
Corresponding author:
Karina Doorley
* The results presented here are based on EUROMOD version G4.0+. EUROMOD is maintained, developed
and managed by the Institute for Social and Economic Research (ISER) at the University of Essex, in
collaboration with national teams from the EU member states. We are indebted to the many people who
have contributed to the development of EUROMOD. The process of extending and updating EUROMOD
is financially supported by the European Union Programme for Employment and Social Innovation ’Easi’
(2014-2020). We make use of microdata from the EU Statistics on Incomes and Living Conditions (EU-
SILC) made available by Eurostat (59/2013-EU-SILC-LFS). The results and their interpretation are the
authors’ responsibility. We are also indebted to Olivier Bargain and participants of the 14th EUROFRAME
conference, the 6th World Congress of the International Microsimulation Association, the SimDeco closing
workshop and the seminar series at Maynooth University and the Economic and Social Research Institute
for valuable comments and suggestions.

2
1. Introduction
Income inequality has been rising in most OECD countries since well before the onset of the
Great Recession (GR) and the economic recovery from the GR has not reversed this trend
(OECD, 2017). The widespread adoption of fiscal austerity policies during the GR has
heightened concern about inequality and its effects, not only on social outcomes, such as
political fall-outs (Funcke et al, 2016), but also in potentially undermining growth in the
medium to longer-term. Against that background, it is now important to look beyond the
initial impact of the GR to explore how income inequality has evolved as policy has
responded to the challenges posed by the crisis. The specifics of how tax and welfare systems
coped and the adoption, to a greater or lesser extent, of macro-fiscal austerity policies to cope
with ballooning fiscal deficits are both relevant. Austerity policies were most stark in the five
European countries that were unable to continue to finance their debt in the financial markets
after the financial crash and had to avail of formal ‘bail-out’ arrangements with the European
Union and IMF, namely Portugal, Ireland, Italy, Greece and Cyprus. Spain was also
particularly hard-hit and had to receive assistance from the European Stability Mechanism in
recapitalising its banks. The experience of these countries has been very varied. Greece at one
end of the spectrum remains in crisis mode. Ireland at the other end of the spectrum has
successfully completed a stringent bail-out programme, with growth now returned, and the
fiscal deficit reduced to the point where debt can be financed at very low interest rates.
Unemployment has fallen to close to pre-crisis levels in all countries except Spain, where it
remains high.
The distributional impact of tax-transfer systems can change due to explicit discretionary
changes in tax-benefit policies (e.g., higher tax rates or lower welfare payment rates). It may
also be substantially affected by changes in the underlying population and distribution of
income (e.g., a higher proportion of pensioners, or increased unemployment). Dolls et al.
(2012, 2017) concentrate on this latter component, and examine, ex ante, the degree of
“automatic stabilisation” of aggregate income inherent in the systems of EU countries and the
US, under either an income or an unemployment shock. Their focus is therefore on the
redistributive properties of a given tax-transfer system on alternative distributions of market
income. They find than countries with weak automatic stabilisers were also those which
experienced major economic contractions and increases in unemployment during the crisis.
A separate literature, initiated by Bargain and Callan (2010) and followed up by Bargain
(2012); Jenkins et al (2013); Bargain et al (2017); Paulus and Tasseva (2017a); Matsaganis &
Leventi (2014); Creedy and Hérault (2015) and Sologon et al (2017) among others, focuses
on identifying, for a given population and income distribution, the impact of discretionary
changes in tax-transfer policy on measures of income inequality and poverty.1 In this
approach “automatic” responses of existing policies to income or unemployment shocks are
not separately identified but included with other factors, such as changes in unemployment or
1 Cowell & Fiorio (2011) provide a framework for reconciling microeconometric decomposition approaches of
this type with regression methodology.

3
the distribution of market incomes. In this paper we apply an approach which draws on both
perspectives to identify the impact of tax and benefit policy on changes to income inequality
over time in a selection of EU countries, and the breakdown of this change between
discretionary and automatic components.
Evaluating the automatic stabilisation component of tax-benefit policy is often conducted
using macro data (see Girouard and André (2005) for example). Micro-data has many
advantages over macro-data in this context. As argued by Dolls et al. (2012), the use of
micro-data and the use of microsimulation allow us to investigate the causal effects of shocks
on household disposable income, holding everything else constant. It is possible, therefore, to
isolate the impact of automatic stabilisation from other factors, such as discretionary tax-
benefit policy, that can affect macro-based studies. In addition, macro-data analysis, by
design, prohibits examination of the distributional impact of automatic stabilisation. The
second main advantage of using microdata in this context is the ability to analyse the impact
of automatic stabilisation on changes in income inequality, rather than solely focussing on
average or aggregate income. Our framework isolates the impact of automatic stabilisation on
income inequality in this ex post manner.
We apply and extend a framework developed by Savage et al. (2017), which builds on the
approach of Bargain and Callan (2010), to decompose the change in inequality during the GR
into components attributable to changes in market income, changes in discretionary policy,
and the automatic stabilisation properties of the pre-existing tax-transfer systems. Paulus and
Tasseva (2017b) employ a similar method to provide an overview of how automatic
stabilisers absorbed market shocks in the EU-27 over the course of the GR, finding that
automatic stabilisation played at least as important a role as discretionary policy. We provide
a more in-depth study of this nature for the EU countries which were hardest hit by the GR
and, using detailed decompositions, can investigate the contribution of market income,
discretionary policy and automatic stabilisation to inequality changes, with a focus on
particular instruments within the tax-benefit system in each country. We use EU-SILC data
on incomes and the EUROMOD tax-benefit model to construct appropriate counterfactuals
for the decomposition. Our results give a better understanding of how changes in inequality
were generated or prevented in a number of European countries who were most vulnerable to
market income shocks during the crisis.
This paper makes several significant contributions to the literature on the impact of tax-
benefit systems on households’ experience of the GR. We contribute new evidence on how
income distributions changed in a selection of countries most severely affected by the GR.
Our methodology is novel in that it allows us to disentangle discretionary policy effects from
automatic stabilisation in an ex post context. We go beyond quantifying the role of automatic
stabilisers in cushioning simulated market shocks and show how they shaped income
distributions in the wake of a real and very substantial market income shock. We further
show how an extension to this method can be used to isolate the contribution of specific taxes
and benefits to automatic stabilisation of inequality during the crisis. This allows us to
comment on how existing tax-benefit systems (including particular instruments) as well as
4
new fiscal policies helped to cushion the impact of the GR in the EU countries which were
hardest hit by the GR.
2. Data and Method
2.1 Microsimulation and Data
We use the tax-benefit microsimulation software, EUROMOD, which numerically simulates
tax-benefit rules, allowing the computation of all social contributions, direct taxes and
transfers to yield household disposable income.2 It is linked to EU-SILC data for years 2008
(2007 incomes) and 2014 (2013 incomes).3 One exception is Ireland, for which 2014 data is
not yet available in EUROMOD. We therefore report results based on EUROMOD for
Ireland with an end-year of 2011 policies linked to 2012 data (containing a mix of 2011 and
2012 incomes). However, we find similar results in a 2008-2013 framework using SWITCH,
the Irish national model (Savage et al, 2017). We simulate disposable income distributions
and inequality indices for a base year at the onset of the crisis (2007) and for an end year for
which microsimulation models (with the relevant data) are available (usually 2013). We also
simulate some counterfactual scenarios, described in the next section. Figure 1 shows that
this period encompasses all periods of negative GDP growth in the countries concerned
(except for Cyprus, which registered slightly negative GDP growth in 2014).
The major advantage of a microsimulation model is that it allows us to examine
counterfactual scenarios (e.g. what if tax-benefit policies had simply been indexed in line
with price inflation or wage growth?). This allows us to isolate the changes in inequality and
poverty that are due to government policy and those that are due to market forces. Using our
decomposition method (described in the next section), we can now also break down the
“market forces” component into the relative contributions of direct changes in market income
and automatic stabilisation caused by the pre-existing tax-benefit system, isolating the
relative contribution of both taxes and benefits to these.
It is worth noting the standard limitations that accompany the use of microsimulation models.
Firstly, the models are static and assume no behavioural response to policy changes. Any
behavioural responses occurring between 2007 and 2013 will therefore be picked up in the
market income and automatic stabilisation category. Survey data tends to have problems
accurately capturing the higher end of the income distribution. However, it is these data
which are the subject of extensive analysis in the debate about income inequality, and our
approach helps to identify what lies behind the headline results. We also take care to compare
our simulated inequality indices with those reported in official statistics (Table 5). The
2 For a comprehensive overview of EUROMOD, see Sutherland and Figari (2013) 3 Started in 2003 for 6 member states (Belgium, Denmark, Greece, Ireland, Luxemburg and Austria), as well as
Norway, EU-SILC was extended to other EU countries from 2004. It gathers annual cross-sectional information
on European individuals and households (incomes, socio-demographics, social exclusion, life condition). It was
originally created to provide the material for structural indices of social cohesion in Europe (Laeken indices).
EU-SILC (statistics on income and life conditions) constitute the most recent and important source of microdata
for comparative studies on income distribution in Europe.

5
inequality indices simulated by EUROMOD and reported in official statistics are similar and
change in the same manner during the crisis. There is one major exception: for Cyprus,
EUROMOD simulates an increase in the disposable income Gini index between the base and
the end period of around 7 points. The recorded increase according to official Eurostat
statistics (which is based on EU-SILC) is around 3 points, casting some doubt on the
reliability of the Cypriot simulations. For this reason, in what follows, we do not present
results for Cyprus.
Figure 1: Real GDP growth rate in crisis countries
Sources: Eurostat and Irish Central Statistics Office (CSO). Note: From 2015 onwards, Ireland’s national
accounts are distorted by the reclassification of multinational companies or their assets as being resident in
Ireland. Therefore, modified Gross National Income (GNI*), as computed by the CSO, is used for Ireland for
2015 and 2016 to ensure comparability with the other countries.
Other important considerations when using a microsimulation model include the systematic
underreporting of income for the purposes of tax evasion. Tax evasion has been found to be a
widespread phenomenon in two of the countries in our samples, Greece and Italy (Sutherland
and Figari, 2013). For these countries, a simple adjustment is included in the model to split
recorded employment and self-employment income into a component which is assumed to be
reported to the tax authority and a residual component which is assumed to be evaded (see
Ceriani et al., 2013 for further discussion of this issue).
Take-up of means-tested benefits is generally not 100% although basic microsimulation of
benefits attributes them to all eligible households. We deal with this by introducing random
non-take-up, where possible, to certain means-tested benefits which have low reported take-
up rates.4 In addition to this there may be some policy changes that are not captured by a tax-
benefit model due to a lack of information in the underlying data that prevents simulation of a
tax or benefit. Lastly, indirect taxes are generally not captured in microsimulation models as
4 This includes in-work benefits in Ireland (Family Income Supplement), social pension and unemployment
assistance for older workers in Greece and the Social Supplement for the Elderly in Portugal
-15
-10
-5
0
5
10
15
2005 2006 2007 2008 2009 2010 2011 2012 2013 2014 2015 2016
Real GDP growth rate - volume
Cyprus
Portugal
Ireland
Greece
Spain
Italy

6
expenditure information is often not present in the income surveys used to build a database
for the tax-benefit model.5
2.2 Decomposition Method
In this section, we outline the method used to decompose the change in inequality into three
components: a market income effect, an automatic stabilisation effect and a discretionary
policy effect. The decomposition can be applied to any inequality index defined over the full
range of incomes (including zeros and negatives). For clarity, in this section we discuss the
decomposition applied to the Gini index, one of the most commonly used indices of income
inequality. We start by defining the change in the Gini coefficient based on disposable
income6, as the change in the Gini based on market incomes, 𝐺(𝑀1) − 𝐺(𝑀0), minus the
change in the Reynolds-Smolensky (RS) index, 𝑅1 − 𝑅0.7 This starting point makes clear that
the change in 𝐺(𝐷) over any time period is determined by the degree to which any change in
the distribution of market incomes is offset by a change in the amount of redistribution done
by the tax-benefit system. It is the second component of the equation that we are particularly
interested in. 𝑅1 − 𝑅0 is a combination of the impact of automatic stabilisation and the
impact of discretionary changes to the tax-benefit system.
G(D1) − G(D0) = G(M1) − G(M0) − [R1 − R0] (1)
= [G(M1) − G(M0)] − [[G(M1) − G(D1)] − [G(M0 ) − G(D0)]]
It is useful at this point to show how this method relates to the commonly used decomposition
proposed by Bargain-Callan (2010), BC hereafter. We define 𝐺(𝐷) as the result of a tax-
benefit function 𝑑(. ) which transforms market incomes 𝑀 into disposable incomes 𝐷, based
on monetary tax-benefit parameters 𝑝 (benefit payments, tax thresholds etc.).
We can therefore define the change in 𝐺(𝐷) as:
∆𝐺(𝐷) =
[𝐺(𝑀1) − 𝐺(𝑀0)] − [𝐺(𝑀1) − 𝐺(𝑑1(𝑝1, 𝑀1)) − {𝐺(𝑀0) − 𝐺(𝑑0(𝑝0, 𝑀0))}] (2)
To isolate the impact of the discretionary changes in tax-benefit policy from the impact of
automatic stabilisation, we introduce a Gini based on a counterfactual distribution of income
𝐺(𝑑0(𝛼𝑝0, 𝑀1)). This index summarises income inequality in a distribution of disposable
incomes calculated using end-year market incomes transformed into disposable incomes
5 Kaplanoglou and Rapanos (2016) examined how the distribution of consumption in Greece changed between
2008 and 2013. They found evidence of a significant increase in consumption inequality, with indirect tax
changes contributing to this outcome. See also Pestel and Sommer (2016), Decoster et al. (2014), and Savage
(2017) for analyses based on imputation of expenditure data into a tax-benefit microsimulation database. 6 Equivalised household disposable income, where the OECD equivalence scale is used to equivalise incomes (1
for the first adult, 0.7 for subsequent adults, 0.5 for children). 7 The RS index is simply defined as the difference between the Gini based on market incomes and the Gini
based on disposable incomes. It is therefore a measure of how much redistribution is done by the tax-benefit
system in a given year.

7
under the start-year tax-benefit system, where the parameter, 𝛼, indexes monetary tax-benefit
parameters, 𝑝0, to common end year values8.
To equation (2) we add and subtract [𝐺(𝑀1) − 𝐺(𝑑0(𝛼𝑝0, 𝑀1))], giving:
∆𝐺(𝐷) = [𝐺(𝑀1) − 𝐺(𝑀0)] − [𝐺(𝑀1) − 𝐺(𝑑1(𝑝1, 𝑀1)) − {𝐺(𝑀0) − 𝐺(𝑑0(𝑝0, 𝑀0))}] +
[𝐺(𝑀1) − 𝐺(𝑑0(𝛼𝑝0, 𝑀1))] − [𝐺(𝑀1) − 𝐺(𝑑0(𝛼𝑝0, 𝑀1))] (3)
The comparison with the BC decomposition can be made clear at this point. Rearranging
terms in equation (3), and cancelling all 𝐺(𝑀𝑡) gives us the BC decomposition in which
market income changes and automatic stabilisation are captured in what BC term the “other”
effect:
∆𝐺(𝐷) =
𝐺(𝑑1(𝑝1, 𝑀1)) − 𝐺(𝑑0(𝛼𝑝0, 𝑀1)) (4a) “policy” effect9
+ 𝐺(𝑑0(𝛼𝑝0, 𝑀1)) − 𝐺(𝑑0(𝑝0, 𝑀0)) (4b) “other” effect
Alternatively, by rearranging equation (3), we can decompose the overall impact of the tax-
benefit system into the impact of the change in the distribution of market income (expression
5a), the impact of discretionary changes to tax-benefit policies (expression 5b), and the
impact of automatic stabilisation (expression 5c):
∆𝐺(𝐷) =
[𝐺(𝑀1) − 𝐺(𝑀0)] (5a) Market income effect
−[𝐺(𝑀1) − 𝐺(𝑑1(𝑝1, 𝑀1)) − 𝐺(𝑀1) + 𝐺(𝑑0(𝛼𝑝0, 𝑀1)) (5b) Discretionary policy
+𝐺(𝑀1) − 𝐺(𝑑0(𝛼𝑝0, 𝑀1)) − 𝐺(𝑀0) + 𝐺(𝑑0(𝑝0, 𝑀0))] (5c) Auto Stabilisation
These expressions can be simplified by moving to the use of notation based on the fact that
the Reynolds-Smolensky index (𝑅) is simply the difference between 𝐺(𝑀𝑡) and 𝐺(𝐷𝑡):
∆𝐺(𝐷) =
[𝐺(𝑀1) − 𝐺(𝑀0)] (6a) Market income effect
−[ 𝑅[𝑀1, 𝑑1(𝑝1, 𝑀1)] − 𝑅[𝑀1, 𝑑𝑜(𝛼 𝑝𝑜 , 𝑀1)] (6b) Discretionary policy
+𝑅[𝑀1, 𝑑𝑜(𝛼𝑝𝑜 , 𝑀1)] − 𝑅[𝑀0, 𝑑𝑜(𝑝𝑜, 𝑀0)]} ] (6c) Auto Stabilisation
The discretionary policy effect above is estimated using final year data for the counterfactual
distributions. The effect can also be estimated based on initial-year data, using the
decomposition:
∆𝐺(𝐷) =
8 See discussion later in this section for choices on the value of 𝛼. 9 What BC define as the “policy” effect captures only the impact of discretionary policy changes.

8
[𝐺(𝑀1) − 𝐺(𝑀0)] (7a) Market income effect
−[ 𝑅[𝑀1, 𝑑1(𝑝1, 𝑀1)] − 𝑅[𝛼𝑀0, 𝑑1(𝑝1, 𝛼𝑀0)] (7b) Auto Stabilisation
+𝑅[𝛼𝑀0, 𝑑1(𝑝1, 𝛼𝑀0)] − 𝑅[𝑀0, 𝑑𝑜(𝑝𝑜, 𝑀0)]} ] (7c) Discretionary policy
In what follows, we report decomposition results using initial year data, but results based on
end-year data (available on request) lead to similar conclusions.
It is straightforward to further decompose either the automatic stabilisation or the
discretionary policy components to separately identify the effect of tax policy and the effect
of benefit policy. For example, expression 6(c) shows the impact of automatic stabilisation on
inequality. We can isolate the contribution of benefit policy from the contribution of tax
policy to overall automatic stabilisation by introducing a benefit function, 𝑏(. ), which
transforms market income into post-transfer, pre-tax income, giving us:
𝑅[𝑀1, 𝑑𝑜(𝛼, 𝑝𝑜 , 𝑀1)] − 𝑅[𝑀0, 𝑑𝑜(𝑝𝑜, 𝑀0)] =
𝑅[𝑀1, 𝑏𝑜(𝛼, 𝑝0, 𝑀1)] − 𝑅[𝑀0, 𝑏𝑜(𝑝𝑜, 𝑀0)] (8a) Automatic Benefit Stabilisation
+ 𝑅[𝑏𝑜(𝛼 𝑝0, 𝑀1), 𝑑𝑜(𝛼 𝑝0, 𝑀1)] − 𝑅[𝑏𝑜(𝑝𝑜 , 𝑀0), 𝑑𝑜(𝑝𝑜, 𝑀0)]
(8b) Automatic Tax Stabilisation
or by introducing a tax function, 𝑡(. ), which transforms market income into post-tax pre-
benefit income, giving us:
𝑅[𝑀1, 𝑑𝑜(𝛼 𝑝𝑜 , 𝑀1)] − 𝑅[𝑀0, 𝑑𝑜(𝑝𝑜, 𝑀0)] =
𝑅[𝑀1, 𝑡𝑜(𝛼𝑝0, 𝑀1)] − 𝑅[𝑀0, 𝑡𝑜(𝑝𝑜 , 𝑀0)] (9a) Automatic Tax Stabilisation
+ 𝑅[𝑡𝑜(𝛼 𝑝0, 𝑀1), 𝑑𝑜(𝛼 𝑝0, 𝑀1)] − 𝑅[𝑡𝑜(𝑝𝑜, 𝑀0), 𝑑𝑜(𝑝𝑜 , 𝑀0)]
(9b) Automatic Benefit Stabilisation
We report results using the decomposition in equation 8 but results using equation 9 are
qualitatively similar. Similarly, expression 6(b) can be decomposed to separately identify the
impact of discretionary tax policy from discretionary benefit policy. Further breakdowns into
the contribution of specific taxes and benefits (e.g., unemployment benefit) are also possible
(and are performed) by replacing the tax or benefit function with a partial tax or benefit
function, t*(.) or b*(.), which takes account only of the tax/benefit instrument we are
interested in isolating.
In this analysis, we allow 𝛼, the indexation parameter, to take three possible values. The first
is the change in average market income between the base and end periods, i.e. it measures
each component against a scenario where tax-benefit policy parameters are indexed in line
with developments in market income. The second is wage growth, i.e., we index policy
parameters in line with average annual wage growth. The third is CPI whereby tax-benefit
policies are assumed to evolve in line with the consumer price index. These approaches
allow us to account for three different types of indexation, which seem most relevant to make

9
tax-benefit policy parameters in monetary units comparable over time. These are also the
most common indexation types used by governments in practice. The relevant figures for
each indexation assumption are displayed in Table 1. CPI and wage growth are generally
positive and broadly similar (except for Greece where CPI grew by 14% but wages declined
by 11%). Market income growth, by contrast, has been negative in every country except for
Spain where market income registered no growth over the period concerned. In what follows,
we present results using the wage growth indexing assumption. However, despite some
divergence across the three measures, the decomposition results are not particularly sensitive
to this parameter.
Table 1: Measures of price and income growth between 2007 and 2013 (2011 for
Ireland)
2.3 Automatic Stabilisers and Income Inequality
Automatic stabilisers, such as progressive tax systems and unemployment benefits, cushion
market income shocks so that the resulting disposable income shock is less severe than the
original market income shock. Dolls et al (2012) estimate that automatic stabilisers absorb
38% of a proportional market income shock in the EU. Estimations from the European
Commission (2017) also put this figure at around one-third. The effect of automatic
stabilisers on income inequality is less clear-cut because of the relative nature of inequality
measures (Atkinson & Brandolini, 2006). Depending on the type of market income shock and
the tax-benefit system, automatic stabilisers may either cushion income inequality or, less
frequently, exacerbate it. At the same time, benefits which are constant before and after a
market income shock – such as some child-related and age-related universal benefits – can
help to cushion income inequality from a market shock, even though they do not cushion
income losses. This can be seen as a form of “passive” stabilisation of inequality arising from
the existence of these benefits, rather than any increased eligibility to them.
Some examples may help to clarify these points. Consider first a proportional reduction of
10% in market income in a simplified system with a progressive income tax and no transfers.
The progressivity of the taxation system would ensure that a 10% decrease in market income
translates into less than a 10% decrease in average disposable income. In other words, the
taxation system cushions the shock to market income. However, its effect on inequality is
more nuanced. Market income inequality, as measured by the Gini coefficient, would be
unchanged by a 10% fall in all market incomes - this is an inherent property of the Gini
index. Disposable incomes, however, will not fall in this uniform fashion – losses will be
Market income
growth CPI Wage growth
Greece -37% 14% -11%
Spain 0% 14% 17%
Ireland -9% 1% 2%
Portugal -10% 10% 6%
Italy -3% 11% 8%Market income growth is calculated using EU-SILC data for the base
(2007) and end (2011/2013) periods. CPI figures come from Eurostat.
Annual wage growth statistics come from the OECD.

10
lower where income falls bring taxpayers into lower tax brackets. This means that, depending
on the specific features of the taxation system and the distribution of market income,
disposable income inequality may either increase or decrease under a proportional income
shock to market income.
Taking a second example of a system in which there is no taxation and the only transfer is a
non-means-tested old-age benefit, we can think about a similar market income shock. If all
market incomes decrease by 10% but there is no change to old-age benefits, average
disposable income will decrease by less than 10%, as in the taxation example. There is no
change to the market income Gini. However, this time, the Gini of disposable income will
decrease because the pension benefit, which is the same for all eligible households, becomes
a more important proportion of disposable income and results in some convergence in the
income distribution.10
From these examples, it is clear that the impact of automatic stabilisers on income inequality
cannot be determined a priori but must be a matter for empirical investigation. This is the task
undertaken here, drawing on the decomposition approaches set out above.
3. The Tax and Benefit Systems in the Crisis Countries
There is considerable heterogeneity across EU countries in the level of stabilisation inherent
in the tax and benefit systems. In response to a simulated proportional shock to market
incomes or an increase in unemployment, (Dolls et al. (2012) found that the overall
stabilisation of disposable incomes ranged from 25 per cent to 56 per cent of the overall
change in market incomes. Variation in tax-benefit design can, therefore, have different
implications for the automatic response to income or unemployment shocks. In this section,
we briefly discuss some of the key features of the tax-benefit systems in each of the countries
analysed. We also summarise the key reforms to each of the systems implemented during the
2007 to 2013 period.
3.1 Social Protection
A significant degree of variation exists in the targeting of social protection expenditure across
countries. The sub-panels of Figure 2 show the proportion of total social protection
expenditure by social protection function. Unemployment supports (in the left-hand panel of
Figure 2) represent a significantly higher proportion of total social protection expenditure in
Ireland and Spain than the other three countries analysed here, particularly during the
recession. With a pre-crisis unemployment rate of 4.5 per cent, Ireland spent 8 to 9 per cent
of its social expenditure budget on unemployment supports. Spain spent approximately 10
per cent of its social protection budget on unemployment supports in the pre-crisis years.
During the crisis, expenditure on unemployment benefits increased significantly in Ireland
and Spain due to the increase in unemployment, even though cuts were made to the rate of
unemployment benefits paid in both countries. Despite similar increases in unemployment in
Greece and Portugal, there is very little evidence of a resulting increase in unemployment
10 If the nature of the market income shock means that more people actually move into retirement afterwards or
become eligible to higher means tested payments, this effect will be strengthened.

11
benefit expenditure due to combination of strict eligibility conditions and reductions in the
value of the payments during the austerity period. Ireland also devoted a significantly higher
proportion of its social protection budget to Family and Children state supports than the other
countries (see also Table 4 in Section 4.1), a pattern that remains consistent throughout the
recession.
The right-hand panel of Figure 2 shows that the pension system is the primary form of social
protection available in Greece and Italy, with approximately half of total social protection
expenditure spent on old-age payments. A further 8-10 per cent of social protection
expenditure in these two countries goes on survivor payments. Before the onset of recession
in Greece, the standard retirement age was 65 for men and 60 for women. However, a
number of exceptions applied, including a reduced pension available to those with 15 years of
social insurance contributions, and a number of “hazardous” occupations with entitlement to
a full pension up to five years before “standard” occupations.11 Austerity measures
introduced in Greece included an increase in the retirement age by up to 7 years with
immediate effect, large reductions in pension payments, and a reduction in the number of
occupations classified as hazardous. Similar reforms were implemented in Italy, with the
retirement age increased by up to 5 years, though the increase in this case was phased in over
a number of years. At the other end of the scale, Ireland had the lowest proportion of social
protection expenditure devoted to old-age payments. Pre-crisis, just over 20 per cent of social
expenditure was on old-age payments, increasing to about 25 per cent from 2010 onwards.
Rates of payment of state pensions in Ireland were largely unaffected by austerity measures,
though there was an immediate rise in the effective state pension age and a time path for
future increases was announced.
3.2 Income Taxes and Social Security Contributions
Each of the countries analysed here has a tax-benefit system which is progressively
structured, whereby the marginal effective tax rate increases with income. Some important
differences exist across the countries and over time however. Table 2 compares the top
income tax rate and social security contributions (the “all-in rate”) in each country over time.
Pre-crisis, the top “all-in” rate varied from between 43 per cent in Spain to 50.7 per cent in
Italy. This increased in all countries by 2011, apart from Italy. By 2013, the top tax rate had
decreased below its pre-crisis rate in Greece. No change occurred in Ireland and Italy while a
further increase can be observed in Portugal and Spain.
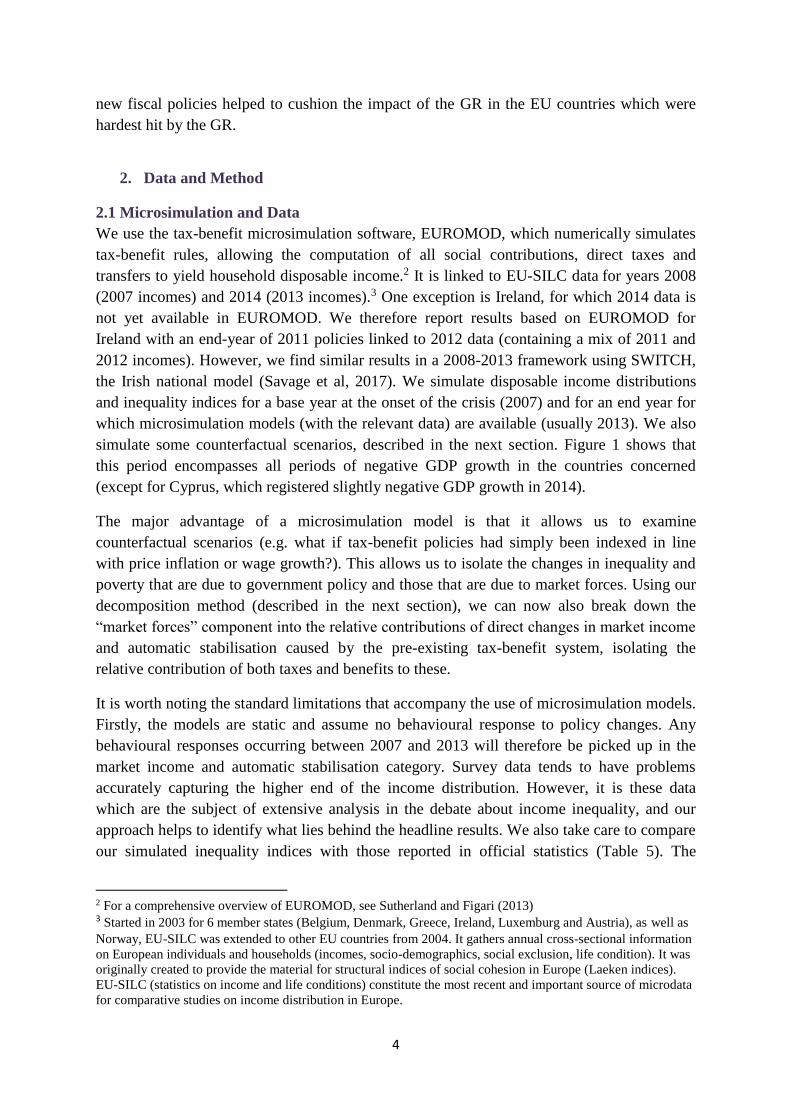
Table 3 shows that average tax and social security rates (ATRs) increased with gross wages
in all countries. The difference between the ATR at 67 per cent of the average wage and 167
of the average wage is largest in Ireland, the result of the relatively low threshold at which the
top rate of income tax is paid in the Irish tax system. Between 2007 and 2013, the ATR
increased across the earnings distribution in all five countries, particularly in Ireland and
Portugal.
11 In 2006, over 30 per cent of contributors to the primary private sector fund (IKA) were in “hazardous”
occupations (Leventi et al., 2010).

12
Figure 2: Unemployment benefit and old age benefit expenditure as a percentage of
total social protection expenditure
Source: Eurostat
Table 2 Top personal income tax & employee social security contributions (All-in rate)
2007 2011 2013
Greece 49.6 57.3 46.0
Ireland 43.6 52.0 52.0
Italy 50.7 47.3 47.3
Portugal 48.4 55.5 61.3
Spain 43.0 45.0 52.0
Source: OECD
0
2
4
6
8
10
12
14
16
18
2004 2005 2006 2007 2008 2009 2010 2011 2012 2013
% o
f to
tal s
oci
al p
rote
ctio
n
exp
en
dit
ture
Unemployment benefit
0
10
20
30
40
50
60
2004 2005 2006 2007 2008 2009 2010 2011 2012 2013
Old age benefit
IE
EL
ES
IT
PT
13
Table 3: Average income tax and social security contribution rate for singles, by
percentage of average wage
Proportion of average
gross disposable income: 67% 100% 133% 167%
2007
Greece 19 26 29 33
Ireland 6 14 21 26
Italy 25 29 33 36
Portugal 17 22 26 29
Spain 16 21 24 25
2013
Greece 20 26 31 35
Ireland 13 20 28 33
Italy 27 31 35 38
Portugal 20 27 31 35
Spain 18 23 26 28
Source: OECD
4. The Evolution of Income Inequality over the Great Recession
This section examines changes in the labour market, in income and in income inequality
observed in our selection of countries during the GR. We first look at how the labour market
structure of the population, as well as the level of income, changed between the base and end
periods. We then decompose the changes in a number of inequality indices over the crisis into
the relative contributions of market income, discretionary policy and automatic stabilisation.
Finding that the automatic stabilisation properties of benefits contributed the most to
stabilising inequality during the crisis, we further decompose this factor into the relative
contribution of the most important benefits in each economy (unemployment and old-age
benefits) to get a more detailed picture of what parts of the benefit system made the largest
contribution to stabilising inequality in the crisis countries. As shown in the next sub-section,
the crisis was one of strong increases in unemployment and reductions in market income,
factors which affect the working age population more than, for example, the older population.
Therefore, in a final step, we repeat the exercise for the working age population to zone in on
the drivers of inequality for this important demographic group.
4.1 Summary statistics
Using EUROMOD policies from before and after the crisis, linked to the relevant EU-SILC
data, Table 4 shows how labour market behaviour, income, taxes and benefits have evolved
in the crisis countries over the crisis period.

14
Table 4: Labour market status and income in crisis countries in base and end periods
Mean N Mean N Mean N Mean N Mean N Mean N Mean N Mean N Mean N Mean N
A. Household monthly
income (excluding 0s)
Market income 2,626 0.91 2,407 0.93 2,548 0.85 1,794 0.80 5,064 0.89 4,385 0.83 2,077 0.87 1,871 0.84 3,174 0.91 3,014 0.91
Benefits 855 0.58 1,006 0.72 982 0.55 716 0.79 1,247 0.89 1,163 0.91 488 0.88 651 0.76 1,126 0.78 1,253 0.76
unemployment 367 0.11 406 0.34 199 0.07 235 0.08 757 0.23 820 0.34 375 0.07 372 0.13 285 0.11 328 0.15
old age benefits 1,165 0.34 1,466 0.35 1,227 0.40 1,146 0.45 1,178 0.20 1,355 0.18 831 0.40 955 0.40 1,612 0.43 1,841 0.42
other 193 0.30 214 0.36 114 0.26 86 0.45 844 0.82 658 0.81 109 0.61 130 0.46 276 0.54 255 0.52
Tax 379 0.77 497 0.75 345 0.60 249 0.88 1,020 0.75 947 0.83 299 0.78 347 0.82 726 0.96 770 0.91
Employee social security 164 0.79 157 0.77 286 0.84 207 0.82 324 0.66 404 0.59 215 0.76 210 0.74 291 0.69 311 0.62
Self-employed social
security 256 0.17 217 0.19 198 0.35 266 0.28 104 0.42 68 0.26 172 0.14 347 0.05 311 0.28 289 0.29
Disposable income 2,414 1.00 2,435 1.00 2,191 1.00 1,541 1.00 4,601 1.00 3,667 1.00 1,811 1.00 1,603 1.00 2,792 1.00 2,728 1.00
B. Individual labour
Market Status
School 0.21 0.22 0.21 0.21 0.30 0.30 0.21 0.22 0.21 0.21
Employee 0.37 0.30 0.28 0.21 0.34 0.30 0.38 0.34 0.29 0.29
Self-employed 0.07 0.06 0.14 0.11 0.07 0.05 0.09 0.05 0.09 0.08
Unemployed 0.06 0.14 0.04 0.13 0.05 0.09 0.05 0.11 0.04 0.07
Inactive 0.14 0.11 0.13 0.12 0.14 0.12 0.08 0.05 0.16 0.16
Disabled 0.02 0.02 0.01 0.01 0.04 0.04 0.01 0.02 0.01 0.01
Pensioner 0.13 0.14 0.18 0.21 0.07 0.09 0.18 0.22 0.19 0.18
Over-65's 0.16 0.18 0.18 0.20 0.11 0.12 0.17 0.20 0.20 0.21
Base End Base End Base End Base End Base End
Results based on own simulations using EUROMOD linked to EU-SILC data for the base (2007) and end (2011 for Ireland and 2013 for all other countries) periods.
Monthly income is averaged over households with non-zero values for the specific income type. In panel A, Column "N" shows the proportion of household which are
repicients in the total population. In panel B, column "N" shows the propotion of individuals in each category of the population.
Spain Greece Ireland Portugal Italy

15
Panel A in Table 4 shows average income, tax and transfer statistics for households in each
country in the base and end period. These exclude zeros. The proportion of households
recording a non-zero value for each component of disposable income is also shown. Monthly
market income decreases sharply between the base and end periods. The proportion of
households receiving market income also declines in Greece, Ireland and Portugal. The level
of unemployment benefit received increases slightly in most countries but the proportion of
households in receipt of unemployment benefit increases substantially in Ireland and Spain.
The level of old age benefits received by households also increases (or stays stable) but the
proportion of household in receipt of this type of welfare varies considerably from a low of
20% in Ireland in 2007 to a high of 43% in Italy in the same year. “Other” benefits play a
relatively small role as their monetary value is quite low across countries, apart from Ireland,
where the role of family benefits is quite important. In terms of taxation, the average level of
tax paid by household increases in Spain, Italy and Portugal and decreases in Greece and
Ireland. However, the proportion of households paying income tax increases substantially in
Greece, Ireland and Portugal. These developments in welfare and taxation incidence and
amount reflect both the automatic stabilisation properties of the base period tax and benefit
system and the discretionary changes to the system enacted to stabilise public finances.
Panel B in Table 4 categorises individuals by their labour market status. The most notable
shifts between the base and end period are out of employment and into unemployment.
Employment probabilities are stable in Italy but decrease in all other countries from between
3 to 7 ppt. Unemployment probabilities increase by between 3 and 9 ppt across countries. In
most countries, the probability of being self-employed also decreases over the crisis period
while the proportion of pensioners increases.
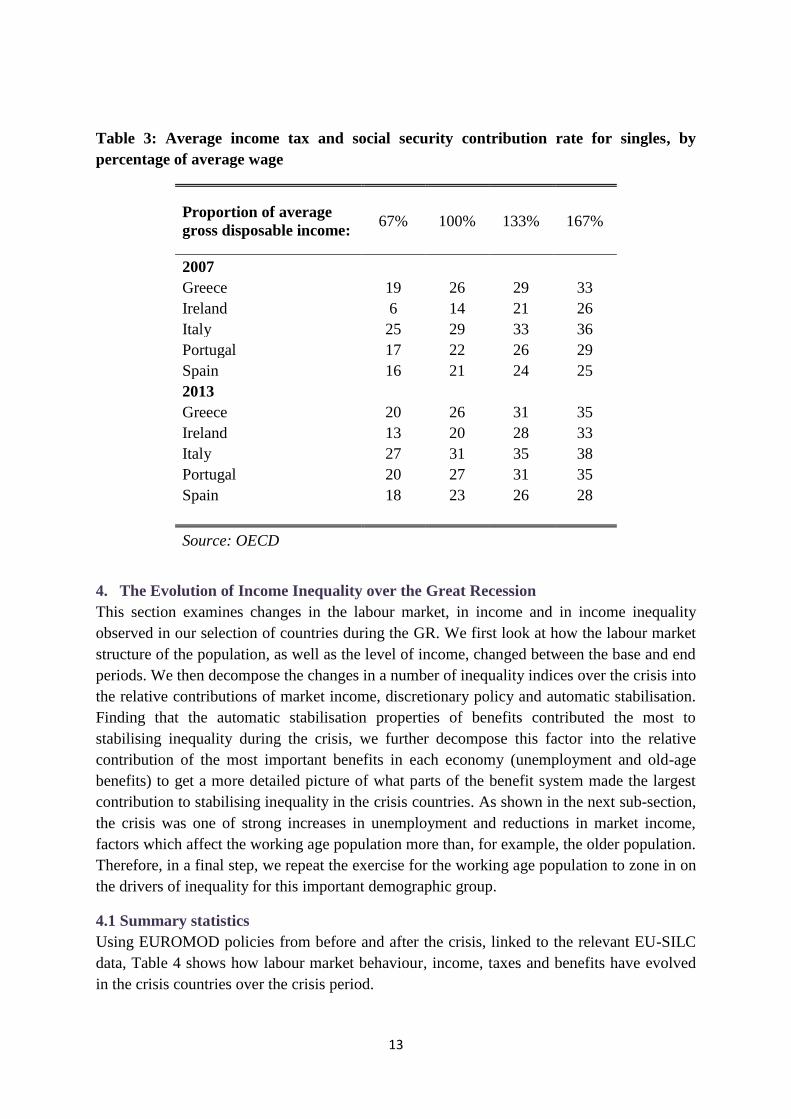
As explained in Section 2.1, the use of a simulated baseline is essential to allow the
construction of counterfactual scenarios. To ensure that our simulations are “good enough” to
sustain the analysis, we compare the simulations to results from actual survey data. Table 5
shows how Gini coefficients for market and disposable incomes, calculated using
EUROMOD, evolved between the base and end periods. These are compared to external
figures from Eurostat/OECD and show good validity both in terms of magnitude and
direction of change. As discussed in Section 2.1, the exception to this is Cyprus and, for this
reason, we exclude Cyprus from the remainder of the analysis.
The Gini index of market income inequality has increased substantially in all the countries
studied. The largest increases are recorded in Spain, where the market income Gini increased
by around 8 points. This increase is followed closely by Greece (recording an increase of 6
points) and then by Ireland, Italy and Portugal (a 3-4 point increase). Despite increases in the
market income Gini in every country, the disposable income Gini only increased substantially
in Spain (4 points). Greece and Italy experienced smaller increases in disposable income
inequality with the Gini coefficient increasing by 1-2 points between 2007 and 2013.
Disposable income inequality in Ireland and Portugal actually fell slightly over the period
examined, by 1-2 points.
16
The five “crisis countries” we study all experienced a substantial rise in market income
inequality, as measured by the Gini index, during the GR. However, while Spain and Italy
also registered large increases in disposable income inequality, Greece, Ireland and Portugal
experienced relatively stable or falling disposable income inequality. Clearly, the tax-benefit
systems of the latter countries were more effective in cushioning the effects of rising market
inequality during the GR. The question of whether this was due to the automatic stabilisation
capacities of these systems or due to discretionary policies implemented over the course of
the GR is tackled in the next section.
Table 5: Comparison between simulated and official figures for inequality in crisis
countries in the base and end period
5. Decomposing the change in income inequality during the crisis
5.1 The role of market income, discretionary policy and automatic stabilisation
The distributional impact of tax-transfer systems can change due to explicit discretionary
changes in tax-benefit policies (e.g., higher tax rates or lower welfare payment rates). But the
distributional impact may also be substantially affected by how the tax-benefit system
interacts with changes in the underlying population and distribution of income (e.g., an
increased expenditure on state transfers due to a higher proportion of pensioners, or increased
unemployment).13 We use the decomposition elaborated in Section 2 to decompose the
change in disposable income inequality measured by the Gini coefficient into the relative
contributions of market income changes, discretionary policy changes and automatic
stabilisation. We also examine two further indices of inequality, the 75/25 percentile ratio
(the ratio between the seventy-fifth and the twenty-fifth centile of equivalised disposable
13 This has long been recognised in the literature on tax progressivity; see, for example, Lambert and Thoresen
(2009).
Base End Base End
Gini (market income)
Greece 0.51 0.58 0.50 0.57
Spain 0.45 0.53 0.45 0.53
Ireland 0.50 0.54 0.51 0.57
Portugal 0.53 0.57 0.52 0.56
Cyprus 0.38 0.46 - -
Italy 0.50 0.53 0.49 0.52
Gini (disposable income)
Greece 0.33 0.34 0.33 0.35
Spain 0.29 0.34 0.31 0.35
Ireland 0.28 0.27 0.31 0.32
Portugal 0.35 0.33 0.36 0.34
Cyprus 0.27 0.34 0.30 0.32
Italy 0.30 0.32 0.32 0.33
Eurostat/OECDEUROMOD
Indices are calculated using 2007 EUROMOD policies linked to 2008
data (base period) and 2013 (2011 for Ireland) EUROMOD policies
linked to 2014 (2012 for Ireland) data (end period). Incomes are
equivalised using the OECD equivalence scale.

17
income) and the Generalised Entropy Index GE(2) which is equivalent to half the coefficient
of variation.14 The GE(2) is more sensitive to differences in income shares among the rich,
while the Gini coefficient is more sensitive to changes in the middle of the income
distribution. The 75/25 percentile ratio is concerned with inequality between the medium-rich
and the medium-poor. This range of indices sheds light in a comprehensive manner on
changes in income inequality.
Results are displayed in Figure 3 and are also detailed in Table 6 in the Appendix. The black
diamonds in Figure 3 depict the total change in each index over the period in question while
the different coloured bars indicate the relative contribution of market income changes,
discretionary policy (DP) and automatic stabilisation (AS). Within these last two categories,
we distinguish between the effect of taxes and benefits separately. The AS effect is split into
Automatic Benefit Stabilisation (ABS) and Automatic Tax Stabilisation (ATS). Likewise, the
DP effect is split into Discretionary Tax Policy (DTP) and Discretionary Benefit Policy
(DBP).
Looking firstly at the Gini index in the upper panel of Figure 3, immediately evident is the
fact that changes in market income worked to increase inequality during the GR. This was
also apparent from Table 5. This is particularly true in Greece and Spain where the market
income effect is quite large. However, in all countries, changes in market income increased
inequality. Turning next to discretionary policy, we find that the effect of discretionary
changes to tax policy was somewhat inequality reducing in all countries but Greece. This
effect is likely to be driven by the fact that all the countries studied, particularly Ireland and
Portugal, increased the progressivity of their taxation systems during the crisis (Table 3).
Discretionary changes to benefits during the crisis, on the other hand, had no discernible
effect on inequality.
Looking next at automatic stabilisation, we find that this property of the tax-benefit system
made a substantial contribution to decreasing inequality in all countries. In each country, the
effect of AS is larger than that of DP and, in some countries (Portugal, Greece and Ireland),
its magnitude is comparable to that of market income changes. The automatic stabilising
effect of benefits dominated. In Portugal, Ireland, Greece and Italy, existing benefits
cushioned the shock to market income to the extent that inequality decreased or was
relatively stable between the beginning and the end of the crisis. In Spain, the existing
benefits system also cushioned inequality but not to the same extent, with the result that the
Gini index increased by 4 points.
We turn next to the P75/25 ratio, shown in the middle panel of Figure 3. The P75/25 ratio
measures inequality in the middle of the income distribution. Like the Gini index, the only
country to experience an increase in the P75/25 index during the crisis was Spain. There are
many similarities between the contributors to changes in the Gini index and changes in the
P75/25 ratio. Market income played the biggest role, increasing this measure of inequality in
14 The reason for focusing on these three measures is that they are capable of dealing with zero or negative
incomes, which is necessary for our decomposition framework. In principle, other measures of inequality or
poverty with similar properties could also be used.

18
all countries. Market income shocks were counteracted by ABS. Only in Spain, did ABS not
completely counteract market income changes.
Finally, we focus on another family of inequality measures, the General Entropy measure
which includes the GE(2) index. The GE indices measure non-randomness or data
compression and the GE(2) index puts more weight on differences between welfare levels
higher up in the distribution than lower down in the distribution. The change in the GE(2)
measure is depicted in the lower panel of Figure 3. This measure of inequality decreased in
Portugal and Ireland, was stable in Italy and Greece and increased in Spain between the base
and end periods. Decomposing the changes to this index, we find that it was less sensitive
than other measures to the changes in market income experienced in Portugal and Ireland
during the crisis but still increased in response to market income shocks in Greece and Spain.
As with the other measures of inequality, in all countries the automatic stabilising effect of
benefits do the most to counteract increases in inequality as measured by this index.
We find little effect of either automatic tax stabilisation or discretionary benefit policy on any
measure of inequality. Taking the example of a 10 per cent market income shock and
disregarding any welfare benefits, a progressive tax system stabilises the top of the income
distribution more than the bottom of the income distribution, which is likely to increase
income inequality in the process. Therefore, ATS is not a channel through which we might
expect much inequality stabilisation. In terms of DBP, most discretionary changes to welfare
benefits over the period aimed to reduce the total welfare bill and included increases in the
state pension age (Greece, Italy and Ireland), cuts to unemployment benefits (Ireland, Spain,
Greece and Portugal) and more stringent eligibility criteria for unemployment benefits
(Greece and Portugal). However, as market income, wages and CPI fell or increased very
slowly over the recession period, some of these cuts in welfare payments would have seen
welfare incomes fall in line with other incomes. Our estimations show that, relative to other
factors, these discretionary benefit measures had little effect on inequality measures although
they undoubtedly reduced average income.
To summarise, we find that countries in which disposable income inequality changed little or
decreased over the course of the crisis are not necessarily those with the least change to
market income inequality. Rather, the combination of the existing welfare system (ABS) and,
to a lesser extent, changes in taxation rules (DTP), counteracted increased market income
inequality more in some countries than others. This highlights the importance of the
automatic stabilisation properties of tax-benefit systems in alleviating unexpected market
shocks to income inequality. It is noteworthy that this finding applies both to countries which
have been characterised as having a distinctive Southern European variant of the welfare
state, and to Ireland, which is often seen as closer to the liberal model of the UK.
5.2 The role of benefits in stabilising inequality
Results from the previous section indicate that the automatic stabilisation property of benefits
played the largest role in cushioning inequality during the crisis. In this section, we
investigate the relative role of the two main benefits in operation in the countries examined,
old age benefits and unemployment benefits. From Table 4, we note that unemployment

19
benefits and old-age benefits account for the vast majority of benefits across countries and
time. The exception to this is Ireland, a country in which a larger proportion of social
protection expenditure is used for family transfers (universal child benefit, in-work benefits,
lone parent allowance, etc.). However, even in Ireland old-age benefits and unemployment
benefits combined account for around half of all transfers. In our analysis, unemployment
benefits include both contributory and non-contributory benefits but exclude social assistance
(minimum income style benefits). Old age benefits also included both contributory and non-
contributory pensions, including disability pensions and survivor’s benefits. Private pensions
are not included in this category as they form part of market income. All other benefits are
captured by the “other” category.
A decomposition of the ABS effect into the role of specific benefits is shown in Figure 4 and
detailed in Table 7 in the Appendix. The diamond points in Figure 4 show the size of the
ABS effect, represented by the light grey bar in Figure 3. From the top panel of Figure 4, we
see that base-period benefits stabilised the Gini index by between 1 and 6 percentage points
across countries. The drivers of this stabilisation effect vary. Portugal, Greece and Italy,
whose spending on old-age benefits is high relative to other supports (Figure 2 and Table 4)
owe most of this effect to old-age benefits. In Ireland and Spain, where unemployment
supports represented a large and increasing proportion of social protection during the crisis,
unemployment benefits are more important in redistribution. Similar patterns can be observed
in the middle and lower panels of Figure 4 which depict the effect of ABS on the P75/25 ratio
and the GE(2) index respectively. Old-age benefits prove to be the main source of
stabilisation of both the P75/25 ratio and the GE(2) in Portugal, Greece and Italy. Looking at
the P75/25 index, unemployment benefits and old-age benefit play an equally important role
in stabilising income inequality in Ireland and Spain. The same is true for the GE(2) index for
Spain while unemployment benefits do all the work in stabilising this index in Ireland.
5.3 The working age population
Given the crisis was one that greatly impacted employment rates and market income, the
finding that old-age benefits cushioned its effect on income inequality in several crisis
countries deserves a little more attention. We judge that this finding is likely to be at least
partly due to difference in household composition across countries, with southern European
households more likely to have at least one pensioner in each household (Table 4).

20
Figure 3: Decomposition of the change in inequality indices into the contribution of
market income, discretionary policy and automatic stabilisation over the crisis period
Note: Own calculations from base year EUROMOD policies and income data (2007 for all countries) and end
year EUROMOD policies and income data (2013 for all countries except Ireland, for which the end year is
2011).
th
-0.08
-0.06
-0.04
-0.02
0.00
0.02
0.04
0.06
0.08
0.10
Portugal Ireland Greece Italy Spain
Ch
ange
in G
ini
Gini Index MarketIncome
DiscretionaryPolicy Benefits
DiscretionaryPolicy Taxes
AutomaticStabilisationBenefits
AutomaticStabilisationTaxes
Total change
-0.40
-0.30
-0.20
-0.10
0.00
0.10
0.20
0.30
0.40
0.50
Portugal Ireland Greece Italy Spain
Ch
ange
in G
E(2
)
GE(2) Index MarketIncome
DiscretionaryPolicy Benefits
DiscretionaryPolicy Taxes
AutomaticStabilisationBenefits
AutomaticStabilisationTaxes
Total change
-6.00
-4.00
-2.00
0.00
2.00
4.00
6.00
Portugal Ireland Greece Italy Spain
Ch
ange
in P
75
25
P7525 MarketIncome
DiscretionaryPolicy Benefits
DiscretionaryPolicy Taxes
AutomaticStabilisationBenefitsAutomaticStabilisationTaxesTotal change

21
Figure 4 Decomposition of the automatic stabilisation effect of benefits into its relevant
components over the crisis period
Note: Own calculations from base year EUROMOD policies and income data (2007 for all countries) and end
year EUROMOD policies and income data (2013 for all countries except Ireland, for which the end year is
2011).
th
-0.07
-0.06
-0.05
-0.04
-0.03
-0.02
-0.01
0.00
0.01
Portugal Ireland Greece Italy Spain
Ch
ange
in G
ini
Gini Index AS Other
AS Old agebenefit
ASUnemploymentbenefit
Total ABS
-0.30
-0.25
-0.20
-0.15
-0.10
-0.05
0.00
0.05
0.10
Portugal Ireland Greece Italy Spain
Ch
ange
in G
E(2
)
GE(2) Index Total ABS
ASUnemployment benefit
AS Old agebenefit
AS Other
-10.00
-8.00
-6.00
-4.00
-2.00
0.00
2.00
4.00
Portugal Ireland Greece Italy Spain
Ch
ange
in P
75
25
P7525AS Other
AS Old agebenefit
ASUnemploymentbenefit
Total ABS

22
The question of whether household members pool income among themselves is a much
debated one but it is generally accepted that ignoring the dynamics within a household can
lead to a flawed understanding of inequality in the population as a whole (Chiappori &
Meghir, 2014). The majority of analyses of income distribution are carried out at the
household level under the assumption that income is fully shared or “pooled” so that all
household members enjoy the same standard of living. This unitary model of family
behaviour is often an appropriate way to characterise household income sharing but non-
unitary models of family behaviour, which posit some form of bargaining or negotiation
within the family, challenge this unitary approach and have been shown to have some validity
(Lundberg et al., 1997; Browning et al., 2010; Watson et al, 2013). If there is limited income
pooling, particularly intergenerational income pooling, within households, the finding that
old-age benefits stabilised income inequality in Portugal, Greece and Italy is to be interpreted
with caution. We try to abstract from this issue by focusing our attention on the working age
population. That is, we repeat the decomposition exercise for those households in which the
oldest person is under 60 years of age.15 This will give a reflection of how inequality changed
and through which channels for those generally deemed to have been hardest hit by the
recession.
Results are displayed in Figures 5 and 6 (and detailed in Tables 8 and 9 in the Appendix).
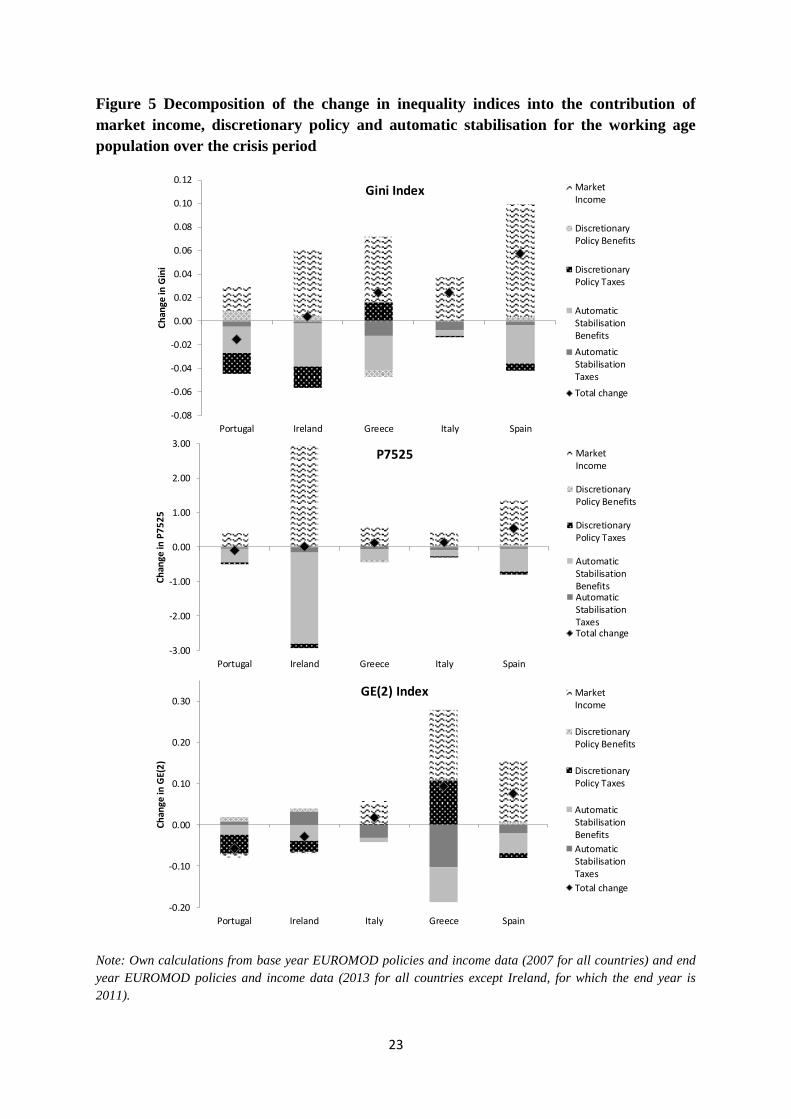
The top panel of Figure 5 shows that the Gini Index for the working age population decreased
by 2 points in Portugal, was stable in Ireland and increased in Greece, Italy and Spain. As
was the case for the whole population, market income changes increased inequality in all
countries but particularly in Ireland, Greece and Spain. In Portugal and Ireland, DTP and
ABS reversed or counteracted this increase. ABS also counteracted some of the increase in
market income inequality in Greece and Spain but not by enough to keep the Gini Index
constant. Comparing to results for the whole population (Figure 3), we note that the
magnitude of ABS is lower for the working age population in Portugal, Greece and Italy and
this results in an overall increase in income inequality for this demographic group in these
countries.
The middle panel of Figure 5 shows the contributions of discretionary policy and automatic
stabilisation to the evolution of the P75/25 ratio of the working age population. While this
was found to be constant for the population as a whole between the beginning and the end of
the recession everywhere but Spain, within the working age population, this index has
increased slightly for Greece and Italy and more substantially for Spain. In general ABS,
which completely counteracts the increase in the p75/25 ratio brought about by market
income changes for the whole population, is slightly weaker in counteracting the increase for
the working age population, particularly in Spain.
15 The retirement age in each of the countries studied was as follows. Greece - 65 (men), 60(women); Spain –
65; Ireland – 65; Italy – 65 (men), 60 (women); Portugal – 65.
23
Figure 5 Decomposition of the change in inequality indices into the contribution of
market income, discretionary policy and automatic stabilisation for the working age
population over the crisis period
Note: Own calculations from base year EUROMOD policies and income data (2007 for all countries) and end
year EUROMOD policies and income data (2013 for all countries except Ireland, for which the end year is
2011).
th
-0.08
-0.06
-0.04
-0.02
0.00
0.02
0.04
0.06
0.08
0.10
0.12
Portugal Ireland Greece Italy Spain
Ch
ange
in G
ini
Gini Index MarketIncome
DiscretionaryPolicy Benefits
DiscretionaryPolicy Taxes
AutomaticStabilisationBenefits
AutomaticStabilisationTaxes
Total change
-0.20
-0.10
0.00
0.10
0.20
0.30
Portugal Ireland Italy Greece Spain
Ch
ange
in G
E(2
)
GE(2) Index MarketIncome
DiscretionaryPolicy Benefits
DiscretionaryPolicy Taxes
AutomaticStabilisationBenefits
AutomaticStabilisationTaxes
Total change
-3.00
-2.00
-1.00
0.00
1.00
2.00
3.00
Portugal Ireland Greece Italy Spain
Ch
ange
in P
75
25
P7525 MarketIncome
DiscretionaryPolicy Benefits
DiscretionaryPolicy Taxes
AutomaticStabilisationBenefitsAutomaticStabilisationTaxesTotal change

24
Figure 6: Decomposition of the automatic stabilisation effect of benefits into its relevant
components for the working age population over the crisis period
Note: Own calculations from base year EUROMOD policies and income data (2007 for all countries) and end
year EUROMOD policies and income data (2013 for all countries except Ireland, for which the end year is
2011).
th
-0.08
-0.06
-0.04
-0.02
0.00
0.02
0.04
0.06
Portugal Ireland Greece Italy Spain
Ch
ange
in
Gin
iGini Index AS Other
AS Old agebenefit
ASUnemployme
nt benefit
Total ASbenefits
-0.20
-0.15
-0.10
-0.05
0.00
0.05
0.10
0.15
Portugal Ireland Greece Italy Spain
Ch
ange
in
GE(
2)
GE(2) Index AS Other
AS Old agebenefit
ASUnemploym
ent benefit
Total ASbenefits
-5.50
-4.50
-3.50
-2.50
-1.50
-0.50
0.50
1.50
2.50
3.50
Portugal Ireland Greece Italy Spain
Ch
ange
in
P7
52
5
P7525 AS Other
AS Old agebenefit
ASUnemploym
ent benefit
Total ASbenefits
25
We turn lastly to the GE(2) index in the bottom panel of Figure 5. While the magnitude and
patterns of change to this index are generally similar for the whole population and for the
working age population, Greece stands out as an exception. The GE(2) index increased more
dramatically in Greece for the working age population and this can be attributed to the fact
that ABS was weaker at counteracting increases to market income inequality for this group of
the population.
The breakdown of the total ABS effect for the working age population into the relative
contributions of old age benefits, unemployment supports and other benefits is displayed in
Figure 6. In general, old age benefits play a much less important role in ABS for the working
age population. This is to be expected as the only pension-type benefits that this population
should be entitled to are pre-retirement age disability pensions. Like for the case of the
whole population, unemployment supports make up a large part of the ABS effect for Ireland
and Spain. However, these types of benefits do not substantially stabilise inequality in
Greece, Portugal or Italy. In some cases, they are seen to increase inequality further rather
than decrease it.
6. Conclusions
The impact of the Great Recession and associated austerity policies on poverty and inequality
in OECD countries is of central interest, not least considering the political turmoil and rise of
populism to which it may be contributing. Much of the emphasis in research and debate about
inequality and fiscal adjustment focuses on discretionary changes in tax and transfer system
parameters, explored via tax-benefit simulation models. However, the ‘automatic’ stabiliser
effects as the tax and transfer systems respond to changes in household incomes and
employment levels also play a central role.
Applying and extending a new approach developed by Savage et al. (2017), we show that
automatic stabilisation played a large role in shaping income distributions in “crisis”
countries over the course of the Great Recession. Disposable income inequality fell or was
stable in every country but Spain. This was largely due to the automatic stabilising effect of
the benefits system. The effect of old-age benefits and unemployment benefits, which
account for most of social protection expenditure in these countries, was found to vary.
Countries which devoted more resources to unemployment supports, such as Ireland and
Spain, were also those in which unemployment protection played an important role in
cushioning inequality. Old–age benefits were important stabilisers in all countries but were
most important in countries which devoted a larger share of their social protection
expenditure to old-age supports. Ireland and Spain’s income distributions were mainly
cushioned by unemployment supports while old-age benefits played an important role in
Greece, Italy and Portugal. Overall, across countries, automatic stabilisation, particularly
through the benefits system, played a larger role than discretionary policy in reducing
inequality, highlighting the importance of a well-designed tax-benefit system in dealing with
unexpected market shocks. One important implication of this is that, in implementing
discretionary policy, policy-makers should consider the extent to which it changes the
existing automatic stabilisation property of a tax-benefit system.

26
Given that the crisis severely impacted employment and market income, the channels through
which income inequality for the working age population evolved are also of interest.
Focussing on the working age population also negates concerns that old-age benefits may not
be subject to similar income pooling to other income sources. Estimations for the working
age population find that disposable income inequality increased in Greece, Italy and Spain
but was stable in Portugal and Ireland. Cross-country comparisons indicate that discretionary
tax policy and a larger degree of automatic benefit stabilisation in Portugal and Ireland
cushioned income inequality for the working age population. Due to the lack of a strong
unemployment support system, a smaller role was played by benefits in stabilising income
inequality in Greece, Italy and Spain for this demographic group. Commonly used inequality
measures assume full income pooling between household members. Although it is generally
accepted that married couples pool most of their income, less is known about how income is
pooled between working age household members and retired household members. Our results
invite a more cautious interpretation of the stable headline inequality indices in most of the
crisis countries during the Great Recession.

27
References
Atkinson, A. & Brandolini, A. (2006), “From earnings dispersion to income
inequality.” In: Farina, Francesco and Savaglio, Ernesto, (eds.) Inequality and Economic
Integration. Routledge Siena studies in political economy. Routledge, London, UK, pp. 35-
62.
Bargain, O., 2012. "Decomposition analysis of distributive policies using behavioural
simulations," International Tax and Public Finance, Springer; International Institute of
Public Finance, vol. 19(5), pages 708-731, October.
Bargain, O. and T. Callan, “Analysing the effects of tax-benefit reforms on income
distribution: a decomposition approach,” Journal of Economic Inequality, vol. 8(1), 1-21,
2010.
Bargain, O., Callan, T., Doorley, K. and Keane, C. (2017), “Changes in Income Distributions
and the Role of Tax-benefit Policy During the Great Recession: An International
Perspective”, Fiscal Studies, Institute for Fiscal Studies, vol. 38, pages 559-585, December.
Browning, M., P-A. Chiappori and V. Lechene, 2010. "Distributional Effects in Household
Models: Separate Spheres and Income Pooling," Economic Journal, Royal Economic Society,
vol. 120(545), pages 786-799, 06.
Ceriani L., Fiorio C., and C. Gigliarano (2013) 'The importance of choosing the data set for
taxbenefit analysis', The International Journal of Microsimulation 6(1): 86-121.
Chiappori, P. & C. Meghir, 2014. "Intrahousehold Inequality," NBER Working Papers
20191, National Bureau of Economic Research, Inc.
Cowell, F. and Fiorio, C. (2011). Inequality decompositions—a reconciliation. Journal of
Economic Inequality, 9(4):509–528.
Creedy, J. & N. Hérault, 2015. "Decomposing Inequality Changes: Allowing for Leisure in the
Evaluation of Tax and Transfer Policy Effects," Fiscal Studies, Institute for Fiscal Studies, vol. 36,
pages 157-180, June.
Decoster, A., R. Ochmann, and K. Spiritus. “Integrating VAT into Euromod. Documentation
and Results for Belgium” EUROMOD Working Paper Series 12/14, 2014
Dolls, M., C. Fuest and A. Peichl “Automatic stablizers and economic crisis: US vs Europe”,
Journal of Public Economics, Vol. 96, pp.279-294, 2012
Dolls, M., C. Fuest, A. Peichl and C. Wittneben, “Crisis, Austerity and Automatic
Stabilization”, unpublished manuscript, 2017.
European Commission (2017), Impact of fiscal policy on income distribution, Report on
Public Finances in EMU 2017, 71-131.
28
Funke, M., M. Schularick & C. Trebesch, 2016. "Going to extremes: Politics after financial
crises, 1870–2014," European Economic Review, Elsevier, vol. 88(C), pages 227-260.
Girouard, N. and C. André (2005), "Measuring Cyclically-adjusted Budget Balances for
OECD Countries", OECD Economics Department Working Papers, No. 434, OECD
Publishing, Paris.
Jenkins S.P., A. Brandolini, J. Micklewright, B. Nolan (eds.), “The Great Recession and the
Distribution of Household Income”, Oxford University Press, Oxford, UK, 2013
Kaplanoglou, G. and V.T. Rapanos., “Evolutions in Consumption Inequality and Poverty in
Greece: The Impact of the Crisis and Austerity Policies” Review of Income and Wealth.
doi:10.1111/roiw.12287, 2016
Lambert, P., and T. Thoresen, "Base independence in the analysis of tax policy effects: with
an application to Norway 1992–2004," International Tax and Public Finance, Springer;
International Institute of Public Finance, 16(2), 219-252, 2009
Leventi, C.; M. Matsaganis & P. Tsakloglou, 2010, EUROMOD country report: Greece
2005-2008
Lundberg S., Pollak, R. and Wales, J. (1997). “Do Husbands and Wives Pool Their
Resources? Evidence from the United Kingdom Child Benefit,” Journal of Human
Resources, University of Wisconsin Press, vol. 32(3), pages 463-480.
Matsaganis, M. and C. Leventi “The Distributional Impact of the Greek Crisis in 2010”
Fiscal Studies, 34: 83–108, 2013
OECD. Society at a Glance 2014, OECD, Paris 2014a.
OECD, “Rising inequality: youth and poor fall further behind”, Income Inequality Update,
June, OECD, Paris, 2014b.
Paulus, Alari & Tasseva, Iva Valentinova, 2017a. " Decomposition of changes in the EU
income distribution in 2007-2011," EUROMOD Working Papers EM9/17, EUROMOD at
the Institute for Social and Economic Research.
Paulus, Alari & Tasseva, Iva Valentinova, 2017b. “Europe through the crisis: tax-benefit
policy changes and automatic stabilisers”, unpublished manuscript.
Pestel, N. and E. Sommer, 2017, “Shifting taxes from labor to consumption: More
employment and more inequality,” Review of Income and Wealth 63: 542–563
Savage, M. “Modelling the Impact of Direct and Indirect Taxes Using Complementary
Datasets”, The Economic and Social Review, forthcoming, 2018
Savage, M. & Callan, T. & Nolan, B. & Colgan, B., 2017. "The Great Recession, Austerity
and Inequality: Evidence from Ireland," Review of Income and Wealth, forthcoming.

29
Sologon, D.; Van Kerm, P., Li, J.; & O’Donoghue, C., 2018, Accounting for Differences in
Income Inequality across Countries: Ireland and the United Kingdom., LISER Working Paper
Series 2018-01, LISER.
Sutherland, H. and Figari, F. (2013). EUROMOD: the European Union tax-benefit
microsimulation model. International Journal of Microsimulation, 1(6):4–26.
Watson, D., B. Maitre and S. Cantillon. “Implications of Income Pooling and Household
Decision-making for Poverty and Deprivation: An Analysis of the SILC 2010 Special
Module for Ireland”, Social Inclusion Technical Paper No. 4, Dublin: Department of Social
Protection, 2013.

30
Appendix
Table 6: Decomposition of the change in disposable income inequality between 2007 and
2013 (2011 for Ireland)
Gini Index
Portugal 0.35 -0.02 -5% 0.04 0.00 -0.02 -0.04 0.00
Ireland 0.28 -0.01 -3% 0.04 0.00 -0.02 -0.03 0.00
Greece 0.33 0.00 1% 0.07 -0.01 0.01 -0.06 0.00
Italy 0.31 0.01 4% 0.04 -0.01 0.00 -0.02 0.00
Spain 0.29 0.04 15% 0.08 0.00 -0.01 -0.03 0.00
P90/50
Portugal 2.27 -0.16 -7% 0.29 -0.01 -0.15 -0.30 0.00
Ireland 1.83 0.06 3% 0.60 -0.09 -0.08 -0.37 0.00
Greece 2.01 2.79 138% 0.42 2.80 0.03 -0.45 -0.01
Italy 1.89 0.00 0% 0.28 -0.08 0.01 -0.19 -0.02
Spain 1.87 0.18 10% 0.80 -0.07 -0.03 -0.52 0.01
P75/25
Portugal 2.30 -0.15 -6% 5.45 -0.07 -0.09 -5.36 -0.07
Ireland 2.07 -0.02 -1% 3.83 -0.05 -0.10 -3.71 0.02
Greece 2.19 -0.05 -2% 5.31 -0.03 0.00 -5.50 0.17
Italy 2.04 0.03 2% 2.60 -0.04 -0.02 -2.58 0.07
Spain 2.03 0.30 15% 3.28 -0.04 -0.07 -2.86 -0.01
GE(2)
Portugal 0.31 -0.07 -22% 0.04 0.02 -0.05 -0.08 0.00
Ireland 0.18 -0.04 -24% -0.03 0.04 -0.02 -0.03 0.00
Greece 0.27 0.04 14% 0.26 -0.07 0.08 -0.26 0.04
Italy 0.22 0.00 2% 0.09 -0.04 0.01 -0.06 0.00
Spain 0.15 0.06 40% 0.18 -0.02 -0.01 -0.09 0.00
Indices are calculated using 2007 EUROMOD policies linked to 2008 data (base period) and 2013 (2011 for Ireland)
EUROMOD policies linked to 2014 (2012 for Ireland) data (end period). Incomes are equivalised using the OECD
equivalence scale.
Total
change
(end -
base)
Market
Income
Automatic
Stabilisation
Taxes
Discretionary
Policy Taxes
Automatic
Stabilisation
Benefits
Discretionary
Policy
Benefits
Base
(2007)
%
change

31
Table 7: Decomposition of the automatic stabilising effect of benefits during the crisis
into its relevant components
Other
Gini Index
Portugal -0.04 -0.01 -0.02 -0.01
Ireland -0.03 -0.03 0.00 0.00
Greece -0.06 -0.01 -0.05 0.00
Italy -0.02 0.00 -0.01 0.00
Spain -0.03 -0.03 0.00 0.00
P90/50
Portugal -0.30 -0.08 -0.27 0.05
Ireland -0.37 -0.14 -0.25 0.02
Greece -0.45 0.03 -0.45 -0.03
Italy -0.19 -0.03 -0.19 0.02
Spain -0.52 -0.25 -0.45 0.18
P75/25
Portugal -5.36 -3.20 -5.22 3.06
Ireland -3.71 -3.77 -2.49 2.54
Greece -5.50 -2.51 -5.47 2.48
Italy -2.58 -0.64 -2.51 0.57
Spain -2.86 -1.95 -2.65 1.74
GE(2)
Portugal -0.08 -0.03 -0.06 0.00
Ireland -0.03 -0.06 0.00 0.02
Greece -0.26 -0.02 -0.25 0.01
Italy -0.06 -0.01 -0.05 0.01
Spain -0.09 -0.06 -0.07 0.03
Automatic
Stabilisation
Benefits
Unemployment
benefit Old-age benefit
Indices are calculated using 2007 EUROMOD policies linked to 2008 data (base period) and
2013 (2011 for Ireland) EUROMOD policies linked to 2014 (2012 for Ireland) data (end
period). Incomes are equivalised using the OECD equivalence scale.

32
Table 8: Decomposition of the change in disposable income inequality for the working
age population between 2007 and 2013 (2011 for Ireland)
Gini Index
Portugal 0.35 -0.02 -4% 0.02 0.00 -0.02 -0.02 0.01
Ireland 0.28 0.00 1% 0.06 0.00 -0.02 -0.04 0.00
Greece 0.35 0.02 7% 0.06 -0.01 0.02 -0.03 -0.01
Italy 0.31 0.02 8% 0.04 -0.01 0.00 0.00 0.00
Spain 0.30 0.06 19% 0.10 0.00 -0.01 -0.03 0.00
P90/50
Portugal 2.23 -0.18 -8% -0.03 -0.06 -0.12 0.03 0.01
Ireland 1.78 0.19 11% 0.55 -0.15 -0.08 -0.15 0.03
Greece 1.97 0.15 8% 0.31 -0.04 0.09 -0.18 -0.03
Italy 1.86 0.03 2% 0.15 -0.07 -0.01 -0.02 -0.02
Spain 1.85 0.25 13% 0.52 -0.11 -0.02 -0.15 0.00
P75/25
Portugal 2.27 -0.10 -4% 0.41 -0.05 -0.05 -0.40 -0.02
Ireland 2.07 0.01 0% 2.91 -0.17 -0.12 -2.64 0.02
Greece 2.29 0.12 5% 0.54 -0.07 0.02 -0.32 -0.07
Italy 2.05 0.13 6% 0.39 -0.09 -0.04 -0.17 0.03
Spain 2.03 0.55 27% 1.30 -0.05 -0.08 -0.67 0.05
GE(2)
Portugal 0.29 -0.06 -21% -0.01 0.01 -0.05 -0.02 0.01
Ireland 0.18 -0.03 -17% 0.00 0.03 -0.03 -0.04 0.01
Greece 0.30 0.09 30% 0.17 -0.10 0.11 -0.08 0.00
Italy 0.21 0.02 8% 0.06 -0.03 0.00 -0.01 0.00
Spain 0.15 0.07 49% 0.15 -0.02 -0.01 -0.05 0.00
Indices are calculated using 2007 EUROMOD policies linked to 2008 data (base period) and 2013 (2011 for Ireland)
EUROMOD policies linked to 2014 (2012 for Ireland) data (end period). Incomes are equivalised using the OECD equivalence
scale. The working age population is defined as all households in which the eldest member is less than 60 years of age.
Total
change
(end -
base)
Market
Income
Automatic
Stabilisation
Taxes
Discretionary
Policy Taxes
Automatic
Stabilisation
Benefits
Discretionary
Policy
Benefits
Base
(2007)
%
change

33
Table 9: Decomposition of the automatic stabilising effect of benefits during the crisis
into its relevant components
Other
Gini Index
Portugal -0.02 0.01 0.00 -0.03
Ireland -0.04 -0.05 -0.01 0.02
Greece -0.03 0.00 -0.05 0.02
Italy 0.00 -0.01 -0.01 0.01
Spain -0.03 -0.04 -0.02 0.04
P90/50
Portugal 0.03 0.25 0.06 -0.27
Ireland -0.15 -0.09 -0.20 0.14
Greece -0.18 0.15 -0.34 0.01
Italy -0.02 0.13 -0.03 -0.13
Spain -0.15 0.02 -0.17 0.00
P75/25
Portugal -0.40 1.84 -0.19 -2.04
Ireland -2.64 -2.85 -1.57 1.79
Greece -0.32 2.45 -0.52 -2.24
Italy -0.17 1.63 -0.25 -1.55
Spain -0.67 0.03 -0.67 -0.03
GE(2)
Portugal -0.02 0.02 -0.01 -0.04
Ireland -0.04 -0.08 -0.02 0.06
Greece -0.08 0.08 -0.15 -0.02
Italy -0.01 0.03 -0.01 -0.03
Spain -0.05 -0.03 -0.03 0.01
Automatic
Stabilisation
Benefits
Unemployment
benefit Old-age benefit
Indices are calculated using 2007 EUROMOD policies linked to 2008 data (base period) and
2013 (2011 for Ireland) EUROMOD policies linked to 2014 (2012 for Ireland) data (end
period). Incomes are equivalised using the OECD equivalence scale. The working age
population is defined as all households in which the eldest member is less than 60 years of