time-dependent response of a recycled c&d material
TRANSCRIPT

materials
Article
Time-Dependent Response of a Recycled C&DMaterial-Geotextile Interface under Direct Shear Mode
Fernanda Bessa Ferreira , Paulo M. Pereira, Castorina Silva Vieira * and Maria de Lurdes Lopes
�����������������
Citation: Ferreira, F.B.; Pereira, P.M.;
Vieira, C.S.; Lopes, M.d.L.
Time-Dependent Response of a
Recycled C&D Material-Geotextile
Interface under Direct Shear Mode.
Materials 2021, 14, 3070. https://
doi.org/10.3390/ma14113070
Academic Editors:
Nadezda Stevulova and
Adriana Estokova
Received: 26 April 2021
Accepted: 31 May 2021
Published: 4 June 2021
Publisher’s Note: MDPI stays neutral
with regard to jurisdictional claims in
published maps and institutional affil-
iations.
Copyright: © 2021 by the authors.
Licensee MDPI, Basel, Switzerland.
This article is an open access article
distributed under the terms and
conditions of the Creative Commons
Attribution (CC BY) license (https://
creativecommons.org/licenses/by/
4.0/).
CONSTRUCT, Faculty of Engineering, University of Porto, Rua Dr. Roberto Frias, 4200-465 Porto, Portugal;[email protected] (F.B.F.); [email protected] (P.M.P.); [email protected] (M.d.L.L.)* Correspondence: [email protected]
Abstract: Geosynthetic-reinforced soil structures have been used extensively in recent decades dueto their significant advantages over more conventional earth retaining structures, including thecost-effectiveness, reduced construction time, and possibility of using locally-available lower qualitysoils and/or waste materials, such as recycled construction and demolition (C&D) wastes. The time-dependent shear behaviour at the interfaces between the geosynthetic and the backfill is an importantfactor affecting the overall long-term performance of such structures, and thereby should be properlyunderstood. In this study, an innovative multistage direct shear test procedure is introduced tocharacterise the time-dependent response of the interface between a high-strength geotextile anda recycled C&D material. After a prescribed shear displacement is reached, the shear box is keptstationary for a specific period of time, after which the test proceeds again, at a constant displacementrate, until the peak and large-displacement shear strengths are mobilised. The shear stress-sheardisplacement curves from the proposed multistage tests exhibited a progressive decrease in shearstress with time (stress relaxation) during the period in which the shear box was restrained from anymovement, which was more pronounced under lower normal stress values. Regardless of the priorinterface shear displacement and duration of the stress relaxation stage, the peak and residual shearstrength parameters of the C&D material-geotextile interface remained similar to those obtainedfrom the conventional (benchmark) tests carried out under constant displacement rate.
Keywords: recycled construction and demolition materials; geosynthetics; high-strength geotextile;direct shear tests; long-term interface response; stress relaxation; geosynthetic-reinforced structures
1. Introduction
Over the last few decades, the application of geosynthetics as soil reinforcementelements in permanent earth structures, such as retaining walls, embankments, steepslopes, and bridge abutments has become a well-established technology. Among theadvantages of geosynthetic-reinforced soil structures are the cost-effectiveness, relativelyshort construction time, possibility of using lower quality and/or locally available backfillmaterials, including recycled waste materials, flexibility, and ductility, as well as theadequate performance, even when constructed in seismic areas. For the internal stabilityanalysis and safe design of such structures, the interaction properties at soil-geosyntheticinterfaces are of the utmost importance [1–3]. Various experimental methods, such asthe direct shear test, inclined plane test, pullout test, and in-soil tensile test have beendeveloped to characterise soil-geosynthetic interaction, of which the pullout and directshear tests are the most typically used [3–10].While the pullout test is a valuable method toexamine the interaction between the soil and the geosynthetic, in the anchorage zone ofgeosynthetic-reinforced soil walls, slopes, and embankments, the direct shear test is bettersuited to analyse the soil-geosynthetic interface behaviour in cases where sliding of the soilmass on the reinforcement surface is likely to occur [2,3,7,11,12].
In recent years, the use of recycled construction and demolition (C&D) wastes ingeotechnical engineering works (e.g., road and railway infrastructure and geosynthetic-
Materials 2021, 14, 3070. https://doi.org/10.3390/ma14113070 https://www.mdpi.com/journal/materials
Materials 2021, 14, 3070 2 of 16
reinforced structures) has been pointed out as a cost-effective and sustainable way ofmitigating the environmental impacts arising from the overexploitation of natural re-sources, while also decreasing the waste disposal volumes in landfills [13–19]. In fact,vast amounts of C&D wastes are produced each year by the construction industry, whichhas raised significant environmental concerns at a global level. In the European Union,the construction industry is responsible for over 35% of total waste generation [20]. Thevast amounts of C&D wastes generated, associated with their high valorisation potential,have led the European Commission to recognize these materials as a priority waste streamfor reuse and recycling [21]. Therefore, the use of recycled C&D wastes, as an alterna-tive backfill in geosynthetic-reinforced structures, would significantly contribute towardssustainability and environmental protection. However, a thorough understanding of thelong-term response of such structures is required before they can be safely put into practice.
Geosynthetics, being polymeric materials, exhibit a time-dependent stress-strainbehaviour (i.e., creep and stress relaxation) when subjected to tensile loads. The intrinsicviscoelastic nature of geosynthetics may affect the performance of the reinforced structuresthroughout their design lifetimes, and thereby, the long-term mechanical properties ofgeosynthetics and soil-geosynthetic interfaces are of great importance when these materialsare used in permanent reinforcement applications. Several factors, such as the polymertype, loading rate, temperature, and soil confinement are susceptible to influence thetime-dependent response of geosynthetics [22–24].
The long-term tensile behaviour of geosynthetics has been typically assessed by creepand creep rupture tests and, albeit less often, using stress relaxation tests [25–33]. Thiscan be partly explained by the fact that current design guidelines are based upon creeptest results, and thus do not require stress relaxation data, as well as the relatively highercomplexity of stress relaxation testing [25]. While in creep testing, the applied tensile loadis kept constant, and the resulting strains are measured over time, in a stress relaxationtest the strain is kept constant through the reduction in the tensile load with time, whichinevitably demands a sophisticated test device with feedback control.
Leshchinsky et al. [25] investigated the creep and stress relaxation behaviour ofseveral typical geogrids used in reinforced soil walls and slopes. The geogrid specimenswere subjected to initial loads corresponding to 40–80% of the ultimate short-term tensilestrength, and the tests were conducted for a period of one month, or until rupture occurred(whichever was shortest). The authors found that the maximum potential stress relaxationwas about 30% and 50% of the initial loads for polyester and high-density polyethylenegeogrids, respectively.
Allen and Bathurst [34] analysed the reinforcement creep data, measured in 10 full-scale geosynthetic walls, and compared them with the creep rates obtained by unconfined(i.e., in-isolation) laboratory creep tests. They concluded that, in the majority of cases, thelaboratory creep rates were identical, or greater than, the measured reinforcement creeprates in the full-scale walls, suggesting that in-isolation laboratory creep data generallyproduce conservative estimates of creep in walls. The authors also reported that, at theend of wall construction, the reinforcement appeared to be primarily exhibiting creep,with negligible stress relaxation. However, in the long-term, there was a trend towardsreinforcement stress relaxation.
Recently, Costa and Zornberg [22] presented a novel laboratory test device suitableto evaluate the time-dependent deformation of geosynthetics experienced under soil con-finement. Apart from soil-geosynthetic interaction tests, the apparatus enables in-isolationgeosynthetic stress relaxation tests and soil-only tests to be performed under a constantstrain rate. The soil-geosynthetic interaction tests, carried out on a sand and a polypropy-lene woven geotextile, were found to lead to increasing geotextile deformations, anddecreasing reinforcement tension, over time. For the geotextile tested, the authors observeda reduction in time-dependent deformations under confinement conditions in comparisonto those obtained by in-isolation creep tests. Their study also showed that the lower defor-
Materials 2021, 14, 3070 3 of 16
mations, over time, obtained under confinement conditions occurred as a result of the loadreduction throughout the test, rather than due to the effect of soil confinement.
The above literature review has shown that, although significant research has beenconducted in the past to investigate the long-term response of geosynthetics, very limitedstudies have focused on the time-dependent interaction behaviour at soil-geosyntheticinterfaces. In particular, to the best of the authors’ knowledge, no previous studies havebeen conducted to evaluate the time-dependent response of soil-geosynthetic interfacesunder direct shear mode.
In view of the above, an innovative direct shear test method is used in this study toinvestigate the time-dependent phenomena (stress relaxation) taking place at the interfacebetween a high-strength geotextile and a fine-grained recycled C&D material. A large-scaledirect shear testing programme, involving conventional and multistage tests, is carried outunder varying normal stresses, shear displacements at the onset of the stress relaxationstage, and stress relaxation periods. A comparison is then made between the interfaceshear stress-shear displacement response, and the vertical deformation of the specimens,obtained from both test methods, to examine the effect of time on the interface shearstrength properties.
2. Materials and Methods2.1. Materials
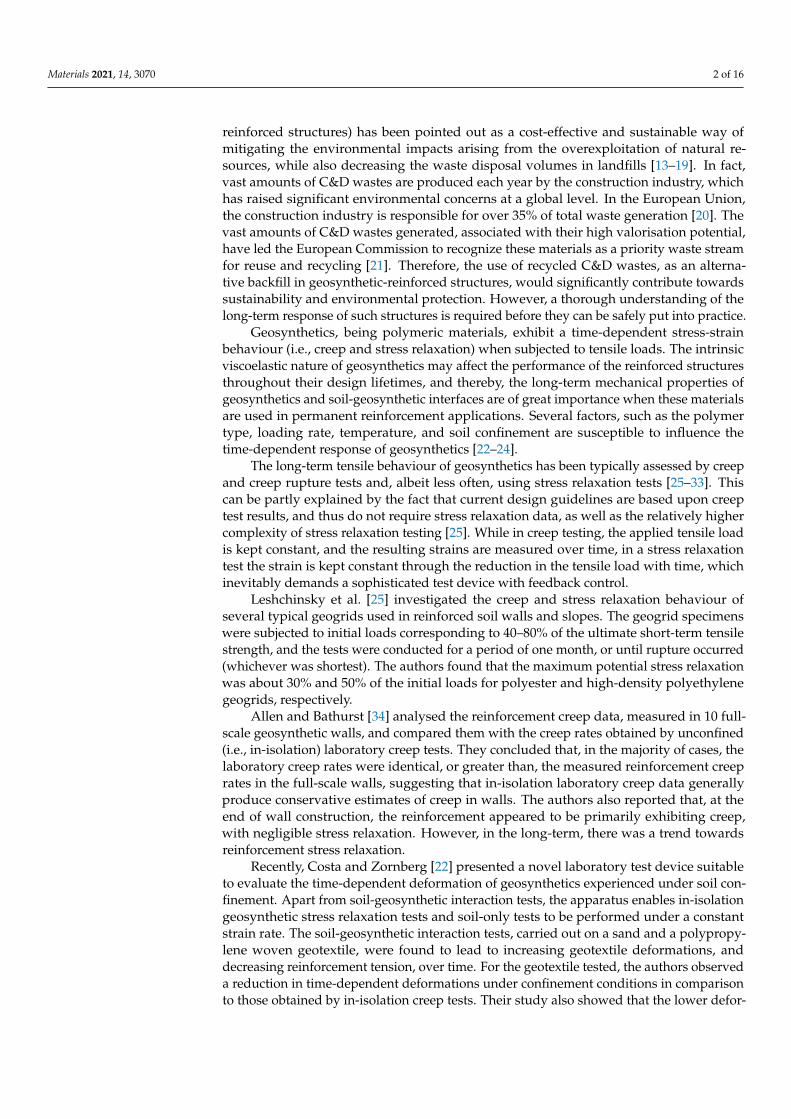
A commercially-available uniaxial high-strength geotextile, also termed as a geocom-posite reinforcement, was used in this study (Figure 1a). This geotextile consists of high-modulus polyethylene terephthalate yarns attached to a continuous filament nonwovenpolypropylene geotextile, with a nominal tensile strength of 40 kN/m and correspondingelongation of 10% (machine direction), according to the manufacturer specifications. Due toits in-plane permeability, this geotextile reduces excess pore-water pressure and is thereforesuitable for backfill materials with high fines content.
Materials 2021, 14, x FOR PEER REVIEW 3 of 16
ene woven geotextile, were found to lead to increasing geotextile deformations, and de-creasing reinforcement tension, over time. For the geotextile tested, the authors observed a reduction in time-dependent deformations under confinement conditions in comparison to those obtained by in-isolation creep tests. Their study also showed that the lower de-formations, over time, obtained under confinement conditions occurred as a result of the load reduction throughout the test, rather than due to the effect of soil confinement.
The above literature review has shown that, although significant research has been conducted in the past to investigate the long-term response of geosynthetics, very limited studies have focused on the time-dependent interaction behaviour at soil-geosynthetic in-terfaces. In particular, to the best of the authors’ knowledge, no previous studies have been conducted to evaluate the time-dependent response of soil-geosynthetic interfaces under direct shear mode.
In view of the above, an innovative direct shear test method is used in this study to investigate the time-dependent phenomena (stress relaxation) taking place at the interface between a high-strength geotextile and a fine-grained recycled C&D material. A large-scale direct shear testing programme, involving conventional and multistage tests, is car-ried out under varying normal stresses, shear displacements at the onset of the stress re-laxation stage, and stress relaxation periods. A comparison is then made between the in-terface shear stress-shear displacement response, and the vertical deformation of the spec-imens, obtained from both test methods, to examine the effect of time on the interface shear strength properties.
2. Materials and Methods 2.1. Materials
A commercially-available uniaxial high-strength geotextile, also termed as a geocom-posite reinforcement, was used in this study (Figure 1a). This geotextile consists of high-modulus polyethylene terephthalate yarns attached to a continuous filament nonwoven polypropylene geotextile, with a nominal tensile strength of 40 kN/m and corresponding elongation of 10% (machine direction), according to the manufacturer specifications. Due to its in-plane permeability, this geotextile reduces excess pore-water pressure and is therefore suitable for backfill materials with high fines content.
(a) (b)
Figure 1. Materials used in the study: (a) High-strength geotextile; (b) Recycled C&D material.
The recycled C&D material (Figure 1b) is a fine-grained material resulting from the recycling process carried out at a Portuguese specialized recycling plant, which involves several steps, including the removal of metals and light contaminants (e.g., plastics, rubbers, cork, foams, etc.,) in a trommel and the separation by granulometric fractions through con-veyor belts and multiple sieves. The batch of the recycled material used in the study was produced from C&D wastes coming mainly from maintenance and rehabilitation works of
Figure 1. Materials used in the study: (a) High-strength geotextile; (b) Recycled C&D material.
The recycled C&D material (Figure 1b) is a fine-grained material resulting from therecycling process carried out at a Portuguese specialized recycling plant, which involvesseveral steps, including the removal of metals and light contaminants (e.g., plastics, rubbers,cork, foams, etc.,) in a trommel and the separation by granulometric fractions throughconveyor belts and multiple sieves. The batch of the recycled material used in the study wasproduced from C&D wastes coming mainly from maintenance and rehabilitation works ofresidential buildings, demolition of masonry fences and recovering of C&D wastes fromillegal dumps.
Materials 2021, 14, 3070 4 of 16
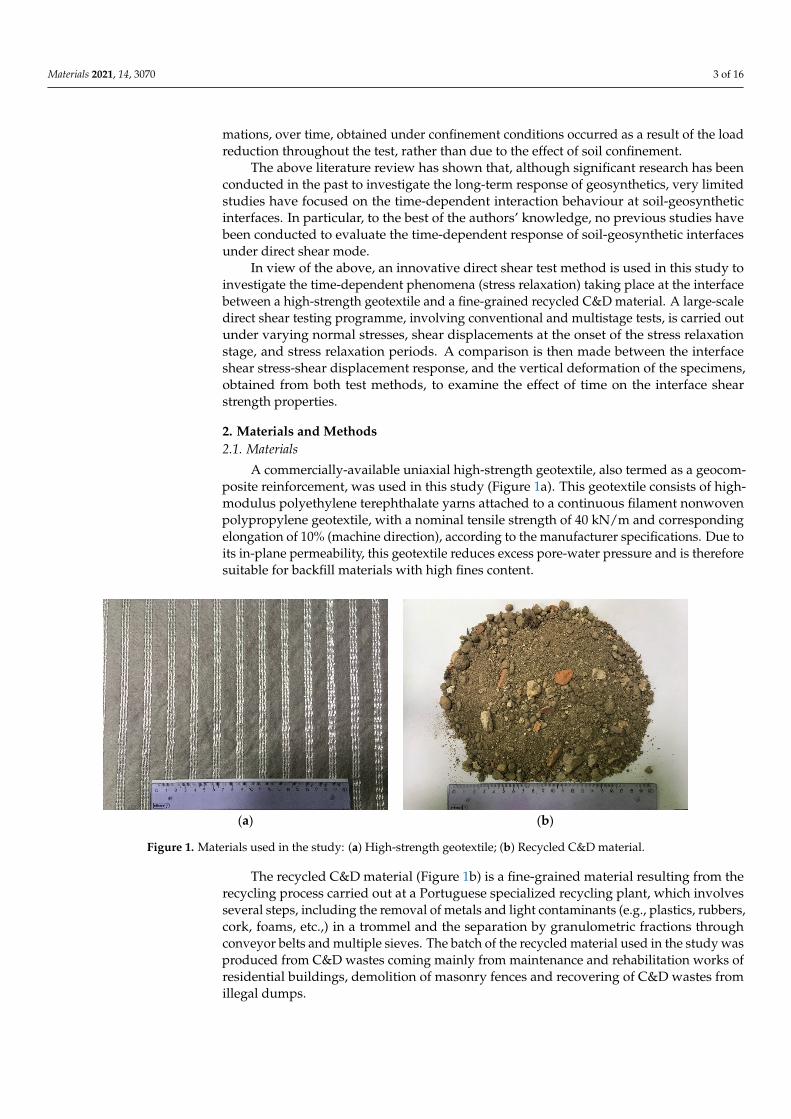
The relative proportion of constituents of recycled C&D aggregates may be estimatedon the basis of the European Standard EN 933-11:2011 [35] (Table 1). However, this standardis applicable to coarse recycled aggregates, whereby the particles whose diameter is lowerthan 4 mm are not considered. Taking into account that a large proportion of the recycledC&D material under investigation consists of particles passing the 4 mm sieve (see Figure 2),but the manual sorting of these particles is humanly impossible, an alternative classificationwas also included in Table 1. Assuming that the unsorted particles can be classified assoil, it can be considered that this recycled material is mostly composed of soil with someparticles of concrete, mortars, unbound and hydraulically bound aggregates.
Materials 2021, 14, x FOR PEER REVIEW 4 of 16
residential buildings, demolition of masonry fences and recovering of C&D wastes from illegal dumps.
The relative proportion of constituents of recycled C&D aggregates may be estimated on the basis of the European Standard EN 933-11:2011 [35] (Table 1). However, this stand-ard is applicable to coarse recycled aggregates, whereby the particles whose diameter is lower than 4 mm are not considered. Taking into account that a large proportion of the recycled C&D material under investigation consists of particles passing the 4 mm sieve (see Figure 2), but the manual sorting of these particles is humanly impossible, an alter-native classification was also included in Table 1. Assuming that the unsorted particles can be classified as soil, it can be considered that this recycled material is mostly composed of soil with some particles of concrete, mortars, unbound and hydraulically bound aggre-gates.
Figure 2. Particle size distribution curve of the recycled C&D material.
Table 1. Constituents of the recycled C&D material.
Constituents According to [35] * Global Value Concrete, concrete products, mortar, concrete masonry units, Rc (%) 16.0 1.6
Unbound aggregate, natural stone, hydraulically bound aggregate, Ru (%) 45.7 4.6 Clay masonry units, calcium silicate masonry units, aerated non-floating concrete, Rb (%) 3.7 0.4
Bituminous materials, Ra (%) 2.2 0.2 Glass, Rg (%) 0.3 0.0
Other materials, X ** (%) 32.1 3.2 Unsorted particles (%) - 90
Floating particles, FL (cm3/kg) 3.8 - * Only for particles above 4 mm; ** Materials that do not fall into the above categories (e.g., gypsum drywall, cork, non-floating wood and soils resulting from the washing process).
The particle size distribution of the recycled C&D material was evaluated by sieving and sedimentation in accordance with the EN 933-1:2012 [36] and CEN ISO/TS 17892-4:2016 [37] Standards (Figure 2). The optimum compaction parameters (i.e., optimum moisture content, wopt and maximum dry unit weight, γdmax) were determined using the standard Proctor test, following the EN 13286-2:2010 [38]. The main physical properties of this recycled material are presented in Table 2.
0
10
20
30
40
50
60
70
80
90
100
0.0001 0.001 0.01 0.1 1 10 100
Perc
enta
ge p
assi
ng (
%)
Particle size (mm)
Figure 2. Particle size distribution curve of the recycled C&D material.
Table 1. Constituents of the recycled C&D material.
Constituents According to [35] * Global Value
Concrete, concrete products, mortar, concrete masonry units, Rc (%) 16.0 1.6Unbound aggregate, natural stone, hydraulically bound aggregate, Ru (%) 45.7 4.6
Clay masonry units, calcium silicate masonry units, aerated non-floating concrete, Rb (%) 3.7 0.4Bituminous materials, Ra (%) 2.2 0.2
Glass, Rg (%) 0.3 0.0Other materials, X ** (%) 32.1 3.2Unsorted particles (%) - 90
Floating particles, FL (cm3/kg) 3.8 -
* Only for particles above 4 mm; ** Materials that do not fall into the above categories (e.g., gypsum drywall, cork, non-floating wood andsoils resulting from the washing process).
The particle size distribution of the recycled C&D material was evaluated by sievingand sedimentation in accordance with the EN 933-1:2012 [36] and CEN ISO/TS 17892-4:2016 [37] Standards (Figure 2). The optimum compaction parameters (i.e., optimummoisture content, wopt and maximum dry unit weight, γdmax) were determined using thestandard Proctor test, following the EN 13286-2:2010 [38]. The main physical properties ofthis recycled material are presented in Table 2.
Materials 2021, 14, 3070 5 of 16
Table 2. Physical properties of the recycled C&D material.
Property Value
D10 (mm) 0.01D50 (mm) 0.33D60 (mm) 0.45
Fines content (%) 26.5CU 39.3CC 2.4
γdmax (kN/m3) a 19.0wopt (%) a 11.3
a Estimated from the standard Proctor test (EN 13286-2:2010 [38]).
The evaluation of the leaching behaviour of recycled C&D materials to be used ingeosynthetic-reinforced structures is of great relevance to investigate the potential forgroundwater contamination and the presence of chemical substances that could inducethe degradation of geosynthetics. In this study, laboratory leaching tests were carried outon the recycled C&D material following the European Standard EN 12457-4:2002 [39] todetermine the concentration of each contaminant. The obtained values were then comparedwith the acceptance criteria for inert landfill according to the European Council Decision2003/33/EC [40] (Table 3).
Table 3. Results of laboratory leaching tests of the recycled C&D material and correspondingacceptance criteria.
Parameter Value (mg/kg) Acceptance Criteria—Inertlandfill (mg/kg)
Arsenic, As 0.03 0.5Lead, Pb <0.3 0.5
Cadmium, Cd <0.04 0.04Chromium, Cr <0.5 0.5
Copper, Cu <0.25 2Nickel, Ni <0.3 0.4
Mercury, Hg <0.01 0.01Zinc, Zn 0.52 4
Barium, Ba 0.16 20Molybdenum, Mo 0.03 0.5
Antimony, Sb <0.01 0.06Selenium, Se 0.02 0.1Chloride, Cl 56 800Fluoride, F <2 10
Sulphate, SO4 1200 1000Phenol index <0.05 1
Dissolved Organic Carbon, DOC <200 500
pH 8.6 -
It can be concluded that, except for sulphate whose concentration (1200 mg/kg ofdry matter) exceeded the maximum value established by the European legislation forinert landfill (1000 mg/kg of dry matter), all the pollutants were significantly belowthe respective limits. The relatively high concentration of sulphate in mixed recycledaggregates is usually attributed to the presence of gypsum drywall [41]. It is noteworthythat according to the European legislation [40], if the waste material exceeds the thresholdvalue for sulphate, it can still be considered as meeting the acceptance criteria as long asthe leaching does not exceed 6000 mg/kg at a liquid to solid (L/S) ratio of 10 L/kg.
2.2. Large-Scale Direct Shear Apparatus and Test Procedures
The direct shear tests on the recycled C&D material-geotextile interface were con-ducted using a large-scale direct shear test apparatus that is suitable to characterise the
Materials 2021, 14, 3070 6 of 16
direct shear behaviour of soils, soil-geosynthetic, and geosynthetic-geosynthetic interfacesunder monotonic and cyclic loading conditions. The equipment comprises a shear box(including upper and lower boxes), a support structure, five hydraulic actuators and respec-tive fluid power unit, an electric cabinet and a number of internal and external transducers.The upper and lower boxes are 600 mm long × 300 mm wide × 150 mm deep and 800 mmlong × 340 mm wide × 100 mm deep, respectively. The apparatus is capable of performingdirect shear tests with constant or reduced contact area during shearing, depending onwhether a rigid base or, alternatively, a rigid ring is installed in the lower box, respectively.Further details about the large-scale direct shear test apparatus can be found in previouspublications [12,42].
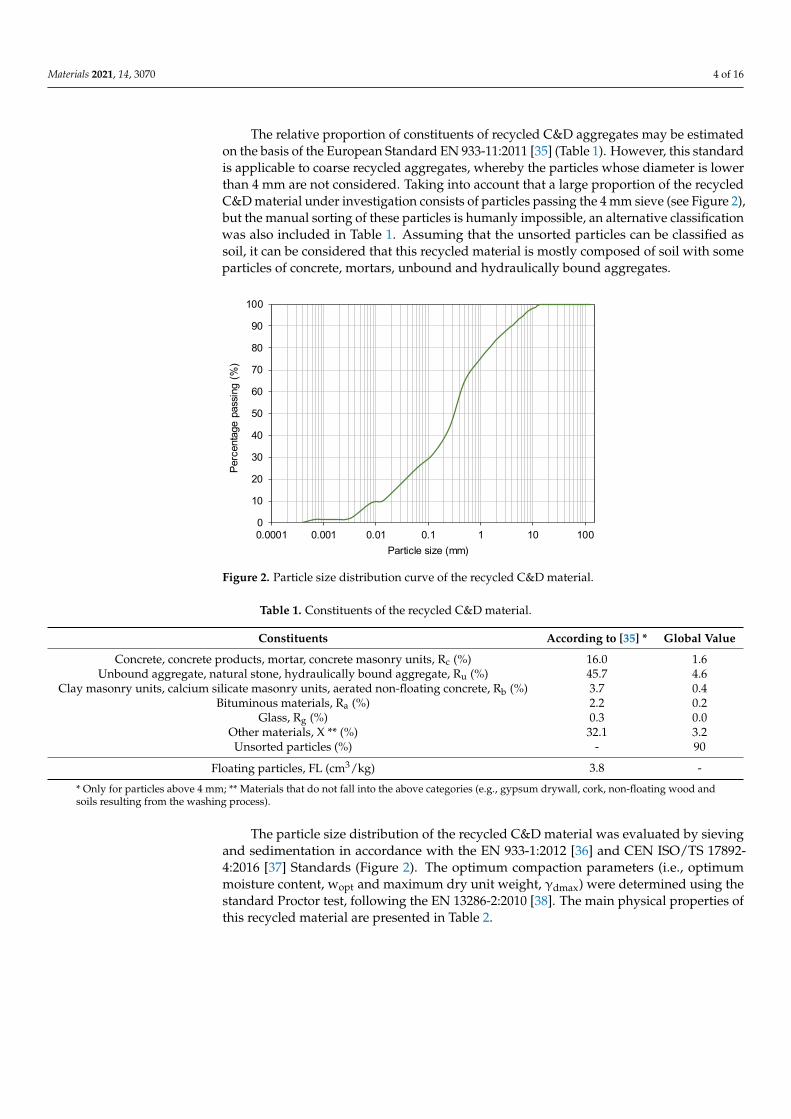
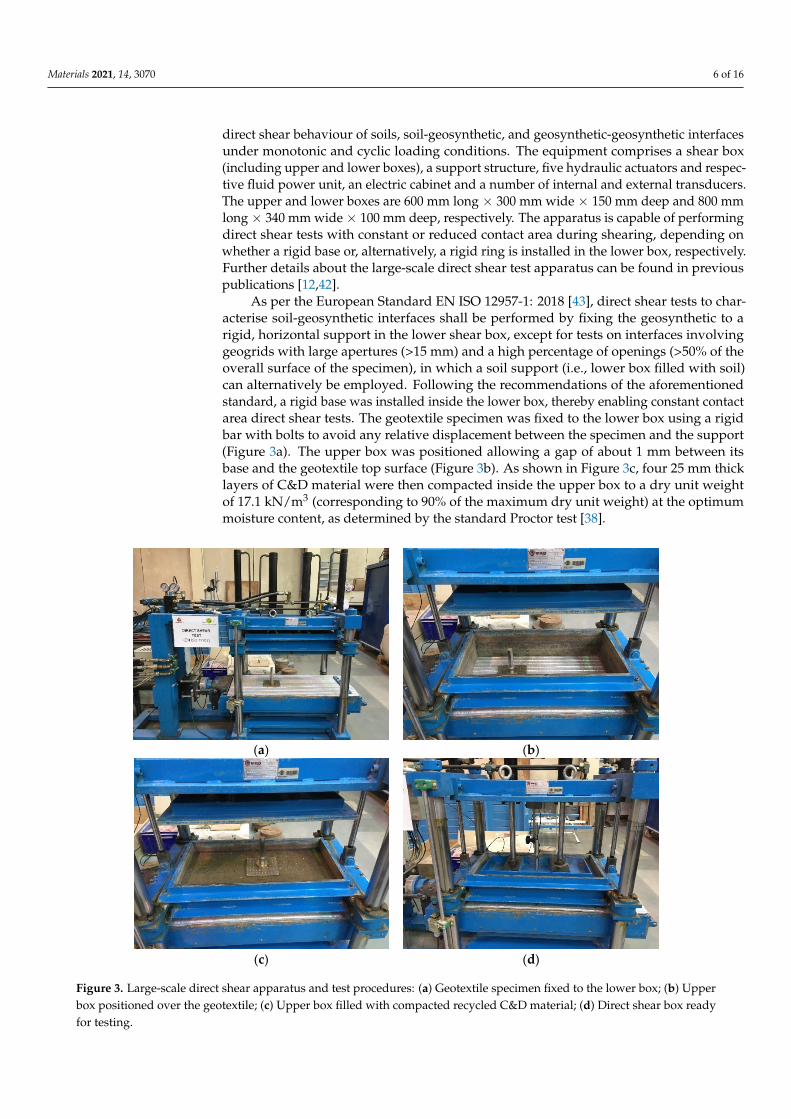
As per the European Standard EN ISO 12957-1: 2018 [43], direct shear tests to char-acterise soil-geosynthetic interfaces shall be performed by fixing the geosynthetic to arigid, horizontal support in the lower shear box, except for tests on interfaces involvinggeogrids with large apertures (>15 mm) and a high percentage of openings (>50% of theoverall surface of the specimen), in which a soil support (i.e., lower box filled with soil)can alternatively be employed. Following the recommendations of the aforementionedstandard, a rigid base was installed inside the lower box, thereby enabling constant contactarea direct shear tests. The geotextile specimen was fixed to the lower box using a rigidbar with bolts to avoid any relative displacement between the specimen and the support(Figure 3a). The upper box was positioned allowing a gap of about 1 mm between itsbase and the geotextile top surface (Figure 3b). As shown in Figure 3c, four 25 mm thicklayers of C&D material were then compacted inside the upper box to a dry unit weightof 17.1 kN/m3 (corresponding to 90% of the maximum dry unit weight) at the optimummoisture content, as determined by the standard Proctor test [38].
Materials 2021, 14, x FOR PEER REVIEW 6 of 16
2.2. Large-Scale Direct Shear Apparatus and Test Procedures The direct shear tests on the recycled C&D material-geotextile interface were con-
ducted using a large-scale direct shear test apparatus that is suitable to characterise the direct shear behaviour of soils, soil-geosynthetic, and geosynthetic-geosynthetic interfaces under monotonic and cyclic loading conditions. The equipment comprises a shear box (including upper and lower boxes), a support structure, five hydraulic actuators and re-spective fluid power unit, an electric cabinet and a number of internal and external trans-ducers. The upper and lower boxes are 600 mm long × 300 mm wide × 150 mm deep and 800 mm long × 340 mm wide × 100 mm deep, respectively. The apparatus is capable of performing direct shear tests with constant or reduced contact area during shearing, de-pending on whether a rigid base or, alternatively, a rigid ring is installed in the lower box, respectively. Further details about the large-scale direct shear test apparatus can be found in previous publications [12,42].
As per the European Standard EN ISO 12957-1: 2018 [43], direct shear tests to char-acterise soil-geosynthetic interfaces shall be performed by fixing the geosynthetic to a rigid, horizontal support in the lower shear box, except for tests on interfaces involving geogrids with large apertures (>15 mm) and a high percentage of openings (>50% of the overall surface of the specimen), in which a soil support (i.e., lower box filled with soil) can alternatively be employed. Following the recommendations of the aforementioned standard, a rigid base was installed inside the lower box, thereby enabling constant con-tact area direct shear tests. The geotextile specimen was fixed to the lower box using a rigid bar with bolts to avoid any relative displacement between the specimen and the sup-port (Figure 3a). The upper box was positioned allowing a gap of about 1 mm between its base and the geotextile top surface (Figure 3b). As shown in Figure 3c, four 25 mm thick layers of C&D material were then compacted inside the upper box to a dry unit weight of 17.1 kN/m3 (corresponding to 90% of the maximum dry unit weight) at the optimum mois-ture content, as determined by the standard Proctor test [38].
(a) (b)
(c) (d)
Figure 3. Large-scale direct shear apparatus and test procedures: (a) Geotextile specimen fixed to the lower box; (b) Upperbox positioned over the geotextile; (c) Upper box filled with compacted recycled C&D material; (d) Direct shear box readyfor testing.

Materials 2021, 14, 3070 7 of 16
The direct shear tests were conducted under varying normal stress levels (σn) rangingfrom 25 kPa to 150 kPa. The required normal stress was applied to the test specimenby a rigid plate with pressure-controlled double acting linear actuators and the verticaldisplacements were recorded using an external displacement transducer (i.e., a LinearVariable Differential Transformer, LVDT) positioned at the rigid plate centre (Figure 3d).The values of the applied normal stress, vertical displacement of the rigid plate, horizontaldisplacement of the lower box, and shear stress mobilised at the C&D material-geotextileinterface were continuously monitored during the tests.
2.3. Test Programme
The test conditions investigated in this study are summarized in Table 4. The testprogramme involved 20 large-scale direct shear tests on a recycled C&D material-geotextileinterface (5 conventional and 15 multistage direct shear tests). The conventional (i.e., bench-mark) direct shear tests were performed at a constant displacement rate of 1 mm/min andup to a maximum shear displacement of 60 mm. In order to examine the time-dependentstress-strain behaviour of the C&D material-geotextile interface, an innovative multistagedirect shear test procedure was implemented including three different stages: first, a con-stant displacement rate of 1 mm/min was applied until a prescribed horizontal (shear)displacement (dr) was reached; in the second stage, the displacement of the lower boxwas restrained for a specific period of time (tr), while the stress decay associated withstress relaxation was continuously measured; in the final stage, the test proceeded againat a constant displacement rate (1 mm/min) until an horizontal displacement of 60 mmwas reached.
Table 4. Direct shear test programme.
Test Number Test Method Normal Stress, σn(kPa)
Displacement,dr/dmax
Time, tr (min)
T-1 Conventional 25 N/A N/AT-2 Conventional 50 N/A N/AT-3 Conventional 100 N/A N/AT-4 Conventional 100 N/A N/AT-5 Conventional 150 N/A N/AT-6 Multistage 25 1/3 30T-7 Multistage 50 1/3 30T-8 Multistage 100 1/3 30T-9 Multistage 100 1/3 30T-10 Multistage 150 1/3 30T-11 Multistage 25 2/3 30T-12 Multistage 50 2/3 30T-13 Multistage 100 2/3 30T-14 Multistage 100 2/3 30T-15 Multistage 150 2/3 30T-16 Multistage 25 2/3 120T-17 Multistage 50 2/3 120T-18 Multistage 100 2/3 120T-19 Multistage 100 2/3 120T-20 Multistage 150 2/3 120
The effect of the magnitude of shear displacement, at which the stress relaxation phasestarted, was investigated by defining two different displacement levels (i.e., dr = 1/3 dmaxand dr = 2/3 dmax, where dmax is the shear displacement corresponding to the maximumshear stress in the benchmark test conducted under the same normal stress). The periodof time during which the shear box was kept restrained varied between 30 and 120 min.All of the direct shear tests were conducted under normal stresses (σn) ranging from 25 to150 kPa. To assess the repeatability of results, the tests under σn = 100 kPa were repeated.
Materials 2021, 14, 3070 8 of 16
3. Results and Discussion3.1. Direct Shear Behaviour under Constant Displacement Rate
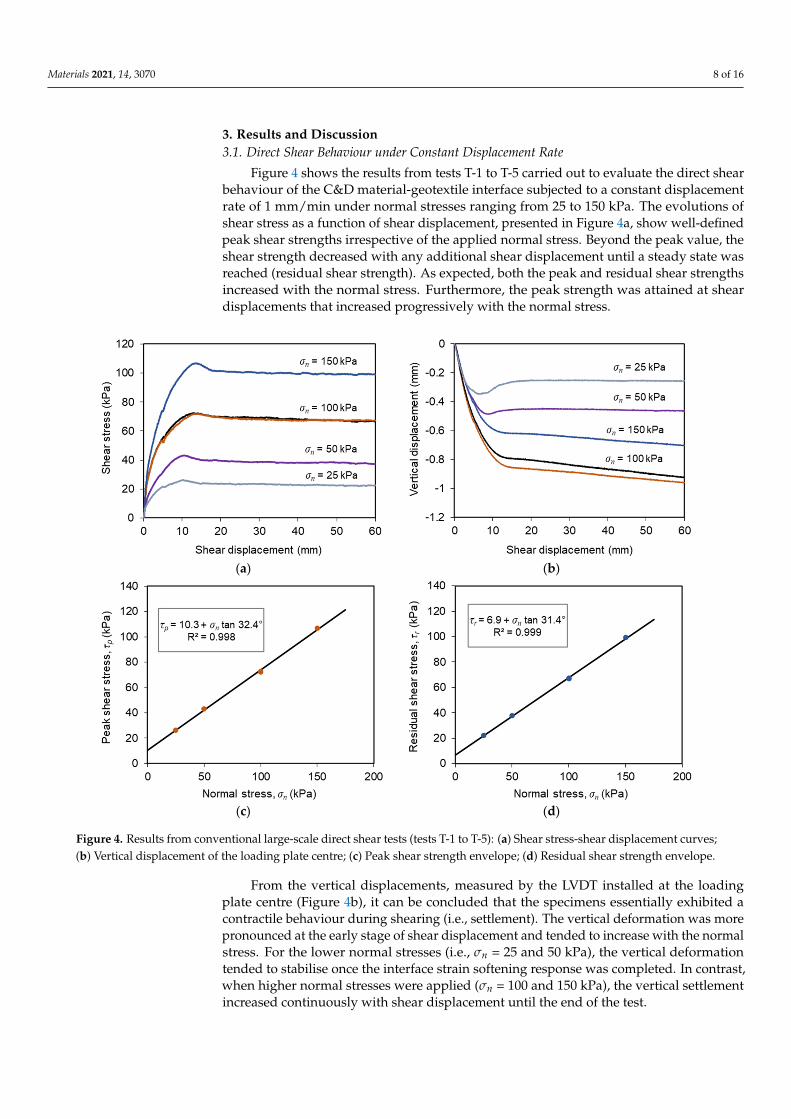
Figure 4 shows the results from tests T-1 to T-5 carried out to evaluate the direct shearbehaviour of the C&D material-geotextile interface subjected to a constant displacementrate of 1 mm/min under normal stresses ranging from 25 to 150 kPa. The evolutions ofshear stress as a function of shear displacement, presented in Figure 4a, show well-definedpeak shear strengths irrespective of the applied normal stress. Beyond the peak value, theshear strength decreased with any additional shear displacement until a steady state wasreached (residual shear strength). As expected, both the peak and residual shear strengthsincreased with the normal stress. Furthermore, the peak strength was attained at sheardisplacements that increased progressively with the normal stress.
Materials 2021, 14, x FOR PEER REVIEW 8 of 16
shear stress in the benchmark test conducted under the same normal stress). The period of time during which the shear box was kept restrained varied between 30 and 120 min. All of the direct shear tests were conducted under normal stresses (σn) ranging from 25 to 150 kPa. To assess the repeatability of results, the tests under σn = 100 kPa were repeated.
3. Results and Discussion 3.1. Direct Shear Behaviour under Constant Displacement Rate
Figure 4 shows the results from tests T-1 to T-5 carried out to evaluate the direct shear behaviour of the C&D material-geotextile interface subjected to a constant displacement rate of 1 mm/min under normal stresses ranging from 25 to 150 kPa. The evolutions of shear stress as a function of shear displacement, presented in Figure 4a, show well-defined peak shear strengths irrespective of the applied normal stress. Beyond the peak value, the shear strength decreased with any additional shear displacement until a steady state was reached (residual shear strength). As expected, both the peak and residual shear strengths increased with the normal stress. Furthermore, the peak strength was attained at shear displacements that increased progressively with the normal stress.
(a) (b)
(c) (d)
Figure 4. Results from conventional large-scale direct shear tests (tests T-1 to T-5): (a) Shear stress-shear displacement curves; (b) Vertical displacement of the loading plate centre; (c) Peak shear strength envelope; (d) Residual shear strength envelope.
From the vertical displacements, measured by the LVDT installed at the loading plate centre (Figure 4b), it can be concluded that the specimens essentially exhibited a contrac-tile behaviour during shearing (i.e., settlement). The vertical deformation was more pro-nounced at the early stage of shear displacement and tended to increase with the normal
Figure 4. Results from conventional large-scale direct shear tests (tests T-1 to T-5): (a) Shear stress-shear displacement curves;(b) Vertical displacement of the loading plate centre; (c) Peak shear strength envelope; (d) Residual shear strength envelope.
From the vertical displacements, measured by the LVDT installed at the loadingplate centre (Figure 4b), it can be concluded that the specimens essentially exhibited acontractile behaviour during shearing (i.e., settlement). The vertical deformation was morepronounced at the early stage of shear displacement and tended to increase with the normalstress. For the lower normal stresses (i.e., σn = 25 and 50 kPa), the vertical deformationtended to stabilise once the interface strain softening response was completed. In contrast,when higher normal stresses were applied (σn = 100 and 150 kPa), the vertical settlementincreased continuously with shear displacement until the end of the test.
Materials 2021, 14, 3070 9 of 16
The peak and residual shear strengths mobilised at the studied interface when sub-jected to a constant displacement rate, and different normal stresses are illustrated inFigure 4c,d, respectively, along with the corresponding linear best fits (Mohr-Coulombstrength envelopes) and respective equations. The interface peak shear strength can becharacterised by a friction angle (δ) of 32.4◦ and adhesion (ca) of 10.3 kPa, whereas theresidual shear strength can be characterised by a slightly lower friction angle of 31.4◦ andadhesion of 6.9 kPa.
3.2. Time-Dependent Interface Behaviour
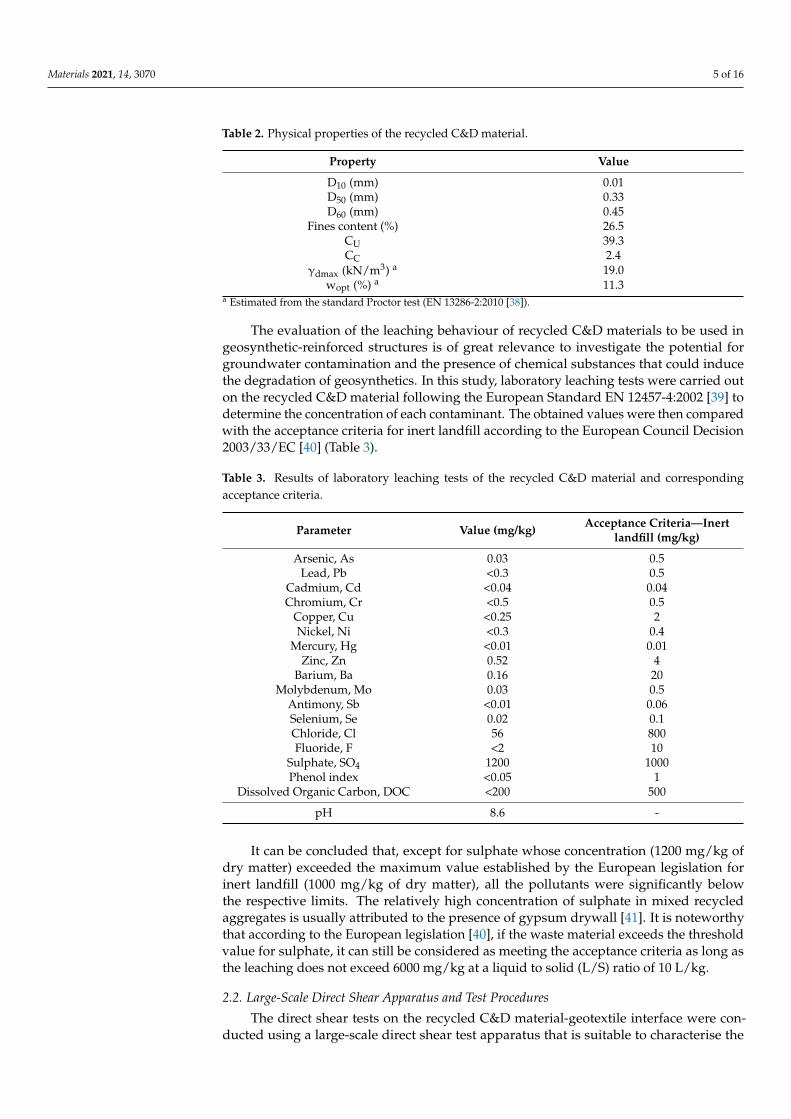
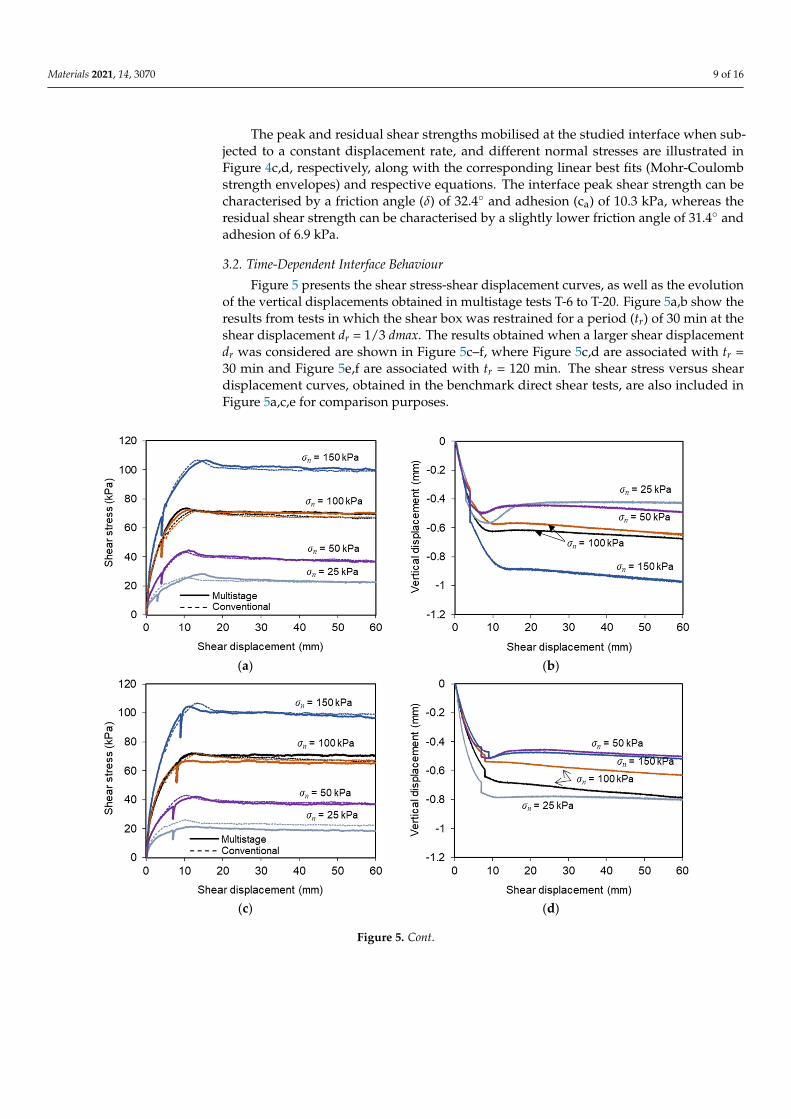
Figure 5 presents the shear stress-shear displacement curves, as well as the evolutionof the vertical displacements obtained in multistage tests T-6 to T-20. Figure 5a,b show theresults from tests in which the shear box was restrained for a period (tr) of 30 min at theshear displacement dr = 1/3 dmax. The results obtained when a larger shear displacementdr was considered are shown in Figure 5c–f, where Figure 5c,d are associated with tr =30 min and Figure 5e,f are associated with tr = 120 min. The shear stress versus sheardisplacement curves, obtained in the benchmark direct shear tests, are also included inFigure 5a,c,e for comparison purposes.
Materials 2021, 14, x FOR PEER REVIEW 9 of 16
stress. For the lower normal stresses (i.e., σn = 25 and 50 kPa), the vertical deformation tended to stabilise once the interface strain softening response was completed. In contrast, when higher normal stresses were applied (σn = 100 and 150 kPa), the vertical settlement increased continuously with shear displacement until the end of the test.
The peak and residual shear strengths mobilised at the studied interface when sub-jected to a constant displacement rate, and different normal stresses are illustrated in Fig-ure 4c,d, respectively, along with the corresponding linear best fits (Mohr-Coulomb strength envelopes) and respective equations. The interface peak shear strength can be characterised by a friction angle (δ) of 32.4° and adhesion (ca) of 10.3 kPa, whereas the residual shear strength can be characterised by a slightly lower friction angle of 31.4° and adhesion of 6.9 kPa.
3.2. Time-Dependent Interface Behaviour Figure 5 presents the shear stress-shear displacement curves, as well as the evolution
of the vertical displacements obtained in multistage tests T-6 to T-20. Figure 5a,b show the results from tests in which the shear box was restrained for a period (tr) of 30 min at the shear displacement dr = 1/3 dmax. The results obtained when a larger shear displacement dr was considered are shown in Figure 5c–f, where Figure 5c,d are associated with tr = 30 min and Figure 5e,f are associated with tr = 120 min. The shear stress versus shear dis-placement curves, obtained in the benchmark direct shear tests, are also included in Figure 5a,c,e for comparison purposes.
(a) (b)
(c) (d)
Figure 5. Cont.
Materials 2021, 14, 3070 10 of 16Materials 2021, 14, x FOR PEER REVIEW 10 of 16
(e) (f)
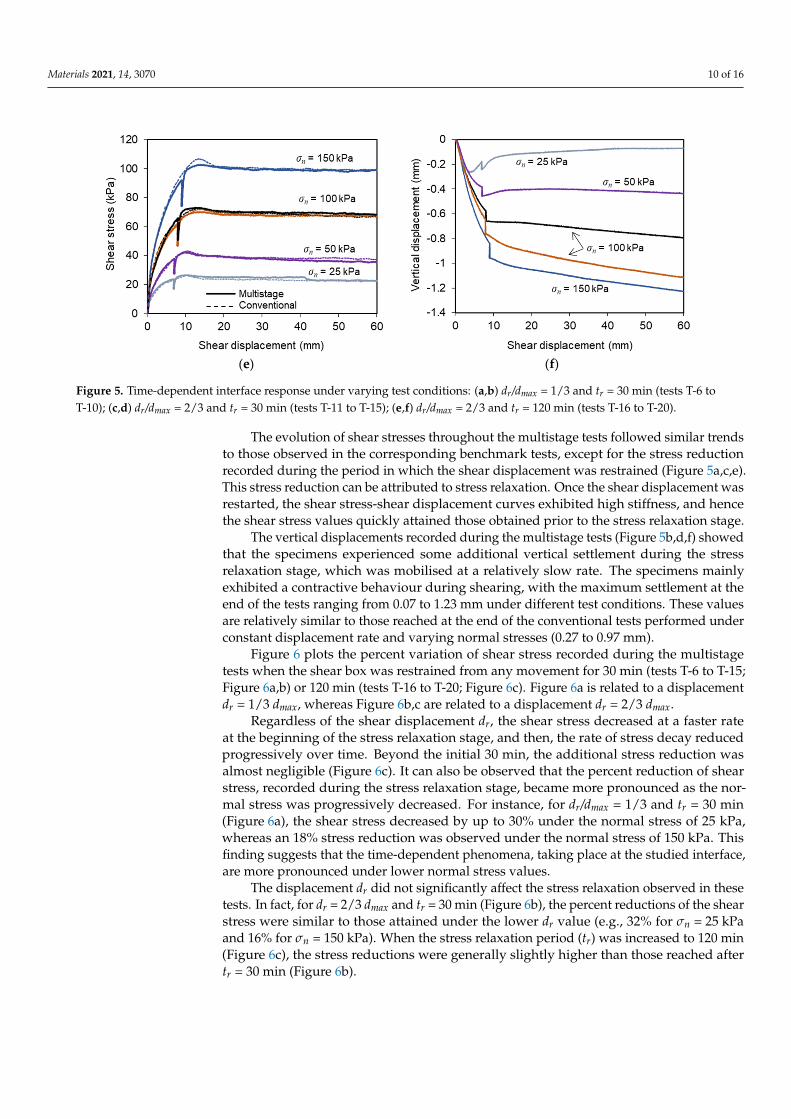
Figure 5. Time-dependent interface response under varying test conditions: (a,b) dr/dmax = 1/3 and tr = 30 min (tests T-6 to T-10); (c,d) dr/dmax = 2/3 and tr = 30 min (tests T-11 to T-15); (e,f) dr/dmax = 2/3 and tr = 120 min (tests T-16 to T-20).
The evolution of shear stresses throughout the multistage tests followed similar trends to those observed in the corresponding benchmark tests, except for the stress re-duction recorded during the period in which the shear displacement was restrained (Fig-ure 5a,c,e). This stress reduction can be attributed to stress relaxation. Once the shear dis-placement was restarted, the shear stress-shear displacement curves exhibited high stiff-ness, and hence the shear stress values quickly attained those obtained prior to the stress relaxation stage.
The vertical displacements recorded during the multistage tests (Figure 5b,d,f) showed that the specimens experienced some additional vertical settlement during the stress relaxation stage, which was mobilised at a relatively slow rate. The specimens mainly exhibited a contractive behaviour during shearing, with the maximum settlement at the end of the tests ranging from 0.07 to 1.23 mm under different test conditions. These values are relatively similar to those reached at the end of the conventional tests per-formed under constant displacement rate and varying normal stresses (0.27 to 0.97 mm).
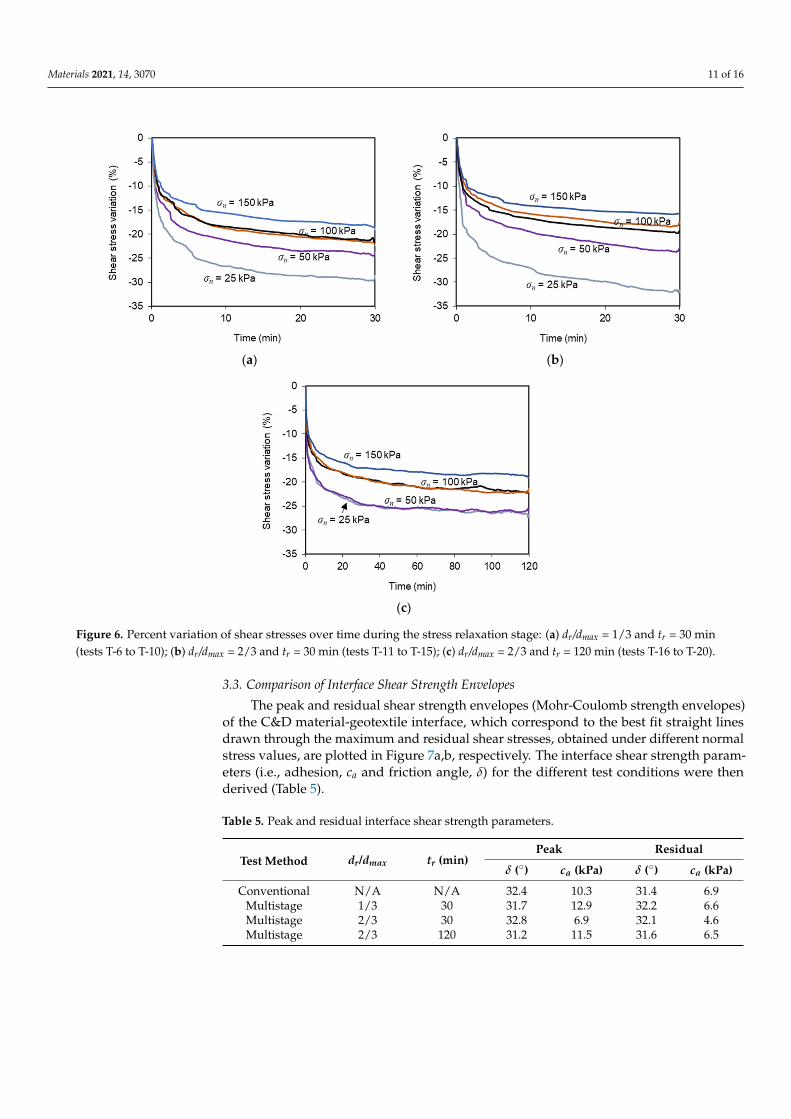
Figure 6 plots the percent variation of shear stress recorded during the multistage tests when the shear box was restrained from any movement for 30 min (tests T-6 to T-15; Figure 6a,b) or 120 min (tests T-16 to T-20; Figure 6c). Figure 6a is related to a displacement dr = 1/3 dmax, whereas Figure 6b,c are related to a displacement dr = 2/3 dmax.
(a) (b)
Figure 5. Time-dependent interface response under varying test conditions: (a,b) dr/dmax = 1/3 and tr = 30 min (tests T-6 toT-10); (c,d) dr/dmax = 2/3 and tr = 30 min (tests T-11 to T-15); (e,f) dr/dmax = 2/3 and tr = 120 min (tests T-16 to T-20).
The evolution of shear stresses throughout the multistage tests followed similar trendsto those observed in the corresponding benchmark tests, except for the stress reductionrecorded during the period in which the shear displacement was restrained (Figure 5a,c,e).This stress reduction can be attributed to stress relaxation. Once the shear displacement wasrestarted, the shear stress-shear displacement curves exhibited high stiffness, and hencethe shear stress values quickly attained those obtained prior to the stress relaxation stage.
The vertical displacements recorded during the multistage tests (Figure 5b,d,f) showedthat the specimens experienced some additional vertical settlement during the stressrelaxation stage, which was mobilised at a relatively slow rate. The specimens mainlyexhibited a contractive behaviour during shearing, with the maximum settlement at theend of the tests ranging from 0.07 to 1.23 mm under different test conditions. These valuesare relatively similar to those reached at the end of the conventional tests performed underconstant displacement rate and varying normal stresses (0.27 to 0.97 mm).
Figure 6 plots the percent variation of shear stress recorded during the multistagetests when the shear box was restrained from any movement for 30 min (tests T-6 to T-15;Figure 6a,b) or 120 min (tests T-16 to T-20; Figure 6c). Figure 6a is related to a displacementdr = 1/3 dmax, whereas Figure 6b,c are related to a displacement dr = 2/3 dmax.
Regardless of the shear displacement dr, the shear stress decreased at a faster rateat the beginning of the stress relaxation stage, and then, the rate of stress decay reducedprogressively over time. Beyond the initial 30 min, the additional stress reduction wasalmost negligible (Figure 6c). It can also be observed that the percent reduction of shearstress, recorded during the stress relaxation stage, became more pronounced as the nor-mal stress was progressively decreased. For instance, for dr/dmax = 1/3 and tr = 30 min(Figure 6a), the shear stress decreased by up to 30% under the normal stress of 25 kPa,whereas an 18% stress reduction was observed under the normal stress of 150 kPa. Thisfinding suggests that the time-dependent phenomena, taking place at the studied interface,are more pronounced under lower normal stress values.
The displacement dr did not significantly affect the stress relaxation observed in thesetests. In fact, for dr = 2/3 dmax and tr = 30 min (Figure 6b), the percent reductions of the shearstress were similar to those attained under the lower dr value (e.g., 32% for σn = 25 kPaand 16% for σn = 150 kPa). When the stress relaxation period (tr) was increased to 120 min(Figure 6c), the stress reductions were generally slightly higher than those reached aftertr = 30 min (Figure 6b).
Materials 2021, 14, 3070 11 of 16
Materials 2021, 14, x FOR PEER REVIEW 10 of 16
(e) (f)
Figure 5. Time-dependent interface response under varying test conditions: (a,b) dr/dmax = 1/3 and tr = 30 min (tests T-6 to T-10); (c,d) dr/dmax = 2/3 and tr = 30 min (tests T-11 to T-15); (e,f) dr/dmax = 2/3 and tr = 120 min (tests T-16 to T-20).
The evolution of shear stresses throughout the multistage tests followed similar trends to those observed in the corresponding benchmark tests, except for the stress re-duction recorded during the period in which the shear displacement was restrained (Fig-ure 5a,c,e). This stress reduction can be attributed to stress relaxation. Once the shear dis-placement was restarted, the shear stress-shear displacement curves exhibited high stiff-ness, and hence the shear stress values quickly attained those obtained prior to the stress relaxation stage.
The vertical displacements recorded during the multistage tests (Figure 5b,d,f) showed that the specimens experienced some additional vertical settlement during the stress relaxation stage, which was mobilised at a relatively slow rate. The specimens mainly exhibited a contractive behaviour during shearing, with the maximum settlement at the end of the tests ranging from 0.07 to 1.23 mm under different test conditions. These values are relatively similar to those reached at the end of the conventional tests per-formed under constant displacement rate and varying normal stresses (0.27 to 0.97 mm).
Figure 6 plots the percent variation of shear stress recorded during the multistage tests when the shear box was restrained from any movement for 30 min (tests T-6 to T-15; Figure 6a,b) or 120 min (tests T-16 to T-20; Figure 6c). Figure 6a is related to a displacement dr = 1/3 dmax, whereas Figure 6b,c are related to a displacement dr = 2/3 dmax.
(a) (b)
Materials 2021, 14, x FOR PEER REVIEW 11 of 16
(c)
Figure 6. Percent variation of shear stresses over time during the stress relaxation stage: (a) dr/dmax = 1/3 and tr = 30 min (tests T-6 to T-10); (b) dr/dmax = 2/3 and tr = 30 min (tests T-11 to T-15); (c) dr/dmax = 2/3 and tr = 120 min (tests T-16 to T-20).
Regardless of the shear displacement dr, the shear stress decreased at a faster rate at the beginning of the stress relaxation stage, and then, the rate of stress decay reduced progressively over time. Beyond the initial 30 min, the additional stress reduction was almost negligible (Figure 6c). It can also be observed that the percent reduction of shear stress, recorded during the stress relaxation stage, became more pronounced as the nor-mal stress was progressively decreased. For instance, for dr/dmax = 1/3 and tr = 30 min (Fig-ure 6a), the shear stress decreased by up to 30% under the normal stress of 25 kPa, whereas an 18% stress reduction was observed under the normal stress of 150 kPa. This finding suggests that the time-dependent phenomena, taking place at the studied interface, are more pronounced under lower normal stress values.
The displacement dr did not significantly affect the stress relaxation observed in these tests. In fact, for dr = 2/3 dmax and tr = 30 min (Figure 6b), the percent reductions of the shear stress were similar to those attained under the lower dr value (e.g., 32% for σn = 25 kPa and 16% for σn = 150 kPa). When the stress relaxation period (tr) was increased to 120 min (Figure 6c), the stress reductions were generally slightly higher than those reached after tr = 30 min (Figure 6b).
3.3. Comparison of Interface Shear Strength Envelopes The peak and residual shear strength envelopes (Mohr-Coulomb strength envelopes)
of the C&D material-geotextile interface, which correspond to the best fit straight lines drawn through the maximum and residual shear stresses, obtained under different nor-mal stress values, are plotted in Figure 7a,b, respectively. The interface shear strength pa-rameters (i.e., adhesion, ca and friction angle, δ) for the different test conditions were then derived (Table 5).
Figure 6. Percent variation of shear stresses over time during the stress relaxation stage: (a) dr/dmax = 1/3 and tr = 30 min(tests T-6 to T-10); (b) dr/dmax = 2/3 and tr = 30 min (tests T-11 to T-15); (c) dr/dmax = 2/3 and tr = 120 min (tests T-16 to T-20).
3.3. Comparison of Interface Shear Strength Envelopes
The peak and residual shear strength envelopes (Mohr-Coulomb strength envelopes)of the C&D material-geotextile interface, which correspond to the best fit straight linesdrawn through the maximum and residual shear stresses, obtained under different normalstress values, are plotted in Figure 7a,b, respectively. The interface shear strength param-eters (i.e., adhesion, ca and friction angle, δ) for the different test conditions were thenderived (Table 5).
Table 5. Peak and residual interface shear strength parameters.
Test Method dr/dmax tr (min)Peak Residual
δ (◦) ca (kPa) δ (◦) ca (kPa)
Conventional N/A N/A 32.4 10.3 31.4 6.9Multistage 1/3 30 31.7 12.9 32.2 6.6Multistage 2/3 30 32.8 6.9 32.1 4.6Multistage 2/3 120 31.2 11.5 31.6 6.5

Materials 2021, 14, 3070 12 of 16Materials 2021, 14, x FOR PEER REVIEW 12 of 16
(a)
(b)
Figure 7. Interface shear strength envelopes from conventional (benchmark) and multistage tests: (a) Peak strength envelopes; (b) Residual strength envelopes.
Table 5. Peak and residual interface shear strength parameters.
Test Method dr/dmax tr (min) Peak Residual
δ (°) ca (kPa) δ (°) ca (kPa) Conventional N/A N/A 32.4 10.3 31.4 6.9
Multistage 1/3 30 31.7 12.9 32.2 6.6 Multistage 2/3 30 32.8 6.9 32.1 4.6 Multistage 2/3 120 31.2 11.5 31.6 6.5
Comparing the shear strength envelopes, determined from the benchmark and mul-tistage tests, it becomes apparent that, for the conditions investigated in this study, the influence of stress relaxation on the interface peak and residual shear strength can be con-sidered almost negligible. The values of the peak friction angle, obtained from the multi-stage tests, ranged from 31.2° to 32.8°, whereas the peak friction angle, obtained from the conventional tests, was equal to 32.4°. Regarding the corresponding interface adhesion, the values obtained from the multistage tests varied between 6.9 and 12.9 kPa, whereas the adhesion estimated from the benchmark test was 10.3 kPa. In turn, the residual inter-face friction angle and adhesion ranged from 31.6° to 32.2° and from 4.6 to 6.6 kPa in the
Figure 7. Interface shear strength envelopes from conventional (benchmark) and multistage tests:(a) Peak strength envelopes; (b) Residual strength envelopes.
Comparing the shear strength envelopes, determined from the benchmark and mul-tistage tests, it becomes apparent that, for the conditions investigated in this study, theinfluence of stress relaxation on the interface peak and residual shear strength can beconsidered almost negligible. The values of the peak friction angle, obtained from themultistage tests, ranged from 31.2◦ to 32.8◦, whereas the peak friction angle, obtainedfrom the conventional tests, was equal to 32.4◦. Regarding the corresponding interfaceadhesion, the values obtained from the multistage tests varied between 6.9 and 12.9 kPa,whereas the adhesion estimated from the benchmark test was 10.3 kPa. In turn, the residualinterface friction angle and adhesion ranged from 31.6◦ to 32.2◦ and from 4.6 to 6.6 kPain the multistage tests, respectively. Similar values were determined from the benchmarktests (31.4◦ and 6.9 kPa, respectively).
These results suggest that neither the stress relaxation period, nor the shear displace-ment at which stress relaxation occurs, are susceptible to affect the interface peak andresidual shear strength, implying that the conventional direct shear tests can be consideredsuitable to characterise the long-term interface strength properties under direct shear mode.
It is noteworthy that the results obtained herein, for the C&D material-geotextileinterface, are in good agreement with those reported in previous studies involving naturalsoils and a similar high-strength geotextile [12,44], as well as recycled C&D materials and
Materials 2021, 14, 3070 13 of 16
other geosynthetics [14,45,46]. Previous studies carried out with similar recycled C&Dmaterials have shown that, when properly compacted, these recycled materials can exhibitshear strength similar to, or even greater than, that of natural soils commonly used in theconstruction of geosynthetic-reinforced structures [13,45,47].
The aforementioned evidence supports the feasibility of using these fine-grainedrecycled C&D materials as a substitute backfill material in the construction of geosynthetic-reinforced structures, which would represent a valuable contribution towards the imple-mentation of circular economy in the construction sector.
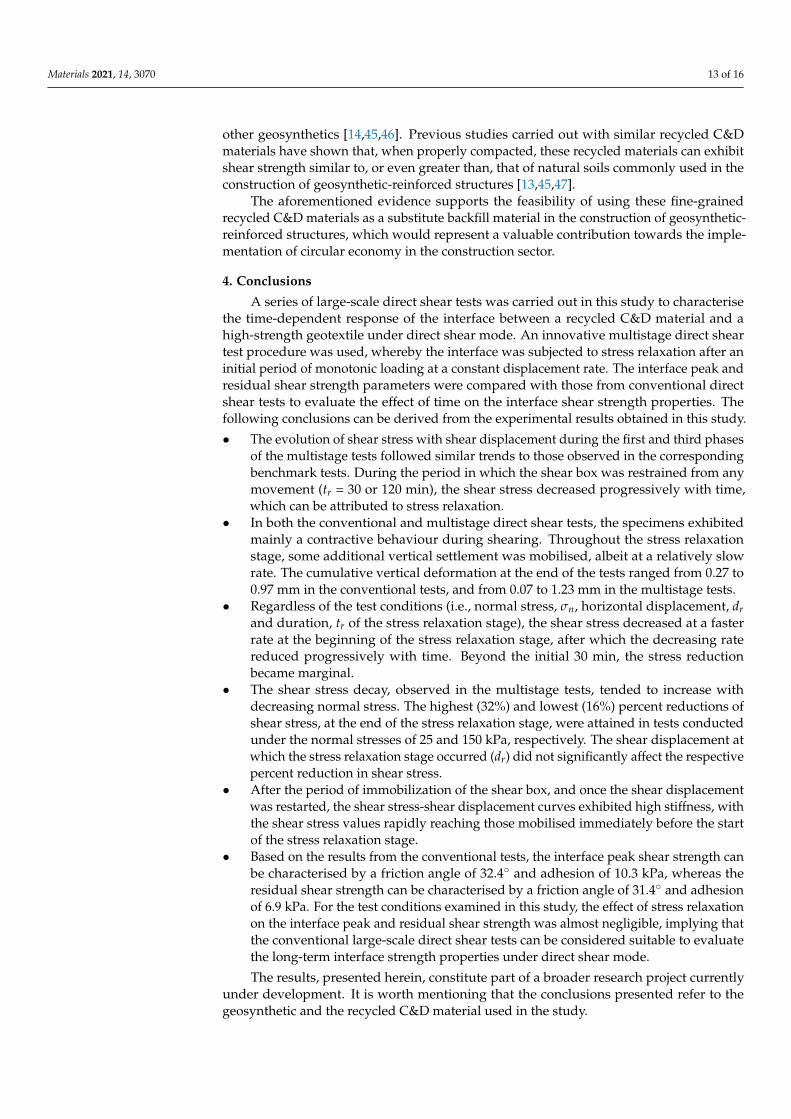
4. Conclusions
A series of large-scale direct shear tests was carried out in this study to characterisethe time-dependent response of the interface between a recycled C&D material and ahigh-strength geotextile under direct shear mode. An innovative multistage direct sheartest procedure was used, whereby the interface was subjected to stress relaxation after aninitial period of monotonic loading at a constant displacement rate. The interface peak andresidual shear strength parameters were compared with those from conventional directshear tests to evaluate the effect of time on the interface shear strength properties. Thefollowing conclusions can be derived from the experimental results obtained in this study.
• The evolution of shear stress with shear displacement during the first and third phasesof the multistage tests followed similar trends to those observed in the correspondingbenchmark tests. During the period in which the shear box was restrained from anymovement (tr = 30 or 120 min), the shear stress decreased progressively with time,which can be attributed to stress relaxation.
• In both the conventional and multistage direct shear tests, the specimens exhibitedmainly a contractive behaviour during shearing. Throughout the stress relaxationstage, some additional vertical settlement was mobilised, albeit at a relatively slowrate. The cumulative vertical deformation at the end of the tests ranged from 0.27 to0.97 mm in the conventional tests, and from 0.07 to 1.23 mm in the multistage tests.
• Regardless of the test conditions (i.e., normal stress, σn, horizontal displacement, drand duration, tr of the stress relaxation stage), the shear stress decreased at a fasterrate at the beginning of the stress relaxation stage, after which the decreasing ratereduced progressively with time. Beyond the initial 30 min, the stress reductionbecame marginal.
• The shear stress decay, observed in the multistage tests, tended to increase withdecreasing normal stress. The highest (32%) and lowest (16%) percent reductions ofshear stress, at the end of the stress relaxation stage, were attained in tests conductedunder the normal stresses of 25 and 150 kPa, respectively. The shear displacement atwhich the stress relaxation stage occurred (dr) did not significantly affect the respectivepercent reduction in shear stress.
• After the period of immobilization of the shear box, and once the shear displacementwas restarted, the shear stress-shear displacement curves exhibited high stiffness, withthe shear stress values rapidly reaching those mobilised immediately before the startof the stress relaxation stage.
• Based on the results from the conventional tests, the interface peak shear strength canbe characterised by a friction angle of 32.4◦ and adhesion of 10.3 kPa, whereas theresidual shear strength can be characterised by a friction angle of 31.4◦ and adhesionof 6.9 kPa. For the test conditions examined in this study, the effect of stress relaxationon the interface peak and residual shear strength was almost negligible, implying thatthe conventional large-scale direct shear tests can be considered suitable to evaluatethe long-term interface strength properties under direct shear mode.
The results, presented herein, constitute part of a broader research project currentlyunder development. It is worth mentioning that the conclusions presented refer to thegeosynthetic and the recycled C&D material used in the study.

Materials 2021, 14, 3070 14 of 16
Author Contributions: Conceptualization, C.S.V., F.B.F. and P.M.P.; methodology, F.B.F., C.S.V. andP.M.P.; formal analysis, F.B.F.; investigation, F.B.F., P.M.P., C.S.V. and M.d.L.L.; resources, C.S.V. andM.d.L.L.; writing—original draft preparation, F.B.F.; writing—review and editing, C.S.V.; supervision,C.S.V.; project administration, C.S.V.; funding acquisition, C.S.V. and M.d.L.L. All authors have readand agreed to the published version of the manuscript.
Funding: This work was financially supported by: Project PTDC/ECI-EGC/30452/2017—POCI-01-0145-FEDER-030452—funded by FEDER funds through COMPETE2020—Programa OperacionalCompetitividade e Internacionalização (POCI) and by national funds (PIDDAC) through FCT/MCTES;Base Funding—UIDB/04708/2020 of the CONSTRUCT—Instituto de I&D em Estruturas e Construções—funded by national funds through the FCT/MCTES (PIDDAC). The second author would also like tothank Fundação para a Ciência e Tecnologia (FCT) for his research grant: SFRH/BD/147838/2019.
Materials 2021, 14, x FOR PEER REVIEW 14 of 16
• Based on the results from the conventional tests, the interface peak shear strength can be characterised by a friction angle of 32.4° and adhesion of 10.3 kPa, whereas the residual shear strength can be characterised by a friction angle of 31.4° and adhesion of 6.9 kPa. For the test conditions examined in this study, the effect of stress relaxation on the interface peak and residual shear strength was almost negligible, implying that the conventional large-scale direct shear tests can be considered suitable to eval-uate the long-term interface strength properties under direct shear mode.
The results, presented herein, constitute part of a broader research project currently under development. It is worth mentioning that the conclusions presented refer to the geosynthetic and the recycled C&D material used in the study.
Author Contributions: Conceptualization, C.S.V., F.B.F. and P.M.P.; methodology, F.B.F., C.S.V. and P.M.P.; formal analysis, F.B.F.; investigation, F.B.F., P.M.P., C.S.V. and M.d.L.L.; resources, C.S.V. and M.d.L.L.; writing—original draft preparation, F.B.F.; writing—review and editing, C.S.V.; supervision, C.S.V.; project administration, C.S.V.; funding acquisition, C.S.V. and M.d.L.L. All authors have read and agreed to the published version of the manuscript.
Funding: This work was financially supported by: Project PTDC/ECI-EGC/30452/2017—POCI-01-0145-FEDER-030452—funded by FEDER funds through COMPETE2020—Programa Operacional Competitividade e Internacionalização (POCI) and by national funds (PIDDAC) through FCT/MCTES; Base Funding—UIDB/04708/2020 of the CONSTRUCT—Instituto de I&D em Estru-turas e Construções—funded by national funds through the FCT/MCTES (PIDDAC). The second author would also like to thank Fundação para a Ciência e Tecnologia (FCT) for his research grant: SFRH/BD/147838/2019.
Institutional Review Board Statement: Not applicable.
Informed Consent Statement: Not applicable.
Data Availability Statement: The data presented in this study are available on request from the corresponding author. The data are not publicly available due to privacy reasons.
Acknowledgments: The authors wish to thank RCD, SA and TenCate Geosynthetics Iberia for providing the recycled C&D material and the geosynthetic used in this study, respectively.
Conflicts of Interest: The authors declare no conflict of interest. The funders had no role in the design of the study; in the collection, analyses, or interpretation of data; in the writing of the manu-script, or in the decision to publish the results.
References 1. Palmeira, E.M. Soil–geosynthetic interaction: Modelling and analysis. Geotext. Geomembr. 2009, 27, 368–390,
doi:10.1016/j.geotexmem.2009.03.003. 2. Lopes, M.L. Soil-geosynthetic interaction. In Handbook of Geosynthetic Engineering; Ice Publishing, Thomas Telford Ltd.: London,
UK, 2012; pp. 45–66. 3. Moraci, N.; Cardile, G.; Gioffrè, D.; Mandaglio, M.C.; Calvarano, L.S.; Carbone, L. Soil Geosynthetic Interaction: Design
Parameters from Experimental and Theoretical Analysis. Transp. Infrastruct. Geotechnol. 2014, 1, 165–227, doi:10.1007/s40515-014-0007-2.
4. Mendes, M.J.A.; Palmeira, E.M.; Matheus, E. Some factors affecting the in-soil load–strain behaviour of virgin and damaged nonwoven geotextiles. Geosynth. Int. 2007, 14, 39–50, doi:10.1680/gein.2007.14.1.39.
5. Liu, C.-N.; Ho, Y.-H.; Huang, J.-W. Large scale direct shear tests of soil/PET-yarn geogrid interfaces. Geotext. Geomembr. 2009, 27, 19–30, doi:10.1016/j.geotexmem.2008.03.002.
6. Ezzein, F.M.; Bathurst, R.J. A new approach to evaluate soil-geosynthetic interaction using a novel pullout test apparatus and transparent granular soil. Geotext. Geomembr. 2014, 42, 246–255, doi:10.1016/j.geotexmem.2014.04.003.
7. Ferreira, F.; Vieira, C.; Lopes, M.; Carlos, D. Experimental investigation on the pullout behaviour of geosynthetics embedded in a granite residual soil. Eur. J. Environ. Civ. Eng. 2015, 20, 1147–1180, doi:10.1080/19648189.2015.1090927.
Institutional Review Board Statement: Not applicable.
Informed Consent Statement: Not applicable.
Data Availability Statement: The data presented in this study are available on request from thecorresponding author. The data are not publicly available due to privacy reasons.
Acknowledgments: The authors wish to thank RCD, SA and TenCate Geosynthetics Iberia forproviding the recycled C&D material and the geosynthetic used in this study, respectively.
Conflicts of Interest: The authors declare no conflict of interest. The funders had no role in the designof the study; in the collection, analyses, or interpretation of data; in the writing of the manuscript, orin the decision to publish the results.
References1. Palmeira, E.M. Soil–geosynthetic interaction: Modelling and analysis. Geotext. Geomembr. 2009, 27, 368–390. [CrossRef]2. Lopes, M.L. Soil-geosynthetic interaction. In Handbook of Geosynthetic Engineering; Ice Publishing, Thomas Telford Ltd.: London,
UK, 2012; pp. 45–66.3. Moraci, N.; Cardile, G.; Gioffrè, D.; Mandaglio, M.C.; Calvarano, L.S.; Carbone, L. Soil Geosynthetic Interaction: Design
Parameters from Experimental and Theoretical Analysis. Transp. Infrastruct. Geotechnol. 2014, 1, 165–227. [CrossRef]4. Mendes, M.J.A.; Palmeira, E.M.; Matheus, E. Some factors affecting the in-soil load–strain behaviour of virgin and damaged
nonwoven geotextiles. Geosynth. Int. 2007, 14, 39–50. [CrossRef]5. Liu, C.-N.; Ho, Y.-H.; Huang, J.-W. Large scale direct shear tests of soil/PET-yarn geogrid interfaces. Geotext. Geomembr. 2009, 27,
19–30. [CrossRef]6. Ezzein, F.M.; Bathurst, R.J. A new approach to evaluate soil-geosynthetic interaction using a novel pullout test apparatus and
transparent granular soil. Geotext. Geomembr. 2014, 42, 246–255. [CrossRef]7. Ferreira, F.; Vieira, C.; Lopes, M.; Carlos, D. Experimental investigation on the pullout behaviour of geosynthetics embedded in a
granite residual soil. Eur. J. Environ. Civ. Eng. 2015, 20, 1147–1180. [CrossRef]8. Ferreira, F.B.; Vieira, C.S.; Lopes, M.L. Soil-geosynthetic interface strength properties from inclined plane and direct shear tests—A
comparative analysis. In Proceedings of the 6th Asian Regional Conference on Geosynthetics, New Delhi, India, 8–11 November2016; pp. 925–937.
9. Shaykhi, P.; Briançon, L.; Lajevardi, S.H. Experimental evaluation of geosynthetics interface friction with a new procedure byusing inclined plane. Innov. Infrastruct. Solut. 2020, 5, 1–12. [CrossRef]
10. Ferreira, F.B.; Vieira, C.S.; Lopes, M.D.L. Pullout Behavior of Different Geosynthetics—Influence of Soil Density and MoistureContent. Front. Built Environ. 2020, 6, 1–13. [CrossRef]
11. Chen, J.-F.; Gu, Z.-A.; Rajesh, S.; Yu, S.-B. Pullout Behavior of Triaxial Geogrid Embedded in a Transparent Soil. Int. J. Géoméch.2021, 21, 04021003. [CrossRef]
12. Ferreira, F.B.; Vieira, C.S.; Lopes, M.L. Direct shear behaviour of residual soil–geosynthetic interfaces–influence of soil moisturecontent, soil density and geosynthetic type. Geosynth. Int. 2015, 22, 257–272. [CrossRef]
13. Santos, E.C.; Palmeira, E.M.; Bathurst, R.J. Behaviour of a geogrid reinforced wall built with recycled construction and demolitionwaste backfill on a collapsible foundation. Geotext. Geomembr. 2013, 39, 9–19. [CrossRef]
14. Vieira, C.S.; Pereira, P.M.; Lopes, M.D.L. Recycled Construction and Demolition Wastes as filling material for geosyntheticreinforced structures. Interface properties. J. Clean. Prod. 2016, 124, 299–311. [CrossRef]
15. Vieira, C.S.; Ferreira, F.B.; Pereira, P.M.; Lopes, M.D.L. Pullout behaviour of geosynthetics in a recycled construction anddemolition material–Effects of cyclic loading. Transp. Geotech. 2020, 23, 100346. [CrossRef]
Materials 2021, 14, 3070 15 of 16
16. Maghool, F.; Senanayake, M.; Arulrajah, A.; Horpibulsuk, S. Permanent deformation and rutting resistance of demolition wastetriple blends in unbound pavement applications. Materials 2021, 14, 798. [CrossRef]
17. Pourkhorshidi, S.; Sangiorgi, C.; Torreggiani, D.; Tassinari, P. Using Recycled Aggregates from Construction and DemolitionWaste in Unbound Layers of Pavements. Sustainability 2021, 280, 122499. [CrossRef]
18. Vieira, C.S.; Pereira, P.; Ferreira, F.; Lopes, M.D.L. Pullout Behaviour of Geogrids Embedded in a Recycled Construction andDemolition Material. Effects of Specimen Size and Displacement Rate. Sustainability 2020, 12, 3825. [CrossRef]
19. Jiménez, J.R.; Ayuso, J.; Agrela, F.; López, M.; Galvín, A.P. Utilisation of unbound recycled aggregates from selected CDW inunpaved rural roads. Resour. Conserv. Recycl. 2012, 58, 88–97. [CrossRef]
20. European Commission. EU Circular Economy Action Plan. 2020. Available online: https://ec.europa.eu/environment/circular-economy/ (accessed on 20 February 2021).
21. European Commission. EU Construction & Demolition Waste Management Protocol. 2018. Available online: https://ec.europa.eu/growth/content/eu-construction-and-demolition-waste-protocol-0_en (accessed on 20 February 2021).
22. Costa, C.M.L.; Zornberg, J.G. Novel experimental techniques to assess the time-dependent deformations of geosynthetics undersoil confinement. J. Rock Mech. Geotech. Eng. 2021, 13, 410–419. [CrossRef]
23. Sawicki, A.; Swidzinski, W. Unconfined Versus Confined Testing of Geosynthetics. Geosynth. Int. 1999, 6, 157–169. [CrossRef]24. Becker, L.D.B.; Nunes, A.L.L.D.S. Influence of soil confinement on the creep behavior of geotextiles. Geotext. Geomembr. 2015, 43,
351–358. [CrossRef]25. Leshchinsky, D.; Dechasakulsom, M.; Kaliakin, V.N.; Ling, H.I. Creep and stress relaxation of geogrids. Geosynth. Int. 1997, 4,
463–479. [CrossRef]26. Bathurst, R.J.; Huang, B.Q.; Allen, T.M. Interpretation of laboratory creep testing for reliability-based analysis and load and
resistance factor design (LRFD) calibration. Geosynth. Int. 1997, 4, 463–479. [CrossRef]27. Li, A.; Rowe, R. Influence of Creep and Stress-Relaxation of Geosynthetic Reinforcement on Embankment Behaviour. Geosynth.
Int. 2001, 8, 233–270. [CrossRef]28. Kongkitkul, W.; Tatsuoka, F.; Hirakawa, D. Creep rupture curve for simultaneous creep deformation and degradation of
geosynthetic reinforcement. Geosynth. Int. 2007, 14, 189–200. [CrossRef]29. Miyata, Y.; Bathurst, R.J.; Allen, T.M. Reliability analysis of geogrid creep data in Japan. Soils Found. 2014, 54, 608–620. [CrossRef]30. Kongkitkul, W.; Chantachot, T.; Tatsuoka, F. Simulation of geosynthetic load–strain–time behaviour by the non-linear three-
component model. Geosynth. Int. 2014, 21, 244–255. [CrossRef]31. Pinho-Lopes, M.; Paula, A.M.; Lopes, M.L. Long-term response and design of two geosynthetics: Effect of field installation
damage. Geosynth. Int. 2018, 25, 98–117. [CrossRef]32. Nuntapanich, N.; Kongkitkul, W.; Tatsuoka, F.; Jongpradist, P. Prediction of creep behaviour from load relaxation behaviour of
polymer geogrids. Geosynth. Int. 2018, 25, 334–349. [CrossRef]33. Dias Filho, J.L.E.D.; Maia, P.; Xavier, G.D.C. A short-term model for extrapolating unconfined creep deformation data for woven
geotextiles. Geotext. Geomembr. 2019, 47, 792–797. [CrossRef]34. Allen, T.; Bathurst, R. Observed Long-Term Performance of Geosynthetic Walls and Implications for Design. Geosynth. Int. 2002,
9, 567–606. [CrossRef]35. CEN. Tests for Geometrical Properties of Aggregates—Part 11: Classification Test for the Constituents of Coarse Recycled Aggregate; EN
933-11; CEN: Brussels, Belgium, 2009.36. CEN. Tests for Geometrical Properties of Aggregates—Part 1: Determination of Particle Size Distribution–Sieving Method; EN 933-1; CEN:
Brussels, Belgium, 2012.37. CEN. Geotechnical Investigation and Testing–Laboratory Testing of Soil—Part 4: Determination of Particle Size Distribution; ISO/TS
17892-4; CEN: Brussels, Belgium, 2016.38. CEN. Unbound and Hydraulically Bound Mixtures—Part 2: Test Methods for Laboratory Reference Density and Water Content–Proctor
Compaction; EN 13286-2; CEN: Brussels, Belgium, 2010.39. CEN. Characterisation of Waste–Leaching–Compliance Test for Leaching of Granular Waste Material and Sludges—Part 4; EN 12457-4;
CEN: Brussels, Belgium, 2002.40. European Commission, Council Decision 2003/33/EC. Establishing Criteria and Procedures for the Acceptance of Waste at Landfills
Pursuant to Article 16 of and Annex II to Directive; 1999/31/EC.; L11/27; Official Journal of the European Union: Luxembourg, 2003.41. Jang, Y.-C.; Townsend, T. Sulfate leaching from recovered construction and demolition debris fines. Adv. Environ. Res. 2001, 5,
203–217. [CrossRef]42. Vieira, C.S.; Lopes, M.L.; Caldeira, L. Sand-geotextile interface characterisation through monotonic and cyclic direct shear tests.
Geosynth. Int. 2013, 20, 26–38. [CrossRef]43. CEN. Geosynthetics–Determination of Friction Characteristics—Part 1: Direct Shear Test; EN ISO 12957-1; CEN: Brussels, Belgium,
2018.44. Ferreira, F.B.; Vieira, C.S.; Lopes, M.L. Analysis of soil-geosynthetic interfaces shear strength through direct shear tests. In
Proceedings of the International Symposium on Design and Practice of Geosynthetic-Reinforced Soil Structures, Bologna, Italy,14–16 October 2013.
45. Vieira, C.S.; Pereira, P.M. Use of Mixed Construction and Demolition Recycled Materials in Geosynthetic Reinforced Embankments.Indian Geotech. J. 2017, 48, 279–292. [CrossRef]

Materials 2021, 14, 3070 16 of 16
46. Arulrajah, A.; Rahman, M.A.; Piratheepan, J.; Bo, M.W.; Imteaz, M.A. Evaluation of Interface Shear Strength Properties ofGeogrid-Reinforced Construction and Demolition Materials Using a Modified Large-Scale Direct Shear Testing Apparatus. J.Mater. Civ. Eng. 2014, 26, 974–982. [CrossRef]
47. Vieira, C.S.; Pereira, P.M. Interface shear properties of geosynthetics and construction and demolition waste from large-scaledirect shear tests. Geosynth. Int. 2015, 23, 1–9. [CrossRef]