tips annual forum june 2016 author: keith …forum.tips.org.za/images/forum...
TRANSCRIPT

1
Analysis of Investment in Mining
TIPS Annual Forum
June 2016
Author: Keith Lockwood
2
List of acronyms used in this document
ASX Australian Securities Exchange
COMTRADE United Nations International Trade Statistics Database
E&MJ Engineering and Mining Journal
EPC Engineering, Procurement, Construction
FIRB Foreign Investment Review Board
GEC Global Economic Crisis
GFCF Gross Fixed Capital Formation
GVA Gross Value Added
ITC International Trade Centre
JSE Johannesburg Stock Exchange
LPI Logistics Performance Index
PGMs Platinum Group Metals
ROA Return on Assets
UNCTAD United Nations Conference on Trade and Development

3
Table of Contents
List of acronyms used in this document ................................................................................................... 2 1. Introduction ...................................................................................................................................... 5 2. The global context for investment in the mining sector .................................................................... 6 3. The nature of global investment in the metals mining sectors ....................................................... 10 4. Investment in the mining and quarrying sector in South Africa ...................................................... 12 5. The nature of investment in mining in South Africa ........................................................................ 17 6. Looking for reasons to explain the observed investment trends and investment prospects in mining in South Africa ....................................................................................................................................... 19
6.1 Australia ................................................................................................................................. 23
6.2 Canada .................................................................................................................................. 24
7. Summary and conclusion .............................................................................................................. 24 8. References and data sources ........................................................................................................ 27 Annexures ............................................................................................................................................. 28
List of Figures
Figure 1: Contrasting prices and capital expenditure in mining during two bear markets ........................ 6
Figure 2: Value and nature of global capital expenditure in mining .......................................................... 7
Figure 3: Relative trends in the stock value of FDI (US$) in mining and quarrying from 2004 to 2012 –
Australia, South Africa, Chile and Canada ............................................................................................... 8
Figure 4: The value and share of global investment in 2013 by type of metal mined ............................... 9
Figure 5: Mineral exports contribution to total merchandise export earnings ......................................... 12
Figure 6: Relative trends in real gross fixed capital formation by sector ................................................ 13
Figure 7: The value of gross fixed capital formation in mining by asset type ......................................... 13
Figure 8: The value and composition of the real fixed capital stock in the mining and quarrying sector 14
Figure 9: The value and composition of the fixed capital stock in the mining and quarrying sector by
type of mineral mined ............................................................................................................................ 14
Figure 10: Relative trends in the nominal value of the fixed capital stock for the major mining product
categories .............................................................................................................................................. 15
Figure 11: Comparative return on assets for different minerals, 2009 and 2013 ................................... 16
Figure 12: Gross fixed capital formation as a percentage of GVA ......................................................... 16
Figure 13: Estimated value chain for gold and uranium ore mining in 2014 .......................................... 20
Figure 14: Relationship between Ease of Doing Business ranking and share of global mining
investment project value in 2013 ........................................................................................................... 21
Figure 15: Relationship between Logistics Performance Index ranking and share of global mining
investment project value in 2013 ........................................................................................................... 22
Figure 16: Comparative LPI component scores for major mining investment destinations .................... 23
4
List of Tables
Table 1: Reported value of FDI inflows into the mining sector in 2012 .................................................... 8
Table 2: South Africa's share of global investment in the metals mining sector ....................................... 9
Table 3: Value of mining investment projects in the metals mining sectors in 2013 .............................. 10
Table 4: The number of greenfield metals mining investment projects globally by stage and their
aggregate and average value in 2012 and 2013.................................................................................... 11
Table 5: The number of brownfield and sustaining metals mining investment projects globally by stage
and their aggregate and average value in 2012 and 2013 ..................................................................... 11
Table 6: The number of greenfield mining investment projects in South Africa by stage and their
aggregate and average value in 2012 and 2013.................................................................................... 17
Table 7: The number of brownfield and sustaining mining investment projects in South Africa by stage
and their aggregate and average value in 2012 and 2013 ..................................................................... 18
Table 8: Contrasting the structure and nature of mining in 2013 in the rest of the world with that in
South Africa ........................................................................................................................................... 18
Annexures
Annexure 1: Accumulated stock value of FDI inflows into the mining sector as at end 2012 ................. 28
Annexure 2: Rankings of the top 10 countries in terms of the value of mining investment in the metals
mining sectors ....................................................................................................................................... 28
Annexure 3: Revealed competitive advantage of South African mineral exports: 2008 to 2014 ............ 29
Annexure 4: Estimated shares of the total fixed capital stock of the mining sector by type of mineral
mined ..................................................................................................................................................... 30
Annexure 5: Return on assets by type of mineral mined ....................................................................... 30
Annexure 6: Estimated value chain for coal mining in 2014 .................................................................. 31
Annexure 7: Estimated value chain for other mining in 2014 ................................................................. 31
Annexure 8: Comparative World Bank Logistics Performance Index scores for major mining investment
recipients - 2014 .................................................................................................................................... 32

5
1. Introduction
South Africa’s mining sector has been through a torrid time since the Global Economic Crisis (GEC)
that commenced in 2008. The commodity boom that preceded the crisis has been followed by an
extended bear market characterized by volatile and generally declining prices, falling profits, and
fractious labour relations. While output has not declined in absolute terms over the whole post GEC-
period, there have been periods of negative growth and few indications of a recovery that can be
sustained. This is not an environment that would typically be regarded as being conducive to rising
levels of investment in the sector.
In its traditional economic sense, the act of investment constitutes an addition to the fixed capital stock
of an economy. Since fixed capital - in the form of buildings, machinery and equipment, and transport
equipment - is a critical input into most production processes, increases in the quantity and/or quality of
capital assets is typically associated with an expansion in production capacity and is a prerequisite for
economic growth. As part of the existing fixed capital is consumed during the production process,
increases in the fixed capital stock requires that gross new investment flows exceed the value of the
fixed capital consumed within the same period. Investment can also reflect financial flows arising from
changing ownership of assets that may have very little to do with underlying changes in the quantum of
fixed capital. In such cases, the economic value of this investment can arise from the freeing-up of
capital for investment in new ventures in the same sector, or investment in others sectors. The new
owners may also be more adept at extracting value from the asset than the previous owners.
In order for private investment projects to be undertaken, they should yield returns that exceed the cost
of the financial capital employed, and at least match risk-adjusted returns on alternative uses of that
capital. For this reason, investment in a particular economy, or sector, is viewed as an expression of
confidence in its future. Levels of investment in South Africa’s mining sector can therefore be regarded
as something of a barometer of the sector’s health and relative attractiveness, when compared with
investments in other sectors, or in mining activities in other parts of the world.
This study analyses investment trends in mining in South Africa, and contrasts these with similar trends
in both other sectors and other economies, so as to provide a perspective of the sector’s relative health
and future prospects. In the absence of comprehensive, disaggregated official data the analysis has
had to try to construct a picture of relevant trends using a variety of data sources. These include
aggregated national accounts indicators of investment flows and stocks for mining in South Africa
sourced from the South African Reserve Bank; slightly disaggregated data of the same flows and
stocks from Quantec’s Standardised Industry Database; disaggregated data on the annual financial
performance of operations engaged in mining a wide variety of different metals and minerals sourced
from Statistics South Africa’s Annual Financial Statements analysis; aggregated country data of foreign
direct investment inflows and stocks from the ITC’s Investment Map using UNCTAD and COMTRADE
data; annual surveys of global investment projects in metals mining published by the Engineering and
Mining Journal (E&MJ); and data on aggregated investment project values by type of investment
published by SNL Metals and Mining. The study has also used country ranking data from the World
Bank’s Ease of Doing Business and Logistics Performance indices to assess broader economic, logistic
and administrative factors that may impact on the mining sector in South Africa.
6
None of these sources are without limitations or shortcomings, but it is hoped that together they provide
a reasonably comprehensive and accurate reflection of investment trends in mining.
2. The global context for investment in the mining sector
In the wake of the GEC, most mineral commodity prices plummeted, before recovering strongly
between late 2009 and early 2011 on the back of strong demand from China. However, a strong bear
market then took hold, with the prices of South Africa’s main mining commodities decreasing between
January 2011 and September 2015 as follows:
Coal 58% Iron Ore 68% Gold 17% Platinum 46%
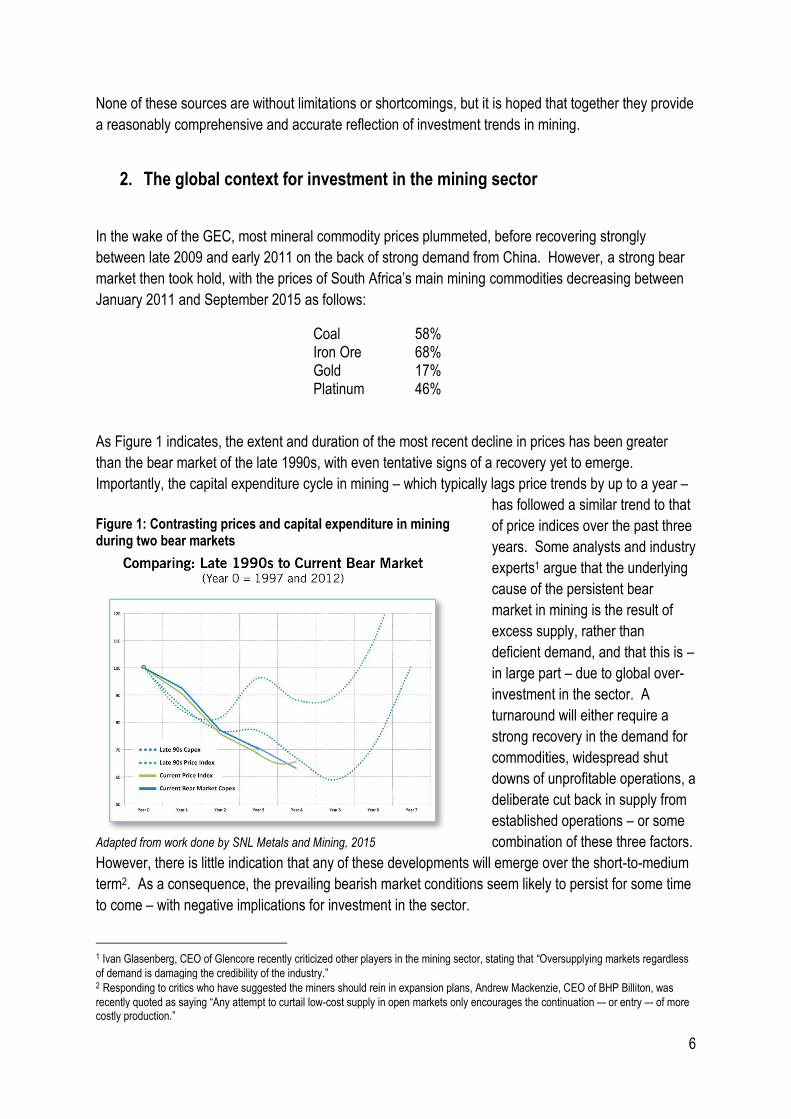
As Figure 1 indicates, the extent and duration of the most recent decline in prices has been greater
than the bear market of the late 1990s, with even tentative signs of a recovery yet to emerge.
Importantly, the capital expenditure cycle in mining – which typically lags price trends by up to a year –
has followed a similar trend to that
of price indices over the past three
years. Some analysts and industry
experts1 argue that the underlying
cause of the persistent bear
market in mining is the result of
excess supply, rather than
deficient demand, and that this is –
in large part – due to global over-
investment in the sector. A
turnaround will either require a
strong recovery in the demand for
commodities, widespread shut
downs of unprofitable operations, a
deliberate cut back in supply from
established operations – or some
combination of these three factors.
However, there is little indication that any of these developments will emerge over the short-to-medium
term2. As a consequence, the prevailing bearish market conditions seem likely to persist for some time
to come – with negative implications for investment in the sector.
1 Ivan Glasenberg, CEO of Glencore recently criticized other players in the mining sector, stating that “Oversupplying markets regardless
of demand is damaging the credibility of the industry.” 2 Responding to critics who have suggested the miners should rein in expansion plans, Andrew Mackenzie, CEO of BHP Billiton, was
recently quoted as saying “Any attempt to curtail low-cost supply in open markets only encourages the continuation –- or entry –- of more costly production.”
Figure 1: Contrasting prices and capital expenditure in mining during two bear markets
Adapted from work done by SNL Metals and Mining, 2015

7
This view seems to be supported
by estimates of the value and
nature of global investment in
mining reflected in Figure 2, which
indicates that by the end of 2015
mining capex could be as much as
30% lower than it was at its peak
in 2012. This decline is expected
to be driven by a 14% decline in
expenditure aimed at sustaining
existing production facilities, a 47%
decline in brownfield investment,
and a 36% fall in greenfield
investments over the same period.
Brownfield investments refer to the
acquisition of existing mining
operations that may have been
“mothballed” or have been
operating unprofitably under their
previous owners. The dramatic fall
in the value of this type of
investment suggests that there are
perceived to be limited opportunities to turn existing loss-making operations into financially-viable
entities given prevailing commodity prices. Similarly, there are substantially fewer unexploited mineral
deposits of sufficient quality to justify greenfield investments in the context of current and anticipated
commodity prices.
Given the transnational character of the global mining industry, levels of foreign direct investment
inflows and accumulated stocks of such investment can provide a proxy for the level of investor
confidence in particular locations, and for underlying capital formation. Table 1 indicates the reported
value of world FDI inflows into the top twenty reporting3 recipient countries. It indicates that Australia
was – by some magnitude – the largest recipient of FDI inflows in 2012, followed by Canada, Malaysia
and Chile. Given that South Africa is excluded, some care should be taken in interpreting these figures
because there is likely to be some reporting bias. Given that commodity prices started to fall during
2011 – signaling the end of the so-called “Super Cycle” - these figures may reflect some residual
investment exuberance. There is also a lag between initial decisions to invest and the related payment
flows, so some of the 2012 flows may have related to investment decisions from 2011, or earlier. The
construction of new mines (greenfield investments) would also typically require investment over a
number of years.
3 South Africa does not currently report FDI flows at a sector level – so it is not included in this analysis.
Figure 2: Value and nature of global capital expenditure in mining
Source: SNL Metals and Mining, 2015
0
50
100
150
200
250
Est
imat
ed
Cap
ex
in t
he
Min
ing
Ind
ust
ry (
US$
Bill
ion
s)
Greenfield
Brownfield
Sustaining Capex

8
The available Investment Map figures do not
differentiate between the mining of different
commodities. However, FDI inflows into some
countries – such as Malaysia and Kazakhstan –
are likely to be dominated by investment in oil
and gas extraction activities.
The stock value of FDI reflects the accumulated
impact of prior investment inflows, adjusted for
changes in the value of the underlying assets.
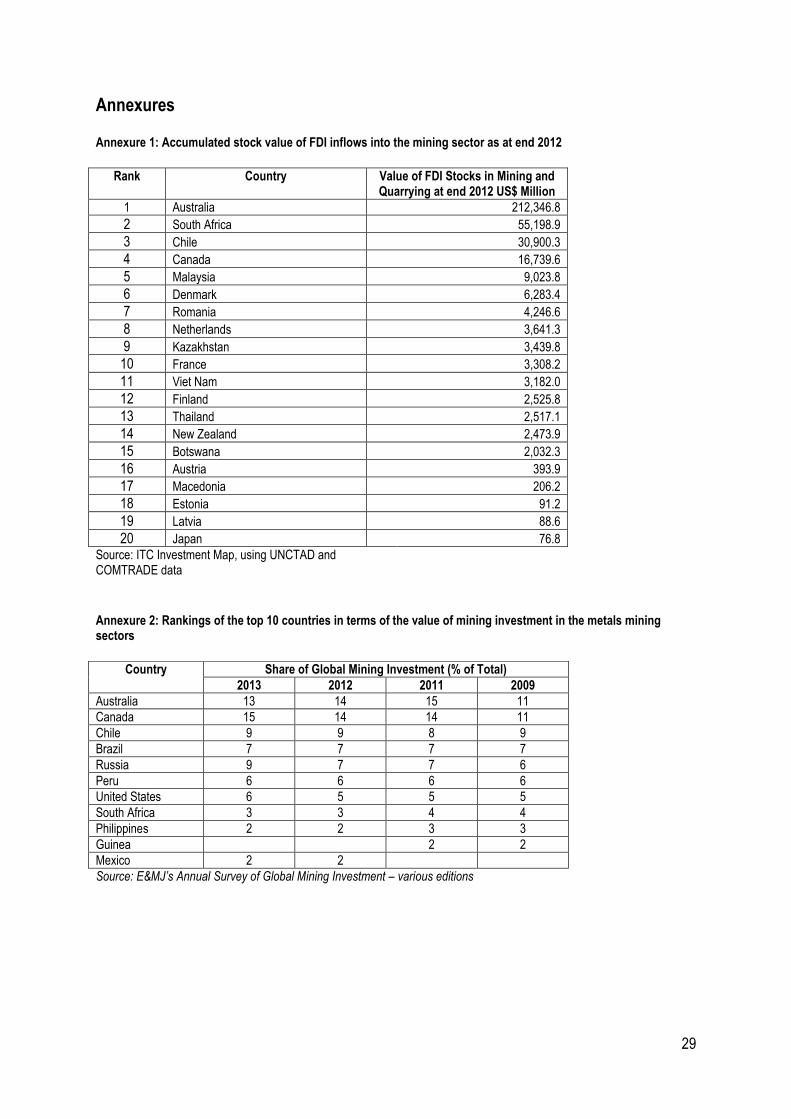
Annexure 1 reflects the twenty countries with the
largest reported stocks of FDI in mining as at the
end of 2012. In this case, South Africa had the
second largest foreign investment in the sector,
with FDI valued at US$55.2 billion (around R453
billion at the exchange rates that prevailed in
2012). This was substantially lower than the
US$212.3 billion of FDI inflows that Australia had
attracted at that time, but significantly more than
Chile (US$30.9 billion) and Canada (US$16.7
billion).
Relative trends in the stock of mining FDI over
time for Australia, South Africa, Chile and
Canada are shown in Figure 3. It indicates
that the stock value of mining FDI in Australia
increased by 458% between 2004 and 2012.
The corresponding increase in South Africa
was only 178%, while in Canada it was 134%
and in Chile only 61%. Between 2004 and
2007, during the commodity boom leading up
to the 2008 GEC – Australia and South Africa
followed similar trends, but Australia was
impacted less severely by the GEC and its
aftermath, and recovered more strongly and
consistently in the years that followed. This
seems likely to have been influenced largely
by the more extensive supply arrangements
between Australia and China. In the company
of these other countries, the decline in FDI
stock values in 2012 in South Africa seems
Table 1: Reported value of FDI inflows into the mining sector in 2012
Rank Country Value of FDI Inflows into Mining and Quarrying in 2012 US$ Million
1 Australia 38,834.6
2 Canada 6,878.4
3 Malaysia 3,117.1
4 Chile 2,837.7
5 Colombia 2,262.7
6 Kazakhstan 1,344.6
7 Dominican Republic 1,167.9
8 Mexico 627.7
9 Denmark 552.6
10 Spain 420.2
11 Romania 344.4
12 France 330.2
13 Italy 317.4
14 Ecuador 224.9
15 Bolivia 218.9
16 Turkey 214.0
17 Viet Nam 167.5
18 Poland 160.6
19 Nicaragua 157.8
20 Czech Republic 134.9
Source: ITC Investment Map, using UNCTAD and COMTRADE data
Figure 3: Relative trends in the stock value of FDI (US$) in mining and quarrying from 2004 to 2012 – Australia, South Africa, Chile and Canada
Source of basic data: ITC Investment Map, using UNCTAD and COMTRADE data
558
278
161
234
0
100
200
300
400
500
600
20
04
20
05
20
06
20
07
20
08
20
09
20
10
20
11
20
12
Ind
ex:
20
04
= 1
00
Australia
South Africa
Chile
Canada

9
likely to have been driven by endogenous factors, including Marikana and the disrupted labour relations
environment of the time, and electricity supply constraints.
An analysis of investment in the mining sector using
data sourced from Engineering and Mining Journal’s
Annual Survey of Global Mining Investment indicates
that South Africa’s ranking has slipped from 7th in 2010
to 8th in 2013. The rankings of the 10 largest investing
destinations from 2008 to 2013 are shown in Annexure
2. More importantly, the country’s share of global
investment has declined as indicated in Error!
Reference source not found. – from 4% in 2009 to
around 3% in 2013. Over the same period, Russia’s
share increased from 6% to 9%, and Brazil and Chile’s
shares remained stable at 7% and 9% respectively.
Canada’s share rose from 11% to 15%. Australia’s
share increased from 11% to 13% but was off its 2011
peak of 15%.
Table 2: South Africa's share of global investment in the metals mining sector
Country Share of Global Mining Investment (% of Total)
2013 2012 2011 2009
Australia 13 14 15 11
Canada 15 14 14 11
Chile 9 9 8 9
Brazil 7 7 7 7
Russia 9 7 7 6
Peru 6 6 6 6
United States 6 5 5 5
South Africa 3 3 4 4
Philippines 2 2 3 3
Guinea 2 2
Mexico 2 2
Source: E&MJ’s Annual Survey of Global Mining Investment – various editions
Figure 4: The value and share of global investment in 2013 by type of metal mined
Copper, 146.3 , 35%
Iron, 144.9 , 35%
Gold, 62.4 , 15%
Nickel, 39.6 , 9%
Uranium, 12.6 , 3%
Diamonds, 4.0 , 1%
Platinum, 3.8 , 1%
Zinc, 2.8 , 1%
Silver, 2.0 , 0% Palladium, 1.5 , 0%
US$ Billions
10
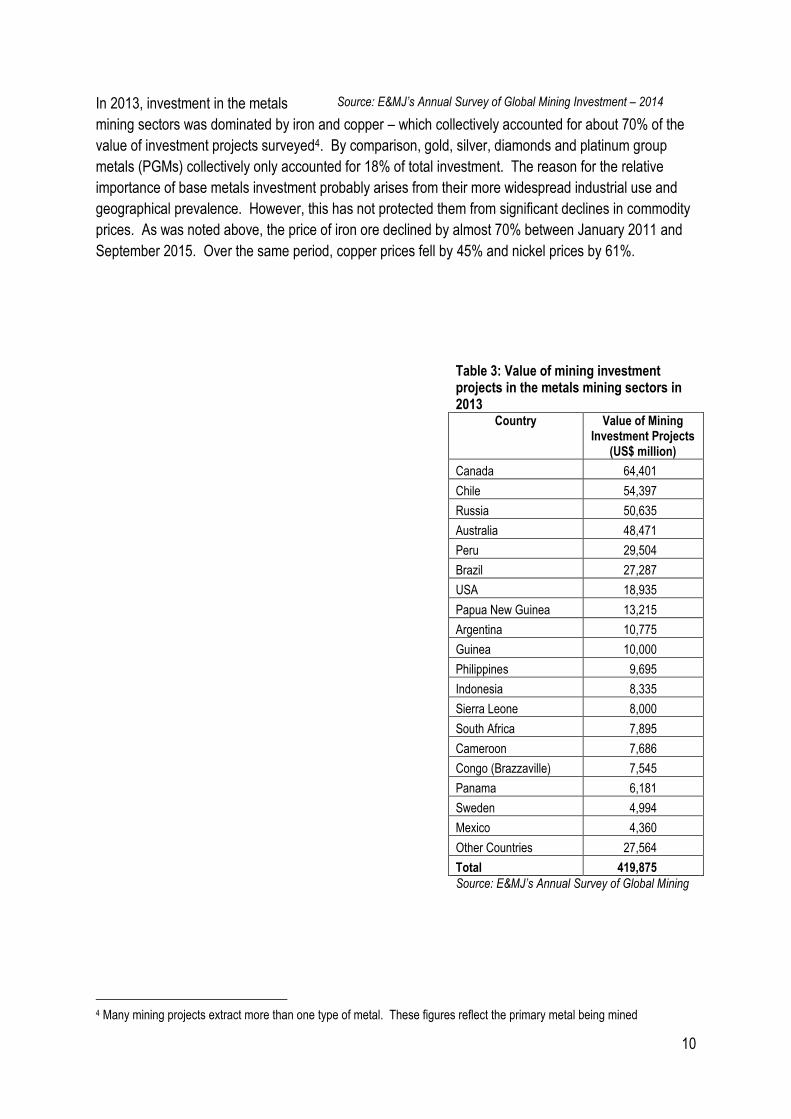
In 2013, investment in the metals
mining sectors was dominated by iron and copper – which collectively accounted for about 70% of the
value of investment projects surveyed4. By comparison, gold, silver, diamonds and platinum group
metals (PGMs) collectively only accounted for 18% of total investment. The reason for the relative
importance of base metals investment probably arises from their more widespread industrial use and
geographical prevalence. However, this has not protected them from significant declines in commodity
prices. As was noted above, the price of iron ore declined by almost 70% between January 2011 and
September 2015. Over the same period, copper prices fell by 45% and nickel prices by 61%.
4 Many mining projects extract more than one type of metal. These figures reflect the primary metal being mined
Source: E&MJ’s Annual Survey of Global Mining Investment – 2014
Table 3: Value of mining investment projects in the metals mining sectors in 2013
Country Value of Mining Investment Projects
(US$ million)
Canada 64,401
Chile 54,397
Russia 50,635
Australia 48,471
Peru 29,504
Brazil 27,287
USA 18,935
Papua New Guinea 13,215
Argentina 10,775
Guinea 10,000
Philippines 9,695
Indonesia 8,335
Sierra Leone 8,000
South Africa 7,895
Cameroon 7,686
Congo (Brazzaville) 7,545
Panama 6,181
Sweden 4,994
Mexico 4,360
Other Countries 27,564
Total 419,875
Source: E&MJ’s Annual Survey of Global Mining

11
Table 3 shows the estimated value of investment projects
by country in 2013. It indicates that global metals mining investment was valued at almost US$420
billion in that year. Of this Canada attracted investment of US$ 64.4 billion, followed by Chile (US$54.4
billion), Russia ((US$50.6 billion) and Australia (US$48.5 billion). Investment in the South African
metals mining sector is estimated at US$7.9 billion (about R76 billion at prevailing exchange rates).
This is similar to Sierra Leone, Cameroon, and Congo Brazzaville.
.
3. The nature of global investment in the metals mining sectors
At the project level, different types of investment go through various stages – creating a “pipeline” of
investment activity that involves different categories of suppliers and service providers. Greenfield
investments will usually first go through a conceptual (sometimes referred to as an order of magnitude
or scoping study) and pre-feasibility phase. Pre-feasibility studies are more detailed than scoping
studies, form part of necessary due diligence, are used to identify areas within the project that require
more work, and aim to determine whether to proceed with a detailed feasibility study. The latter will
provide the basis for capital appropriation, and budgets for the project. They require significant formal
engineering work, should be accurate to within 10-15% and can cost up to 1.5% of the total estimated
project cost. If the detailed feasibility study determines that the project is economically viable and
meets the necessary standards of anticipated returns, the project will move into the construction phase.
5 It is important to acknowledge the limitations of this survey of investment project data. Firstly, it is not clear what degree of coverage the sample has. Secondly, it is not clear that a consistent definition of the expenses that can be included in investment was applied to the responses received. Thirdly, the survey only encompasses metals mining activities, so investment of coal, and petroleum oil and gas extraction – which are significant globally – are not included. Nevertheless, the survey provides important project data that is useful in assessing investment trends with respect to the type of metal being mined, the location of the mining, the type of investment involved, and its announced value.
Investment – 20145
12
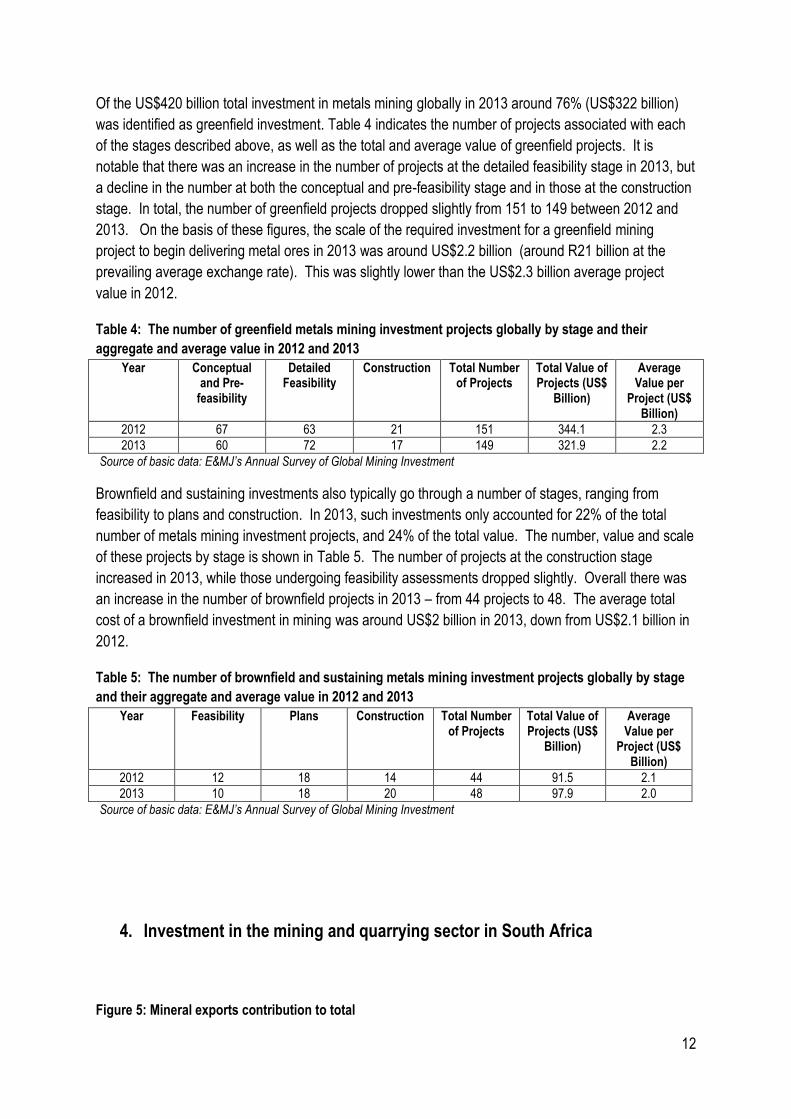
Of the US$420 billion total investment in metals mining globally in 2013 around 76% (US$322 billion)
was identified as greenfield investment. Table 4 indicates the number of projects associated with each
of the stages described above, as well as the total and average value of greenfield projects. It is
notable that there was an increase in the number of projects at the detailed feasibility stage in 2013, but
a decline in the number at both the conceptual and pre-feasibility stage and in those at the construction
stage. In total, the number of greenfield projects dropped slightly from 151 to 149 between 2012 and
2013. On the basis of these figures, the scale of the required investment for a greenfield mining
project to begin delivering metal ores in 2013 was around US$2.2 billion (around R21 billion at the
prevailing average exchange rate). This was slightly lower than the US$2.3 billion average project
value in 2012.
Table 4: The number of greenfield metals mining investment projects globally by stage and their
aggregate and average value in 2012 and 2013
Year Conceptual and Pre-
feasibility
Detailed Feasibility
Construction Total Number of Projects
Total Value of Projects (US$
Billion)
Average Value per
Project (US$ Billion)
2012 67 63 21 151 344.1 2.3
2013 60 72 17 149 321.9 2.2
Source of basic data: E&MJ’s Annual Survey of Global Mining Investment
Brownfield and sustaining investments also typically go through a number of stages, ranging from
feasibility to plans and construction. In 2013, such investments only accounted for 22% of the total
number of metals mining investment projects, and 24% of the total value. The number, value and scale
of these projects by stage is shown in Table 5. The number of projects at the construction stage
increased in 2013, while those undergoing feasibility assessments dropped slightly. Overall there was
an increase in the number of brownfield projects in 2013 – from 44 projects to 48. The average total
cost of a brownfield investment in mining was around US$2 billion in 2013, down from US$2.1 billion in
2012.
Table 5: The number of brownfield and sustaining metals mining investment projects globally by stage
and their aggregate and average value in 2012 and 2013
Year Feasibility Plans Construction Total Number of Projects
Total Value of Projects (US$
Billion)
Average Value per
Project (US$ Billion)
2012 12 18 14 44 91.5 2.1
2013 10 18 20 48 97.9 2.0
Source of basic data: E&MJ’s Annual Survey of Global Mining Investment
4. Investment in the mining and quarrying sector in South Africa
Figure 5: Mineral exports contribution to total

13
There have been significant structural shifts in
South Africa’s earnings from mineral exports –
particularly over the past decade. Whereas
earnings from precious metals and stones
have steadily declined in their contribution to
total merchandise export earnings, from a
peak of 34% in 1997 to under 16% in 2014,
the contribution of ores, slag and ash has
risen from just over 3% to more than 13%
between 2004 and 2014. These trends are
illustrated in Figure 5.
In the wake of the Global Economic Crisis,
South Africa has lost market share in many
categories of metal and mineral products.
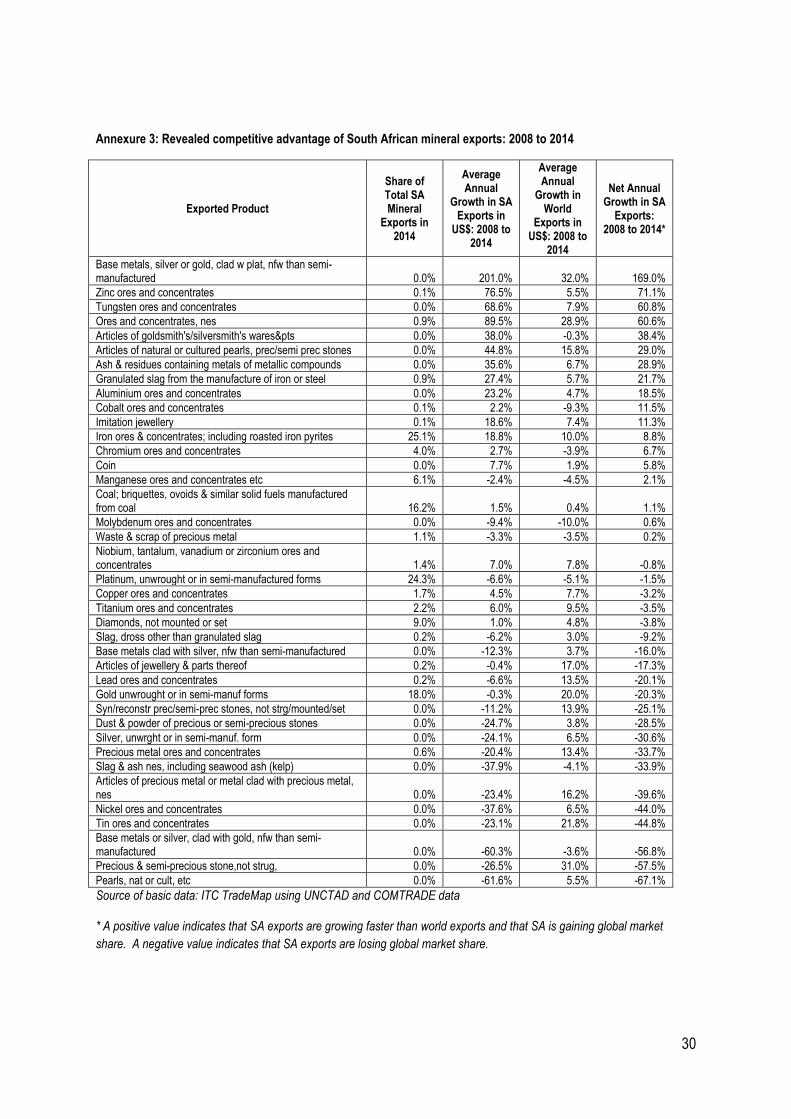
Annexure 3 indicates the share of total South
African metal and mineral exports in 2014, the
average annual percentage change in the
value of South African exports in US dollar
terms, the corresponding average annual
growth in world exports of the same commodity, and the resulting net export growth for South African
exports.
If South African exports of a particular commodity grew at a faster rate than the corresponding rate of
growth in world exports, then this is an indicator of competitive advantages in that commodity.
Conversely, if South African export growth is lower than corresponding world export growth, this is
taken to indicate a competitive disadvantage in that commodity.
The analysis reveals that South Africa gained global market share in 18 mineral product categories
which together accounted for 48.5% of the value of total mineral exports in 2014. The most significant
of the categories that gained market share were iron ore (25% of mineral exports), coal (16% of mineral
exports) and manganese (6% of mineral exports). The country lost global market share in 21 mineral
product categories which collectively accounted for 51.5% of mineral exports in 2014. The most
significant of these was platinum (24% of mineral exports), gold (22% of mineral exports), and
diamonds (9% of mineral exports).
It is not clear what impact levels of gross fixed capital formation in mining had on this export
performance. On the one hand, deteriorating competitiveness suggests deteriorating returns and a
decline in the willingness to invest in the sector. On the other, insufficient investment would limit the
capacity to extract minerals and to grow exports.
merchandise export earnings
Source: South African Revenue Service, via Quantec
Figure 6: Relative trends in real gross fixed capital formation by sector
0%
5%
10%
15%
20%
25%
30%
35%
40%19
9519
9619
9719
9819
9920
0020
0120
0220
0320
0420
0520
0620
0720
0820
0920
1020
1120
1220
1320
14
Sh
are
of
To
tal M
erch
and
ise
Exp
ort
s
Ores, slag & ash Precious metals & stones

14
In the light of this, it is interesting to
compare trends in the levels of gross
fixed capital formation in the mining
and quarrying sector with that of the
other major sectors of the South
African economy. Figure 6 indicates
that while fixed investment in mining
has not performed as well as some
other sectors (construction, utilities,
and transport and communications), it
has performed relatively better than
others – particularly agriculture, finance
and insurance, manufacturing and
trade.
Between 1995 and 2014, the value of
real fixed capital formation in mining
rose by 225%, compared with 388% in
the case of utilities and 11% in agriculture.
The value of fixed capital formation (GFCF) in mining in constant price terms by asset type is shown in
Figure 7. It indicates a drop in investment levels between 2003 and 2005, followed by a dramatic rise
that lasted till 2009. After a slight decrease
in 2009, levels of investment have been
relatively flat in real terms.
While it remains the smallest component of
real GFCF, investment in transport
equipment has shown the strongest growth
since 1995. By 2014, it had increased by
516%. Over the same period, investment in
buildings and construction works increased
in real terms by 283%, and capital
expenditure on machinery and other
equipment rose by 169%. The increased
investment in transport equipment may be a
response to an inability to access Transnet
rail facilities – particularly in the case of
newer mining operations located in areas
unserved by rail. At the same time, there is
relatively little evidence of a dramatic
increase in mechanization within the sector.
Source: South African Reserve Bank, via Quantec
Figure 7: The value of gross fixed capital formation in mining by asset type
Source: Quantec Standardised Industry Database
Figure 8: The value and composition of the real fixed capital
111
488
325
0
100
200
300
400
500
600
Ind
ex:
19
95
= 1
00
Agriculture
Mining
Manufacturing
Utilities
Construction
Transport &Communications
Trade
Finance &Insurance
Community &PersonalServices
0
10
20
30
40
50
60
70
80
Val
ue
of
Gro
ss F
ixed
Cap
ital
Fo
rmat
ion
at
Co
nst
ant
2010
P
rice
s
(R B
illio
ns)
Transport equipment
Machinery and otherequipment
Buildings and constructionworks
15
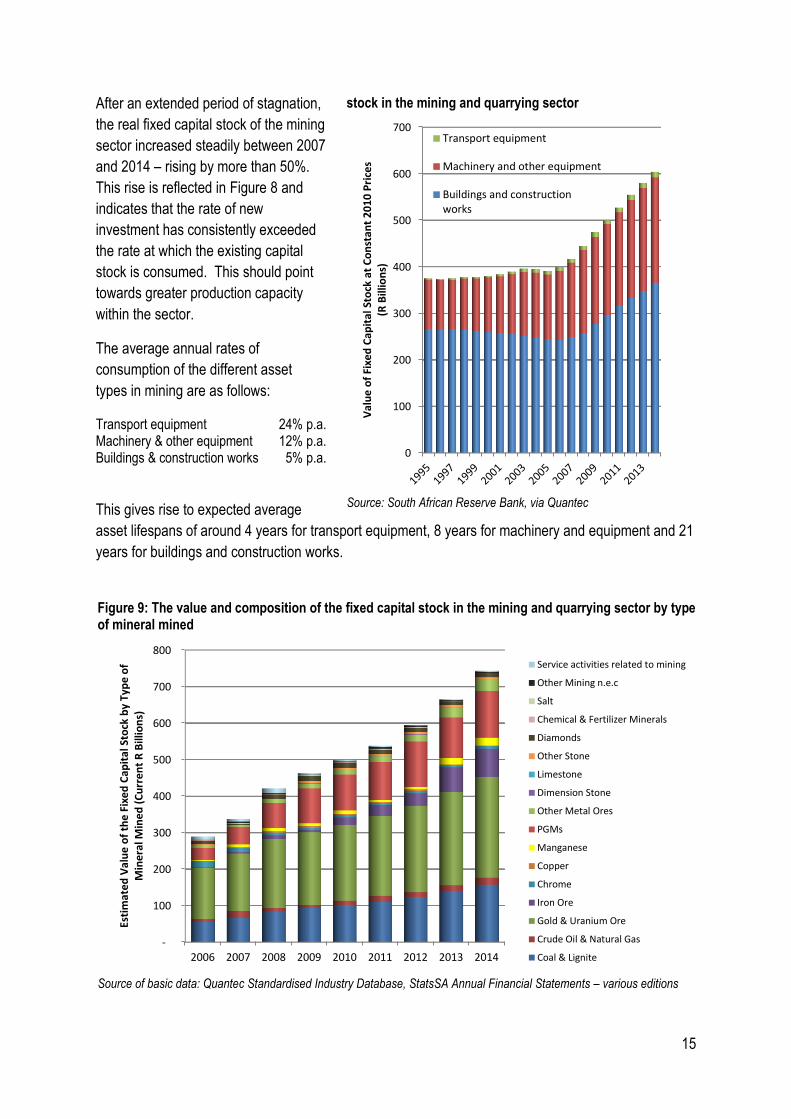
After an extended period of stagnation,
the real fixed capital stock of the mining
sector increased steadily between 2007
and 2014 – rising by more than 50%.
This rise is reflected in Figure 8 and
indicates that the rate of new
investment has consistently exceeded
the rate at which the existing capital
stock is consumed. This should point
towards greater production capacity
within the sector.
The average annual rates of
consumption of the different asset
types in mining are as follows:
Transport equipment 24% p.a. Machinery & other equipment 12% p.a. Buildings & construction works 5% p.a.
This gives rise to expected average
asset lifespans of around 4 years for transport equipment, 8 years for machinery and equipment and 21
years for buildings and construction works.
stock in the mining and quarrying sector
Source: South African Reserve Bank, via Quantec
Figure 9: The value and composition of the fixed capital stock in the mining and quarrying sector by type of mineral mined
Source of basic data: Quantec Standardised Industry Database, StatsSA Annual Financial Statements – various editions
0
100
200
300
400
500
600
700
Val
ue
of
Fixe
d C
apit
al S
tock
at
Co
nst
ant
20
10
Pri
ces
(R
Bill
ion
s)
Transport equipment
Machinery and other equipment
Buildings and constructionworks
-
100
200
300
400
500
600
700
800
2006 2007 2008 2009 2010 2011 2012 2013 2014
Esti
mat
ed
Val
ue
of
the
Fix
ed
Cap
ital
Sto
ck b
y Ty
pe
of
Min
era
l Min
ed
(C
urr
en
t R
Bill
ion
s)
Service activities related to mining
Other Mining n.e.c
Salt
Chemical & Fertilizer Minerals
Diamonds
Other Stone
Limestone
Dimension Stone
Other Metal Ores
PGMs
Manganese
Copper
Chrome
Iron Ore
Gold & Uranium Ore
Crude Oil & Natural Gas
Coal & Lignite
16
Available data only provides for limited disaggregation of the fixed capital stock by type of commodity
mined. Using Quantec data for coal mining, gold and uranium ore mining, iron ore mining and other
mining, and weighting the relevant data using non-current asset data for different types of mining
entities obtained from the Statistics South Africa analysis of Annual Financial Statements, it has been
possible to estimate the fixed capital stock applicable to each commodity type, and to examine how the
share of accumulated fixed investment of each type of mining has changed over time. The results of
this estimation are reflected in Figure 9 above, as well as in Annexure 4 – which indicates how the
share of each type of mineral mined of the total fixed capital stock has changed over time.
The share of gold and uranium ore decreased from an estimated 48% of the total in 2006 to 37%.
Coal’s share rose from 19% to 21%, while PGMs increased from around 12% to 17%. Iron ore showed
the most significant gain, increasing from 0.5% in 2006 to almost 11% in 2014. The other minerals
generally account for relatively small shares of the fixed capital stock. A rising share of the overall
capital stock points to rates of investment in respect of particular minerals that are higher than the
sector average. Conversely, declining shares – as with gold, diamonds, chrome and (since 2010)
PGMs - indicate rates of investment lower than the sector average.
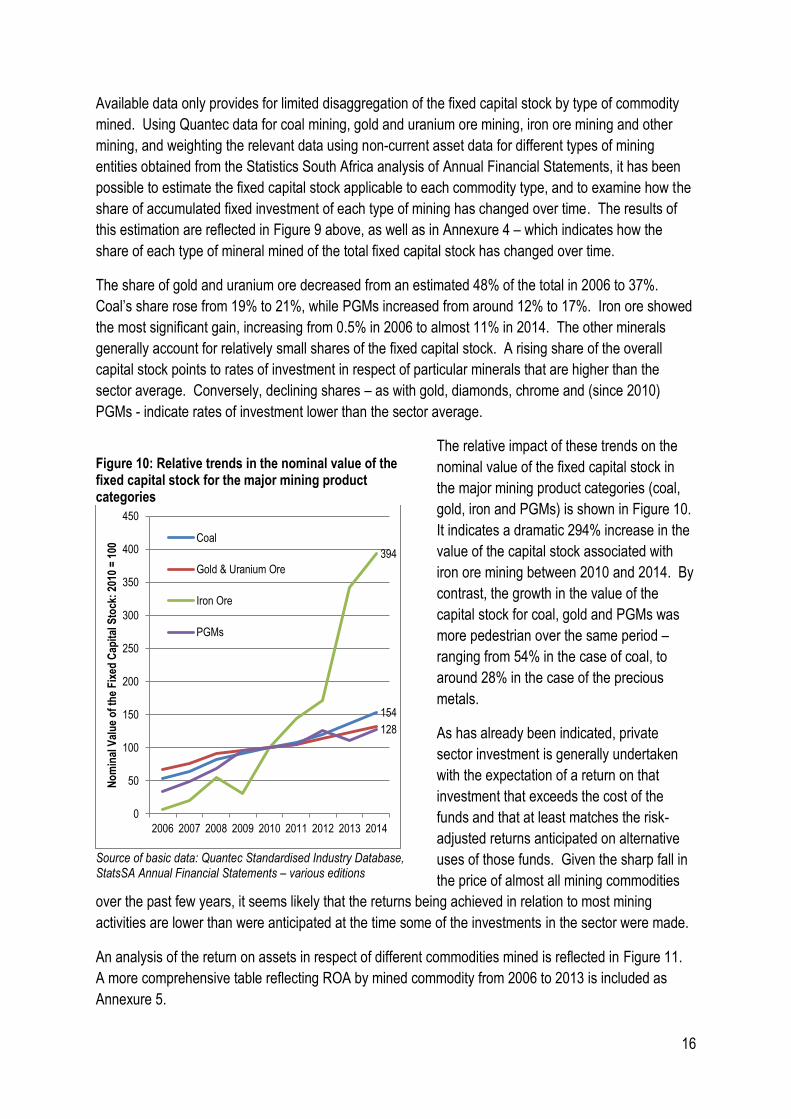
The relative impact of these trends on the
nominal value of the fixed capital stock in
the major mining product categories (coal,
gold, iron and PGMs) is shown in Figure 10.
It indicates a dramatic 294% increase in the
value of the capital stock associated with
iron ore mining between 2010 and 2014. By
contrast, the growth in the value of the
capital stock for coal, gold and PGMs was
more pedestrian over the same period –
ranging from 54% in the case of coal, to
around 28% in the case of the precious
metals.
As has already been indicated, private
sector investment is generally undertaken
with the expectation of a return on that
investment that exceeds the cost of the
funds and that at least matches the risk-
adjusted returns anticipated on alternative
uses of those funds. Given the sharp fall in
the price of almost all mining commodities
over the past few years, it seems likely that the returns being achieved in relation to most mining
activities are lower than were anticipated at the time some of the investments in the sector were made.
An analysis of the return on assets in respect of different commodities mined is reflected in Figure 11.
A more comprehensive table reflecting ROA by mined commodity from 2006 to 2013 is included as
Annexure 5.
Figure 10: Relative trends in the nominal value of the fixed capital stock for the major mining product categories
Source of basic data: Quantec Standardised Industry Database, StatsSA Annual Financial Statements – various editions
154
394
128
0
50
100
150
200
250
300
350
400
450
2006 2007 2008 2009 2010 2011 2012 2013 2014
No
min
al V
alu
e o
f th
e F
ixed
Cap
ital
Sto
ck:
2010
= 1
00 Coal
Gold & Uranium Ore
Iron Ore
PGMs
17
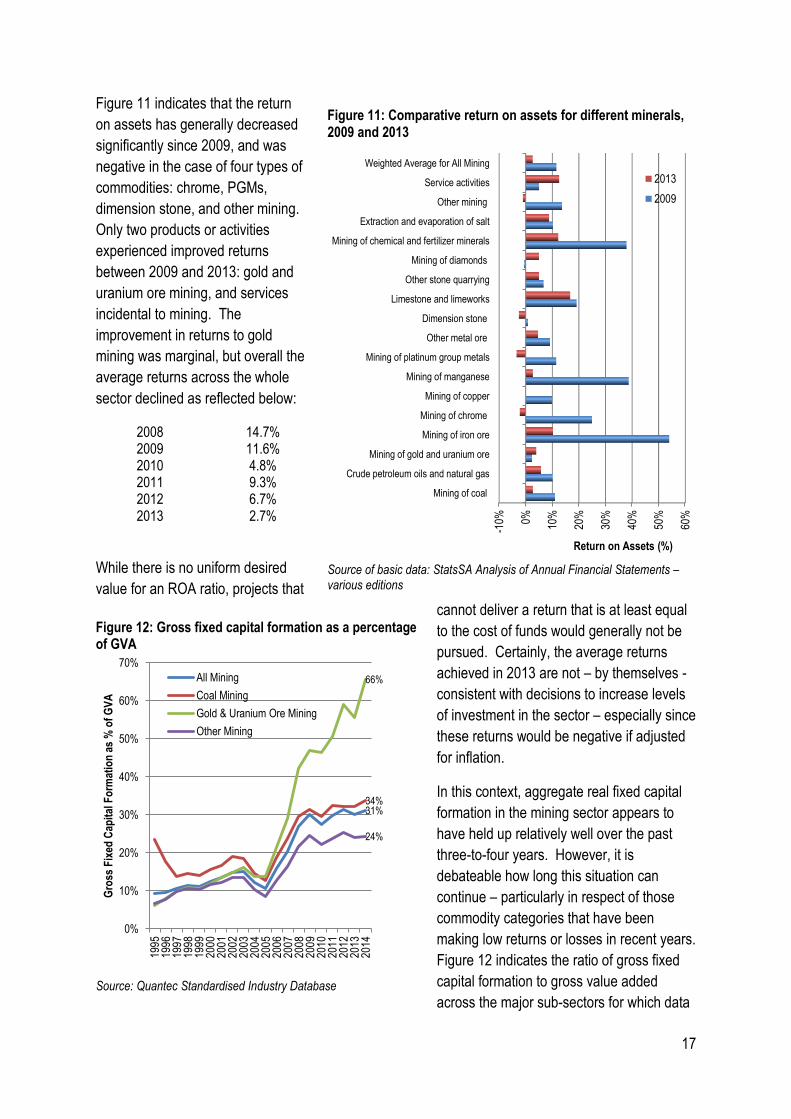
Figure 11 indicates that the return
on assets has generally decreased
significantly since 2009, and was
negative in the case of four types of
commodities: chrome, PGMs,
dimension stone, and other mining.
Only two products or activities
experienced improved returns
between 2009 and 2013: gold and
uranium ore mining, and services
incidental to mining. The
improvement in returns to gold
mining was marginal, but overall the
average returns across the whole
sector declined as reflected below:
2008 14.7% 2009 11.6% 2010 4.8% 2011 9.3% 2012 6.7% 2013 2.7%
While there is no uniform desired
value for an ROA ratio, projects that
cannot deliver a return that is at least equal
to the cost of funds would generally not be
pursued. Certainly, the average returns
achieved in 2013 are not – by themselves -
consistent with decisions to increase levels
of investment in the sector – especially since
these returns would be negative if adjusted
for inflation.
In this context, aggregate real fixed capital
formation in the mining sector appears to
have held up relatively well over the past
three-to-four years. However, it is
debateable how long this situation can
continue – particularly in respect of those
commodity categories that have been
making low returns or losses in recent years.
Figure 12 indicates the ratio of gross fixed
capital formation to gross value added
across the major sub-sectors for which data
Figure 11: Comparative return on assets for different minerals, 2009 and 2013
Source of basic data: StatsSA Analysis of Annual Financial Statements – various editions
Figure 12: Gross fixed capital formation as a percentage of GVA
Source: Quantec Standardised Industry Database
-10% 0% 10%
20%
30%
40%
50%
60%
Mining of coal
Crude petroleum oils and natural gas
Mining of gold and uranium ore
Mining of iron ore
Mining of chrome
Mining of copper
Mining of manganese
Mining of platinum group metals
Other metal ore
Dimension stone
Limestone and limeworks
Other stone quarrying
Mining of diamonds
Mining of chemical and fertilizer minerals
Extraction and evaporation of salt
Other mining
Service activities
Weighted Average for All Mining
Return on Assets (%)
2013
2009
31% 34%
66%
24%
0%
10%
20%
30%
40%
50%
60%
70%
1995
1996
1997
1998
1999
2000
2001
2002
2003
2004
2005
2006
2007
2008
2009
2010
2011
2012
2013
2014
Gro
ss F
ixed
Cap
ital
Fo
rmat
ion
as
% o
f G
VA
All Mining
Coal Mining
Gold & Uranium Ore Mining
Other Mining

18
exists, and for mining as a whole. A central premise of the National Development Plan is that the ratio
of GFCF to the GDP needs to increase from its current levels (around 20%) to closer to 30% in order
for the economy to be able to sustain higher economic growth rates of 6% to 8% per annum. Average
investment rates in the mining sector are already higher than this target ratio, and have been for some
years, but the growth in output has not been forthcoming. In fact, output in the sector has been flat or
declining for the past four years, with an average annual contraction in real GVA between 2010 and
2014 of -0.3%. Certainly, the levels of investment in the gold and uranium ore mining sector appear
unsustainable, with GFCF equivalent to 66% of estimated value added in 2014, a contraction in output
of more than 15%, and persistently low returns in recent years.
While low interest rates globally have made it possible for mining companies to restructure their
balance sheets away from equity-funding and in favour of low cost debt, such funding carries increased
exchange rate risk. It is also widely anticipated that the interest cycle is about to turn.
The principle motive for investing in the current environment would be in anticipation of an upturn in the
commodity cycle. However, - as has been noted - this has been long-awaited and there is little sign of
an imminent turnaround.
5. The nature of investment in mining in South Africa
The global investment trends reflected in Table 4 and Table 5 can be compared with equivalent data
from the same source relating to investment projects in metals mining in South Africa. These are
reflected in Table 6 and Table 7. In relation to the spilt between greenfield and brownfield projects,
South Africa has a smaller proportion of the former (63% in 2012 and 60% in 2013, compared with 77%
and 78% globally) and they are significantly smaller in scale (US$0.84 billion in South Africa in 2012
compared with US$2.3 billion globally, and US$0.39 billion compared with US$ 2.2 billion globally in
2013). According to the available information, the project “pipeline” only has one project in the
conceptual or pre-feasibility stage6. The dramatic fall in the total and average value of projects between
2012 and 2013 suggests a significant down-scaling of project size post Marikana and points to more
risk-averse, less confident investors.
Table 6: The number of greenfield mining investment projects in South Africa by stage and their
aggregate and average value in 2012 and 2013
Year Conceptual and Pre-
feasibility
Detailed Feasibility
Construction Total Number of Projects
Total Value of Projects (US$
Billion)
Average Value per
Project (US$ Billion)
2012 1 6 3 10 8.4 0.84
2013 1 5 3 9 3.5 0.39
Source of basic data: E&MJ’s Annual Survey of Global Mining Investment
6 Lonmin/Shanduka’s Akanani project moved from conceptual in 2012 to pre-feasibility in 2013.
19
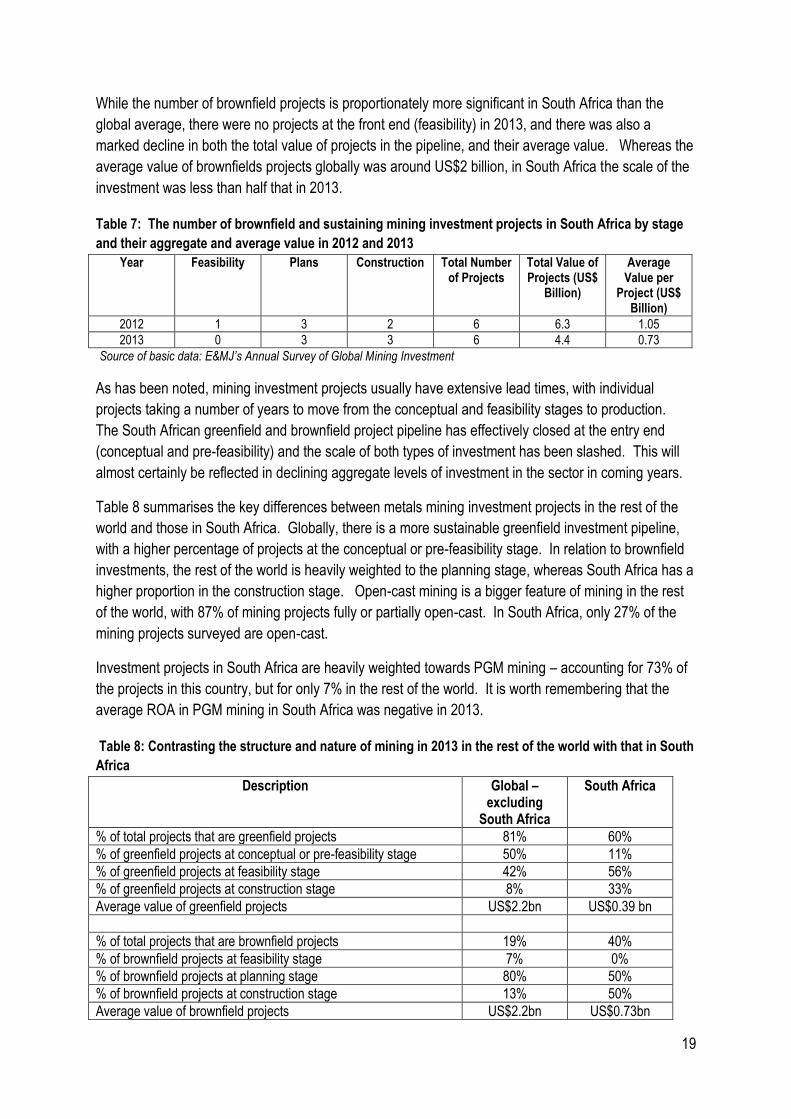
While the number of brownfield projects is proportionately more significant in South Africa than the
global average, there were no projects at the front end (feasibility) in 2013, and there was also a
marked decline in both the total value of projects in the pipeline, and their average value. Whereas the
average value of brownfields projects globally was around US$2 billion, in South Africa the scale of the
investment was less than half that in 2013.
Table 7: The number of brownfield and sustaining mining investment projects in South Africa by stage
and their aggregate and average value in 2012 and 2013
Year Feasibility Plans Construction Total Number of Projects
Total Value of Projects (US$
Billion)
Average Value per
Project (US$ Billion)
2012 1 3 2 6 6.3 1.05
2013 0 3 3 6 4.4 0.73
Source of basic data: E&MJ’s Annual Survey of Global Mining Investment
As has been noted, mining investment projects usually have extensive lead times, with individual
projects taking a number of years to move from the conceptual and feasibility stages to production.
The South African greenfield and brownfield project pipeline has effectively closed at the entry end
(conceptual and pre-feasibility) and the scale of both types of investment has been slashed. This will
almost certainly be reflected in declining aggregate levels of investment in the sector in coming years.
Table 8 summarises the key differences between metals mining investment projects in the rest of the
world and those in South Africa. Globally, there is a more sustainable greenfield investment pipeline,
with a higher percentage of projects at the conceptual or pre-feasibility stage. In relation to brownfield
investments, the rest of the world is heavily weighted to the planning stage, whereas South Africa has a
higher proportion in the construction stage. Open-cast mining is a bigger feature of mining in the rest
of the world, with 87% of mining projects fully or partially open-cast. In South Africa, only 27% of the
mining projects surveyed are open-cast.
Investment projects in South Africa are heavily weighted towards PGM mining – accounting for 73% of
the projects in this country, but for only 7% in the rest of the world. It is worth remembering that the
average ROA in PGM mining in South Africa was negative in 2013.
Table 8: Contrasting the structure and nature of mining in 2013 in the rest of the world with that in South
Africa
Description Global – excluding
South Africa
South Africa
% of total projects that are greenfield projects 81% 60%
% of greenfield projects at conceptual or pre-feasibility stage 50% 11%
% of greenfield projects at feasibility stage 42% 56%
% of greenfield projects at construction stage 8% 33%
Average value of greenfield projects US$2.2bn US$0.39 bn
% of total projects that are brownfield projects 19% 40%
% of brownfield projects at feasibility stage 7% 0%
% of brownfield projects at planning stage 80% 50%
% of brownfield projects at construction stage 13% 50%
Average value of brownfield projects US$2.2bn US$0.73bn
20
% of projects that relate to open-cast mines 87% 27%
% of projects that relate primarily to gold mining 24% 13%
% of projects that relate primarily to PGM mining 7% 73%
% of projects that relate primarily to iron ore mining 16%
% of projects that relate primarily to copper ore mining 20%
% of projects that relate primarily to diamond mining 5% 13%
% of projects that relate primarily to nickel ore mining 13%
% of projects that relate primarily to silver mining 2%
% of projects that relate primarily to uranium ore mining 3%
% of projects that relate primarily to zinc ore mining 6% Source of basic data: E&MJ’s Annual Survey of Global Mining Investment, 2013
6. Looking for reasons to explain the observed investment trends and
investment prospects in mining in South Africa
In addition to the desire to achieve a required rate of return, the act of investment is driven by one or
more additional motives. The choice of location is based on the extent to which it satisfies these
motives. Rationally, one possible location will be preferred over others by private investors because it
gives rise to relatively greater “assets” that are not locationally-transferable. Based on the work done
by Dunning (1997) on industrial organisation and multinational enterprise (MNE) behaviour, four
primary motives are identified that underpin the location choices of investors:
i) Resource seeking investment;
ii) Market seeking investment;
iii) Efficiency seeking investment; and
iv) Strategic asset seeking investment.
The primary motive behind the location choice of investors in the mining sector will almost always be
the presence and quality of a desired mineral resource. According to prevailing theory, resource
seeking investment is usually directly tied to the presence of natural resources or their processing. It is
generally seen as a locationally fixed investment, although processing activities may be more mobile
than extraction activities. Governments are generally seen to have significant bargaining power over
MNCs where this type of investment applies. Policy approaches to mineral rights and licenses are
likely to be significant issues in this kind of investment.
In this regard, it is widely acknowledged that South Africa is richly endowed with a wide range of known
mineral reserves. It has the world’s largest reserves of platinum, manganese, chromium, gold and
alumino-silicates. It is also a significant producer of ferrochrome, other platinum group metals,
vanadium, ferromanganese and fluorspar. On the face of it then, South Africa should have little difficulty
in attracting investment into mining. But while the presence of a particular resource is a necessary
condition to attract investors it is not a sufficient one to ensure that the investment takes place. Firstly,
the prospective miner needs to acquire the necessary rights to extract the resource. In South Africa’s
21
case, a potential investor’s willingness and/or ability to engage in the exploitation of a particular mineral
deposit is not the Government’s only consideration when deciding whether to issue mining rights.
Once the necessary rights have been obtained, the mining entity needs to be able to extract the
necessary resource cost effectively, and to then be able to get the extracted resource from the mine to
a processing site and market. This requires competitively-priced intermediate inputs and production
factors, and efficient transport and logistics infrastructure.
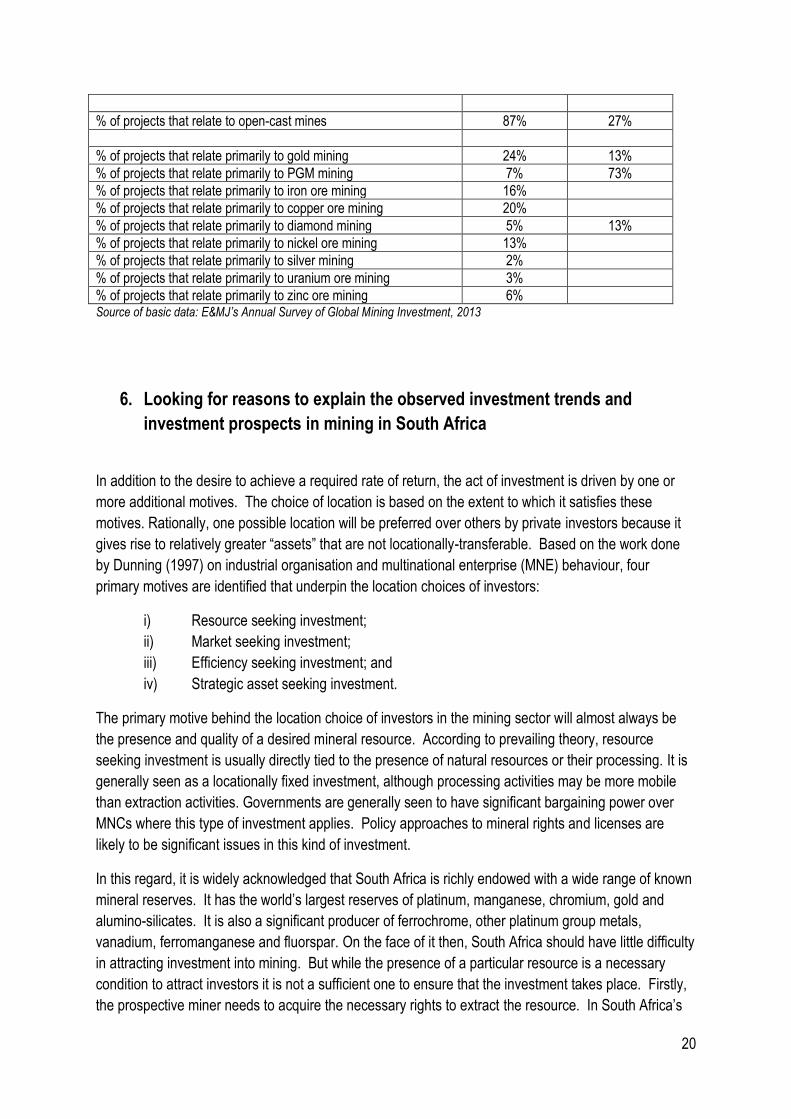
Figure 13 indicates the estimated value chain for gold and uranium ore mining in South Africa in 2014.
Similar value chains for coal and other mining are included as Annexure 6 and Annexure 7 respectively.
While the contribution of intermediate inputs to the value of sales is relatively small (21%) in relation to
the value added of the mining itself (79%), there are many critical inputs, including electricity,
explosives, construction materials, security, transport and financial services without which the mining
operation itself will be unable to function. Given that most mines are run on a continuous basis, it is not
simply the cost of these inputs that matters, but also the reliability of their supply.
It is also noteworthy that remuneration of labour constituted 63% of the value added in 2014. This is
partly the result of depressed returns, resulting in a comparatively lower gross operating surplus. The
average share of the gross operating surplus of South Africa’s GVA in 2014 was 48%. Given that
Figure 13: Estimated value chain for gold and uranium ore mining in 2014
Total Intermediate
Inputs
R13.2bn
Primary Sector R0.3bn
Secondary Sector R9.5bn
Tertiary Sector R3.3bn
Value Added of Gold &
Uranium Ore Mining
R49.9bn
LabourR31.6bn
GOSR16.5bn Net Indirect
TaxesR1.8bn
Sales of Domestically-
produced Gold & Uranium
Ore
R63.1bn
Exports of Gold &
Uranium
R62.7bn
Imports of Gold &
Uranium
R0bn
Domestic Supply of Gold
& Uranium
R0.4bn
Final Demand
-R2.5bn
Intermediate Demand
(Inputs into Other Sectors)
R2.9bn
Primary Sectors
R0bn
Secondary SectorsR1.8bn
Tertiary SectorsR1.1bn
Gross Capital
Formation-R2.5bn
25%
72%
3%
63%
33%
4%
21% 79%
House-holdsR0bn
38%
62%
0%
Govern-mentR0bn
Source of basic data: Quantec Standardised Industry Database

22
labour costs make up such a significant proportion of value added it is concerning that labour
productivity in the sector (measured by real output per worker) has fallen by close to 40% over the past
decade. This is not simply a function of a disrupted labour relations environment, but also a result of
measurement: while the quantity of ore-bearing rock extracted might have increased, gold output per
worker has declined due to the declining quality of the ore extracted.
The lack of domestic beneficiation of the output of the sector is reflected in the fact that less than 1% of
the value of the sales is supplied to the local market.
Given South Africa’s dominant share of many mineral resources, its declining share of global
investment in mining is worrying and requires answers. Is this trend simply a function of changing
demand patterns, which has seen demand for precious metals and stones decline in the depressed
post-GEC global economy? If so, why is there still a fairly high degree of investor interest globally in
the mining of these commodities? The share of investment projects outside South Africa in gold, PGMs,
silver and diamonds was 38% of the total in 2013, and inside the country these products represent the
only ones in the investment pipeline according to available sources. This then raises the question of
whether there are other, country-specific drivers that explain relatively better investment performance.
This is first considered at a general level. Since the general business environment is likely to impact on
the costs of extraction, countries that have are perceived to be easier places to do business should be
able to attract a proportionately greater share of global investment flows into mining.
Figure 14 indicates that there is indeed some correlation between those countries that have succeeded
in attracting large shares of mining investment and their Ease of Doing Business rankings as published
Figure 14: Relationship between Ease of Doing Business ranking and share of global mining investment project value in 2013
Source: E&MJ’s Annual Survey of Global Mining Investment 2014, World Bank
0
20
40
60
80
100
120
140
160
180
200
0% 2% 4% 6% 8% 10% 12% 14% 16% 18%
Eas
e o
f D
oin
g B
usi
nes
s R
anki
ng
Share of Global Mining Investment in 2013

23
by the World Bank7. South Africa’s position is shown in green. While there are some countries with
less attractive Ease of Doing Business rankings and higher shares of global mining investment, there
are also others with lower (better) rankings and smaller shares. The “best fit” function suggests that – if
the easy of doing business was the only relevant factor determining investment shares - then South
Africa should be able to attract at least double its present share of mining investment.
Since the efficiency and cost of getting the extracted product from its source to a processing facility and
on to a local or global market can have a significant impact on the returns to mining, the relationship
between logistics systems and investment performance were also examined. In this case the country
rankings emerging from the World Bank’s Logistics Performance Index (LPI) – which is the weighted
average of the country’s scores on the six key dimensions listed below – were correlated with the
country’s share of global mining investment.
i) Efficiency of the clearance process (i.e., speed, simplicity and predictability of
formalities) by border control agencies, including customs;
ii) Quality of trade and transport related infrastructure (e.g., ports, railroads, roads,
information technology);
iii) Ease of arranging competitively priced shipments;
iv) Competence and quality of logistics services (e.g., transport operators, customs
brokers);
v) Ability to track and trace consignments;
vi) Timeliness of shipments in reaching destination within the scheduled or expected
delivery time.
7 Ideally, this correlation should be tested further in order to try to establish whether there is a causative effect by examining changes in the indices and shares over time. Available data did not permit such an analysis at this time.
Figure 15: Relationship between Logistics Performance Index ranking and share of global mining investment project value in 2013
Source: E&MJ’s Annual Survey of Global Mining Investment 2014, World Bank
0
20
40
60
80
100
120
140
160
180
0% 2% 4% 6% 8% 10% 12% 14% 16% 18%
Lo
gis
tics
Per
form
ance
Ind
ex R
anki
ng
Share of Global Mining Investment in 2013
24
The results of this analysis are reflected in Figure 15. Once again, there is some positive correlation
between the logistics performance of particular countries and their respective shares of global mining
investment. However, if this was the only factor determining investment attraction, South Africa should
have been able to attract around 10% of global mining investment (compared with the 2% actually
attracted).
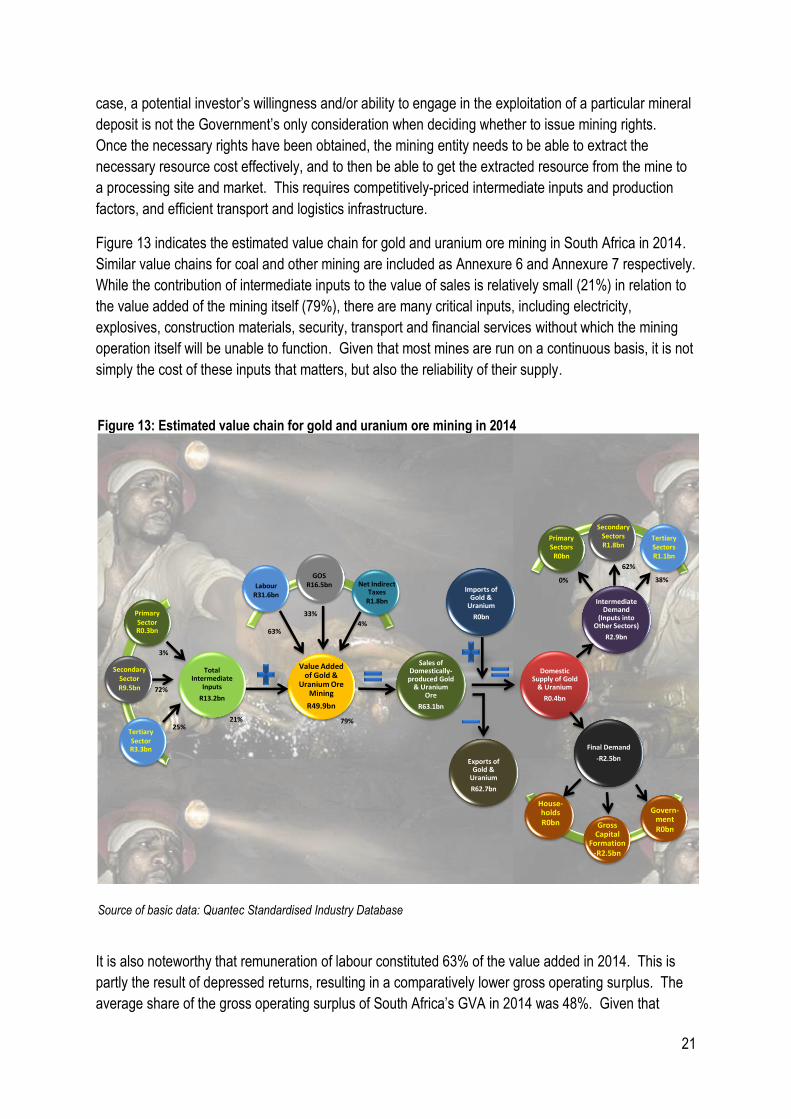
In order to try to determine whether any specific aspect of logistics was more important than others in
relation to mining investment, the scores for each component of the LPI of the four largest destinations
for mining investment in 2013 (Australia, Canada, Chile and Russia), and South Africa, were compared.
These are shown in Figure 16. The detailed rankings and scores are included as Annexure 8. South
Africa scores comparatively poorly in
relation Australia and Canada in customs,
infrastructure, and tracking and tracing, but
scores better than Russia in all departments,
and is largely on par with, or better than,
Chile.
So while the rankings suggest some scope
for areas of absolute and relative
improvement, they do not – by themselves –
explain differences in comparative
attractiveness for mining investment. There
appears to be little in the way of published
research that seeks to explain why some
mining destinations have been more
successful at attracting mining investment
than others.
Tax and other government-provided
incentives do not seem to feature as a
significant driver of investment in the mining
industry, although the provision of appropriate infrastructure may be an incentive at a local level.
6.1 Australia
As the figures relating to fixed capital stocks and investment flows attest, Australia has been hugely
successful at attracting investment into its mining sector. While it is a relatively easy place to do
business, and it has sophisticated and competitive logistics systems, perhaps its biggest advantage is
its relative proximity to China (and other major markets for its minerals such as Japan and Korea). Jin
(2014) notes that:
Figure 16: Comparative LPI component scores for major mining investment destinations
Source: World Bank
0
1
2
3
4
5
LPIScore
Customs
Infrastructure
International
shipments
Logistics
competence
Tracking &
tracing
Timeliness
Canada Australia South Africa
Chile Russia
25
“Australia is one of the earliest countries which Chinese companies have gone out for, and is the second largest
target for China’s overseas investment, second only to the United States. Mining is undoubtedly the industry that
has attracted most investment from China into Australia.”
Commenting on Baosteel’s hostile takeover of Aquila Mining, Jin notes that this was part of a long term
strategy that first saw Baosteel acquire sufficient shares in Aquila to obtain a seat on the board – so it
had an insider view of the company - and then to make an offer directly to shareholders at a time when
the market for steel was depressed and share valuations low. It took a long term view of prospects,
and the timing of the investment reflected this. Jin also notes that Baosteel’s takeover of Aquila could
have encountered greater regulatory hurdles and delays (as other Chinese investments had previously
done) from Australia’s Foreign Investment Review Board (FIRB), but that this was averted through the
establishment of a partnership with Aurizon, a local company, as the engineering, procurement,
construction (EPC) contractor.
The surge in Chinese investment in Australian mining follows on the heels of an earlier wave of
investment from Japan in the 1960s. In both cases, the objective appears to have been to secure
supply of necessary resources – most notably iron ore and coal. By taking a direct stake in the iron ore
mining companies in the 1960s, Japanese steel mills were able to ensure security of supply of raw
materials by signing long-term contracts to buy. Chinese steel mills are now replicating this approach.
6.2 Canada
Although Canada has also managed to attract significant amounts of investment into its mining sector,
most of this is domestically-generated – with a much smaller proportion from foreign sources. Given
that it is the second largest country in the world by area and is sparsely populated, Canada’s status as
a major mining country is not surprising. Although some of the mining operations are comparatively
more remote, most of Canada’s industries are centred in or near metropolitan areas close to the United
States. In 2006, the United States imported over 65% of Canada’s total mining exports, but the country
also has well established logistics routes to Asian, European and South American markets.
Canada’s mining companies, invest significant amounts in R&D, and in exploration, with the country
consistently ranking first in its share of global exploration spending. The Toronto Stock Exchange also
has substantially more mining companies listed than any other bourse and in 2014 it raised over C$8.9
billion in mining finance as part of 1,482 finance transactions. This was more than double the amount
raised on the Australian Securities Exchange (ASX). The JSE only raised C$0.2 billion over the same
period.
7. Summary and conclusion
Since 2011 a pronounced bear market has set in in relation to mining commodities, with prices falling
significantly and steadily. This has had a marked impact on global investment in mining, with mining
capex declining steadily over the past four years. However, even within this broader negative context,
26
South Africa’s share of global mining investment has declined – suggesting that there are other,
country-specific factors at play. Total investment in mining was valued at US$420 billion in 2013, of
which Canada attracted the largest share (US$ 64.4 billion), followed by Chile (US$54.4 billion), Russia
((US$50.6 billion) and Australia (US$48.5 billion). Investment in the South African mining sector is
estimated at US$7.9 billion.
There have been significant structural shifts in South Africa’s earnings from mineral exports with
precious metals and stones accounting for a steadily decreasing share, and exports of ores, slag and
ash rising in importance from just over 3% of total merchandise export earnings in 2004 to more than
13% in 2014. An analysis of the export performance of individual commodities reveals that South
Africa gained global market share in 18 mineral product categories which together accounted for 48.5%
of the value of total mineral exports in 2014 and lost global market share in 21 mineral product
categories which collectively accounted for 51.5% of mineral exports in 2014. The most significant of
these was platinum (24% of mineral exports), gold (22% of mineral exports), and diamonds (9% of
mineral exports).
While fixed investment in mining has not performed as well as some other sectors of the South African
economy (construction, utilities, and transport and communications), it has performed relatively better
than others – particularly agriculture, finance and insurance, manufacturing and trade. After an
extended period of stagnation, the real fixed capital stock of the mining sector increased steadily
between 2007 and 2014 – rising by more than 50%. This indicates that the rate on new investment has
consistently exceeded the rate at which the existing capital stock is consumed, and should point
towards greater production capacity within the sector.
Average investment rates in the mining sector are already higher than the 30% NDP national target
ratio to GDP, and have been for some years, but the growth in output has not been forthcoming. Within
the context of a contraction in output of more than 15% in 2014, and persistently low returns in recent
years, the levels of investment in the gold and uranium ore mining sector (equivalent to 66% of
estimated value added in 2014) appear unsustainable. Since mining investment projects usually have
extensive lead times, with individual projects taking a number of years to move from the conceptual and
feasibility stages to production, it is concerning that the South African greenfield and brownfield project
pipeline has effectively closed at the entry end (conceptual and feasibility) and the scale of both types
of investment has been slashed. This will almost certainly be reflected in declining aggregate levels of
investment in the sector in coming years.
In the search for explanations for South Africa’s comparatively poor investment performance,
correlations with the general ease of doing business and the state of logistics were undertaken. Both
analyses suggest that South Africa should be attracting more investment into mining than it is.
However, in the context of depressed commodity prices and low (and sometimes negative) returns to
most minerals mined, perhaps the biggest constraint the country faces is one of geography. The fact is
that the country is located relatively far away from most of the major markets for the commodities it
produces. When margins are already tight due to low prices, the additional costs associated with
transporting relatively low value and bulky mined commodities to distant markets undermines the
relative attractiveness of the South African mining sector. After being railed to Saldanha, iron ore from
Sichen needs to travel 9322 nautical miles to get to Shanghai. This can be expected to take almost 39
27
days. By contrast ore shipped from Freemantle (Perth) in Australia to Shanghai needs to travel 4794
nautical miles – a trip that should take around 20 days. Delivery from ports close to mining areas in
Chile to ports on the West Coast of the United States can typically take around 25 days.
In the context of global markets that are already over-supplied, it is unrealistic to expect significant
growth in the levels of aggregate investment in the South African mining sector – which is already high
in relation to the value added by the sector. Instead, the short-term investment focus needs to be on
improving the efficiency of extraction in existing operations, and on seeking to limit some of the
disadvantage imposed by South Africa’s distance from major markets. Greater use and beneficiation of
products mined within the local economy would help to limit this disadvantage.
28
8. References and data sources
Data sources
E&MJ Annual Survey of Global Metal-mining Investment, January 2014 accessed at
http://emj.epubxp.com/i/239773-jan-2014/27
ITC Investment Map accessed at http://www.investmentmap.org
Quantec Standardised Industry Database accessed at http://www.easydata.co.za/
Statistics South Africa, P0021 - Annual Financial Statistics (AFS), 2006 to 2013 editions accessed at
http://www.statssa.gov.za/?page_id=1854&PPN=P0021
World Bank Logistics Performance Index accessed at
http://lpi.worldbank.org/international/scorecard/radar/254/C/ZAF/2014/C/AUS/2014/C/CAN/2014/C/CHL
/2014/C/RUS/2014
World Bank Ease of Doing Business Rankings accessed at http://www.doingbusiness.org/rankings
Documents and articles
Anon. March 3, 2015. Leading the World in Mining Financing accessed at
http://www.tmx.com/newsroom/newsfeed?id=289
Dunning, J. H. 1997. Re-evaluating the benefits of foreign direct investment, in Alliance capitalism and
global business, J. H. Dunning. London: Routledge.
Fellows, M. 2015. How Does The Mining Sector Cycle Play Out? Insights for Industry Suppliers. SNL
Metals and Mining
Jackson, Taylor, and Green, Kenneth P. 2015. Fraser Institute Annual Survey of Mining Companies,
2014. Fraser Institute. <http://www.fraserinstitute.org>.
Jin, X. November 20, 2014. Factors for Successful Chinese Investment in the Australian Mining
Industry: A Case Study of Baosteel Consortium’s Acquisition of Aquila accessed at
http://www.chinalawinsight.com/2014/11/articles/corporate/factors-for-successful-chinese-investment-
in-the-australian-mining-industry-a-case-study-of-baosteel-consortiums-acquisition-of-aquila/
McHugh, B. 15 January 2014. Australian mining continues to attract foreign investors accessed at
http://www.abc.net.au/news/2014-01-14/foreign-investment-grows-in-mining/5199614
Peckham, V. and Budgell, P. 2008. Canada’s Mining Industry – A Success Story. Mining.com. April
2008. Accessed at http://www.infomine.com/library/publications/docs/Mining.com/Apr2008e.pdf
SNL Metals and Mining. 2015. World Exploration Trends. Accessed at
http://go.snl.com/rs/snlfinanciallc/images/World-Exploration-Trends-WET-Report-2015-English-
USletter.pdf
29
Annexures
Annexure 1: Accumulated stock value of FDI inflows into the mining sector as at end 2012
Annexure 2: Rankings of the top 10 countries in terms of the value of mining investment in the metals mining sectors
Rank Country Value of FDI Stocks in Mining and Quarrying at end 2012 US$ Million
1 Australia 212,346.8
2 South Africa 55,198.9
3 Chile 30,900.3
4 Canada 16,739.6
5 Malaysia 9,023.8
6 Denmark 6,283.4
7 Romania 4,246.6
8 Netherlands 3,641.3
9 Kazakhstan 3,439.8
10 France 3,308.2
11 Viet Nam 3,182.0
12 Finland 2,525.8
13 Thailand 2,517.1
14 New Zealand 2,473.9
15 Botswana 2,032.3
16 Austria 393.9
17 Macedonia 206.2
18 Estonia 91.2
19 Latvia 88.6
20 Japan 76.8
Source: ITC Investment Map, using UNCTAD and COMTRADE data
Country Share of Global Mining Investment (% of Total)
2013 2012 2011 2009
Australia 13 14 15 11
Canada 15 14 14 11
Chile 9 9 8 9
Brazil 7 7 7 7
Russia 9 7 7 6
Peru 6 6 6 6
United States 6 5 5 5
South Africa 3 3 4 4
Philippines 2 2 3 3
Guinea 2 2
Mexico 2 2
Source: E&MJ’s Annual Survey of Global Mining Investment – various editions
30
Annexure 3: Revealed competitive advantage of South African mineral exports: 2008 to 2014
Exported Product
Share of Total SA Mineral
Exports in 2014
Average Annual
Growth in SA Exports in
US$: 2008 to 2014
Average Annual
Growth in World
Exports in US$: 2008 to
2014
Net Annual Growth in SA
Exports: 2008 to 2014*
Base metals, silver or gold, clad w plat, nfw than semi-manufactured 0.0% 201.0% 32.0% 169.0%
Zinc ores and concentrates 0.1% 76.5% 5.5% 71.1%
Tungsten ores and concentrates 0.0% 68.6% 7.9% 60.8%
Ores and concentrates, nes 0.9% 89.5% 28.9% 60.6%
Articles of goldsmith's/silversmith's wares&pts 0.0% 38.0% -0.3% 38.4%
Articles of natural or cultured pearls, prec/semi prec stones 0.0% 44.8% 15.8% 29.0%
Ash & residues containing metals of metallic compounds 0.0% 35.6% 6.7% 28.9%
Granulated slag from the manufacture of iron or steel 0.9% 27.4% 5.7% 21.7%
Aluminium ores and concentrates 0.0% 23.2% 4.7% 18.5%
Cobalt ores and concentrates 0.1% 2.2% -9.3% 11.5%
Imitation jewellery 0.1% 18.6% 7.4% 11.3%
Iron ores & concentrates; including roasted iron pyrites 25.1% 18.8% 10.0% 8.8%
Chromium ores and concentrates 4.0% 2.7% -3.9% 6.7%
Coin 0.0% 7.7% 1.9% 5.8%
Manganese ores and concentrates etc 6.1% -2.4% -4.5% 2.1%
Coal; briquettes, ovoids & similar solid fuels manufactured from coal 16.2% 1.5% 0.4% 1.1%
Molybdenum ores and concentrates 0.0% -9.4% -10.0% 0.6%
Waste & scrap of precious metal 1.1% -3.3% -3.5% 0.2%
Niobium, tantalum, vanadium or zirconium ores and concentrates 1.4% 7.0% 7.8% -0.8%
Platinum, unwrought or in semi-manufactured forms 24.3% -6.6% -5.1% -1.5%
Copper ores and concentrates 1.7% 4.5% 7.7% -3.2%
Titanium ores and concentrates 2.2% 6.0% 9.5% -3.5%
Diamonds, not mounted or set 9.0% 1.0% 4.8% -3.8%
Slag, dross other than granulated slag 0.2% -6.2% 3.0% -9.2%
Base metals clad with silver, nfw than semi-manufactured 0.0% -12.3% 3.7% -16.0%
Articles of jewellery & parts thereof 0.2% -0.4% 17.0% -17.3%
Lead ores and concentrates 0.2% -6.6% 13.5% -20.1%
Gold unwrought or in semi-manuf forms 18.0% -0.3% 20.0% -20.3%
Syn/reconstr prec/semi-prec stones, not strg/mounted/set 0.0% -11.2% 13.9% -25.1%
Dust & powder of precious or semi-precious stones 0.0% -24.7% 3.8% -28.5%
Silver, unwrght or in semi-manuf. form 0.0% -24.1% 6.5% -30.6%
Precious metal ores and concentrates 0.6% -20.4% 13.4% -33.7%
Slag & ash nes, including seawood ash (kelp) 0.0% -37.9% -4.1% -33.9%
Articles of precious metal or metal clad with precious metal, nes 0.0% -23.4% 16.2% -39.6%
Nickel ores and concentrates 0.0% -37.6% 6.5% -44.0%
Tin ores and concentrates 0.0% -23.1% 21.8% -44.8%
Base metals or silver, clad with gold, nfw than semi-manufactured 0.0% -60.3% -3.6% -56.8%
Precious & semi-precious stone,not strug, 0.0% -26.5% 31.0% -57.5%
Pearls, nat or cult, etc 0.0% -61.6% 5.5% -67.1%
Source of basic data: ITC TradeMap using UNCTAD and COMTRADE data
* A positive value indicates that SA exports are growing faster than world exports and that SA is gaining global market
share. A negative value indicates that SA exports are losing global market share.
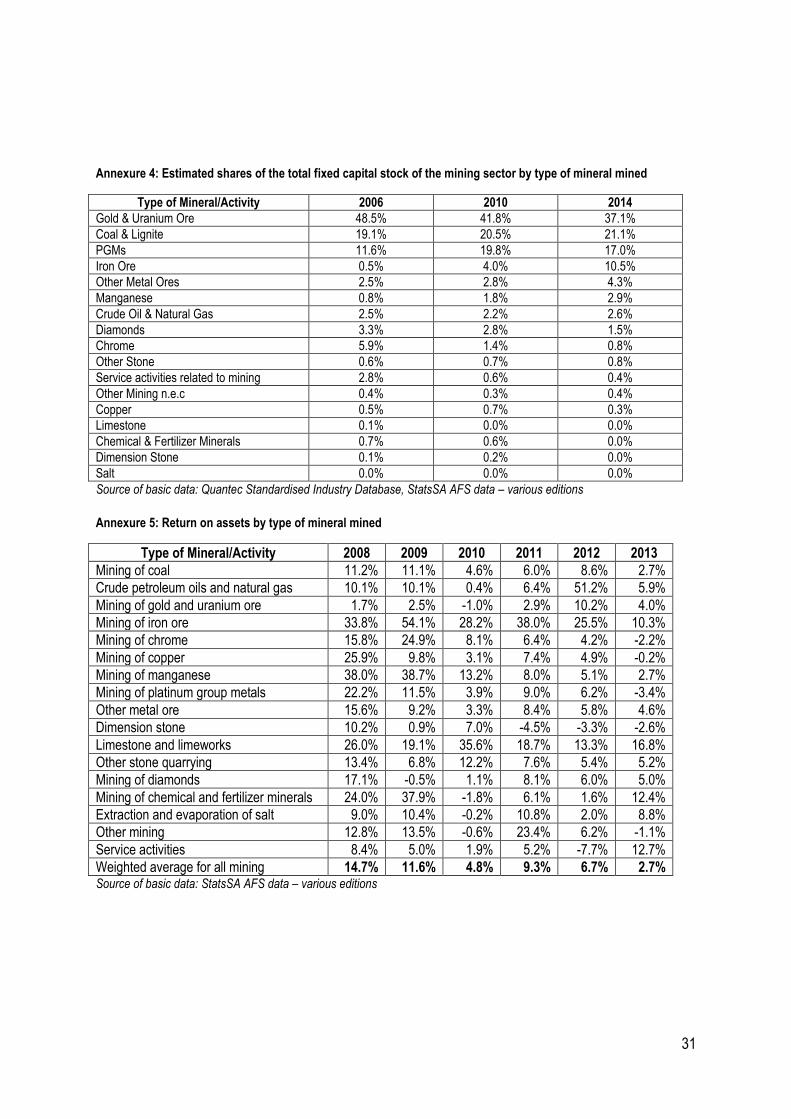
31
Annexure 4: Estimated shares of the total fixed capital stock of the mining sector by type of mineral mined
Type of Mineral/Activity 2006 2010 2014
Gold & Uranium Ore 48.5% 41.8% 37.1%
Coal & Lignite 19.1% 20.5% 21.1%
PGMs 11.6% 19.8% 17.0%
Iron Ore 0.5% 4.0% 10.5%
Other Metal Ores 2.5% 2.8% 4.3%
Manganese 0.8% 1.8% 2.9%
Crude Oil & Natural Gas 2.5% 2.2% 2.6%
Diamonds 3.3% 2.8% 1.5%
Chrome 5.9% 1.4% 0.8%
Other Stone 0.6% 0.7% 0.8%
Service activities related to mining 2.8% 0.6% 0.4%
Other Mining n.e.c 0.4% 0.3% 0.4%
Copper 0.5% 0.7% 0.3%
Limestone 0.1% 0.0% 0.0%
Chemical & Fertilizer Minerals 0.7% 0.6% 0.0%
Dimension Stone 0.1% 0.2% 0.0%
Salt 0.0% 0.0% 0.0%
Source of basic data: Quantec Standardised Industry Database, StatsSA AFS data – various editions
Annexure 5: Return on assets by type of mineral mined
Type of Mineral/Activity 2008 2009 2010 2011 2012 2013
Mining of coal 11.2% 11.1% 4.6% 6.0% 8.6% 2.7%
Crude petroleum oils and natural gas 10.1% 10.1% 0.4% 6.4% 51.2% 5.9%
Mining of gold and uranium ore 1.7% 2.5% -1.0% 2.9% 10.2% 4.0%
Mining of iron ore 33.8% 54.1% 28.2% 38.0% 25.5% 10.3%
Mining of chrome 15.8% 24.9% 8.1% 6.4% 4.2% -2.2%
Mining of copper 25.9% 9.8% 3.1% 7.4% 4.9% -0.2%
Mining of manganese 38.0% 38.7% 13.2% 8.0% 5.1% 2.7%
Mining of platinum group metals 22.2% 11.5% 3.9% 9.0% 6.2% -3.4%
Other metal ore 15.6% 9.2% 3.3% 8.4% 5.8% 4.6%
Dimension stone 10.2% 0.9% 7.0% -4.5% -3.3% -2.6%
Limestone and limeworks 26.0% 19.1% 35.6% 18.7% 13.3% 16.8%
Other stone quarrying 13.4% 6.8% 12.2% 7.6% 5.4% 5.2%
Mining of diamonds 17.1% -0.5% 1.1% 8.1% 6.0% 5.0%
Mining of chemical and fertilizer minerals 24.0% 37.9% -1.8% 6.1% 1.6% 12.4%
Extraction and evaporation of salt 9.0% 10.4% -0.2% 10.8% 2.0% 8.8%
Other mining 12.8% 13.5% -0.6% 23.4% 6.2% -1.1%
Service activities 8.4% 5.0% 1.9% 5.2% -7.7% 12.7%
Weighted average for all mining 14.7% 11.6% 4.8% 9.3% 6.7% 2.7% Source of basic data: StatsSA AFS data – various editions
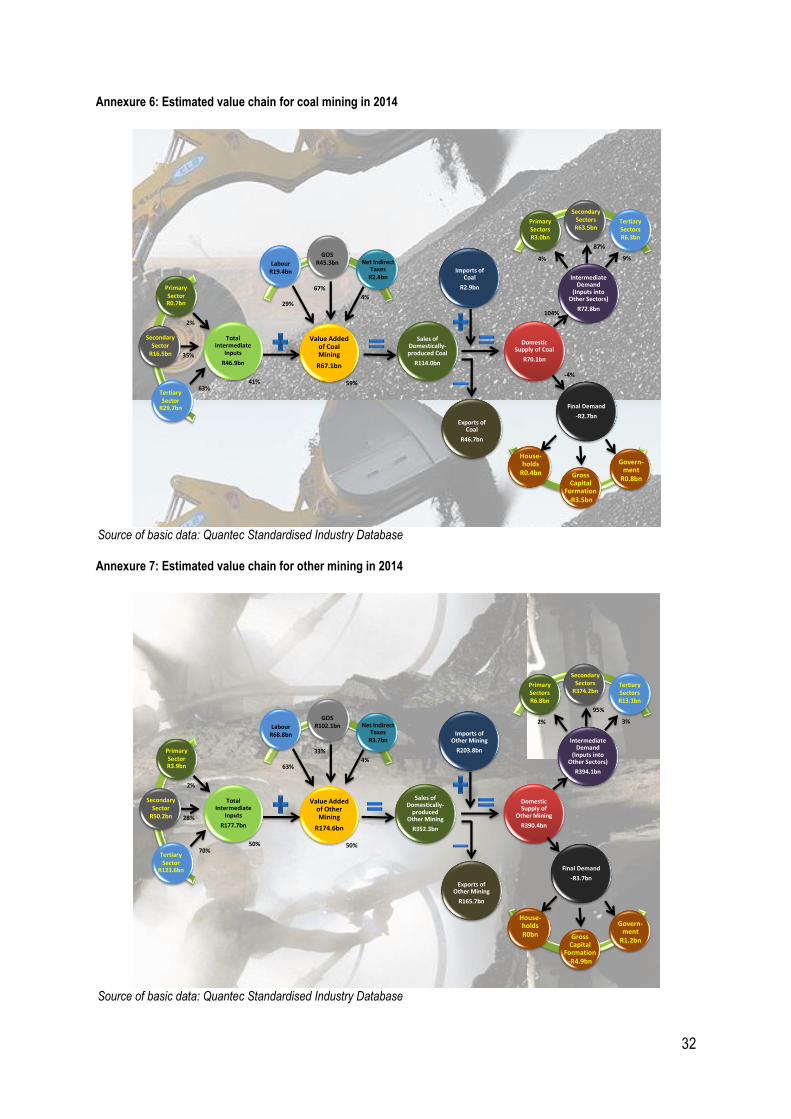
32
Annexure 6: Estimated value chain for coal mining in 2014
Annexure 7: Estimated value chain for other mining in 2014
Total Intermediate
Inputs
R46.9bn
Primary Sector R0.7bn
Secondary Sector
R16.5bn
Tertiary Sector
R29.7bn
Value Added of Coal Mining
R67.1bn
LabourR19.4bn
GOSR45.3bn Net Indirect
TaxesR2.4bn
Sales of Domestically-produced Coal
R114.0bn
Exports of Coal
R46.7bn
Imports of Coal
R2.9bn
Domestic Supply of Coal
R70.1bn
Final Demand
-R2.7bn
Intermediate Demand
(Inputs into Other Sectors)
R72.8bn
Primary SectorsR3.0bn
Secondary SectorsR63.5bn
Tertiary SectorsR6.3bn
Gross Capital
Formation-R3.5bn
63%
35%
2%
29%
67%
4%
41% 59%
House-holds
R0.4bn
104%
-4%
9%
87%
4%
Govern-ment
R0.8bn
Source of basic data: Quantec Standardised Industry Database
Total Intermediate
Inputs
R177.7bn
Primary Sector R3.9bn
Secondary Sector
R50.2bn
Tertiary Sector
R123.6bn
Value Added of Other Mining
R174.6bn
LabourR68.8bn
GOSR102.1bn Net Indirect
TaxesR3.7bn
Sales of Domestically-
produced Other Mining
R352.3bn
Exports of Other Mining
R165.7bn
Imports of Other Mining
R203.8bn
Domestic Supply of
Other Mining
R390.4bn
Final Demand
-R3.7bn
Intermediate Demand
(Inputs into Other Sectors)
R394.1bn
Primary SectorsR6.8bn
Secondary Sectors
R374.2bnTertiary SectorsR13.1bn
Gross Capital
Formation-R4.9bn
70%
28%
2%
63%
33%
4%
50% 50%
House-holdsR0bn
3%
95%
2%
Govern-ment
R1.2bn
Source of basic data: Quantec Standardised Industry Database
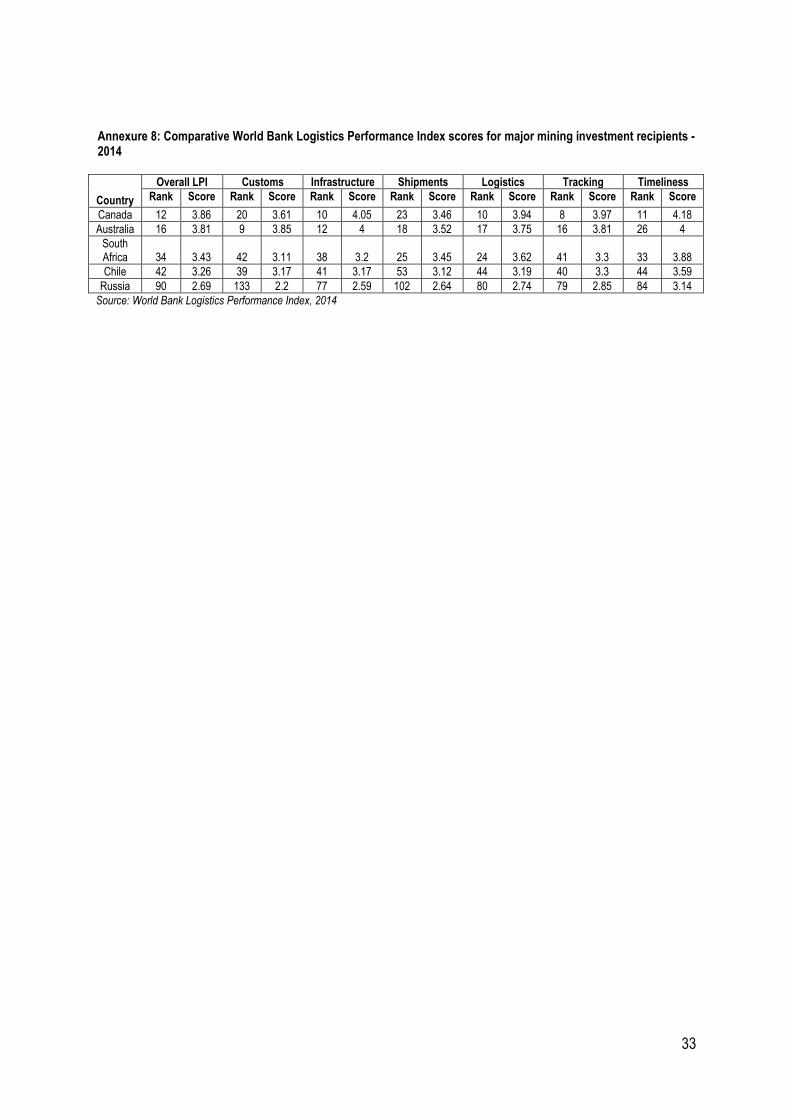
33
Country
Overall LPI Customs Infrastructure Shipments Logistics Tracking Timeliness
Rank Score Rank Score Rank Score Rank Score Rank Score Rank Score Rank Score
Canada 12 3.86 20 3.61 10 4.05 23 3.46 10 3.94 8 3.97 11 4.18
Australia 16 3.81 9 3.85 12 4 18 3.52 17 3.75 16 3.81 26 4
South Africa 34 3.43 42 3.11 38 3.2 25 3.45 24 3.62 41 3.3 33 3.88
Chile 42 3.26 39 3.17 41 3.17 53 3.12 44 3.19 40 3.3 44 3.59
Russia 90 2.69 133 2.2 77 2.59 102 2.64 80 2.74 79 2.85 84 3.14
Source: World Bank Logistics Performance Index, 2014
Annexure 8: Comparative World Bank Logistics Performance Index scores for major mining investment recipients - 2014