to: blackburn study center high school economics...
TRANSCRIPT
TO: Blackburn Study Center High School Economics Students
FROM: Glenn Graner §11Afrjr-' Economics Tutor
I'm excited to start teaching Economics at BSC !
As you know, Monday, January 24th is our first Economics class.
We will be studying Economics primarily with the book "Whatever Happened to Penny Candy" which is a book written for High School students that I hope you will find very informative and fun to read. I will also be supplementing the book with other reading materials.
Attached is your reading assignment for next Monday's class, titled "What is Economics," which is an excellent introduction to economics concepts and principles.
At the end of Monday's class, we'll have a short comprehension quiz to make sure that you understand the key concepts from the reading assignment. (but don't worry, I'm not grading this first quiz). I will also distribute a class Syllabus for the semester.
I look forward to meeting all of you and to begin exploring Economics with you !
Glenn Graner

Which CD to buy? How many hours to study? it it Which movie to see? If you're like most people, you constantly face decisions because you don't have enough time and money to do everything. At its most basic level, economics is the study of how people make choices when they face a limited supply of resources. In this chapter you will begin your study of economics by investigating two basic economic ideas: scarcity and trade-offs.
Economics Journal
Quickly jot down three decisions you made within the last 24 hours. For each decision, list two choices you decided against when you made the decision.
(-Go ariline rilSchool.com
For: Current Data Visit: PHSchool.corn Web Code: mng-1011
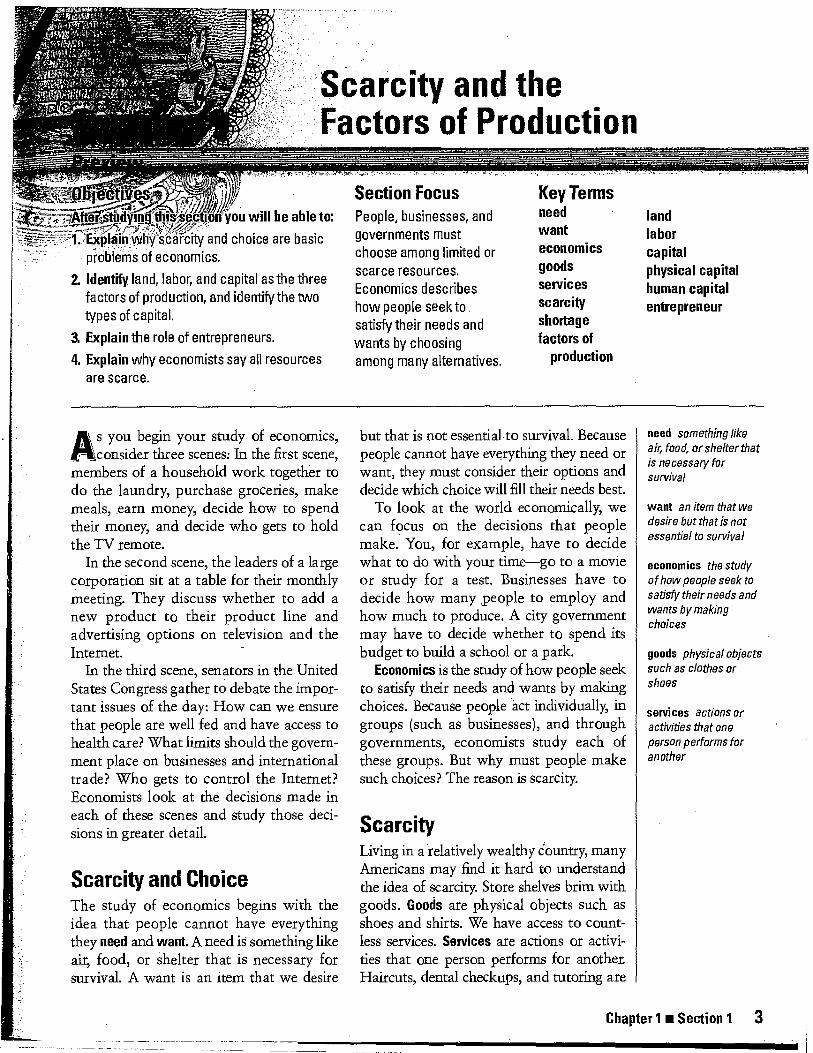
Section Focus People, businesses, and governments must choose among limited or scarce resources. Economics describes how people seek to satisfy their needs and wants by choosing among many alternatives.
Key Terms need land want labor economics capital goods physical capital services human capital scarcity entrepreneur shortage factors of
production
Scarcity and the Factors of Production
ec ) • .
After4tb yingstr4;§/ection .you will be able to
.:Explap why-starcity and choice are basic . problems of economics.
2. Identify land, labor, and capital as the three factors of production, and identify the two types of capital.
3. Explain the role of entrepreneurs.
4. Explain why economists say all resources are scarce.
I s you begin your study of economics, consider three scenes: In the first scene,
members of a household work to gether to do the laundry, purchase groceries, make meals, earn mone y, decide how to spend their money, and decide who gets to hold the TV remote.
In the second scene, the leaders of a lar ge corporation sit at a table for their monthl y meeting. They discuss whether to add a new product to their product line and advertising options on television and the Internet.
In the third scene, senators in the United States Congress gather to debate the impor-tant issues of the day: How can we ensure that people are well fed and have access to health care? What limits should the govern-ment place on businesses and international trade? Who gets to control the Internet? Economists look at the decisions made in each of these scenes and stud y those deci-sions in greater detail.
Scarcity and Choice The study of economics be gins with the idea that people cannot have ever ything they need and want. A need is something like air, food, or shelter that is necessar y for survival. A want is an item that we desire
but that is not essential to survival. Because people cannot have ever ything they need or want, they must consider their options and decide which choice will fill their needs best.
To look at the world economically, we can focus on the decisions that people make. You, for example, have to decide what to do with your time—go to a movie or study for a test. Businesses have to decide how many people to employ and how much to produce. A city government may have to decide whether to spend its budget to build a school or a park.
Economics is the study of how people seek to satisfy their needs and wants b y making choices. Because people act individuall y, in groups (such as businesses), and throu gh governments, economists study each of these groups. But why must people make such choices? The reason is scarcity.
Scarcity Living in a relatively wealthy Country, many Americans may find it hard to understand the idea of scarcit y. Store shelves brim with goods. Goods are physical objects such as shoes and shirts. We have access to count-less services. Services are actions or activi-ties that one person performs for another. Haircuts, dental checkups, and tutoring are
need something like air, food, or shelter that is necessary for survival
want an item that we desire but that is not essential to survival
economics the study of how people seek to satisfy their needs and wants by making choices
goods physical objects such as clothes or shoes
services actions or activities that one person performs for another
Chapter 1 ■ Section 1 3

physical capital all human-made goods that are used to produce other goods and services; tools and buildings
capital any human-made resource that is used to create other goods and services
factors of production land, labor, and capital; the three groups of resources that are used to make all goods and services
land natural resources that are used to make goods and services
labor the effortthat people devote to a task for which they are paid
shortage a situation in which a good or service is unavailable
scarcity limited quantities of resources to meet unlimited wants
all services. Indeed, we see ads everywhere urging us to purchase goods and services. Yet scarcity exists in all places, at all times.
Defining Scarcity All of the goods and services we produce are scarce. Scarcity implies limited quanti-ties of resources to meet unlimited wants. While one person might be able to buy hundreds of basketballs or pencils or pianos, no one can have an endless supply of everything. Sooner or later, a limit is always reached. At its core, economics is about solving the problem of scarcity.
Scarcity Versus Shortages Scarcity is not the same as a shortage. A shortage occurs when producers will not or cannot offer goods or services at the current prices. Shortages can be temporary or long-term. During the holiday season, a customer may see an empty shelf on Tuesday, but return on Friday to find that same shelf filled to overflowing. Wars and droughts can also create shortages that last for many years.
Scarcity, in contrast, always exists because our needs and wants are always greater than our resource supply. Goods and services are scarce because they are all made from resources that are scarce.
Land Economists call the resources that are used to make all goods and services the factors of production, or factor resources. The factors of production are land, labor, and capital.
Economists use the term land to refer to all natural resources used to produce goods and services. Natural resources are mate-rials found in nature. They include fertile land for farming and products that are in or on the land, such as coal, water, and forests.
Labor Another factor of production is labor. Labor is the effort that a person devotes to a task for which that person is paid. Labor includes the medical aid provided by a doctor and the tightening of a clamp by an assembly line worker. It is an artist's creation of a painting or the repair of a television.
Capital Capital is any human-made resource that is used to produce other goods and services. The two categories of capital are physical capital and human capital.
Physical Capital Human-made objects used to create other goods and services are called physical capital. (The term capital goods is a synonym for physical capital.) Physical capital includes buildings and tools. A shoe factory building and all of the sewing machines and other specialized machinery for making shoes make up part of the shoe company's physical capital.
Physical capital is an important factor of production because it can save people and companies a great deal of time and money. A building is physical capital because it helps workers do their work by providing protection and space. Similarly, tools such as tractors, conveyor belts, and pencils are physical capital because they, too, help workers produce a good or a service.
When we create or buy physical capital to accomplish a job, we usually become more productive. Suppose that your family of 6
A While people's needs and wants are unlimited, the resources available to meet those wants are limited, or scarce. Which scarce resources were used to produce the fruits and vegetables shown here?
4 What Is Economics?

CONte
Figure 1.1 The Factors of Production
Al I oftenatural resources that are uSed to produce goods and services
Entrepreneur A person who assembles the factors of production to create new goods and services
Goods and Services
Labor Any effort a person devotes to a task for which that person is paid
Capital Any human-made resource that is used to create other goods and services
Land, labor, and capital, also known as the factors of production, are the "inputs," or resources, used to create all goods and services. Entrepreneurs What role do entrepreneurs play in producing goods and services?
people washes dishes by hand every day after every meal—breakfast, lunch, and dinner—for a total of 21 meals per week. It takes 30 minutes per meal for two family members working together to scrape, stack, wash; rinse; dry, and put away the dishes. That's 21 hours per week that could have been spent on other more productive activities.
Now, suppose that your family decides to buy a dishwasher that costs $400. Using the dishwasher, it will take 15 minutes for a single family member to clean up after each meal. At this rate, it will take the entire family only 54 hours per week to handle this chore. The benefits that your family reaps from the free time will cover the cost of the new dishwasher, which provides the typical benefits of physical capital: 1. Extra time Your family no longer has to spend 21 hours per week doing the dishes. Instead, the family gains 15j hours each week to use for other activities. 2. More knowledge By learning how to wash the dishes by machine, family members learn more about using household appliances in general. They can apply that
knowledge to the use of other labor-saving devices, such as washing machines, dryers, and microwaves. 3. More productivity Because family members now have extra time and extra knowledge, they can use their resources and labor to do additional chores or other activ-ities that are beneficial to the family.
Human Capital In addition to producing physical capital, people can invest in themselves. Human capital is the knowledge and skills a worker gains through education and experience.
An economy requires both physical and human capital to produce goods and services. Doctors use stethoscopes and their schooling in order to provide their services. Assembly-line workers use equipment as well as skills acquired through training and practice to produce goods.
human capital the skills and knowledge gained by a worker through education and experience
THE. WALL STREETJOURNAL.
CLASSROOM EDITION
In the News Read more about capital in "Humans Need NotApply," an article in The Wall StreetJournal Classroom Edition.
Go Online The Wall Street Journal Classroom Edition
For: Current Events
Visit: PHSchool.corn Web Code: mnc-1011
Chapter 1 ■ Section 1 5

OWNtera17.1.4.14**2014M4e4.14A.,,Mar.e .at,
FAST FACT
After:M.104V #.(ifiFid.ro:: . **.tetue .o'iniibtadoercluring 1912 . a man named Clarence
irdseye was astounded that his frozen fish was tasty When he thawe and cooked it weeks later. This entrepreneur soon patented a "quick-freeze machine" and started his own seafood company. The result? An entire frozen foods industry was born.
(-Go 'Online 4° ' PHSchool.com
For: Research Activity Visit: PHSchool.com Web Code: mnd-1011
.4,71.4114..N.TM,V.5.. •
entrepreneur ambitious leader who combines land, labor, and capital to create and market new goods and services
Entrepreneurs If land, labor, and capital are the essential ingredients for creating all goods and services, who pulls these resources together? The answer is entre-preneurs. Entrepreneurs are ambitious leaders who decide how to combine land, labor, and capital resources to create new goods and services. They are the individuals who take
risks to develop original ideas, start busi-nesses, create new industries, and fuel economic growth.
You need not be Bill Gates of Microsoft or Henry Ford to be considered an entrepre-neur. An individual who opens a corner food store and transforms it into a 10-store supermarket chain is an entrepreneur.
Scarce Resources Economists say that all goods and services are scarce because the land, labor, and capital used to create them are scarce. Consider French fries. A typical portion of French fries started as a potato in a field in
Idaho. Seven and one-half gallons of water irrigated the half-foot plot where the potato grew. Nurtured with fertilizers and protected by pesticides, the potato was harvested, processed, frozen, and then transported to Seattle. In Seattle, it was fried in corn oil from Nebraska, sprinkled with salt from Louisiana, and eaten in a restaurant.
All of the economic resources, or factors of production, that were used to create the French fries are scarce. First, the quantity of the land and water available for growing potatoes is limited. Second, the labor avail-able to grow the crop and to process and transport the potatoes is limited by the size, time, age, and energy of a population. Finally, because land and labor are limited, the amount of physical capital available to create the French fries, such as farm equip-ment, is also limited.
While we have been talking about French fries, we could easily have been talking about a pair of blue jeans or a new space shuttle. No 'matter what good or service we were to look at, we would discover that the supplies of land, labor, and capital used to produce it are scarce, and that each resource has many alternative uses.
Progress Monitoring Online For: Self-quiz with vocabulary practice Web Code: mna-1015
() erms-an amfl e ;. aiisAha:diff6rende'betvvedn igood and a service?
. Why is the idea of scarcity a starting point for thinking economically?
3. How is scarcity different from shortages?
4. Describe the three factors of production.
5. What special advantages does physical capital offer?
6. What role do entrepreneurs play in the economy?
Applying Economic Concepts 7. Critical Thinking Why might an economist look at
hundreds of cars moving along an assembly line and say, "There is an example of scarcity"?
8. Decision Making Which factor of production is repre-sented by each of the following? (a) an office building (b) an assembly line worker (c) a tree used to make paper (d) unused soil (e) an artist (f) a student
9. Try This Leaving class today, you decide to start an economics tutoring business. Your first step is to get the two categories of capital. Nextyou need to obtain the other factors of production. Specifically, what do you need in terms of land, labor, and capital?
10. Critical Thinking Do you agree or disagree with the following statement? Creating capital is like depositing money in a savings account You save now in order to have more in the future.
6 What is Economics?

ort re.p.M Stz. r
Gary Becker 4b. 1930
Nobel Prize-winning economist Gary Becker looks at daily life and sees economics at work in all we do. Becker even sees marriage as an economic decision that many people make based on opportunity costs. To understand how Becker arrived at this intriguing conclusion, you have to look at how he came to see the world.
Economics and Social Issues Like many high school seniors, Becker knew what he was good at—mathematics---but wanted some practical way to apply it. Leaving his small Pennsylvania hometown, Becker went to Princeton University and decided to pursue economics. But he lost interest in the subject because it didn't "deal with important social problems."
Becker briefly considered a degree in sociology, but found the subject "too diffi-cult." Later, as a graduate student at the University of Chicago, he realized that eco-nomics could indeed help answer social questions. His first book, based on his stud-ies at Chicago, was an economic analysis of racial discrimination.
"It started me down the path of applying economics to social issues," states Becker, "a path that I have continued to follow." In 1992, that path led to the Nobel Prize in economics, which Becker received for using economic analysis to study a wide range of human behavior. "Economy is the art of making the most of life," he says.
Economics and Personal Decisions Becker maintains that economics guides even life's most personal decisions. He sees the process of dating as part of a
"marriage market." Most people do not marry the first prospect they meet, he notes. The opportunity cost of such a marriage would be high because better prospects are likely to exist. Instead, people try to search for better prospects.
Considering Costs and Benefits An extended search for a mate, however, consumes time, effort, and other resources. It involves expenditures on personal appearance, in social situations, for educa- tion, and for other things that help attract a mate. A person decides to marry, Becker says, when the cost of searching exceeds the possible benefits of finding a better mate.
People measure the benefits of a poten-tial spouse by criteria such as job, appear-ance, education, and family, Becker says, and they try to judge other traits by these factors. For example, the probability that a person is honest and good-natured may be judged by looking at the person's family. Intelligence is gauged by the person's educa-tion. Becker maintains that this process causes people to marry on the basis of imperfect information. Not until later do they truly learn about their partner's per-sonality and compatibility, qualities that take longer to assess.
CHECK FOR UNDERSTANDING
1. Source Reading Interpret the fol-
lowing passage from an article by
Becker that appeared in
BusinessWeek:"Human capital is as
much a part of the wealth of nations as
are factories, housing, machinery, and
other physical capital."
2. Critical Thinking How does what
you've read in this introductory chapter
on economics support or conflict with
Becker's idea that "economy is the art
of making the most of life"?
3. Decision Making Do you agree or
disagree with Beckers idea that
economics guides even life's most
personal decisions? Support your
position with two or three examples
of your own.
TT11' "tr-Itt,
aNTiroi: 614 Mk147,01 igierarT7,4;,,' 01,575„ 470.44 e h A-04,A
Opportunity Cost
on~eo 1 e, n you will be able to: qte ,std" yi ng
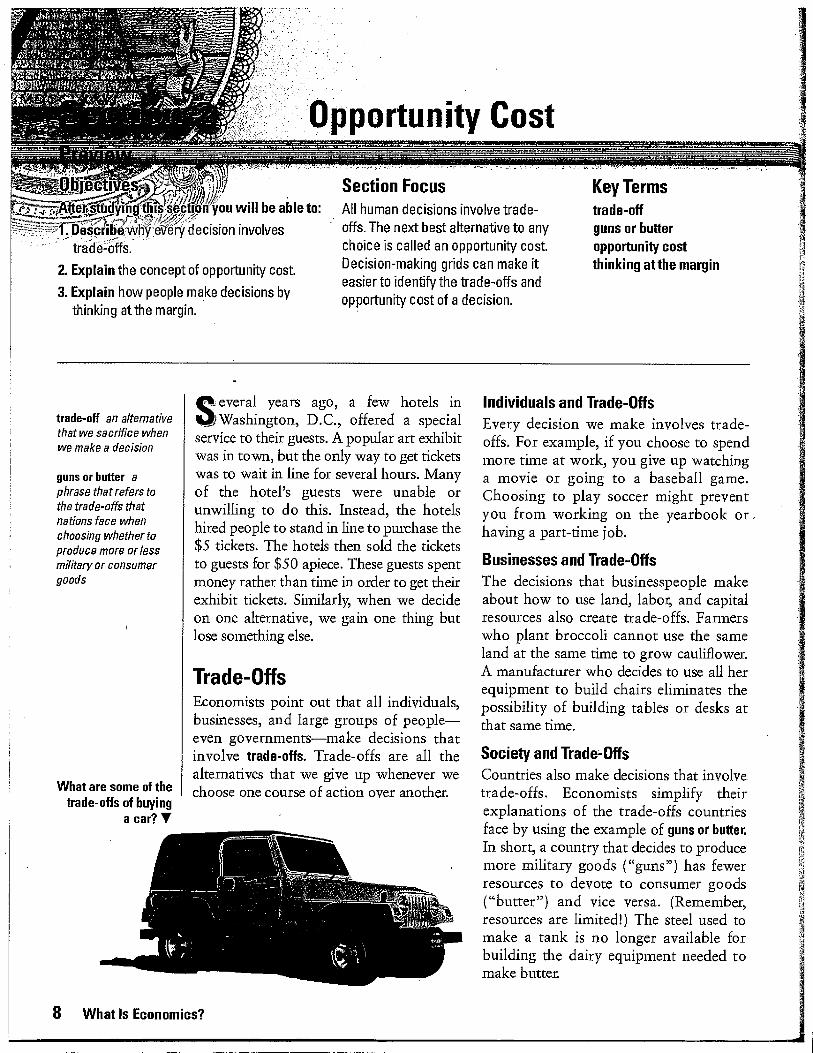
Describe why every decision involves trade-Offs.
2. Explain the concept of opportunity cost.
3. Explain how people make decisions by thinking at the margin.
Section Focus Key Terms All human decisions involve trade-offs. The next best alternative to any choice is called an opportunity cost. Decision-making grids can make it easier to identify the trade-offs and opportunity cost of a decision.
trade-off guns or butter opportunity cost thinking at the margin
trade-off an alternative that we sacrifice when we make a decision
guns or butter a phrase that refers to the trade-offs that nations face when choosing whether to produce more or less military or consumer goods
What are some of the trade-offs of buying
a car? •
everal years ago, a few hotels in %1Washington, D.C., offered a special service to their guests. A popular art exhibit was in town, but the only way to get tickets was to wait in line for several hours. Many of the hotel's guests were unable or unwilling to do this. Instead, the hotels hired people to stand in line to purchase the $5 tickets. The hotels then sold the tickets to guests for $50 apiece. These guests spent money rather than time in order to get their exhibit tickets. Similarly, when we decide on one alternative, we gain one thing but lose something else.
Trade-Offs Economists point out that all individuals, businesses, and large groups of people—even governments—make decisions that involve trade-offs. Trade-offs are all the alternatives that we give up whenever we choose one course of action over another.
Individuals and Trade -Offs Every decision we make involves trade-offs. For example, if you choose to spend more time at work, you give up watching a movie or going to a baseball game. Choosing to play soccer might prevent you from working on the yearbook or - having a part-time job.
Businesses and Trade -Offs The decisions that businesspeople make about how to use land, labor, and capital resources also create trade-offs. Farmers who plant broccoli cannot use the same land at the same time to grow cauliflower. A manufacturer who decides to use all her equipment to build chairs eliminates the possibility of building tables or desks at that same time.
Society and Trade -Offs Countries also make decisions that involve trade-offs. Economists simplify their explanations of the trade-offs countries face by using the example of guns or butter. In short, a country that decides to produce more military goods ("guns") has fewer resources to devote to consumer goods ("butter") and vice versa. (Remember, resources are limited!) The steel used to make a tank is no longer available for building the dairy equipment needed to make butter.
8 What Is Economics?
/1 01P'
A111%1 I1Iu,j
.
GlobalTrade-Offs The same decision made in two different coun-
tries can have vastly different opportunity costs. Malaysia bought two
warships in 1992, paying a price equal to the cost of providing safe drinking
water for the 5 million Malaysians lacking it. In other words, the opportunity
cost of the warships was safe drinking water for 5 million people. The opportu-
nity cost of building warships in wealthier countries is not nearly so high.
However, there are still costs to consider. In the United States, the number of
people employed byte military decreased dramatically following the end of
the cold wan-In response, the Pentagon developed a new program, "Troops to
Teachers," to help former soldiers get jobs teaching in schools. The switch
from army duty to teaching reminds us that the opportunity cost of a soldier
may be a teacher and vice versa. Why does the opportunity cost of a decision vary from one situation to another?
Yoe! HAVE TWO CA0ICE5 FOR Dit4t4ER--- I '`rAgO 1-7"log 119A✓e 17-11/
4<4'
6 4/ brialfela at■W
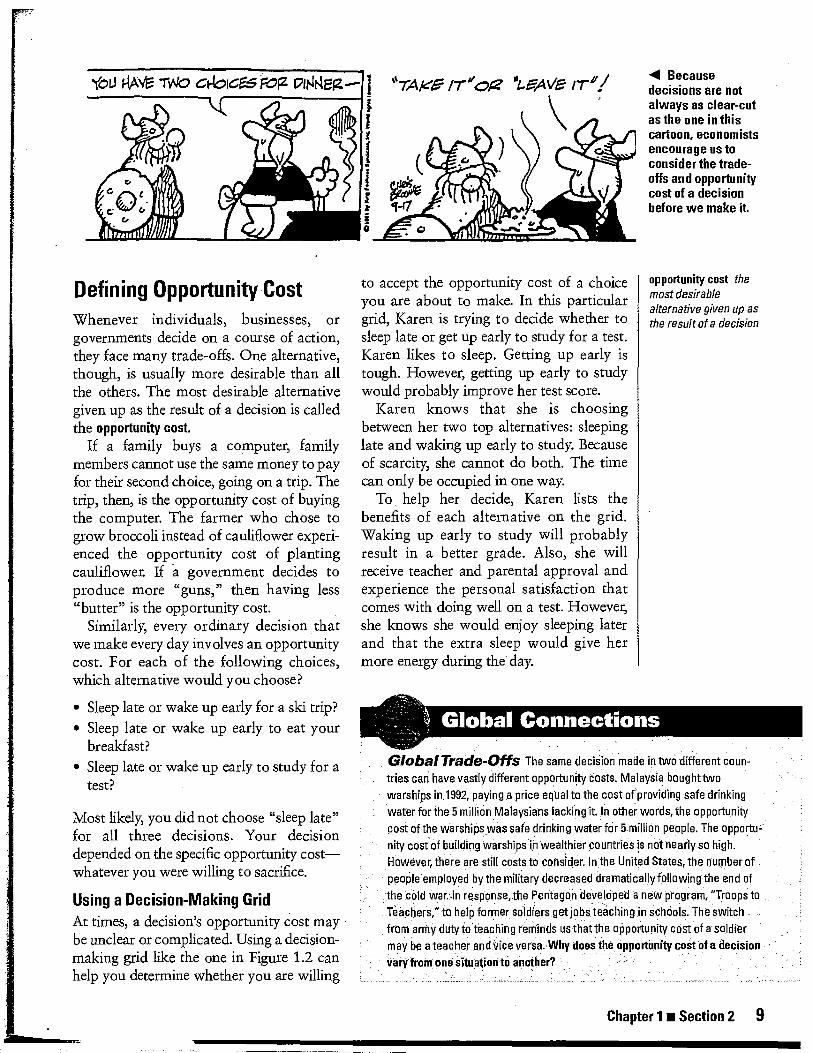
• Because decisions are not always as clear-cut as the one in this cartoon, economists encourage us to consider the trade-offs and opportunity cost of a decision before we make it.
Defining Opportunity Cost Whenever individuals, businesses, or governments decide on a course of action, they face many trade-offs. One alternative, though, is usually more desirable than all the others. The most desirable alternative given up as the result of a decision is called the opportunity cost.
If a family buys a computer, family members cannot use the same money to pay for their second choice, going on a trip. The trip, then, is the opportunity cost of buying the computer. The farmer who chose to grow broccoli instead of cauliflower experi-enced the opportunity cost of planting cauliflower. If a government decides to produce more "guns," then having less "butter" is the opportunity cost.
Similarly, every ordinary decision that we make every day involves an opportunity cost. For each of the following choices, which alternative would you choose?
• Sleep late or wake up early for a ski trip? • Sleep late or wake up early to eat your
breakfast? • Sleep late or wake up early to study for a
test?
Most likely, you did not choose "sleep late" for all three decisions. Your decision depended on the specific opportunity cost—whatever you were willing to sacrifice.
Using a Decision-Making Grid At times, a decision's opportunity cost may be unclear or complicated. Using a decision-making grid like the one in Figure 1.2 can help you determine whether you are willing
to accept the opportunity cost of a choice you are about to make. In this particular grid, Karen is trying to decide whether to sleep late or get up early to study for a test. Karen likes to sleep. Getting up early is tough. However, getting up early to study would probably improve her test score.
Karen knows that she is choosing between her two top alternatives: sleeping late and waking up early to study. Because of scarcity, she cannot do both. The time can only be occupied in one way.
To help her decide, Karen lists the benefits of each alternative on the grid. Waking up early to study will probably result in a better grade. Also, she will receive teacher and parental approval and experience the personal satisfaction that comes with doing well on a test. However, she knows she would enjoy sleeping later and that the extra sleep would give her more energy during the day.
opportunity cost the most desirable alternative given up as the result of a decision
Chapter 1 ■ Section 2 9
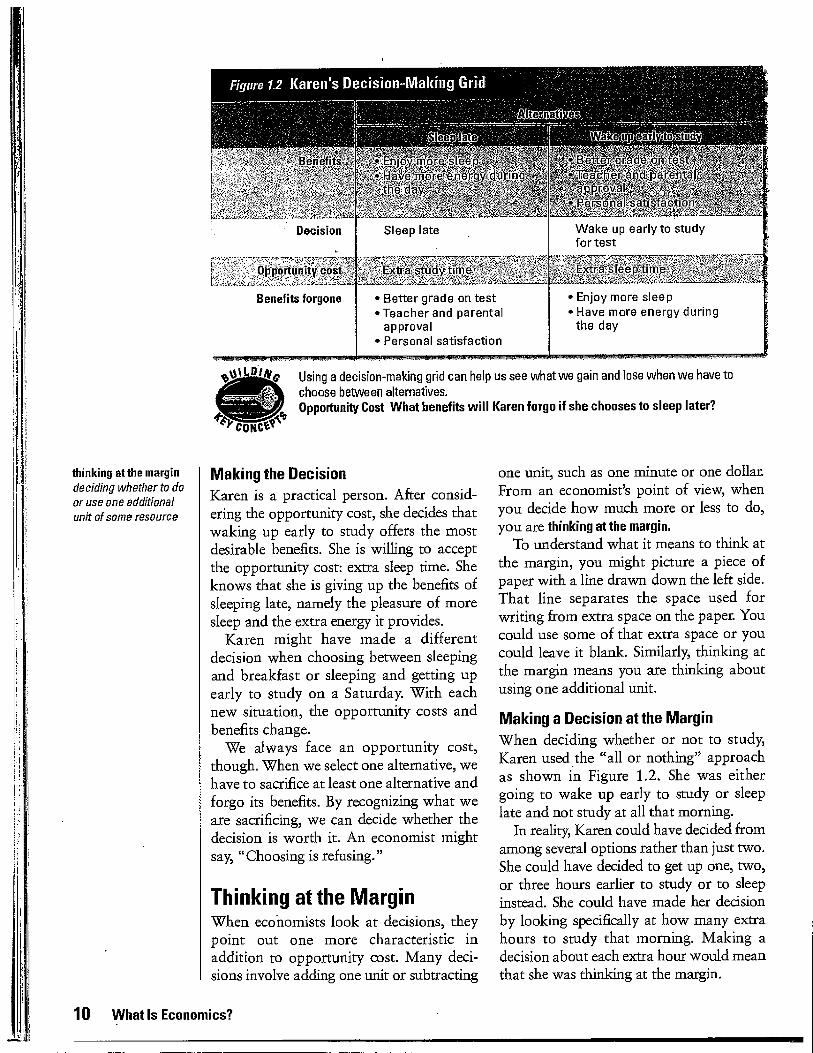
Figure 1.2 Karen's Decision-Making Grid:
WEIIIPG0abibeffiZi gen-Virr
Sleep late
• Better grade on test • Teacher and parental
approval • Personal satisfaction
promo
Wake up early to study for test
• Enjoy more sleep • Have more energy during
the day
Decision
PO°rtiinify co
Benefits forgone
1L,DIry Using a decision-making grid can help us see what we gain and lose when we have to choose between alternatives. Opportunity Cost What benefits will Karen forgo if she chooses to sleep later?
Ca Nalc
thinking at the margin deciding whether to do or use one additional unit of some resource
Making the Decision Karen is a practical person. After consid-ering the opportunity cost, she decides that waking up early to study offers the most desirable benefits. She is willing to accept the opportunity cost: extra sleep time. She knows that she is giving up the benefits of sleeping late, namely the pleasure of more sleep and the extra energy it provides.
Karen might have made a different decision when choosing between sleeping and breakfast or sleeping and getting up early to study on a Saturday. With each new situation, the opportunity costs and benefits change.
We always face an opportunity cost, though. When we select one alternative, we have to sacrifice at least one alternative and forgo its benefits. By recognizing what we are sacrificing, we can decide whether the decision is worth it. An economist might say, "Choosing is refusing."
Thinking at the Margin When economists look at decisions, they point out one more characteristic in addition to opportunity cost. Many deci-sions involve adding one unit or subtracting
one unit, such as one minute or one dollar. From an economist's point of view, when you decide how much more or less to do, you are thinking at the margin.
To understand what it means to think at the margin, you might picture a piece of paper with a line drawn down the left side. That line separates the space used for writing from extra space on the paper. You could use some of that extra space or you could leave it blank. Similarly, thinking at the margin means you are thinking about using one additional unit.
Making a Decision at the Margin When deciding whether or not to study, Karen used the "all or nothing" approach as shown in Figure 1.2. She was either going to wake up early to study or sleep late and not study at all that morning.
In reality, Karen could have decided from among several options rather than just two. She could have decided to get up one, two, or three hours earlier to study or to sleep instead. She could have made her decision by looking specifically at how many extra hours to study that morning. Making a decision about each extra hour would mean that she was thinking at the margin.
10 What Is Economics?

cGo Online FHSchool.com
For: Decision-making Activity Visit PHSchool.com Web Code: mnd-1012
To make a decision at the margin, Karen should look at the opportunity cost of each extra hour of studying and compare it to the benefit. In Figure 1.3, we can see that one hour of studying means an opportunity cost of an hour of sleep and a benefit of probably passing the test with a C. Two hours of studying "cost" two hours of sleep and perhaps getting a B. Three hours of studying mean sacri-ficing three hours of sleep and probably getting only a slightly higher grade of B+.
What should Karen decide? At three hours, the cost is no longer worth the benefit to Karen because her grade will improve only slightly. Thus, Karen decides to awaken two hours earlier.
Cost and Benefit at the Margin Comparing opportunity costs and benefits at the margin enabled Karen to decide how many hours to study. Such a comparison could help someone decide how much money to spend on a car, how many hours to work, and how much time to spend watching television. Employers think at the margin when they decide how many extra workers to hire. Legislators think at
Figure 1.3 Decision Making at the Margin
O gmarti a s
2fict.hotv.:of extra • study time .-
3rd.k:Ok. 9
the margin when deciding if a government program should include more of a partic-ular benefit. This decision-making process is sometimes called cost/benefit analysis.
Deciding by thinking at the margin is just like making any other decision. Decision makers just have to compare the opportunity costs and the benefits—what they will sacrifice and what they will gain. Once the opportunity cost outweighs the benefits, no more units should be added.
rade:A tes
*vm` 11.04 This person has to decide how many extra hours to study.
By comparing the opportunity cost to the benefit of each extra hour, she can decide how much is the right amount. Opportunity Cost At what point is this person paying an added cost with little extra benefit?
Progress Monitoring Online For: Self-quiz with vocabulary practice Web Code: mna-1016
etIng.:rancL: eas 13-reSeffithree eXarniile's.tliat illustrate how all decisions involve trade-offi.
2. Why must the opportunity cost of a decision always be something desirable?
3. How do economists use the phrase "guns or butter"?
4. What does it mean to "think at the margin"?
Applying EConomic Concepts 5. Problem Solving Suppose that you can save $50 by
buying your car in a different city. If the trip requires only $10 in gasoline, is the trip worthwhile? Why or why not?
6. Decision Making Determine an opportunity cost for each of the following. (a) eating pizza (b) going to see a movie on a Tuesday (c) going to see a movie on a Saturday (d) watching television
7. Try This Create a decision-making grid like the one in Figure 1.2 to defend a decision you will make today.
8. Critical Thinking Decide whether to work 2, 4, or 6 hours at an after-school job by comparing the opportunity cost and benefit of each alternative.
9. Decision Making Which factors would an employer consider if he or she were trying to decide whether to hire an additional worker?
Chapter 1 ■ Section 2 11

,VZ=r9C44
Interpreting Line Graphs I me graphs easily and clearly present a large quantity of statistical data.
4 • L Economists use line graphs to illustrate patterns or trends over time and to explain the relationship between two or more variables. A variable is a factor with a value that can change. Use the following steps to read and interpret the line graph below.
1. Identify the type of information presented on the graph. Before you can begin to interpret the information on a graph, you must identify specifically what is being shown. The graph title and the axes' labels indicate the meanings of the points and lines on the graph. Answer the following ques-tions. (a) What do the numbers on the horizontal axis (across) represent? (b) What do the numbers on the verti-cal axis (up and down) represent? (c) What relationship does the line graph describe?
2. Read the data shown on the graph. Study the graph's axes carefully. Before study-ing the overall patterns, look carefully at specific points on the graph.
Answer the following questions. (a) What is the maximum number of points per game that can be shown on the graph? (b) How many hours a week did Player B practice? (c) How many points per game did Player E average?
3. Study the data shown on the graph to look for relationships or draw conclu-sions about a topic. Use the graph below to draw conclusions about the relationship between time spent prac-ticing and the number of points scored per game. What could you conclude from the information on the line graph about the relationship between practice and points per game?
Additional Practice Skills: Hours of Practice vs. Points Scored
.
to 25
• 15—
13-
•
10-o
• 5
Note that the points on the graph do not form a perfectly straight line. For example, Player D did not score as many points per game as Player C, although Player D practiced more hours each week. Why might this be so? What does this informa-tion say about the conclusions we can draw from line graphs?
0 I i I I I 0 2 4 6 8 10 12 14 16
Hours of Practice per Week

Production Possibilities Curves
we --AftWOUVing thmsectm you will be able to
:Ifite7prex'alifociction possibilities curve.
2. Demonstrate how production possibilities curves show efficiency, growth, and cost.
3. Understand that a country's production possibilities depend on its available resources and technology.
Section Focus Decisions about which goods and services to produce affect each of us every day. Production possibilities graphs can help us examine the opportunity cost of these decisions.
Key Terms production
possibilities curve production
possibilities frontier efficiency underutilization cost law of increasing costs
s the United States entered World War 11 in 1941, it faced an urgent task: create
the weapons and equipment needed to win the war or face defeat. Government agencies took the lead in switching the output of America's factories, farms, and mines from the production of consumer products to the production of military products.
Whether at war or not, nations must choose what to produce. In 2002, farmers in the United States grew about 2 million tons of watermelons. Could they have produced more? If they had, what would have been the opportunity cost?
Production Possibilities Economists often use graphs to analyze the choices and trade-offs that people make. Why? Because graphs help us see how one value relates to another value. A production possibilities curve, or graph, shows alterna-tive ways to use an economy's productive resources. The axes of the graph can show categories of goods and services, such as farm goods and factory goods or capital goods and consumer goods. The axes can also display any pair of specific goods or services, such as hats on one axis and shoes on the other.
production possibilities curve a graph that shows alternative ways to use an economy's resources
• During World War II, consumer goods were in short supply as the nation shifted resources to increase production of planes, ships, artillery, and ammu-nition. Ration coupons (far left) were used to ensure that civilians got a fair share of consumer goods.
ter 1 in Section 3 13

"We feel he's either going to be an artist or an economist."
Figure 1.4 Production Possibilities Curve Step 1
Graph B
No watermelons, all possible shoes
0
E 10
0
5 10 15 20 25 0
Watermelons (millions of tons)
I I I I 5 10 15 20 25
Watermelons (millions of ions)
A Why do economists use graphs?
production possibilities frontier the line on a production possibilities graph that shows the maximum possible output
Drawing a Production Possibilities Curve To draw a production possibilities curve, an economist begins by deciding which goods or services to examine; for example, farm goods and factory goods. In this example shoes and watermelons become the values shown on the two axes of the graph. If the vertical axis in Graphs A and B in Figure 1.4 represents shoes, Graph A indicates that this fictional country,
Capeland, could produce 15 million pairs of shoes if it used all of its resources to produce only shoes.
The horizontal axis represents water-melons. Graph B indicates that Capeland could produce 21 million tons of water-melons if that's the only product it chose to produce. So Capeland can produce a maximum of:
15 million pairs of shoes OR
21 million tons of watermelons A third, more likely, alternative appears
in Figure 1.5. The citizens of Capeland could also produce both shoes and water-melons, and this range of choices appears in the table and graph in that figure. It shows six different ways that Capelanders could use their resources to produce watermelons and shoes. Using the made-up data from the table, we can plot points on the graph and then connect them to draw the line shown in Figure 1.5. This line that we can draw, called the production possibilities frontier, shows combinations of the production of both shoes and watermelons. Any spot on
14 What Is Economics?
You can begin to build a production possibilities curve by plotting two of the production choices on a grid. Graph A reflects a decision to produce 15 million pairs of shoes. Graph B reflects a decision to produce 21 million tons of watermelons.
Opportunity Cost What is the opportunity cost of the decision shown in Graph A?

21
A production possibilities frontier
5 10 15 20
Watermelons (millions of tons)
25
Figure 1.5 Production Possibilities Curve Step 2
20
15
10
0
11. Di* Z'r""rMir5rrTrir5nrMPF,T!.,',""":' ,.771nT!fr-r,-,-
The table above shows six different combinations of watermelon and shoes that Capeland could produce using all of its factor resources. Each combination of numbers in the table is drawn as a point on the graph. Connecting the points forms a line known as the production possibilities frontier. Opportunity Cost What is the opportunity cost of choosing to produce the combi-nation of goods shown at point c instead of that shown at point d?
efficiency using resources in such a way as to maximize the production of goods and services
that line represents a point at which Capeland is using all of its resources to produce a maximum combination of those two products.
Trade-Offs Each point in Figure 1.5 reflects a trade-off. Near the top of the curve (points a and b), shoe factories produce more shoes, but farms grow fewer watermelons. Moving down the curve, farms grow more water-melons, but factories make fewer shoes. Why? Because land, labor, and capital are scarce. Using the factors of production to make one product means that fewer resources are left to make something else.
Efficiency, Growth, and Cost Production possibilities graphs tell us important information. They can show how efficient an economy is, whether an economy has grown or shrunk, and the opportunity cost of a decision to produce more of one good or service.
Efficiency A production possibilities frontier repre-sents an economy working at its most efficient level, of production. Efficiency means using resources in such a way as to maximize the production or output of goods and services. However, sometimes economies operate inefficiently. For example, what would happen if some farmers and factory workers were laid off? The farms and factories where they worked would produce fewer goods. This trade-off is represented by drawing a point inside the production possibilities frontier.
Any point inside the line indicates an underutilization of resources. Under-utilization means using fewer resources than the economy is capable of using. Point g in Figure 1.6 shows that Capeland is harvesting 5 million tons of water-melons and manufacturing 8 million pairs of shoes—much less than the maximum possible production.
underutilization using fewer resources than an economy is capable of using
Chapter 1 ■ Section 3 15

Figure 1.6 Production Possibilities Curve Step 3
25 0 5 10 15 20
Future production possibilities frontier
15
10 —
5 A point of underutilization
0
Sh
oes
(mil
lion
s o
f pa
20.
Watermelons (millions of tons)
At point g on this graph, not all factor resources are being used, and the output of farm and factory goods is less than what is possible. Line S represents the economy's current production possibilities.
Line T represents future production possibilities if more land, labor, or capital resources become available. Investment How does a society benefit when it invests money in the development of new technologies?
IL 01
CONCO
THE WALL STREET JOURNAL. CLASSROOM EDITION
In the News Read more about efficiency growth, and cost in "A New Scholarship Strategy," an article in The Wall Street Journal Classroom Edition.
Go Online The Wall Street Journal Classroom Edition
For: Current Events Visit: PHSchool.com Web Code: mnc - 1013
Growth A production possibilities curve reflects the country's current production possibilities as if the country's resources were frozen in
time. In the real world, however, the quantity of resources a country has is constantly changing. If the quantity or quality of avail- able land, labor, or capital changes, then the curve will move. For example, if immi- grants pour into a country, then more labor becomes available. In this way, the maximum amount of goods the nation can produce increases. Likewise, new inventions can allow workers to produce more goods at lower costs. When an
economy grows, economists say that the entire production possibilities curve has "shifted to the right." Line T in Figure 1.6 shows such a shift.
By contrast, when a country's production capacity decreases, the curve shifts to the left. A decrease could occur, for example, when a country goes to war and loses part of its land as a result. Likewise, if a country's population ages, or becomes less healthy or less educated, the supply of labor and human capital would decrease, and the curve would shift to the left.
Cost Speaking economically, note that cost is not necessarily money. Rather, to an econ-omist, cost is the alternative we give up when we choose one option over the other. This statement should sound familiar. To an economist, cost always means opportu-nity cost. We can use production possibili-ties graphs to see the opportunity cost involved in a decision.
Looking at the table in Figure 1.5, we can see that the cost of moving from producing no watermelons to producing 8 million tons of watermelons is 1 million pairs of shoes. In other words, we had to sacrifice 1 million pairs of shoes to produce 8 million tons of watermelons. In the same way, if we decide to produce 14 million tons of water-melons—an increase of only 6 million tons—it costs 2 million pairs of shoes. In the first step, those 8 million tons of water-melons cost 1 million pairs of shoes. In the second step, an increase of only 6 million tons of watermelons cost an additional 2 million pairs of shoes. This amounts to 3 million pairs of shoes for 14 million tons of watermelons.
Everyone would agree that switching from shoes to watermelons costs something. An economist looking at Capeland's economy would say that the switch has increasing costs. Each time we grow more watermelons, the sacrifice in terms of shoes increases. Finally, at the bottom of the table, it costs an additional 5 million pairs of shoes to increase watermelon production by only 1 million tons..
cost to an economist, the alternative that is given up because of a decision
16 What Is Economics?

Figure 1.7 The Law of Increasing Costs
Shoe factories
STEP I
Initially, resources are used 'efficiently to make a balance of watermelons and shoes.
The most suitable land for farming is used to grow watermelons.
STEP
A debision is made.to grow more - watermelons. Less Suitable resources are shifted to farm produCtion. Farm production increases. Shoe production
' decreases.
STEP 3
A decision is made to grow even more watermelons, and more
- resources are shifted to farm production. Because the:added land is less productive, a greater amount of it must be cultivated. Farrroutput increases. Shoe output decreases by an even - greater amount
Land with rocky soil is now used to grow watermelons.
Land with rocky soil and poor drainage is now used to grow watermelons.
att.A73.1M.04M510
The law of increasing costs states that as production shifts from one item to another, in this case from shoes to watermelons, more and more resources are necessary to increase production of the second item, in this case, watermelons.
CONOS01' Opportunity Cost According to this diagram, what is the cost of increasing watermelon production?
ilDi
law of increasing costs law that states that as we shift factors of production from making one good or service to another, the cost of producing the second item increases
Economists explain these increasingly expensive trade-offs with the law of
increasing costs. This law states that as production switches from one item to another (for example, from shoes to watermelons), more and more resources are necessary to increase production of the second item (watermelons). Therefore, the opportunity cost increases.
Why does the cost increase? In this example it is because some resources are better suited for use in farming, while others are more appropriate for manufac-turing. Moving resources from factory to farm production means that farmers must
use resources that are not as suitable for farming. For example, say that at first this economy used its most fertile land for growing watermelons. After the best land was used up, farmers had to use poorer land that could produce less per acre than the fertile land could. To increase output on the poorer land, farmers had to use more land and other resources.
The law of increasing costs explains why production possibilities frontiers, such as the one in Figure 1.5, usually curve. As we move along the curve, we trade off more and more to get less and less additional output.
Chapter 1 ■ Section 3 17

414 CoRae
The United States and Western
Europe are the heaviest
computer-using regions of the world.
Opportunity Cost What opportunity
cost might a poorer country face if it
chose to purchase or produce more
computers?
Figure 1.8 Personal Computers per 1,000 People
1111111142:0
.11. 08.4 111188.7
03.0 ;: . 111 .74.8 !. 127.6 If 11.9
Go idIr.
onlineonlinePHicnoom
Web Code: fling-1012
413.8
451.4
484.7
487.0
528.3
576.8
501.8
708.7
382.2
3471
100 200 300 400 500 600 700 800
linitedr4tates':- R
OM ark
NerWaY
Canada
Germany
Iceland
New Zealand
Japan
France
Poland
Hungary
Russia
Mexico
Brazil
China
Indonesia
India
asst ,y
(
-Go
PHSchool.com For: Research Activity Visit: PHSchool.com Web Code: avid-1013
0 5 10 15 20 25
Consumer Goods
B
I I 0 5 10 15 20 25
Consumer Goods
0
15
10
'E. 5 L7
0
15 -0 0 ° 10
Source: International Telecommunication Union
701fe'grmwerragergINIF
Resources and Technology When economists collect data to create production possibility curves, they must first determine which goods and services a country can produce, given its current resources. A country's resources include its land and natural resources, its work force, and its physical and human capital. Both human and physical capital reflect a vital ingredient—technology. At any time, coun-tries have different ways to produce shoes or watermelons or any of the thousands of products in the world. Each production method uses different technology, or know-how, to create products. So economists also must assess each country's level of technolog-ical know-how: whether Capeland makes shoes and plants watermelons by hand or whether they have machines to help. A country's production possibilities depend on both its technological level and the resources it has available.
Progress Monitoring Online For: Self-quiz with vocabulary practice Web Code: mna-1017
e yTerMs;-,a ndlitm Ida Os
Oepicted on a production possi- bilities frontier?
2. How does a production possibilities curve illustrate how efficient an economy is?
3. How does a production possibilities curve illustrate opportunity cost?
Applying Economic Concepts 4. Using the Databank Turn to the charts showing the
number of farms and the average size of farms on page 535. If the number of farms has decreased since 1950, does this mean that the production possibilities for farm output have also decreased? Why or why not?
5. Problem Solving How would you illustrate the impact of each of the following events on a production possibilities curve for factory goods and farm goods? (a) the computer is invented (b) 1 million farm workers remain unemployed far six months (c) a drought
6. Critical Thinking Describe a specific event that would make each of the following happen to a production
possibilities curve. (a) a point moves down and to the left (b) the frontier shifts to the right
7. Decision Making Assume that graphs A and B below each represent a production trade-off made by a society for its economy. Write a brief description of each society. Include specific examples of what the society is producing.
18 What Is Economics? x.

ITT
.Z.717
Opportunity Cost _L ................
Safety at Any Cost?
When you buy a car, you face trade-offs: Do you buy the new subcompact that may not have enough room for
your gear or the larger used sedan that needs a paint job? The features that make a car safer may also involve trade-offs. Economists urge consumers to consider the trade-offs and opportunity costs of each of their purchase decisions. Most of these opportunity costs fall into one of three cate-gories: cost and convenience, size, and personal freedom.
Safety Devices Versus Cost and Convenience Over 40,000 people are killed every year in crashes on our roads. Safety features like antilock brakes and dual-side air bags may save lives, but they also make cars more expensive. Some features like seatbelts are sometimes seen as an inconvenience, so consumers do not always use them. Manufactures would like to produce safe cars, but they must sell them at a price that buyers are willing to pay. Safety features are defeated if travelers ignore or disable them.
Size Versus Pollution Heavier cars are generally safer cars—they tend to hold up better when there is an accident and provide passengers with more protection. SUVs have become increasingly popular because they are heavy and taller, giving the driver a better view of the road. On the other hand, they are also more expensive to buy and more costly to run because they have lower fuel efficiency.
Burning extra fuel also means increasing auto emissions. The U.S. currently generates more greenhouse gas emissions than any other country in the world, and the amount is growing. Also, "gas guzzlers" increase our dependence on foreign oil.
Safety Laws Versus Personal Freedom Many states have struggled with laws requiring the use of seatbelts in cars, carseats for infants and young children, or helmets for motorcyclists. There is considerable evidence that these safety precautions reduce the severity of injury if there is an accident. However, laws requir-ing people to use seatbelts or helmets also restrict individual freedom, so there is a trade-off between a national interest in keeping people safe and a personal interest in being able to make your own life choices.
Applying Economic Ideas 1. Suppose you are buying a car. How would the trade-offs
discussed above affect your decision?
2. The table at the right shows the specific costs of various optional auto safety devices. On what basis would you decide which, if any, of these safety options to buy?
♦ Safety devices save lives but also involve some opportunity costs.
C S o
a ntilock e
Idle: $14,205
feature Cost ntilock brakes
tr4" d impa
air c t bags
Tractin10'14
eat u ost...
ractioni et von.141algt;hr:°
aifefeature • nblOCk rakes,
'actio3i ::control::'

Human Capital
Labor Capital Land
Physical Capital
Chapter Summary A summary of major ideas in Chapter 1 appears ^below. See also the Guide to the Essentials of Economics, which provides additional review and test practice of key concepts in Chapter 1.
Section 1 Scarcity and the Factors of Production (pp. 3-6) Economics is the study of how people seek to satisfy their needs and wants by making choices. People, businesses, and governments must make choices because all resources are scarce. Scarcity means lim-ited quantities of resources to meet unlimited needs or desires. Economists call the resources that are used to make all goods and services the factors of production. The three factors of production are land, labor, and capital. Entrepreneurs are leaders who combine the three factors of production to cre-ate new goods and services.
Section 2 Opportunity Cost (pp. 8-11) Every decision involves trade-offs. Trade-offs are all the alternatives that we give up when we choose one course of action over another. The most desirable alternative given up as the result of a decision is called the opportunity cost. If a decision involves choosing one more or one fewer unit of an input, economists say we are thinking at the margin. Employers think at the margin to decide how many workers to hire.
Section 3 Production Possibilities Curves (pp. 13-18) Economists draw curves or graphs in order to help them analyze the choices and trade-offs people make. A production possibilities curve shows the alternative ways in which an economy's resources can be used. The production possibilities frontier is the line or curve on the graph that represents the maximum amount that an economy can produce. Points inside the frontier reflect an underutilization of resources. If the amount of available land, labor, or capital increases, the entire curve can shift to the right. The law of increasing costs states that as production shifts from one item to a sec-ond item, more and more resources are necessary to increase production of the second item.
Key Terms Complete each sentence by choosing the correct answer from the list of terms below. You will not use all of the terms.
• - capitej.. ,opportunity. cost , entrepreneur scarcity goods , trade-offs "guns or butter" underutiliiation land economics
1. Economists define as "limited quan- tities to meet unlimited wants."
2. All decisions involve because we must give up some alternatives when we choose a certain course of action.
3. The term refers to all natural resources that are used to produce goods and services.
4. Economists use the phrase to describe the trade-offs a country is forced to make when choosing between military and con-sumer production.
5. A(n) is the most important sacrifice that results from making a decision.
6. A person who starts a new business or develops an original idea is known as a(n)
7 of resources occurs when an econ- omy uses fewer resources than it is capable of expending.
Using Graphic Organizers 8. On a separate sheet of paper, copy the tree
map below to help you organize information about the factors of production. Complete the tree map by writing descriptions and examples for each of the headings shown.
Factors of Production
20

c.-0 -80 — co 0 70 — = c -0 60-- c c co
co crt
0 co _c 45,1
1 I I I 6 8 10 12 14 16 18 20 22
Years of school completed Source: Bureau otthe Census
50 — 40 —30 — 20 —10-0
Economics Journal
Essay Writing Review your Economics Journal entry for Chapter 1. Write a brief essay describing the opportunity cost for each of the three decisions that you noted in your journal.
Reviewing Main Ideas 9. Using examples of land, labor, and capital,
explain why economists believe that all goods and services are scarce.
10. Explain how each of the following people would talk about scarcity and trade-offs. (a) the President of the United States (b) the leader of a developing nation (c) a U.S. citizen .whose income is in the top one percent (d) a U.S. citizen whose income is in the bottom 5 percent
11. What three important pieces of information can we learn by reading a production possibilities graph?
12. Explain the law of increasing costs.
Critical Thinking 13. Testing Conclusions Review the typical benefits
of physical capital described in Section 1. Give specific examples of how the first railroads in the United States created or did not create the benefits of physical capital.
14. Predicting Consequences Describe three services that the government provides to its citizens. Identify. some of the opportunity costs of provid-ing each of those services.
15. Drawing Conclusions Some economists consider entrepreneurship to be a fourth factor of pro-duction in addition to land, labor, and capital. Other economists consider entrepreneurship to be a special category of labor. Which group of economists do you agree with? Why?
Problem-Solving Activity 16. Suppose that you lent $100 to a friend, and he or
she paid you back one year later. What was the cost of lending your friend this money?
Skills for Life Interpreting Line Graphs Review the steps shown on page 12; then answer the following questions about the line graph shown below.
17. What relationship does the line graph describe? 18. What is the average annual income of men with
16 years of education? 19. How many years of schooling result in an aver-
age annual income of $73,000 for women? 20. What could you conclude from the line graph
about the relationship between income and education?
21. Use this graph to practice thinking at the margin. Suppose you have just completed grade 12. If you spend one more year in school, by how much will your lifetime income increase (assum-ing you work until age 65)?
Progress Monitoring Online For: Chapter 1 Self-Test Visit: PHSchool.com Web Code: mna-1011
As a final review, take the Economics Chapter 1 Self-Test and receive immediate feedback on your answers. The test consists of 20 multiple-choice questions designed to test your understanding of the chapter content.
21