topic paper #28 transportation efficiency - · pdf fileworking document of the npc global oil...
TRANSCRIPT

Working Document of the NPC Global Oil & Gas Study Made Available July 18, 2007
TOPIC PAPER #28
TRANSPORTATION EFFICIENCY
On July 18, 2007, The National Petroleum Council (NPC) in approving its report, Facing the Hard Truths about Energy, also approved the making available of certain materials used in the study process, including detailed, specific subject matter papers prepared or used by the Task Groups and their Subgroups. These Topic Papers were working documents that were part of the analyses that led to development of the summary results presented in the report’s Executive Summary and Chapters. These Topic Papers represent the views and conclusions of the authors. The National Petroleum Council has not endorsed or approved the statements and conclusions contained in these documents but approved the publication of these materials as part of the study process. The NPC believes that these papers will be of interest to the readers of the report and will help them better understand the results. These materials are being made available in the interest of transparency. The attached Topic Paper is one of 38 such working document used in the study analyses. Also included is a roster of the Subgroup that developed or submitted this paper. Appendix E of the final NPC report provides a complete list of the 38 Topic Papers and an abstract for each. The printed final report volume contains a CD that includes pdf files of all papers. These papers also can be viewed and downloaded from the report section of the NPC website (www.npc.org).

Working Document of the NPC Global Oil and Gas Study Made Available July 18, 2007
NATIONAL PETROLEUM COUNCIL
TRANSPORTATION EFFICIENCY SUBGROUP OF THE
TECHNOLOGY TASK GROUP OF THE
NPC COMMITTEE ON GLOBAL OIL AND GAS
TEAM LEADER
F. Emil Jacobs Vice President
Research and Development ExxonMobil Research and
Engineering Company
MEMBERS
John K. Amdall Director Engine Research and Development Caterpillar Inc. Alicia M. Boutan Vice President Business Development Chevron Technology Ventures LLC Kevin L. Bruch Assistant Director, Engine Research Technical Services Division Caterpillar Inc. K. G. Duleep Managing Director Transportation Energy and Environmental Analysis, Inc. William R. Finger Senior Associate Cambridge Energy Research Associates David J. Friedman Research Director Clean Vehicles Program Union of Concerned Scientists Srini R. Gowda Business Development Manager General Electric - Aircraft Engines Albert M. Hochhauser Consultant Essex Consulting, Inc.
Gilbert R. Jersey Distinguished Research Associate ExxonMobil Research & Engineering Co. Peter Lawson Product Line Manager General Electric – Transportation James A. Spearot Director, Chemical and Environmental Sciences Lab General Motors Research & Development Center Daniel Sperling Director Institute of Transportation Studies University of California Kevin C. Stork Lead General Engineer Office of FreedomCAR and Vehicle Technology Program U.S. Department of Energy Tom Stricker Director Technical and Regulatory Affairs Toyota Motor North America, Inc. Rogelio A. Sullivan Supervisory General Engineer Office of the FreedomCAR and Vehicle Technology Program U.S. Department of Energy
Working Document of the NPC Global Oil and Gas Study Made Available July 18, 2007
1
Technologies for Transportation Efficiency
Transportation Efficiency Subgroup Team leader: Emil Jacobs
Date submitted: January 2007
I. Executive Summary
A. General Overview
This report identifies technologies that have the potential to reduce petroleum
fuel demand for the five subsectors of transportation (light-duty vehicles, heavy-duty
vehicles, air transport, marine shipping, and rail transport) between now and 2030.
The report lists hurdles and possible actions for overcoming the hurdles, but does not
attempt to predict which technologies will be adopted.
Over time, new technologies will enter the marketplace if one or more of the
following occur: 1) the technologies mature and costs decrease, 2) fuel costs increase
and remain high, 3) the technologies are valued by the consumer or 4) policies
encourage adoption of improved technologies.
Government and industry play an important role in filling and maintaining the
technology pipeline for transportation efficiency, can encourage academic research in
high-profile transportation technology areas such as advanced batteries and bio-based
fuels, and can encourage students to enter engineering, science, and mathematics
professions to work on these challenging issues. In addition, increased funding of
R&D increases the number of breakthrough concepts that can be pursued, making the
odds more favorable for successful commercialization.
The various modes of freight shipment have much different energy requirements
on a ton-mile basis, as do the various modes of passenger travel (automobiles, buses,
Working Document of the NPC Global Oil and Gas Study Made Available July 18, 2007
2
trains, and aircraft). Policies that encourage efficient use across transportation
subsectors were not addressed in this report, and the cost, benefits, and hurdles of
these should be studied further.
Finally, alternative fuels have a generic impact across all of the subsectors by
displacing some petroleum-based fuel, but have little impact on reducing the energy
demand (e.g. BTUs per mile) for a subsector. Hydrogen—when used as an energy
carrier in fuel cells—and electricity in plug-in hybrids or battery electric vehicles,
result in higher efficiency than existing technologies. Infrastructure requirements and
the energy required to produce the fuels need to be considered for these alternatives
(e.g. well-to-tank assessment).
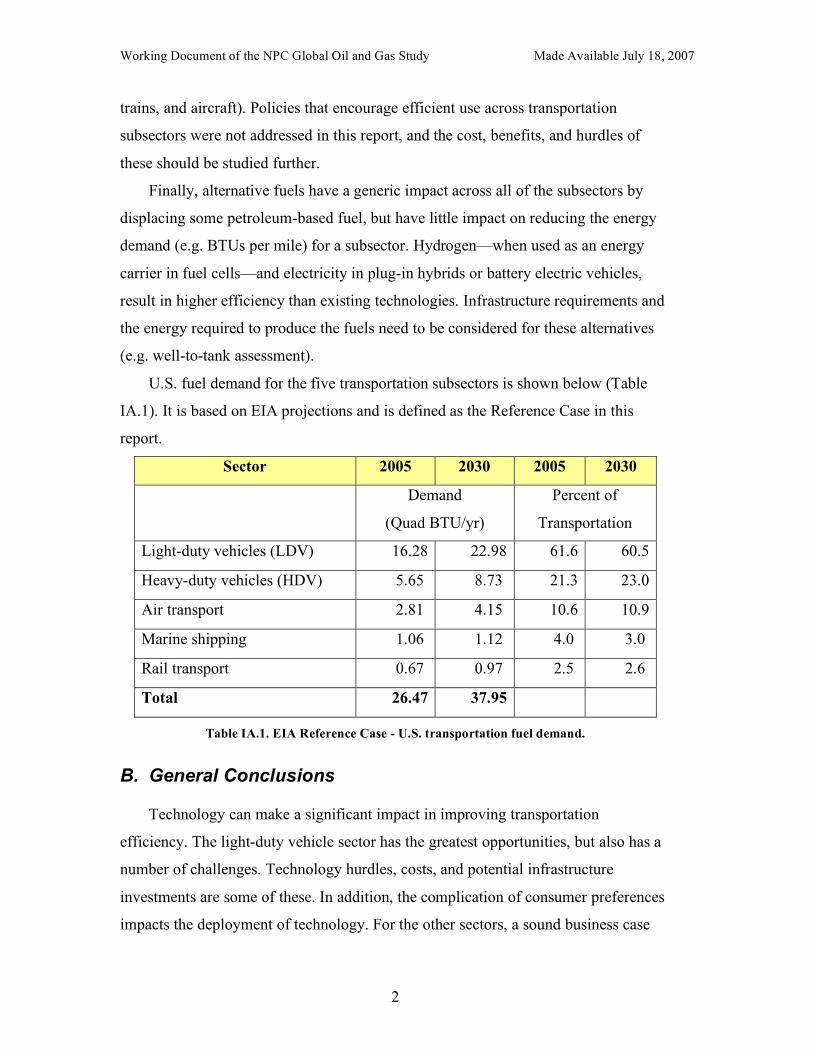
U.S. fuel demand for the five transportation subsectors is shown below (Table
IA.1). It is based on EIA projections and is defined as the Reference Case in this
report.
Sector 2005 2030 2005 2030
Demand
(Quad BTU/yr)
Percent of
Transportation
Light-duty vehicles (LDV) 16.28 22.98 61.6 60.5
Heavy-duty vehicles (HDV) 5.65 8.73 21.3 23.0
Air transport 2.81 4.15 10.6 10.9
Marine shipping 1.06 1.12 4.0 3.0
Rail transport 0.67 0.97 2.5 2.6
Total 26.47 37.95
Table IA.1. EIA Reference Case - U.S. transportation fuel demand.
B. General Conclusions
Technology can make a significant impact in improving transportation
efficiency. The light-duty vehicle sector has the greatest opportunities, but also has a
number of challenges. Technology hurdles, costs, and potential infrastructure
investments are some of these. In addition, the complication of consumer preferences
impacts the deployment of technology. For the other sectors, a sound business case

Working Document of the NPC Global Oil and Gas Study Made Available July 18, 2007
3
impacts the deployment of technology, including fuel cost savings and operational
factors.
It is important that all of the technologies are analyzed from a “wells-to-wheels”
efficiency and cost basis. This was not done by the subteam, since the focus was on
transportation efficiency at the point of end use (excluding fuel availability,
production, and distribution issues). As such, many of the learnings will require
further analysis by the Demand and Supply Teams.
It should be noted that, although the technologies discussed below are analyzed
from a U.S. perspective, the technologies themselves are generic and can be applied
in all parts of the world, when the appropriate attributes and constraints are
considered for the specific countries of interest.
C. Light-Duty Vehicles
The EIA reference case projects that in 2030, technology improvements will
result in ~13% improvement in new vehicle fuel consumption (BTUs per mile) from
2005 levels. EEA estimated that this included technology improvements of ~30% at
constant vehicle performance, and vehicle attribute changes that reduce this
improvement by about half. Based on this study’s analysis, technologies (drive-train
and body improvements, and hybridization) exist, or are expected to be developed,
that have the potential to reduce fuel consumption of new light-duty vehicles by 50%
relative to 2005 vehicles. This assumes constant vehicle performance and entails
higher vehicle cost. The extent to which these technologies translate into reduction in
fuel consumption depends on factors not evaluated in this study, including customer
preferences, vehicle and fuel costs, and vehicle attributes (acceleration, weight, and
size). Improvements beyond 50% will require breakthroughs in batteries or fuel cells,
resulting in significantly higher vehicle costs and potentially significant infrastructure
investments. Technologies such as hybrids and fuel cells will take longer to deploy in
the fleet than more conventional changes (e.g. improved fuel injection or turbo
charging). Hydrogen for fuel cells would displace petroleum-based fuels. However,

Working Document of the NPC Global Oil and Gas Study Made Available July 18, 2007
4
the source of the hydrogen, costs, technical hurdles, and infrastructure requirements
are major unknowns and it is difficult to estimate the impact of fuel cells in 2030.
D. Heavy-Duty Vehicles
Technologies exist to reduce new heavy-duty truck fuel consumption by 15 to
20% in the USA by 2030, which is about equal to the EIA reference case. These
technologies (e.g. engine efficiency, rolling resistance, and aerodynamic
improvements) will involve higher cost and require an associated financial business
case. Operational improvements such as reduced idling and improved logistics can
provide a benefit of 5 to 10% across the fleet during this period. Advanced
technology solutions, such as hybridization and fuel cells, offer fuel consumption
reductions of an additional 25%, and applications would likely be initiated in local
delivery, short-haul, medium-duty delivery trucks and buses. In the near term, U.S.
heavy-duty emission standards will limit the potential to reduce fuel consumption.
E. Air Transport
Fuel consumption improvements on the order of 25% are the basis for the EIA
reference case. This is an aggressive projection and all of the known technologies
appear to be included in the EIA estimates. New technologies will need to be
discovered to achieve additional improvements in efficiency. These new technologies
will require a reinvigoration of U.S. research, development, and demonstration
initiatives, similar to programs currently being carried out in Europe.
F. Marine Shipping
The EIA reference case is based on a 5% improvement in marine shipping fuel
consumption by 2030. This level of improvement is achievable with operational
solutions and existing technologies. Improvements greater than 5% will require new
hull designs and new propeller designs. Given the long life of ships (greater than 20
years), migration of these solutions into the fleet will not have a large impact until

Working Document of the NPC Global Oil and Gas Study Made Available July 18, 2007
5
later in the study period. Operational changes, affecting the entire fleet, may be more
significant than technological improvements.
G. Rail Transport
The EIA reference case projects that fuel consumption will improve by 2.5%
between 2005 and 2030. Incremental improvements in engine design, aerodynamics,
and use of hybrids have the potential to reduce new locomotive fuel consumption by
up to 30% over 2005 technology. Rollout of new technology into the fleet is slow due
to low turnover and will be difficult to achieve in the study timeframe. Emissions
standards will tend to increase fuel consumption.

Working Document of the NPC Global Oil and Gas Study Made Available July 18, 2007
6
II. Overview of Methodology
The Transportation Efficiency Technology Subgroup consisted of experts in
transportation and fuel technology from a cross-section of academia, the federal
government, NGOs, vehicle and engine manufacturers, and energy companies.
Subgroup members are listed in Appendix 1.
Individual subgroup members provided data, reports, and other publicly-
accessible information for review and discussion. These are identified in Appendix 2.
Two teleconferences were held to discuss study approach and deliverables. A
Transportation Efficiency Workshop was held at the end of October to review all data
collected and to discuss the study conclusions. Finally, two teleconferences were held
to review final study conclusions.
The subgroup was assisted by Mr. K.G. Duleep of Energy and Environmental
Analysis, who acted as a clearinghouse for the collected data and provided analysis
summaries. The approach used by the Subgroup consisted of:
• Identification of technologies in the EIA reference case.
• Categorization of technologies that might be considered for improving fuel
consumption in the five subsectors (light-duty vehicles, heavy-duty vehicles,
air, marine, and rail) by percent fuel consumption improvement and costs,
and probability of commercial availability of the technologies, rated as low,
medium, or high.
• Identification of potential fuel consumption improvements above the EIA
reference case.
• Identification of hurdles to technology advancement and potential policy
options to advance the technologies. Potential policies will be analyzed by
the Policy Group.
In all of the transportation subsectors, fuel consumption was considered at the
end-use point (e.g. tank-to-wheels for the light-duty vehicle sector). Energy is

Working Document of the NPC Global Oil and Gas Study Made Available July 18, 2007
7
required to produce the fuels associated with the various transportation modes. These
well-to-tank energy requirements can be substantial for some alternatives to
petroleum (i.e. hydrogen, biofuels, and electricity, depending on the source) and are
being analyzed by the Supply and Demand Groups.
Alternative fuels can influence demand for petroleum-based fuels in two ways:
1) they displace the demand for petroleum in the transportation sector on an energy-
equivalent basis (e.g. use of biodiesel in heavy-duty trucks) and 2) they may change
fuel consumption (positively or negatively) at the point of use (e.g. hydrogen use in
fuel cells is more efficient than gasoline from a tank-to-wheels perspective). Only the
second effect is identified in the technology tables in this report. The petroleum
displacement effect can be applied generically across all of the sectors and
quantitative analysis is being conducted by Demand Group.
It should be noted that shifts in transportation from one sector to another can
have a significant influence on energy demand. For example, the table below shows a
relative comparison of fuel consumption of freight moved by heavy-duty truck, rail,
and ships.
Mode Relative Consumption
Truck 1.0 Rail 0.31 Ship—Container 0.24 Ship—Bulk 0.10
Table II.1. Relative consumption, based on energy used/ton-mile, with trucking set to 1.0.
Where sector shifts are possible, these are identified but no further analysis was
conducted.
Working Document of the NPC Global Oil and Gas Study Made Available July 18, 2007
8
III. Light-duty Vehicles (LDV)
A. Background
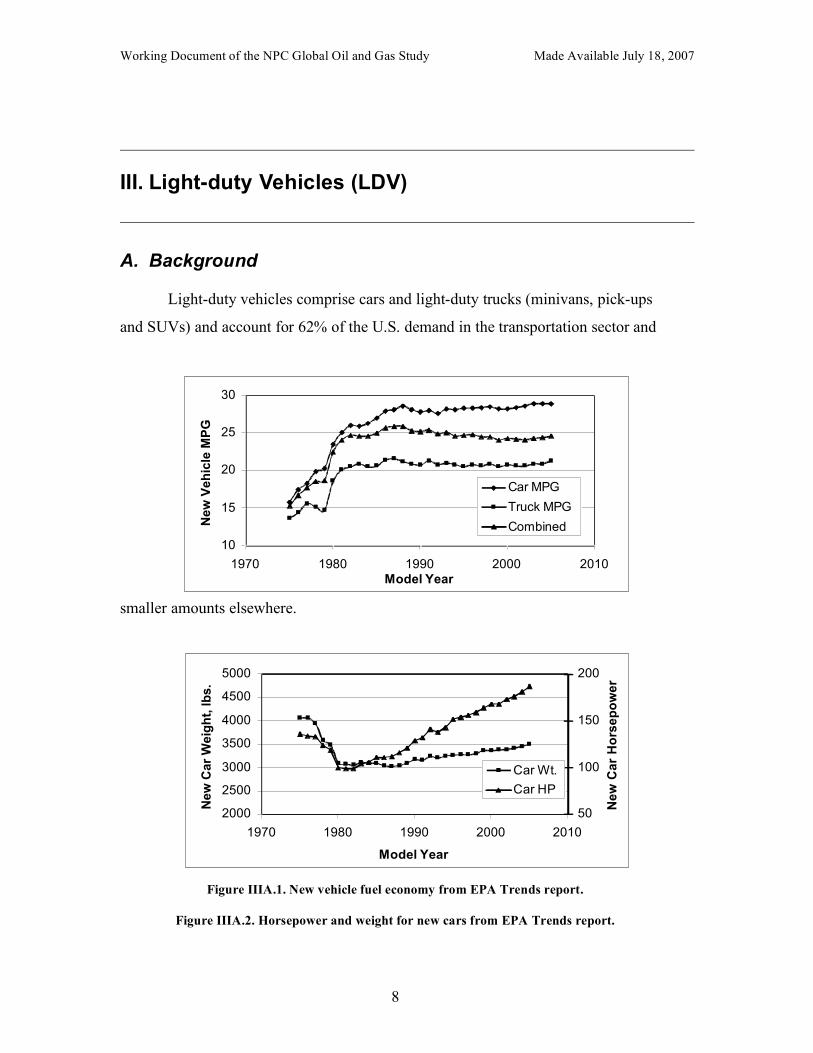
Light-duty vehicles comprise cars and light-duty trucks (minivans, pick-ups
and SUVs) and account for 62% of the U.S. demand in the transportation sector and
smaller amounts elsewhere.
Figure IIIA.1. New vehicle fuel economy from EPA Trends report.
Figure IIIA.2. Horsepower and weight for new cars from EPA Trends report.
10
15
20
25
30
1970 1980 1990 2000 2010
Model Year
New
Veh
icle
MP
G
Car MPG
Truck MPG
Combined
2000
2500
3000
3500
4000
4500
5000
1970 1980 1990 2000 2010
Model Year
New
Car
Weig
ht,
lb
s.
50
100
150
200
Ne
w C
ar
Ho
rse
po
we
r
Car Wt.
Car HP

Working Document of the NPC Global Oil and Gas Study Made Available July 18, 2007
9
The U.S. new-vehicle fuel economy has been constant for about 20 years, in line
with Corporate Average Fuel Economy (CAFE) standards. Figure IIIA.1 shows
average U.S. new-vehicle fuel economy for cars and light-duty trucks (LDTs) since
1975, and Figure IIIA.2 shows the average horsepower and weights of new cars over
the same time period. Engine and drive train efficiency improved significantly over
this period and, in response to consumer desires and expectations, many of these
gains were used to provide increased engine power and performance features while
meeting CAFE standards. The efficiency improvements were made through steps
such as advanced fuel metering, feedback emission control, better engine breathing,
and more efficient transmissions.
Growth in market share of LDTs, currently about 50% of new vehicle sales, has
also affected fleet fuel economy. Due to higher mass and greater aerodynamic drag,
these vehicles have lower average fuel economy than passenger cars.
In the U.S., new LDVs are mostly gasoline-fueled and are split evenly between
cars and LDTs. Many of the heavier LDTs are diesel-powered. In Europe, diesel
vehicles account for about half of new LDV sales. In many developing countries,
notably China and India, the fleet consists of a large percentage of relatively small
vehicles with small engines and few amenities such as air conditioning. As these
economies grow, the path of fuel economy is uncertain. The new fleet might be
larger, heavier, more powerful and with more accessories than today’s fleet, and this
will tend to lower fuel economy. Infrastructure growth and government policy will
impact fuel economy and total demand through the ability of the economy to absorb
more LDVs and through potential limitations on growth in miles traveled.
Working Document of the NPC Global Oil and Gas Study Made Available July 18, 2007
10
B. Tables of advances
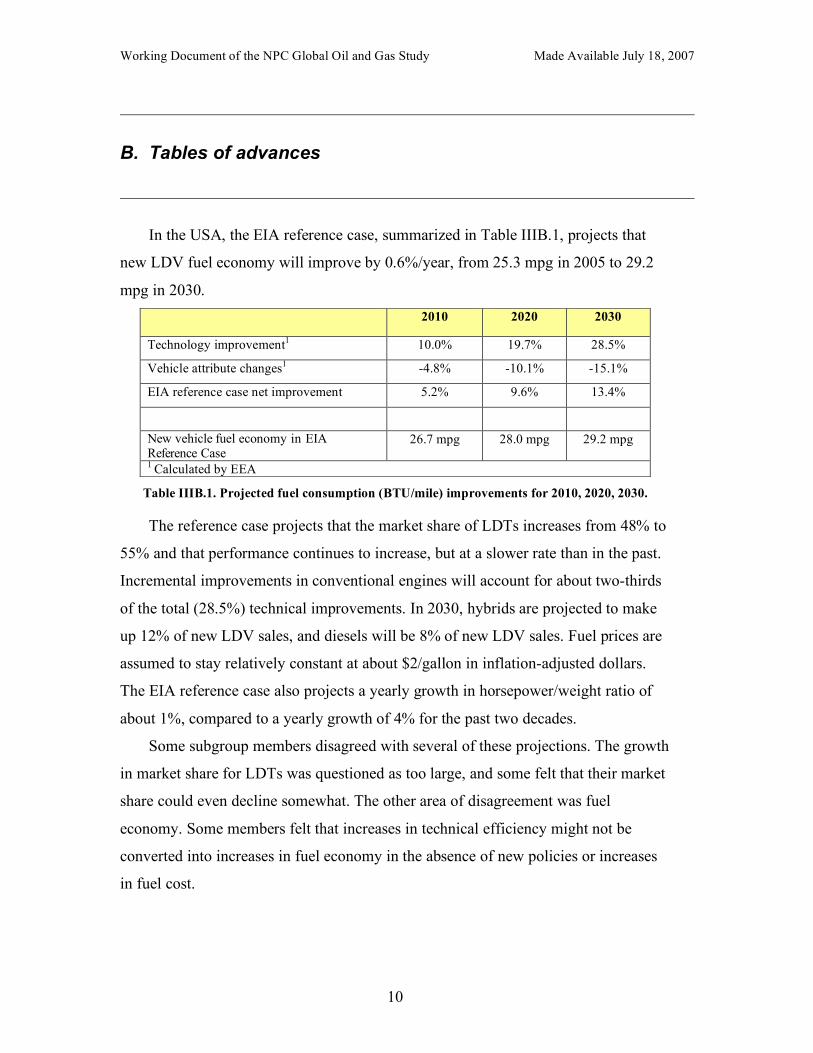
In the USA, the EIA reference case, summarized in Table IIIB.1, projects that
new LDV fuel economy will improve by 0.6%/year, from 25.3 mpg in 2005 to 29.2
mpg in 2030.
Table IIIB.1. Projected fuel consumption (BTU/mile) improvements for 2010, 2020, 2030.
The reference case projects that the market share of LDTs increases from 48% to
55% and that performance continues to increase, but at a slower rate than in the past.
Incremental improvements in conventional engines will account for about two-thirds
of the total (28.5%) technical improvements. In 2030, hybrids are projected to make
up 12% of new LDV sales, and diesels will be 8% of new LDV sales. Fuel prices are
assumed to stay relatively constant at about $2/gallon in inflation-adjusted dollars.
The EIA reference case also projects a yearly growth in horsepower/weight ratio of
about 1%, compared to a yearly growth of 4% for the past two decades.
Some subgroup members disagreed with several of these projections. The growth
in market share for LDTs was questioned as too large, and some felt that their market
share could even decline somewhat. The other area of disagreement was fuel
economy. Some members felt that increases in technical efficiency might not be
converted into increases in fuel economy in the absence of new policies or increases
in fuel cost.
2010 2020 2030
Technology improvement1 10.0% 19.7% 28.5%
Vehicle attribute changes1 -4.8% -10.1% -15.1%
EIA reference case net improvement 5.2% 9.6% 13.4%
New vehicle fuel economy in EIA Reference Case
26.7 mpg 28.0 mpg 29.2 mpg
1 Calculated by EEA

Working Document of the NPC Global Oil and Gas Study Made Available July 18, 2007
11
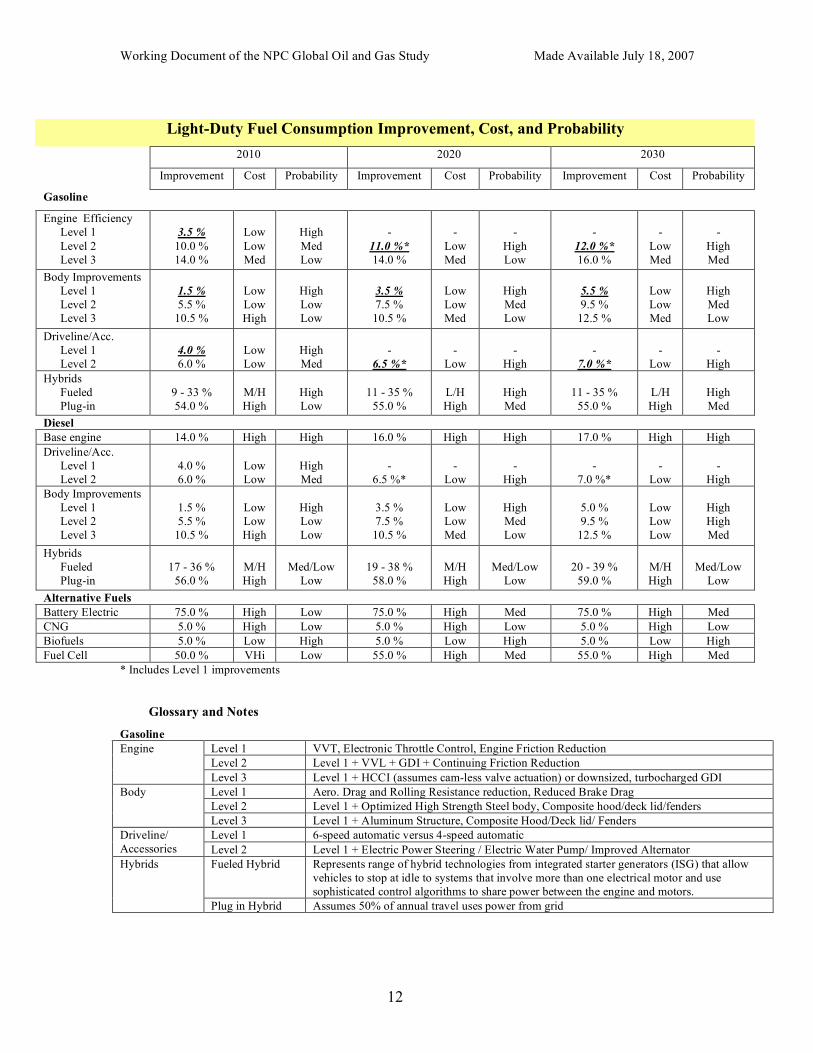
Table IIIB.2 below shows potential improvements in fuel consumption that could
be applied to LDVs. All values are relative to a typical mid-size 2005 U.S. gasoline
car. For each advance, the study estimated the improvement in fuel consumption
relative to the base vehicle, an assessment of the cost of this improvement (low,
medium or high) and the likelihood that this technology will be ready for sale in a
commercial vehicle. Reductions in vehicle size or power were not considered. Such
changes would likely be considered only in response to policy initiatives.
Some of the items listed in the table are not defined explicitly, e.g. engine
efficiency improvements. It was concluded that there will be many items available to
improve efficiency. Predicting exactly which ones would be developed and available
for application is beyond the scope of this study. Appendix 3 lists the individual items
that were identified.
It should be noted that the individual values in the table may not be additive,
because not all improvements are independent of each other. For instance,
hybridization can either be diesel or gasoline, but not both.
Based on all of these data, the study group concluded that technology exists, or is
likely to be developed, that can reduce fuel consumption of new light-duty vehicles
by 50% by 2030, at higher costs and at 2005 vehicle performance levels. Actual
technology deployment and fuel consumption benefit will depend on factors not
evaluated in this study, including vehicle and fuel costs, customer preferences, and
changing vehicle attributes. See Appendix 4 for examples of technology
combinations that might be employed to achieve 50% reduction in fuel consumption.
Working Document of the NPC Global Oil and Gas Study Made Available July 18, 2007
12
Light-Duty Fuel Consumption Improvement, Cost, and Probability 2010 2020 2030
Improvement Cost Probability Improvement Cost Probability Improvement Cost Probability
Gasoline
Engine Efficiency Level 1 Level 2 Level 3
3.5 %
10.0 % 14.0 %
Low Low Med
High Med Low
-
11.0 %* 14.0 %
-
Low Med
-
High Low
-
12.0 %* 16.0 %
-
Low Med
-
High Med
Body Improvements Level 1 Level 2 Level 3
1.5 % 5.5 %
10.5 %
Low Low High
High Low Low
3.5 % 7.5 % 10.5 %
Low Low Med
High Med Low
5.5 % 9.5 %
12.5 %
Low Low Med
High Med Low
Driveline/Acc. Level 1 Level 2
4.0 % 6.0 %
Low Low
High Med
-
6.5 %*
-
Low
-
High
-
7.0 %*
-
Low
-
High Hybrids Fueled Plug-in
9 - 33 % 54.0 %
M/H High
High Low
11 - 35 %
55.0 %
L/H High
High Med
11 - 35 %
55.0 %
L/H High
High Med
Diesel Base engine 14.0 % High High 16.0 % High High 17.0 % High High Driveline/Acc. Level 1 Level 2
4.0 % 6.0 %
Low Low
High Med
-
6.5 %*
-
Low
-
High
-
7.0 %*
-
Low
-
High Body Improvements Level 1 Level 2 Level 3
1.5 % 5.5 %
10.5 %
Low Low High
High Low Low
3.5 % 7.5 % 10.5 %
Low Low Med
High Med Low
5.0 % 9.5 %
12.5 %
Low Low Low
High High Med
Hybrids Fueled Plug-in
17 - 36 %
56.0 %
M/H High
Med/Low
Low
19 - 38 %
58.0 %
M/H High
Med/Low
Low
20 - 39 %
59.0 %
M/H High
Med/Low
Low Alternative Fuels Battery Electric 75.0 % High Low 75.0 % High Med 75.0 % High Med CNG 5.0 % High Low 5.0 % High Low 5.0 % High Low Biofuels 5.0 % Low High 5.0 % Low High 5.0 % Low High Fuel Cell 50.0 % VHi Low 55.0 % High Med 55.0 % High Med
* Includes Level 1 improvements
Glossary and Notes
Gasoline Level 1 VVT, Electronic Throttle Control, Engine Friction Reduction Level 2 Level 1 + VVL + GDI + Continuing Friction Reduction
Engine
Level 3 Level 1 + HCCI (assumes cam-less valve actuation) or downsized, turbocharged GDI Level 1 Aero. Drag and Rolling Resistance reduction, Reduced Brake Drag Level 2 Level 1 + Optimized High Strength Steel body, Composite hood/deck lid/fenders
Body
Level 3 Level 1 + Aluminum Structure, Composite Hood/Deck lid/ Fenders Level 1 6-speed automatic versus 4-speed automatic Driveline/
Accessories Level 2 Level 1 + Electric Power Steering / Electric Water Pump/ Improved Alternator Fueled Hybrid Represents range of hybrid technologies from integrated starter generators (ISG) that allow
vehicles to stop at idle to systems that involve more than one electrical motor and use sophisticated control algorithms to share power between the engine and motors.
Hybrids
Plug in Hybrid Assumes 50% of annual travel uses power from grid
Working Document of the NPC Global Oil and Gas Study Made Available July 18, 2007
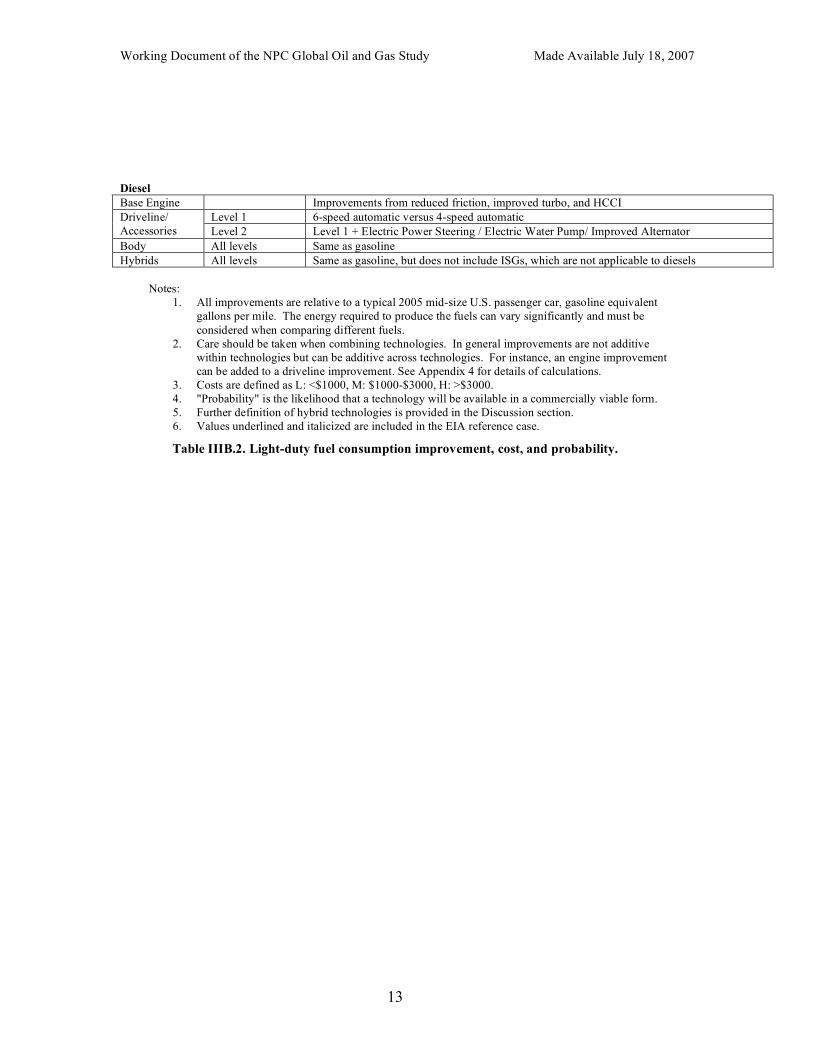
13
Diesel Base Engine Improvements from reduced friction, improved turbo, and HCCI
Level 1 6-speed automatic versus 4-speed automatic Driveline/ Accessories Level 2 Level 1 + Electric Power Steering / Electric Water Pump/ Improved Alternator Body All levels Same as gasoline Hybrids All levels Same as gasoline, but does not include ISGs, which are not applicable to diesels
Notes:
1. All improvements are relative to a typical 2005 mid-size U.S. passenger car, gasoline equivalent gallons per mile. The energy required to produce the fuels can vary significantly and must be considered when comparing different fuels.
2. Care should be taken when combining technologies. In general improvements are not additive within technologies but can be additive across technologies. For instance, an engine improvement can be added to a driveline improvement. See Appendix 4 for details of calculations.
3. Costs are defined as L: <$1000, M: $1000-$3000, H: >$3000. 4. "Probability" is the likelihood that a technology will be available in a commercially viable form. 5. Further definition of hybrid technologies is provided in the Discussion section. 6. Values underlined and italicized are included in the EIA reference case.
Table IIIB.2. Light-duty fuel consumption improvement, cost, and probability.

Working Document of the NPC Global Oil and Gas Study Made Available July 18, 2007
14
C. Discussion
Specific items from Table IIIB.2 are discussed below in order of their overall
ability to influence fuel consumption. For each item, the study group considered its
impact, steps that might be taken to increase the chance of implementation, and the
potential to advance its implementation sooner than might be possible in the base
case.
It may take up to 15 years for new technology to achieve full penetration of new
vehicle sales. As a rule of thumb, and in the absence of policy drivers, the bigger the
change, the longer it takes to penetrate new vehicle sales. Technology available
toward the end of the study period will not have a large impact on demand in 2030,
but may affect demand trends past that date.
1. Hybrids and Battery Electric Vehicles
Hybrid vehicles use batteries and an electric motor in combination with an
internal combustion engine—gasoline or diesel. Relative to today’s gasoline vehicles,
hybrids may achieve from 9% to 55% improvement in fuel consumption. Two broad
categories are considered: fueled and plug-in. In fueled hybrids, the battery is
recharged by a combination of regenerative braking and the engine. At the low end of
the efficiency and cost range is the start-stop configuration, where the engine shuts
off during stops and possibly during coasting or braking. The battery may also
contribute power during acceleration or at low speeds. Larger batteries and
sophisticated power sharing with the engine can provide more fuel savings at a higher
cost.
In a plug-in configuration, the battery is large enough to provide a significant
fraction of the total driving force and is recharged in off-hours by external power. A
major unknown is the mileage driven on battery power. In the table, a value of 50%

Working Document of the NPC Global Oil and Gas Study Made Available July 18, 2007
15
was assumed. A full analysis of plug-in hybrid technology needs to account for the
energy used in producing the electricity to recharge the battery.
Hybrid vehicles are being sold today in relatively small numbers. The type of
hybrid and market penetration cannot be predicted. Factors that could impact these
choices include higher CAFE standards, incentives, and fuel taxes. Fuel costs relative
to incremental vehicle costs can also impact the customer’s decision process.
In addition to market issues, two limiting technical factors were identified for the
application of hybrid technology. The first is battery technology, where significant
advances are needed to bring plug-in hybrids to readiness. The second limiting factor
is battery manufacturing capacity. The steps required to increase battery
manufacturing capacity should be investigated.
Battery electric vehicles are a logical progression of technology beyond plug-in
hybrids. They require batteries with higher energy density than plug-in hybrids.
Considering only the vehicle, battery vehicles have the potential to reduce energy
consumption by about 75% relative to today’s vehicles. The energy required to
produce the electricity for battery charging needs to be taken into account. As the
potential for hybrids to increase fuel consumption efficiency grows, the incremental
improvement from battery-electric vehicles is reduced. Technical challenges for
battery-electric vehicles include higher energy density, greater driving range, and
faster recharge rates.
2. Diesels
Diesel engines for LDVs are available today in large quantities in Europe, and
they have a fuel consumption benefit of up to 17% (gasoline equivalent energy)
relative to a gasoline powered vehicle. Diesel engines cost more to produce than their
gasoline counterparts. Their popularity in Europe is a result of high fuel costs,
government tax incentives, and aggressive fuel consumption targets. Diesel vehicles
are also able to meet current European emission standards, which are less stringent
than U.S. standards.

Working Document of the NPC Global Oil and Gas Study Made Available July 18, 2007
16
Further development is required to achieve U.S. Tier 2 emission standards,
especially for the lower emission bins. At least initially, it is likely that the fuel
consumption benefit of LDV diesel engines may be negatively impacted by the need
to meet Tier 2 exhaust emission standards. The data in Table IIIB.2 are based on this
debit disappearing over time. Future emission standards may also impact the potential
fuel-consumption benefit of diesels. Diesels may also be hybridized, with associated
reductions in fuel consumption. The lowest level of hybridization, integrated starter-
generators, is not expected to be applied to diesels.
If diesel-engine penetration grows, fuel properties such as cetane may have to be
adjusted for these vehicles. Refinery investments may also be required to match the
shifting gasoline/diesel demand ratio. Introduction of LDV diesel engines can be
encouraged through additional research on exhaust emission control, and through
government policies promoting fuel economy.
Improvements to gasoline-engine technology may reduce the fuel consumption
differences between gasoline and diesel engines. One improvement being
implemented for gasoline engines, direct injection, has already been applied to
diesels. Other steps, such as improved transmissions and aerodynamics are common
to both. More stringent emission standards would likely have a larger impact on
diesels than on gasoline engines.
3. HCCI (Homogeneous Charge Compression Ignition)
HCCI technology is at an early stage of development for gasoline and diesel
applications. For diesel, HCCI may reduce emissions but will probably not reduce
fuel consumption. Gasoline HCCI has the potential for low engine-out emissions and
a reduction in fuel consumption by up to 16%. Since this is a compression ignition
engine, some of the advances in drive-train efficiency are not relevant. A major
technical hurdle for HCCI is to maintain stable and complete combustion over the
entire operating envelope. Significant progress has been made to date, but HCCI is
not likely to be available until near the end of the study period.

Working Document of the NPC Global Oil and Gas Study Made Available July 18, 2007
17
HCCI engines will probably benefit from a fuel with different properties than
today’s gasoline. The fuel might have a low octane number, different volatility
characteristics, and might require a new specification for combustion properties. It
might be possible to advance HCCI technology by additional research, either
privately or government funded. Fundamental issues that require study include
combustion control and fuel properties matched to the engine.
4. Fuel cells
Fuel cells have the potential to halve LDV fuel consumption relative to the base
gasoline LDV, on an energy equivalent basis. This estimate includes only tank-to-
wheels effects, and does not consider the energy required to make the fuels (gasoline
or hydrogen). Fuel-cell powered vehicles are available today in small numbers only in
demonstration programs and are not likely to be ready for large commercial
application until well into the study period. Significant scientific and technical
advances as well as cost reductions will be required in order to bring fuel cells to
readiness. Hydrogen storage on-board the vehicle is a major technical question. High-
pressure storage has weight, cost, and safety issues that need to be further addressed.
Other storage ideas, such as metal hydrides, are not feasible at this time. On-board
production of hydrogen by reforming petroleum fuels is also far from ready.
In addition to vehicle technology, there are major infrastructure issues
concerning the supply of hydrogen. Hydrogen can be made at central stations and
shipped through specialized pipelines or in trucks. It may also be made in a
decentralized fashion at service stations. An economic process for manufacturing
hydrogen is also not fully developed. It can be made by electrolysis of water, or by
reforming a hydrocarbon such as natural gas or petroleum.
The main areas requiring additional research are:
• On-board hydrogen storage
• Reducing fuel cell cost, improving durability
• Cold start, system optimization
• Hydrogen infrastructure.
Working Document of the NPC Global Oil and Gas Study Made Available July 18, 2007
18
5. Alternative Fuels
Biofuels such as ethanol are available today and can be used without vehicle
modification, when blended in small quantities into gasoline (≤10%). Use of higher
concentrations of biofuels, such as E85 (85% ethanol), requires changes in fuel-
system materials and fuel metering. Use of E85 also requires changes to materials in
the fuel distribution system. The technology changes are well known and the major
barrier to large increases in ethanol use is the availability of suitable land and water.
Development of low cost cellulosic ethanol, a significantly more difficult and costly
process, could change the supply outlook.
Technology to use compressed natural gas (CNG) is also well known, and CNG
is used widely in other countries such as Argentina. On-board fuel storage requires
high-pressure tanks that add weight and take up significant volume. Fuel systems
must be designed to deal with high pressure and to meter gases instead of liquids. The
major barriers to large increases in CNG use are high cost, poor vehicle range, and
alternative uses for CNG (e.g. power generation).
LDVs built for the exclusive use of alternative fuels such as E100 or CNG may
achieve a modest decrease in energy use of about 5% through higher compression
ratios. Both ethanol and CNG use can be increased through government incentives or
mandates. If significant volumes of either alternative are used, the impact will be
reduced demand for LDV petroleum fuel.
6. Potential Negative Impacts on Fuel Consumption
A number of factors could have a negative impact on fuel consumption,
including:
• More stringent emission regulations, especially for diesel engines
• Safety regulations that add vehicle weight
• Heavier, more powerful vehicles
• Shift from cars to LDTs.
In developing countries, as discussed earlier, economic factors may contribute to
a shift to larger, more powerful, and less efficient light-duty vehicles.

Working Document of the NPC Global Oil and Gas Study Made Available July 18, 2007
19
7. Potential Policy Options to Reduce Fuel Consumption
Potential policy initiatives to reduce LDV fuel consumption include:
• Fuel economy standards
• Fuel taxes
• Incentives to buy fuel efficient vehicles, penalties for inefficient vehicles
• Incentives and mandates that increase use of mass transit and carpooling
• Government funding of additional research on new technologies, including
alternative fuels.
IV. Heavy-duty Vehicles (HDV)
A. Background
EIA estimates that energy demand for heavy-duty vehicles constitutes
approximately 20% of total transportation energy consumption in the USA. Overall
fuel consumption from HDVs is projected to rise by 1.8% per year over the forecast
period (2005-2030), along with a total ton-mile growth of about 2.3% per year. EIA
projects approximately 0.5% per year improvement in U.S. freight truck fuel
economy, from 6 to 6.8 miles per gallon.
In the near term, U.S. regulatory requirements for reduced NOx and particulate
matter emissions from the heavy-duty sector will compete with technological
improvements in fuel consumption, since after-treatment devices and combustion
strategies will consume some energy. Therefore, most believe that fuel consumption
will remain flat or even increase slightly in the short term, improving again in the
2015-2030 period.
B. Tables of advances
The fuel consumption improvements included in the EIA projections relative to
2005 are shown in the last line of Table IVB.1 for 2010, 2020, and 2030. Negative

Working Document of the NPC Global Oil and Gas Study Made Available July 18, 2007
20
numbers indicate an increase in energy consumption per ton-mile traveled, positive
numbers indicate a decrease.
Table IVB.1. Projected fuel-consumption improvements relative to 2005.
Table IVB.2, below, lists technological and operational improvements with the
potential to reduce fuel consumption in the heavy-duty sector. The analysis was
conducted by EEA and was based on work by DOE and results of interviews with
heavy-duty engine manufacturers. The data in the table are primarily applicable to the
Class 8 category of trucks (a.k.a., heavy heavy-duty), but most technologies can also
be applied to the medium heavy-duty classification (e.g. delivery trucks). Where
differences between the two classifications exist, these are noted in the Discussion
Section. Underlined and italicized fuel consumption improvements in the table
identify the technologies that could be adopted to achieve the projected improvements
in fuel consumption in the EIA reference case. In analyzing the EIA reference case,
EEA concluded that the difference between technology improvements and the EIA
reference data resulted from operational factors such as increased traffic congestion
which negatively affects fuel consumption, as shown in Table IVB.2.
2010 2020 2030
Technology Improvements1 +1% +9.5% +18%
Operational Factors1 -1% -3.2% -6.2%
EIA Reference Case 0% +6.3% +11.8% 1 Estimated by EEA

Working Document of the NPC Global Oil and Gas Study Made Available July 18, 2007
21
Table IVB.2 Heavy-duty fuel consumption improvement, cost, and probability (Class 8 truck).
Heavy-Duty Fuel Consumption Improvement, Cost, and Probability (Class 8 Truck)
2010 2020 2030
Technology Improvement Cost Probability Improvement Cost Probability Improvement Cost Probability
Engine Efficiency
- Level 1
- Level 2
- Level 3
-4%
+2%
+13%
N/A
Med
High
High
Med
Low
+4%
+7%
+14%
Low
Med
High
High
Med
Low
+6%
+9%
+18%
Low
Med
High
High
Med
Low
Rolling Resistance +2% Low High +4% Low High +6% Low High
Aerodynamics
- Level 1
- Level 2
+3%
+5%
Low
Med
High
Med
+6%
+10%
Low
Med
High
Med
+6%
+10%
Low
Med
High
Med
Elec. Accessories
- Level 1
- Level 2
+2%
-
Low
-
High
-
+3%
+5%
Low
Med
High
Med
+3%
+5%
Low
Med
High
Med
Mild Hybrid +8% High Low +10% Med Low +10% Med Low
Full Hybrid +15% High Low +20% High Low +20% High Low
Reduced idling +5% Low High +5% Low High +5% Low High
Engine Efficiency Level 1: Combustion improvements, advanced injection, turbo charging, emissions control
Engine Efficiency Level 2: Friction reduction, electric water and oil pumps
Engine Efficiency Level 3: Turbo compounding, electric turbo
Aerodynamics Level 1: Air deflectors, wheel covers
Aerodynamics Level 2: Trailer and tractor integration
Electric Accessories Level 1: Electric power steering, power accessories
Electric Accessories Level 2: Electric cooling fans
Cost: Low < $2000; Medium < $6000; High >$6000
Probability: Likelihood that technology will be available in a commercially viable form
Values underlined and italicized are technologies that are likely to be adopted to achieve the EIA Reference case.

Working Document of the NPC Global Oil and Gas Study Made Available July 18, 2007
22
C. Discussion
Opportunities for technology retrofits or operational changes have the potential
to impact the entire fleet and could have a greater immediate impact on fuel demand
than even quite large efficiency improvements in new engine platforms affecting only
the new vehicles entering the fleet.
1. Emissions Reductions/Engine Efficiency
New U.S. heavy-duty emission standards for NOx and particulate matter are
likely to have a negative impact on fuel consumption of diesel engine systems, at
least in the near term. Other factors being constant, an increase of fuel consumption
of 2 to 5% would not be unexpected. DOE is attempting to address this in the 21st
Century Truck Program, a research partnership between the DOE, DOD (Army),
EPA, DOT, and truck engine builders. This program addresses diesel engine
efficiency, aerodynamic drag reduction, auxiliary loads reduction, and drive train
improvements.
Additional R&D directed specifically at the issue of engine efficiency/emission
trade-offs could provide benefits in the short-term. Although not part of the current
DOE program, efforts to address potential fuel/engine optimization or fuel-enabling
strategies could advance cost-effective deployment of the engine technology options
sooner.
Alternative fuels, such as biofuels, may also play a role in the relationship
between emissions control and engine efficiency. Although biofuel use would not
directly result in a fuel consumption improvement, research to understand the fuel-
engine interaction of diesel biofuel combustion characteristics could result in
identification of new, effective “system” strategies.
The use of biodiesel or any other non-petroleum fuel for the heavy-duty sector
displaces demand for petroleum-based diesel. The significance of this displacement
depends on the available supply of biodiesel. This issue is being assessed by the
Supply Team.

Working Document of the NPC Global Oil and Gas Study Made Available July 18, 2007
23
2. Reduced Idling, Other Operational Improvements
Reduced idling and use of external power to operate vehicle systems while the
vehicle is not in transit offer the greatest potential to impact a broad portion of the
fleet in the short-term. A potential fuel consumption improvement of 5% in the USA
could be achieved if applied across the entire fleet. The technology is currently
available and deployed in limited application where the economics are favorable or
local idling restrictions exist. A possible method to encourage broader deployment
across the heavy-duty fleet would be through incentives or mandates.
Another example of an operational improvement is better scheduling, for
example reduced empty backhauling. These improvements are presently driven by the
business case for such efforts and the potential cost-saving dynamics associated with
individual trucking companies.
3. Aerodynamics and Rolling Resistance
Simple aerodynamic improvements (Level 1) and rolling resistance
improvements are considered in the EIA reference case. Both items are low-cost and
high-probability technologies that will likely be deployed due to their economic
payback. Level 2 aerodynamic technologies, involving physical integration of the
tractor and trailer, have a potential fuel consumption benefit for Class 8 trucks.
Deployment may be application-specific, and the financial incentive of this
technology in reducing fuel costs is probably adequate to bring it to
commercialization.
4. Hybridization
Unlike the light-duty vehicle sector, the fuel-consumption improvement, cost,
and probability basis for deployment of hybrid technology for heavy-duty application
is not as clear cut. Although hybridization has a potential fuel-consumption benefit of
10 to 20%, achieving these fuel savings in practice may be a challenge for the U.S.
Class 8 trucks. Long-haul trucks require power trains that provide adequate power for
long-duration, high-speed, high-load conditions, resulting in limited opportunity for

Working Document of the NPC Global Oil and Gas Study Made Available July 18, 2007
24
engine downsizing. The most promising applications for hybridization are medium-
duty delivery trucks or local transit buses. These vehicles encounter a high frequency
of start-stop conditions in which hybrid technologies provide the most fuel
consumption benefits, through engine on-off cycling, engine downsizing and
regenerative braking. The evolution of hybrid technology for heavy-duty application
would leverage off the development in the light-duty sector. Therefore, deployment
of hybrid technology does not appear to be limited by technological hurdles unique to
this sector.
5. Potential Negative Impacts on Fuel Consumption
The most significant negative impact on fuel consumption in the heavy-duty
sector is the near-term U.S. emission regulations for NOx and particulate matter that
will affect the 2007–2010 product offerings. The need for higher-power engines or
additional truck-safety or convenience devices is expected to have a secondary impact
on fuel consumption.
6. Potential Policy Options to Reduce Fuel Consumption
Potential policy options to reduce fuel consumption from the HDV sector
include:
• Reduced idling
• Fuel taxes or incentives (e.g. alternative fuels)
• Vehicle system-efficiency requirements (tractor plus trailer together)
• Policies that provide incentives for shifts from heavy-duty freight to marine
or rail freight, if more fuel efficient
• Reducing Class 8 operations in stop-and-go traffic
• Long-term government research and demonstration on promising,
breakthrough technologies to help address heavy-duty manufacturers’ R&D
shortfall during low revenue periods brought on by pre-buy/no-buy cycles
(condition in which buyers purchase engines immediately prior to new
emission standards for lower cost and higher fuel economy and do not buy
after emission standards takes effect).

Working Document of the NPC Global Oil and Gas Study Made Available July 18, 2007
25
V. Air Transport
A. Background
IEA estimates the 2005 world-wide demand for air transport as 12% of the total
transportation sector. Future projections of growth rate from Boeing and Airbus show
a world-wide annual demand growth rate of 5 to 6% (seat-miles/year) out to 2030,
whereas IEA projects a much lower growth rate of 2% per year. At a recent
Commercial Aviation Alternative Fuels Initiative meeting, participants suggested that
worldwide travel rates would increase by 3.8% per year. In the USA, the EIA projects
a growth rate of 1.9% per year.
Efficiency of air transport (seat-miles/gallon) is projected to improve by about
1.2% per year on average, which is substantially less than the 2% per year
improvements achieved from 1970-1990.
B. Tables of advances
The EIA reference case fuel consumption improvements for 2010, 2020, and
2030 are shown in Table VB.1. Table VB.2 lists fuel consumption improvement
opportunities.
Table VB.1. EIA reference case fuel consumption (BTU/seat-mile) improvements for 2010, 2020,
2030.
2010 2020 2030
EIA Reference Case 4.4% 16.6% 25.8%

Working Document of the NPC Global Oil and Gas Study Made Available July 18, 2007
26
Air Transportation Fuel Consumption Improvements, Cost, and Probability
2010* 2020 2030
Improvement Cost Probability Improvement Cost Probability Improvement Cost Probability
Wide-body
- Engine Imprv.
- Composites
- Aerodynamics
4%
4%
3%
Low
Med
Low
High
High
High
10%
5%
3%
Med
High
Low
High
High
High
10%
5%
4%
Med
High
Low
High
High
High
Existing Aircraft
- Engine Retrofit
3%
Low
Med
6%
Low
Med
9%
Low
Med
Operations
- Optimal Routes
1%
Low
Med
3%
Low
Med
5%
Low
Med
Narrow Body
- Engine Imprv.
- Composites
- Aerodynamics
4%
0%
0%
Low
-
-
High
-
-
10%
4%
3%
Low
Med
Low
High
High
High
10%
6%
4%
Low
Med
Low
High
High
High
Existing Aircraft
- Engine Retrofit
- Winglets
3%
3%
Low
Low
High
Med
5%
3%
Low
Low
Med
Med
8%
3%
Low
Low
High
Med
Operations
- one-engine taxi;
faster climb
1%
NA
Med
3%
NA
Med
5%
NA
Med
Cost: Low =$0.5-$1.0B; Med= $1.0-$2.0B; High= greater than $2.0B *2010 information and data based on 2006 to 2010 time period Underlined and italicized improvements indicate activities required to meet EIA reference case NA: not available Probability: Likelihood that technology will be available in a commercially viable form
Table VB.2. Air transportation fuel-consumption improvements, cost, and probability.
C. Discussion
The air sector differs from the others since virtually all of the fuel consumption
improvements in Table VB.2 are required to achieve the EIA reference case.
Additional breakthrough technologies or cross-sector shifts of passenger travel to
more efficient modes will be required if fuel consumption improvements beyond the
reference case are to be achieved.

Working Document of the NPC Global Oil and Gas Study Made Available July 18, 2007
27
1. Existing Efficiency Programs
Many of the technologies or operational improvements in Table VB.2 are already
being planned or deployed. For example, Boeing and others are developing next-
generation wide-body, fuel-efficient aircraft for deployment in 2010. Routing is
continually being optimized, and single-engine taxiing is in use at some locations.
Research in weight reductions through advanced materials and composites needs to
continue, since this technology has broad application to other transport sectors.
2. New and Breakthrough Research
In order to provide opportunity for new discoveries and to fill the early stage of
the technology pipeline with new ideas, the airline industry could benefit from new or
expanded cooperative programs with government support. NASA had conducted
research and development demonstration programs in the 1970s through 1990s, but
these research and development demonstration programs no longer exist. In contrast,
Europe currently has such an air transportation efficiency program, Euro-Vision
2020. In the fuels area, the DOD is pursuing coal-based synthetic fuels. The U.S. Air
Force has a goal to meet 50% of their fuel needs with synthetic fuel by 2015, about
5% of the U.S. air sector demand. Research in understanding the combustion
characteristics of new fuels also has the potential to balance the emissions (NOx and
particulate) versus efficiency trade-off.
3. Potential Negative Impacts on Fuel Consumption
Several factors may negatively impact the ability to achieve all of the fuel
consumption improvements identified in the above technology table.
Air Congestion—The projected increase in air traffic will undoubtedly result in
increased air-space congestion, with operational disruptions resulting in lower
efficiencies.
Aircraft Noise Reduction—Efforts to decrease noise generation from aircraft
negatively impact fuel consumption as modifications are made to aircraft engines, or
air-routing logistics are optimized for noise reductions versus fuel efficiency.

Working Document of the NPC Global Oil and Gas Study Made Available July 18, 2007
28
Emissions Reduction—NOx and particulate-matter control is managed on aircraft
engines in a similar manner as for heavy-duty diesels, via combustion modifications
or mechanical changes that have a negative impact on fuel consumption.
Regional vs. Long-Distance Routing—Increasing numbers of regional carriers
and “air taxis” have a negative impact on fuel consumption.
4. Potential Policy Options to Reduce Fuel Consumption
The following are potential policies for consideration in the air sector:
• Increased government-funded research for breakthrough technologies
• Incentives and infrastructure improvements to encourage greater passenger
use of the rail sector, e.g. Northeast rail corridor
• Incentives or mandates for operational fuel-consumption improvements
• Promotion of increased alternative-fuels research and demonstration
activities.
VI. Marine Transport
A. Background
In 2005, world-wide marine transport was estimated by IEA to consume ~9% of
the total transportation energy demand. EIA indicates that, in the USA, marine fuel
represents about 4% of the 2005 transportation fuel use. EIA projects U.S. marine
transport demand increasing 0.2% per year.
Others have estimated that marine energy fuel demand is significantly higher
(e.g. 15%, estimated by Eyring). Different approaches of building marine energy
demand and different bunker-fuel accounting methods used by individual countries
are the likely cause for this variation in energy demand estimates.

Working Document of the NPC Global Oil and Gas Study Made Available July 18, 2007
29
B. Tables of advances
EIA projects that the U.S. inland waterway marine freight-fuel consumption is
expected to improve by 0.2% per year. The technologies by which these
improvements are achieved are not clearly identified in the EIA reference case. A
0.2% per year improvement would result in the fuel consumption improvements
shown in Table VIB.1. Table VIB.2 lists the potential technologies and operational
improvements that could reduce fuel consumption. In the near-term, focus on NOx
and particulate-matter control may degrade fuel-consumption improvements.
Table VIB.1. EIA reference case fuel consumption improvements relative to 2005.
Table VIB.2 Marine transportation fuel-consumption improvements, cost, and probability.
2010 2020 2030
EIA Reference Case 0.8% 2.8% 4.9%
Marine Transportation Fuel-Consumption Improvements, Cost, and Probability
2010 2020 2030
Technology Improvement Cost Probability Improvement Cost Probability Improvement Cost Probability
Engine Efficiency
- Combustion impr.
- Fuel Cell Systems
2-5%
0-10%
Med
High
Med
Low
2-5%
0-10%
Med
High
High
Low
2-5%
0-10%
Med
High
High
Low
Hull Design 5% (20%) Low Med 5% (20%) Low Med 5% (20%) Low Med
Propeller Design 5% (10%) Low Med 5% (10%) Low Med 5% (10%) Low Med
Hull Maintenance 5% Low High 5% Low High 5% Low High
Propeller
Maintenance/retrofit
3% (8% ) Low Med 3% (8%) Low Med 3% (8%) Low High
Operational
Improvements
5% (40%) Low-
Med
Med 5% (40%) Low-
Med
Med 5% (40%) Low-
Med
Med
Improvement: Numbers in parenthesis are high end of MARINTEK report and likely approach theoretical maximum Cost: Low = 1% of New vessel; Medium = 1-5% of new vessel; High= 5% of New vessel Probability: Likelihood that technology will be available in a commercially viable form Italicized and Underlined improvement percentages represent technologies that could be applied to meet the EIA reference case projections. Table developed from data in MARINTEK, Carnegie Mellon, and Corbett.

Working Document of the NPC Global Oil and Gas Study Made Available July 18, 2007
30
C. Discussion
In general, future marine energy demand will more than offset the fuel-
consumption improvements contained in the EIA reference case. Given the relatively
low vessel-replacement rate (greater than 20-year lifetime), the most effective options
for efficiency improvements in the short term are through actions affecting the
existing fleet, with vessel replacement having a potential significant impact in the
long-term.
1. Operational Improvements
MARINTEK identified several operational measures which have significant
efficiency improvement potential, and many of these are in practice today. Since fuel
consumption increases proportionately with the square of speed, “slow steaming” or
“just in time” delivery strategies can be effective. Another operational strategy for
reduced fuel consumption would be leveraging economies of scale through the use of
larger ships. Although not specifically identified in MARINTEK, this is currently
being practiced (e.g. shipments of LNG and other bulk shipping applications). These
operational changes may have a 5 to 10% benefit.
2. New Hull and Propeller Designs
Due to dimensional limitations of canals and harbors, the ability to dramatically
redesign hulls is limited, but fuel-consumption improvements of 5 to 20% are
possible; with the lower number being the most likely achievable over a broad set of
designs. Hull improvements will be adopted most quickly by larger ships since hull
design is a fixed cost ranging from $50K to $200K.
Improvement in propeller design for new ships is also a potential source of fuel-
consumption improvement. Examples of propeller designs to improve efficiency
include low RPM and increased diameter blades, coaxial contrarotating propellers,
and ducted propellers.

Working Document of the NPC Global Oil and Gas Study Made Available July 18, 2007
31
3. Engine Efficiency Improvements
Two major categories exist for reducing fuel consumption of the marine power-
generation system. The first is an improvement in the fuel combustion efficiency on
the vessel. Improvements of an additional 3 to 5% (relative) may be possible with
newer engines and emissions control systems. A move from bunker fuel to a cleaner
fuel (e.g. distillate) could also enable a systems approach to designing incrementally
more efficient propulsion systems.
The second engine efficiency improvement category is the replacement of the
diesel-based power systems with a more efficient power source. Fuel cells are being
considered for naval applications, and the technology could migrate to commercial
shipping applications. Fuel consumption for fuel cells could be 10% less than that for
diesel engines, but high costs and issues around sources of hydrogen for fuel cells
remain as significant barriers.
4. Hull and Propeller Maintenance and Retrofit
For existing ships, improvements in hull maintenance and coatings can save
power demand by reducing roughness (viscous resistance). The potential for saving is
~5%. Also, pre- and post-swirl and flow-smoothing devices can reduce fuel use by
~3%.
5. Potential Negative Impacts on Fuel Consumption
The current focus on NOx and particulate-matter emissions from marine engines
will likely consume potential benefits of technologies for combustion efficiency in
the near term.
Secondly, the number of new ships entering the fleet is small. Therefore, new
technologies, such as reduced-friction hulls or significantly improved engine designs,
will not have a major impact during the early portion of the time period. Operational
changes and retrofits of existing ships offer the greatest efficiency options in the near
term, and each of these is in the modest range of 5% improvement.
Working Document of the NPC Global Oil and Gas Study Made Available July 18, 2007
32
6. Potential Policy Options to Reduce Fuel Consumption
Potential policies or incentives that may impact marine fuel consumption:
• Proactive support by local and federal authorities for deepening of harbor
channels to accommodate larger ships
• Encouragement of research collaboration between the government and
industry on marine efficiency technologies and designs
• Transfer of learnings from the naval community to commercial carriers and
power-train builders via government-sponsored forums.
VII. Rail Transport
A. Background
Railroads account for approximately 3% of total worldwide transportation energy
demand. IEA projects that worldwide rail-fuel demand will grow at roughly 3%/year
and for the USA, EIA projects growth of 1.6% per year. The relative portion of
freight versus passenger use varies by region. Freight use dominates in the USA,
Latin America, Africa, China and Australia. In Europe, passenger demand is about
equal to freight demand, and in India it is larger by a factor of two.
Most rail transport consists of diesel engines powering generators that in turn
power electric motors connected to the wheels. A relatively small fraction of rail
service is run by direct electric power. In Europe, approximately 30% of the total rail
network is electrified. In the USA, the only area of significant electrification is the
high density Boston-New York-Washington corridor. Electric service is twice as
efficient on average versus diesel power on a tank-to-rails basis, although the
advantage is less when the energy used to produce and distribute the electricity is
taken into account. It is generally employed only in high density areas since it
requires large capital investments for electrical generation and distribution.
Working Document of the NPC Global Oil and Gas Study Made Available July 18, 2007
33
The market for new railroad locomotives is relatively small—approximately
1,000 new engines per year in the USA—and the average useful life for engines can
be 30 years or more. These two factors make it very challenging for OEMs to support
an extensive, privately funded research program and imply that that new technology
can have only a small impact on total fuel demand in the short term.
B. Tables of advances
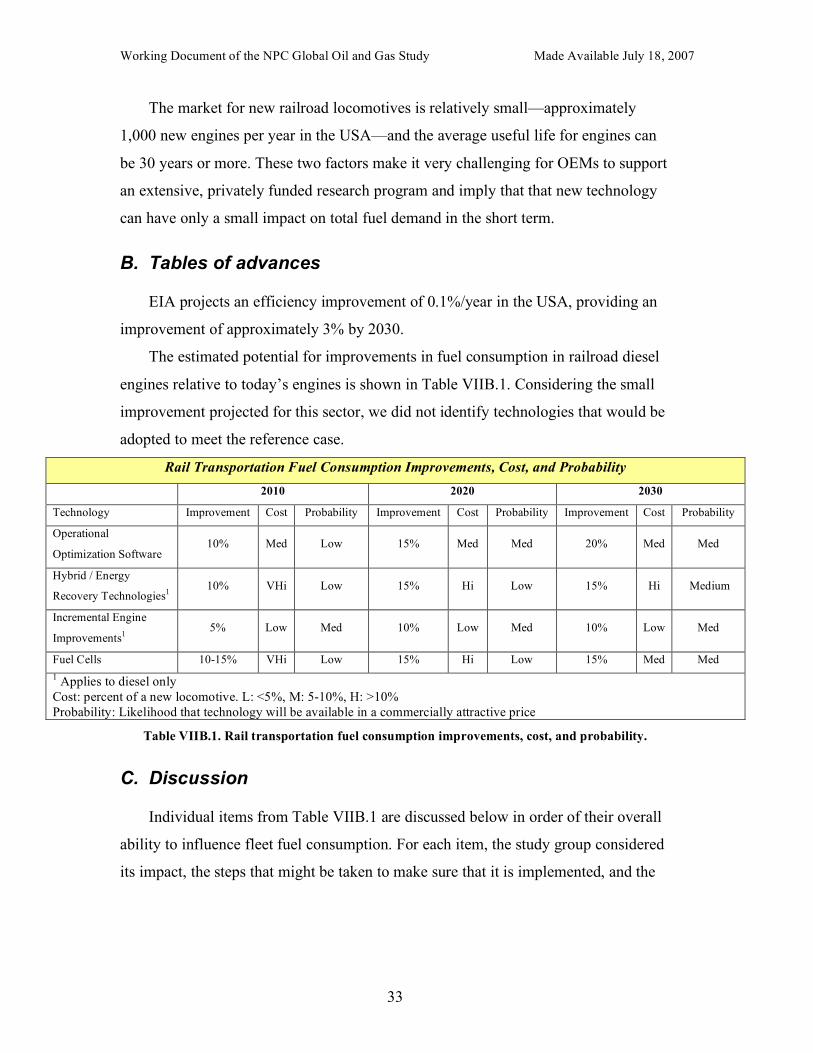
EIA projects an efficiency improvement of 0.1%/year in the USA, providing an
improvement of approximately 3% by 2030.
The estimated potential for improvements in fuel consumption in railroad diesel
engines relative to today’s engines is shown in Table VIIB.1. Considering the small
improvement projected for this sector, we did not identify technologies that would be
adopted to meet the reference case.
Table VIIB.1. Rail transportation fuel consumption improvements, cost, and probability.
C. Discussion
Individual items from Table VIIB.1 are discussed below in order of their overall
ability to influence fleet fuel consumption. For each item, the study group considered
its impact, the steps that might be taken to make sure that it is implemented, and the
Rail Transportation Fuel Consumption Improvements, Cost, and Probability 2010 2020 2030
Technology Improvement Cost Probability Improvement Cost Probability Improvement Cost Probability
Operational
Optimization Software 10% Med Low 15% Med Med 20% Med Med
Hybrid / Energy
Recovery Technologies1 10% VHi Low 15% Hi Low 15% Hi Medium
Incremental Engine
Improvements1 5% Low Med 10% Low Med 10% Low Med
Fuel Cells 10-15% VHi Low 15% Hi Low 15% Med Med 1 Applies to diesel only Cost: percent of a new locomotive. L: <5%, M: 5-10%, H: >10% Probability: Likelihood that technology will be available in a commercially attractive price

Working Document of the NPC Global Oil and Gas Study Made Available July 18, 2007
34
potential to advance its implementation sooner than might be possible in the base
case.
1. Operational Changes
Changes in railroad fleet operation and control have the potential to reduce
energy use by up to 20%. Steps include implementation of new software and control
algorithms to optimize the energy management of the train by applying decision-
making algorithms to train make-up, scheduling, routing, and track use.
This approach can be adopted relatively rapidly if the implementation is limited
to software and minor hardware changes. The potential reduction in total demand is
greater than with new locomotive technologies, which, although they may have a
large fuel consumption improvement, may take many years to be incorporated into
the fleet. Implementation of this technology requires coordination among the
railroads. A good model for coordination is U.S. air traffic control, which operates as
a single national system. Converting to this type of operation would require the
government to play a significant role. Significant engineering development would
also be required to identify potential safety issues, bottlenecks, and pinch points that
could negatively impact system fuel consumption.
2. Hybridization and Energy Recovery
Trains use considerable amounts of braking energy, which may be captured and
redeployed by hybrid systems to decrease fuel consumption by up to 10% on long-
haul freight locomotives and up to 15% on passenger locomotives. The major
technical hurdle is a suitable storage device and associated control systems. Since the
cycle time between braking and acceleration is much longer in trains than in LDVs,
the energy storage would have to be much larger for locomotive hybrids. Options
include batteries, capacitors, and flywheels, with batteries having the shortest
implementation time horizon. Due to the size, operating requirements, and
environmental conditions under which locomotives operate, batteries will need to be
dramatically different than those that are being used or are being considered for use in
LDV or HDV applications.

Working Document of the NPC Global Oil and Gas Study Made Available July 18, 2007
35
Hybrid locomotive technology is not likely to be commercially viable for at least
ten years. The small size of the market makes it difficult to justify significant research
in locomotive hybrid applications. Substantial government funding would be
necessary to accelerate the availability of this technology.
Another potential source of energy recovery is the low-grade heat that is lost in
the diesel cycle. Up to 60% of the fuel’s available energy is released as heat in the
exhaust or through the radiator. The opportunity for reducing fuel consumption an
additional 5 to10% exists by recovering energy from this low-grade heat.
3. Fuel Cells
Fuel cells may improve fuel consumption by 15% relative to diesels when
considered on a tank-to-rails basis. Development and deployment of fuel cells for
locomotives will probably lag behind LDV and HDV applications, primarily because
of the slow pace of introduction of new locomotive models. There are no fundamental
barriers and fuels cells for LDVs should scale up to locomotive use as long as the
technology selected for LDVs is consistent with the locomotive application.
4. Engine Improvements
Improvements in engine technology (combustion chambers and fuel delivery
systems) have the potential to reduce fuel consumption by 5 to 10%. Most of these
are evolutionary improvements and will be adopted when new models are introduced.
Additional government research funding would advance the pace of development and
introduction of these improvements.
Future emission regulations have the potential to counteract advances in engine
efficiency, or even reduce efficiency relative to today’s engines. Significant
investment in research will be required to reverse this negative efficiency trend.
5. Potential Policy Options to Reduce Fuel Consumption
Potential policy initiatives to reduce rail fuel consumption include:
• Incentives or mandates to operators to switch from diesels to electric trains

Working Document of the NPC Global Oil and Gas Study Made Available July 18, 2007
36
• Incentives or mandates to switch freight traffic to rail transport from other
less efficient transport modes
• Incentives or mandates to switch transportation of people to rail transport
from other less efficient transport modes
• Incentives or mandates for fuel consumption improvements.

Working Document of the NPC Global Oil and Gas Study Made Available July 18, 2007
37
VIII. Appendix 1: Transportation Efficiency Subgroup
Subgroup Members: John Amdall Caterpillar Alicia Boutan Chevron Kevin Bruch Caterpillar K. G. Duleep (Consultant) EEA Inc. Bill Finger (Demand Group) Cambridge Energy Research Associates David Friedman Union of Concerned Scientists Srini Gowda General Electric Albie Hochhauser ExxonMobil Emil Jacobs (Team Lead) ExxonMobil Gib Jersey ExxonMobil Peter Lawson General Electric Jim Spearot General Motors Dan Sperling Univ. of California–Davis, Institute of
Transportation Studies Kevin Stork U.S. DOE, Freedom Car Tom Stricker Toyota Motor North America Rogelio Sullivan U.S. DOE, Freedom Car The following provided substantial information or consulting support to the Subgroup: Norm Brinkman General Motors James Corbett Univ. of Delaware, Marine Policy Program Edward Hall General Electric John Heywood Massachusetts Institute of Technology, Sloan
Automotive Lab Russell Myers EEA, Inc. V. K. Sharma International Truck

Working Document of the NPC Global Oil and Gas Study Made Available July 18, 2007
38
IX. Appendix 2: References
A. General
1) Energy Information Administration, Annual Energy Outlook, 2006
2) Energy Information Administration. 2003. Model Documentation Report:
System for the Analysis of Global Energy Markets (SAGE). Volume 2: Data
Implementation Guide. DOE/EIA-M072(2003)/2
3) Fulton, L. and Eads, G. 2004. IEA/SMP Model Documentation and
Reference Case Projection.
B. Light-Duty Vehicles
1) National Academy of Science Press, Effectiveness and Impact of CAFE
Standards, July 2001
2) MIT Energy Laboratory, On the Road In 2020, Prepared by J. Weiss, et. al.,
October 2000
3) ACEEE, Technical Options for Improving Fuel Economy of U.S. Cars and
Light Trucks, ACEEE Publication, April 2001
4) EEA, Technology and Cost of Future Fuel Economy Improvements for
Light-Duty Vehicles, Report to the National Academy of Sciences, June 2001
5) “Light-Duty Automotive Technology and Fuel Economy Trends: 1975
Through 2005”, Robert M. Heavenrich, ATD-OTAQ U.S. Environmental
Protection Agency, Report EPA420-R-05-001, July, 2005.

Working Document of the NPC Global Oil and Gas Study Made Available July 18, 2007
39
C. Heavy-Duty Vehicles
1) “Technology Roadmap for the 21st Century Truck Program, a Government-
Industry Research Partnership”, the U.S. Department of Energy (DOE),
December 2000.
2) “Truck Essential Power Systems Efficiency Improvements for Medium
Duty Trucks”, Presentation by Caterpillar at HVSO Review Meeting, April
20, 2006.
3) McCallen, R., et al “DOE’s Effort to Reduce Truck Aerodynamic Drag
through Joint Experiments and Computations”, Presentation, April 2006.
4) Milovanovic, N., Kenchington, S., “Lotus AVT™ System for Advanced
Diesel Combustion”, Presentation by Lotus Engineering, October 2006.
5) Easley, W. L., Kapic, A., Milam, D.M., “The Path to a 50% Thermal
Efficient Engine”, Presentation by Caterpillar, DEER Conference, August 23,
2005.
6) Puetz, W, “Future Diesel Engine Thermal Efficiency Improvement and
Emissions Control Technology”, Presentation by Detroit Diesel, August
2005.
7) “UPS Expands “Green Fleet” with 50 Hybrid Electric Vehicles”, UPS Press
Release, February 17, 2006.
8) Gaines, L., “Analyzing Technologies to Reduce the Fuel Use of Heavy
Vehicles”, Presentation by Argonne National Laboratory, April 2006.
9) “Goodyear Launches Fuel-Efficient Truck Tire Lines”, Goodyear Press
Release, August 24, 2006.

Working Document of the NPC Global Oil and Gas Study Made Available July 18, 2007
40
10) “DOE Program on Parasitic Energy Loss Reduction for Class 7/8 Trucks”,
Presentation by Caterpillar, April 19, 2006.
11) “EPA to Build World’s First Full Hydraulic Hybrid Urban Delivery
Vehicle”, the U.S. Environmental Protection Agency, Press Release,
February 10, 2006
D. Air
1) Airbus. 2004. Global Market Forecast 2004-2023.
2) Boeing. 2006. Current Market Outlook, 2006.
3) Energy Information Administration. 2003. Model Documentation Report:
System for the Analysis of Global Energy Markets (SAGE). Volume 2: Data
Implementation Guide. DOE/EIA-M072(2003)/2
4) IPCC. 1999. IPCC Special Report: Aviation and the Global Atmosphere –
Summary for Policymakers.
5) Greene, David L. 1992. Energy-Efficiency Improvement Potential of
Commercial Aircraft. Annu. Rev. Energy Environ 17, 537-573.
6) Lee, Joosung J., et al. 2001. Historical and Future Trends in Aircraft
Performance, Cost, and Emissions. Annual. Rev. Energy Environ. 26, 167-
200.
7) Peeters, P.M. and Hoolhorst, Middel J. 2005. Fuel efficiency of commercial
aircraft: An overview of historical trends. National Aerospace Laboratory
NLR (Nationaal Lucht- en Ruimtevaartlaboratorium)

Working Document of the NPC Global Oil and Gas Study Made Available July 18, 2007
41
E. Marine
1) Eyring, V., et al. 2005. Emissions from international shipping: 2. Impact of
future technologies on scenarios until 2050. Journal of Geophysical Research
110, D17306
2) Eyring, V., et al. 2006. Multi-model simulations of the impact of
international shipping on atmospheric chemistry and climate in 2000 and
2030. Atmospheric Chemistry and Physics Discussions 6, 8553-8604.
3) Fulton, L. and Eads, G. 2004. IEA/SMP Model Documentation and
Reference Case Projection.
4) MARINTEK et al. 2000. Study of Greenhouse Gas Emissions from Ships –
Final Report to the International Maritime Organization.
http://unfccc.int/files/methods_and_science/emissions_from_intl_transport/ap
plication/pdf/imoghgmain.pdf.
F. Rail
1) King, Robert D. 2002. DOE Heavy Vehicle Systems Optimization: 21st
Century Locomotive Technology (locomotive system tasks). Presentation by
GE to DOE, available at
http://www1.eere.energy.gov/vehiclesandfuels/pdfs/hvso_2006/ 22_salasoo.p
df.
2) Liu, Rongfang and Golovitcher, Iakov. 2003. Energy-efficient Operation of
Rail Vehicles. Transportation Research Part A 37, 917-932.

Working Document of the NPC Global Oil and Gas Study Made Available July 18, 2007
42
3) Miller, Arnold et al. 2006. Analysis of Fuel Cell Hybrid Locomotives.
Journal of Power Sources 157, 855-861.
4) Stodolsky, Frank. 2002. Railroad and Locomotive Technology Roadmap.
Argonne National Laboratory. Center for Transportation Research, Energy
Systems Division.
5) Thelen, Gerhard and Lovette, Michael. 1996. A Parametric Study of the
Lubrication Transport Mechanism at the Rail-wheel Interface. Wear 151,
113-120.
6) UIC – International Union of Railways. 2003. Energy efficiency strategies
for rolling stock and train operation. http://www.railway-energy.org/
templates/EnergyEfficiencyTech.pdf.
7) UIC – International Union of Railways. 2002. Industry as a partner for
sustainable development - Railways. Prepared in a process facilitated by
UNEP. Available at
http://www.uneptie.org/outreach/wssd/docs/sectors/final/railways.pdf.
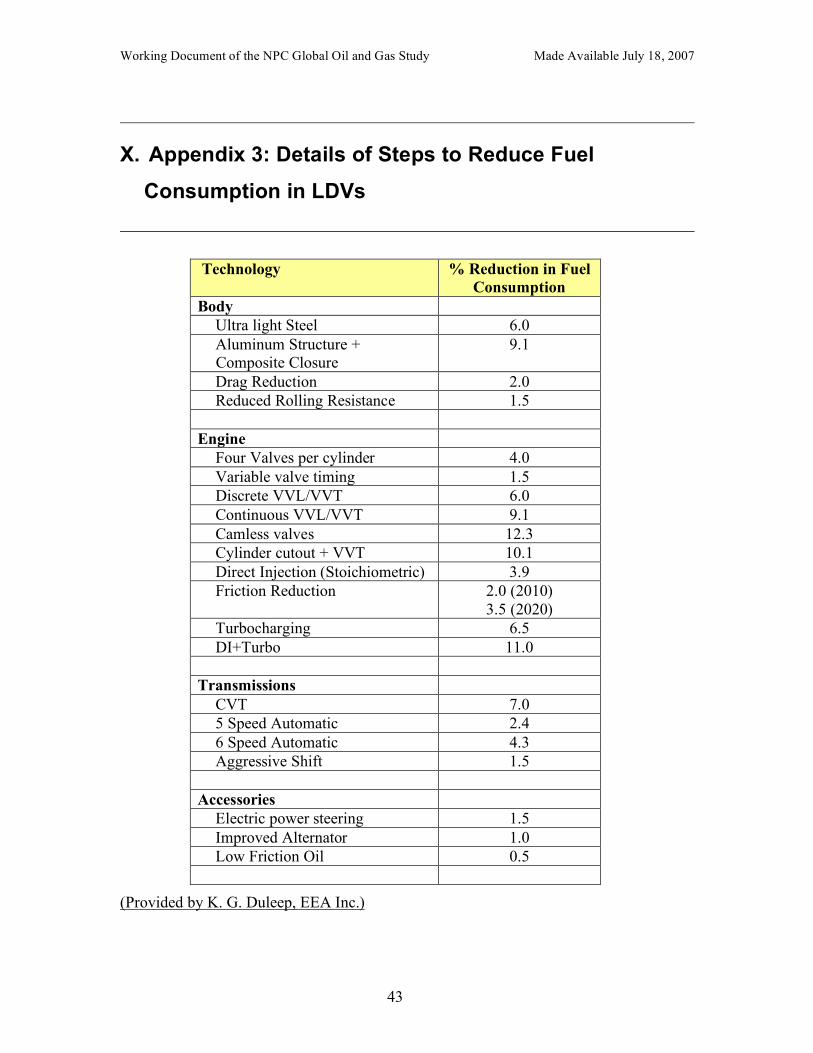
Working Document of the NPC Global Oil and Gas Study Made Available July 18, 2007
43
X. Appendix 3: Details of Steps to Reduce Fuel
Consumption in LDVs
Technology % Reduction in Fuel Consumption
Body Ultra light Steel 6.0 Aluminum Structure +
Composite Closure 9.1
Drag Reduction 2.0 Reduced Rolling Resistance 1.5 Engine Four Valves per cylinder 4.0 Variable valve timing 1.5 Discrete VVL/VVT 6.0 Continuous VVL/VVT 9.1 Camless valves 12.3 Cylinder cutout + VVT 10.1 Direct Injection (Stoichiometric) 3.9 Friction Reduction 2.0 (2010)
3.5 (2020) Turbocharging 6.5 DI+Turbo 11.0 Transmissions CVT 7.0 5 Speed Automatic 2.4 6 Speed Automatic 4.3 Aggressive Shift 1.5 Accessories Electric power steering 1.5 Improved Alternator 1.0 Low Friction Oil 0.5
(Provided by K. G. Duleep, EEA Inc.)

Working Document of the NPC Global Oil and Gas Study Made Available July 18, 2007
44
XI. Appendix 4: Calculation of LDV Fuel Consumption
Fuel consumption, as used in this report, has units of gasoline equivalent
gallons/mile, or energy/mile. To determine the total change in fuel consumption from
a series of steps, use the formula:
)}100
1(1{1001
i
n
i
TrR !
=
""#=
where:
RT = total reduction in fuel consumption, %
ri = reduction in fuel consumption for step i, %
Two examples illustrate the calculation and show steps that might be taken to
achieve 50% reduction in fuel consumption. All values are taken from Table IIIB.2.
Example 1 (2030)
r1: Engine efficiency Level 3, 16%
r2: Body improvements Level 3, 12.5%
r3: Driveline improvements Level 2, 7%
r4: Fueled Hybrid, 27%
Total improvement (%) = 100 x {1 - (1 - 0.16) x (1 - 0.125) x (1 - 0.07) x (1 - 0.27)}
= 100 x {1 - 0.84 x 0.875 x 0.93 x 0.73}
= 100 x {1 - 0.50}
= 50%
Example 2 (2030)
r1: Diesel Engine, 17%
r2: Driveline improvements, 7%
r3: Body improvements Level 3, 12.5%
r4: Fueled Hybrid, 26%
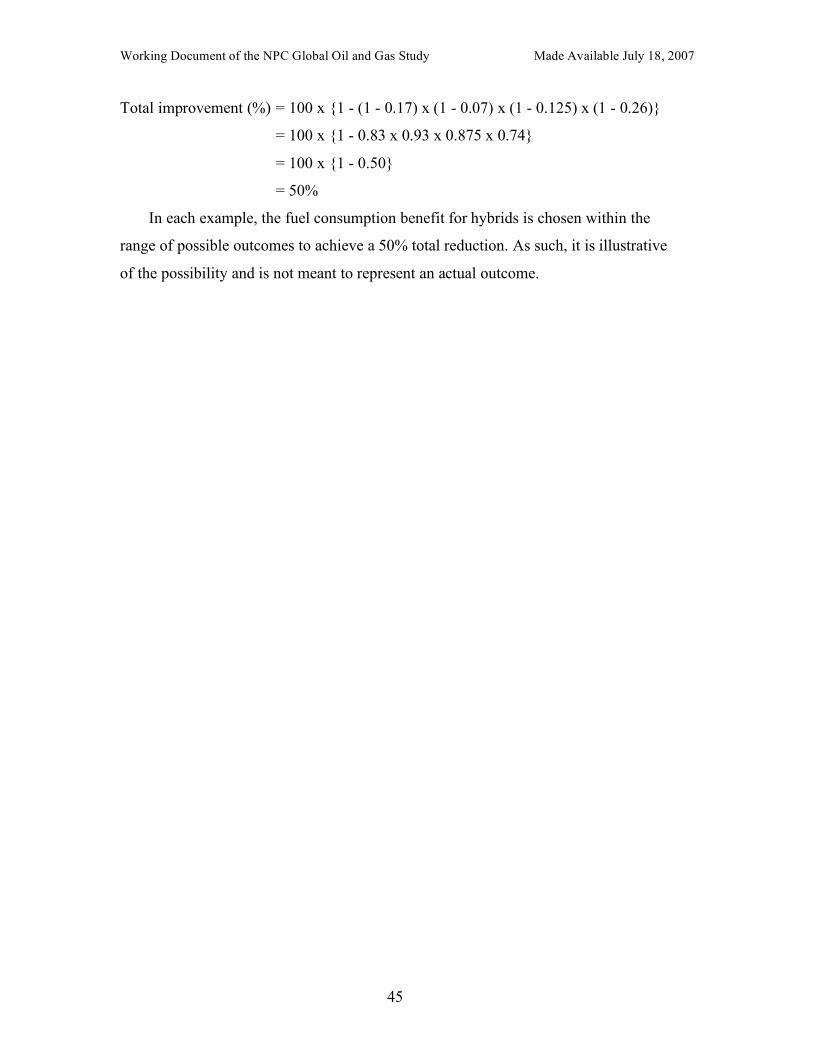
Working Document of the NPC Global Oil and Gas Study Made Available July 18, 2007
45
Total improvement (%) = 100 x {1 - (1 - 0.17) x (1 - 0.07) x (1 - 0.125) x (1 - 0.26)}
= 100 x {1 - 0.83 x 0.93 x 0.875 x 0.74}
= 100 x {1 - 0.50}
= 50%
In each example, the fuel consumption benefit for hybrids is chosen within the
range of possible outcomes to achieve a 50% total reduction. As such, it is illustrative
of the possibility and is not meant to represent an actual outcome.