topics in computational sustainability - stanford universityermon/cs325/slides/lecture1-s16.pdf ·...
TRANSCRIPT

Topics in Computational SustainabilityCS 325
Spring 2016
Lecture 1: Intro
Course information (Administrivia)
Examples of Computational Sustainability Projects
Spring 2016

Course Information
Instructor
Stefano Ermon
Office Location: 228 Gates Hall
There will also be several guest lectures
Lectures: Tuesdays and Thursdays - 10:30 – 11:50
No Textbook
Website: http://cs.stanford.edu/~ermon/cs325/

Computational Sustainability:
Goals and Topics
1. Introduce students to sustainability notions, concepts, and challenges
2. Introduce students to computational models and algorithms, in the context of
sustainability topics.
Sustainability topics:
Sustainable development, renewable resources, biodiversity and
wildlife conservation, poverty mitigation, energy, transportation,
and climate change.
Computational topics:
Machine learning (e.g., supervised and unsupervised learning), decision
and optimization problems (e.g., linear and integer programming,
dynamic programming), sequential decision making under uncertainty
(markov decision processes), networks (e.g., graphs and network
algorithms)

Background
How many have taken an intro to Artificial Intelligence class (CS 221)?
How many are familiar with Machine Learning (e.g., have taken CS 229 or
CS 228)?
How many are familiar with optimization problems (e.g., convex
optimization)?
How would you rate your programming skills? Beginner / Average / Good
Prerequisites: familiar with mathematical modeling, algebra, calculus,
probability theory etc. Basic programming skills.

Coursework and Grading
5
Coursework and grading (tentative)
– Project (60%): proposal and final report. You are free to do something
related to your research. Students can choose to work on their own or in
a small team. Interdisciplinary teams encouraged!
– Reaction paper (20%): critically summarize a sustainability-related
problem and published solution approaches. It’s a good idea to use to
use the reaction paper as background research for the project.
– Presentation (20%): present 1) a paper concerning a computational
approach to a sustainability topic, 2) a sustainability domain and its open
challenges where computation can play a role, or 3) a computational
technique, model or tool that can be used to address sustainability-
related problems. More details on the logistics to come.
– Class participation (up to extra 10%)

What is Computational Sustainability?
A new field of research that aims to develop computational methods to help
solve some of the pressing challenges concerning sustainability.
6
Balancing Environmental &
Socioeconomic Needs
Dynamical
Models
Simulation
Control
Optimization
CompSustNet
Simulation
Dynamical Models
Optimization
Multi-Agent
Systems
Citizen Science
Big Data
Machine Learning
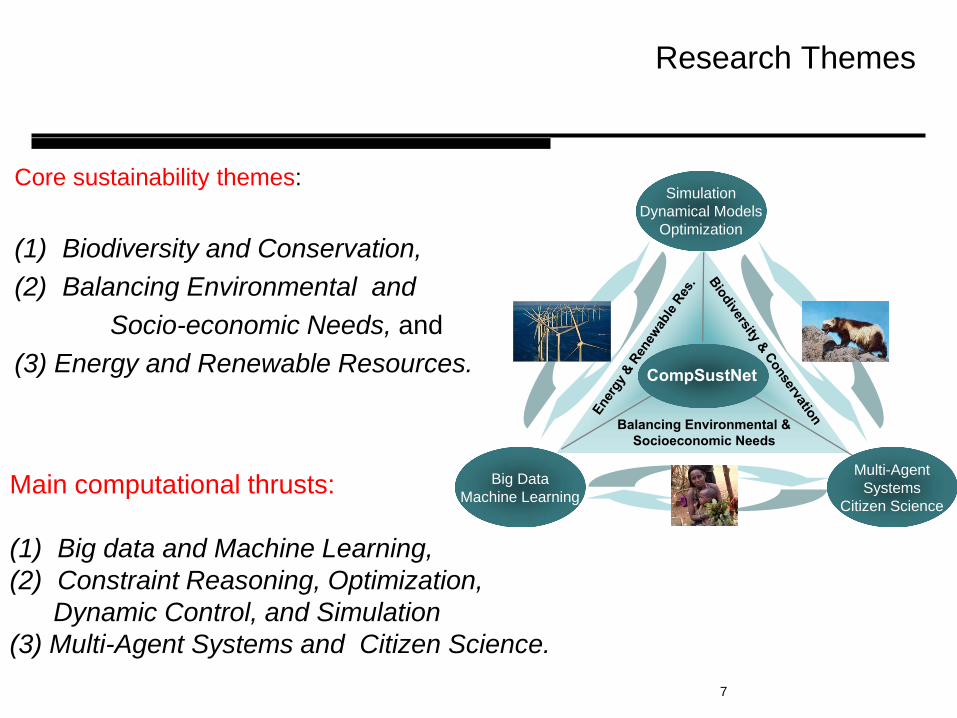
Core sustainability themes:
(1) Biodiversity and Conservation,
(2) Balancing Environmental and
Socio-economic Needs, and
(3) Energy and Renewable Resources.
7
Research Themes
Main computational thrusts:
(1) Big data and Machine Learning,
(2) Constraint Reasoning, Optimization,
Dynamic Control, and Simulation
(3) Multi-Agent Systems and Citizen Science.

Examples of Computational Sustainability projects
8

I - Biodiversity and Species Distributions
Biodiversity or biological diversity
Degree of variety of life forms within a given species,
ecosystem, or an entire planet.
9
Fundamental question in
biodiversity research:
How different species
are distributed
across landscapes over time.

10
eBird: Citizen Science at
the Cornell Lab. Of Ornithology
The Citizen Science project at the Lab of Ornithology at Cornell
empowers everyone interested in birds to contribute
to research by submitting bird observations to the eBird webportal.
Increase scientific knowledge
Gather meaningful data to answer large-scale research questions
Increase conservation action
Apply results to science-based conservation efforts
Increase scientific literacy
Enable participants to experience the process of scientific investigation and develop problem-solving skills

Bird Distributions
Machine Learning and Citizen Science
Adaptive Spatio-Temporal Machine Learning
Models and Algorithms
Relate environmental predictors to
observed patterns of occurrences
and absences
Land Cover
Weather
Remote Sensing
En
viro
nm
en
tal D
ata
Patterns of occurrence of the Barn Swallow for different months of the year Source: Daniel Fink
80,000+
CPU Hours
(~ 10 Years!!!)
eBirdCitizen Science
150,000+volunteer
birders
200,000,000+bird
observations
~1,500,000hours of field work
(170+years)
Bird ObservationsState of the Birds Report
(officially released by Secretary of Interior)
1st TimeHemisphere Scale Bird Distribution Models, Revealing, at a fine resolution, Species’ Habitat Preferences
Distribution
Models for
400+ species with
weekly estimates
at fine spatial
resolution
(3km2)
Novel Approaches
To Conservation
Based on eBird Models

How to Engage Citizen Scientists?
Bird-Watcher Assistant
Xue et. al., HumComp 2013

Recommending Interesting sites to Birders Within a Region
Suggesting interesting birding places
– Optimization problem:
Objective function: maximize # of different species seen
Constraint on the # of sites to visit
More species to observe compared with experts’ suggestions
Find Best Places to visit
Secondary criterion: Bird-Watcher Assistant
suggests places which are not frequently visited
previously, but are potentially interesting.

II - Protecting Species:
Wildlife Corridor Design
Key causes of biodiversity loss:
Habitat Loss and Fragmentation

Conservation and Biodiversity :
Wildlife Corridors
Wildlife CorridorsPreserve wildlife against
land fragmentation
Link core biological areas,
allowing animal movement
between areas.
Limited budget; must maximize environmental benefits/utility
Y2Y

Wildlife Corridors link core biological areas,
allowing animal movement between areas.
Typically: low budgets to implement corridors.
Example:
Goal: preserve grizzly bear populations in
the U.S. Northern Rockies by creating
wildlife corridors connecting 3 reserves:
Yellowstone National Park
Glacier Park / Northern Continental Divide
Salmon-Selway Ecosystem
Protecting Species: Wildlife Corridors
costHabitat suitability
Glacier Park
YellowstoneSalmon-Selway

17
Turning a Conservation Problem Into a Computational One..
Wildlife Corridors link core biological areas, allowing animal
movement between areas;
Typically: low budgets to implement corridors.
Find a group of patches that:
• contains the reserves;
• is connected;
• with cost below a given budget;
(and with maximum habitat suitability)
Given a graph G with a set of reserves:
Connection Sub-graph Problem
Map “Graph”
= land patch
= reserve
If you can move
between two patches

Minimum Cost Corridor for the Connected Sub-Graph Problem
25 km2 hex
1288 Cells
$7.3M
2 hrs
50x50 grid
167 Cells
$1.3B
<1 sec
40x40 grid
242 Cells
$891M
<1 sec
25x25 grid
570 Cells
$449M
<1 sec
10x10 grid
3299 Cells
$99M
10 mins
25 km2 hex
Extend with
2xB=$15M
10x in Util
Need to solve problems large number of cells! Scalability Issues

5 km grid
(12788 land parcels):
minimum cost solution
$8M
5 km grid
(12788 land parcels):
+1% of min. cost
Glacier Park
Yellowstone
Salmon-Selway
Real world instance:
Corridor for grizzly bears in the
Northern Rockies, connecting:
Yellowstone
Salmon-Selway Ecosystem
Glacier Park
Approach allows us to find optimal or near-optimal solutions (with
guarantees) for large-scale problem instances and
reduce corridor cost dramatically.
Scaling up Solutions by Exploiting Structure
Typical Case Analysis
Identification of Tractable Sub-problems
Streamlining for Optimization
Static/Dynamic Pruning
(12788 parcels ) 212788 ~ 2.4 x 103726
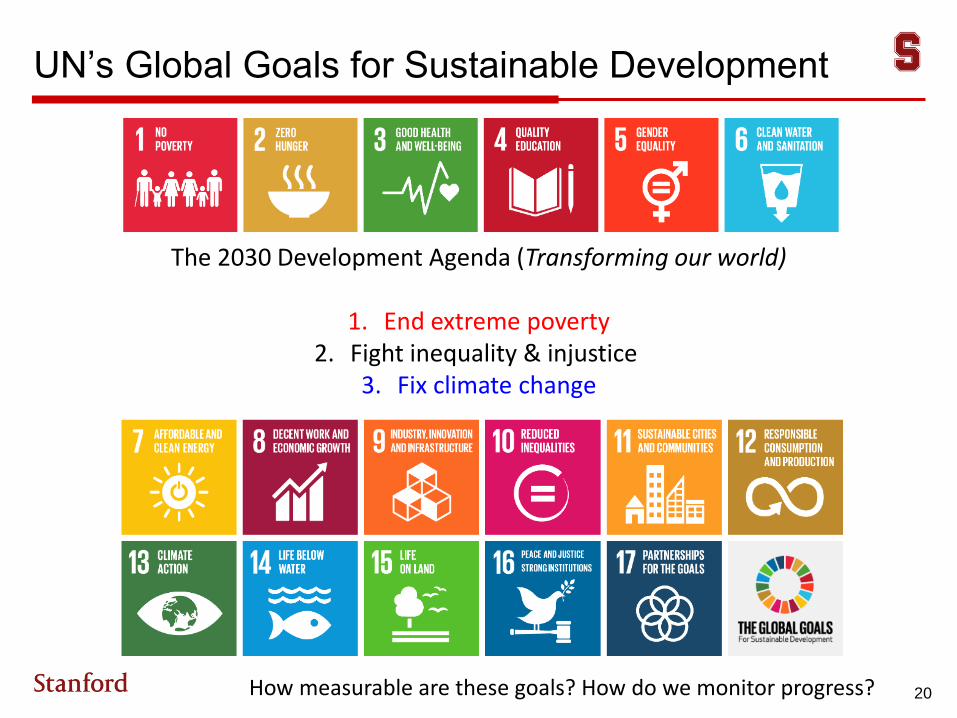
UN’s Global Goals for Sustainable Development
20How measurable are these goals? How do we monitor progress?
The 2030 Development Agenda (Transforming our world)
1. End extreme poverty2. Fight inequality & injustice
3. Fix climate change

A Data Divide is Emerging
21
• Emerging data divide: rich countries are flooded with data (Big Data),
while developing countries are suffering from data drought
– We have sensors in phones, watches, cars, thermostats, …
– Afghanistan is still using census figures from 1979 (a count cut short after
census-takers were killed by mujahideen)
– Nearly 230 million births have gone unrecorded in the last 5 years
– Botswana’s poverty figure is extrapolated from data collected in 1993
“Data are the lifeblood of decision-making and the raw material for accountability. Without data … designing, monitoring and evaluating policies becomes almost impossible”

Remotely Sensed Data
22
Remote sensing (e.g., satellite imagery) is among the few cost-effective
technologies able to provide data at a global scale
Becoming increasingly accurate and cheap (SpaceX, PlanetLabs, SkyBox, …).
New opportunities for modeling global-scale phenomena.
Is it possible to infer socioeconomic indicators (poverty, child
mortality, etc.) from large-scale remotely sensed data?

Focus on Poverty
23
First step: infer household income and poverty from satellite imagery
Do this at scale, accurately and with unprecedented spatial resolution:
vs.Example:

Learned Features: Roads
24
Corresponding filters25 Maximally activating images
f1
f2
…
f4096
Nonlinear mapping

Learned Features: Urban Areas
25
Maximally activating images

Learned Features: Farmland
26
Maximally activating images
Can we use this knowledge for poverty estimation?
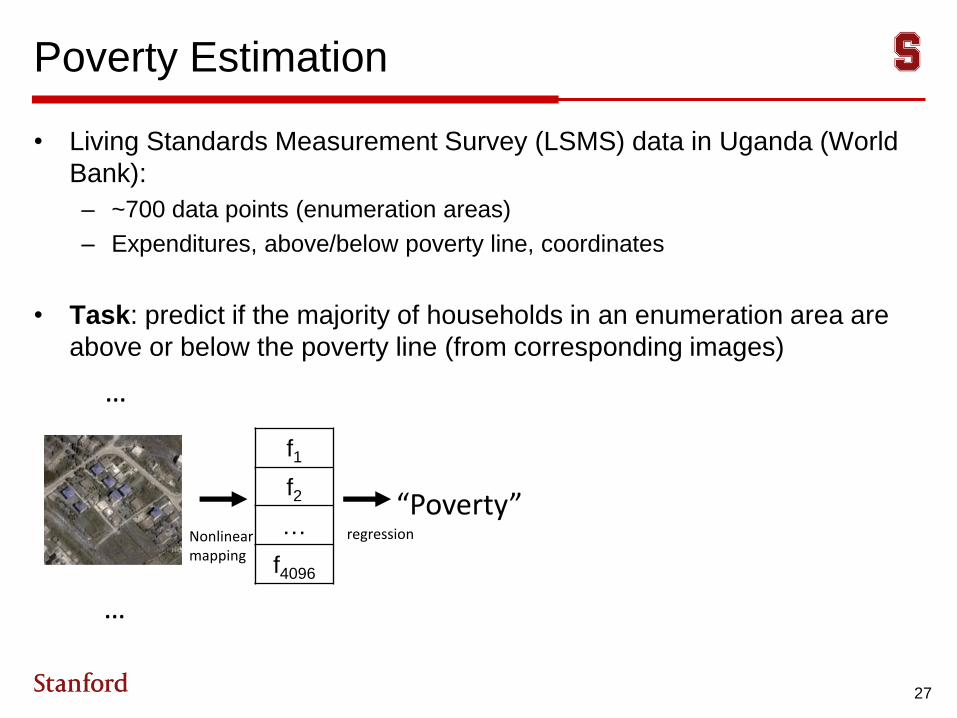
Poverty Estimation
27
• Living Standards Measurement Survey (LSMS) data in Uganda (World
Bank):
– ~700 data points (enumeration areas)
– Expenditures, above/below poverty line, coordinates
• Task: predict if the majority of households in an enumeration area are
above or below the poverty line (from corresponding images)
f1
f2
…
f4096
“Poverty”Nonlinear mapping
regression
…
…

High Resolution Poverty Maps
28
Run the model on about 500,000 images from Uganda:
Scalable and inexpensive approach to generate high resolution
maps.
Most up-to-date map

29
Expeditions
in
Computing
(CISE)
Carla Gomes
October 2014
Computational Sustainability Network
Biodiversity and Conservation
Economic Development
Renewable Energy &
Sustainable Materials
Cross-Cutting Computational
Models/Algorithms
Leveraging them across Applications
20+ faculty, 30+ graduate students, 80+ undergrad Students,
12 Institutions, 7 colleges, 13 departments, 150+collaborators

30
Expeditions
in
Computing
(CISE)
Carla Gomes
October 2014
Computational Sustainability Biodiversity and Conservation
Economic Development
Renewable Energy &
Sustainable Materials
20+ faculty, 30+ graduate students, 80+ undergrad Students,
12 Institutions, 7 colleges, 13 departments, 150+collaborators
Cross-Cutting Computational
Models/Algorithms
Leveraging them across Applications
Pattern Decomposition with
Complex Constraints
Materials Discovery
for Fuel Cells and Solar
Fuels
Sequential Decision Making
Wildlife Corridor Design
Species’ Habitat
Requirements
Migratory Pastoralism
Water-points
Planning
Index-based
Livestock
Insurance
Traffic
Halibut
Fishery Mgtm.Sea Star Wasting
Disease
Incentivize Ciitizen Scientists
Birds
UDiscoverIt:
for Fuel and Solar Cells
Rangeland
and Forage
Electric Car
Network Design
Species
Distributions
Monitoring
Elephants
(Elephant Calls)
Monitoring Birds
(Flight Calls)
Rangeland
and Forage
Birds
Mamals
Smart Grid

More examples
31