total quality management in public schools and attrition ... · total quality management in public...
TRANSCRIPT
TOTAL QUALITY MANAGEMENT IN PUBLIC SCHOOLS AND ATTRITION OF
CERTIFIED PERSONNEL
By
MICHAEL FRANCIS MEEHAN
(Under Direction the of WILLIAM W. SWAN)
ABSTRACT
The attrition of certified personnel from schools implementing Total QualityManagement (TQM) was studied. The surveyed schools represented a national sample ofschool districts and schools that had implemented TQM for three years. Tests ofProportionality were conducted to determine if there was any statistical significancebetween the number of certified personnel leaving schools implementing TQM and thenumber of certified personnel leaving schools as reported in a national study. Five othervariables were tested: age, degrees held, ethnicity, years of experience, and teachinglevel. Findings revealed that:
It must be concluded that certified personnel attrition for the sample group wassignificantly less. In the sub-category of elementary schools certified personnel attritionsignificantly decreased for the three years of the study. It was also found that the certifiedpersonnel attrition within the sub-category of secondary schools significantly decreasedfor the three years of the study.
INDEX WORDS: Total Quality Management, attrition, implementation, certifiedpersonnel

TOTAL QUALITY MANAGEMENT IN PUBLIC SCHOOLS AND ATTRITION OF
CERTIFIED PERSONNEL
by
MICHAEL FRANCIS MEEHAN
MED, NORTHEASTERN UNIVERSITY, 1972
BS, STATE COLLEGE AT BOSTON, 1969
A Dissertation Submitted to the Graduate Faculty of The University of Georgia in Partial
Fulfillment of the Requirements for the Degree
DOCTOR OF EDUCATION
ATHENS, GEORGIA
2003

© 2003
MICHAEL FRANCIS MEEHAN
All Rights Reserved
TOTAL QUALITY MANAGEMENT IN PUBLIC SCHOOLS AND ATTRITION OF
CERTIFIED PERSONNEL
by
MICHAEL FRANCIS MEEHAN
Major Professor: William W. Swan
Committee: Charles T. HolmesL. David Weller
Electronic Version Approved:
Maureen GrassoDean of the Graduate SchoolThe University of GeorgiaMay, 2003
iv
DEDICATED TO THE MEMORY OF
FRANCIS J. MEEHAN
AND
JOHN A. SENCABAUGH
v
ACKNOWLEDGEMENTS
This dissertation is the product of years of development. I would like to recognize
the patience and guidance of Dr. William W. Swan who guided me during its
development. His criticisms, corrections, and patience aided in the improvement of my
writing style. Bill is a man of quality, insight, and immense writing talent. He is an
inspiration to all the department’s graduate students.
I gratefully acknowledge the patience of my wife, Kay, who has put up with
numerous nights, weekends, and vacations where authorship has been a competing
mistress. I must acknowledge the teenage opinion of my daughter, Jessica, who bet me
that she would graduate from high school before I completed this dissertation. She won
the bet, but by only a few months.
Finally, thanks to all those relatives and friends that have waited for me to finish
and who listened to me while I was working on this dissertation.
vi
TABLE OF CONTENTS
Page
ACKNOWLEDGEMENTS.................................................................................................v
LIST OF TABLES............................................................................................................. ix
LIST OF FIGURES .............................................................................................................x
CHAPTER
1 THE INTRODUCTION.....................................................................................1
Conceptual Framework .................................................................................5
The Purpose of the Study ............................................................................12
Research Questions .....................................................................................12
Null Hypothesis...........................................................................................13
Research Hypothesis ...................................................................................14
Limitations...................................................................................................16
Justification for this Study...........................................................................17
Definition of Terms .....................................................................................18
Organization of the Remainder of Study.....................................................20
2 REVIEW OF THE LITERATURE .................................................................21
The Application of TQM Theory to Education...........................................22
School Cultures and Climate.......................................................................32
Motivation ...................................................................................................41
vii
Within Education: The Bell Curve Meets Kaizen.......................................43
Educational Implementation in Practice......................................................44
Brown-Frierson’s Demographic Linkages ..................................................45
Standardization of TQM in Education ........................................................48
Attrition Studies-National Statistics ...........................................................50
Summary .....................................................................................................52
3 METHODOLOGY .......................................................................................55
Overview .....................................................................................................55
Research Design ..........................................................................................55
The Survey Development ............................................................................56
Reliability and Validity ...............................................................................57
The Sample..................................................................................................58
Demographic linkages.................................................................................60
Hypotheses and Variables ...........................................................................65
Null Hypothesis...........................................................................................65
Procedure.....................................................................................................67
Survey Returns ............................................................................................69
Statistical Analysis ......................................................................................69
Analysis .......................................................................................................69
4- DATA ANALYSIS AND INTERPERTATION ................................................71
Sampling Procedures...................................................................................71
Problems in Received Responses ................................................................72
Data Analysis ..............................................................................................74

viii
National Descriptive statistics/Responses of Usable Surveys.....................74
Inferential Statistics .....................................................................................77
Findings .......................................................................................................86
5 SUMMARY AND DISCUSSION...................................................................95
Summary ....................................................................................................95
Implications .................................................................................................96
Recommendations .......................................................................................97
REFERENCES ................................................................................................................100
APPENDICES
A Survey Letter..................................................................................................105
B Survey ............................................................................................................106
ix
LIST OF TABLES
Page
Table 1: Attrition among full-time public school teachers 1993-1994 to 1994-1995. ......76
Table 2:Analysis of Ho1. ...................................................................................................80
Table 3:Analysis of Ho2a: elementary. .............................................................................80
Table 4: Analysis of Ho2a secondary. ...............................................................................80
Table 5: Analysis of Ho2b: 1-3 years of experience..........................................................82
Table 6: Analysis of Ho2b: 4-9 years of experience..........................................................82
Table 7: Analysis of Ho2b:10-20 years experience...........................................................82
Table 8: Analysis of Ho2b: 20+ years of experience.........................................................83
Table 9: Analysis of Ho2c: certified personnel <26-29 years of age. ...............................83
Table 10: Analysis of Ho2c: certified personnel 30-39 years of age.................................83
Table 11: Analysis of Ho2c: certified personnel 40-49 years of age.................................87
Table 12: Analysis of Ho2c: certified personnel 50-59 years of age.................................87
Table 13: Analysis of Ho2c: certified personnel 60-64 years of age.................................87
Table 14 Analysis of Ho2c: certified personnel 65+ years of age.....................................88
Table 15: Analysis of Ho2e certified personnel Bachelors. ..............................................88
Table 16: Analysis of Ho2e: certified personnel Masters..................................................88
Table 17: Analysis of Ho2e: certified personnel Masters +. .............................................89
Table 18: Summary of Analysis ........................................................................................90
x
LIST OF FIGURES
Page
Figure 1: Deming’s 14 Points (Out of Crisis, 1986)............................................................3
Figure 2: The Principal within the Total Quality Framework ...........................................33
Figure 3: Summary of Germinario and Ogden’s Organizational Vitality .........................34
Figure 4: Summary of Germinario, Ogden and Glickman, Schenkat Organizational
Vitality ................................................................................................................35
Figure 5: ASQC Survey Responses ...................................................................................61
Figure 6: The Focus Area of Business Support .................................................................62
Figure 7: The Focus Area of Administrative Practice .......................................................62
Figure 8:The Focus Area of Communication ....................................................................63
Figure 9: The Focus Area of Curriculum...........................................................................63
Figure 10: The Focus Area of Student Achievement.........................................................64
Figure 11: The Focus Area Improvement of Teaching Methods.......................................64
1
CHAPTER 1
THE INTRODUCTION
Ravitch (2000) commented that early in the twentieth century education activists
dreamed of universal education. The U.S. Department of Education (1997) reported that
public education, during the 90’s, was universally accessible with graduation rates flat at
86%. While this statistic demonstrates progress toward our national educational goals, it
reflected only partial completion of the vision of the earlier turn of the century activists.
That vision saw that public schools could transform children’s lives by giving them the
opportunity and skills to learn, which are critical elements in self-improvement (Ravitch,
2000). Ravitch observed that public education’s impacts on large-scale social and
economic changes were innately limited by the distinctiveness of its mission and its
institutional culture.
Ravitch (2000) stated that “the 1980s and 1990s saw a campaign among parents,
legislators, governors, business leaders, and even presidents to strengthen curricula, raise
graduation requirements and set higher expectations for all children (p. 461).” These
topics are fundamental to the distinctive mission and institutional culture of public
schools. The major reforms also being debated included school vouchers, back-to-basics,
bi-lingual education, teacher empowerment, the market approach to education, and whole
language
Joyce, Bennett, and Rolheiser-Bennett (1990), writing on the empowerment of
teachers through research, acknowledged that: “Proposals both for the empowerment of
2
teachers and for an increase in knowledge base in education depend on the realization of
a radically revised workplace with very different relationships among teachers and
greater attention to the application of professional knowledge than is the norm in
educational settings today” (p. 34). Total Quality Management (TQM) is one approach to
teacher empowerment. TQM creates a radically revised workplace that changes the
relationships among teachers. TQM acts as a management theory (Deming, 1986,) for the
improvement of quality, productivity, and competitive position.
Through the adoption of TQM, school districts and their schools may accomplish
three objectives. The first is to focus schools on the quality of education that students
receive. The second is to restructure adult roles and each role’s portrayal of successful
behaviors. The third is the re-establishment or redefinition of sub-system borders
(Schenkat, 1993).
The first objective is achieved when the senior leadership defines the district’s
purpose and key stakeholders and outlines successful student outcomes based on meeting
or exceeding essential stakeholder expectations. The senior leadership then promotes the
district-wide coordination of each school’s mission and culture to reflect the district’s
purpose. In a TQM culture, the higher the leadership position, the more the leader must
be concerned with quality improvement. Innovation becomes a top and middle leadership
function. As the TQM leadership pilots the improvement process, the new results attained
lead to new standards (Imai, 1986).
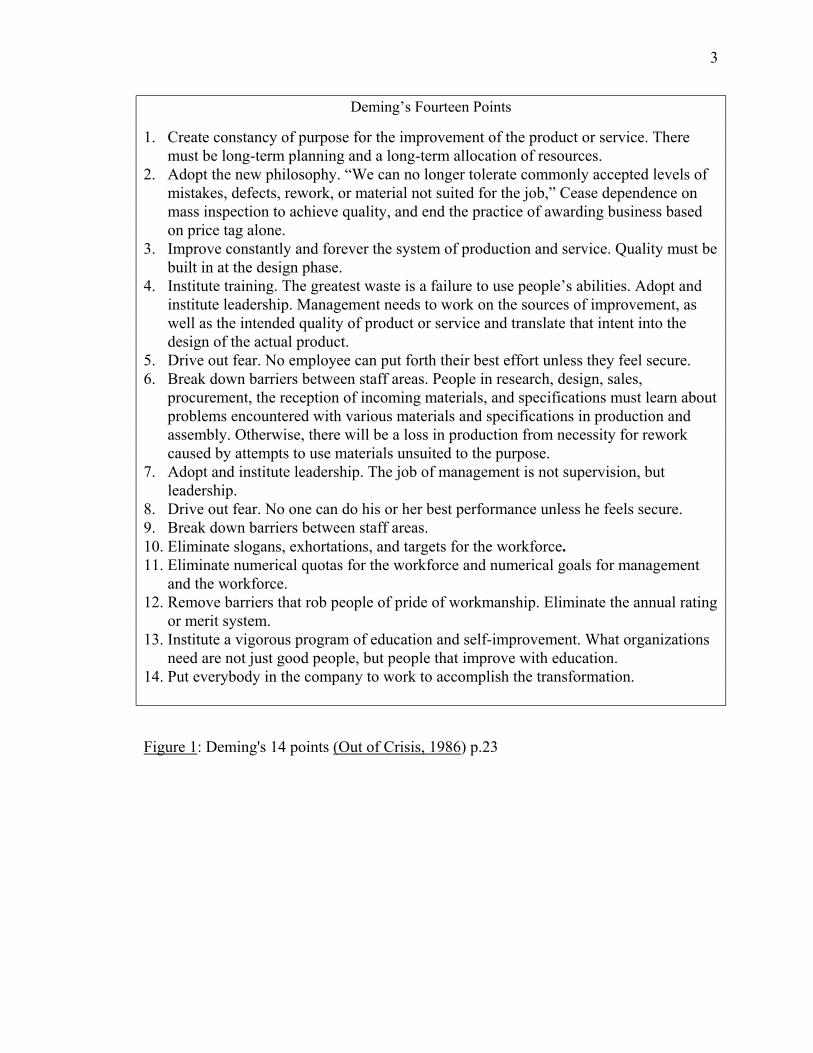
TQM restructures the roles of leader and teacher when it redefines successful
teaching as the application of Deming’s 14 Points, Deming’s theory of variation, the use
of quality tools, and systems thinking. The foundation to the theory is Deming’s (1986)
14 points of Total Quality Management (see Figure 1).
3
Deming’s Fourteen Points
1. Create constancy of purpose for the improvement of the product or service. Theremust be long-term planning and a long-term allocation of resources.
2. Adopt the new philosophy. “We can no longer tolerate commonly accepted levels ofmistakes, defects, rework, or material not suited for the job,” Cease dependence onmass inspection to achieve quality, and end the practice of awarding business basedon price tag alone.
3. Improve constantly and forever the system of production and service. Quality must bebuilt in at the design phase.
4. Institute training. The greatest waste is a failure to use people’s abilities. Adopt andinstitute leadership. Management needs to work on the sources of improvement, aswell as the intended quality of product or service and translate that intent into thedesign of the actual product.
5. Drive out fear. No employee can put forth their best effort unless they feel secure.6. Break down barriers between staff areas. People in research, design, sales,
procurement, the reception of incoming materials, and specifications must learn aboutproblems encountered with various materials and specifications in production andassembly. Otherwise, there will be a loss in production from necessity for reworkcaused by attempts to use materials unsuited to the purpose.
7. Adopt and institute leadership. The job of management is not supervision, butleadership.
8. Drive out fear. No one can do his or her best performance unless he feels secure.9. Break down barriers between staff areas.10. Eliminate slogans, exhortations, and targets for the workforce.11. Eliminate numerical quotas for the workforce and numerical goals for management
and the workforce.12. Remove barriers that rob people of pride of workmanship. Eliminate the annual rating
or merit system.13. Institute a vigorous program of education and self-improvement. What organizations
need are not just good people, but people that improve with education.14. Put everybody in the company to work to accomplish the transformation.
Figure 1: Deming's 14 points (Out of Crisis, 1986) p.23
4
The district’s second objective is addressed when the school’s leadership systems
promote faculty and staff quality consciousness. Moreover, through quality
consciousness faculty and staff members redefine their jobs with the pursuit of quality
improvement incorporated as an element of their daily tasks. Quality consciousness
focuses on both the quality of the product and the efficiency of process. TQM achieves
the assurance of quality with continuous statistical measurement to evaluate process and
to control variance.
The faculty and staff take statistical measurements to provide data on variance
and brainstorm for solutions for eliminating variance. Attention must be paid to how each
persons’ efforts impact other persons efforts and the outcome (Deming points 5 & 9).
The third objective is accomplished through adoption and training of certified
personnel in systems thinking. Once people share a common system picture of their
work, they can be clear in their purpose. Certified personnel learn to document all
systems and to recognize how the systems and subsystems interact to effect quality
outcomes. They are empowered by their knowledge of variation and systems theory to
control variation. Fields 1993, reported that, “School leaders are familiar with many of
Deming’s considerations, but the terminology they have heard may be different” (p.48).
An example of this is that employee involvement translates to teacher empowerment,
process translates to methodology, reject rate translates to failure rate,
customers/stakeholders translates to students, employers, communities, taxpayers, and
the next education institution (Neuroth, Plastrik, & Cleveland, 1992).
Deming (1986) represented the TQM transformation as beneficial to the worker
who would “feel important to the job if he can take pride in his work and may have a part
5
in improvement of the system” (p. 82). Deming (1986) addressed attrition when he stated
that, “Turnover goes up as the proportion of defective items goes up, and the turnover
goes down when it becomes obvious to employees that the management is trying to
improve the process” (p. 82). In contrast, Schenkat (1993) lamented that the massive
changes brought on through a TQM transformation would be deeply psychologically
threatening to rigid hard-wired people.
The attrition of certified personnel is the largest single factor determining the
demand for certified personnel in the nation’s schools. Patterns of attrition vary with the
ages and the positions of leaving personnel. It is important to study attrition patterns and
their implications as the current education work force ages.
Conceptual Framework
TQM advances a theory that runs counter to the common leadership practice in
education. TQM transformed schools go through fundamental and interrelated changes.
During this process (Deming, 1986), the personnel grow through the recognition and
collegial finding of answers. The school’s leadership system and certified personnel are
supported and encouraged to find site-based solutions to common cause variation.
The task that most new TQM principals face is to nurture and grow the school’s
adult work culture. The starting point for constructing the TQM adult work culture is the
analysis of a school’s current adult work culture. An overview of common school
cultures was assembled by Germinario and Ogden (1994). They searched the literature
and identified three categories of schools. They advanced profiles of the certified
personnel in each category.

6
The lowest, most common, and least effective schools they named the
Conventional/Collected Schools. The instructional leadership in these schools firmly
believes that good certified personnel make good schools; teaching is an art: therefore,
they struggle to hire good certified personnel and eliminate bad teachers. There is a belief
that certified personnel are the ones who know instruction and the needs of the students;
a good principal leaves the certified personnel alone. The principal ensures the safe and
orderly school environment. Effectiveness of the school is the responsibility of the
individual teacher; however, effectiveness is limited by outside influences on the student.
These schools are characterized as having a distrust of research and a leadership that
crisis manages the school.
They named their second class of schools Collegial-teacher centered. Many of the
core beliefs of the Conventional or Collected Schools prevail in these schools. Yet,
within these schools, decisions are made based on what is best for the adult working
culture. The principals of Collegial Schools are very concerned with being popular. The
students gain little from being in the Collegial School versus their peers in the
Conventional or Collected School. The third class of schools they named the Effective
Student Outcome Based/Professional-Collegial Knowledge Based Schools. The adult
culture of these schools believes that the purpose of the school is student learning; all
students can learn to a very high set of standards. The principal is the instructional leader
of the school instructional team. The principal’s role is to express the beliefs of the
school, find time to communicate the school’s mission and outcomes beyond the school,
foster staff development, and guide planning and analysis. Adult personnel of the school
share in the responsibility for the learning of the students. The educators know how to
7
recognize individual student learning styles and how they should be taught. There is
continuous planning and data collection; the adult personnel realize that one needs to
wait for something to break down before it is fixed.
Germinario and Ogden’s (1994) third category characteristics agree with TQM
concepts and procedures as set out by Fields (1993), Capezio and Morehouse (1993),
Bonstingl (1992), and Lau and Shani (1992) and Deming’s 14 points (1986). Under the
guidance of the leadership team, a student-focused, learning-oriented climate that is
responsive to stakeholder needs develops. A school’s leadership team asserts its’
dynamic leadership through the creation of a clear and visible direction and through the
setting of high expectations. The leadership team trains personnel in the principles of
TQM and statistical control of variance. At both the district and building leadership
levels, system, sub-systems, curricula, policies, and methods for achieving excellence are
developed. They set tone, enlist commitment, and spread belief throughout the
organization in continuous improvement. This requires providing a learner-centered
approach to educating students—a learner-centered design that possesses definite
learning objectives and that considers the individual needs of the students. A learner-
centered design that has an effective means for gauging student progress and a central
quality related theme that adds value to each student’s education. This education adds
economic and social value to each student and meets or exceeds the needs that derive
from the requirements of the marketplace and the responsibilities of citizenship. District
and building leaders strengthen the school learning environment by building and aligning
community support, business leaders, and community services to bolster the mission of
the school (Capezio & Morehouse, 1993).
8
The continuous improvement processes possesses four identifying characteristics:
1. The TQM school possess a clear set of goals of what to improve;
2. decisions in the TQM school are fact-based and planning outlines what
measures/indicators are to be used to measure progress;
3. this planning is systematic and addresses questions of measurement, planning
outcomes, and execution;
4. the school focuses upon key processes as avenues to success. The continuous
improvement process should be firmly established in the way the school
operates (Neuroth, et al., 1992).
TQM work attitudes, thinking, and approaches operate as a regular part of the daily
work of all the adult employees. The certified employees are part of the improvement
process. They seek to eliminate problems at the source and before problems can grow.
The certified personnel and staff possess an attitude that views improvement as driven by
opportunities to do better, as well as being driven to solve problems. The personnel view
opportunities for improvement as coming from varied sources. The personnel would not
be dismissive of ideas generated by: (1) other certified employees and staff members; (2)
successful practices of other organizations; and (3) educational research (Capezio &
Morehouse, 1993).
Using TQM, certified personnel are given the opportunity to develop and implement
the principles, core values, concepts, and skills taught by Deming. The development of
certified personnel in quality methodology means not only the building of a knowledge
discipline, but also increasing their certified personnel’s knowledge of student learning
styles and assessment methods. An active continuous improvement process includes
9
certified personnel and staff participating in the formation of policy and working in
quality teams to develop and implement programs and curricula. Leadership in the TQM
school works to eliminate disincentives for individuals to sustain these important,
learning-focused professional development activities (Capezio & Morehouse, 1993).
Additionally, there needs to be a firm future orientation among the personnel and a
willingness to make long term commitments to stakeholders both within the building and
outside the building. Stakeholders are defined as the current students, parents, future
students, future employers, alumni, and internal stakeholders--teachers and future
teachers of current students. The TQM transformed school possesses an organizational
focus that views the student’s education as a process outcome that effectively fulfills
student requirements after graduation (Fields, 1993).
The long-term planning to meet the goals and needs of stakeholders must anticipate
changes in requirements, instructional techniques, resource availability, technology, and
demographics. While long term planning is a core value, an increasing important measure
of a school’s effectiveness is the efficient and flexible response to the needs of
stakeholders. Schools by their nature are community based and owe their existence to
that community they serve. TQM schools learn to make improvements in quality,
productivity, and response time that strengthen community stakeholders. To meet the
sometimes conflicting and changing aims that a balancing implies, school strategy needs
to seek out and explicitly address student and stakeholder requirements. Policies, goals,
and plans must be frequently updated. The use of a balanced composite of performance
indicators offers an effective means to communicate requirements, monitor actual
10
performance, and gather broad-based support for improving results (Neuroth, et al.,
1992).
During the TQM establishment phase, school leaders and teachers, find
themselves enmeshed in a school-wide cultural change. Initially, senior leaders set
internal and external direction for establishment of TQM. They interpret and apply
Deming’s Fourteen Points. During the establishment phase, the TQM school’s leaders:
Gain internal support through employee empowerment, establish a research based
culture, set acceptable student variances, and select appropriate measurement standards.
When in the operational phase, the leadership style changes from vertical management to
a horizontal systems approach with direct input from an empowered faculty (Fields,
1993). The TQM transformed school uses benchmarking, embraces change, and develops
a multiplicity of specific practices and programs (Deming, 1993).
One of Deming’s core beliefs is that workers want to take pride in their work. As
Deming stated (1986), “Barriers against realization of pride of workmanship may in fact
be one of the most important obstacles to reduction of cost and improvement of quality in
the United States” (p. 83). Point 12 of Deming’s 14 Points deals directly with the
necessity of eliminating barriers that the system creates to workers having pride in their
work. Deming stated that, “Give the workforce a chance to work with pride, and the 3
percent that apparently don’t care will erode itself by peer pressure” (1986, p. 85).
Savings are generated from the reduction of rework. TQM theory advances the
idea that common cause variation and special cause variations inhibit the process and
create rework. Variations arise from faults within the system that cannot be blamed on
human error. It is common cause variations that cross sub-system boundaries. However,
11
the solution for a particular common cause variation may exist within one of the effected
sub-systems. In cases of special cause variations, a particular subsystem is involved. A
special cause problem may involve fewer people but effect the whole process (Deming,
1986). Problems in the system are to blame for 90 percent of product rejection and
rework (Deming, 1986). Deming does not blame the people who work within the process
for process breakdowns and increasing rejection rates. His judgment is that the workers
are the keys to solving common cause variations and specific cause variations. By
solving variation, there is a reduction in the cost of production. In the TQM School,
leader and teacher involvement in solving process variations encourages behaviors that
help the individual grow. The school as an adult workplace becomes a teacher to adults. “
The result is a chain reaction--lower costs, better competitive position, happier people on
the job, jobs, and more jobs” (Deming, 1986, p. 2).
The school’s certified personnel grow in perspective, they propose new solutions,
take on new responsibilities, and speak a new language, as they are given responsibility
for quality outcome early in the process (Fields, 1993). Hence, the school’s certified
personnel learn new behaviors. The certified personnel monitor the processes and
contribute to progress in the areas of student performance, educational climate, research,
scholarship, service, and the capable use of resources (Fields, 1993). They adopt long
term planning to meet goals, emphasizing cross-functional teamwork and involvement
with the whole organization. Through participation, the certified personnel are released
from the fear of expressing ideas; they expand their vision, clarify their needs and
assumptions, and perceive others' needs and assumptions (Fields, 1993).
12
The Purpose of the Study
The purpose of this study was to document changes in certified personnel attrition
that may be related to a TQM culture change. This study expanded on the Brown-
Frierson (1994) qualitative study that reported a link with certain demographic variables
and acceptance of TQM conditions of excellence. Her study did not attempt to determine
if personnel left. The act of leaving creates problems for the senior leadership involving
time and costs linked with the recruitment and training of replacement personnel.
This study answered the question of whether the implementation of TQM lowers
certified personnel attrition rates or increased certified personnel attrition rates addition.
This study provided a basis for planning strategies to deal with the certified personnel
attrition during a TQM transformation.
Research Questions
This study addressed three research questions as follows:
1. What are the demographic descriptors of certified personnel leaving schools
transforming to TQM in the following areas: elementary or secondary schools,
highest degree held, ethnicity, chronological age, years of experience?
2. Does the transformation to a TQM school over a three-year period result in a decrease
or increase in attrition of certified personnel as compared to national attrition data?
3. Are there differences between the number of certified personnel leaving
schools transforming to TQM as compared to national attrition data for the
following demographic descriptors: Type of school (elementary or
secondary), highest degree held, ethnicity, chronological age, years of
experience?

13
Null Hypotheses
To answer these three questions the following six null hypotheses were developed:
Ho1: There is no statistically significant difference in the proportion of attritions from the
sample study of certified personnel from schools transforming to TQM as compared to
the proportion of attritions of certified personnel from the national study by the U.S.
Department of Education for year 1, year 2, or year 3
Ho2a: There is no statistically significant difference in the proportion of the number of
attritions from the sample study of certified personnel from schools transforming to TQM
as compared to the proportion of attritions from the national study by the U.S.
Department of Education for year 1, year 2, or year 3 for elementary or secondary
schools.
Ho2b: There is no statistically significant difference in the proportion of the
number of attritions from the sample study of certified personnel in schools
transforming to TQM as compared to the proportion of attritions from the national
study by the U.S. Department of Education for Year 1, Year 2, or Year 3 for the
category highest degree held.
Ho2c: There is no statistically significant difference in the proportion of the
number of attritions from the sample study of certified personnel in schools
transforming to TQM as compared to the proportion of attritions from the national
study by the U.S. Department of Education for Year 1, Year 2, or Year 3 for the
category of ethnicity.
Ho2d: There is no statistically significant difference in the proportion of the
number of attritions from the sample study of certified personnel in schools
14
transforming to TQM as compared to the proportion of attritions from the national
study by the U.S. Department of Education for Year 1, Year 2, or Year 3 for the
category of chronological age.
Ho2e There is no statistically significant difference in the proportion of the
number of attritions from the sample of certified personnel in schools
transforming to TQM as compared to the proportion of attritions from the national
study by the U.S. Department of Education for Year 1, Year 2, or Year 3 for years
of experience.
Research Hypothesis
HR1: There is a statistically significant increase in the proportion of the number of
attritions from the sample study of certified personnel as compared to the
proportion of attritions from the U.S. Department of Education Study for Year 1,
Year 2, or Year 3.
HR2a: There is a statistically significant difference in the number of attritions from the
sample study of certified personnel in schools transforming to TQM as compared to the
proportion of attritions from the national study by the U.S. Department of Education for
year 1, year 2, or year 3 for elementary or secondary schools.
HR2b: There is a statistically significant difference in the number of attritions
from the sample study of certified personnel in schools transforming to TQM as
compared to the proportion of attritions from the national study by the U.S.
Department of Education for year 1, year 2, or year 3 the category of highest
degree held.

15
HR2c: There is a statistically significant difference in the number of attritions
from the sample study of certified personnel in schools transforming to TQM as
compared to the proportion of attritions from the national study by the U.S.
Department of Education for Year 1, Year 2, or Year 3 for the category ethnicity.
HR2d: There is a statistically significant difference in the number of attritions
from the sample study of certified personnel in schools transforming to TQM as
compared to the proportion of attritions from the national study by the U.S.
Department of Education for Year 1, Year 2, or Year 3 for the category of
chronological age.
HR2e There is a statistically significant difference in the number of attritions from the
sample of certified personnel in schools transforming to TQM as compared to the
proportion of attritions from the national study by the U.S. Department of Education for
Year 1, Year 2, or Year 3 for the category of number years of experience.
An effect of the TQM transformation in a school district or in a school is to
cognitively challenge the school system employees to recognize critical success factors
and key performance requirements that promote student achievement. TQM requires a
focus shift to service to the student as the initial customer along with other key
stakeholders both internal and external. TQM becomes a theoretical base for instructional
leadership, experimental inquiry, and response to public responsibilities (Neuroth, et al.,
1992). The importance of TQM to the education field and its practical effect upon the
certified personnel remains relatively unknown.
Germinario and Ogden (1994) observed that the environment that the school
certified personnel work in frames their perceptions and influences their behaviors. A
16
school leadership system and certified personnel adopt thinking and behaviors that they
perceive as successful within the culture of the school. Senge (1994) identified two
central beliefs in systems thinking, which related to people's beliefs: "structure influences
behavior" and "policy resistance" (p. 374). Senge (1994) stated that policy resistance is
the tendency of complex human systems to resist efforts to change. From a systems
approach, the entropy that exacerbates efforts to change schools proceeds from policy
resistance to the internal and external demands for system change (p. 374).
As Schenkat (1993) stated: “Such massive change has deep psychological roots. It
is difficult for rigid, hard wired folks to get excited and more importantly act congruently
with the reality that change is constant” (p.21). Therefore, Schenkat’s rigid hard-wired
folks should show up as an increase in the attrition rates for transformed schools.
Limitations
Specific certified personnel attitudes toward their experiences with TQM are not
assessed in this study. Similar attitudes could be held by other certified personnel, but
with different results. Since this is a quantitative study, the investigator is examining
quantitative variables--ethnicity, age, academic degrees possessed, and years of
experience. Limitations to the study include: The lack of participation of principals; a
small number of schools that responded (10), uncertainty that the national survey and
TQM survey groups are equivalent, and uncertainty as to the degree of commitment
demonstrated by senior staff members to applying all the principles of TQM, This study
relied on responses from principals and they are under no obligation to respond.
17
Justification for this Study
This study will contribute to existing knowledge through the identification of the
characteristics of certified personnel who leave the school during the establishment of
TQM. The study will contribute data to school boards and superintendents considering
incorporating TQM in their education planning models. The results of the study will
allow planners to adopt policies and design responses that address employee training
needs and employee problems.
Detert and Mauriel (1997) pointed out that TQM “is somewhat silent” regarding
the topic of dealing with resisters (p.35). They recognized that TQM brings about
changes in cultural norms that are forced through its school-wide or district-wide
adoption. They considered the question of how resistance is motivated by a fear of power
loss and loss of competence. Detert and Mauriel (1997), writing about education reforms,
contended that “it may be inevitable that some lose power and others gain power in a true
systemic change, but we are unsure why anyone who stands to lose power will
necessarily be any more excited about TQM than other power-reducing change”(p. 36).
A search of the literature on teacher attitudes, beliefs, and behaviors revealed
relationships between Germinario and Ogden's descriptive school categories with
Glickman's (1985) and Schenkat’s (1993) descriptions of administrator and teacher
cognitive levels. During the establishment phase of the TQM transformation, successful
leader and teacher modes of thinking and work habits should change to be successful in a
new environment. Accomplishment within the adult TQM school shifts from the
presentation of a perfect lesson plan to a new measure of performance-instructional
leadership. Instructional leadership promotes clear goals regarding what to improve.
18
Instructional leadership creates an environment where decisions are fact-based. Within
TQM, the action of teaching calls for a profound knowledge of students and of subject
matter, together with knowledge of all possible approaches to communicating of the
material (Deming, 1993). This shift in the adult work culture effects some teachers with a
fear of power loss and a loss of confidence.
Detert and Mauriel (1997) viewed the issue of a loss of competence as typically
addressed by TQM through an emphasis on training and retraining. As they pointed out,
this brings up the issue of costs involved in establishment, especially the costs of training
and retraining. There are costs involved in the training of new people and the hidden
costs involved in maintaining the processes that strain resources. Detert and Mauriel
(1997) disputed the conclusion that quality pays for itself through increased revenues
generated by increased sales and decreased scrap. They maintained that education costs
are relatively fixed. They did point out that the gains in student learning, process
efficiency, faculty morale, and customer satisfaction produced by a TQM transformation
may well be worth the money spent but it probably will not be free.
Definition of Terms
The following terms are defined for this study:
Benchmarking- processes and products that represent best practice and
performance, within and/or outside of education.
Common cause variation-variation in a process produced by interactions of
process variables.
Critical success factors-conditions of performance most critical to the school's
success.
19
Human Capital-workers skills that can be rented out to employers.
Instructional leadership- behaviors directed toward a school's mission goals, it’s
instructional goals, it’s workplace collegiality, and growth through service.
Kaizen-incremental improvement involving everyone in the organization.
Key performance requirements- includes student learning styles, assessment of
student progress, use of school and external resources, effective design, and the
use of feedback from students and peers, faculty teamwork, and teaching styles
and methods.
Key stakeholders- parents, communities, past graduates, employers, social service
organizations, governing boards, legislatures, and other schools.
Quality-the extent to which the customers or users of a product or service believe
it surpasses their needs and expectations.
Quality of design- the setting of goals and objectives, preparation of syllabus,
course materials, lecture notes, and examinations. All require a long-range view
with much thought and research.
Special Cause variation-causes of process variance directly related to a failure in
material, equipment, of the human operator, or operating method.
System thinking-the capacity to see the parts in relation to the whole, to see why
variations arise.
Valued added performance-two manifestations, (a) year-to-year improvement in
key measures and/or indicators of performance, and (b) demonstrated value-added
leadership in overall performance relative to comparable schools and/or to
appropriate benchmarks
20
Organization of the Remainder of the Study
In Chapter two, books and articles that refer to TQM and its application and
implementation in education as well as schools as workplace cultures are examined.
Chapter 3 reviews the methodology including national attrition data reported by
the U.S. Department of Education. The chapter sets the criteria for selecting the sample
population.
In Chapter 4 the descriptive and inferential analysis of the data and the findings
are presented.
Chapter 5 concludes this study with a discussion of conclusions drawn from the
proportional comparisons and presents recommendations for future research.
21
CHAPTER 2
REVIEW OF LITERATURE
A search of the computer databases (ERIC, Galin, and Dissertation Abstracts
International) yielded 119 articles and books concerned with TQM and education. A
search of the bibliographies in articles and books produced 27 additional related articles
and books. Of the 146 articles and books reviewed, 88 sources addressed the application
of TQM in K-12 public education. These sources were clustered into three categories.
The largest category incorporated opinion articles; the next category consisted of theory
articles; and the smallest category was case histories. The second category included
works concerned with the protocols for the Malcolm Baldrige Education Award. The
third and smallest category consisted of two multiple school studies.
Deming commented on education in a 1993 seminar entitled Dr. Deming Talks to
Educators sponsored by the American Association of School Administrators (AASA). At
that seminar he outlined TQM and made comments concerned with the application of
TQM to education. He commented again on the application of TQM to education in his
book The New Economics. In The New Economics, he criticized the Secretary of
Education, Lamar Alexander, for the April 1991 education bulletin America 2000: An
Education Study. Deming (1999) commented that it was a “horrible example of
numerical goals, tests, rewards, but no method” (p. 45). Deming cited examples from the
report under the heading, “Horrible examples of numerical goals in public places” (p.
22
45). The possible effects of a TQM transformation on personnel attrition rates. Patterson,
Purkey, and Parker (1986) stated that “culture can be defined as the way we do business
around here; who you are and what you stand for; the assumptions about the organization
(p. 47). Refining the definition further, they stated that: “culture embraces the norms,
values, history--the sum total of the shared understandings held by members of the
organization"(Patterson, et al., 1986, p.48). Davis (1984) contributed a caution that
beliefs and behavior are only manifestations of the culture and not the culture itself.
However, he stated "artifacts are tangible, and it is possible to get your arms around
them” (Davis 1984,p.12). There is a difference between the culture of the organization
and the climate within the organization. Patterson, et al., (1986) pointed out
that…“climate is a measure of whether people’s expectations are being met regarding
what it should be like to work in the school district” (p. 48). Davis (1984) put the idea
this way: “Climate, then, becomes the fit between the prevailing culture and individual
values of employees” (p. 12). Changes in the existing organization’s culture must also
bring changes in the organization’s climate.
The Application of TQM Theory to Education
Bonstingl (1992) observed that Shewhart and Deming defined quality by linking
the product with the customer's expectations. Deming (1986) credited Shewhart with
pioneering the idea that productivity improved when variation is reduced in 1931.
Deming (1986) promoted a culture of continued process improvement guided by
Shewhart’s Plan-Do-Study-Act cycle (PDSA). The product would be uniform,
predictable and dependable, of low cost, and meet or exceed the customer’s expectations.
23
Education commentaries by Bonstingl (1992), Capezio and Morehouse (1993), Fields
(1993), and Lau and Shani (1992) are used to explicate Deming’s 14 points follow:
1. Create constancy of purpose for improvement of product and service. There
must be long term planning and allocation of resources. “Place resources into:
Research and Education. Constantly improve the design of product and service”
(Deming, 1986, p. 26). Fields (1993) stated that: “Schools are in the business of
personal contribution to the customers as measured by personalized service to
their graduates. Schools must think in terms of futures, always 10 to 20 years
ahead of today. Schools are constant in their purpose and must change to meet
customer requirements” (p. 48).
2. Adopt the new philosophy. Management makes a mistake when it does not view
quality as an integral part of everyone's work. A management that insists that it is
only necessary to meet specifications advances an attitude which does not permit
growth or product improvement, and is ineffective (Capezio & Morehouse, 1993;
Deming, 1986). In the TQM transformed schools, the leadership system accepts
the responsibility for change. TQM school leaders foster and direct changes that
build a community of certified personnel characterized by cooperation, not
competition. In a TQM school, certified personnel open a dialogue based on
cooperation between areas and formal and informal systems to create
horizontally and vertically integrated teams. The TQM leadership focuses the
adult work culture upon meeting the needs of stakeholders. This is done through
the labor of continued process improvement, the promotion of quality methods, a
24
structured interdependence that supports the system, and a respect for the
school’s human capital.
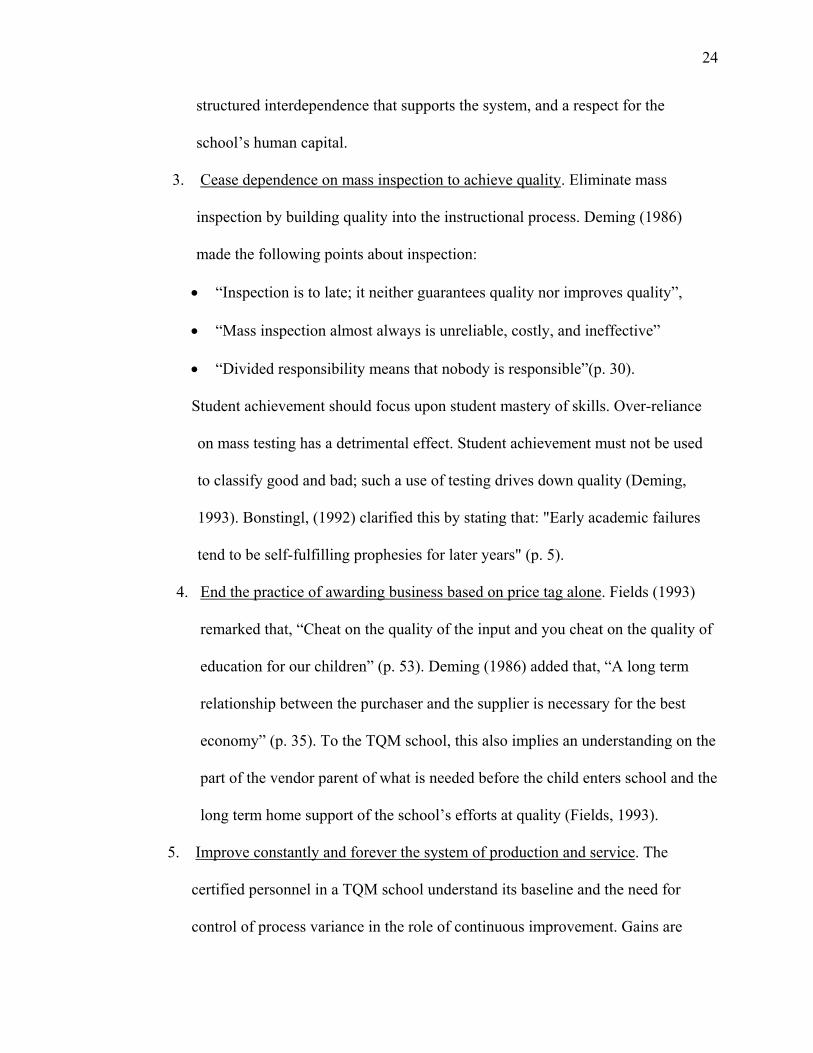
3. Cease dependence on mass inspection to achieve quality. Eliminate mass
inspection by building quality into the instructional process. Deming (1986)
made the following points about inspection:
• “Inspection is to late; it neither guarantees quality nor improves quality”,
• “Mass inspection almost always is unreliable, costly, and ineffective”
• “Divided responsibility means that nobody is responsible”(p. 30).
Student achievement should focus upon student mastery of skills. Over-reliance
on mass testing has a detrimental effect. Student achievement must not be used
to classify good and bad; such a use of testing drives down quality (Deming,
1993). Bonstingl, (1992) clarified this by stating that: "Early academic failures
tend to be self-fulfilling prophesies for later years" (p. 5).
4. End the practice of awarding business based on price tag alone. Fields (1993)
remarked that, “Cheat on the quality of the input and you cheat on the quality of
education for our children” (p. 53). Deming (1986) added that, “A long term
relationship between the purchaser and the supplier is necessary for the best
economy” (p. 35). To the TQM school, this also implies an understanding on the
part of the vendor parent of what is needed before the child enters school and the
long term home support of the school’s efforts at quality (Fields, 1993).
5. Improve constantly and forever the system of production and service. The
certified personnel in a TQM school understand its baseline and the need for
control of process variance in the role of continuous improvement. Gains are
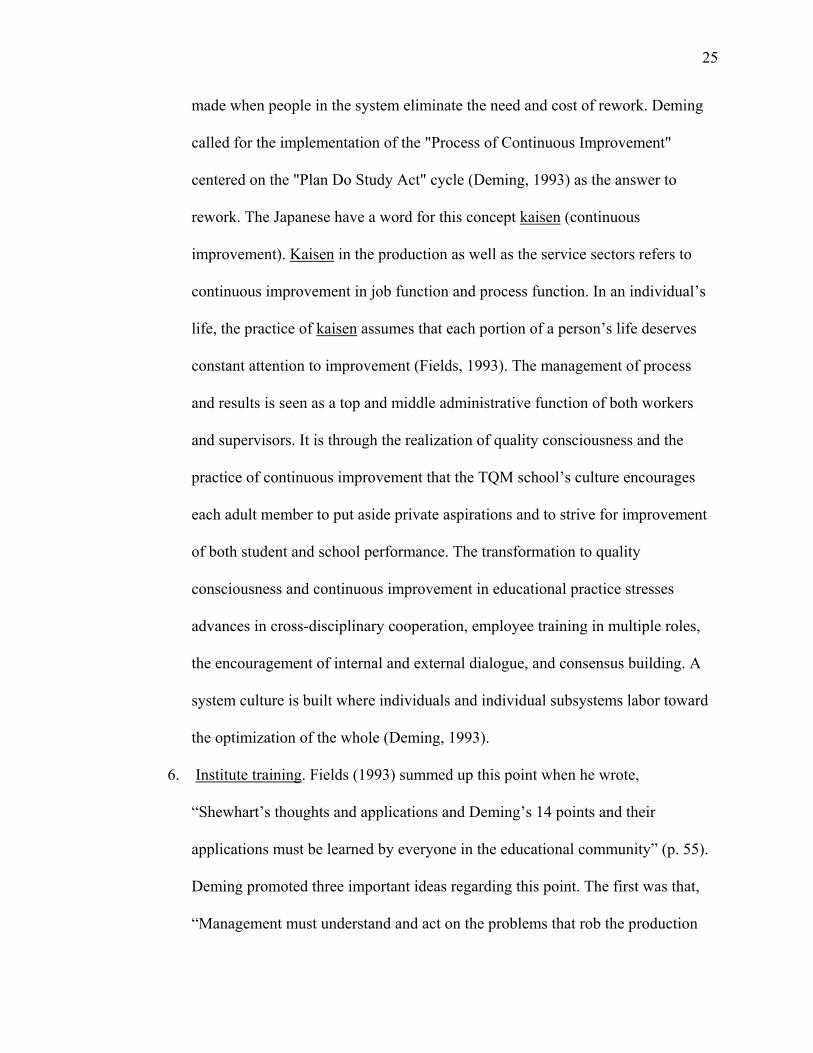
25
made when people in the system eliminate the need and cost of rework. Deming
called for the implementation of the "Process of Continuous Improvement"
centered on the "Plan Do Study Act" cycle (Deming, 1993) as the answer to
rework. The Japanese have a word for this concept kaisen (continuous
improvement). Kaisen in the production as well as the service sectors refers to
continuous improvement in job function and process function. In an individual’s
life, the practice of kaisen assumes that each portion of a person’s life deserves
constant attention to improvement (Fields, 1993). The management of process
and results is seen as a top and middle administrative function of both workers
and supervisors. It is through the realization of quality consciousness and the
practice of continuous improvement that the TQM school’s culture encourages
each adult member to put aside private aspirations and to strive for improvement
of both student and school performance. The transformation to quality
consciousness and continuous improvement in educational practice stresses
advances in cross-disciplinary cooperation, employee training in multiple roles,
the encouragement of internal and external dialogue, and consensus building. A
system culture is built where individuals and individual subsystems labor toward
the optimization of the whole (Deming, 1993).
6. Institute training. Fields (1993) summed up this point when he wrote,
“Shewhart’s thoughts and applications and Deming’s 14 points and their
applications must be learned by everyone in the educational community” (p. 55).
Deming promoted three important ideas regarding this point. The first was that,
“Management must understand and act on the problems that rob the production
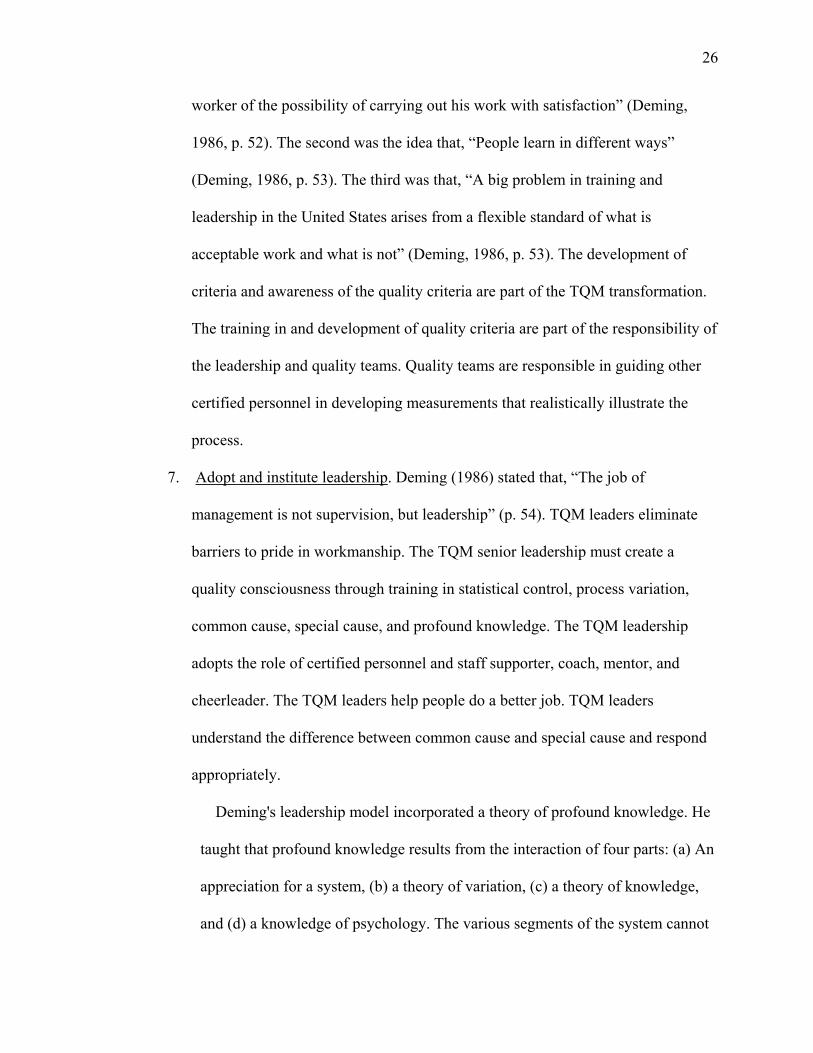
26
worker of the possibility of carrying out his work with satisfaction” (Deming,
1986, p. 52). The second was the idea that, “People learn in different ways”
(Deming, 1986, p. 53). The third was that, “A big problem in training and
leadership in the United States arises from a flexible standard of what is
acceptable work and what is not” (Deming, 1986, p. 53). The development of
criteria and awareness of the quality criteria are part of the TQM transformation.
The training in and development of quality criteria are part of the responsibility of
the leadership and quality teams. Quality teams are responsible in guiding other
certified personnel in developing measurements that realistically illustrate the
process.
7. Adopt and institute leadership. Deming (1986) stated that, “The job of
management is not supervision, but leadership” (p. 54). TQM leaders eliminate
barriers to pride in workmanship. The TQM senior leadership must create a
quality consciousness through training in statistical control, process variation,
common cause, special cause, and profound knowledge. The TQM leadership
adopts the role of certified personnel and staff supporter, coach, mentor, and
cheerleader. The TQM leaders help people do a better job. TQM leaders
understand the difference between common cause and special cause and respond
appropriately.
Deming's leadership model incorporated a theory of profound knowledge. He
taught that profound knowledge results from the interaction of four parts: (a) An
appreciation for a system, (b) a theory of variation, (c) a theory of knowledge,
and (d) a knowledge of psychology. The various segments of the system cannot
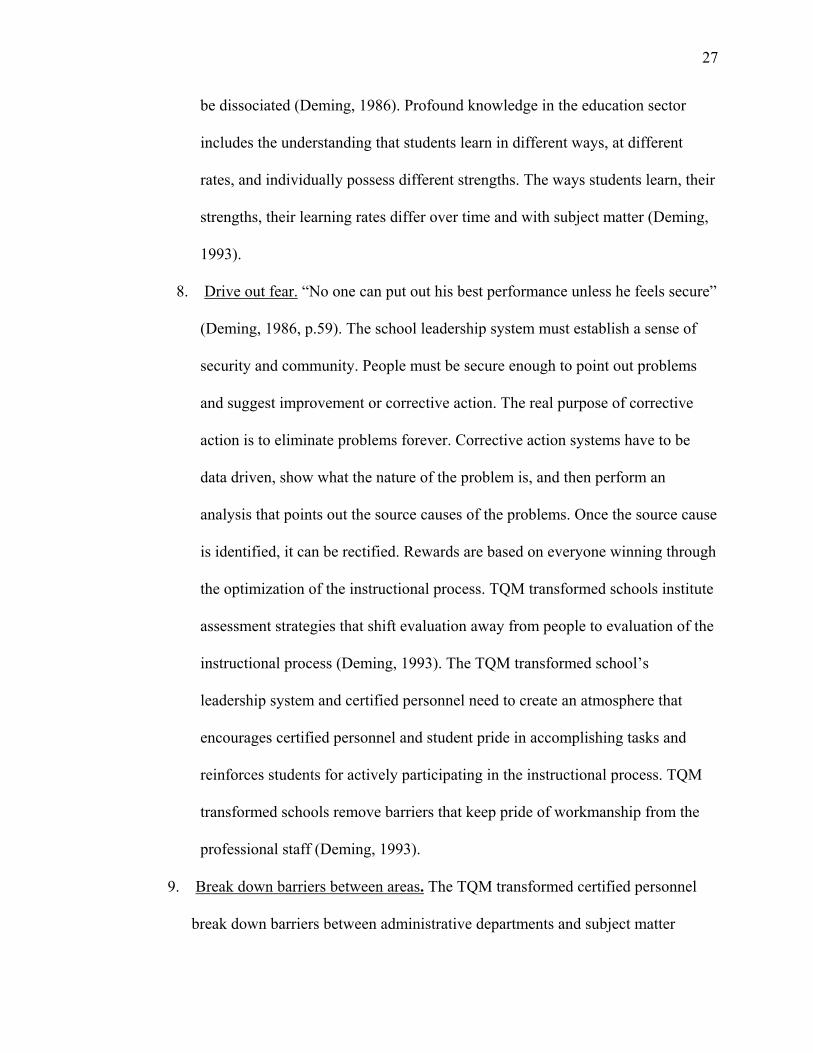
27
be dissociated (Deming, 1986). Profound knowledge in the education sector
includes the understanding that students learn in different ways, at different
rates, and individually possess different strengths. The ways students learn, their
strengths, their learning rates differ over time and with subject matter (Deming,
1993).
8. Drive out fear. “No one can put out his best performance unless he feels secure”
(Deming, 1986, p.59). The school leadership system must establish a sense of
security and community. People must be secure enough to point out problems
and suggest improvement or corrective action. The real purpose of corrective
action is to eliminate problems forever. Corrective action systems have to be
data driven, show what the nature of the problem is, and then perform an
analysis that points out the source causes of the problems. Once the source cause
is identified, it can be rectified. Rewards are based on everyone winning through
the optimization of the instructional process. TQM transformed schools institute
assessment strategies that shift evaluation away from people to evaluation of the
instructional process (Deming, 1993). The TQM transformed school’s
leadership system and certified personnel need to create an atmosphere that
encourages certified personnel and student pride in accomplishing tasks and
reinforces students for actively participating in the instructional process. TQM
transformed schools remove barriers that keep pride of workmanship from the
professional staff (Deming, 1993).
9. Break down barriers between areas. The TQM transformed certified personnel
break down barriers between administrative departments and subject matter
28
disciplines. Competition between departments is counterproductive, time wasting,
and confusion creating; it diverts focus from the students. The TQM school
leadership system organizes interdisciplinary quality improvement teams. The
purpose of the quality improvement team is to advance strategies that deal with
common problems and to optimize the quality of the system. Quality
improvement teams, representing all departments guide the quality process. The
quality improvement team possesses an essential role of building quality
awareness throughout the school (Deming, 1986). The quality improvement team
functions in the education of other certified personnel in quality methods, they
represent the school with external stakeholders. They can commit functions
without having to double check with senior administrators or school level
leadership, and they can clear paths of improvement for faculty and students.
10. Eliminate slogans, exhortations, and targets for the workforce. Eliminate goals
and slogans that pressure quality work without the means to do so from a
commitment to quality. Deming expressed the belief that slogans, exhortations,
and targets set by administrators had a negative effect on performance (Deming,
1986).
11. Eliminate numerical quotas for the workforce and numerical goals for
management. Instructional outcomes and specific instructional strategies possess
meaning only (to certified personnel) when both originate among the faculty and
are supported statistically. The senior administration needs to eliminate quotas
and implement assessment strategies for students to affirm learning and predict
readiness for future instruction and for future advancement. Deming advocated
29
basing advancement of professional staff on criteria such as the demonstration of
cooperative skills, understanding statistical analysis, pursuing new knowledge,
and using skills consistent with system objectives (Deming, 1986).
12. Remove barriers that rob people of pride of workmanship Deming endorsed
eliminating the annual rating or merit system. He looked to the elimination of
barriers created by management. Management’s barriers are: (a) demanding
instant success, (b) placing too much accentuation on the next technological
innovation, (c) insistence that external consultants detail the transformation of the
company's culture, and (d) insistence that other external solutions and successes
can not be duplicated here (Capezio & Morehouse, 1993; Deming, 1986).
Deming explained that leadership’s poor judgment creates barriers to
success. Deming insisted that annual rating systems and merit systems focus on
individual efforts and not group cooperation. By singling out a worker for special
treatment, management diminishes the efforts of everyone else. Such actions
work against efforts at cooperation between workers and departments. In the long
term these actions hinder quality efforts and harm the organization.
13. Institute a vigorous program of education and self-improvement. The overall
process design must include clear learning objectives, and consider the individual
needs of the students. Such a design must contain an effective means for
measuring data. That is, TQM faculties adopt and foster successful behaviors that
encompass skills needed to negotiate, think in the long term, take a global view,
and plan abstractly. TQM leaders invest in the system’s human capital through a
vigorous program of education and life long learning. When the teaching staff
30
improves their profound knowledge, the quality of instruction improves. Through
staff development, the TQM faculty introduces new ideas into the school culture.
14. Put everybody in the company to work to accomplish the transformation.
Reaching the TQM school’s performance requirements depends upon the
focused capabilities of the faculty, a commonly held faculty belief in continuous
improvement, and the skills and the motivation of certified personnel. Part of
answering the need to satisfy stakeholders and public responsibilities is to find
local solutions to the demands for safe quality schools--coupled with steady
improvements in technological systems (Fields, 1993). TQM forces system-wide
choices to be made about which technology to adapt, transfer, or develop. TQM
schools must find solutions that answer an increasing demand for service quality.
Part of the solution fosters the need to reexamine work dynamics (e.g. work
design, communication networks, motivation, leadership, and teamwork). System
cooperation draws certified personnel out of their comfortable modes of thought
and familiar paradigms to form new adult school cultures. Lau and Shani (1992)
noted a link between the way employees think about themselves and the way
people behave; the reverse can also be true. They stated that, ”This
interrelationship can be extended to three areas: (a) cognitive, (b)
communicative, and (c) the behavioral” (p. 430).
The application of TQM to the field of education has produced a set of core values
designed for education. These are expressed in the Malcolm Baldrige National Quality
Award in education. The criteria for this TQM award were developed under the National
Institute of Standards and Technology (NIST) and funded through the Malcolm Baldrige
31
National Quality Improvement Act of 1987-Public Law 100-107. The Malcolm Baldrige
Education Pilot Criteria were introduced in 1995. These core values are emphasized in
this education award:
• Learner-Centered Education--Effective teaching and curriculum that place the focus
on learning and the real needs of the learners.
• Leadership--A school’s senior administrators and leadership teams that take seriously
their crucial role in the development of a student-focused, learning-orientated climate.
• Faculty and Staff Participation and Development--Success depends upon having
meaningful opportunities to develop and practice new knowledge and skills.
• Partnership Development--Schools seek to build internal and external partnerships to
better accomplish their overall goals.
• Design Quality and Prevention--School improvement places powerful emphasis on
effective design of educational programs, curricula, and learning objectives. The
TQM faculty implements continuous quality improvements within the system.
Students learn within the limits of the system. Everyone in a TQM school forms a
learning community that collectively and cooperatively transforms the system.
• Management by Fact--Any effective improvement needs to be based upon cause-
effect thinking utilizing measurement, information, data, and analysis.
• Long Range View of the Future--Long term education improvement based on a belief
that our efforts do influence the future and a willingness to make long term
commitment to the students and to all stakeholders-parents, communities, employers,
faculty, and staff.

32
• Public Responsibility and Citizenship--School’s leadership stresses that the school
has an important role as a model in its operation as a community institution.
• Fast Response--An increasingly important measurement of institutional effectiveness
is fast and flexible response to the needs of its students and stakeholders.
• Result Orientation--A schools performance should focus on results reflecting and
balancing the needs and interests of students and all stakeholders.
(Malcolm Baldrige Award Education Pilot, 1995)
TQM school leaders direct change in the system. Everyone is needed to act to
accomplish the transformation. The school’s certified personnel and staff must believe
that the senior district leadership and the principals are serious about school wide quality.
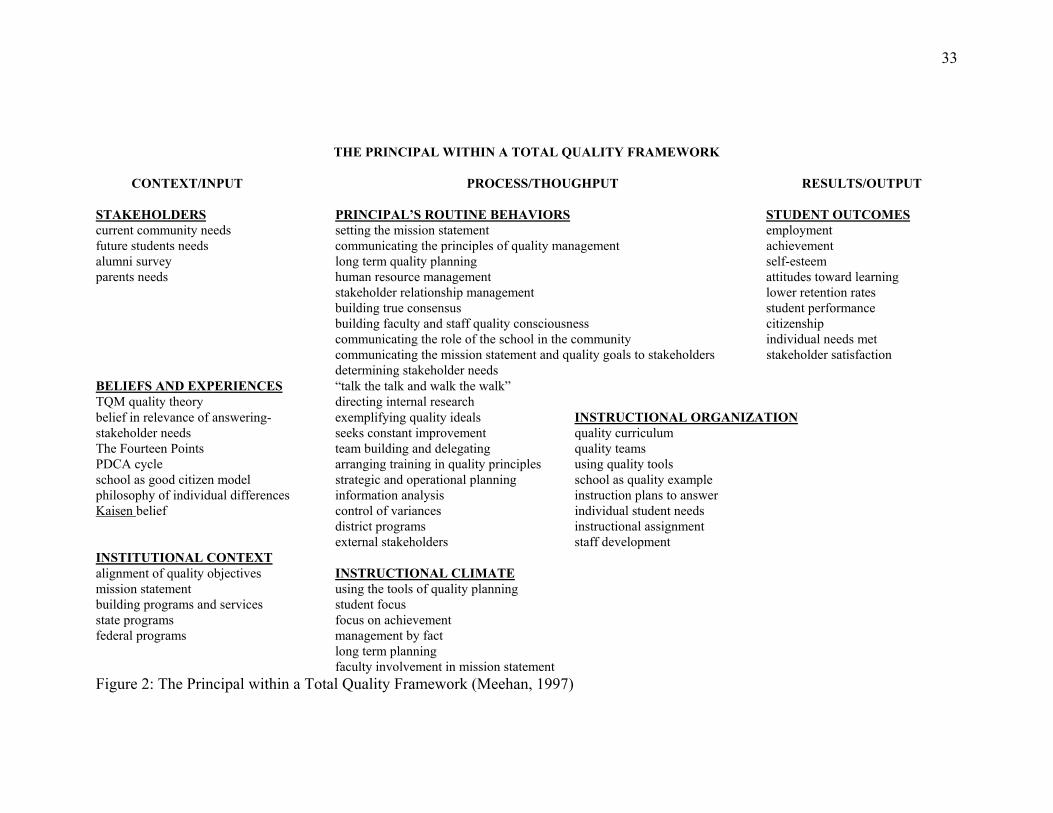
This emphasis on quality and the application of the core values of TQM adds to the
principal’s responsibilities. The principal’s behaviors directly influence the institutional
climate, instructional organization, and the resulting student outcomes. Figure 2 places
adult work culture shapes the learning environment--particularly attitudes core values of
TQM theory into areas of the principal’s responsibilities.
School Cultures and Climate
Since personnel attrition is a possible outcome of a change in a school’s culture and
climate, a review of the literature that focuses on certified personnel, and the influence of
the circumstances under which they work was necessary. Germinario and Ogden (1994)
stated that" the conceptual environment in which certified personnel' work can
distinguish successful from unsuccessful schools" (p. 33). Thus, certified personnel
performance is not a separate issue from the building’s working environment. The adult
33
THE PRINCIPAL WITHIN A TOTAL QUALITY FRAMEWORK
CONTEXT/INPUT PROCESS/THOUGHPUT RESULTS/OUTPUT
STAKEHOLDERS PRINCIPAL’S ROUTINE BEHAVIORS STUDENT OUTCOMEScurrent community needs setting the mission statement employmentfuture students needs communicating the principles of quality management achievementalumni survey long term quality planning self-esteemparents needs human resource management attitudes toward learning
stakeholder relationship management lower retention ratesbuilding true consensus student performancebuilding faculty and staff quality consciousness citizenshipcommunicating the role of the school in the community individual needs metcommunicating the mission statement and quality goals to stakeholders stakeholder satisfactiondetermining stakeholder needs
BELIEFS AND EXPERIENCES “talk the talk and walk the walk”TQM quality theory directing internal researchbelief in relevance of answering- exemplifying quality ideals INSTRUCTIONAL ORGANIZATIONstakeholder needs seeks constant improvement quality curriculumThe Fourteen Points team building and delegating quality teamsPDCA cycle arranging training in quality principles using quality toolsschool as good citizen model strategic and operational planning school as quality examplephilosophy of individual differences information analysis instruction plans to answerKaisen belief control of variances individual student needs
district programs instructional assignmentexternal stakeholders staff development
INSTITUTIONAL CONTEXTalignment of quality objectives INSTRUCTIONAL CLIMATEmission statement using the tools of quality planningbuilding programs and services student focusstate programs focus on achievementfederal programs management by fact
long term planningfaculty involvement in mission statement
Figure 2: The Principal within a Total Quality Framework (Meehan, 1997)
34
ORGANIZATIONAL VITALITYMEASURED BY ADULT WORK ATTITUDES SCHOOL CULTURE AND CLIMATE
Germinario and Ogden
Instructional Leadership Management Instructional Accountability Education ResearchSchool Improvement and Planning
Conventional SchoolsTeaching viewed as an art.
Classroom considered separate mini-schools
Teachers work as isolated units. Moststaff believe that other teachers share
same beliefs about teaching
Conventional SchoolsA major concern of the Principal is
for a safe and orderly school.Good schools have good teachers
eliminate bad teachers
Procedures must be followed, andstandardize everything
Conventional SchoolsEach teacher bears the responsibilityfor learning and school effectiveness.School effectiveness is largely amatter of perception.
Conventional SchoolsResearch is not trusted.
Outside ideas cannot apply here our
situations are unique
Better schools are that way becausethey have better kids and more
resources.
Conventional SchoolsSchools improvement is linked to
increased fiscal resources.Lack of a drive to improve learning
unless in crisis.
Congenial SchoolsPrincipal wants to be liked.
There are frequent staff meetings andefforts made to promote adult
communication and sharedinformation.
Congenial SchoolsThe school is run primarily for the
benefit of the adult workers there is a
strong sense of adult ownership of
the school.
Congenial SchoolsThe effectiveness of the school is a
function of how the adults perceive
their own satisfaction with the
accomplishment of their own goals.
Congenial SchoolsAdult attitudes on research are
similar to the conventional schools;there remains a distrust of outside
research.
Congenial SchoolsAdult attitudes are similar to the
conventional schools; they are opento ideas that make their task easier
Effective Student Outcome-Based
Schools
The adult culture believes thatpurpose of school is student learning.
Principal is the instructional leaderand head team leader
Effective Student Outcome-Based
Schools
Principal concerned with safe andorderly school with common
procedures.Open to sharing information with
parents.
Effective Student Outcome-Based
Schools
The whole staff and school are
accountable for the learning of the
students.
If teachers work smart and hard,enough they can reach every student.
Effective Student Outcome-Based
Schools
The teachers as a group know moreabout student learning then anyindividual. Research is useful
Teachers and principals arecontinuously improving their skills
Effective Student Outcome-Based
Schools
Data concerning outcomes andprocess are continually gathered and
shared with the community.Change takes time and study.
The staff needs a commonvocabulary and set of common
definitions.Outside agencies can help.
Figure 3: Organizational Vitality-School Culture: Measured by Adult Work Attitudes
35
ORGANIZATIONAL VITALITYSCHOOL CULTURE AND CLIMATE; MEASURED BY ADULT WORK ATTITUDES
Instructional Leadership Management InstructionalAccountability
Education ResearchSchool Improvement and
Planning
Conventional SchoolsTextbooks and persons in
authority, includingthemselves are correct
Dependent on authority tomake changes
Knowledge is absolute
Conventional SchoolsPrincipal as authority figurealways correct Authority andcorrectness flows downwards
Very procedure conscious,and everything standardized
Conventional SchoolsTeachers have difficultygenerating alternatives to
problemsInstruction consists of
questions with only one rightanswer
Conventional SchoolsThere is little useful
knowledge outside the school
district.
Leadership approved researchMight be tried as long as itdid not threaten teachers
authority
Difficulty generatingalternatives
Habitual responses tosituations
Often wants authority figuresto make decision
Congenial SchoolsPrincipal interested in being
liked.A people person, so tasks
usually slipAll opinions are equally valid
Congenial SchoolsSome adults negative against
rules, resistant againstauthority
Other adults see how pointsof view relate
Congenial SchoolsSome adults struggling with
other points of viewIdentify Instructional
problems by concentrating onone dimension of the problem
Congenial SchoolsAttitudes toward researchmixed, some teachers can
other points of view and oneto three ideas are generated.Still distrustful of research.
Congenial SchoolsSome adults can see validityin other points of view and
generate a few ideas forimprovement.
Still look for guidance ofauthority
Figure 4: Summary of Germinario, Ogden and Glickman, Schenkat Organizational Vitality
36
work culture reflects the actions/non-actions, attitudes, and interactions of certified
personnel. The towards difficult assignments, patterns of privilege or power, and daily
work attitudes (Germinario & Ogden, 1994). According to Germinario and Ogden
(1994), the interaction of the school's adult culture with students' perceptions of their
environment has significant impact on student achievement.
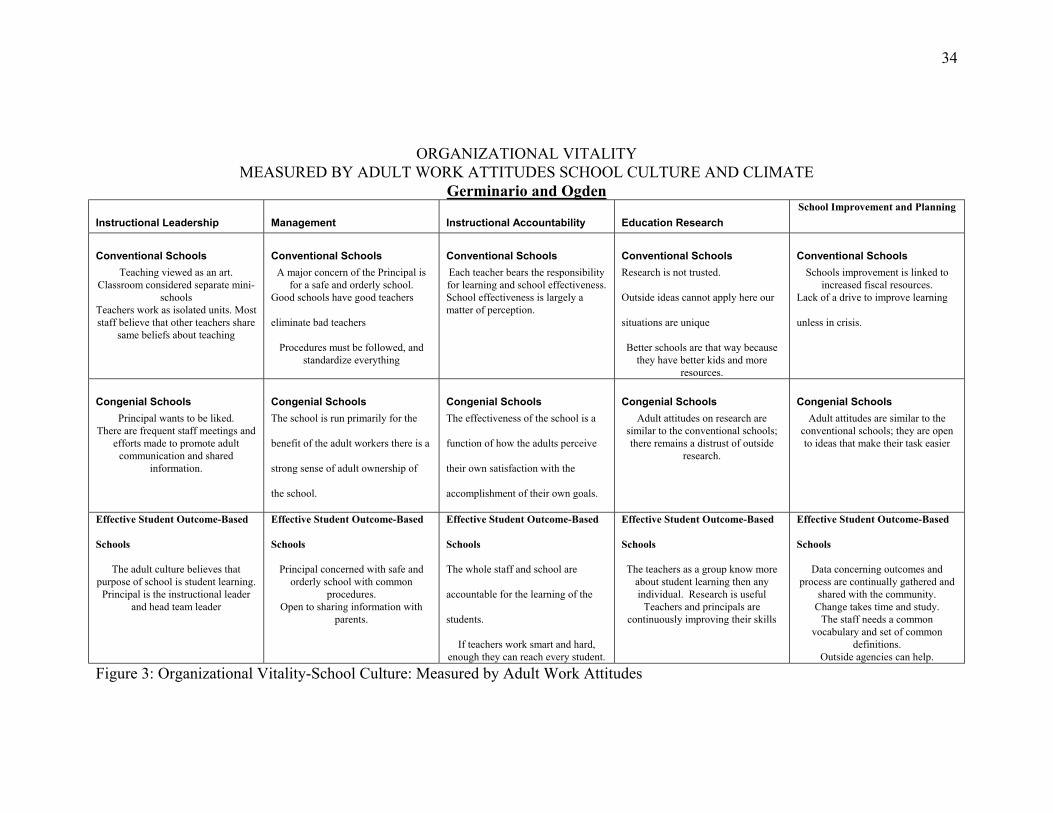
Based on their review of the literature, Germinario and Ogden (1994) constructed a
range of school environments based on school achievement, faculty attitudes, and student
focus. From their studies of the literature, they identified a continuum with three levels of
adult-formed school cultures: (a) Conventional or Collected School, (b) the Congenial
School, and (c) the Effective Student Outcome-Based/Professional/Collegial Knowledge-
Based School. Figure 3 illustrates the continuum of climate and attitudes discerned from
the literature by Germinario and Ogden.
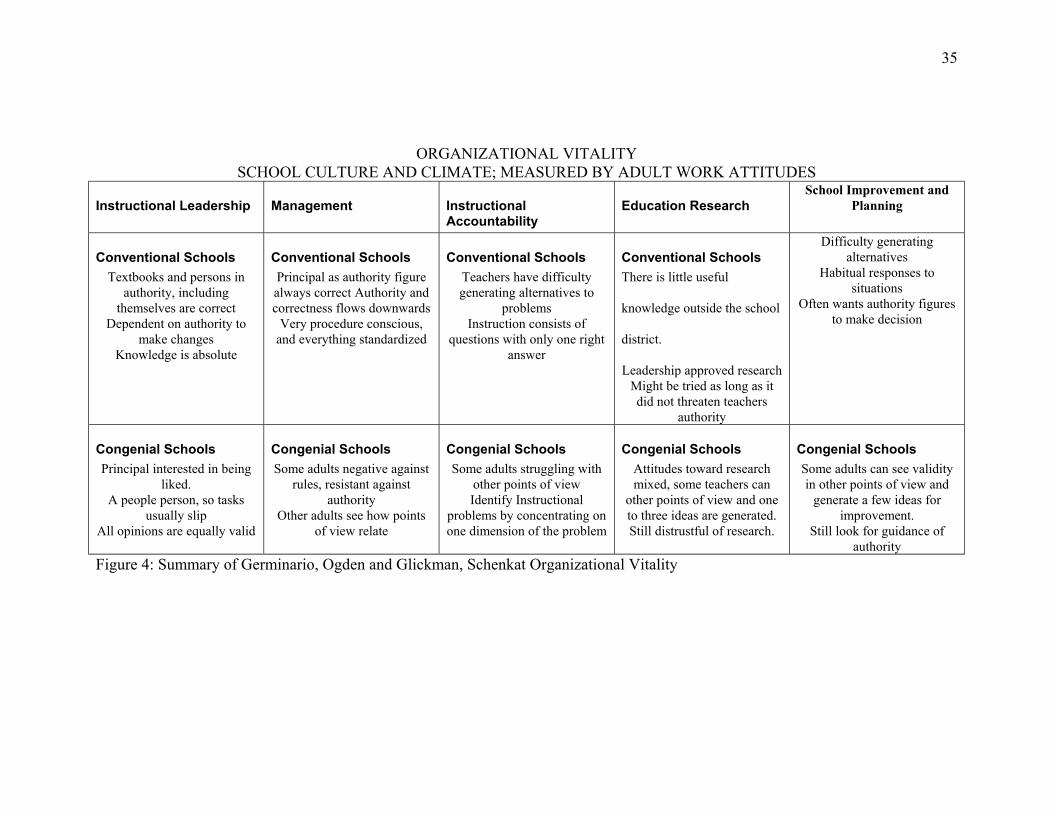
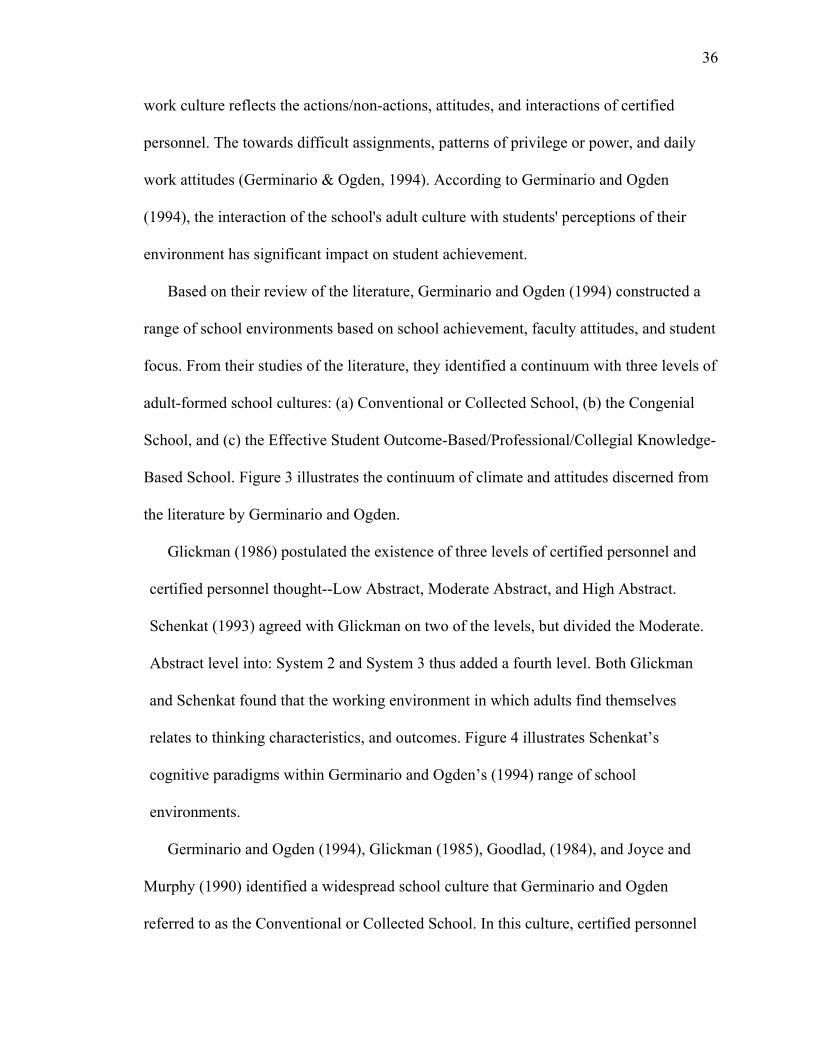
Glickman (1986) postulated the existence of three levels of certified personnel and
certified personnel thought--Low Abstract, Moderate Abstract, and High Abstract.
Schenkat (1993) agreed with Glickman on two of the levels, but divided the Moderate.
Abstract level into: System 2 and System 3 thus added a fourth level. Both Glickman
and Schenkat found that the working environment in which adults find themselves
relates to thinking characteristics, and outcomes. Figure 4 illustrates Schenkat’s
cognitive paradigms within Germinario and Ogden’s (1994) range of school
environments.
Germinario and Ogden (1994), Glickman (1985), Goodlad, (1984), and Joyce and
Murphy (1990) identified a widespread school culture that Germinario and Ogden
referred to as the Conventional or Collected School. In this culture, certified personnel
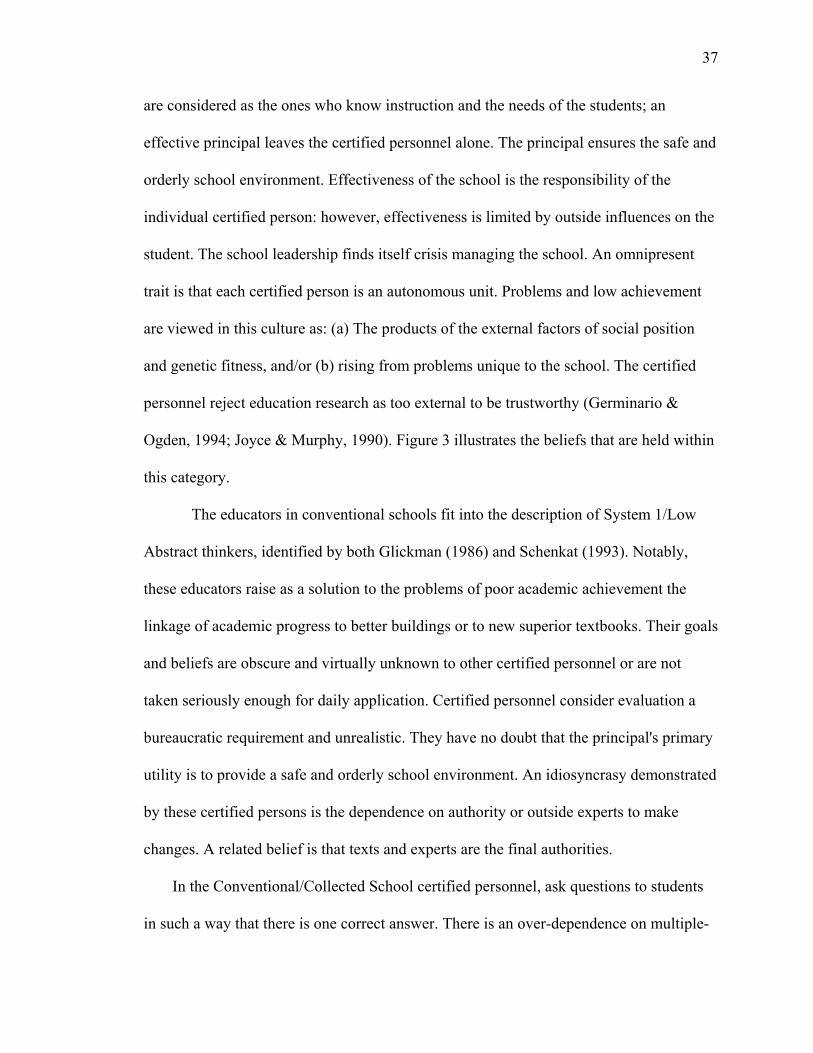
37
are considered as the ones who know instruction and the needs of the students; an
effective principal leaves the certified personnel alone. The principal ensures the safe and
orderly school environment. Effectiveness of the school is the responsibility of the
individual certified person: however, effectiveness is limited by outside influences on the
student. The school leadership finds itself crisis managing the school. An omnipresent
trait is that each certified person is an autonomous unit. Problems and low achievement
are viewed in this culture as: (a) The products of the external factors of social position
and genetic fitness, and/or (b) rising from problems unique to the school. The certified
personnel reject education research as too external to be trustworthy (Germinario &
Ogden, 1994; Joyce & Murphy, 1990). Figure 3 illustrates the beliefs that are held within
this category.
The educators in conventional schools fit into the description of System 1/Low
Abstract thinkers, identified by both Glickman (1986) and Schenkat (1993). Notably,
these educators raise as a solution to the problems of poor academic achievement the
linkage of academic progress to better buildings or to new superior textbooks. Their goals
and beliefs are obscure and virtually unknown to other certified personnel or are not
taken seriously enough for daily application. Certified personnel consider evaluation a
bureaucratic requirement and unrealistic. They have no doubt that the principal's primary
utility is to provide a safe and orderly school environment. An idiosyncrasy demonstrated
by these certified persons is the dependence on authority or outside experts to make
changes. A related belief is that texts and experts are the final authorities.
In the Conventional/Collected School certified personnel, ask questions to students
in such a way that there is one correct answer. There is an over-dependence on multiple-
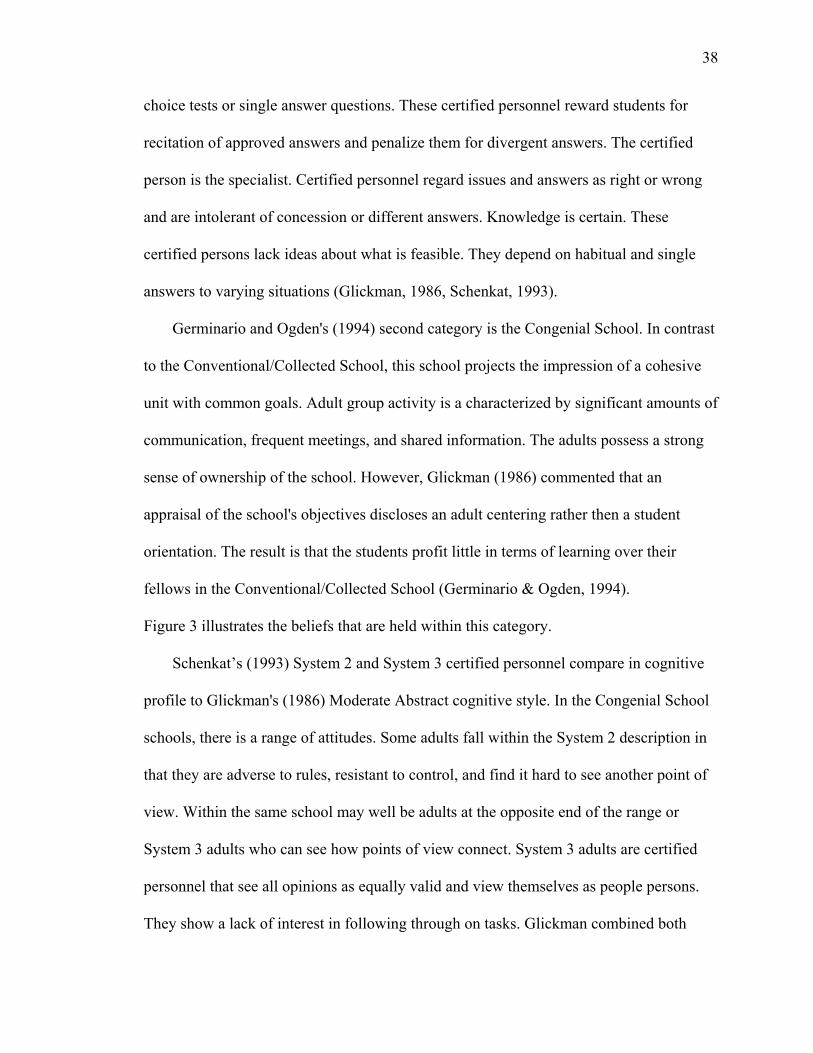
38
choice tests or single answer questions. These certified personnel reward students for
recitation of approved answers and penalize them for divergent answers. The certified
person is the specialist. Certified personnel regard issues and answers as right or wrong
and are intolerant of concession or different answers. Knowledge is certain. These
certified persons lack ideas about what is feasible. They depend on habitual and single
answers to varying situations (Glickman, 1986, Schenkat, 1993).
Germinario and Ogden's (1994) second category is the Congenial School. In contrast
to the Conventional/Collected School, this school projects the impression of a cohesive
unit with common goals. Adult group activity is a characterized by significant amounts of
communication, frequent meetings, and shared information. The adults possess a strong
sense of ownership of the school. However, Glickman (1986) commented that an
appraisal of the school's objectives discloses an adult centering rather then a student
orientation. The result is that the students profit little in terms of learning over their
fellows in the Conventional/Collected School (Germinario & Ogden, 1994).
Figure 3 illustrates the beliefs that are held within this category.
Schenkat’s (1993) System 2 and System 3 certified personnel compare in cognitive
profile to Glickman's (1986) Moderate Abstract cognitive style. In the Congenial School
schools, there is a range of attitudes. Some adults fall within the System 2 description in
that they are adverse to rules, resistant to control, and find it hard to see another point of
view. Within the same school may well be adults at the opposite end of the range or
System 3 adults who can see how points of view connect. System 3 adults are certified
personnel that see all opinions as equally valid and view themselves as people persons.
They show a lack of interest in following through on tasks. Glickman combined both
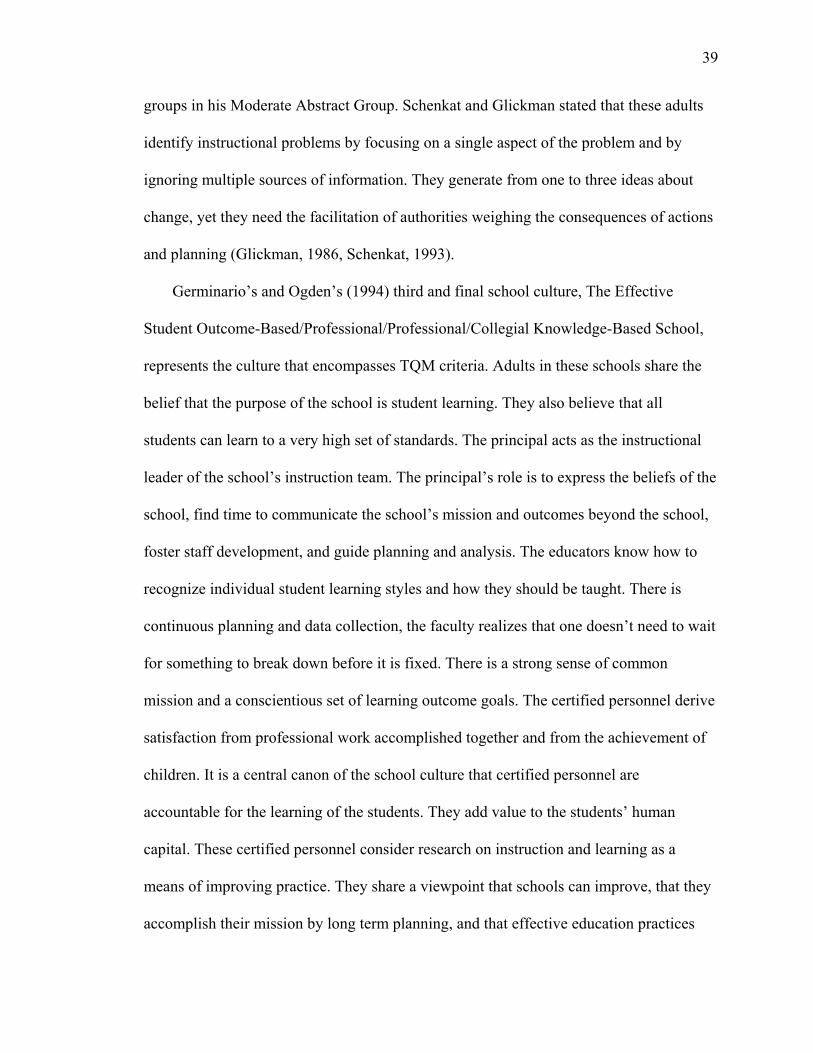
39
groups in his Moderate Abstract Group. Schenkat and Glickman stated that these adults
identify instructional problems by focusing on a single aspect of the problem and by
ignoring multiple sources of information. They generate from one to three ideas about
change, yet they need the facilitation of authorities weighing the consequences of actions
and planning (Glickman, 1986, Schenkat, 1993).
Germinario’s and Ogden’s (1994) third and final school culture, The Effective
Student Outcome-Based/Professional/Professional/Collegial Knowledge-Based School,
represents the culture that encompasses TQM criteria. Adults in these schools share the
belief that the purpose of the school is student learning. They also believe that all
students can learn to a very high set of standards. The principal acts as the instructional
leader of the school’s instruction team. The principal’s role is to express the beliefs of the
school, find time to communicate the school’s mission and outcomes beyond the school,
foster staff development, and guide planning and analysis. The educators know how to
recognize individual student learning styles and how they should be taught. There is
continuous planning and data collection, the faculty realizes that one doesn’t need to wait
for something to break down before it is fixed. There is a strong sense of common
mission and a conscientious set of learning outcome goals. The certified personnel derive
satisfaction from professional work accomplished together and from the achievement of
children. It is a central canon of the school culture that certified personnel are
accountable for the learning of the students. They add value to the students’ human
capital. These certified personnel consider research on instruction and learning as a
means of improving practice. They share a viewpoint that schools can improve, that they
accomplish their mission by long term planning, and that effective education practices
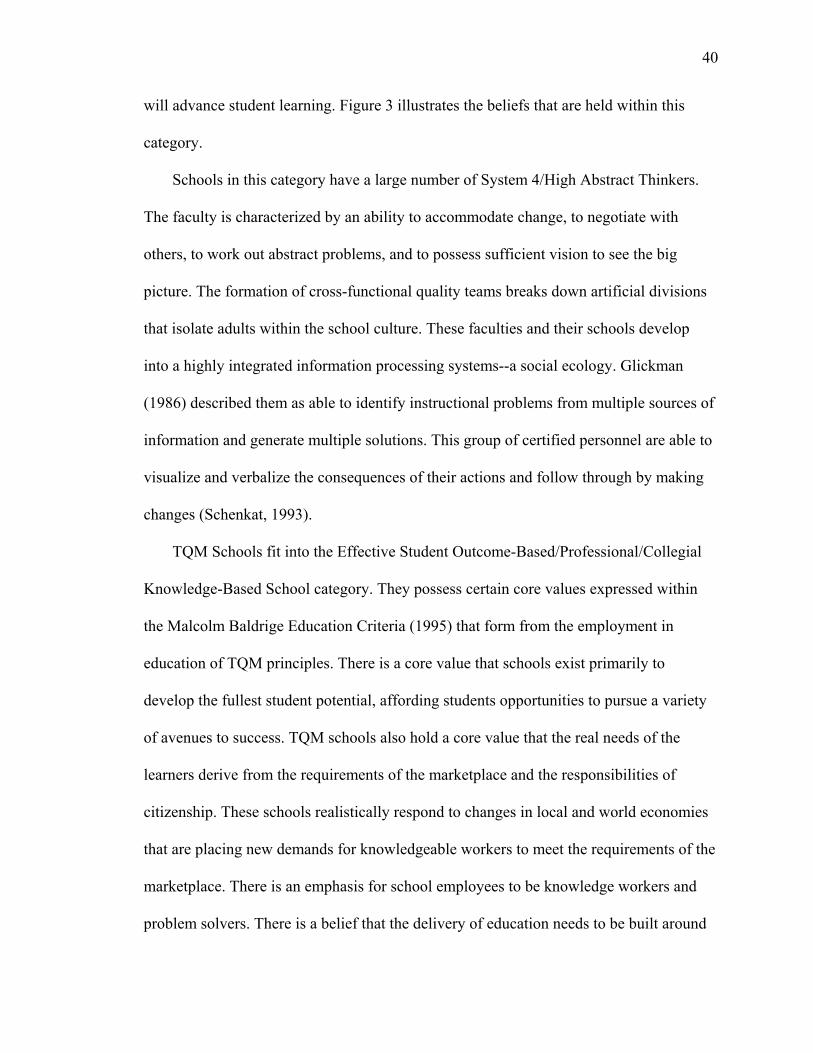
40
will advance student learning. Figure 3 illustrates the beliefs that are held within this
category.
Schools in this category have a large number of System 4/High Abstract Thinkers.
The faculty is characterized by an ability to accommodate change, to negotiate with
others, to work out abstract problems, and to possess sufficient vision to see the big
picture. The formation of cross-functional quality teams breaks down artificial divisions
that isolate adults within the school culture. These faculties and their schools develop
into a highly integrated information processing systems--a social ecology. Glickman
(1986) described them as able to identify instructional problems from multiple sources of
information and generate multiple solutions. This group of certified personnel are able to
visualize and verbalize the consequences of their actions and follow through by making
changes (Schenkat, 1993).
TQM Schools fit into the Effective Student Outcome-Based/Professional/Collegial
Knowledge-Based School category. They possess certain core values expressed within
the Malcolm Baldrige Education Criteria (1995) that form from the employment in
education of TQM principles. There is a core value that schools exist primarily to
develop the fullest student potential, affording students opportunities to pursue a variety
of avenues to success. TQM schools also hold a core value that the real needs of the
learners derive from the requirements of the marketplace and the responsibilities of
citizenship. These schools realistically respond to changes in local and world economies
that are placing new demands for knowledgeable workers to meet the requirements of the
marketplace. There is an emphasis for school employees to be knowledge workers and
problem solvers. There is a belief that the delivery of education needs to be built around
41
gathered data concerning learning effectiveness and student outcomes. Teaching
effectiveness is to be defined in terms of learning effectiveness.
A school district and its principals are using cultural change to build organizational
vitality. The changes within the culture effect adult work attitudes and certified personnel
thinking. Certified personnel are being asked to abandon their old perceptions and grow
more complex in their thinking and actions.
Motivation
When examining changing the adult work culture of a school, motivation is an
important factor in that cultural change. Schools are unlikely to change from a
Conventional or Collected School culture to an Effective Student Outcome-
Based/Professional/Collegial Knowledge Based School culture without significant effort.
Effort is linked with motivation.
Kondo (1990) explained that motivation is a common problem in manufacturing. He
remarked that Maslow linked motivation to a hierarchy of human needs. He outlined
Maslow’s five classes of human needs: (a) Physiological needs, (b) safety needs, (c)
social needs, (d) ego and esteem needs workers setting their own goals, and (e)
leadership's recognition of their work.
Motivated workers produce creative ideas. Within the workplace, needs are met at
lower levels by removal of dissatisfiers and alleviated at higher levels by satisfiers; this
effect confirms the thesis of Maslow and Hertzberg (Kondo, 1990). In order to encourage
creative ideas from certified personnel the leadership must adopt policies and systems
that provide certified personnel, and students with needed satisfiers in their daily work..
42
Kondo (1990) theorized that there is..."an optimum to the quest for quality of
conformance with regard to manufacturing cost" (p. 7). Kondo stated that the optimum
would always fall short of perfection because of the increased costs involved. The
optimum is advanced through the worker’s creative ideas. It is the worker’s breakthrough
ideas that promote product or service conformance and reduce cost. What is needed is to
search for ideas that reduce defects with a minimum cost (Kondo, 1990). Kondo pointed
out that breakthrough thinking occurs before considerable progress in optimization.
Breakthrough thinking is defined as an original approach based on the creative ideas
and strong will of concerned individuals. Breakthrough thinking is a quantum leap in
judgment which is not predictable, nor does it follow clearly evolved paths of logical
development (Kondo, 1990). This type of thinking is motivated by the need to solve a
dilemma. The solution may come from any employee. Kondo stated that: "Quality is
achieved only by the quality consciousness and the keen sense of responsibility in the
mind of the workers" (Kondo, 1990, p. 9).
Education presents a motivation dilemma. How can the leadership provide satisfiers
to both the students and the adult faculty? When a TQM School’s culture is in the
establishment phase this question becomes complex. There are at least two viewpoints
concerned with the development and administration of satisfiers. The first viewpoint
envisions senior leadership controlling the outside satisfiers as a means of achieving
production levels. Trenta (1992) outlined the second viewpoint, that administrators can
overcome resistance to the TQM paradigm by leading dissenters into experiencing
satisfaction in their new work paradigm.
43
Within Education: The Bell Curve Meets Kaizen
When considering moving a school from the culture and climate of a Conventional
or Congenial School to that of an Effective Student Outcome/Professional/Collegial
Knowledge Based School, student success and failure needs to be defined. How schools
determine student success and failure and the effect of either of these on student
motivation is addressed by Deming (1993) and Glasser (1992). Both of them point out
that a problem arises from using a bell-curve to determine student success. The bell curve
has an acceptable zone of failure built into it. Glasser (1992) pointed out that certified
personnel are trained to use the bell (normal) curve as the basis for educational
evaluation. Deming (1993) pointed out that through the acceptance of the bell curve,
schools tacitly build in a rejection rate. Some students are expected to achieve below
group expectations. This acceptance of a rejection rate is counter to key points in TQM:
continuous improvement, control of variance, and meeting the needs of stakeholders. In
TQM transformed schools, certified personnel troubleshoot the process. Their emphasis
is upon correcting flaws in a process. The certified personnel must find the flaws that
hold back the acquisition of knowledge and skills by students and eliminate their
influence. In TQM Schools, students are given remedial and preventive help early in the
process, and the focus is on returning them to the standard.
In manufacturing, gains are made in cost benefits through the control of all factors
leading to unacceptable variances in the product. Manufacturing refers to production
savings as cutting down on rework costs. In education, a measure and visual example of
unacceptable variance of product is the presence of remedial programs. Remedial and
rework costs are incurred to bring students/products into conformance with requirements.
44
Therefore, there is a cost in both the manufacturing and education experience that
increases the closer each gets to total-zero defects.
In the TQM School, there is a fundamental belief that student achievement increases
through faculty effort and control of the costs of variance. The support of certified
personnel is an essential element in the stimulation of curriculum improvements,
instructional improvements, and improvements to the social climate. According to
Steverson, Lee, and Stigler (1986) and Halloway (1988), the belief in effort is one of the
essential reasons for the outstanding record of the Japanese schools. Under TQM, the
quality of education and the responsibility for what the student understands of the
material is placed upon the certified personnel and the whole school's culture. The end
objective is for all students to understand the material well enough to receive an A or A+
or least a B (Glasser, 1992).
Educational Implementation in Practice
Trenta (1992) detailed the first year experiences of employees implementing TQM in
the Akron Public schools. Trenta was the chief personnel officer for the school system
with supervisory responsibility for the Department of Research and Education. He did
not address problems of faculty retention directly. He commented on the resistance to
implementation of TQM that "much of what existed as negative feelings is due to people
acting out to protect themselves or preserve the status quo, then reaction to the redefined
(TQM) and revitalized mission of the system" (p. 4).
Trenta (1992) Reported that under TQM, certified personnel develop through three
levels of experience on their way toward becoming, "ethical Professionals" (Trenta,
1992, p.4). He termed the levels as follows: (a) state of being, (b) process level, and (c)
45
level of action. During the state of being level, employees defined themselves through
their prior experiences. At this level, they had no understanding of the nature of the
proposed changes. Employees moved to the process level by learning to make decisions
using separate knowledge bases. The certified personnel’s knowledge bases were their
individual classroom situation, the school building, the community, and knowledge about
pedagogues, student learning styles, and current education research. In the level of action,
the professional reflected upon his/her professionalism, the unique situation in which an
action must occur, and the current knowledge in the field; only then does he/she decide
and act (Trenta, 1992).
Trenta (1992) stated that to effectively deal with negativism, senior administrators
must provide the faculty with assignments that they can be successful doing. He pointed
out that motivation became a critical issue during the adoption process. "Since stopping
is not possible, we must find ways and time to make people be and feel successful" (p. 4).
Success can be earned only within the context of using the new ways of operating.
Success motivated adults to try new methods and to practice new skills. Adult motivation
must be addressed effectively or the whole TQM process stops.
Brown-Frierson’s Demographic Linkages
One study linked demographics with the attitudes of adapters and resistors
concerning TQM implementation. This study entitled, A Study in Organizational
Change: The Attitudes of Personnel Toward Total Quality Management in a State
Department of Education (Brown-Frierson, 1994), described the impact of TQM on
workers at the headquarters of the Maryland State Department of Education. Her research
hypothesis was as follows:
46
"That there is a significant difference in the means of the twelve categories
and the total score based on (independent variable) as measured by a
survey instrument on Total Quality Management" (Brown-Frierson, 1994,
p. 119).
She found significant mean differences when distinguishing dissenters from adapters
with the demographic variables of education, age, department affiliation, and ethnicity.
Her data allowed her to develop a profile of dissenters.
Brown-Frierson’s (1994) dissertation survey was an analysis of employee attitudes
toward TQM. She surveyed personnel in each division asking their perceptions on twelve
conditions of quality. She matched dissenters with the demographic variables and
division affiliation. She used a correlation matrix to identify differences in attitudes of
employees with her defined twelve conditions of quality excellence that were significant
at p< 01.
Brown-Frierson’s (1994) survey was concerned with the identification of the
following twelve conditions of excellence: (a) Total Quality Requirements, (b) Customer
Orientation, (c) Participation, (d) Development, (e) Motivation, (f) Product and Services,
(g) Processes and Procedures, (h) Information, (i) Suppliers, (j) Culture, (l) Planning, and
(m) Communications and Accountabilities' (Brown-Frierson, 1994). She found that
adapters answering her questions either agreed or strongly agreed with the twelve
conditions of excellence. Dissenters did not strongly disagree as frequently as adapters
strongly agreed.
She defined dissenters as strongly disagreeing or disagreeing with one or more
segments or all the twelve conditions of excellence. The mean response on each of the 33
47
questions was lower for dissenters than for the adapters. The demographic variables
tested were (a) level of education, (b) gender, (c) age, (d) ethnic background, (e) length
of employment or service, and (f) department of employment. She reported no significant
difference in response based on the variables of gender or length of service. Her gathered
data revealed that within the variable of education, the subgroup identified as Some
College Group scored the lowest; therefore, they were dissenters. The subgroup
identified as High School Graduates Group scored the highest mean; they agreed with the
twelve principles of TQM examined. When she analyzed by age, the data suggested that
the subgroup aged 46-52 proved more adaptable then the other age groups; they agreed or
strongly agreed. Brown-Frierson attributed this support to the nearness to retirement. She
stated that the subgroup directly before it, aged 39-45, registered the lowest mean in two
of the twelve conditions of excellence (Brown-Frierson, 1994). She discovered that
ethnicity had significance in the categories of Participation, Development, Motivation,
Information, Culture, and Communication. African-Americans had not adopted six of the
conditions of excellence. Brown-Frierson interpreted this response to be associated with
an African-American viewpoint of not being part of the system (1994).
Different units within the Maryland State Department of Education presented
significant attitudinal preferences. The Division of Certification and Accreditation
registered the highest means in most of the conditions of excellence; they were adapters.
The dissenting divisions were the Divisions of Planning, Division of Results, and the
Division of Information Management which consistently registered the lowest means in
the conditions of excellence; they were dissenters (Brown-Frierson, 1994). In her
implications, she stated that the difference in the division means reflected a difference in
48
the leadership styles between the divisions. Brown-Frierson made three recommendations
based on her research. First, the Maryland State Department of Education should study
its system climate for reasons why dissenters feel as they do. Second, she proposed that
her research results suggested a need for stronger leadership. Third, the Maryland State
Department of Education should benchmark with other state agencies and implement
comprehensive system wide staff development (Brown-Frierson, 1994).
Standardization of the TQM in Education
Since 1991, the American Society for Quality Control (ASQC) annually surveyed
school districts that were members of the American Association of School
Administrator's Total Quality Management Network. Additionally, the ASQC sent state
superintendents of education the survey and past ASQC survey respondents a letter
requesting forwarding of the survey to districts involved in TQM. At the K-12 level the
responses grew from 42 in 1991 to 156 in 1996, but dropped to 107 in 1997, and 102 in
1998. Colleges, universities, and community colleges represented a separate survey
category. These institutions responded that they either offered courses and degree
opportunities or applied TQM principles in running their administrations. By combining
the post-secondary responses and the K-12 survey responses, the total number of
responses were charted (Horine, 1992). Horine, et al., (1993) reported that several states
had taken the initiative to form quality partnerships with school districts. All of these
partnerships were aimed at the use and promotion of quality principles in school
improvement efforts. Two partnerships were singled out by the ASQC for attention were
New Mexico's Strengthening Quality in Schools Project and Minnesota's Partners for
Quality Education Initiative. Horine, Hailey, and Rubach (1993) reported that in 1992 the
49
governor of New York issued the Excelsior Award (a quality in education award modeled
after the Malcolm Baldrige National Quality Award). The state of Massachusetts adopted
elements of TQM under the 1993 Massachusetts Education Reform Act.
Brown (1993) related that the National Institute of Standards and Technology (NIST)
(1987) sponsored the development of the Malcolm Baldrige National Quality Award
(P.L.100-107). The award was created with a three-fold intent:
• to promote awareness of the importance of quality improvement in the national
economy;
• to recognize systems which have substantial improvement in products, services,
and overall competitive performance; and
• to foster sharing of the best practice information among U.S. systems.
(Malcolm Baldrige National Quality Award-Education Pilot Criteria, 1995, p.1)
In 1993, the Malcolm Baldrige Award was extended to education. The criteria and
the terminology of the Malcolm Baldrige Award were standardized to facilitate the
application of TQM in the education sector of the economy. The ASQC oversaw the
Malcolm Baldrige Education Pilot Award Criteria under contract to NIST. The criteria
for the award focused around several TQM core values: demonstrated value-added
performance, clear ties between what is assessed and the mission statement of the school,
a single set of criteria to cover all requirements of specific organization missions,
research on customers’ needs, a primary focus on teaching and learning, efficient
business operations, statistical sampling, control of variation, long term planning, and
relations with suppliers. Each candidate school must demonstrate these TQM core values
in the seven following categories:

50
1. Leadership
2. Information and Analysis
3. Strategic and Operational Planning
4. Human Resource Development and Management
5. Educational and Business Process Management
6. School Performance Results
7. Student Focus and Student and Stakeholder Satisfaction
(Malcolm Baldrige National Quality Award-Education Pilot Criteria, 1995)
Attrition Studies—National Statistics
In the U.S. Department of Education study Characteristics of Stayers, Movers,
and Leavers: Results from the Teacher Follow-up Survey, 1988-89, Bobbit, Faupel, and
Burns, (1991) found that the mean certified personnel attrition rate was 5.6 % in public
schools. They (1991) reported that the rate at which public school certified personnel
leave the profession varied little by field. Science and math teachers, in particular, were
no more likely to leave the teaching profession than certified personnel of general
education subjects such as English, reading, and social studies. They found certified
personnel attrition varied by age. The attrition rate for public school certified personnel
ages 50 or more was 9.8 %; for ages 40 to 49 was 2.9%; for ages 30-39 was 5%, and the
rate for certified personnel below age 30 was 9 %. The total response rate for former
certified personnel was 93.5% and for current certified personnel was 97.4%.
Bobbit, et al. (1991) reported that the percent of public school certified personnel
that left one public school for another during FY '87-'88 and '88-'89 was 92.6% of
leavers. They reported that only 48% of the private school certified personnel in FY '87-

51
'88 transferred to other private schools while 52 % from that group transferred to public
schools. About two-thirds of certified personnel who stayed in the same school during the
school years' 1987-88 and 1988-89 stated that providing higher salaries or better fringe
benefits was the most effective step that schools might take to encourage certified
personnel to remain in teaching (Bobbit, et al., 1991). However, the former public school
certified personnel cited "dissatisfaction with the career" as one of their main reasons for
leaving the profession and 7.3% cited poor salary as their main area of dissatisfaction,
while 26% cited "inadequate support from the administration" (Bobbit, et al., 1991, p.
iii).
Fondelier et al., (1997), for the U.S. Department of Education, National Center
for Education Statistics, published SASS Data for 1994-1995 as the Characteristics of
Stayers, Movers, and Leavers: Results from the Teacher Follow-up Survey: 1994-95.
This report was particularly important to the survey in this study since it covers the
period of time when many of the reported ASQC TQM school districts were being
established. This survey provided a national norm (comparison group) compiled during
the period when school districts were reporting their progress at implementation of TQM
to the ASQC 1995.
The report stated that six percent of full-time public school certified personnel
during 1993-94 left teaching before the 1994-95 school year. This rate was higher then
the reported rates between 1987-88 and 1988-89 school years. For most of the public
school leavers during 1993-94 and 1994-95, the reason was retirement. During this
period thirty percent of the leavers retired. The attrition rate was higher among older
certified personnel (those aged 60 and older) and among those aged 25-29 it was ten
52
percent (U.S. Department of Education, National Center for Education Statistics, Teacher
Follow-up Survey, 1988-89, 1991-92, and 1994-95 (1997) The Condition of Education
1997, Indicator 58 page 1-3).
Summary
The ideas that comprise TQM have entered the American lexicon. The term quality
has become a fixture of advertising, education, and business names. The Deming phrase
to “walk the talk” has made it into the American business lexicon. Ideas including
quality, customer driven design, quality of design, benchmarking, Just In Time (JIT),
abstraction, systems thinking, experimental inquiry, and collaboration, while not
exclusive to TQM, are parts of the umbrella of ideas that comprise TQM. In our high-
volume, high-value production, and global economy, TQM stands out as the paradigm
that brought about the Japanese miracle of 1970’s-1980’s market dominance. TQM has
not become the dominant management practice in America.
Germinario and Ogden (1994) projected the existence of a continuum of three
dominant school cultures: the Conventional/Collegial, the Congenial, and the Effective.
These three cultures are distinct because of dominant certified personnel and certified
personnel work paradigms. Each adult culture influences student outcomes. Glickman
(1986) and Schenkat (1993) found the same adult work paradigms when they described
and ranked certified personnel according to their cognitive levels. The findings of Ogden
and Germinario together with Glickman and Schenkat support the systems idea that a
culture of a school influences the perceptions of involved individuals.
When a school redefines itself and establishes a new culture, adults need to redefine
themselves and their concepts or leave. TQM represents this circumstance of redefining
53
system behaviors and employee behaviors. Employees seeking internal consistency with
the past are likely to leave.
The literature suggests two areas that directly effect the faculty involved within the
TQM paradigm. The first is that the consumer drives product design; and the second is
that a quality instructional leadership paradigm vigorously promotes a commitment to the
continuing improvement of educational quality. The result is that from the certified
personnel to the custodian there is greater worker empowerment and responsibility for
the quality of the product. The empowerment of the teacher or production worker over
the process represents one function of the paradigm. There is also a strong emphasis in
TQM toward research, design, development, sourcing, and marketing of the product.
It is clear from the literature that certain themes are repeated and are well supported.
The quality instructional leadership paradigm is enhanced with modern business theory
and technologies. Lau and Shani (1992) stated that managers could use social technology,
learning approaches, methods, and techniques to enhance their effectiveness. They
divided social technology by the subheadings of individual and teams (small group, inter-
group, and system wide groupings). Their list of examples agreed with points emphasized
in TQM. They agreed that leadership must possess communication skills, engage in
coaching, encourage private growth, set goals, and recognize creativity. Both groups
emphasize team building, inter-team communications, and job swapping to learn job
roles, group empowerment, group problem solving, group decision-making, and group
goal setting. TQM emphasizes team quality control with each member of a team
understanding statistical processes. Lau and Shani (1992) stated that not everyone in
business agrees on the same limits to worker empowerment. In TQM, workers possess a
54
high level of control over the work they are responsible for along with a voice in design
and internal production requirements. TQM and modern business research advocate the
use of subordinate goal setting, inter-group comments, benchmarking, and inter-group
contacts. Both groups emphasize continuing system improvement, socio-technical
systems, internal instruction, surveys, data comments, and goal setting throughout the
system.
55
CHAPTER 3
METHODOLOGY
Overview
The researcher gathered data on attrition rates following the initial institution of
TQM and correlated the reported rates with known attrition rates during the period under
study. Data was also gathered on the demographic characteristics of the leavers and
correlated with known data on attrition. The attrition data was recorded at the site or
available in the district personnel office.
The researcher constructed a survey instrument designed to probe changes in the
attrition rate of certified personnel within six descriptive categories. Items on the survey
instrument correspond to categories and questions used in a series of U.S. Department of
Education studies on teacher attrition conducted during the period of initial institution of
TQM in the surveyed schools.
Research Design
This study is a quantitative, descriptive study, which compared data gathered
nationally on teacher attrition as a baseline for comparison to attrition in schools
implementing TQM. This study was designed to follow up on similar research done by
Brown-Frierson. The survey was designed to be consistent with the U.S. Department of
Education, National Center for Education Statistics studies and their follow-up surveys
56
that appeared as Characteristics of Stayers, Movers, and Leavers: Results from the
Follow-up Survey: (1987-88 to 1988-89), (1993-94 to 1994-95).
Campbell and Stanley (1963) reported that a time-series design might be
employed to measure the effects of a major change in administrative policy. Policy
decisions infrequently reveal the direct effects, indirect effects, nor the cumulative
effects to the observer until the element of effect over time is studied. The time series
design considers this. Moreover, “ the design is especially suited to institutional settings
in which records are continually kept and thus compose an accustomed part of the
environment” (p.41). Such a design possesses a relatively high degree of reliability
since there exists a set of conditions that makes this certain.
The Survey Development
Clearly, the more certain the nature of the data being sought and the better the
respondent knows that information, the more reliable the reported information should be.
The information that was sought for this survey is fixed. It will not change nor is it
subject to observer errors.
A researcher looking at teacher attrition would be interested in the demographic
variables of age, sex, number of years experience, highest degree held, ethnicity, and
teaching level taught. Sex was rejected for use as a variable because the only other study
in this area and type, the Brown-Frierson (1994) study found sex to be of no
consequence.
The data variables for the leaving teachers were the same as those reported by the
U.S. Department of Education survey: the year of leaving, the teacher’s age, the highest
57
degree held, the teacher’s ethnic group, the teacher’s grade level, and the teacher’s years
of experience (Appendix B, p. 102).
The U.S. Department of Education tracks attrition among the national teaching
force through six-year surveys. The period on which this study is focused was from the
late 1980s through 1990s. The rational for presenting the decade span was to check the
results of the surveys for wide variances.
The survey also collected data as to when personnel left, in the first, second or
third year of TQM implementation. The first question that the survey addresses is that of
teaching level taught. Each principal’s survey was numbered so that the school and its
level could be identified. This along with the figure of how many teachers and
administrators taught at the school allowed the researcher to calculate percentages of
stayers versus leavers.
Reliability and Validity
The basis for evaluating the reliability of an instrument comes from the
identification and control of the factors that diminish the reliability of the instrument.
According to Fox (1969) there are five factors, if not present negatively effect the
reliability of a study. Factor 1 is the certainty of the information being sought. Factor 2 is
the stability of the dynamic over time. Factor 3 is the researchers understanding of the
dynamic being studied. Factor 4 is the current ability of the investigator to translate that
dynamic into instrument form. Factor 5 are chance factors (Fox, 1969).
Fox’s first condition is that the investigator is seeking relatively defined objective
material that respondents possess in files. The second is that the information is stable
58
over time. The survey accomplished these two factors needed in reliability. In the survey,
the information is fixed and unchanging and the respondent is in a position to know.
The third and fourth of Fox’s (1969) factors for reliability deal with
understanding the dynamic being measured. The use of TQM in education is not a
regional or localized occurrence. It has been used in business for 70 years; it is an
internationally and nationally recognized management technique. When TQM crossed
over into education, it became an agent of change on a national education level. The
schools and school districts surveyed were in all regions of the country. The data used to
compare attrition rated must be national. The period on which this study was focused was
from the late 1980s through the 1990s.
Fox’s fifth factor (1969) is the recognition and control of chance factors. A design
problem springs from the external history variable that might have skewed results. This
study controls the external history variable through the means of geographic distribution
and group size. The researcher sampled public schools and public school districts in
United States. The survey validly measures select quantitative indices. Campbell and
Stanley’s conditions agree with Fox’s factors. Therefore, this survey’s reliability and
validity regarding public school attrition rates is high.
The Sample
A difficulty in measuring the impact of TQM on the attrition of certified
personnel is locating TQM schools. The researcher selected and surveyed principals in
public school districts that the American Society for Quality Control (ASQC) reported as
using TQM in their K-12 Quality Education Listings (1992 through 1998). The list's
sponsor was the National Aeronautics and Space Administration (NASA). The American
Society for Quality Control (ASQC) listed qualified schools in its monthly magazine
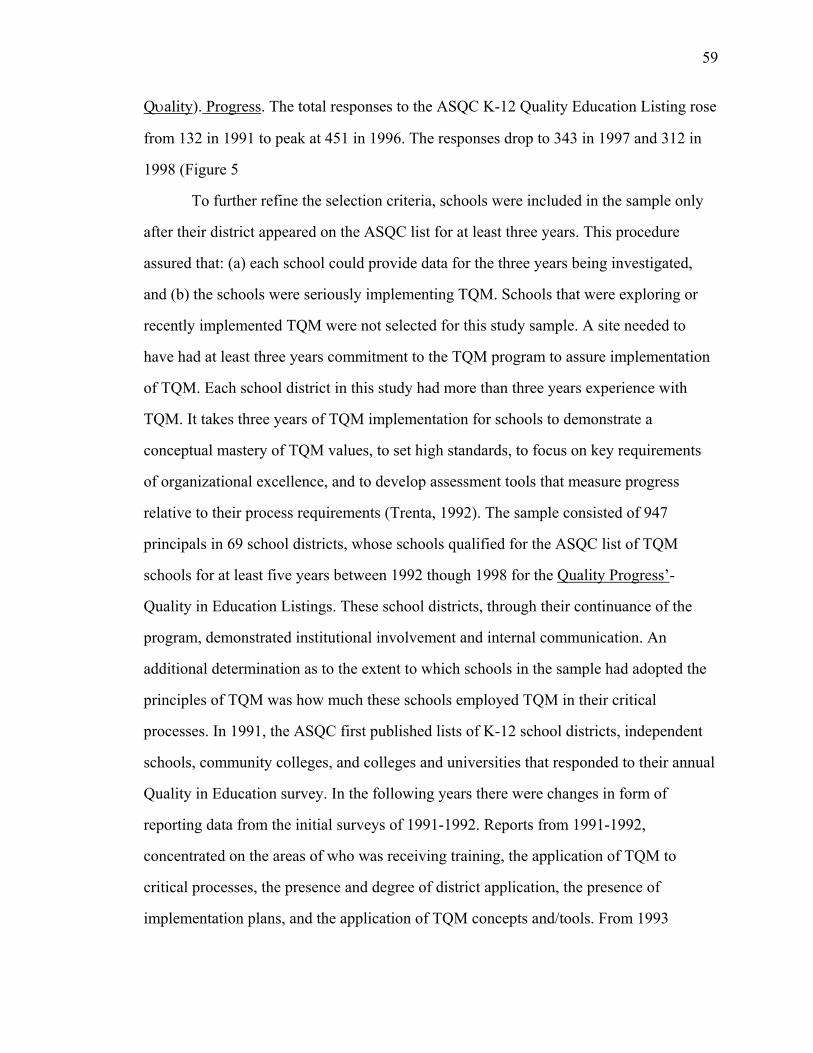
59
Qυality). Progress. The total responses to the ASQC K-12 Quality Education Listing rose
from 132 in 1991 to peak at 451 in 1996. The responses drop to 343 in 1997 and 312 in
1998 (Figure 5
To further refine the selection criteria, schools were included in the sample only
after their district appeared on the ASQC list for at least three years. This procedure
assured that: (a) each school could provide data for the three years being investigated,
and (b) the schools were seriously implementing TQM. Schools that were exploring or
recently implemented TQM were not selected for this study sample. A site needed to
have had at least three years commitment to the TQM program to assure implementation
of TQM. Each school district in this study had more than three years experience with
TQM. It takes three years of TQM implementation for schools to demonstrate a
conceptual mastery of TQM values, to set high standards, to focus on key requirements
of organizational excellence, and to develop assessment tools that measure progress
relative to their process requirements (Trenta, 1992). The sample consisted of 947
principals in 69 school districts, whose schools qualified for the ASQC list of TQM
schools for at least five years between 1992 though 1998 for the Quality Progress’-
Quality in Education Listings. These school districts, through their continuance of the
program, demonstrated institutional involvement and internal communication. An
additional determination as to the extent to which schools in the sample had adopted the
principles of TQM was how much these schools employed TQM in their critical
processes. In 1991, the ASQC first published lists of K-12 school districts, independent
schools, community colleges, and colleges and universities that responded to their annual
Quality in Education survey. In the following years there were changes in form of
reporting data from the initial surveys of 1991-1992. Reports from 1991-1992,
concentrated on the areas of who was receiving training, the application of TQM to
critical processes, the presence and degree of district application, the presence of
implementation plans, and the application of TQM concepts and/tools. From 1993
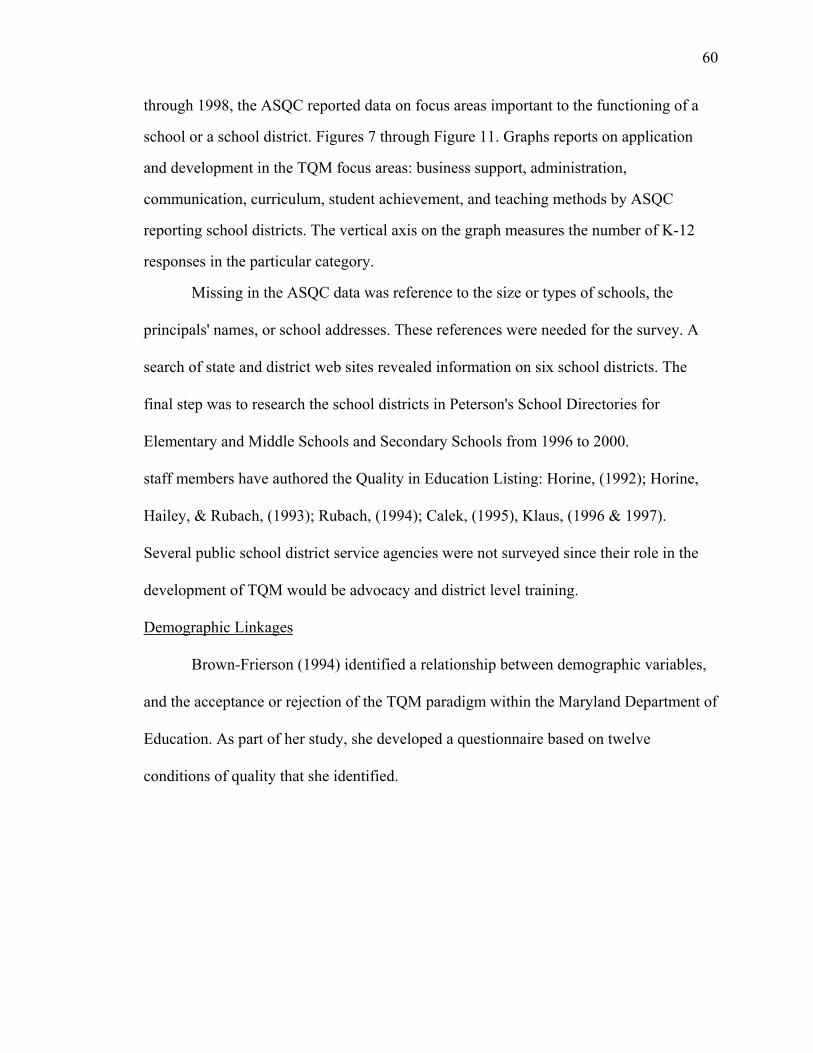
60
through 1998, the ASQC reported data on focus areas important to the functioning of a
school or a school district. Figures 7 through Figure 11. Graphs reports on application
and development in the TQM focus areas: business support, administration,
communication, curriculum, student achievement, and teaching methods by ASQC
reporting school districts. The vertical axis on the graph measures the number of K-12
responses in the particular category.
Missing in the ASQC data was reference to the size or types of schools, the
principals' names, or school addresses. These references were needed for the survey. A
search of state and district web sites revealed information on six school districts. The
final step was to research the school districts in Peterson's School Directories for
Elementary and Middle Schools and Secondary Schools from 1996 to 2000.
staff members have authored the Quality in Education Listing: Horine, (1992); Horine,
Hailey, & Rubach, (1993); Rubach, (1994); Calek, (1995), Klaus, (1996 & 1997).
Several public school district service agencies were not surveyed since their role in the
development of TQM would be advocacy and district level training.
Demographic Linkages
Brown-Frierson (1994) identified a relationship between demographic variables,
and the acceptance or rejection of the TQM paradigm within the Maryland Department of
Education. As part of her study, she developed a questionnaire based on twelve
conditions of quality that she identified.
61
ASQC SURVEY RESPONSES
Responses
Years
0
20
40
60
80
100
120
140
160
1991 1992 1993 1994 1995 1996 1997 1998
Figure 5 The ASQC survey response reports published in (Quality Progress from 1991-1998)

62
K-12 Responces
0
20
40
60
80
1993 1994 1995 1996 1997 1998
Figure 6. The focus area of business support
K-12 Responces
0
20
40
60
80
100
1992 1993 1994 1995 1996 1997 1998
Figure 7. The focus area administrative practice
63
K-12 Responces
0
20
40
60
80
1993 1994 1995 1996 1997 1998
Figure 8. The focus area communication
K-12 Responces
0
20
40
60
80
100
1992 1993 1994 1995 1996 1997 1998
Figure 9. The focus area of curriculum
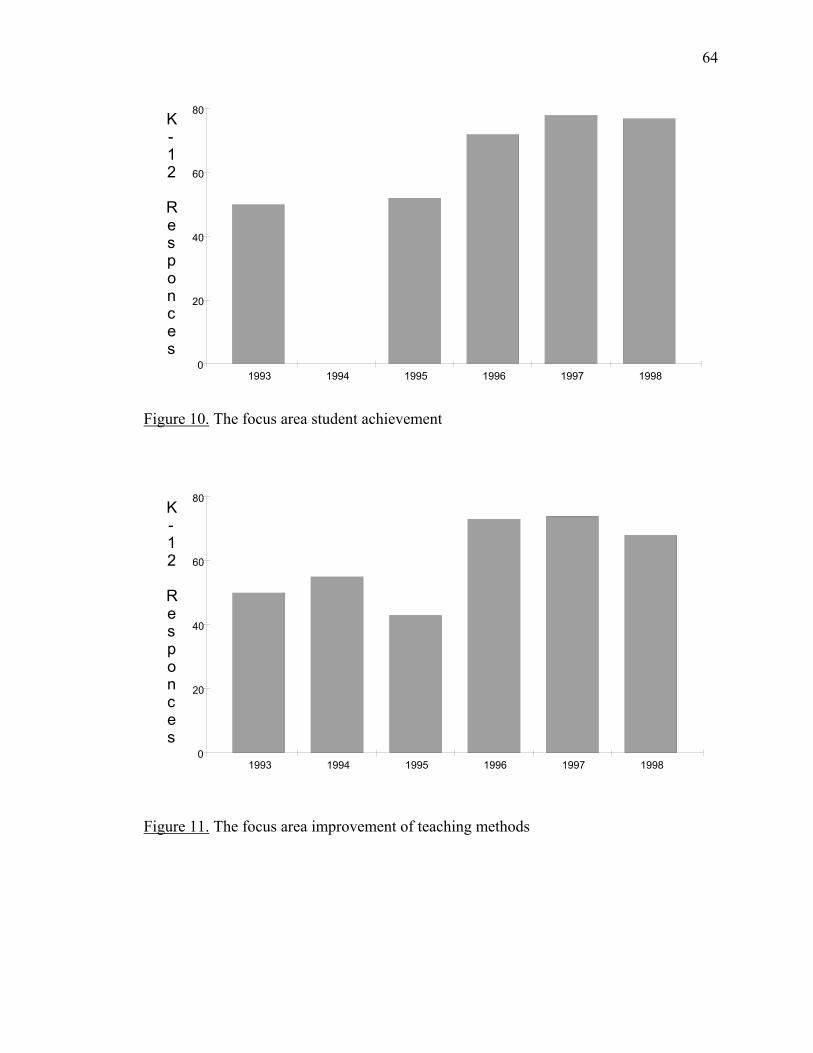
64
K-12 Responces
0
20
40
60
80
1993 1994 1995 1996 1997 1998
Figure 10. The focus area student achievement
K-12 Responces
0
20
40
60
80
1993 1994 1995 1996 1997 1998
Figure 11. The focus area improvement of teaching methods
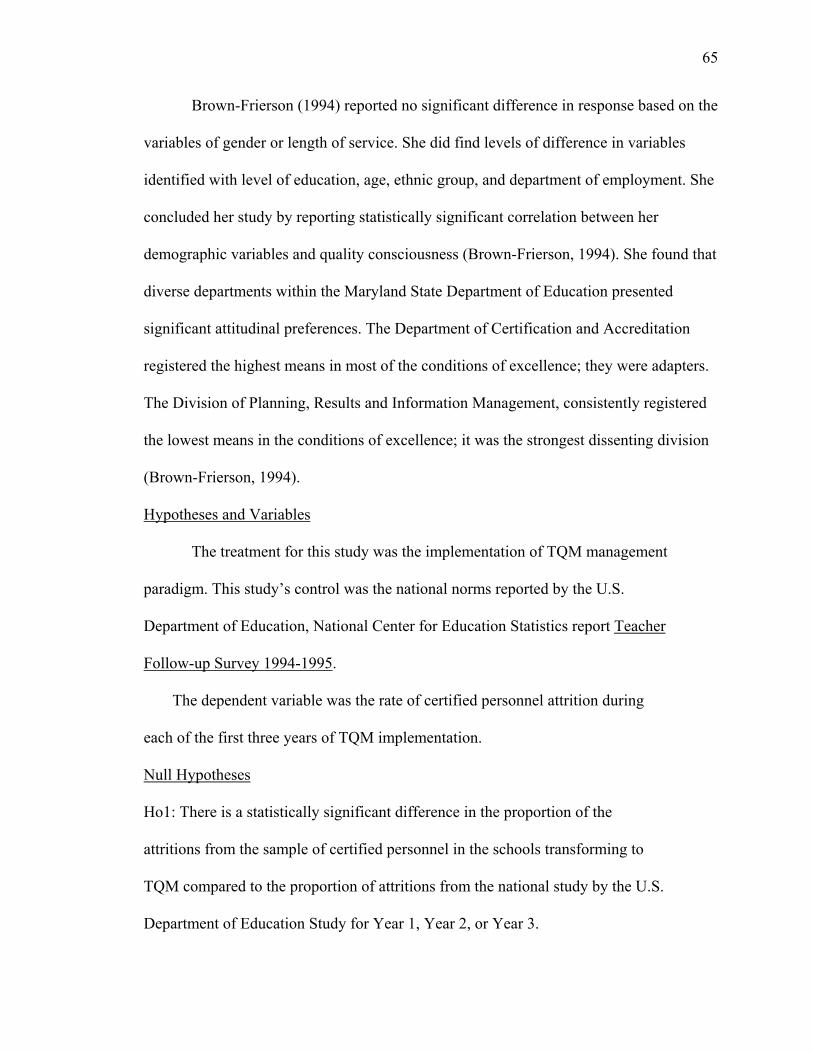
65
Brown-Frierson (1994) reported no significant difference in response based on the
variables of gender or length of service. She did find levels of difference in variables
identified with level of education, age, ethnic group, and department of employment. She
concluded her study by reporting statistically significant correlation between her
demographic variables and quality consciousness (Brown-Frierson, 1994). She found that
diverse departments within the Maryland State Department of Education presented
significant attitudinal preferences. The Department of Certification and Accreditation
registered the highest means in most of the conditions of excellence; they were adapters.
The Division of Planning, Results and Information Management, consistently registered
the lowest means in the conditions of excellence; it was the strongest dissenting division
(Brown-Frierson, 1994).
Hypotheses and Variables
The treatment for this study was the implementation of TQM management
paradigm. This study’s control was the national norms reported by the U.S.
Department of Education, National Center for Education Statistics report Teacher
Follow-up Survey 1994-1995.
The dependent variable was the rate of certified personnel attrition during
each of the first three years of TQM implementation.
Null Hypotheses
Ho1: There is a statistically significant difference in the proportion of the
attritions from the sample of certified personnel in the schools transforming to
TQM compared to the proportion of attritions from the national study by the U.S.
Department of Education Study for Year 1, Year 2, or Year 3.
66
To respond to the research hypothesis the following seven null hypotheses were
developed: The hypotheses concerned characteristics of the leaving certified personnel
and the rates of attrition for each of the independent demographic variables—level
taught, chronological age, highest degrees held, race/ethnicity, and full-time teaching
experience are as follows.
Ho2a: There is no statistically significant difference in the proportion of the number of
attritions from the sample of certified personnel in schools transforming to TQM
compared to the proportion of attritions from the national study by the U.S. Department
of Education for year 1, year 2, or year 3 for elementary schools.
Ho2ab: There is no statistically significant difference in the proportion of the number of
attritions from the sample of certified personnel in schools transforming to TQM
compared to the proportion of attritions from the national study by the U.S. Department
of Education for year 1, year 2, or year 3 for secondary schools.
Ho2b: There is no statistically significant difference in the proportion of the number of
attritions from the sample of certified personnel in schools transforming to TQM
compared to the proportion of attritions from the national study by the U.S. Department
of Education for year 1, year 2, or year 3 for the category chronological age.
Ho2c: There is no statistically significant difference in the proportion of the number of
attritions from the sample of certified personnel in schools transforming to TQM
compared to the proportion of attritions from the national study by the U.S. Department
of Education for year 1, year 2, or year 3 for the category highest degree held.
Ho2d: There is no statistically significant difference in the proportion of attritions
from the sample of certified personnel in schools transforming to TQM compared
67
to the proportion of attritions projected from the national study by the U.S.
Department of Education for Year 1, Year 2, or Year 3 for the category ethnicity.
Ho2e: There is no statistically significant difference in the proportion of attritions
from the sample of certified personnel in schools transforming to TQM compared
to the proportion of attritions projected from the national study by the U.S.
Department of Education for Year 1, Year 2, or Year 3 for the category years of
experience.
Procedures
Over the eight years of the lists, there were 291 different United States public
schools and public school districts mentioned--each state was represented. The researcher
paired down the lists to 69 public school districts and public schools based on their
consistent appearance on the list for four or more years that demonstrated vitality in those
programs. These 69 public school districts and public schools were scattered among 16
states. There were four states from the North East; four from the South East; four from
the North Central States; three from the South Central States; one from the South West;
and two from the West Coast; therefore, national representation was possible.
Of the 69 school districts in the ASQC’s list of Quality School Districts over half
were either state capitals or cities clearly identifiable with corporate home offices: for
example Sacramento, California; Albany, New York; Oskosh, Wisconsin; Battle Creek,
Michigan; and Yamouth, Maine. This distribution strongly suggests a link existed
between business sponsorship and the implementation of TQM.
The study group consisted of a group of 941 principals belonging to 69 public
school districts and one public school. These school districts varied in size from the
68
Sacramento District with 116 schools to two or three schools in a district. To prevent
large schools from skewing the results these practices were adopted:
The study group was arranged into a list without regard to geographic region.
1. In districts of more then 99 schools, every tenth principal was surveyed.
2. In districts of more then 45 schools, but less then 99, every fifth. principal
was surveyed.
3. In districts of more then 18 schools, but less then 45, every third principal
was surveyed.
4. In districts of more then 2 schools, but less then 18, every second principal
was surveyed.
5. When a single school was involved, the principal was surveyed.
The investigator continued the count from district to district, adjusting only to the
size of the district as summarized above. This technique randomized the order of
selection and assured the first principal in Peterson’s school district lists was not always
surveyed.
Ninety-five principals were randomly selected from a list of ASQC identified TQM
schools. The first survey, a letter of explanation, and a stamped return envelope were
mailed on April 20, 2000 to each chosen principal; along with a request to return the
completed survey before June 1, 2000. Each envelope was numbered and each number
represented a particular principal and school. Survey instruments were mailed with a
return stamped addressed envelope and a cover letter that explained the purpose of the
study and gave instructions for completion and return of the survey.
69
Survey Returns
The first survey yielded 6 usable responses and the second survey yielded 1
usable survey. There were six returned surveys in response to the third survey, but again
only 1 was usable. The fourth survey returned 11 responses. One was by E-mail. The 11
responses yielded only 3 that contained survey data. Eight did not respond with data. The
eight responses break down three groups. The first group consisted of two principals who
were about to start implementing TQM. The second group consisted of three that were
new principals and did not have data. The third group consisted of three principals who
were not using TQM. This leaves the 3 respondents which the investigator bases the
fourth survey comparison of data upon.
Statistical Analysis
The researcher applied the test of proportionality (Ferguson 1966, p.178-180) to
test the hypotheses and to create tables concerning the demographic distributions of
leavers. The Test of Proportionality was used to determine if the distribution of reported
leaving personnel was the same or different from the known national distribution. The
significance level was set at p<.05.
Analysis
The researcher’s methodology involved asking the principal about events at a
school building level; the principal in his role of senior building leader would be in the
position to have access to the attrition data necessary for this study. The investigator
developed a cover letter that requested the cooperation of principals (see appendix A).
The survey instrument asked principals to supply a count for specific demographic
information certified personnel leaving during the first three years of implementation (see
70
appendix B). Comparisons to national statistics on stayers, leavers, and movers were to
be made using inferential statistics parametric models. Percentages in the different
categories were developed by referencing the Common Core of Data (CCD) reported by
Fondelier, et al., in the 1993-1994 schools and Staffing Survey: Data File User’s Manual,
Vol.1: Survey Documentation.
71
CHAPTER 4
DATA ANALYSIS AND INTERPERTATION
Data generated from this study are presented, analyzed, and interpreted in this
chapter. This study was taken to answer two questions. The first was whether the
implementation of TQM was related an increase in personnel attrition (Ho 1). The second
was whether certain demographic variables correlated with those who left (Ho 2).
Answers to these questions could guide the development of appropriate interventions that
might reduce future attrition.
Sampling Procedures
Since there were only six usable responses to the first survey, the investigator
selected another 95 principals. Where the 10th was selected, the 11th was now selected.
Where the fifth was selected, the sixth was now selected. Where the third had been
selected, the fourth was now selected. Where the second had been selected, the next
school on the list was selected. The new mailing list was checked for names of
superintendents still leading their districts and the principals still leading their schools
against 1998 ASQC listing and Peterson’s Spring 2000 lists of Elementary and
Secondary Lists. The new list was checked against the old mailing. If a site was
discovered that had already been surveyed, the next school on the list was sent a survey.
The selection process was therefore advanced by one. On August 15, 2000, the
second survey was sent to 95 principals. The return deadline date for this survey was
72
September 10, 2000. Seven responses were received none were usable, most responses
remarked that they were new principals who were unfamiliar with TQM.
These results were followed by a third attempt that employed the same selection
procedure that was used in the second survey that resulted in one usable response. The
list for the fourth attempt was selected differently. The previous lists were based on
schools and school districts that appeared on the ASQC list from four to eight years. The
investigator went back to the ASQC K-12 District listings and selected school districts
that had been rejected for the original lists because they had only appeared on the list for
one or two years. At the time of the fourth mailing, these schools would be in their third
or fourth year of implementation. This search produced four more school districts. These
schools and their principals were added to the list. All the schools were checked against
Peterson’s Fall 2000 Elementary and Secondary School Listings. This resulted in a fourth
list of 95 principals that was checked against past lists to assure not re-surveying
principals. The fourth survey went out to principals on November 19, 2000. The return
date was December 15, 2000. This survey mailing yielded eleven responses; only three
were usable surveys. After four survey distributions, the total usable surveys were 10.
Problems in Received Responses
There were 19 unusable responses. There were 10 usable survey responses.
The returned unusable surveys fall into four categories of explanations,
• Five principals stated that TQM was no longer a priority.
• Five principals responded that the principal who initiated TQM had left.
• Four other principals stated that they were new principals and had not been
involved in the implementation phase of TQM and had no data.

73
• Three more responses indicated that TQM had not been implemented.
• Two principals reported that TQM had been dropped by the school district and
both principals were from the same district.
Four of the five principals reported that TQM was no longer a priority were from the
Sacramento District. Since the Sacramento District was comprised of 130 different
schools, over a quarter of the sample and nine other surveys sent to the Sacramento
district were not returned a further inquiry needed to be made.
The researcher wrote to Mr. Meaney the Sacramento School District’s Assistant
Superintendent of Quality Control. He responded that the Sacramento School District and
the surrounding school districts were no longer using TQM. He remarked that
Sacramento was still using three key principles of TQM: 1) customer focus, 2)
improvement, and 3) involvement of everyone. He explained that, ‘TQM had become
invisible and is now just the way we do business”. He also stated that, ”We feel that we
have been highly successful by a number of measures ex: income doubled from $30
million to $70 million, employee turnover was down, moral was up, customers (e.g.
school districts) more then satisfied that TQM works” (D. Meaney (personal
communication), Oct.30 1998). The investigator eliminated the Sacramento School
District from the list of TQM districts.
Two principals from the Haddonfield (NJ) Public Schools, stated that TQM was
not implemented in a formal way and it was dropped after one year by order of the
district. The Haddonfield superintendent had not left his position during the period
covered by this study.
74
A problem that emerged from the responses was principal attrition. The first list
of superintendents their school districts and the list of principals and their schools were
compiled by cross-referencing the ASQC lists and Patterson's 1998 Spring list of school
districts and schools. When a recheck (Fall, 2000) of the same districts and their
principals was done by the investigator it was discovered that 11.5% of the
superintendents and that 13.6% of the principals had been replaced. This is important
since it is a variable that effects the survey outcomes as already noted from some of the
unusable responses. Principals and superintendents are in positions that can either
advance or retard TQM in their schools the replacement of committed TQM principals
and superintendents can negatively effect the implementation of TQM.
Data Analysis
The investigator combined all the usable responses from all four distributions of
the surveys-a total of 447 certified personnel were contained in the usable responses. The
Test for Significance of Difference Between two Independent Proportions (Ferguson,
1966) was used to determine the significance of the difference between two independent
proportions to analyze the attrition data for all hypothesis. There was no report of any
certified personnel leaving who were not white. The survey did have a place on the report
form for different racial and ethnic groups to be represented and accounted for in the
survey. The variable of ethnicity was could not be reported.
National descriptive statistics/responses of usable surveys
The Teacher Follow-up Survey (TFS) 1994-95 was a survey of elementary and
secondary certified personnel who participated in the Schools and Staffing Survey
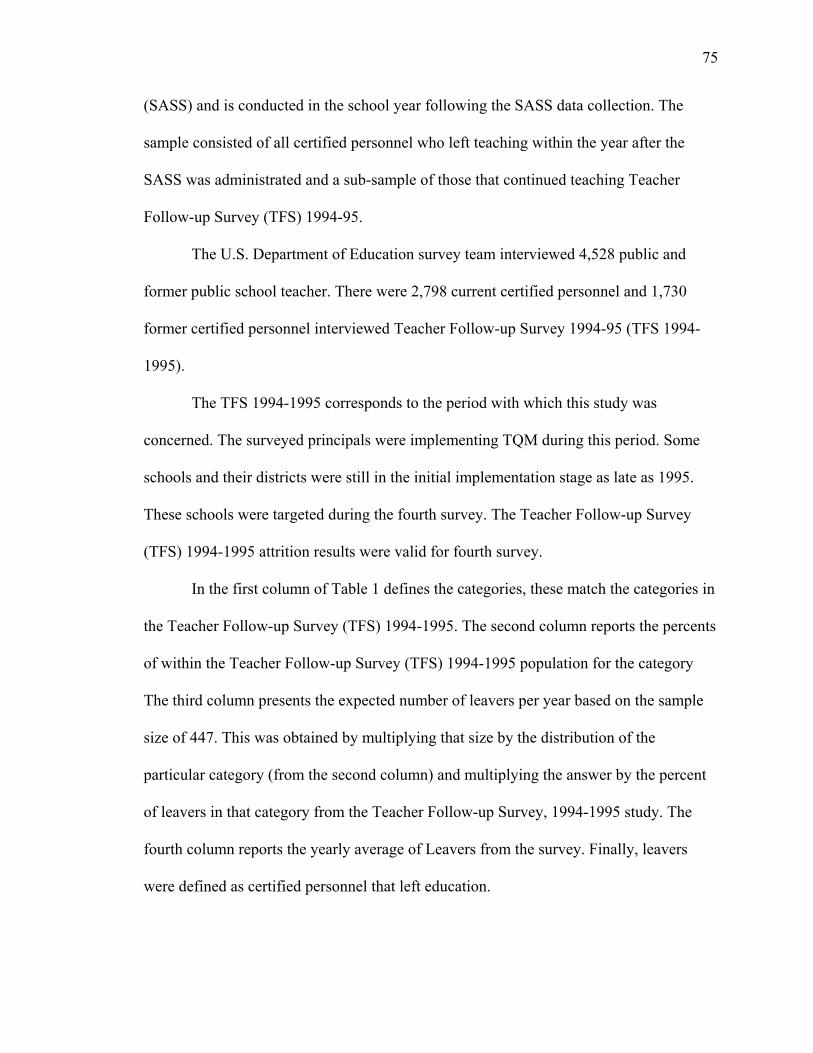
75
(SASS) and is conducted in the school year following the SASS data collection. The
sample consisted of all certified personnel who left teaching within the year after the
SASS was administrated and a sub-sample of those that continued teaching Teacher
Follow-up Survey (TFS) 1994-95.
The U.S. Department of Education survey team interviewed 4,528 public and
former public school teacher. There were 2,798 current certified personnel and 1,730
former certified personnel interviewed Teacher Follow-up Survey 1994-95 (TFS 1994-
1995).
The TFS 1994-1995 corresponds to the period with which this study was
concerned. The surveyed principals were implementing TQM during this period. Some
schools and their districts were still in the initial implementation stage as late as 1995.
These schools were targeted during the fourth survey. The Teacher Follow-up Survey
(TFS) 1994-1995 attrition results were valid for fourth survey.
In the first column of Table 1 defines the categories, these match the categories in
the Teacher Follow-up Survey (TFS) 1994-1995. The second column reports the percents
of within the Teacher Follow-up Survey (TFS) 1994-1995 population for the category
The third column presents the expected number of leavers per year based on the sample
size of 447. This was obtained by multiplying that size by the distribution of the
particular category (from the second column) and multiplying the answer by the percent
of leavers in that category from the Teacher Follow-up Survey, 1994-1995 study. The
fourth column reports the yearly average of Leavers from the survey. Finally, leavers
were defined as certified personnel that left education.
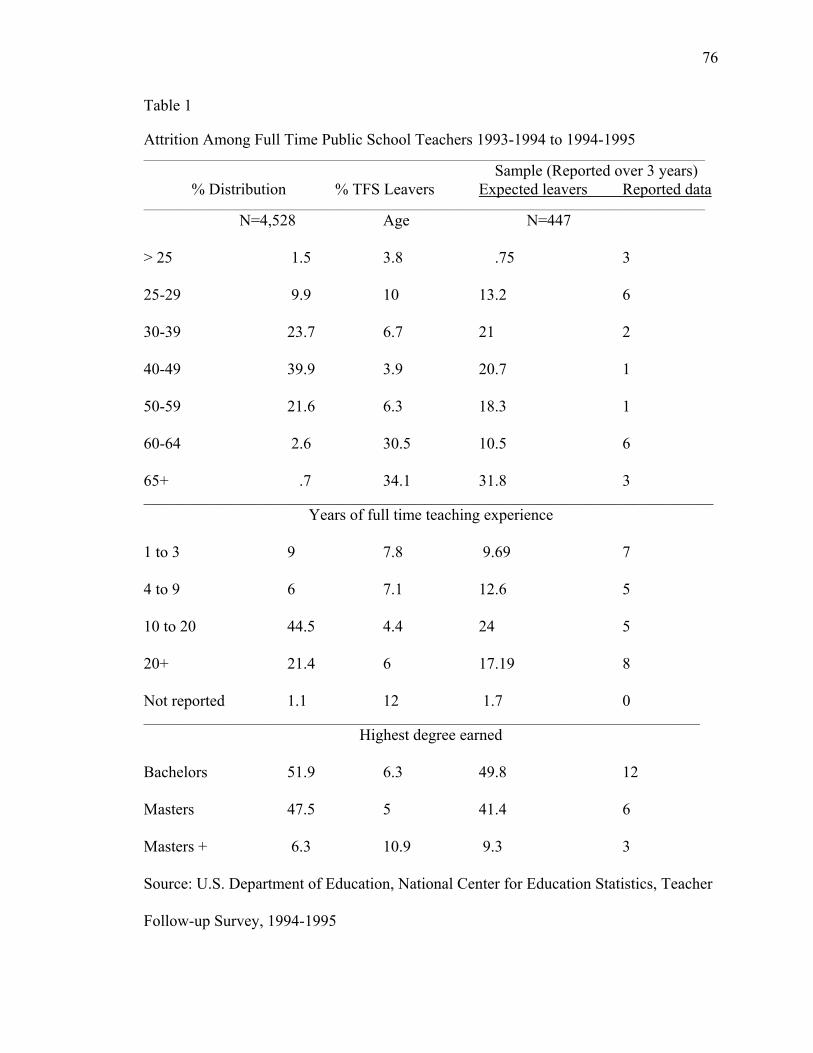
76
Table 1
Attrition Among Full Time Public School Teachers 1993-1994 to 1994-1995_________________________________________________________________________________________________________
Sample (Reported over 3 years)% Distribution % TFS Leavers Expected leavers Reported data
_________________________________________________________________________________________________________
N=4,528 Age N=447
> 25 1.5 3.8 .75 3
25-29 9.9 10 13.2 6
30-39 23.7 6.7 21 2
40-49 39.9 3.9 20.7 1
50-59 21.6 6.3 18.3 1
60-64 2.6 30.5 10.5 6
65+ .7 34.1 31.8 3_____________________________________________________________________________________
Years of full time teaching experience
1 to 3 9 7.8 9.69 7
4 to 9 6 7.1 12.6 5
10 to 20 44.5 4.4 24 5
20+ 21.4 6 17.19 8
Not reported 1.1 12 1.7 0___________________________________________________________________________________
Highest degree earned
Bachelors 51.9 6.3 49.8 12
Masters 47.5 5 41.4 6
Masters + 6.3 10.9 9.3 3
Source: U.S. Department of Education, National Center for Education Statistics, Teacher
Follow-up Survey, 1994-1995
77
Inferential statistics
Two sets of attrition data were used in the analyses. The first set of attrition data
were from a national the Teacher Follow-up Survey, 1994-1995 survey reported by the
U.S. Department of Education (1997). In order to provide comparable comparisons, the
data from the national study were used to project the numbers of attrition that would have
been expected in the survey. For example, a mean of 6.6% of the certified personnel was
reported in the national study as leaving their schools each year. By using the 6.6% as the
attrition rate for the 447 certified personnel in the sample it is estimated that 30 certified
persons would leave their positions each year. A similar procedure was used to estimate
the number of leavers for each of the demographic hypotheses (level taught, age, teaching
experience, and degrees earned). The estimations for each demographic hypothesis were
arrived at by applying the percent distribution in each category of the Teacher Follow-up
Survey, 1994-1995 reported in Table 1. The estimates were then rounded before they
were set into the tables. The last set of data was the distribution of the collected data
concerning the 447 certified personnel gathered from reporting schools. Tables 2 through
Table 17 contain the actual demographic distributions by year and type for the 447
personnel and the expected distributions.
Seven hypotheses were tested using the Test of Significance of the Difference
between Two Independent Proportions with a significance level of p<. 05 and p<. 01.
Each hypothesis is presented along with the data and analyses.
Ho1: There is no statistically significant difference in the proportion of the number of
attritions of certified personnel from the sample study of schools transforming to TQM
compared to the proportion of certified personnel from the U.S. Department of Education
Study for year 1, year 2, or year 3.
78
A total of 447 certified personnel were represented in the usable responses. Table
2 illustrates the actual attrition distributions by the year for the 447 personnel. A rate of
6.6% of the certified personnel in the national study left their schools each year. By using
the 6.6% figure as the expected attrition rate applied against the 447 certified personnel
from the survey sample, it is estimated that 30 certified persons would leave each year.
The Test of the Difference between Two Independent Proportions was used to determine
whether there were any statistically significant differences between TFS 1994-1995
reported data and the TQM attritions. The data is comprised of two samples drawn
independently. The TFS (1994-1995) sample consisted of 4528 individuals while the
TQM survey group consisted of 447 individuals. In Table 2, the calculated Z values for
each year are presented. Using p< .05 the critical value of Z= 1.96 and at a p<. 01 value
the Z=2.57. The calculated value of the TQM sample attrition of certified personnel was
statistically significant from the national survey.
Ho2a: There is no statistically significant difference in the proportion of the number of
attritions from the TQM sample of elementary personnel as compared to the proportion
from the U.S. Department of Education Study for year 1, Year 2, or year 3.
182 certified personnel in elementary schools were represented in the usable
responses. Table 3 contains the actual and expected attritions for each year for the 182
personnel. Using the results of the TFS (1994-1995), it was anticipated that 6.6% of these
personnel would leave their positions each year. The Test of significance of the
difference between Two Independent Proportions was used to determine statistically the
difference between expected proportion and the reported attritions. Using p<. 05, the
critical value for Z=1.96 and at the p<. 01 critical value Z=2.57. As indicated in Table 3,
the calculated Z value exceeded the critical value of p<. 01 for the three years of the
study, therefore the null hypothesis is rejected for all three years of the study. The TQM
sample's attrition was significantly lower for all three years of the study then that of the
certified personnel in the national study.
Ho2a: There is no statistically significant difference in the proportion of the number of
certified personnel attritions from the sample study of TQM secondary schools compared
79
to the proportion of certified personnel from the U.S. Department of Education Study for
year 1, year 2, or year 3.
There were 265 certified personnel in secondary schools represented in the usable
responses. Table 4 illustrates the actual and the expected attritions by year for TQM
secondary teachers. By using the results of the TFS (1994-1995) report, it was anticipated
that 6.6% of the personnel would leave their positions each year. The Test of significance
of the Difference between Two Independent Proportions was used to determine
difference between the expected and the reported number of leavers. Table 4 contains the
actual and expected attritions by year. The sample attrition of certified personnel
participating in schools implementing TQM was significantly statistically different from
the attrition of certified personnel from the TFS (1994-1995) The null hypothesis was
rejected for all three years.
Tables 5 through 17 contain the expected and reported attritions by year for the
TQM sample (n=447) each table represents a different category that match the TFS
(1994-1995) reported categories. Tables 5 through Table 8 illustrate the category years of
teaching experience broken into chronological segments. Using p<. 05 the critical value
of Z =1.96 and at p.01 the critical value of Z= 2.57.
Using the results reported in the TFS (1994-1995) report that was illustrated and
expanded in Table 1 the expected number of personnel was projected. To assure accuracy
in the determining the expected number of leavers the same percentage of population
distribution was used in the TFS (1994-1995) study was applied against the sample size
(447) for each category and then multiplied by the percent of leavers reported in the
national sample. The Test of Significance of the Difference between Two Independent
Proportions was again used to determine difference between the expected and the
reported attrition. Tables 5 through 8 report the results of these comparisons. Using p<.
05 the critical value of Z =1.96 and at p. 01 the critical value of Z= 2.57. The result was
that the calculated values of Z in Table 5 did not exceed the critical value, thus the null
hypothesis is accepted for certified personnel with under 4 years of teaching experience.
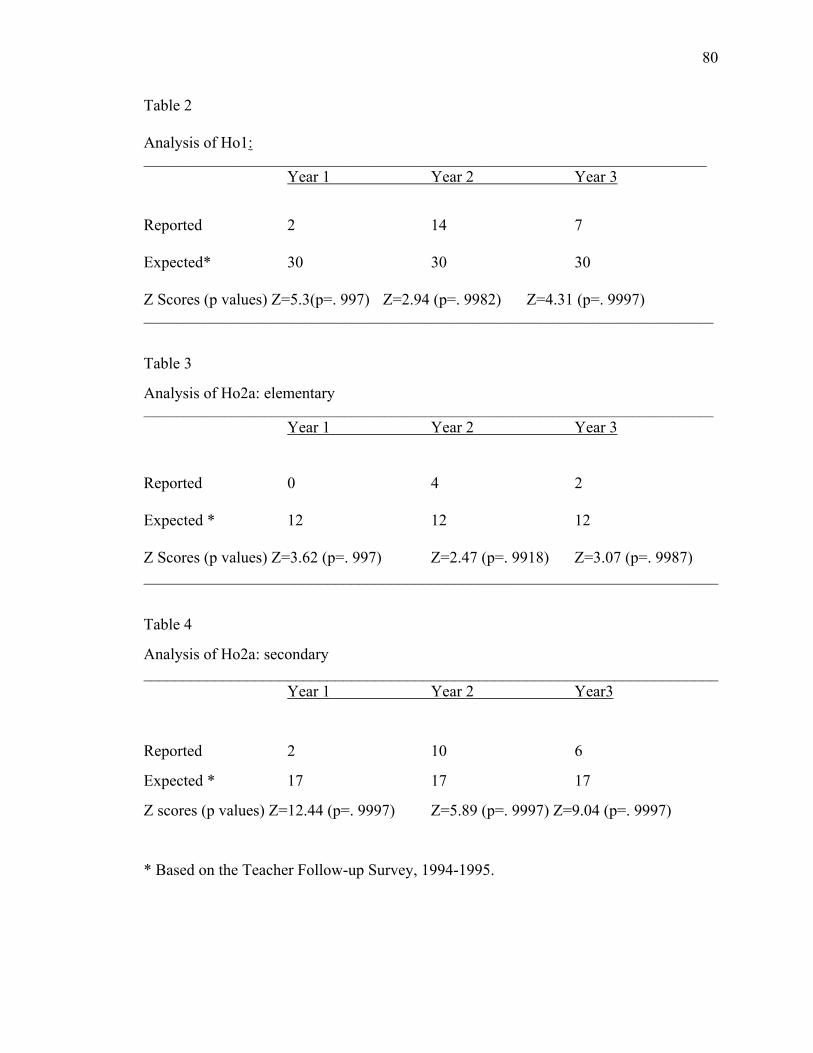
80
Table 2
Analysis of Ho1:____________________________________________________________________________________
Year 1 Year 2 Year 3
Reported 2 14 7
Expected* 30 30 30
Z Scores (p values) Z=5.3(p=. 997) Z=2.94 (p=. 9982) Z=4.31 (p=. 9997)_____________________________________________________________________________________
Table 3
Analysis of Ho2a: elementary_____________________________________________________________________________________
Year 1 Year 2 Year 3
Reported 0 4 2
Expected * 12 12 12
Z Scores (p values) Z=3.62 (p=. 997) Z=2.47 (p=. 9918) Z=3.07 (p=. 9987)________________________________________________________________________
Table 4
Analysis of Ho2a: secondary________________________________________________________________________
Year 1 Year 2 Year3
Reported 2 10 6
Expected * 17 17 17
Z scores (p values) Z=12.44 (p=. 9997) Z=5.89 (p=. 9997) Z=9.04 (p=. 9997)
* Based on the Teacher Follow-up Survey, 1994-1995.
81
The calculated Z values in Table 6 did not exceed the critical value. The null hypothesis
is accepted for the category 4 to 9 years of teaching experience. The attrition of certified
personnel from TQM schools was not statistically different then the attrition from the
TFS (1994-1995) report. The TQM sample's attrition of certified personnel was not
statistically different then the attrition from the TFS (1994-1995) report. The calculated Z
values in Table 7 (10 to 20 years experience) did exceed the critical values for year 1 and
3, but did not exceed the critical values for year 2. The null hypothesis is rejected for
years 1 and 3 and accepted for year 2. Certified personnel in the TQM sample left their
schools in lower numbers during years 1 and 3 then certified personnel reported in the
TFS (1994-1995) report. During year two the attrition was not significantly different
from the (TFS (1994-1995) sample. The calculated Z values in Table 8 did not exceed the
critical value and therefore the null hypothesis is accepted for certified personnel with 20
+ years of experience. The TQM sample of attrition for certified personnel was not
statistically different from reported attrition in the TFS (1994-1995).
Ho2c: There is no statistically significant difference in the proportion of the number of
attritions from the sample study of schools transforming to TQM compared to the
proportion from the U.S. Department of Education Study for year 1, year 2, or year 3
under the category of chronological age.
Table 9 illustrates the reported and expected attritions for each year of
implementation for the 447 certified personnel from the TQM survey sample. Using the
results from TFS (1994-1995), recorded in Table 1 the number of certified personnel that
would leave was projected for each age category. To assure accuracy the same
percentage of the distribution from the TFS (1994-1995) study was applied against the
TQM sample of 447 for each age category and that number was applied against the
percent of leavers from the TFS (1994-1995) report for each category. The Test of
Significance of the Difference between Two Independent Proportions was applied for
each age category. The results are recorded in Table 9 through Table 14.
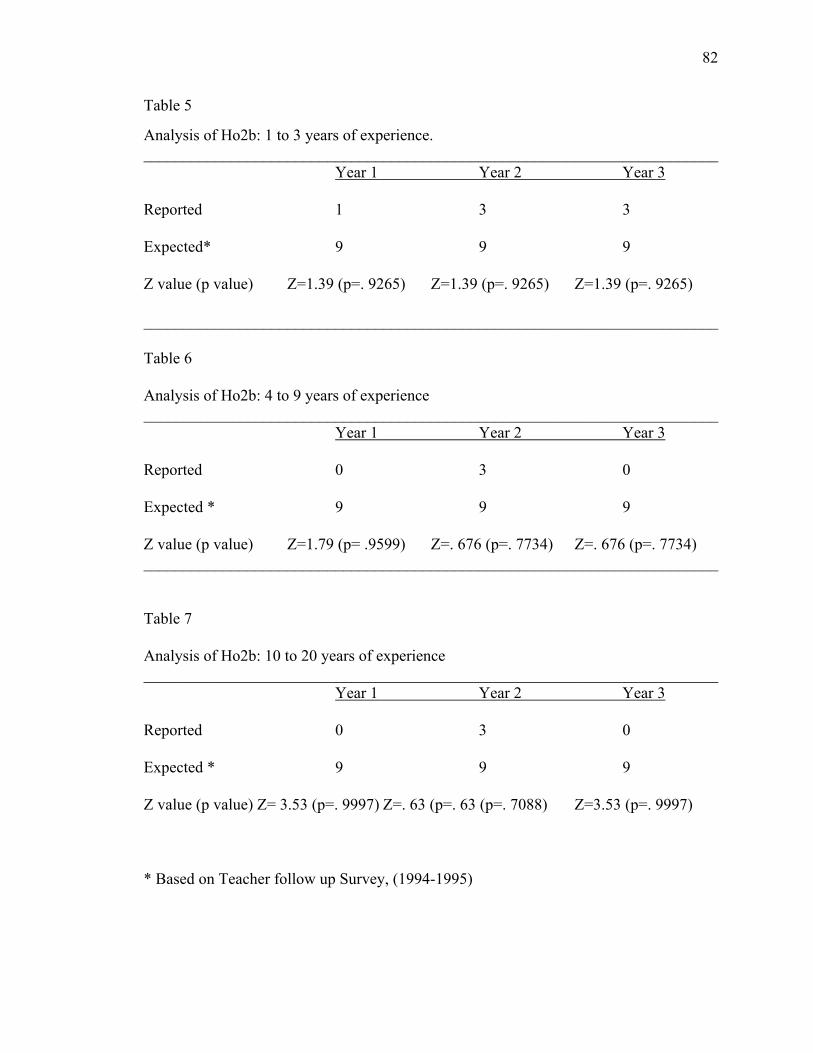
82
Table 5
Analysis of Ho2b: 1 to 3 years of experience.________________________________________________________________________
Year 1 Year 2 Year 3
Reported 1 3 3
Expected* 9 9 9
Z value (p value) Z=1.39 (p=. 9265) Z=1.39 (p=. 9265) Z=1.39 (p=. 9265)
________________________________________________________________________
Table 6
Analysis of Ho2b: 4 to 9 years of experience________________________________________________________________________
Year 1 Year 2 Year 3
Reported 0 3 0
Expected * 9 9 9
Z value (p value) Z=1.79 (p= .9599) Z=. 676 (p=. 7734) Z=. 676 (p=. 7734)________________________________________________________________________
Table 7
Analysis of Ho2b: 10 to 20 years of experience________________________________________________________________________
Year 1 Year 2 Year 3
Reported 0 3 0
Expected * 9 9 9
Z value (p value) Z= 3.53 (p=. 9997) Z=. 63 (p=. 63 (p=. 7088) Z=3.53 (p=. 9997)
* Based on Teacher follow up Survey, (1994-1995)
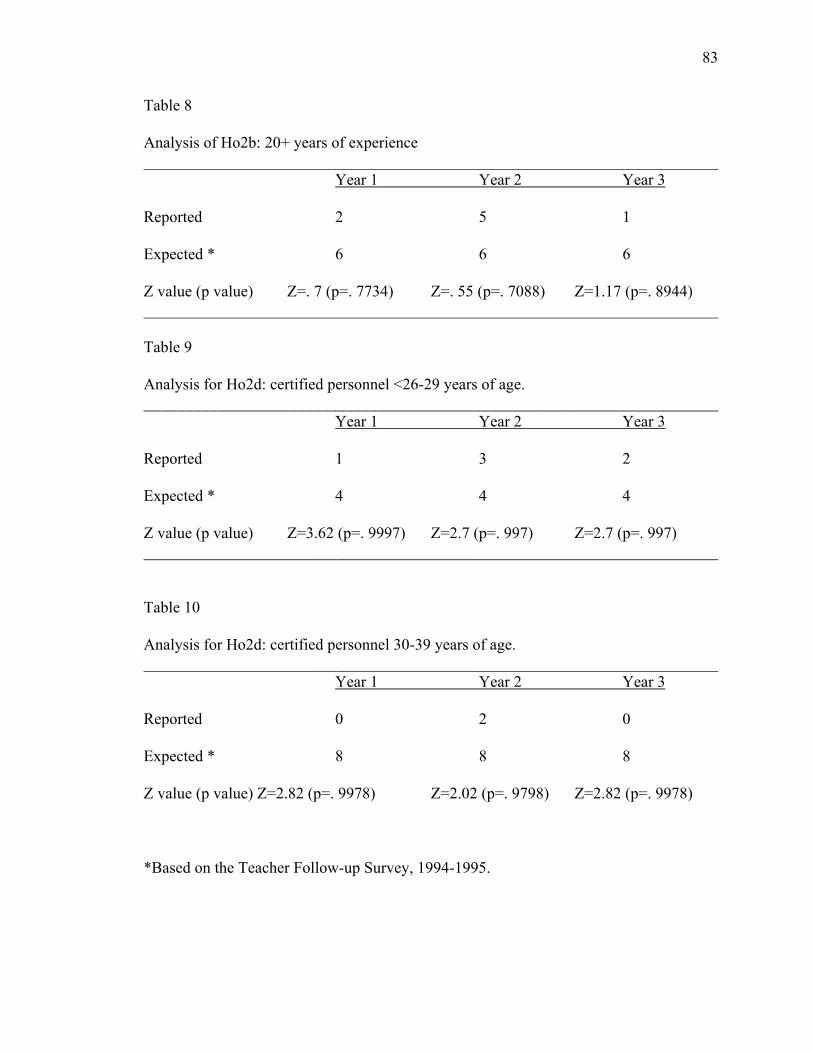
83
Table 8
Analysis of Ho2b: 20+ years of experience________________________________________________________________________
Year 1 Year 2 Year 3
Reported 2 5 1
Expected * 6 6 6
Z value (p value) Z=. 7 (p=. 7734) Z=. 55 (p=. 7088) Z=1.17 (p=. 8944)________________________________________________________________________
Table 9
Analysis for Ho2d: certified personnel <26-29 years of age.________________________________________________________________________
Year 1 Year 2 Year 3
Reported 1 3 2
Expected * 4 4 4
Z value (p value) Z=3.62 (p=. 9997) Z=2.7 (p=. 997) Z=2.7 (p=. 997)________________________________________________________________________
Table 10
Analysis for Ho2d: certified personnel 30-39 years of age.________________________________________________________________________
Year 1 Year 2 Year 3
Reported 0 2 0
Expected * 8 8 8
Z value (p value) Z=2.82 (p=. 9978) Z=2.02 (p=. 9798) Z=2.82 (p=. 9978)
*Based on the Teacher Follow-up Survey, 1994-1995.
84
Using p<. 05 the critical value of Z =1.96 and at p=. 01 the critical value of Z=
2.57. The calculated Z score did exceed the critical value for chronological ages <25-29
thus the null hypothesis is rejected for all three years. In the age group 30-0=39, the
calculated value of Z did exceed the critical value for all three years, for years 1 and 3 the
critical value exceeded the p=. 01, but only exceeded the p=. 05 level during year 2. The
null hypothesis is rejected for the category 30-39 years. In the category ages 40-49, the
calculated Z value for all three exceeded the p=. 05 level and during years 2 and 3 the
value exceeded the p=. 01 critical value. The null hypothesis is therefore rejected for the
age category 40-49 for all three years of the study. The critical Z value exceeded the
critical value at the p=. 05 level for each of the three years of the study in the age
category 50-59. The null hypothesis is rejected for all three years under study. In the age
category 60-64, the critical value was exceeded at the critical value of p=. 05 for all three
years under study and exceeded the p=. 01 level during years 1 and 3. The null
hypothesis was rejected for ages 60-64. In the age category 65+, the critical value
exceeded the critical value during all three years under study at the p=. 01 level. The null
hypothesis is rejected for rejected for all three years of the study.
Ho2d: There is no statistically significant difference in the proportion of the number of
certified personnel attritions from the sample study of schools transforming to TQM as
compared to the proportion of certified personnel attritions from the U.S. Department of
education Study for year 1, year 2, or year 3, under the category race/ethnicity.
85
The null hypothesis concerning with TQM implementation and the variables of
race and ethnicity could not be tested due to a lack of reported data, because of
incomplete surveys. Therefore, the hypothesis was not tested.
Ho2f There is no statistically significant difference in the proportion of the number of
certified personnel leaving from the sample of schools transforming to TQM as compared
to the proportion of certified attritions from the U.S. Department of Education Study for
year 1, year 2, or year 3 in the category of highest degree earned.
Table 15 through 17 contains the reported and expected attrition by year divided
into categories by highest degree attained. To assure accuracy the percentage (Table 1)
for each category of degree earned was multiplied times the TQM survey sample size of
447 to determine approximately how many individuals the category represented. The
number obtained was then multiplied by the percent of leavers for that category of the
TFS (1994-1995) study to yield the expected number of TQM leavers. A comparison was
then done using the Test of Significance between Two Independent Proportions. . At p=.
05 the critical value of Z=1.96 and at the p=. 01 level the critical value of Z=2.57.
The calculated value of Z in Table 15 did not exceed the critical Z value. The null
hypothesis must be accepted. Certified personnel possessing Bachelor degrees from the
TQM study sample leave in the same numbers as certified person or greater numbers then
certified personnel from the TFS 1994-1995.
The category Masters degrees the critical Z value were exceeded during years 1
and 3 but it was not met or exceeded for the second year. The null hypothesis is rejected
during years 1 and 3 and accepted for year 2.
86
The category Masters degree + did not exceed the critical value for all three years
of the study. The attrition from TQM sample schools met or exceeded that of the reported
attrition from the TFS 1994-1995 survey. Attrition in the TQM schools sampled was not
statistically different within the categories of Bachelors degrees and Masters + degrees. It
did differ statistically, during the first and third year under study, within the category of
Masters degree. The number of people leaving was statistically significantly lower for
years 1 and 3 under study.
Tables 2 through 17 have been summarized in Table 18. In Table 18 each table's
Z scores are illustrated. Where a Z score has a single * before it the Z score meet or
exceeded the critical value at the p< .05 level. Where the Z score has a do8uble ** before
it the critical value was met or exceeded at the p<.01 level.
Findings
Several conclusions were generated from this study.
1. That based on a 6.6% attrition rate it was expected that 30 certified personnel would
leave for each year of the study, therefore 90 certified personnel would leave during
the three years of the study. It was reported by the TQM schools that 23 certified
personnel left during the three years of the study. The Test of the Significance of the
Difference between Two proportions was applied and the Z scores for each of the
three years did fall within the rejection region. The null hypothesis is rejected as
implausible in favor of an alternative hypothesis that the attrition in the TQM school
2. (cont.) under study was statistically significantly lower then the reported attrition in
the TFS 1994-1995.
3. That based on the level taught elementary schools and the national attrition rate of
6.6% it was expected that 12 certified personnel would leave each
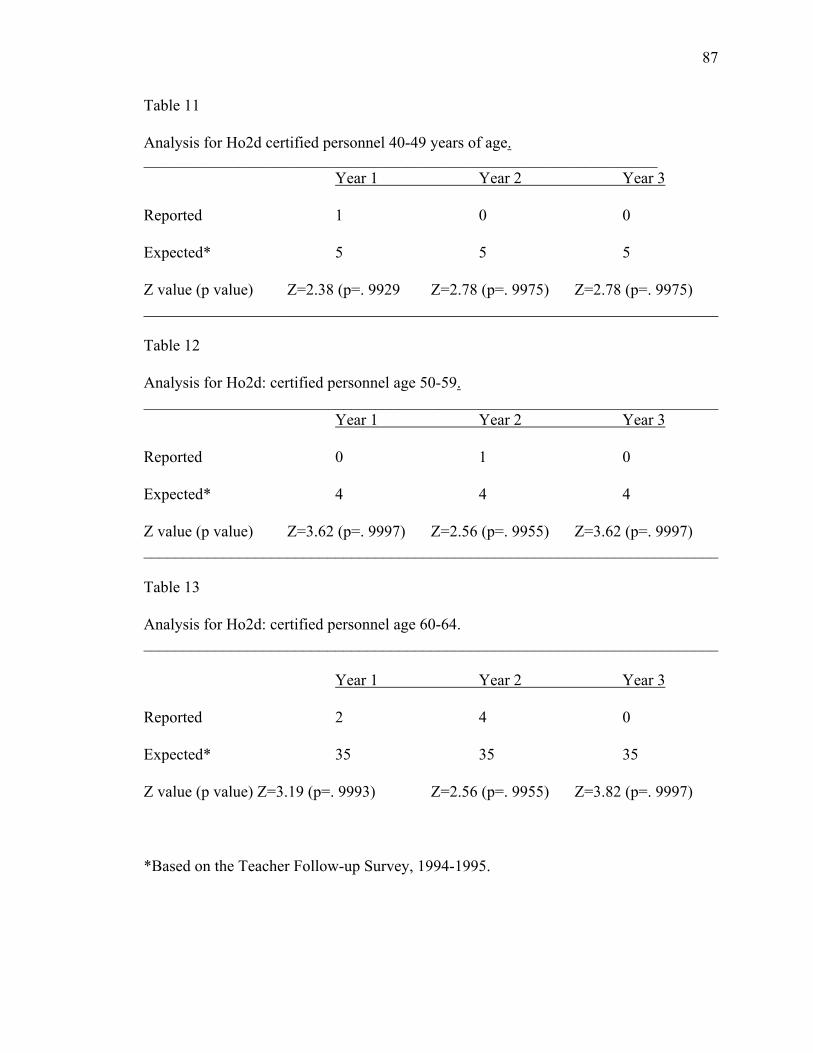
87
Table 11
Analysis for Ho2d certified personnel 40-49 years of age.______________________________________________________________________
Year 1 Year 2 Year 3
Reported 1 0 0
Expected* 5 5 5
Z value (p value) Z=2.38 (p=. 9929 Z=2.78 (p=. 9975) Z=2.78 (p=. 9975)________________________________________________________________________
Table 12
Analysis for Ho2d: certified personnel age 50-59.________________________________________________________________________
Year 1 Year 2 Year 3
Reported 0 1 0
Expected* 4 4 4
Z value (p value) Z=3.62 (p=. 9997) Z=2.56 (p=. 9955) Z=3.62 (p=. 9997)________________________________________________________________________
Table 13
Analysis for Ho2d: certified personnel age 60-64.________________________________________________________________________
Year 1 Year 2 Year 3
Reported 2 4 0
Expected* 35 35 35
Z value (p value) Z=3.19 (p=. 9993) Z=2.56 (p=. 9955) Z=3.82 (p=. 9997)
*Based on the Teacher Follow-up Survey, 1994-1995.
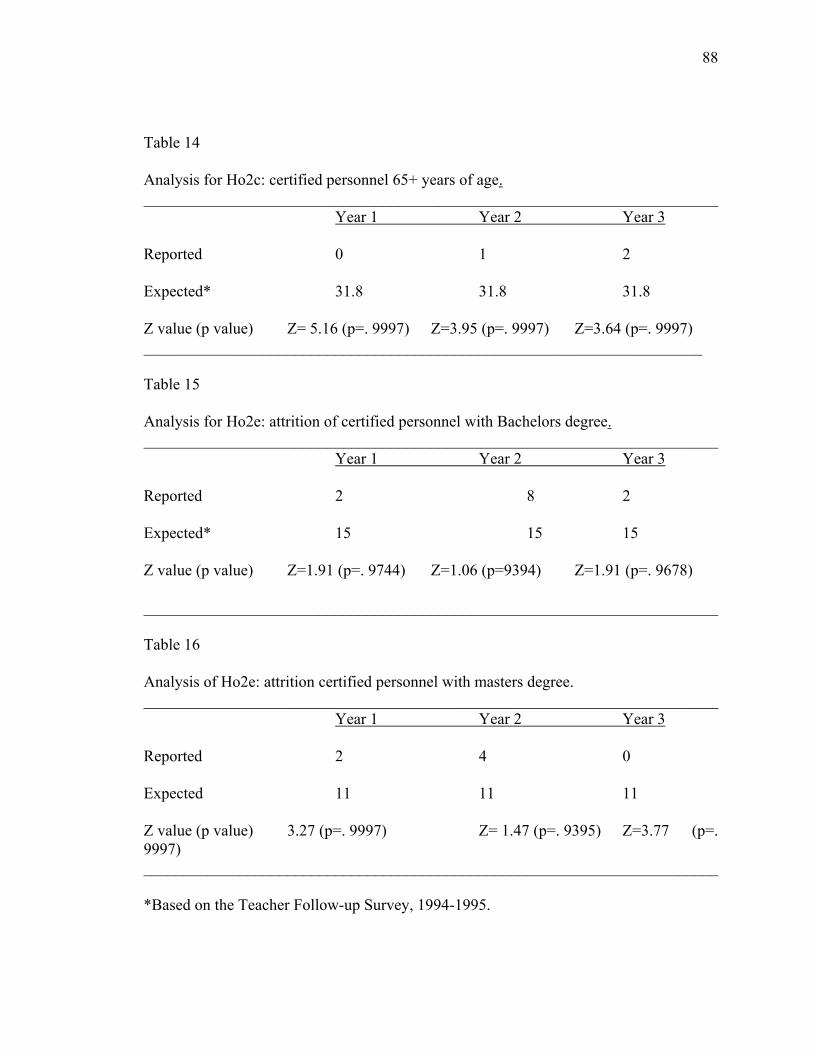
88
Table 14
Analysis for Ho2c: certified personnel 65+ years of age.________________________________________________________________________
Year 1 Year 2 Year 3
Reported 0 1 2
Expected* 31.8 31.8 31.8
Z value (p value) Z= 5.16 (p=. 9997) Z=3.95 (p=. 9997) Z=3.64 (p=. 9997)______________________________________________________________________
Table 15
Analysis for Ho2e: attrition of certified personnel with Bachelors degree.________________________________________________________________________
Year 1 Year 2 Year 3
Reported 2 8 2
Expected* 15 15 15
Z value (p value) Z=1.91 (p=. 9744) Z=1.06 (p=9394) Z=1.91 (p=. 9678)
________________________________________________________________________
Table 16
Analysis of Ho2e: attrition certified personnel with masters degree.________________________________________________________________________
Year 1 Year 2 Year 3
Reported 2 4 0
Expected 11 11 11
Z value (p value) 3.27 (p=. 9997) Z= 1.47 (p=. 9395) Z=3.77 (p=.9997)________________________________________________________________________
*Based on the Teacher Follow-up Survey, 1994-1995.
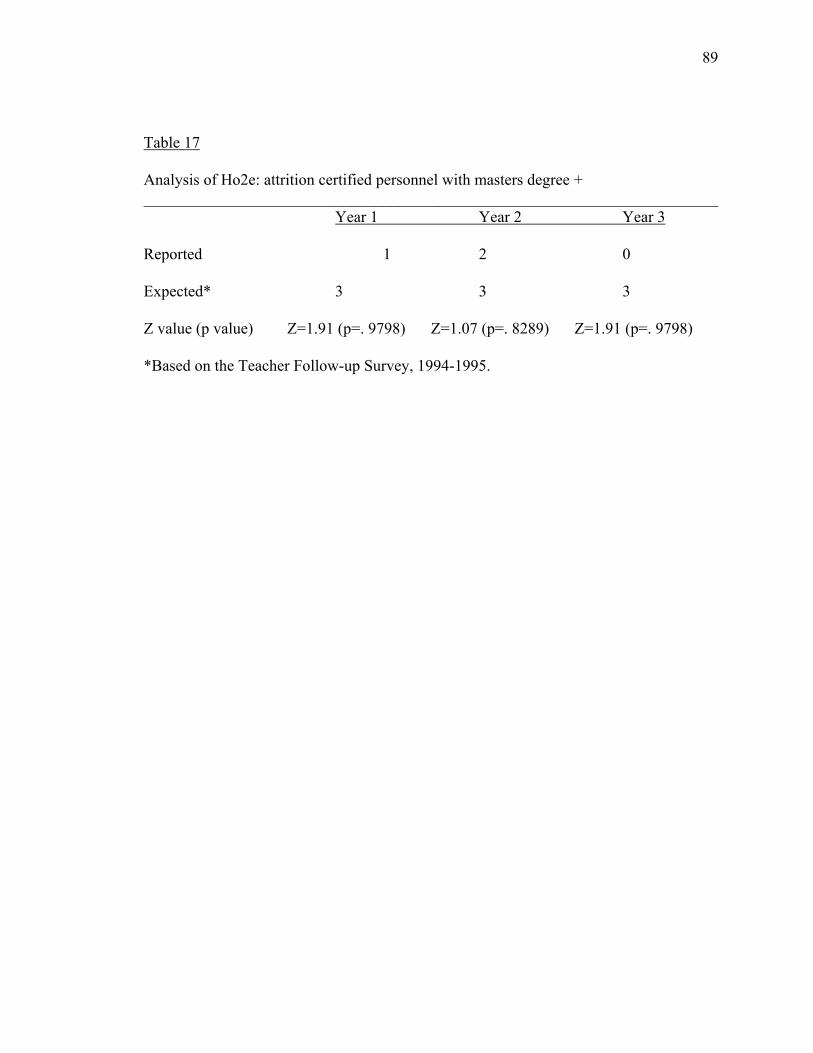
89
Table 17
Analysis of Ho2e: attrition certified personnel with masters degree +________________________________________________________________________
Year 1 Year 2 Year 3
Reported 1 2 0
Expected* 3 3 3
Z value (p value) Z=1.91 (p=. 9798) Z=1.07 (p=. 8289) Z=1.91 (p=. 9798)
*Based on the Teacher Follow-up Survey, 1994-1995.
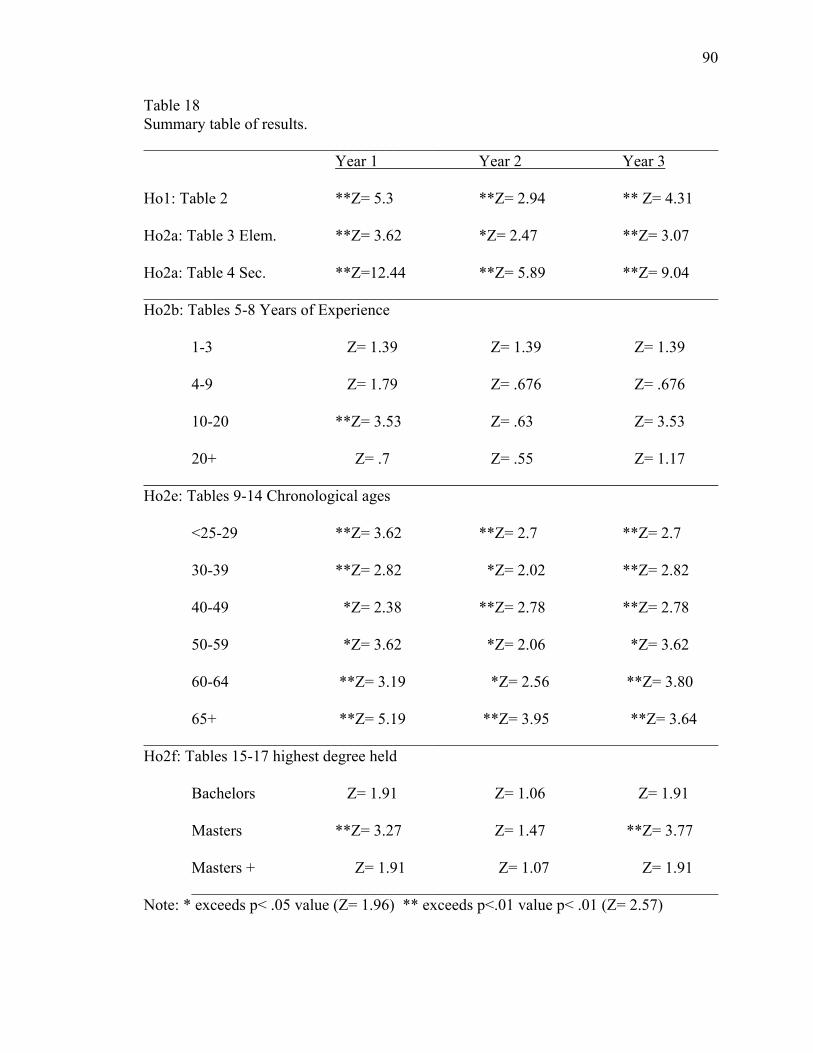
90
Table 18Summary table of results.________________________________________________________________________
Year 1 Year 2 Year 3
Ho1: Table 2 **Z= 5.3 **Z= 2.94 ** Z= 4.31
Ho2a: Table 3 Elem. **Z= 3.62 *Z= 2.47 **Z= 3.07
Ho2a: Table 4 Sec. **Z=12.44 **Z= 5.89 **Z= 9.04________________________________________________________________________Ho2b: Tables 5-8 Years of Experience
1-3 Z= 1.39 Z= 1.39 Z= 1.39
4-9 Z= 1.79 Z= .676 Z= .676
10-20 **Z= 3.53 Z= .63 Z= 3.53
20+ Z= .7 Z= .55 Z= 1.17________________________________________________________________________Ho2e: Tables 9-14 Chronological ages
<25-29 **Z= 3.62 **Z= 2.7 **Z= 2.7
30-39 **Z= 2.82 *Z= 2.02 **Z= 2.82
40-49 *Z= 2.38 **Z= 2.78 **Z= 2.78
50-59 *Z= 3.62 *Z= 2.06 *Z= 3.62
60-64 **Z= 3.19 *Z= 2.56 **Z= 3.80
65+ **Z= 5.19 **Z= 3.95 **Z= 3.64________________________________________________________________________Ho2f: Tables 15-17 highest degree held
Bachelors Z= 1.91 Z= 1.06 Z= 1.91
Masters **Z= 3.27 Z= 1.47 **Z= 3.77
Masters + Z= 1.91 Z= 1.07 Z= 1.91__________________________________________________________________
Note: * exceeds p< .05 value (Z= 1.96) ** exceeds p<.01 value p< .01 (Z= 2.57)
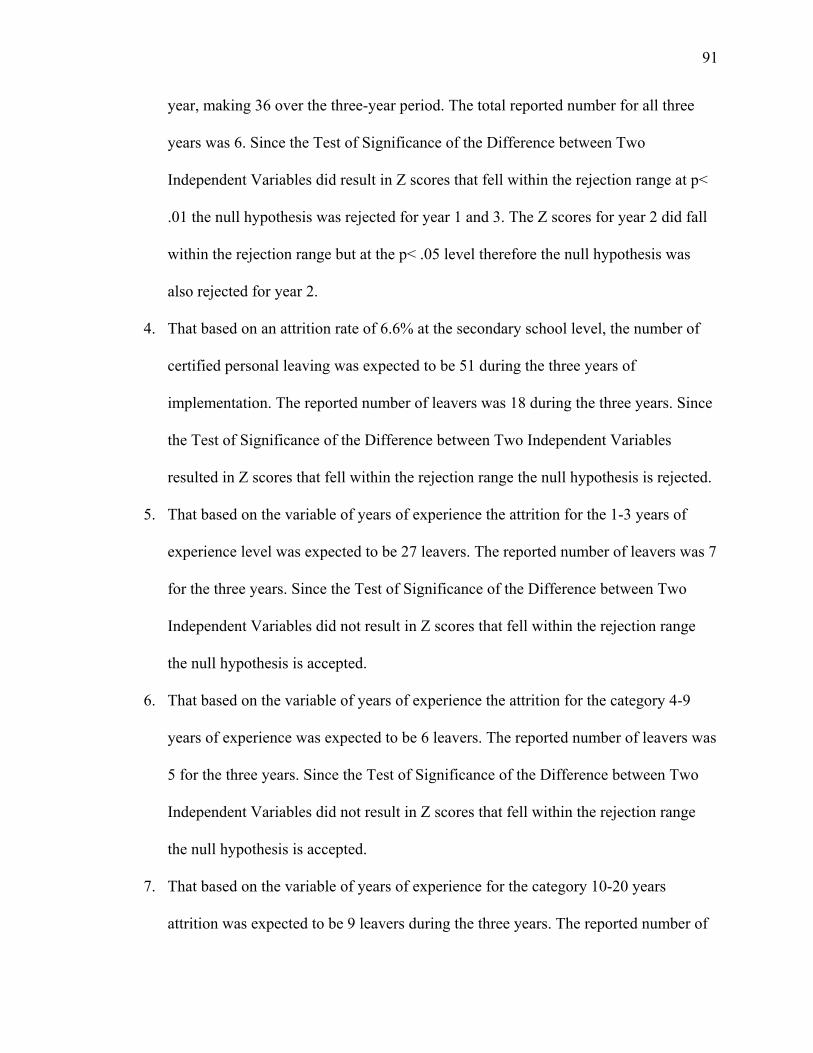
91
year, making 36 over the three-year period. The total reported number for all three
years was 6. Since the Test of Significance of the Difference between Two
Independent Variables did result in Z scores that fell within the rejection range at p<
.01 the null hypothesis was rejected for year 1 and 3. The Z scores for year 2 did fall
within the rejection range but at the p< .05 level therefore the null hypothesis was
also rejected for year 2.
4. That based on an attrition rate of 6.6% at the secondary school level, the number of
certified personal leaving was expected to be 51 during the three years of
implementation. The reported number of leavers was 18 during the three years. Since
the Test of Significance of the Difference between Two Independent Variables
resulted in Z scores that fell within the rejection range the null hypothesis is rejected.
5. That based on the variable of years of experience the attrition for the 1-3 years of
experience level was expected to be 27 leavers. The reported number of leavers was 7
for the three years. Since the Test of Significance of the Difference between Two
Independent Variables did not result in Z scores that fell within the rejection range
the null hypothesis is accepted.
6. That based on the variable of years of experience the attrition for the category 4-9
years of experience was expected to be 6 leavers. The reported number of leavers was
5 for the three years. Since the Test of Significance of the Difference between Two
Independent Variables did not result in Z scores that fell within the rejection range
the null hypothesis is accepted.
7. That based on the variable of years of experience for the category 10-20 years
attrition was expected to be 9 leavers during the three years. The reported number of
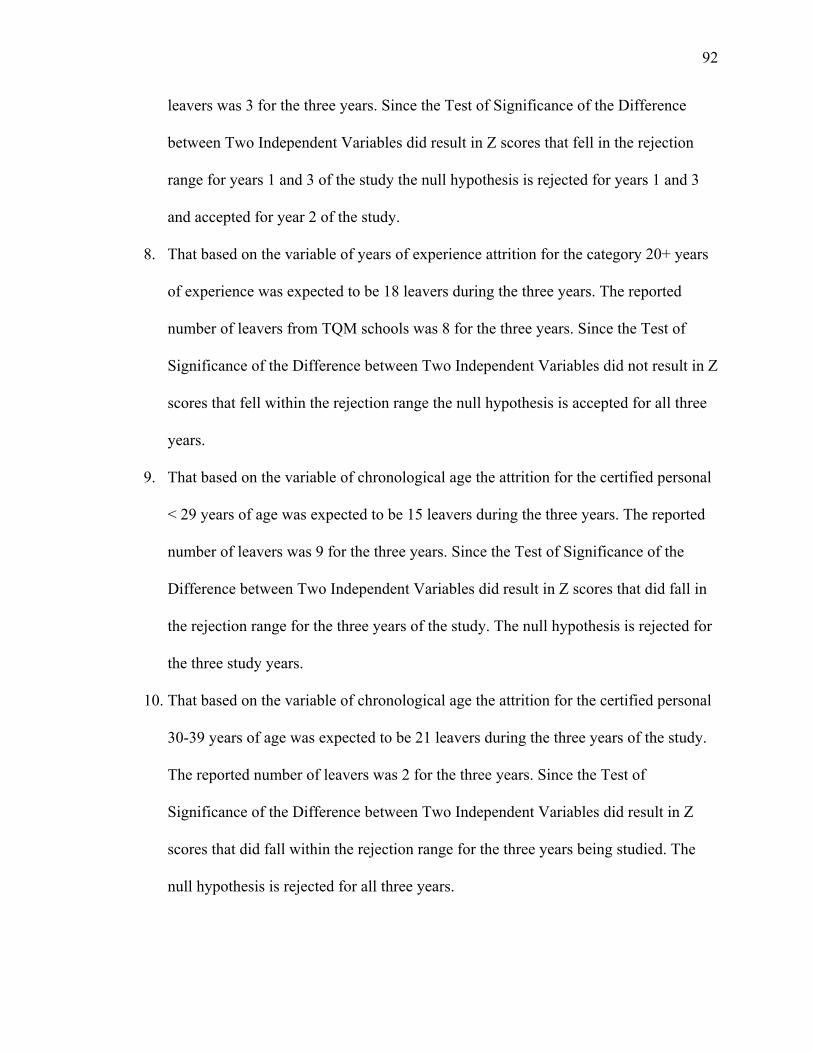
92
leavers was 3 for the three years. Since the Test of Significance of the Difference
between Two Independent Variables did result in Z scores that fell in the rejection
range for years 1 and 3 of the study the null hypothesis is rejected for years 1 and 3
and accepted for year 2 of the study.
8. That based on the variable of years of experience attrition for the category 20+ years
of experience was expected to be 18 leavers during the three years. The reported
number of leavers from TQM schools was 8 for the three years. Since the Test of
Significance of the Difference between Two Independent Variables did not result in Z
scores that fell within the rejection range the null hypothesis is accepted for all three
years.
9. That based on the variable of chronological age the attrition for the certified personal
< 29 years of age was expected to be 15 leavers during the three years. The reported
number of leavers was 9 for the three years. Since the Test of Significance of the
Difference between Two Independent Variables did result in Z scores that did fall in
the rejection range for the three years of the study. The null hypothesis is rejected for
the three study years.
10. That based on the variable of chronological age the attrition for the certified personal
30-39 years of age was expected to be 21 leavers during the three years of the study.
The reported number of leavers was 2 for the three years. Since the Test of
Significance of the Difference between Two Independent Variables did result in Z
scores that did fall within the rejection range for the three years being studied. The
null hypothesis is rejected for all three years.
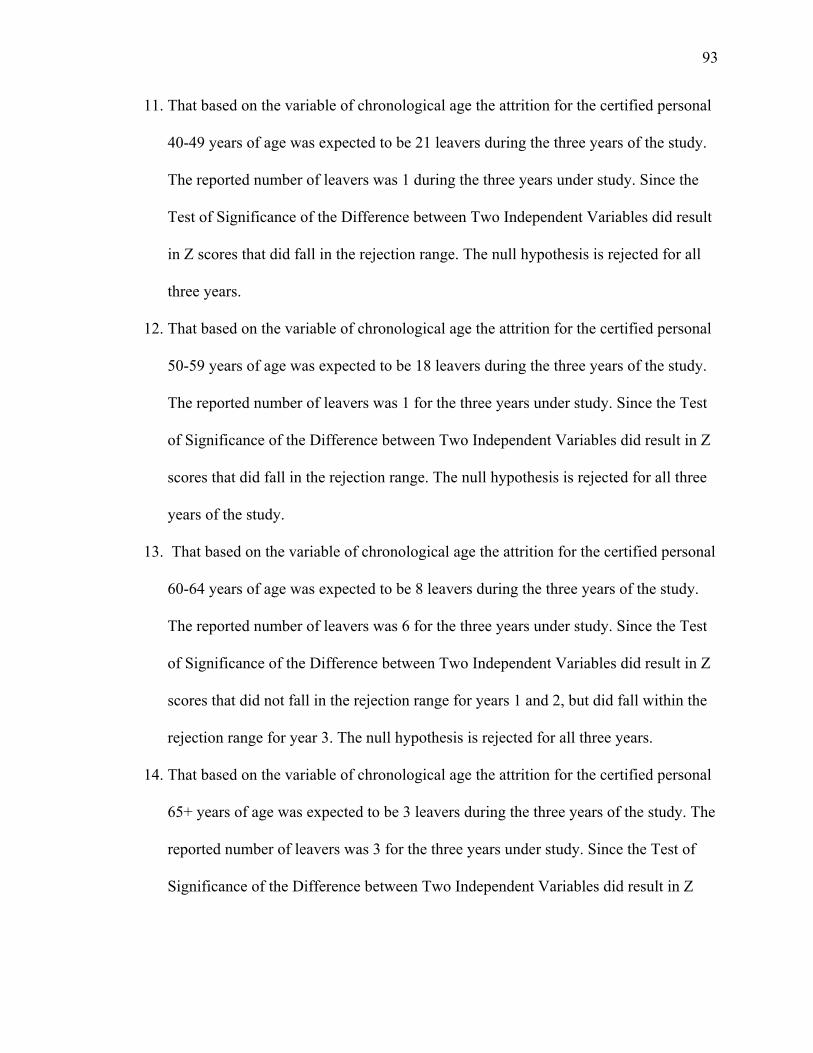
93
11. That based on the variable of chronological age the attrition for the certified personal
40-49 years of age was expected to be 21 leavers during the three years of the study.
The reported number of leavers was 1 during the three years under study. Since the
Test of Significance of the Difference between Two Independent Variables did result
in Z scores that did fall in the rejection range. The null hypothesis is rejected for all
three years.
12. That based on the variable of chronological age the attrition for the certified personal
50-59 years of age was expected to be 18 leavers during the three years of the study.
The reported number of leavers was 1 for the three years under study. Since the Test
of Significance of the Difference between Two Independent Variables did result in Z
scores that did fall in the rejection range. The null hypothesis is rejected for all three
years of the study.
13. That based on the variable of chronological age the attrition for the certified personal
60-64 years of age was expected to be 8 leavers during the three years of the study.
The reported number of leavers was 6 for the three years under study. Since the Test
of Significance of the Difference between Two Independent Variables did result in Z
scores that did not fall in the rejection range for years 1 and 2, but did fall within the
rejection range for year 3. The null hypothesis is rejected for all three years.
14. That based on the variable of chronological age the attrition for the certified personal
65+ years of age was expected to be 3 leavers during the three years of the study. The
reported number of leavers was 3 for the three years under study. Since the Test of
Significance of the Difference between Two Independent Variables did result in Z
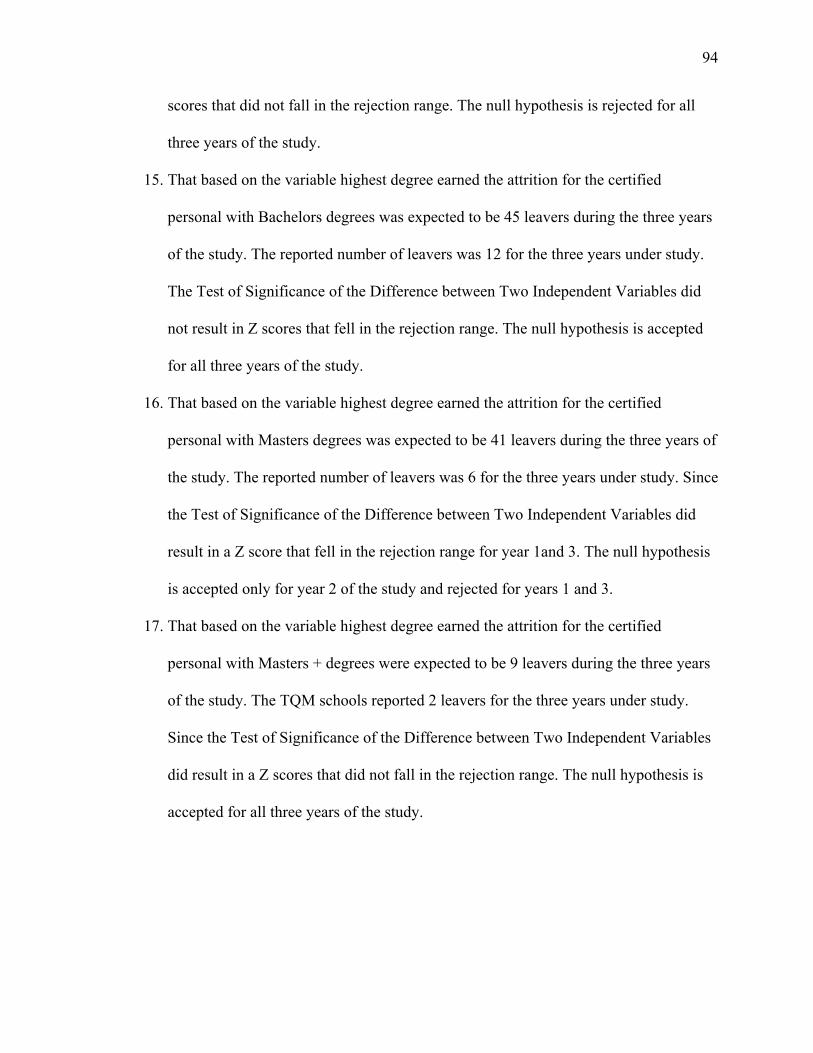
94
scores that did not fall in the rejection range. The null hypothesis is rejected for all
three years of the study.
15. That based on the variable highest degree earned the attrition for the certified
personal with Bachelors degrees was expected to be 45 leavers during the three years
of the study. The reported number of leavers was 12 for the three years under study.
The Test of Significance of the Difference between Two Independent Variables did
not result in Z scores that fell in the rejection range. The null hypothesis is accepted
for all three years of the study.
16. That based on the variable highest degree earned the attrition for the certified
personal with Masters degrees was expected to be 41 leavers during the three years of
the study. The reported number of leavers was 6 for the three years under study. Since
the Test of Significance of the Difference between Two Independent Variables did
result in a Z score that fell in the rejection range for year 1and 3. The null hypothesis
is accepted only for year 2 of the study and rejected for years 1 and 3.
17. That based on the variable highest degree earned the attrition for the certified
personal with Masters + degrees were expected to be 9 leavers during the three years
of the study. The TQM schools reported 2 leavers for the three years under study.
Since the Test of Significance of the Difference between Two Independent Variables
did result in a Z scores that did not fall in the rejection range. The null hypothesis is
accepted for all three years of the study.
95
CHAPTER 5
SUMMARY AND DISCUSSION
The purpose of this study was to investigate the relationship between certified
personal attrition and changes in the adult workplace brought about through the
implementation of Total Quality Management in public schools. Further, the study
expected to determine demographic characteristics that would identify personnel most
likely to leave. It was hoped that by identifying the likely leavers that attention to their
needs could be given and measures could be developed to address their concerns.
Through the development of counter-measures, the cost of replacing the certified
personal could be saved. A TQM sample of four hundred and forty seven certified
teachers and administrators were gathered. This sample group was compared to a TFS
1994-1995 sample group of four thousand five hundred twenty eight. This chapter will
provide the reader with a concise summary of the study.
Summary
Six hypotheses were tested at the p<. 05 and p<. 01 critical levels. The data was
compared using a Test of Significance of Difference between Two Proportions. The data
under analysis consisted of two samples drawn independently. The first survey was
conducted by the U.S. Department of Education. It was based on interviews with 4528
certified personal and conducted as part of a continuous study of teacher attrition. The
second was conducted for this study and involved principals using TQM and returning a
96
survey on attrition during the implementation period. The difference between the two
proportions is being tested, the null hypothesis is assumed. The variables chosen for the
study were level being taught (secondary or elementary), the highest degree held, age,
number of years teaching, and ethnic background. These variables were analyzed in
terms of difference to the proportions that occurred in the two surveys. A yearly
projected number of leavers were projected in each category.
Implications
The ramification for a district’s senior education leadership contemplating
implementing TQM and concerned about attrition is that it may result in staff remaining.
Attrition should not be a factor against the adoption of a TQM program. As noted in
chapter 4 in tables 2, 3, and 4 the data rejects the hypothesis that there is no significant
difference or an increase of attrition between the TFS 1994-1995 study and TQM schools
under study. The reported data supports the hypothesis that there is a statistically
significant lowering of the attrition numbers in the TQM schools under study. When the
data is broken down into elementary and secondary schools the data continues to support
the hypothesis that there is a significant lowering of the attrition at TQM schools during
the first three years of implementation. The attrition numbers reported in all three tables
were statistically significant, the p< .05 being the criteria of significance. These results
are organizationally significant to any school district or school that is in the planning
stages of implementing TQM in their school. The attrition of certified personnel can have
a disrupting effect on school programs.
As tested and noted in the data age, earned degrees, teaching level and years of
experience were variables that could be used to distinguish leaves from stayers. Timing
97
might be added to the list since during years 1 and 3 the attrition of certified personnel is
lower then during year 2 of implementation. The profile of leavers was evident where the
variables of degrees, age, years of experience. The most likely leavers would have less
then 9 years experience and possess a Bachelors or Masters + degrees, teach at an
elementary level, and leave during the year 2 of implementation. Conversely, the most
likely certified personnel to remain would be 40-59 with 10-20 years of experience,
possess a Masters degree and be in year 1 or year 3 of implementation. It may be that for
this group their experiences and intelligence are leading them to address problems that
they recognize and they are interested in innovation. They may wish to leave a legacy
and improve their last years of teaching before retirement. The data involved in
describing these profiles does differ from the profiles of leavers and stayers in the TFS
1994-1995 study. There is a tendency revealed in the TQM sample to remain teaching
while in their sixties which is counter to the national TFS 1994-1995 data.
The gathered data on TQM schools does not indicate an increase in attrition. The
data when tested leads to the observation that in categories where the data did not fall
into the rejection range the attrition characteristics were similar to those reported in TFS
1994-1995.
Recommendations
As a result of this study, the following recommendations for further study were
generated:
1. Conduct a study focused on measuring principal’s attitudes before, during,
and at the end of the implementation process.

98
2. Study the leaders during the implementation process and their strategies to
implement TQM in their schools. Observe by charting behaviors that the
leadership at both the school and district levels holds the belief that TQM is a
visible, viable, and effective planned change method, when properly installed.
3. Develop observation and surveys that address if a school is ready for TQM.
Some schools described by Germinario and Ogden as Conventional Schools
would not be ready to accept the changes brought by TQM. As part of the
development of the observation and survey instruments test them in schools
and return after implementation or implementation failure to determine
perimeters for readiness
4. A greater examination of the organizational cultures of successful TQM
schools and schools that failed in their implementation efforts should be
undertaken..
5. Study the evolving quality culture and compare these work culture changes
with other school improvement techniques and issues.
6. Research to reveal how certified personnel are using statistical sampling to
uncover data and drive the process should be done.
7. Research can reveal if quality circles are successful and if they make a
difference in student achievement.
8. Examine the changes that lead to districts dropping TQM to determine if each
school’s leadership committed themselves to the idea that the TQM paradigm
involves long term, large-scale cultural change.
99
In summary, remember that changing a school’s culture to TQM is a difficult,
comprehensive, and long process. TQM gives principals and their certified personnel an
increased ability to synthesize, analyze, and evaluate process. The data gathered while
using TQM processes permits the principal and the senior leadership to exercise greater
control over the outcomes. Leaders will need to maintain their commitment, keep the
focus of their certified personnel on the quality process, leadership must provide the
necessary support, and hold personnel responsible for following through on the gathered
data. The principal sets the tone, oversees the gathering of the data tat guides the school’s
continuous improvement cycle.

100
REFERENCES
Achievement in America GEAR-UP (April, 2000)
http://ed.gov/offices/OPE/gearup/TRIO Conference.ppt-size189.OK U.S. Department of
Education Mirror
Bobbitt, S. A., Faupel, E., & Burns, S. (1991). Characteristics of stayers, movers,
and leavers: Results from the teacher follow-up survey, 1988-1989. (NCES 91-128)
Washington, DC: U.S. Department of Education.
Bonstingl, J. (1992). Schools of quality: An introduction to total quality management
in education, Alexandra, VA: ASCD.
Brown, M.G. (1993). Baldrige Award winning quality: How to interpret the
Malcolm Baldrige Award Criteria, Milwaukee, WI: ASQC Quality Press.
Brown-Frierson, J. (1994). A study in organizational change: The attitudes of
personnel toward total quality management implementation in a state department of
education (Doctoral dissertation, Morgan State University, 1994). UMI Dissertation
Services, 0514AAC.
Calek, A. (1995). Quality progress' fifth quality in education listing. Quality
Progress, 28 (9) 27-4.
Campbell, D. T., & Stanley, J.C. (1963). Experimental and quasi-experimental
designs for research. Boston: Houghton Mifflin.
Capezio, P., & Morehouse, D. (1993). Taking the mystery out of TQM: A practical
guide to Total Quality Management. New York: Career Press.
Davis, S.M. (1984). Managing the corporate culture. Cambridge, MA: Ballinger
Publishing Company.
Deming, W.E. (1950). Some theory of sampling. New York: Dover.
Deming, W.E. (1986). Out of crisis. (2nd Ed.), Cambridge, MA: MIT Press.
101
Deming, W.E. (1993). Dr. Deming talks to educators. Arlington, VA: American
Association of School Administrators.
Deming, W.E. (1999). The new economics. (5th Ed.), Cambridge, MA: MIT Press.
Detert, J.R. & Mauriel, J.J. (March, 1997). Using the lessons of organizational
change and previous school reforms to predict innovation outcomes: Should we expect
more from TQM? Paper presented at the annual meeting of the American Educational
Research Association Chicago, IL.
Ehrenberg, R.G., & Smith, R.S. (1991). Modern labor economics. (4th Ed.) New
York: Harper Collins.
Feigenbaum, A. V. (1983). Total quality control. (3rd Ed.) New York: McGraw-Hill.
Ferguson, G.A. (1966). Statistical analysis in psychology and education (2nd. Ed.)
New York: McGraw-Hill.
Fernandez, R.R. (1995). Total quality in purchasing and supplier management.
Delray Beach, FL. St. Lucie Press.
Fields, J.C. (1993). Total quality for schools: A suggestion for American education.
Milwaukee, WI: ASQC Quality Press.
Fondelier, S., Gruber, K., & Rohr, C. (1994). 1993-94 Schools and staffing survey:
Data file user’s manual, volume 1: Survey documentation. U.S. Department of Education,
National Center for Education Statistics (NCES 96-142-1).
Fondelier, S., et al. (1997). Characteristics of stayers, movers, and leavers: Results
from the teacher follow-up survey, 1994-1995. (NCES 97-450) Washington, DC: U.S.
Department of Education.
Fox, D. J. (1969). The research process in education. New York: Holt, Rhinehart and
Winston.
Georgia Department Of Education (2002) Working Draft State of Georgia
consolidated application under reauthorized Elementary and Secondary Education Act
2001 (No Child Left Behind). http//:www.doe k-12 ga us.
102
Germinario, V., & Ogden, E.V., (1994). The nation’s best schools: Blueprints for
excellence. Lancaster, PA: Technomic Publishing.
Glasser, W. (1992). The quality school: Managing students without coercion (2nd
ed.) New York: Harper Collins.
Glickman, C. D. (1985). Developing teacher thought. Journal of Staff
Development,7 (1), 6-21
Glickman, C. (1990). Supervision of instruction: A developmental approach. (2nd
Ed.) New York: Allyn and Bacon.
Goodlad, J. I. (1984). A place called school. New York: McGraw-Hill.
Halloway, S. (1988). Concepts of ability and effort in Japan and the United States.
Review of Educational Research, 37, 408-412.
Horine, J. E. (1992). Reading, writing, and quality tools. Quality Progress, 25 (10),
33-36
Horine, J., Hailey, & W., & Rubach, L. (1993). Transforming schools. Quality
Progress, 26 (10), 31-38.
Hoy, W., & Forsyth, P. (1986). Effective supervision: Theory into practice. New
York: Random House.
Imai, M. (1986). Kaizen: The key to Japan’s competitive success. New York:
McGraw-Hill.
Joyce, B., Bennett, B., & Rolheiser-Bennett, C. (1990). The self-educating teacher:
Empowering teachers through research. Changing school culture through staff
development. Alexandria, VA: ASCD.
Joyce, B., & Murphy, C. (1990). Epilogue: The curious complexities of cultural
change. Changing school culture through staff development, Alexandria, VA: ASCD.
Juran, J. M. (1988). Juran on planning for quality. New York: Free Press.
Klaus, L. (1996). Quality progress' 6th quality in education listing. Quality Progress,
29, (8), 29-40.
103
Klaus, L. (1997). Quality progress' 7th quality in education listing. Quality Progress,
30 (9), 31-42.
Kondo, Y. (1990). Creativity in daily work. Human Systems Management, 9, 7-13.
Lau, J., & Shani, A. (1992). Behavior in organizations: An experimental approach
(5th Ed.) Homewood, IL: Irwin.
Mann, N. R. (1987). The keys to excellence: The story of the Deming philosophy.
(2nd Ed.). Los Angeles: Prestwick.
Malcolm Baldrige National Quality Improvement Act of 1987 Public Law 100-107
August 20, 1987
Malcolm Baldrige National Quality Award education pilot criteria (1995),
Gaithersburg, MD: National Institute of Standards and Technology (NIST)
Milakovich, M. (1991). Total Quality Management in the public sector National
Productivity Review 10, 195213
Neuroth, J., Plastrik, P., & Cleveland, J. (1992). TQM handbook: Applying the
Baldrige criteria to schools. Arlington, VA: American Association of School
Administrators.
Ozeki, K., & Asaka, T. (1990). Handbook of quality tools: The Japanese approach.
(D. Cowhig Trans.) Cambridge, MA: Productivity Press (Original work published 1988).
Packard, T (1996). TQM and organizational change and development. New York:
Reid Moornaugh & Associates
Patterson, J. L., Purkey, S. C., & Parker J. V. (1986). Productive school systems for a
nonrational world. Alexandria, VA: ASCD.
Ravitch, D. (2000). Left back: A century of failed school reforms New York: Simon
& Schuster.
Rubach, L. (1994). Quality progress fourth annual quality in education listing.
Quality Progress, 27 (9), 43.
Schmidt, W.H., & Finnigan, J.P. (1993). TQ Manager: A practical guide for
managing in a Total Quality Organization. San Francisco: Jossey-Bass Publishers.
104
Schenkat, R. (1993). Quality connections: Transforming schools through Total
Quality Management. Alexandria, VA: ASCD.
Schmoker, M. (1996) Results: The key to continuous school improvement.
Alexandria, VA: ASCD
Senge, P.M. (1994). The fifth discipline: The art and practice of the learning
organization. New York: Currency Doubleday.
Steverson, H., Lee,S., & Stigler, J.W.(1986). Mathematics achievement of Chinese,
Japanese, and American children. Science, 231, 693-699.
Swiss, J. (1992) Adapting TQM to government. Public Administration Review, 52,
356-362.
Trenta, L. (1992). The application of W. Edwards Deming's principles to the Akron
City School District: A journal of the first year. (ERIC Document Reproduction Services
No: ED 357427)
U.S. Department of Commerce Technology Administration & National Institute of
Standards and Technology. (1995). The Malcolm Baldrige National Quality Award: 1995
Education pilot program. Gaithersburg, MD: National Institute of Standards and
Technology.
U.S. Department of Education, National Center for Education Statistics, Teacher
Follow-up Survey, 1988-89, 1991-92, and 1994-95 (1997) The condition of education
1997 indicator 58: Attrition among full-time public and private school teachers.
http//www.ed.gov/pubs/index.html.
Walton, M. (1986). The Deming management method. New York: Putnam.
Weinberg, S., & Goldberg, K.(1990). Statistics for the behavioral sciences.
Cambridge, U.K. Cambridge University Press.
Weller, L. D. (1993). Total Quality Management: A conceptual overview and
applications for education. Athens, GA: University
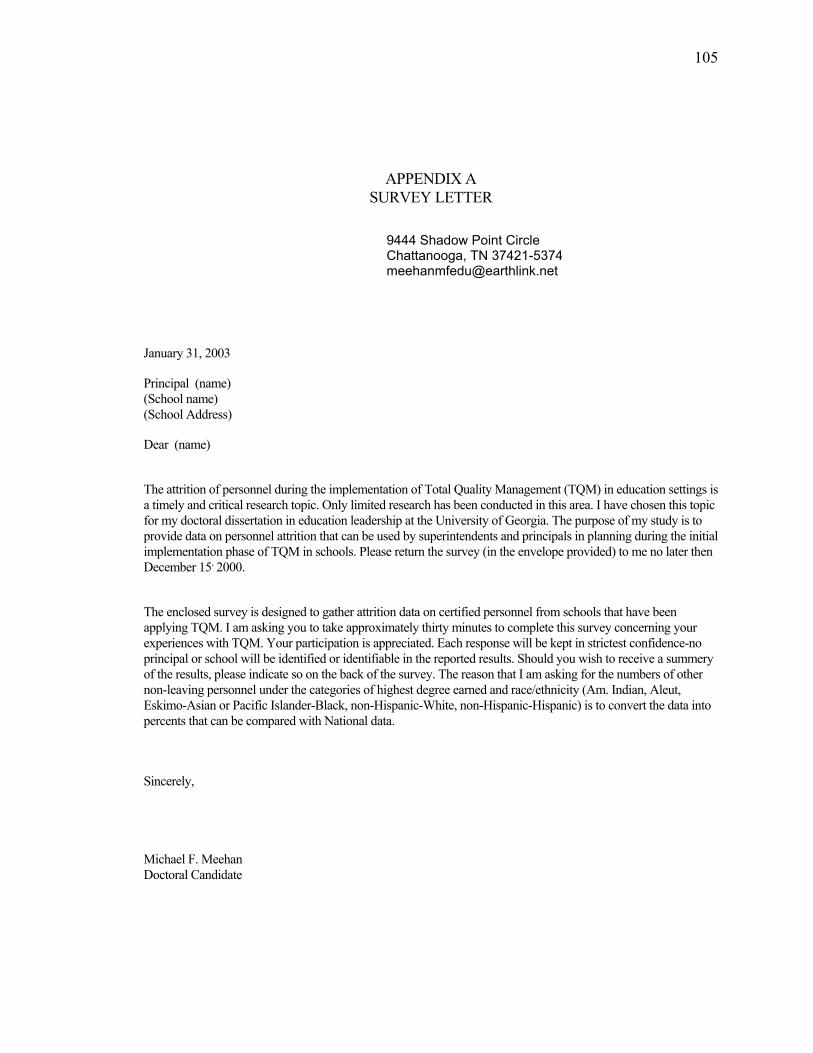
105
APPENDIX ASURVEY LETTER
January 31, 2003
Principal (name)(School name)(School Address)
Dear (name)
The attrition of personnel during the implementation of Total Quality Management (TQM) in education settings isa timely and critical research topic. Only limited research has been conducted in this area. I have chosen this topicfor my doctoral dissertation in education leadership at the University of Georgia. The purpose of my study is toprovide data on personnel attrition that can be used by superintendents and principals in planning during the initialimplementation phase of TQM in schools. Please return the survey (in the envelope provided) to me no later thenDecember 15, 2000.
The enclosed survey is designed to gather attrition data on certified personnel from schools that have beenapplying TQM. I am asking you to take approximately thirty minutes to complete this survey concerning yourexperiences with TQM. Your participation is appreciated. Each response will be kept in strictest confidence-noprincipal or school will be identified or identifiable in the reported results. Should you wish to receive a summeryof the results, please indicate so on the back of the survey. The reason that I am asking for the numbers of othernon-leaving personnel under the categories of highest degree earned and race/ethnicity (Am. Indian, Aleut,Eskimo-Asian or Pacific Islander-Black, non-Hispanic-White, non-Hispanic-Hispanic) is to convert the data intopercents that can be compared with National data.
Sincerely,
Michael F. MeehanDoctoral Candidate
9444 Shadow Point CircleChattanooga, TN [email protected]

106
APPENDIX B
DESCRIPTIVE INFORMATION ABOUT PERSONNEL LEAVING DURING
THE FIRST THREE YEARS OF TQM IMPLEMENTATION
Years ofTeaching
Person’sPosition
Year ofLeaving
HighestDegree
Race/Ethnicity Age Last fourDigits of
EmployeeNumber
1 2 3
1 2 3
1 2 3
1 2 3
1 2 3
1 2 3
1 2 3
1 2 3
1 2 3
How many administrators are assigned to your school?
How many teachers are assigned to your school?