tours and activities market case study
TRANSCRIPT


1. Define sources of information on travel market (web-search). 2. Collect data and make overview of travel market (capacity, regions, segments, players, trends). 3. Define sources of information on T&A segment (web-search, travel industry portals, public market research,
experts opinions, press release and financial reports, startup databases). 4. Collect data and make overview of T&A segment (products, players, sales, forecasts, M&As) 5. Make in-depth research on major players (products, regions, traffic, sales) 6. Opportunities and Threats 7. Make a conclusion
Plan of the research
Skift.com, Tnooz.com, Phocuswright.com, Alexa.com, SimilarWeb.com, Datanyze.com, AppAnnie.com, Crunchbase.com, Techcrunch.com, Google.com, Google Trends, Quora.com, Wikipedia.com.
Sources used
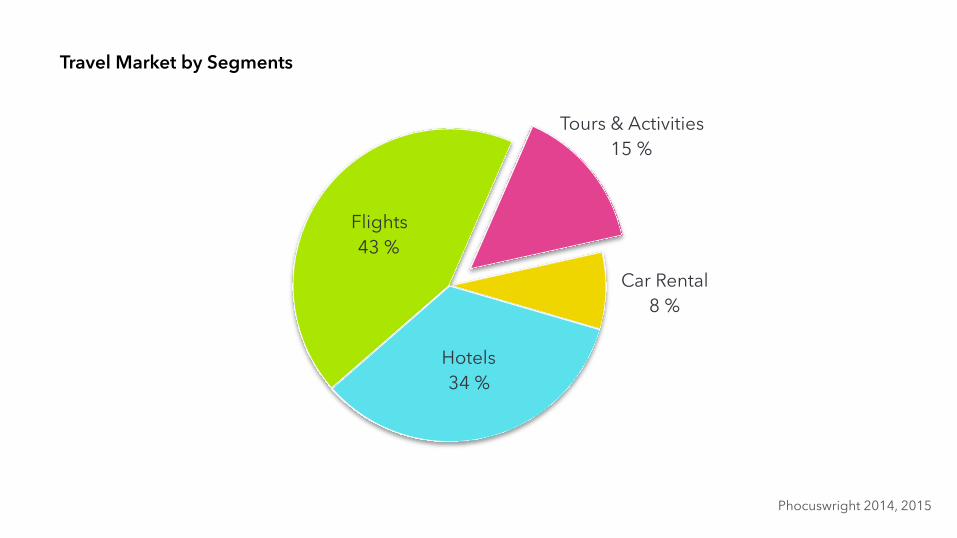
Travel Market by Segments
Car Rental 8 %
Tours & Activities 15 %
Flights 43 %
Hotels 34 %
Phocuswright 2014, 2015
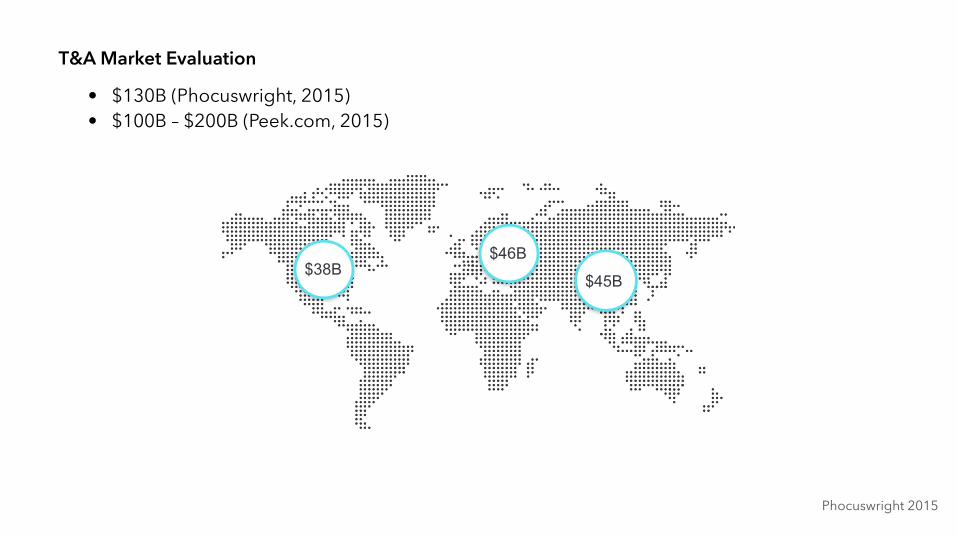
T&A Market Evaluation
• $130B (Phocuswright, 2015) • $100B – $200B (Peek.com, 2015)
$46B$38B
$45B
Phocuswright 2015

T&A is not a market segment. It’s an umbrella term for 50+ distinct segments.
Phocuswright 2015
Not a Segment

Phocuswright 2015
T&A Segments by Revenue
Tours & ExcursionsAdventures
Performing ArtsGround Transportation
Events, SportsSPA & Wellness
Theme ParksCultural attractions
MuseumsNatural attractions
Other 2 %1 %
3 %4 %
6 %7 %
8 %11 %
14 %20 %
24 %
Tours and ActivitiesTicketed EventsTransportationAttractionsOther

Skift, Tnooz, Phocuswright, 2012, 2015
T&A Growth
2012 2015
$11B$6B
$38B
$24B
Total Online
2012 2015
$13B$9B
$46B$37B
Total Online
YOY Growth – 14% YOY Growth – 6%
America
YOY Growth – 20%
Online travel activities bookings are growing significantly faster than the total T&A market.
Europe
YOY Growth – 11%

Tnooz, Phocuswright, 2014, 2015
T&A Supplier Portrait
T&A landscape is filled with small local companies. 80% of those are still operate offline. 82% of the service providers are taking bookings by phone or via email. They typically lack the resources and/or expertise to implement online distribution of their products.
Email, Phone, Fax 82 %
<$250К $250К-1M $1M-5M $5M-100M >$100M
1 %
15 %
24 %25 %
35 %
Suppliers by Annual Gross Revenue T&A Bookings by Channels

There is no major platform or GDS to connect travel activity suppliers to travel sellers. Some attempts were made like BookingBoss, Rezdy, Rezgo, TourCMS and others, but none of them dominates.
Online travel agencies have been too preoccupied with hotels and flights to focus on T&A with its relatively low margins and a myriad of very small suppliers. Though, now it seems major players got exited to go beyond their core features and intend to become service solutions throughout the entire travel cycle, including aggregated in-destination activities.
GDS
OTA are getting interested
Plenty of startups
Lack of attention from major OTAs drove to blossoming of T&A startups, which aggregate activities products by contracting directly with suppliers. Often playing both a B2C and B2B role, aggregators provide connectivity and access to activities content for other parts of the travel ecosystem such as online travel agencies, travel media sites, and airline and hotel websites.

T&A Sellers
Expedia TripAdvisor
TUI

Expedia is one of the largest travel company in the world with such brands as Expedia, Orbitz and Travelocity. All websites offer tours and activities from direct partners as well as from reservation systems: BookingBoss, Rezdy, Rezgo, and TourCMS.
68М visitors per monthAudience by country Mobile appsWebsite traffic• United States – 81% • Israel – 1.5% • Saudi Arabia – 0.8% • Canada – 0.7% • United Arab Emirates – 0.7%
Google Play: 10М-50M
AppStore: N/A
SimilarWeb, AppAnnie, Google Trends, 2016

SimilarWeb, AppAnnie, Google Trends, 2016
Viator is wholly focused on tours and activities. It sells its products to a global consumer base at Viator.com, 60 additional consumer-facing websites, mobile websites and apps, and through its global network of affiliates. Viator’s lists 20,000 tours, activities and attractions and 600,000 reviews, photos, and videos posted by travellers. In 2014 been acquired by TripAdvisor for $200M. Later TripAdvisor been acquired by Priceline Group.
2015 ~ $100M (Skift, 2015)
9М visitors per month • United States – 40% • United Kingdom – 8% • Spain – 4.2% • Australia – 4.22% • Canada – 4.1%
Sales
AppStore: 1M+
Google Play: 500K-1M
Audience by country Mobile appsWebsite traffic

SimilarWeb, AppAnnie, Google Trends, 20162013 ~ $10M (Skift)
3М visitors per month
Sales
AppStore: 1M+
Google Play: 100K-500M
Audience by country Mobile appsWebsite traffic
GetYourGuide is one of the hottest startups in the tours and activities sector, selling over 30000 products in some 2,500 destinations. They look for direct operators who offer tours, attractions and activities. They have website, partner websites and mobile apps. Partner websites include travel websites, online agents, hotel websites, and tourism boards. Till 2014 has been exclusive T&A service provider for TripAdvisor.
• United States – 13% • United Kingdom – 9% • Spain – 5% • Canada – 4% • United Arab Emirates – 3.8%

A big part of online T&A sales is ticketed events – especially concerts, performing arts and professional sports. Tickets are booked through well-established ticket sellers.
Ticket Selles
Live Nation

Live Nation is the world's leading entertainment company with ~1000 concerts listed and 500M+ tickets sold annually worldwide.
• United States – 89% • Canada – 2.5% • United Kingdom – 1% • Australia – 0.9% • Mexico – 0.9%
SimilarWeb, AppAnnie, Google Trends, 2016
2015 – $1.6B
55М visitors per month
Sales
Google Play: 1M-5M
Audience by country Mobile appsWebsite trafficGoogle Play: 1M-5M
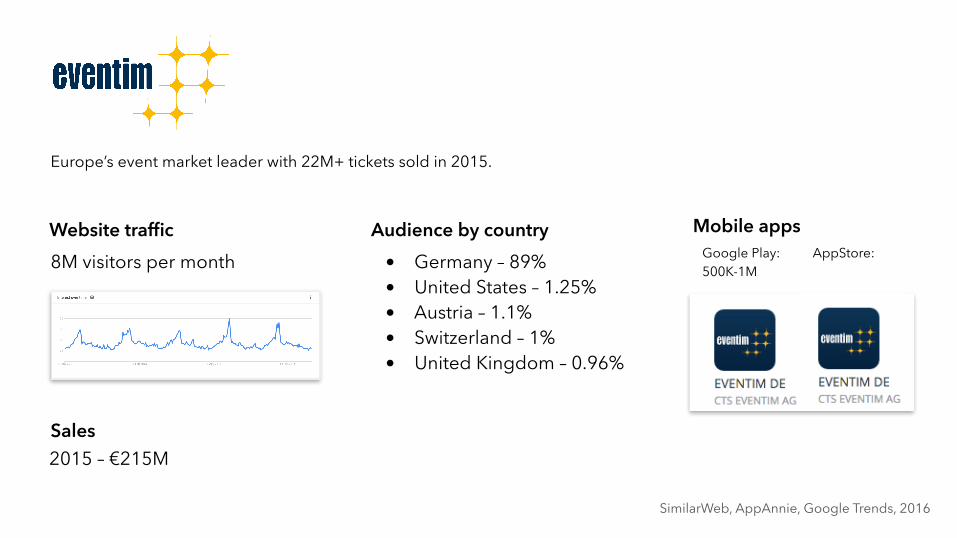
Europe’s event market leader with 22M+ tickets sold in 2015.
SimilarWeb, AppAnnie, Google Trends, 2016
2015 – €215M
8М visitors per month
Sales
Google Play: 500K-1M
Audience by country Mobile appsWebsite trafficAppStore: • Germany – 89%
• United States – 1.25% • Austria – 1.1% • Switzerland – 1% • United Kingdom – 0.96%

A standalone part of T&A segment with big-names. Players provide customers with listings of nearby restaurants and an seat-reservation in a click. Most players provide restaurant’s with business automation solutions.
TripAdvisor
Priceline Group
Dining
Michelin

14М visitors per month Google Play: 1M-5M
Audience by country Mobile appsWebsite trafficAppStore:
OpenTable provides solutions that connect restaurants and diners online. The company seats about 15 million diners per month at more than 31,000 restaurants. OpenTable charges restaurants a monthly fee to allow customers to book restaurant reservations online.
• United States – 91% • Canada – 4.2% • United Kingdom – 1.2% • Japan – 0.3% • India – 0.2%

1М visitors per month Google Play: 1M-5M
Audience by country Mobile appsWebsite traffic
European major restaurant reservation service (the so-called OpenTable of France) operating under the ‘LaFourchette’ brand in French, ‘Eltenedor' in Spanish and ‘TheFork’ in English. Company offers an online and mobile reservation platform for restaurants in France, Spain and other european contries, claiming to have a network of more than 40 000 restaurant partners.
• France – 16% • United States – 14% • Spain – 14% • United Kingdom – 9% • Italy – 8%

42М visitors per month Google Play: 5M-10M
Audience by country Mobile appsWebsite trafficAppStore:
Zomato is a restaurant search and discovery service. It currently operates in 23 countries, mainly in India, Australia and the United States It features restaurant information and other feature including table reservation feature.
• India – 32.7% • United States – 15% • Australia – 7.5% • Turkey – 6.5% • United Arab Emirates – 6%

Currently 90% of all activities are still booked in-destination (Viator), but there are several types of activities that travellers are most likely to be book in advance: music concerts, music festivals, major spectator sports and ski-passes.
Segment by Importance and Booking Window
Phocuswright, 2014
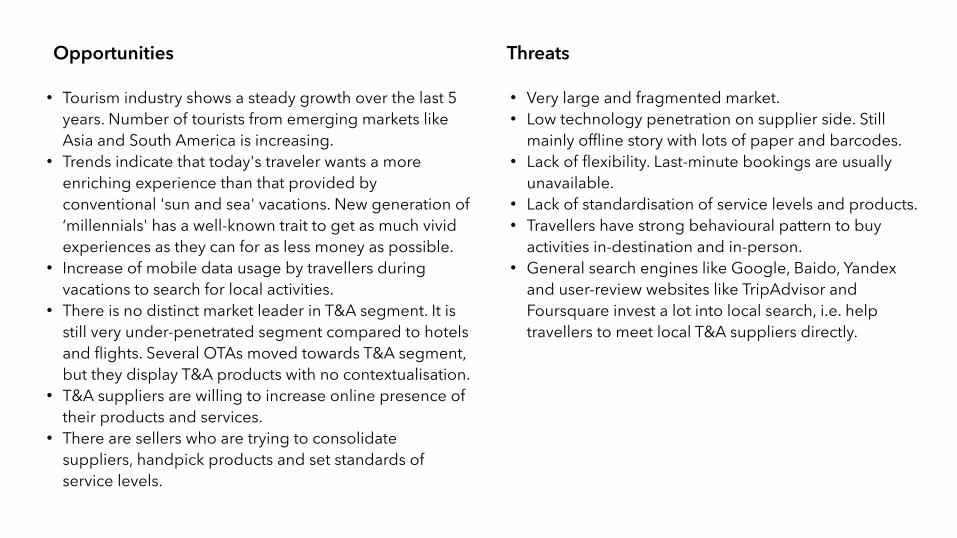
Opportunities Threats
• Tourism industry shows a steady growth over the last 5 years. Number of tourists from emerging markets like Asia and South America is increasing.
• Trends indicate that today's traveler wants a more enriching experience than that provided by conventional 'sun and sea' vacations. New generation of ‘millennials' has a well-known trait to get as much vivid experiences as they can for as less money as possible.
• Increase of mobile data usage by travellers during vacations to search for local activities.
• There is no distinct market leader in T&A segment. It is still very under-penetrated segment compared to hotels and flights. Several OTAs moved towards T&A segment, but they display T&A products with no contextualisation.
• T&A suppliers are willing to increase online presence of their products and services.
• There are sellers who are trying to consolidate suppliers, handpick products and set standards of service levels.
• Very large and fragmented market. • Low technology penetration on supplier side. Still
mainly offline story with lots of paper and barcodes. • Lack of flexibility. Last-minute bookings are usually
unavailable. • Lack of standardisation of service levels and products. • Travellers have strong behavioural pattern to buy
activities in-destination and in-person. • General search engines like Google, Baido, Yandex
and user-review websites like TripAdvisor and Foursquare invest a lot into local search, i.e. help travellers to meet local T&A suppliers directly.

Conclusion
1. Online Tours & Activities segment is becoming mature.
2. It’s the right time for OTAs and meta-search services start exposing T&A products to customers.
3. Partnering with major T&A platforms as BookingBoss, Rezdy, Rezgo or TourCMS makes a lot of sense for OTAs. Contextual embedding into Flights and Hotels verticals, combined with smart upsale strategy (web, mobile, email, push) will increase ARPU.
4. Meta-search services are in trouble. Implementing of direct strategy «find the best price» at the moment is unlikely to succeed due to small search base (low number of T&A sellers) and low price completion between sellers. Currently the best strategy for them is also be partnering with T&A platforms mentioned above.
5. As customers have strong behaviour pattern to buy T&A product in-destination and in-person, OTAs and meta-search services should expose products, which a likely to be booked before departure, i.e. ticketed events, ground transportation, ground/water/air tours and ski passes.
