toward predictive models for estimation of … · solution gas ratio, oil api gravity, gas specific...
TRANSCRIPT

ISSN 0104-6632 Printed in Brazil
www.abeq.org.br/bjche
Vol. 33, No. 04, pp. 1083 - 1090, October - December, 2016 dx.doi.org/10.1590/0104-6632.20160334s20150374
*To whom correspondence should be addressed
Brazilian Journal of Chemical Engineering
TOWARD PREDICTIVE MODELS FOR ESTIMATION OF BUBBLE-POINT PRESSURE AND
FORMATION VOLUME FACTOR OF CRUDE OIL USING AN INTELLIGENT APPROACH
D. Abooali1 and E. Khamehchi2*
1School of Chemical Engineering, Iran University of Science and Technology, (IUST), Postal Code, 16765-163, Tehran, Iran.
2Faculty of Petroleum Engineering, Amirkabir University of Technology, Hafez Avenue, 15914, Tehran, Iran. Phone: + 98 (21) 64545154; Fax: + 98 (21) 64543528
E-mail: [email protected]
(Submitted: June 14, 2015 ; Revised: September 1, 2015 ; Accepted: September 2, 2015)
Abstract - Accurate estimation of reservoirs fluid properties, as vital tools of reservoir behavior simulation and reservoir economic investigations, seems to be necessary. In this study, two important properties of crude oil, bubble point pressure (Pb) and formation volume factor (Bob), were modelled on the basis of a number of basic oil properties: temperature, gas solubility, oil API gravity and gas specific gravity. Genetic programming, as a powerful method, was implemented on a set of 137 crude oil data and acceptable correlations were achieved. In order to evaluate models, two test datasets (17 data for Pb and 12 data for Bob) were used. The squared correlation coefficient (R2) and average absolute relative deviation (AARD %) over the total dataset (training + test) are 0.9675 and 8.22% for Pb and 0.9436 and 2.004% for Bob, respectively. Simplicity and high accuracy are the advantages of the obtained models. Keywords: Crude oil; Bubble point pressure; Formation volume factor; Genetic programming.
INTRODUCTION
Thermodynamic quantities of crude oil are a set of important features in order to determine technical specifications of oil production process equipment. Designing plenty of systems such as upstream and underground devices, surface operation equipment, etc., requires adequate and accurate information about oil parameters which are achieved, in many cases, from experimental tests along with mathemati-cal correlations and formulas.
Laboratory tests are usually expensive and some-times difficult and time-consuming. However, the application of correlations is economically advanta-geous and increases the speed of works. Further-more, the other great use of the correlations is to
determine oil future specifications and changes taken into great consideration in reservoir simulators.
Various pressure-volume-temperature (PVT) prop-erties of crude oil can be estimated by means of equations of state or oil PVT analysis, if a complete set of variables of the oil including temperature, pressure and fluid composition are available. But in many cases, the composition of reservoir fluid is not predetermined, especially in the primary stages of recovery processes. Thus, some correlations are re-quired to be functions of a number of readily availa-ble reservoir parameters in order to be used by engi-neers and scientists in this area.
In fact, the main aim of this project was to pro-vide simple and accurate models for prediction of bubble point pressure (Pb) and bubble point formation
1084 D. Abooali and E. Khamehchi
Brazilian Journal of Chemical Engineering
volume factor (Bob) solely as functions of simple and quickly accessible live crudeoil parameters. The parameters are temperature (T), gas solubility (Rs), oil API gravity and gas specific gravity (γg).
In a hydrocarbon system at constant temperature, whether single-component or mixture, the bubble point pressure is the maximum pressure at which the first gas bubbles appear (Ahmed, 2010). The state of the system in this condition is called “saturated liquid”.
The oil formation volume factor (FVF) is the ra-tio of the specific volume of oil at its natural tem-perature and pressure to the specific volume of the oil at standard conditions (i.e. P = 1 atm and T = 60 ˚F). If Bo is measured in the bubble point condition, it will be the bubble point oil formation volume factor (Bob).
There are several correlations and methodologies developed and proposed so far for prediction of Pb and Bob. Methods of Standing (1947), Vasquez and Beggs (1980), Glaso (1980), Marhoun (1988) and Petrosky and Farshad (1993), as famous correlations, have been introduced in the literature (Ahmed, 2010). Elsharkawy and Alikhan (1997) presented a set of correlations for gas solubility, oil compressibil-ity (Co) and Bob. Their relation for Bob is as follows:
( ) ( )( ) ( )
( )( )
5 5ob s
5
s g o
B 1 40.428 10 R 63.802 10
T – 60 0.78 10
R T – /60
− −
−
= + × +
× +
× γ γ
(1)
in which, γg is gas specific gravity. Khamehchi et al. (2009) also proposed three models for Pb, Rs and bubble point oil viscosity (μob). They called the achieved models “AUT”. Their Pb correlation is given below:
0.9129 0.666 0.2122 1.08b s gP 107.93 R T API− −= ×γ × × (2)
Some presented correlations or algorithms are
based on consistencies of a number of oil compo-nents or assays, which should be predetermined (El-sharkawy, 2003; AlQuraishi, 2009; Bandyopadhyay and Sharma, 2011; Farasat et al., 2013). However, the composition-based models have some limitations in their uses in preliminary reservoir investigations and simulations.
There are also several methods using the artificial neural network (ANN) technique to predict Pb and Bob (Rasouli et al., 2008; Asadisaghandi and Tah-masebi, 2011). Adaptive network-based fuzzy infer-
ence system (ANFIS) is another new approach that has been applied in this area (Shojaei et al., 2014).
Different procedures and methodologies can be used for model development. Artificial neural net-work (ANN), generalized regression neural networks (GRN), imperialist competitive algorithm (ICA), particle swarm optimization (PSO), adaptive net-work-based fuzzy inference system (ANFIS), genetic programing (GP), etc. are applied as famous methods in various fields, especially for optimization and pre-diction purposes. In the present study, a genetic pro-gramming based multi-gene symbolic regression al-gorithm called “GPTIPS” (Searson, 2009) was ap-plied. This is an approved method used by the authors in some projects (Abooali and Khamehchi, 2014).
The application of genetic programming for de-veloping simple-to-use correlations for Pb and Bob seems novel. Moreover, applying natural ranges of bubble point pressure, bubble point formation volume factor, temperature, gas solubility, oil API gravity and gas specific gravity has increased the applicabil-ity and accuracy of the new developed models.
MATERIALS AND METHODS Data Set
The total dataset includes 137 training sets of data from 137 oil samples. Each set includes temperature, solution gas ratio, oil API gravity, gas specific grav-ity, oil bubble point pressure and formation volume factor. The data were collected from different geo-graphical zones.
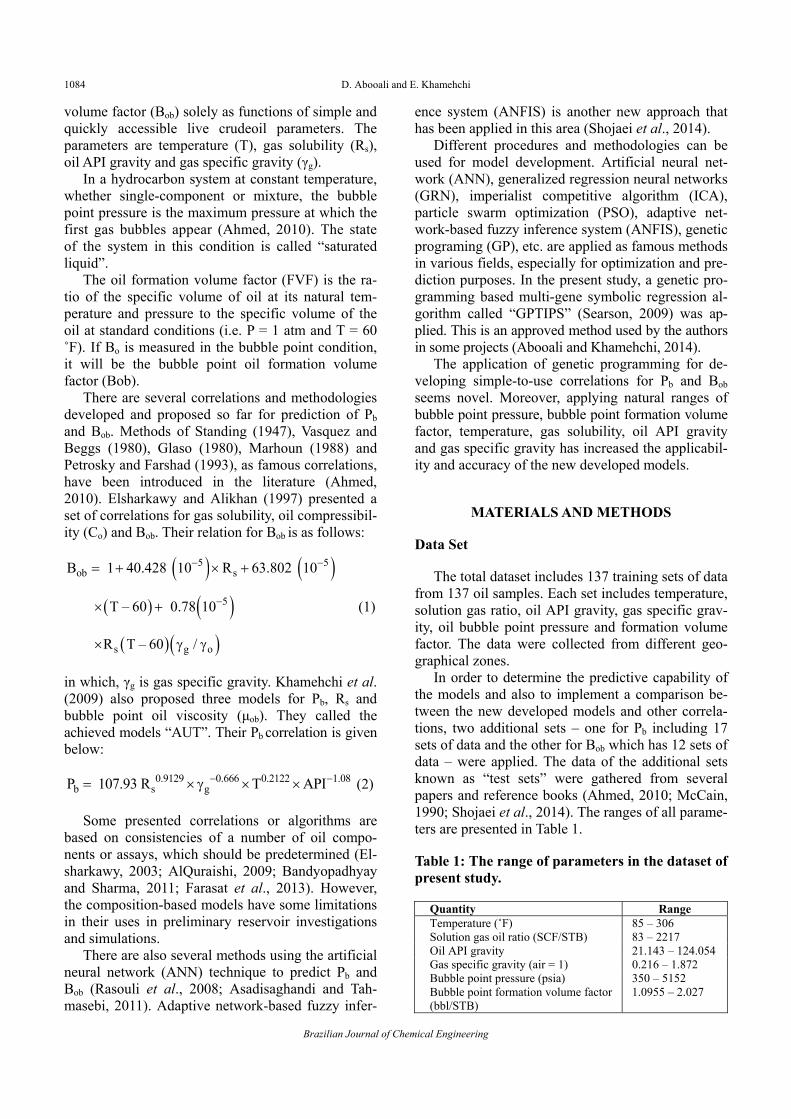
In order to determine the predictive capability of the models and also to implement a comparison be-tween the new developed models and other correla-tions, two additional sets – one for Pb including 17 sets of data and the other for Bob which has 12 sets of data – were applied. The data of the additional sets known as “test sets” were gathered from several papers and reference books (Ahmed, 2010; McCain, 1990; Shojaei et al., 2014). The ranges of all parame-ters are presented in Table 1. Table 1: The range of parameters in the dataset of present study.
Quantity Range Temperature (˚F) 85 – 306 Solution gas oil ratio (SCF/STB) 83 – 2217 Oil API gravity 21.143 – 124.054 Gas specific gravity (air = 1) 0.216 – 1.872 Bubble point pressure (psia) 350 – 5152 Bubble point formation volume factor (bbl/STB)
1.0955 – 2.027

M
ofrgb(1apanfatrnfakocomthuretumtrgfopm
ca“satbBseb
Fto
labas
Toward Predic
Model Develo
Genetic prlogy and itsrom biologiramming waeen develop1992). As anpplications ind modelingamous algorirusted methoew models har, for differind of regref GP. GP is omputer pro
machine learnhe random nder predeteepresented asures. The pri
mathematical ree structure ene is shownor a functioopulations a
mined by the When the
al models osymbolic regt first, the foy the user an
But in a symearches for behavior and
Figure 1: A sors: ×, + and
In GA, aftation (parentsy weighted s genes with
ctive Models for
Brazilian J
opment Pro
rograming (Gs programingcal generati
as introducedped mostly bn efficient toin mathematig projects. Githm based ood in correlhave been p
rent phenomession methoan evolution
ograms in ordning methodpopulation ermined rests chromosomimary populoperators opis often kno
n in Figure on. The numand complexuser. process is s
r functions, gression”. Inorm of the mnd then, modmbolic regreboth the modalso the mod
simple gene tanh.
ter random gs), the overalsummation oh a bias term
Estimation of Bu
Journal of Chemic
ocedure
GP) is a powg procedureion systemsd in the earlyby its innovaool, it has a ical and alsoenetic algorion genetic plation devel
produced by ena. In the p
od was applienary methododer to perfor
d that biologiof mathematrictions. Thmes like syntlation of funperating on iown as a “g1. Each gene
mber of genxity of genes
specificationthe GP is o
n conventionmodel shoulddel parameteression, the adel form descdel paramete
(tree structu
generation ofll primary moof all functiom. The weig
ubble-Point Pressu
cal Engineering V
werful meth was pattern. Genetic p
y 1990s and hator John Kowide variety
o computatioithm (GA), arograming, ilopment. Mause of GA,
present studyed on the baology involvrm tasks. It iically generaatical functioe populationtactic tree strnctions inclunput data. Ea
gene”. A sime mainly stannes, number s can be det
n of mathemoften knownnal regressiod be determinrs will be fittalgorithm itscribing the drs.
ure) with ope
f the first poodel is achievons represen
ght of each t
ure and Formatio
Vol. 33, No. 04,
hod-ned pro-has oza
y of onal as a is a any , so y, a asis
ving is a ates ons n is ruc-udes ach
mple nds
of ter-
mati-n as ons, ned ted. self data
era-
opu-ved
nted tree
ansquincAssomthewearesqu
Figtergen
treof sel(chsumweThatetio(SeGA19
of apprelgenan promosonsho
waMAgenpreing
on Volume Factor
pp. 1083 - 1090,
d the bias teuares technicluding two s can be seeme mathemae input variabeights of gene automaticauares. x1, x2
gure 2: Overm. d0, d1 anes.
In the next ees and mod
trees and elves) are imhildren), i.e.mmation of eights and alhis process ised until the laons) that are earson, 2010A are found e92). If the algorione, in fact,plied for prolations (multne consists oindividually
oaches oftenodels consistn, 2010). Thown in FigurA genetic
as prepared ATLAB softne symbolicevious operag over the be
r of Crude Oil Us
October - Decem
erm are calcuque. A simpgene structun in Figure atical operatbles. d0 is a b
nes. The optially obtainedand x3 are in
erall model and d2 are
step, crossinifications ofexchanging plemented to, new tree all new genelso the new s iterated andast populationable to solve
0). Complemelsewhere (S
ithm creates , a more accuoducing a poti-gene symbof one or my usual GP tn give simpting of one mhe flowcharre 3. algorithm t
by Searsotware. It wasc regression ations (generest trees, mut
sing an Intelligent
ember, 2016
ulated by an ple schematiures is show2, in each g
tors which abias term andimal weightsd by use of nput variable
of two genelinear coeff
ng over the bef trees (cuttincut parts b
to make a nestructures.
es is repeatebias term ar
d new populn contains nee the problem
mentary explaSearson et al
a number ofurate methodopulation ofbolic regress
more genes etree. Thus, mpler functionmonolithic Grt of genetic
toolbox callon (2009) s written ma
applicationrating parent
utating, produ
t Approach 10
ordinary leaic of a mod
wn in Figure gene there aare applied od d1 and d2 as for the genordinary leas.
es with a bificients of th
est performinng some par
between themew populatioThe weighted and the nere determinelations are crew trees (funm successfulanations abol., 2010; Koz
f genes insteadology will bf mathematicsion). A multach one beinmulti-gene ans than othGP tree (Seac algorithm
ed “GPTIPSfor use wiinly for mult
ns. So, all tht genes, crosucing childre
085
ast del 2.
are on are nes ast
ias he
ng rts m-on ed ew ed. re-nc-lly out za,
ad be cal ti-ng
ap-her ar-is
S” ith ti-he ss-en,

10
etcoin2
lisesoalfoTtroban
P
B
086
tc.) are carriorrelation. Mn the refere010).
In this stuinear correlatets), includinolubility, oillong with buormation vo
Then, tuningrolled. Runnbtained withnd good accu
Figure
bP 169 ln R
1.934 ln
(=
+
(
obB 0.0007
0.0003
1.622 1
=
−
ied out by GMore details aences (Sears
udy, GPTIPStions. Input
ng experimenl API gravitubble point lume factor,
g parametersning the progh acceptable uracy.
e 3: Genetic
3s g
s g
R 2614
R γn T
2 API
)γ
⎛ ⎞⎛⎜ ⎟⎜
⎝
−
⎝ ⎠
(() ((6
s
004 T 0.00
518 exp
10 R –−
+
γ
GPTIPS to aabout GPTIPson, 2009; S
S was used tdata (trainin
ntal sets of tety and gas spressure an
, were fed ts were adjugram, each cvalues of sta
algorithm flo
(( g
s
4 ln γ ln R
R ln(APT T API
++
) ( )
( ) (
s
g s
g
03542 R 0
ln R
– exp ln
+
γ +
γ
D. A
Brazilian Jou
achieve the bPS can be fouSearson et
o develop nng and test suemperature, specific grav
nd bubble poto the GPTIPusted and ccorrelation watistical crite
owchart.
))s g 2g
2g
R γγ
I) 0.002 γ
⎛+⎜
⎜⎝
⎞ −⎟ +⎠
(( )) (
2s
0.0003534 AP
R ln 2 T
T 3 T –
+
Abooali and E. K
urnal of Chemica
best und al.,
non-ub-gas vity oint PS. on-was eria
Ev
mocortioperAA
2R
RM
AR
AA
whprevardat
corvoas
2
2s
1 API γ
04272R0.05948 AP
⎞+⎟
⎟+ ⎠
+
) ))
2g
s
API 0.00042
API
– API R A
+
− γ −
+
Khamehchi
al Engineering
valuation of
For evaluation statisticalrrelation coe
on (RMSD) arcentage (AAARD is prefe
n
i 1n
2
i 1
(y
(y1 =
=
= −∑
∑
1MSDn
⎛= ⎜⎝
( ) yRD % =
( )ARD % =
here exp.iy , y
edicted, andriables (Bobtaset, respect
RESU
Applying thrrelations folume factor follows:
s3
g
2g
11.54 Rγ 0.05948
2746 I
+
+ γ
( ) (
(( ))
2g
g
275 A
0.003894
API ln
γ
−
γ
Model Valid
ion of the devl parameters efficient (R2)and average ARD %). A erred. R2 shou
exp. cal. 2ii
exp. exp. 2i
y y )
y )y
−
−
nexp.i
i 1
(y=
⎞ −⎟⎠∑
exp. cal.ii
exp.i
yy−
×
n exi
i 1
y1n
=
⎛ ⎞⎜ ⎟⎝ ⎠∑
cal.iy , exp.
y and average ofand Pb) and tively.
ULTS AND
he genetic prr bubble poiof crude oil
2
8 API
472.5+
(
( ) (s
2g g
API ln R
exp
0.945
−
γ γ
+
dity
veloped mods were calcu), root-meanabsolute rela
A low value ould be near t
2
cal. 2iy )−
100
xp. cal.i
exp.i
y10
y−
×
nd n are the f experimennumber of s
DISCUSSIO
rogramming int pressure l were obtai
))
)s
+
dels, three comulated: square-square deviative deviatioof RMSD anto one.
(3
(4
(5
00 (6
experimentantal dependesamples in th
ONS
approach, twand formatio
ined. They a
(
(
m-ed ia-on nd
3)
4)
5)
6)
al, ent he
wo on are
7)
8)

mBvvTmP
Toward Predic
The statistmodels are giBob, respectiv
alues predicersus exper
Table 3, Figumodels are caPb and Bob. I
ntotal = RMSDR2
total =AARD
Subscripts “to
ntotal = RMSDR2
total =AARD
Subscripts “to
Fc
FR
ctive Models for
Brazilian J
tical parameiven in Tablvely. Figure cted by Equrimental dature 4 and Fiapable of prIn Figure 6
Tab
154 Dtotal = 190.8408= 0.9675
Dtotal = 8.2206%tal”, “train”, and
Tabl
149 Dtotal = 0.0449 bb= 0.9436
Dtotal = 2.0040%tal”, “train”, and
Figure 4: Pcorrelation co
Figure 5: PR2
train and R2t
Estimation of Bu
Journal of Chemic
eters of the nle 2 and Tab
4 and Figuation (7) anta. Accordingure 5, the rediction and
and Figure
le 2: Statisti
8 psia
% “test” are used to
le 3: Statisti
bl/STB
% “test” are used to
Predicted veroefficients o
redicted vertest are correl
ubble-Point Pressu
cal Engineering V
new developble 3 for Pb aure 5 show nd Equationng to Table new developd estimation 7, cumulat
ical parame
ntrain =RMSDR2
trainAARD
o distinguish the r
cal paramet
ntrain =RMSDR2
trainAARD
o distinguish the r
rsus experimf training and
rsus experimation coeffic
ure and Formatio
Vol. 33, No. 04,
ped and the (8) 2, ped n of tive
fretivdatheforlesatitha
eters of the n
= 137 Dtrain = 169.112
n = 0.9695 Dtrain = 8.0395%results related to
ters of the n
= 137 Dtrain = 0.0456 b
n = 0.9419 Dtrain = 2.0069%results related to
mental bubbld test data, r
mental bubblcients of train
on Volume Factor
pp. 1083 - 1090,
equency perve deviationta set for Pbese figures, tr 90.26% of ss than 20%ion percent fan 10%.
new develop
26 psia
% total data set, trai
new develope
bbl/STB
% total data set, trai
le point presespectively.
e point oil ning and test
r of Crude Oil Us
October - Decem
cent versus percent are
b and Bob, rthe absolute
f all data esti. For Bob, th
for 97.315%
ed model fo
ntest =RMSR2
testAAR
ining data set, and
ed model for
ntest =RMSR2
testAAR
ining data set, and
ssure. R2
train
formation vdata, respec
sing an Intelligent
ember, 2016
maximum re shown ovrespectively.
relative devimated by Ehe absolute of all the da
or Pb.
= 17 SDtest = 315.356st = 0.9131 RDtest = 9.6795%nd test data set, re
r Bob.
= 12 SDtest = 0.0360 st = 0.9322 RDtest = 1.9700%nd test data set, re
and R2test ar
volume factoctively.
t Approach 10
absolute relver the enti
As shown viation perceEquation (7)
relative devataset is low
62 psia
% spectively.
bbl/STB
% spectively.
re
or.
087
la-ire in
ent is
vi-wer

10
wm
088
Figure 6: maximum developed mwhole dataabsolute relare less thafor 90.26%
In order twith other mmented over
Table 4: C
Method
Standing Glaso Marhoun Petrosky andAUT Present study
Figure 8: versus cumpressure of absolute reveloped mocorrelations
Cumulativeabsolute relmodel for bua set (154 dlative deviatan 10% and of all data a
to evaluate tmodels, a co
test dataset
Comparison
d Farshad
y
Maximum mulative numf the test set (elative deviaodel is lowers.
e frequency lative deviatubble point pdata). As cations for 73.3
absolute reare less than 2
the new coromparison hats and the r
between em
PbAARD
% 16.951 21.740 11.190
- 35.199
9.680
absolute rember of data (17 data). Asation curve r than that of
D. A
Brazilian Jou
percent vetion of the pressure overan be seen,377% of all lative deviat20%.
rrelations aloas been impresults are p
mpirical corr
(Number of d
R2 R(
0.431 800.461 780.676 60
- -0.944 140.913 31
elative deviafor bubble p
s can be seenof the newf other empi
Abooali and E. K
urnal of Chemica
ersus new r the , the data
tions
Figumaxvelofactseenthe atio
ong ple-pre-
sentheels
relations and
data=17) RMSD (psia)
MaxAAR
07.127 5985.440 5008.592 43
- 491.11 9415.356 29
ation point n, the
w de-irical
Figuverspoindataof tothe
Khamehchi
al Engineering
ure 7: Cumximum absoloped model or over all n, absolute redata are lessns for 97.315
nted in Tablee prediction s is higher th
d the new de
ximum RD%
AAR%
.054 2.62
.763 2.1
.582 2.2- 2.1.462 -.317 1.9
ure 9: Maxsus cumulatint formationa). The averathe new dever empirical
mulative freute relative dfor bubble pthe data set elative devia than 5% an5% of all the
e 4, Figure 8capability ofan that of pre
eveloped mo
Bob (NumRD
% R2
21 0.88871 0.90192 0.90209 0.916
- 70 0.932
ximum absoive number
n volume facage of the abeloped modecorrelations.
equency perdeviation of point formatt (149 data).ations for 91.nd absolute ree data are les
8 and Figure f the new de
revious relati
odels over te
mber of data=RMSD
(bbl/STB8 0.04621 0.04352 0.04346 0.0402
- 2 0.0360
olute relativof data for
ctor for the bsolute relativdel is lower .
rcent versus the new de-
tion volume . As can be .275% of all elative devi-s than 10%.
9. As a resueveloped moons.
est data set.
=12) D B)
MaximumAARD%
2 5.773 5 6.484 4 6.774 2 7.074
- 0 4.788
ve deviation the bubble
test set (12 ve deviation than that of
ult, od-
m %
f

Toward Predictive Models for Estimation of Bubble-Point Pressure and Formation Volume Factor of Crude Oil Using an Intelligent Approach 1089
Brazilian Journal of Chemical Engineering Vol. 33, No. 04, pp. 1083 - 1090, October - December, 2016
These comparisons demonstrate the superiority of the correlations developed in the present project among proposed models.
The experimental values of all dataset along with predicted data have been provided in the supporting materials and information.
CONCLUSIONS
By application of genetic programing methodol-ogy, two new models have been achieved for estima-tion and prediction of bubble point pressure and bub-ble point formation volume factor, as functions of a number of rapidly measurable oil parameters. One of the useful applications of this kind of model is pre-diction of oil properties in the future during the reser-voir lifetime that is very important, especially for economic studies as well as effective uses in reser-voir simulators. A comparison between the new pro-posed models and some other correlations shows the greater accuracy of the proposed models over previ-ous works.
NOMENCLATURE AARD% average absolute relative deviation
percentage ANN artificial neural network API oil API gravity ARD% absolute relative deviation percent bbl STB-1 barrel(s) per standard barrels Bo oil formation volume factor Bob bubble point oil formation volume factorCo oil compressibility at constant
temperature FVF formation volume factor GP genetic programing GRN generalized regression neural networks ICA imperialist competitive algorithm n number of samples in the dataset Pb bubble point pressure PSO particle swarm optimization PVT pressure – volume – temperature R2 squared correlation coefficient RMSD root-mean-square deviation Rs gas solubility SCF STB-1 standard cubic feet of solution gas per
standard barrels of oil T temperature
cal.iy predicted dependent variable of
component i
exp.iy experimental dependent variable of
component i exp.
y average of experimental dependent variables
γg gas specific gravity γo oil specific gravity μob oil bubble point viscosity
REFERENCES Abooali, D. and Khamehchi, E., Estimation of dy-
namic viscosity of natural gas based on genetic pro-gramming methodology. J. Nat. Gas. Sci. Eng., 21, 1025 (2014).
Ahmed, T., Reservoir Engineering Handbook. Gulf Professional Publishing (2010).
AlQuraishi, A. A., Determination of crude oil satura-tion pressure using linear genetic programming. Energy Fuels, 23, 884 (2009).
Asadisaghandi, J. and Tahmasebi, P., Comparative evaluation of back-propagation neural network learning algorithms and empirical correlations for prediction of oil PVT properties in Iran oilfields. J. Pet. Sci. Eng., 78, 464 (2011).
Bandyopadhyay, P. and Sharma, A., Development of a new semi analytical model for prediction of bub-ble point pressure of crude oils. J. Pet. Sci. Eng., 78, 719 (2011).
Elsharkawy, A. M., An empirical model for estimat-ing the saturation pressures of crude oils. J. Pet. Sci. Eng., 38, 57 (2003).
Elsharkawy, A. M. and Alikhan, A. A., Correlations for predicting solution gas/oil ratio, OFVF and undersaturated oil compressibility. J. Pet. Sci. Eng., 17, 291 (1997).
Farasat, A., Shokrollahi, A., Arabloo, M., Ghara-gheizi, F. and Mohammadi, A. H., Toward an in-telligent approach for determination of saturation pressure of crude oil. Fuel Process Technol., 115, 201 (2013).
Glaso, O., Generalized pressure-volume-temperature correlations. J. Pet. Technol., 32, 785 (1980).
Khamehchi, E., Rashidi, F., Rasouli, H. and Ebrahim-ian, A., Novel empirical correlations for estima-tion of bubble point pressure, saturated viscosity and gas solubility of crude oils. J. Petrol Sci., 6, 86 (2009).
Koza, J., Genetic Programming. Massachusetts Insti-tute of Technology. New York (1992).
Marhoun, M. A., PVT Correlations for Middle East Crude Oils. J. Pet. Technol., 40, 650 (1988).
McCain, W. D., The Properties of Petroleum Fluids. PennWell Publishing Co (1990).

1090 D. Abooali and E. Khamehchi
Brazilian Journal of Chemical Engineering
Petrosky, Jr. G. E. and Farshad, F., Pressure-volume-temperature correlations for Gulf of Mexico crude oils. SPE Res. Eval. Eng., 416-420 (1998).
Rasouli, H., Rashidi, F. and Ebrahimian, A., Estimat-ing the bubble point pressure and formation vol-ume factor of oil using artificial neural networks. Chem. Eng. Technol., 31, 493 (2008).
Searson, D. P., GPTIPS: Genetic Programming & Symbolic Regression for MATLAB. http://gptips. sourceforge.net (2009).
Searson, D. P., Leahy, D. E. and Willis, M. J., GPTIPS: An open source genetic programming
toolbox for multigene symbolic regression. IMECS, March 17-19, Hong Kong (2010).
Shojaei, M-J., Bahrami, E., Barati, P. and Riahi, S., Adaptive neuro-fuzzy approach for reservoir oil bubble point pressure estimation. J. Nat. Gas. Sci. Eng., 20, 214 (2014).
Standing, M. B., A Pressure-volume-temperature correlation for mixtures of California oils and gases. API Drill Prod. Pract., 275-287 (1947).
Vazquez, M. and Beggs, H. D., Correlations for fluid physical property prediction. J. Pet. Technol., 32, 968 (1980).