towards net zero carbon report - haringey
TRANSCRIPT

120190258 | Cost of Carbon | May 20 | Rev M
May 2020 | Rev M
Towards Net Zero Carbon
Achieving greater carbon reductions on site
The role of carbon pricing
220190258 | Cost of Carbon | May 20 | Rev M
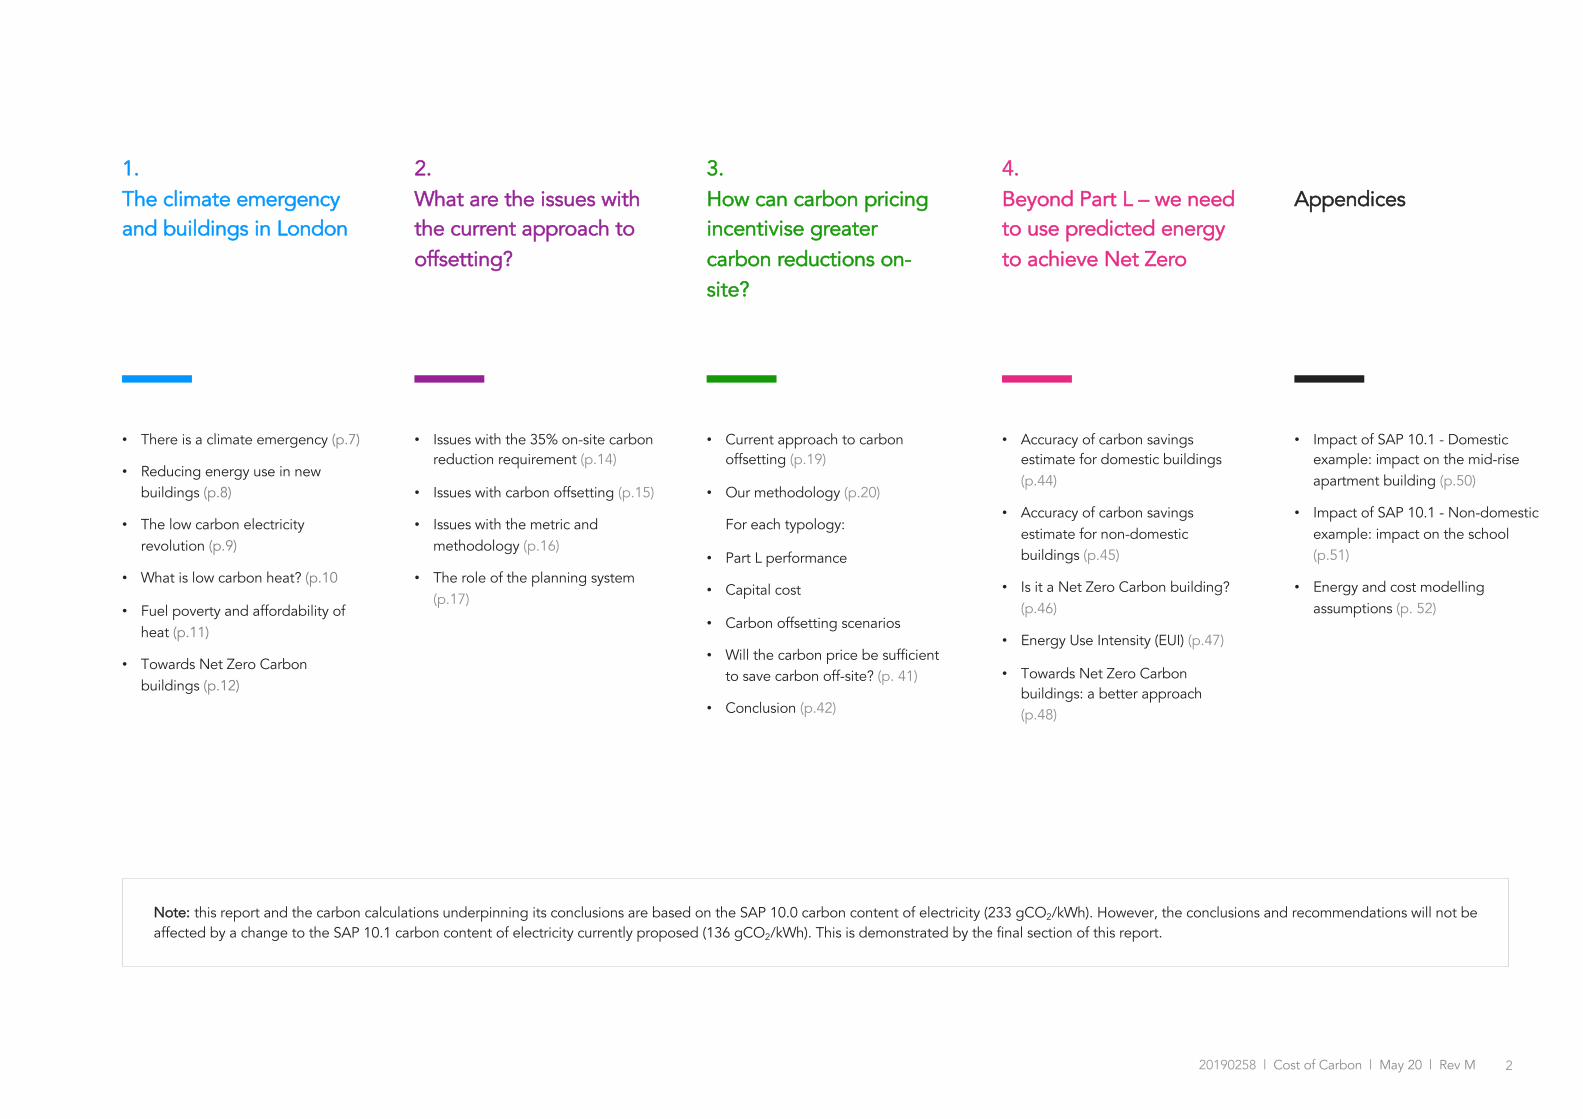
• There is a climate emergency (p.7)
• Reducing energy use in new buildings (p.8)
• The low carbon electricity revolution (p.9)
• What is low carbon heat? (p.10
• Fuel poverty and affordability of heat (p.11)
• Towards Net Zero Carbon buildings (p.12)
1.The climate emergency and buildings in London
• Issues with the 35% on-site carbon reduction requirement (p.14)
• Issues with carbon offsetting (p.15)
• Issues with the metric and methodology (p.16)
• The role of the planning system(p.17)
2.What are the issues with the current approach to offsetting?
• Current approach to carbon offsetting (p.19)
• Our methodology (p.20)
For each typology:
• Part L performance
• Capital cost
• Carbon offsetting scenarios
• Will the carbon price be sufficient to save carbon off-site? (p. 41)
• Conclusion (p.42)
3.How can carbon pricing incentivise greater carbon reductions on-site?
• Accuracy of carbon savings estimate for domestic buildings (p.44)
• Accuracy of carbon savings estimate for non-domestic buildings (p.45)
• Is it a Net Zero Carbon building? (p.46)
• Energy Use Intensity (EUI) (p.47)
• Towards Net Zero Carbon buildings: a better approach (p.48)
4.Beyond Part L – we need to use predicted energy to achieve Net Zero
Note: this report and the carbon calculations underpinning its conclusions are based on the SAP 10.0 carbon content of electricity (233 gCO2/kWh). However, the conclusions and recommendations will not be affected by a change to the SAP 10.1 carbon content of electricity currently proposed (136 gCO2/kWh). This is demonstrated by the final section of this report.
• Impact of SAP 10.1 - Domestic example: impact on the mid-rise apartment building (p.50)
• Impact of SAP 10.1 - Non-domestic example: impact on the school (p.51)
• Energy and cost modelling assumptions (p. 52)
Appendices

320190258 | Cost of Carbon | May 20 | Rev M
Neil Pearce, Commissioning Lead
Energy & Sustainability
Thank you
This report is the result of a collaboration between five London boroughs and four consultants. We are very grateful to the following organisations and individuals for their contribution.
Joanne Mortenson, Climate Action Programme Manager
Ian Weake, Principal Planning Officer
Maria Yashchanka, Principal Sustainability Officer
Karen Montgomerie, Planning Policy Manager
Donna Skordili, Energy and Sustainability Officer
Joe Baker, Head of Carbon Management
Suzanne Kimman, Climate Change Officer
Tim Starley-Grainger, Energy Infrastructure Manager
Bryce Tudball, Planning Policy Team Manager
Damian Hemmings, Principal Policy Officer
Jo Gay, Team Leader, Environment Policy & Projects
Kimberley Hopkins, City and Planning Policy Team Leader
Clara Bagenal George
Alkyoni Papasifaki
Hugh Dugdale
Clare Murray
Zoe Watson
Adam MacTavish
Jess Daly
Tassos Kougionis
Naomi Grint
Caitlin Brown
Chris Worboys
Ed Cremin
Leon Tatlock
Thomas Lefevre

420190258 | Cost of Carbon | May 20 | Rev M
Executive summary | Incentivising greater savings on site with the carbon offset price
Table 1 - Example for a typical medium-rise apartment building. It demonstrates that it is justified to penalise the band of emissions worse than a 60% improvement and that
improvements in excess of 80% are possible and should be encouraged.
There is a climate emergency
Climate change is happening at an alarming rate. A number of London boroughs have declared a climate emergency and need to reduce energy use and carbon emissions of new buildings. Evidence from the Committee on Climate Change also highlights the need to design and build buildings which are low carbon and use less energy in reality (not only at the planning/design stage).
Phasing out natural gas and controlling heating costs
We also need to phase out the use of natural gas for heating new buildings. However, it is important to ensure that the transition towards low carbon heat (e.g. heat pumps, low carbon heat networks) does not lead to high heating costs. The reduction of heating demand and the affordability of heat for occupants should become a greater concern.
The issue with the current carbon price
The current carbon offset price (£60-£95/tCO2) and requirement of a minimum 35% carbon reduction* do not incentivise sufficient savings on site. This means that new buildings have substantially higher carbon emissions that they should.
In addition, our analysis suggests that the current carbon offset price is not sufficient for local authorities to deliver the required carbon savings off-site. A price of at least £300/tCO2 is recommended to enable them to deliver these carbon savings.
A new carbon price: our recommendations
We have undertaken extensive energy modelling on several typologies of buildings. Our calculations demonstrate that the decarbonisation of the electricity grid means that, for the same specifications, a greater improvement over Part L is achieved with no extra effort/cost (‘60% is the new 35%’). On this basis, and given the consensus on the need and benefit of a ‘fabric first’ approach and low carbon heat, our recommendations are:
• To incentivise on-site savings by adopting a high first tier price of £1,000/tCO2 for those easily avoidable and unnecessary residual emissions not met on-site, which fall short of a 60% improvement threshold (measured over Part L1A) for domestic and a 50% improvement threshold (measured over Part L2A) for non-domestic developments.
• To incentive PVs** with the introduction of a medium carbon price second tier of £300/tCO2.
• Finally, and only for residential applications for which it is easier to achieve this high level of performance than for non-residential applications, we recommend a low carbon price third tier of £100/tCO2 as a positive signal.
* The carbon reduction is calculated by comparing the proposed building carbon emissions to those of an equivalent ‘notional’ building using standard assumptions.
** Our analysis suggests that with 233 gCO2/kWh (SAP 10.0) the savings from the use of PVs are equivalent to a carbon cost ratio of around £190/tCO2).
Significant improvements over Part L (using SAP 10.0 carbon factors) can be achieved now with efficient fabric, ventilation as well as low carbon heat.
Table 2 - Example for a typical new office building. It demonstrates that it is justified to penalise the band of emissions worse than a 50% improvement and that improvements
in excess of 80% are not easy to achieve based on the current Part L methodology (they rely entirely on the roof areas available for PVs).
0-60%
Resi
dual
regu
late
d em
issi
ons
and
perc
enta
ge im
prov
emen
t ove
r Par
t L
Residual regulated emissions are offset at a rate of £1,000/tCO2 over 30 years
60-80%Residual regulated emissions are offset at a rate of £300/tCO2 over 30 years
80-100% Residual regulated emissions are offset at a rate of £100/tCO2 over 30 years*
Figure 1 - Recommended tiered carbon prices for domestic buildingsThe third tier aims at sending a positive signal that this level of Part L performance is
achievable today.
0-50%Residual regulated emissions are offset at a rate of £1,000/tCO2 over 30 years
50-100%Residual regulated emissions are offset at a rate of £300/tCO2 over 30 years
Figure 2 - Recommended tiered carbon prices for non-domestic buildingsThere is no third tier due to the limitations of Part L/SBEM for non-domestic buildings
which make it more challenging to achieve an 80% improvement for all typologies.
Resi
dual
regu
late
d em
issi
ons
and
perc
enta
ge im
prov
emen
t ove
r Par
t L
< 0% < 35% < 60% 60-80% > 80%
< 0% < 35% < 50% ³ 50%

520190258 | Cost of Carbon | May 20 | Rev M
Executive summary | A modest impact on viability
Construction costs of lower carbon buildings
The uplift costs associated with each specification option were estimated for each typology based on Currie & Brown’s cost datasets for energy efficiency and low carbon technologies which incorporate information from market prices obtained, specific market testing and first principles cost planning by their specialist quantity surveyors. The costs are based on Q3 2019 prices and reflect a London / South East cost base.
For example, for the medium-rise apartment, the baseline in terms of construction costs is the ‘Business as usual fabric and ventilation + Gas boiler + PVs’ scenario. This scenario is nearly compliant with the London Plan requirement of a minimum 35% carbon reduction over Part L (i.e. 26%). The additional construction costs of lowest carbon options compared to this baseline are comprised between 0.4% and 6.8%. They capture savings associated with combining an ultra-low energy fabric, ventilation system and a low carbon heating system. They do not highlight the cost reductions which can be achieved with a low energy design process (e.g. form factor).
Impact on development costs
The potential impact on total development cost was estimated on the basis of the construction cost representing c.40% of the total development costs with the balance being comprised of land cost, finance and project fees and other planning requirements. For example, for the medium-rise apartment, it means that he impact would therefore be only between 0.2% and 2.7% if the whole development costs were considered.
Impact on viability
Example for the medium-rise apartment building:
• Based on the current approach with a flat carbon price at £60/t, the baseline scenario in terms of construction costs (‘Business as usual + Gas boiler + PVs’) would be required to make a carbon offsetting contribution equivalent to approximately £20/m2.
• Based on the proposed new tiered carbon price, the most economic low carbon scenarios in terms of combined additional construction costs and carbon offsetting costs would represent an additional cost comprised between £18-£69/m2 compared to the baseline.
The additional cost range is provided on the adjacent table.
It is worth the additional cost
Delivering better quality buildings which put us on the right track towards 2025 and 2030 is essential. Although it will cost more, we do not think that this would significantly affect viability, while contributing significantly to key policy objectives: air quality, fuel poverty, reduced running costs and addressing the climate emergency.
Table 5 - Impact of the new proposed approach to carbon offset price on the total construction cost + carbon offsetting cost of the most economic low carbon scenarios
compared with the respective baselines (Business as Usual fabric and ventilation + Direct electric or VRF + PVs)
This analysis is based on a carbon price of £60/tCO2 and the SAP 10.0 carbon factor. If the current carbon price recommended by the GLA was to be used (£95t/tCO2) with the current Part L 2013 carbon factor, the impact on costs above would be smaller. It can therefore be considered a conservative estimate.
Gas boiler
Direct electric
Heat pump
Better heat pump
Business as usual
0.0% -2.9% 0.8% 1.5%
Good practice
1.2% -1.6% 2.1% 2.8%
Ultra-low energy
3.6% 0.8% 4.4% 5.2%
Gas boiler
Direct electric
Heat pump
Better heat pump
Business as usual
0.0% -2.7% 1.6% 3.7%
Good practice
1.8% -0.9% 3.4% 5.5%
Ultra-low energy
3.1% 0.4% 4.7% 6.8%
Mid-rise apartment (~ £2,200/m2 baseline construction cost)
Terrace house (~ £1,800/m2 baseline construction cost)
Fabr
ic &
Ven
tilat
ion
% uplift in cost per m2 of construction
With PV
% uplift in cost per m2 of construction
With PV
Fabr
ic &
Ven
tilat
ion
Table 4 - Mid-rise apartment building - Additional construction costs (£/m2) compared with the ‘Business as usual + Gas boiler scenario + PVs’ baseline scenario - Analysis by Currie & Brown
Table 3 - Example for a typical medium-rise apartment building. Improvement over Part L assuming 233 gCO2/kWh (SAP 10) for grid-supplied electricity
Additional costs of the most economic low carbon scenarios with the proposed
new carbon prices (compared with the baseline scenario and
a carbon price of £60/t)
Terrace house +£8-23/m2
Medium-rise apartment building +£18-69/m2
High-rise apartment building +£79-85/m2
Hotel -£22/m2
School +£62/m2
Office building +£71/m2
Does it incentivise?Current
carbon priceProposed newcarbon price
Greater carbon savings on-site? û ü
Greater energy use reduction? û ü
Best practice (e.g. Passivhaus)? û ∼
Low carbon heat? ∼ ü
Low impact on air quality ∼ ü
More PVs on site? û ü
Table 6 – Comparison of the current and proposed carbon offset prices in terms of potential impact

620190258 | Cost of Carbon | May 20 | Rev M
Executive summary | Towards Net Zero Carbon buildings: a better approach is needed
There are bigger issues with the current system
Carbon pricing can help to incentivise greater savings on site if the current approach based on Part L modelling continues to be used but our recommendation is to move towards a better system to address the following issues:
• Relative metric: the percentage improvement against a notional building is confusing and misleading. It also does not reward efficient designs/forms.
• Carbon only: using carbon only metrics gives the carbon factors a pivotal role. When the carbon factor used in the building regulations is as outdated as it is now it can lead to the wrong outcomes.
• Tools not fit for purpose: Part L was never meant to be used to predict energy use but it is being used for this. This contradiction has been accepted for too long. The inaccuracy of Part L modelling for non-domestic buildings at predicting heating demand is particularly concerning. This means that an improved building fabric is not incentivised.
• Not Net Zero Carbon: a building which achieves a 100% improvement over Part L is not a Net Zero Carbon building.
Next steps: our recommendations for a better, simpler system towards Net Zero
We therefore recommend to introduce the following changes to the system now in order to set planning requirements on the right path towards Net Zero Carbon, and to step up the requirements over time.
1. Introduce Energy Use Intensity (EUI) requirements: the use of maximum EUIs based on absolute values (e.g. 60kWh/m2/yr for residential from now, reducing to 35kWh/m2/yr from 2025) would help as it is an absolute metric, is independent from carbon and can be easily verified by the building/home owner/tenant after completion.
2. Request the prediction of energy use modelling: We recommend to make the estimate of the building’s future energy use mandatory. This could be done with PHPP (Passivhaus Planning Package) and/or other tools consistent with the CIBSE TM54 methodology which are more accurate and were designed for this purpose.
3. Consider regulated and unregulated energy: unregulated energy needs to be assessed in addition to regulated energy if Net Zero Carbon building is the destination.
4. Include planning conditions to address the performance gap: more energy modelling and quality checks after planning, particularly during detailed design and construction would help to reduce the performance gap.
Figure 4 - The electricity grid will continue to decarbonise in the next few years. Using an absolute energy metric would bring clarity toward better energy efficiency
as it would be independent from the grid electricity carbon factor.
0
100
200
300
400
500
600
700
800
900
1000
1100
1970 1980 1990 2000 2010 2020 2030 2040 2050
Grid
Em
issi
on F
acto
r (gC
O₂/
kWh)
0
1
2
3
4
5
Businessas usual -
SBEM
Goodpractice -
SBEM
Ultra-lowenergy -SBEM
Businessas usual -
PHPP
Goodpractice -
PHPP
Ultra-lowenergy -
PHPP
kgC
O2/
m2 y
r
Figure 5 - CO2 emissions associated with space heating for the School as assessed by Part L/SBEM (left hand side) and predicted energy use modelling/PHPP (right hand side)As Part L2A assessments underestimate space heating requirements, they also underestimate carbon savings achieved as a result of fabric and ventilation improvements
x4 reduction in
heating carbon emissions due to ultra low energy fabric compared with Business as usual fabric
Figure 3 - Despite the reduction in heat loss areas and complexity, the percentage improvement over Part L does not vary much between the designs above. This shows that a relative metric is not as useful and clear as an absolute metric for energy efficiency.
Form factor (ratio between external envelope area and internal floor areas)
Improvement over Part L 2013 (assuming good practice specifications)
1.5
-35%
1.2
-35%
0.9
-37%

720190258 | Cost of Carbon | May 20 | Rev M
• There is a climate emergency
• Reducing energy use in new buildings
• The low carbon electricity revolution
• What is low carbon heat?
• Fuel poverty
• Towards Net Zero Carbon buildings
Section 1The climate emergency: Impact on new buildings in London

820190258 | Cost of Carbon | May 20 | Rev M
There is a climate emergency
The science is clear
Climate change is happening and needs to be urgently slowed down to avoid terrible consequences.
The most recent international negotiations on Climate Change concluded with the Paris Agreement in December 2015. Since then, the Special Report on Global Warming of 1.5°C (SR15) was published by the Intergovernmental Panel on Climate Change (IPCC) in October 2018 and highlighted the urgency of the situation. We need to act now.
National commitment
In May 2019, the Committee on Climate Change published its ‘Net Zero report’ and set out the ambitious aim of phasing out carbon emissions in the UK by 2050. The Government adopted the recommendation of this report and the Climate Change Act was amended in June 2019 to reflect this ambition: achieving net zero emissions by 2050.
Public calls for action
Since October 2018, there has been a surge in civil society’s interest and action on climate change. The Schools strike movement started by Greta Thunberg and civil disobedience from Extinction Rebellion are requesting action and truth from those in a position to act.
London Boroughs’ declarations of climate emergency
All five London Boroughs who have directed this study have already declared a climate emergency and set a target to achieve Net Zero Carbon as a whole borough.
Most of them expect policy to require Net Zero Carbon buildings in the short to medium term.
The role of local authorities towards Net Zero Carbon cannot be understated. Setting targets, developing action plans, showing leadership, sharing expertise, monitoring progress: they have a crucial role to play.
Figure 6 - We have to do everything we can to reduce global warming to less than 1.5ºC
Table 7 - Table showing which local authorities have declared a climate emergency Figure 8 - Greta Thunberg, the Schools strike movement and Extinction Rebellion are calling for action now
Figure 7 - The UK Government has committed in June 2019 to Net Zero emissions by 2050
Barking & Dagenham
Ealing Haringey Greenwich WCC
Declaration of climate emergency?
✓ ✓ ✓ ✓ ✓
Net Zero Carbon target(Council)
2030 2030 - 2030 2030
Net Zero Carbon target(Whole borough)
2030 2030 2041 2030 2040
Action plan? -within 8 months
✓ within 8 months
within 6 months
Policy for Net Zero Carbon buildings in operation?
< 2 years(new
homes)< 2 years -
< 2 years(new
homes)
Not before 2025
Section 1

920190258 | Cost of Carbon | May 20 | Rev M
Reducing energy use is critical
Energy efficiency has always been the first step in the energy hierarchy and needs to remain the priority. It is not only important to reduce carbon emissions in the short term: we should not build buildings now which will need to be retrofitted in 15 years.
The wider benefits of energy efficiency are also perceived now, and their role to minimise peak demand is very important.
Buildings Energy Mission: reducing energy use in new buildings by 50%
The Department for Business, Energy and Industrial Strategy (BEIS) has set the Buildings Energy Mission, with the objective of halving the energy use of new buildings by 2030.
The Department for Business, Energy & Industrial Strategy (BEIS) asked the Green Construction Board to respond to the 2030 Buildings Energy Mission. The background report published as part of this response reviewed the evidence from buildings which have already achieved a 50% reduction in energy use. There is a lot which can be learnt from these buildings as there are recurring approaches, techniques and systems that are responsible for their excellent energy efficiency. These are summarised on the adjacent figure.
The future of housing
The Committee on Climate Change has published a report in 2019 named ‘UK housing – fit for the future?’. The report highlights the need to build new buildings with ‘ultra-low’ levels of energy use. It also makes a specific reference to space heating demand and recommends a maximum of 15-20 kWh/m2/yr for new dwellings. For reference, Passivhausrequires 15 kWh/m2/yr and most new domestic buildings have a heating demand of 40-80 kWh/m2/yr.
The cost of changing from ’business as usual’ to ultra low energy
The technical study undertaken by Currie & Brown and AECOM for the Committee on Climate Change’s UK housing: Fit for the future? report illustrates that a switch to low carbon heating is essential in achieving long term carbon savings, but that this must be supported by significant improvements in energy efficiency in order to manage running costs and avoid external costs to the wider energy system.
The study indicates that significant reductions in space heating demand can be achieved at lower cost than smaller improvements where steps are taken to achieve savings in the size and extent of the heating system.
Figure 9 - Recurring features of a low energy building Figure 10 - Cover of the Green Construction Board’s Buildings Energy Mission 2030 report
Figure 11 - The UK housing: Fit for the future? report published by the Committee of Climate Change in February 2019 recommends ultra-low levels of energy use and
a space heating demand of less than 15-20 kWh/m2/yr
Figure 12 - The costs and benefits of tighter standards for new buildings report, produced by Currie & Brown and AECOM for the Committee on Climate Change’s
UK housing: Fit for the future? report
Reducing energy use in new buildings
15-20kWh/m2/yr
Space heating demand
Section 1

1020190258 | Cost of Carbon | May 20 | Rev M
The decarbonisation of the grid
Electricity used to have a very high carbon content: more than 1,000 gCO2/kWh in the early 1970’s. It has become steadily ‘greener’ since, although it reached a plateau of approximately 500 gCO2/kWh during the 2000’s. At that time, heating systems using gas were seen as environmentally friendly options. This has now changed completely: with the de-commissioning of coal-fired power stations and the rise of renewable energy (particularly wind and solar), the annual average carbon content of electricity is now around 150-200 gCO2/kWh and predicted to reduce more in the next decade (see adjacent graph).
The National Grid’s Future Energy Scenarios
The National Grid produces a set of future energy scenarios every year. These are used to facilitate the understanding of how the UK’s electricity generation mix could develop. We have selected the ‘Community Renewables’ scenario as it would meet (or be close to meeting) the UK climate change targets with less nuclear energy than other scenarios (there is a significant degree of uncertainty for new nuclear plant financing). This scenario assumes that around 70% of annual electricity demand in 2050 will be met by wind and solar power. BEIS and HM Treasury have also published their projections for the future carbon content of electricity, which converge with the ‘Community Renewables’ scenario..
What it means in practice
The average carbon content of electricity was 189 gCO2/kWh in 2019, and is likely to be 123 gCO2/kWh in 2020, 60 gCO2/kWh in 2030 and 30 gCO2/kWh in 2050, while gas is likely to remain at around 200 gCO2/kWh.
The marginal carbon content of electricity is higher and is also reducing at a slower rate. It is approximately 300 gCO2/kWh currently and is schedule to reach 200 gCO2/kWh in 2027 and less than 100 gCO2/kWh in the early 2030s. It is converging towards the same value as the average carbon content in 2040.
A ‘greener’ and ‘smarter’ grid
Such a decarbonisation of the grid will only happen if the majority of annual electricity demand in 2050 will be met by wind and solar power. This considerable level of renewable energy (shown on the adjacent graph) can be achieved if the current levels of solar photovoltaic (PVs) are significantly increased: every new building should have an optimised PV system. The grid will also have to be ‘smarter’ with a much more dynamic ‘demand response’ system. This will rely on buildings being able to shift their power demand to help the electricity grid. This will also help to reduce peak demand and therefore to help control the cost of electricity.
Figure 13 - The carbon content of electricity has fallen in the last few years and will continue to decrease. Unfortunately, the carbon content used in Part L 2013 of the
Building Regulations has not been updated.
Figure 14 - High level assessment of the four National Grid scenarios
Figure 15 - Community Renewables: what it means in terms of power generation in the UK over the period 2020-2050: the rise of renewable energy
‘Consumer Evolution’ DiscountedNot compliant with avoiding 1.5˚C warming
‘Steady Progression’ DiscountedNot compliant with avoiding 1.5˚C warming
‘Two Degrees’ DiscountedRelies on nuclear capacity increasing from 9GW in 2018 to 17GW in 2050. Not considered realistic as three of six proposed new nuclear projects have been cancelled, nuclear has consistently failed to attract private investment and electricity prices are higher than those for onshore wind, offshore wind and solar photovoltaics.
‘Community Renewables’
ConsideredEtude assume this scenario offers the most plausible 1.5˚C compliant UK electricity generation mix pathway. This scenario was developed to achieve the UK’s now outdated Climate Change Act target of an 80% reduction in emissions by 2050.0
100
200
300
400
500
600
700
800
900
1000
1100
1970 1980 1990 2000 2010 2020 2030 2040 2050G
rid E
mis
sion
Fac
tor (
gCO₂/
kWh)
MTP (2010)UK CCC (2013)Drax Electric Insights (2019)National Grid (2019) 'Community Renewables'National Grid (2019) 'Two Degrees'National Grid (2019) 'Steady Progression'National Grid (2019) 'Consumer Evolution'Natural Gas
0
50
100
150
200
250
300
350
400
450
500
2020 2025 2030 2035 2040 2045 2050
Elec
tric
ity G
ener
atio
n (T
Wh)
Interconnectors Waste Biomass CoalGas Nuclear Hydro MarineOffshore Wind Onshore Wind Solar Other Renewables
Energy supply | The low carbon electricity revolution
Figure 16 - Roof-mounted PV installations will have to be maximised. The panels selected should be high output and the concertina arrangement makes the most of the roof space
available
Section 1

1120190258 | Cost of Carbon | May 20 | Rev M
A paradigm shift
As the electricity grid is decarbonising, heating systems using electricity (e.g. heat pumps) become lower carbon heating solutions than those using fossil fuels (e.g. natural gas). This is also true of systems using fossil fuels to generate on-site electricity which will become high carbon heating systems as the margins of the grid decarbonise.
There is also a consensus that fossil fuels must be phased out by 2050 and it is much easier to achieve this in the building sector than in others (e.g. industry, aviation). It is therefore justified to prevent or at least disincentivise the use of fossil fuels for heating and hot water in new buildings. This is also in line with the Committee on Climate Change recommendation that ‘from 2025 at the latest, no new homes should be connected to the gas grid, with ultra-low energy houses and flats using low carbon heat instead’. Locking in the use of fossil fuels for the medium to long terms must be avoided.
Electrification of heat
We consider that the electrification of heat is the most likely scenario in the future for buildings. Along with becoming a lower carbon energy source, electricity has other advantages, particularly in terms of local air quality, a concern in London.
Peak demand can be reduced to ensure pressure is not unduly put on the electricity grid. This can be done by:1. reducing heat demand using efficient building fabric and
ventilation systems.2. reducing electrical demand by using a technology which is
more efficient than direct electric heating: heat pumps.3. managing heat demand so that it can enable a smart grid.
Heat networks with waste heat
Alongside heat networks supplied by heat pumps, there is a role for low carbon low temperature waste heat networks. There are different sources of waste heat which could be used, from tube vent shafts and reservoirs to waste heat from industrial processes. The carbon content of this heat, distribution losses and the sustainability of the waste heat source should be evaluated.
How we modelled different heating systems
We modelled four different levels of carbon content of heat (assuming SAP 10.0) and provided for each of them an example of a system which should be able to achieve it (see Figure 19).
Hydrogen is not a likely option for London
Our analysis concluded that hydrogen is unlikely to play a significant role in London as other uses (e.g. industrial heat, top up heating for some buildings on very cold days, back-up power generation and heavy-duty vehicles) would be more appropriate.
Figure 17 - Evolution of the carbon content of grid-supplied electricity. The marginal carbon content of electricity is also reducing towards the same value in
2040 but at a slower rate.
Figure 18 - Heat pumps are available in many different types and scales, from individual systems to heat pumps supplying heat networks (© Etude for the Greater
London Authority)
Energy supply | What is low carbon heat?
0
100
200
300
400
500
600
700
800
2000 2010 2020 2030 2040 2050
Grid
Em
issi
on F
acto
r (gC
O₂/
kWh)
MTP (2010)
UK CCC (2013)
Drax Electric Insights (2019)
National Grid (2018)'Community Renewables'
CO2-Building Regs
CO2-SAP 10.0
CO2-Future
Figure 19 – Approximate carbon emission band of heating system modelled
Heating system
B. Direct electric
C. Heat pump
D. Better heat pump
A. Gas boiler
High carbon Low carbon
> 250 gCO2/kWh
200-250 gCO2/kWh
100-200 gCO2/kWh
< 100 gCO2/kWh
Figure 20 - Summary of evolution of heat networks towards lower temperatures and lower carbon sources (Source: Chris Twinn for LETI's Climate Emergency Design Guide)
Carbon emission
band*
Example heating system
* assuming SAP 10.0 carbon factors)
Section 1

1220190258 | Cost of Carbon | May 20 | Rev M
Fuel poverty in London
Fuel poverty in England is measured using the Low Income High Costs (LIHC) indicator. Under this indicator, a household is considered to be fuel poor if they have required fuel costs that are above average and, if they were to spend that amount, if they would be left with a residual income below the official poverty line.
The main drivers of fuel poverty are the household income, its energy requirements and the energy prices. A number of mechanisms seek to alleviate fuel poverty through requirements on utility companies or financial assistance (e.g. warm home discount).
According to the sub-regional fuel poverty statistics, 11.8% of households in London (i.e. 397,924 households out of a total of 3.371,821) are fuel poor1. However, it is not currently directly addressed by energy planning policies in London. The considerations below explore what could be done with the buildings themselves and therefore through the planning system.
Low carbon new homes must be affordable to run
Historically, carbon has been considered as the exclusive proxy for the energy costs but some systems could be low carbon and lead to high energy bills (e.g. direct electric heating in a ‘business as usual’ building in London). It is therefore important that the implications of design decisions in terms of energy costs are better considered by applicants. In order to mitigate any risk of fuel poverty or issues with affordability, applicants should be required to demonstrate how they will ensure a best practice level of energy efficiency (e.g. Passivhaus) and/or how they will include systems which are more energy efficient than direct electric heating (e.g. heat pumps) and ensure that they are economic to run.
Assessing future annual energy costs at planning stage (including all components of the adjacent figure) could help. This would be particularly useful for Council-led schemes and affordable housing units.
1 Household and fuel poverty numbers at region level come from the national fuel poverty statistics, 2017: https://www.gov.uk/government/statistics/fuel-poverty-detailed-tables-2019
Fuel poverty and affordability of energy costs
Figure 25 - Compared evolution of the carbon content of electricity (blue line) and the average price of electricity for domestic consumers (red bars) over the last 10
years.
Figure 26 - The different components of energy costs. Energy costs generally form the main part of residents heating costs, but they could
be responsible, directly or indirectly, for other costs which should be included.
Figure 27 - Available approaches to minimise heating costs when using electricity (which is expensive) as the main heating fuel
Towards low carbon heat Heat pumps in London – Phase 2 report
20180167 | Aug 2018 | Rev H 4
2.1.2 Heating systems considered The main aim of this analysis is to investigate the impact of a change towards heat pump based solutions. Three scales of systems have therefore been considered and seven heating systems in total. The non-heat pump systems were investigated in order to provide points of reference. Small/individual scale:
• individual gas boiler
• direct electric
• individual air source heat pump Communal/building scale:
• communal gas boiler
• communal air source heat pump
• communal ground loop individual heat pumps
District/large scale:
• district heating with gas-fired boilers and CHP
• district heating with heat pumps
2.1.3 Heating cost components: structure It is therefore very important to be clear about what the heating cost comparison includes. In order to be fair between systems and to truly reflect all heating costs, it should include more than what is on the heating bill for the individual systems.
Figure 2.01 - Key components of heating costs A short summary of these costs is provided below:
• Energy costs represent the proportion of the bill associated directly with energy used for heating and hot water. For district heating systems, this component is more complex as it includes
Standing gas charge (if applicable) i.e. gas connection charge
Metering/billing charge e.g. charge associated with metering, billing and debt collection by the management company
Replacement costs/charge e.g. equivalent annual cost of replacing the equipment at the end of its lifetime
Other charges e.g. repayment of district heating investment, profit
Maintenance costs/charge e.g. annual maintenance contract
Energy costs e.g. direct costs related to metered energy use for space heating and hot water 0
100
200
300
400
500
600
0
5
10
15
20
25
2010 2011 2012 2013 2014 2015 2016 2017 2018
How to reduce heating costs when using electricity as the main heating fuel (instead of gas)
Reduce energy demand
Adopt a low energy approach from concept design through to handover, including construction quality checks, e.g. Passivhaus
Use high performance systems
e.g. use an efficient heat pump-based heating system, ensure that it is commissioned properly and that it can be maintained at an affordable price
and/or
Section 1

1320190258 | Cost of Carbon | May 20 | Rev M
Towards Net Zero Carbon buildings
What Zero Carbon roadmaps tell us
More than 200 local authorities in the UK have declared a climate emergency and a growing number of them are developing science-based targets, a Zero Carbon Roadmap and the associated action plan. These highlight two conclusions relevant to this study:
• the limited role for offsetting in the long term.
• the need for new buildings to reduce on-site emissions to a fraction of what they are now, and to become ideally Net Zero or even Net Positive buildings.
These Zero Carbon roadmaps are likely to significantly influence the requirements for new buildings in London.
Net Zero Carbon Policy in London
Policy SI2 Minimising greenhouse gas emissions in the new London Plan states that all major developments should be net zero-carbon. This provides a strong policy basis for all boroughs. It also includes specific requirements in terms of energy efficiency (‘be lean’), embodied carbon calculation and energy data disclosure.
Unfortunately the current interpretation of this policy is not consistent with the policy ambition: developments tend to achieve a minimum 35% reduction in on-site regulated carbon emissions and offset only the residual regulated emissions.
The definition of a Net Zero Carbon building
A lot of work has recently been undertaken in that area in the last 18 months internationally and in the UK to define Net Zero Carbon. The UKGBC have published their framework in April 2019 and have worked with LETI on the development of a simple definition for Net Zero Carbon new buildings (in operation), now supported by the BBP, the Good Homes Alliance, RIBA and CIBSE. The requirements highlight the importance of all elements below:
• Low energy use
• Low carbon energy supply
• Measurement and verification
• Zero carbon balance (i.e. 100% of the energy used is produced – on-site or off-site – by renewable energy)
• Embodied carbon
A specific role for offsetting
In the future, offsetting should only be allowed when every reasonable effort has been made to minimise energy use, use low carbon heat and integrate PVs. Therefore unless carbon offsetting becomes so expensive that Net Zero Carbon buildings are more commercially attractive, other mechanisms are likely to be required to make Zero Carbon a reality.
Figure 28 - Current greenhouse gas emissions vs target emissions in 2050 for a local authority. GHG emissions associated with buildings (new and existing) will have to
reduce to near zero.
Figure 30 - Current initiatives aimed at defining Net Zero Carbon buildings: The UKGBC Framework (2019)
Figure 31 - Ten key requirements for a Net Zero Operation Carbon - A summaryDeveloped by LETI in collaboration with UKGBC and BBP, and supported by the Good
Homes Alliance, RIBA and CIBSE (source: www.leti.london)
-200
0
200
400
600
800
1000
1200
Tota
l ann
ual c
arbo
n em
issi
ons
(ktC
O2e
)
Offset
F-gases*
Aviation*
Industry
Forestry and land use
Transport
Waste*
Buildings and towns
Current 2050
Figure 29 - Manchester have developed a framework to become Net Zero Carbon by 2038. This includes a requirement for all new buildings to be Net Zero Carbon by 2028.
Section 1
1420190258 | Cost of Carbon | May 20 | Rev M
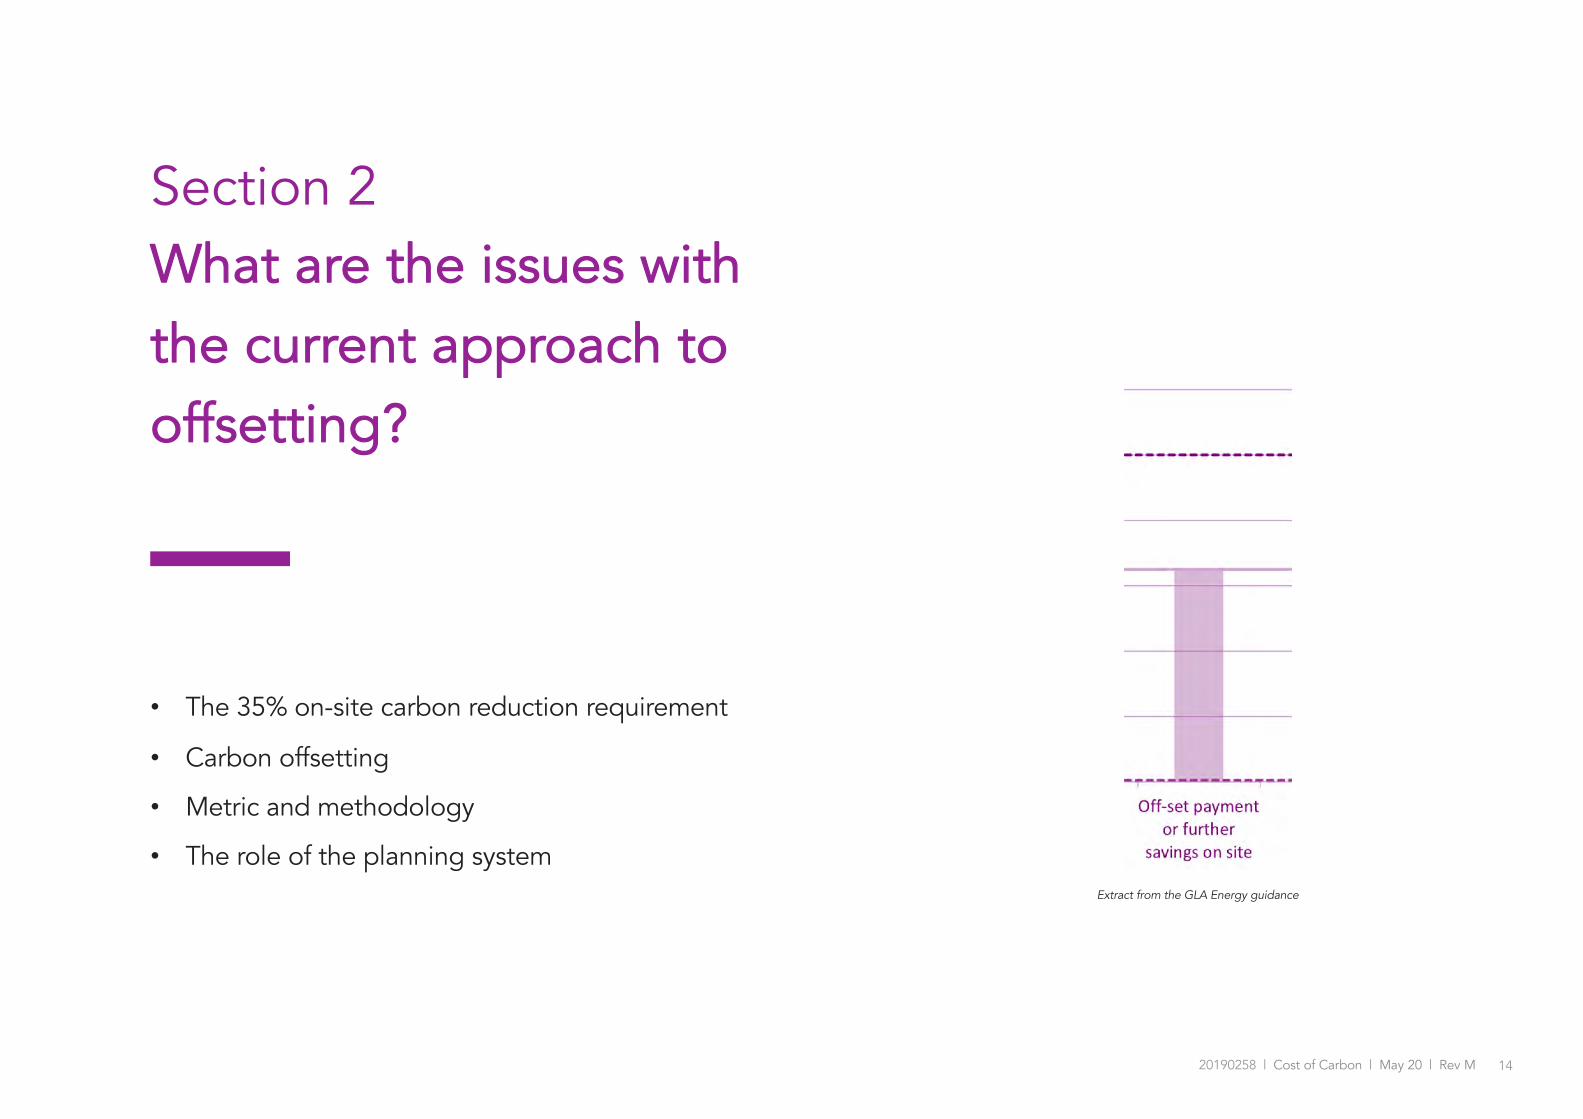
Section 2What are the issues with the current approach to offsetting?
• The 35% on-site carbon reduction requirement
• Carbon offsetting
• Metric and methodology
• The role of the planning systemExtract from the GLA Energy guidance

1520190258 | Cost of Carbon | May 20 | Rev M
Issues with the 35% on-site carbon reduction requirement
A requirement first mandated 7 years ago
The London Plan 2011 introduced a requirement for all new developments to achieve, from 2013, a 40% on-site improvement over Part L 2010. When Part L 2013 was introduced, this was translated into a 35% on-site improvement on-site over Part L 2013. Since then, however, a number of changes have been made to planning policy and guidance:
• Applicants are now required to offset the residual regulated emissions or achieve further savings on-site. In practice, carbon offsetting is often favoured.
• Since January 2019, applicants have to use the SAP 10.0 carbon factor for electricity (233 gCO2/kWh) instead of the out-dated Buildings Regulations factor (519 gCO2/kWh).
• The impact of the heating system on local air quality is given much more importance.
It sets the standard… at 35%
Unfortunately, setting the minimum requirement at 35% with a relatively cheap carbon offset price has created a culture where 35% has become the average level of performance on-site, rather than the minimum. This is illustrated by the graph in the top right corner which summarises the review of energy statements submitted to the five London boroughs. The change in carbon factor should have led to further reduction on-site but does not appear to have had a major impact.
Regulated energy only
The policy focuses only on regulated energy*. This means that unregulated energy use is not addressed at all by the planning system.
The performance gap
There are a number of reasons why the actual performance of new buildings is, on average, significantly worse than anticipated. The current Part L calculation system does not address this issue in a satisfactory way as it cannot be monitored post construction.
Conclusion
The current approach, and in particular the 35% Part L improvement requirement, is not fit-for-purpose to address the issues summarised above and acknowledged widely in the building industry for a number of years now.
* Generally, regulated’ energy consumption results from controlled, fixed building services including heating and cooling, hot water, ventilation and lighting. ‘Unregulated’ energy consumption results from processes that are not covered by building regulations, i.e. ICT equipment, lifts, refrigeration systems, cooking equipment and other ‘small power’. There are however complexities (e.g. heating used outside of NCM profiles is not technically 'regulated''.
Figures 32 and 33 - The London Plan 2011 and the draft London Plan both refer to the same level of on-site carbon reduction. It was mandated from 2013.
Figure 34 - Review of on-site carbon reduction commitments in planning applications. The planning applications submitted using the SAP 10.0 carbon factor
do not appear to achieve a greater level of Part L performance on-site. They should.
Figure 36 - Closing the Gap between Design & As-Built Performance:
Evidence Review Report © Zero Carbon Hub
Figure 35 - Building Performance Evaluation Programme: Early Findings
from Non-Domestic Projects © Innovate UK
0
10
20
30
40
50
60
70
02/01/2016 01/01/2017 01/01/2018 01/01/2019 01/01/2020
% R
educ
tion
in re
gula
ted
emis
sion
s
SAP 2012 SAP 10 Linear (35% Reduction Line)
% better than
Part L
✘ Not clear
✘ Cannot be verified during operation
kWh/m2/year
✓ Clear
✓ Can be verified during operation
Figure 37 - Moving towards a kWh/m2/yr metric would enable to create a virtuous feedback loop between design, construction and operation
Section 2

1620190258 | Cost of Carbon | May 20 | Rev M
Issues with carbon offsetting
Carbon offsetting is the default solution, and it displaces the problem
A large carbon offsetting contribution from a new development can be seen as a sign of policy failure: the building’s regulated carbon emissions are significantly higher than the policy objective (zero regulated carbon emissions on-site) and carbon offsetting is shifting responsibility to the local authority to make the scheme compliant by saving carbon elsewhere in the borough, which has its own challenges. It would be better for the planning application not to rely heavily on this.
There are also concerns about the s106 contribution being negotiated down and, in some cases, not used and returned to the applicant if it has not been used in 5 years, meaning that carbon emissions would actually not be saved.
Carbon offsetting is not a long term solution
Forecasts, including from the Committee on Climate Change suggest that in a net zero scenario, residual emissions in 2050 should be no more than 3-10% of current emissions across the UK. Over 80% of residual emissions in 2050 are forecast to occur in the aviation, agriculture, industry and waste sectors. This means that acceptable residual emissions in other sectors such as buildings are almost zero. Modest levels of residual emissions are acceptable over the next decade, on the basis they reduce close to zero by 2050. This means that emissions from both new buildings and existing buildings will have to be near zero and that transferring the emission reductions from one to the other is not sustainable in the long term.
Strategies to address residual emissions
Housing retrofit to fit heat pumps and improve building fabric efficiency can reduce emissions and fuel poverty, while improving air quality. It cannot remove atmospheric carbon.
Solar panels fitted to buildings use sites that have already been developed to provide cheap clean electricity. They can be installed in conjunction with demand management systems. They also cannot remove atmospheric carbon.
Renewable energy funded but installed outside of the borough contributes toward decarbonisation of the electricity grid. It also cannot remove atmospheric carbon.
Forestation offers the only practical strategy to remove atmospheric carbon. Total potential is very limited though, therefore emissions must be reduced as much as possible first.
Carbon Capture and Storage (CCS). Drax power station is amongst a handful of Bioenergy with Carbon Capture and Storage pilot projects worldwide, which the Committee on Climate Change view as an essential technology. It is currently capturing just 1 tonne of CO2 per day however, so is not a viable option at present.
Figure 38 - Extract from the GLA Energy guidance. Although further savings on site are encouraged, off-set payments are often favoured.
Recommended Strategy 2020 - 2030 2030 - 2040 2040 - 2050
Housing retrofit in the borough ü ü û
Solar photovoltaic panels in the borough
ü ü û
Renewable energy outside of the borough
ü û û
Carbon removal (e.g. reforestationoutside of the borough)
ü ü ü
Figure 40 - Ten options for the removal of carbon from the atmosphere (also referred to as ‘negative emissions’) Source: © Carbon Brief
Figure 39 - Recommended strategies to offset residual emissions and whether they will remain applicable in the short term, medium term and long term
Section 2
1720190258 | Cost of Carbon | May 20 | Rev M
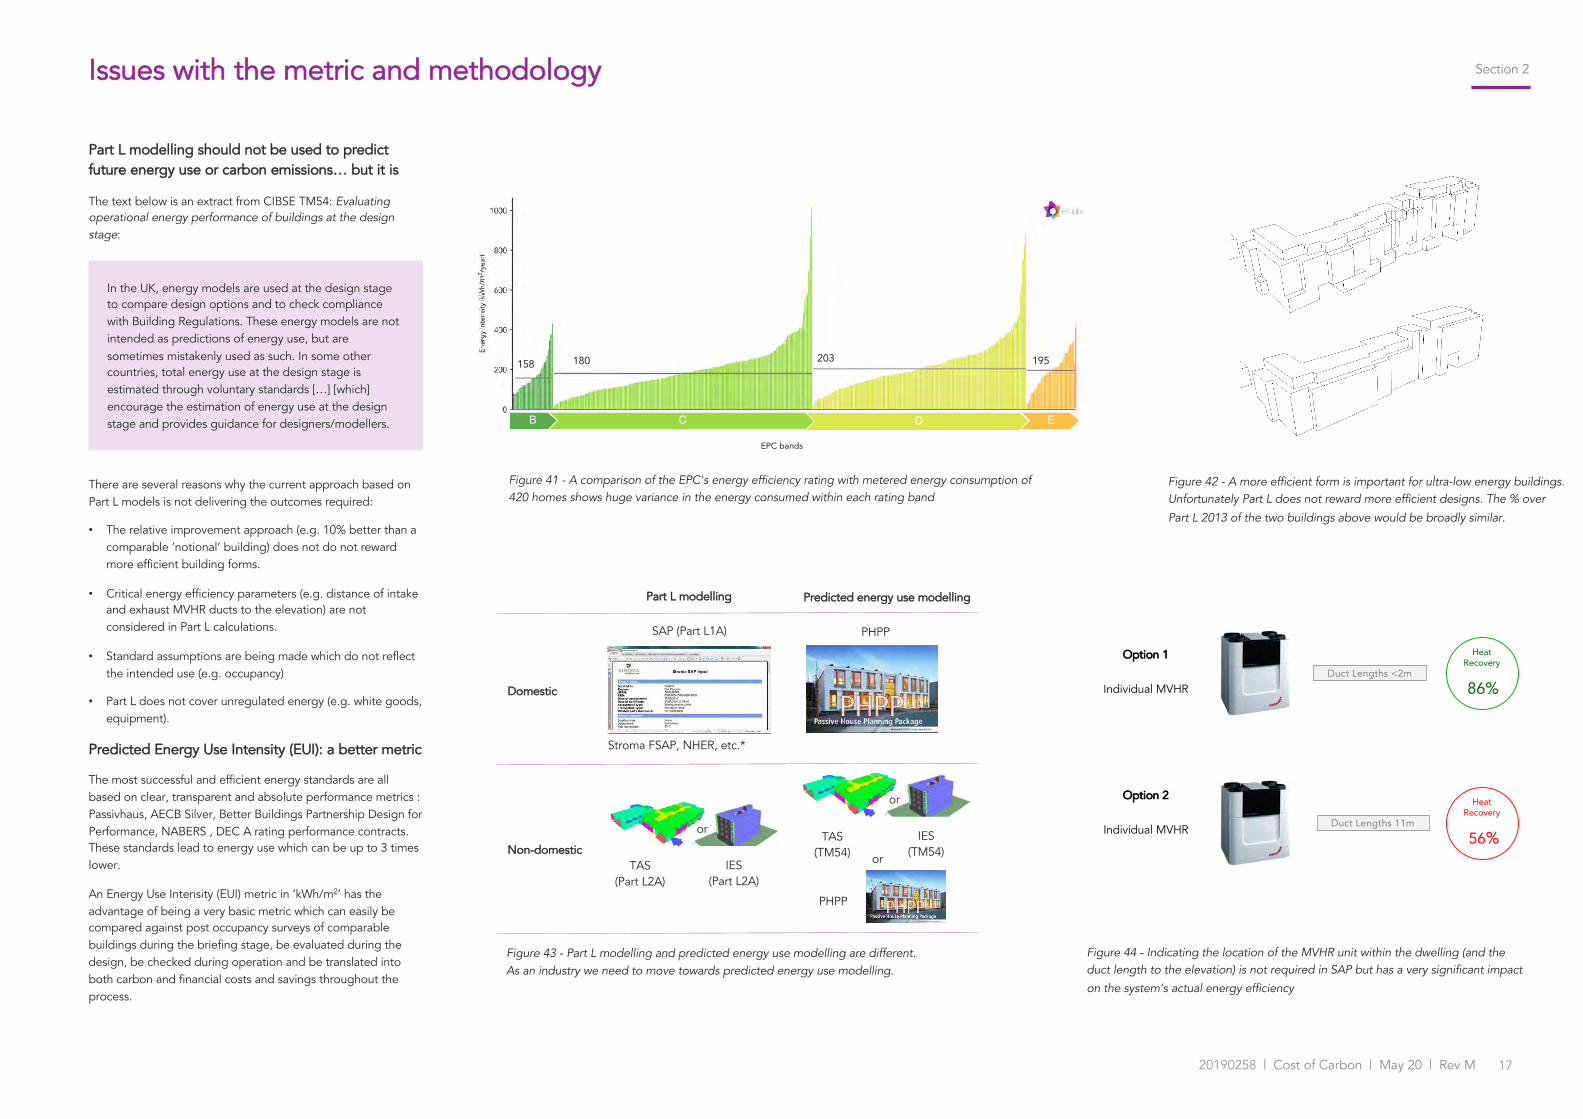
Issues with the metric and methodology
Part L modelling should not be used to predict future energy use or carbon emissions… but it is
The text below is an extract from CIBSE TM54: Evaluating operational energy performance of buildings at the design stage:
There are several reasons why the current approach based on Part L models is not delivering the outcomes required:
• The relative improvement approach (e.g. 10% better than a comparable ‘notional’ building) does not do not reward more efficient building forms.
• Critical energy efficiency parameters (e.g. distance of intake and exhaust MVHR ducts to the elevation) are not considered in Part L calculations.
• Standard assumptions are being made which do not reflect the intended use (e.g. occupancy)
• Part L does not cover unregulated energy (e.g. white goods, equipment).
Predicted Energy Use Intensity (EUI): a better metric
The most successful and efficient energy standards are all based on clear, transparent and absolute performance metrics : Passivhaus, AECB Silver, Better Buildings Partnership Design for Performance, NABERS , DEC A rating performance contracts. These standards lead to energy use which can be up to 3 times lower.
An Energy Use Intensity (EUI) metric in ‘kWh/m2’ has the advantage of being a very basic metric which can easily be compared against post occupancy surveys of comparable buildings during the briefing stage, be evaluated during the design, be checked during operation and be translated into both carbon and financial costs and savings throughout the process.
Figure 41 - A comparison of the EPC's energy efficiency rating with metered energy consumption of 420 homes shows huge variance in the energy consumed within each rating band
Figure 44 - Indicating the location of the MVHR unit within the dwelling (and the duct length to the elevation) is not required in SAP but has a very significant impact
on the system’s actual energy efficiency
In the UK, energy models are used at the design stage to compare design options and to check compliance with Building Regulations. These energy models are not intended as predictions of energy use, but are sometimes mistakenly used as such. In some other countries, total energy use at the design stage is estimated through voluntary standards […] [which] encourage the estimation of energy use at the design stage and provides guidance for designers/modellers.
Figure 42 - A more efficient form is important for ultra-low energy buildings. Unfortunately Part L does not reward more efficient designs. The % over
Part L 2013 of the two buildings above would be broadly similar.
Option 1
Individual MVHR
Option 2
Individual MVHR
Duct Lengths <2m
Heat Recovery
86%
Duct Lengths 11m
Heat Recovery
56%
© Hoare Lea
Figure 43 - Part L modelling and predicted energy use modelling are different. As an industry we need to move towards predicted energy use modelling.
Part L modelling Predicted energy use modelling
Domestic
Non-domestic
SAP (Part L1A)
TAS(Part L2A)
IES(Part L2A)
PHPP
or
Stroma FSAP, NHER, etc.*
or
TAS(TM54)
IES(TM54)
or
PHPP
B C D E
158 180 203 195
EPC bands
Section 2

1820190258 | Cost of Carbon | May 20 | Rev M
The role of the planning system and the road to Net Zero Carbon
The power of policy
The potential for policy to lead to significant positive changes in building design and construction within each borough cannot be understated. New policies should be bold and reflect the urgency of the changes that we need to see to avert catastrophic climate change.
The current system is fit for purpose to deliver the current policy but looking ahead, it is not appropriate to deliver Net Zero Carbon buildings.
In the medium term, we would recommend a change of system and an alignment between the planning metrics/methodology and the Net Zero Carbon metrics/methodology and ambition.
In the short term, we would recommend using carbon pricing to create the right incentives and drive building design and delivery in the right direction.
Key roles for the planning system
The road to Net Zero Carbon involves stepping up the requirements towards the following objectives:
• Objective 1: reduce energy use
• Objective 2: low carbon heat
• Objective 3: low carbon electricity
• Objective 4: affordable energy
• Objective 5: deliver co-benefits
The adjacent table summarises our recommendations for each of these objectives and the role that carbon pricing can play. Although it can help, some more significant changes would be required to achieve these objectives.
Table 8 - Potential contribution from carbon pricing mechanisms. * unless there is a clear plan for decarbonisation of the heat network
Net Zero Carbon Policy
Objective 1Reduce energy use
Objective 2Low carbon heat
Objective 3Low carbon electricity
Objective 4Quality homes and affordable energy
Objective 5 Deliver co-benefits
Proposal 1.1 Require buildings which use less than energy (e.g. 50% less than standard new buildings in line with BEIS’ Energy Mission).
2.1 Phase out gas heating. Gas boilers and gas CHP should not be used*
3.1 Incorporate as much renewable energy as possible (solar PVs being the most suitable technology in London)
4.1 Ensure that all low carbon homes are also affordable to run, particularly affordable and social rent units
5.1 Favour systems which have no adverse impact on air quality. There are significant co-benefits of low carbon buildings.
Can the carbon offset price contribute to this objective? ∼ ∼ ü û üComment A change in metric (i.e.
kWh/m2) and the requirement to predict energy use would be more effective (e.g. Toronto’s approach).
A no gas policy would be more effective. If applicants were required to quantify their residual emissions over 30 years, carbon pricing could play this role.
Carbon pricing can incentivise more PVs on site if the carbon price is higher than the cost of adding more PVs.
Carbon is not a proxy for energy costs/bills.
Carbon emissions from buildings are generally a proxy for their impact on local air quality.
Proposal 1.2 Reward/incentivise best practice (e.g. Passivhauscertified building)
2.2 Reward systems with low carbon content of heat
3.2 Enable a smart grid through incorporation of demand response
4.2 Deliver construction quality to reduce the performance gap
5.2 Reduce refrigerants’ impact on climate change
Can the carbon offset price contribute to this objective? ü ü û û ûComment The carbon offsetting
payment from a Passivhausscheme should be significantly smaller than an equivalent ‘minimum’ planning compliant scheme.
Carbon pricing can incentivise low carbon heat.
Part L does not quantify the carbon benefits of demand response.
The performance gap is not adequately addressed by Part L and so carbon pricing cannot play a significant role.
Some refrigerants have a very high global warming potential and some systems a high leakage rate, but carbon emissions are not a proxy for this impact.
Energy guidance
Carbon offsetting
price
The carbon offsetting price can play an important role to help deliver carbon and energy policy or guidance, but it can only help. Changes to policy and guidance will be required if we are to deliver
Net Zero Carbon buildings soon.
Section 2
1920190258 | Cost of Carbon | May 20 | Rev M
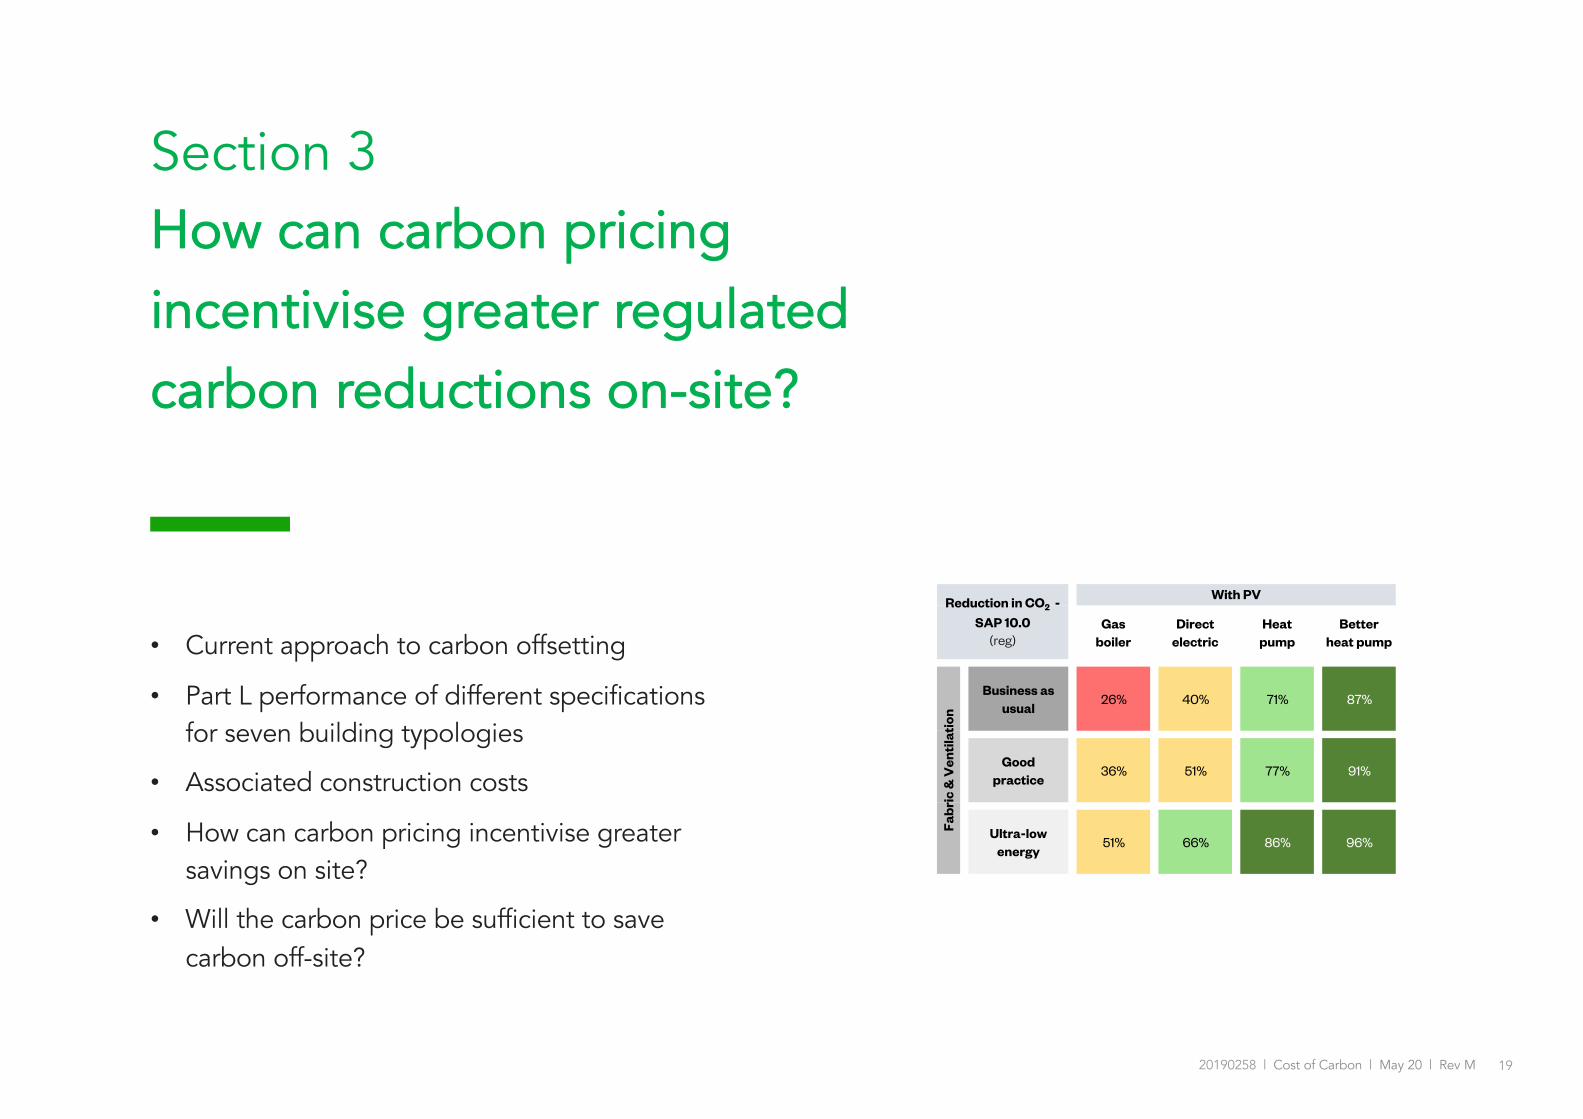
Section 3How can carbon pricing incentivise greater regulated carbon reductions on-site?
• Current approach to carbon offsetting
• Part L performance of different specifications for seven building typologies
• Associated construction costs
• How can carbon pricing incentivise greater savings on site?
• Will the carbon price be sufficient to save carbon off-site?
Gas boiler
Direct electric
Heat pump
Better heat pump
Business as usual
26% 40% 71% 87%
Good practice
36% 51% 77% 91%
Ultra-low energy
51% 66% 86% 96%
Gas boiler
Direct electric
Heat pump
Better heat pump
Business as usual
16% 80% 90% 96%
Good practice
27% 83% 92% 97%
Ultra-low energy
41% 88% 95% 99%
Fabr
ic &
Ven
tilat
ion
With PV
Fabr
ic &
Ven
tilat
ion
Reduction in CO2 - SAP 10.0
(reg)
Reduction in CO2 - Future
(reg)
With PV
2020190258 | Cost of Carbon | May 20 | Rev M
Carbon offseting: current approaches and carbon ‘floor prices’
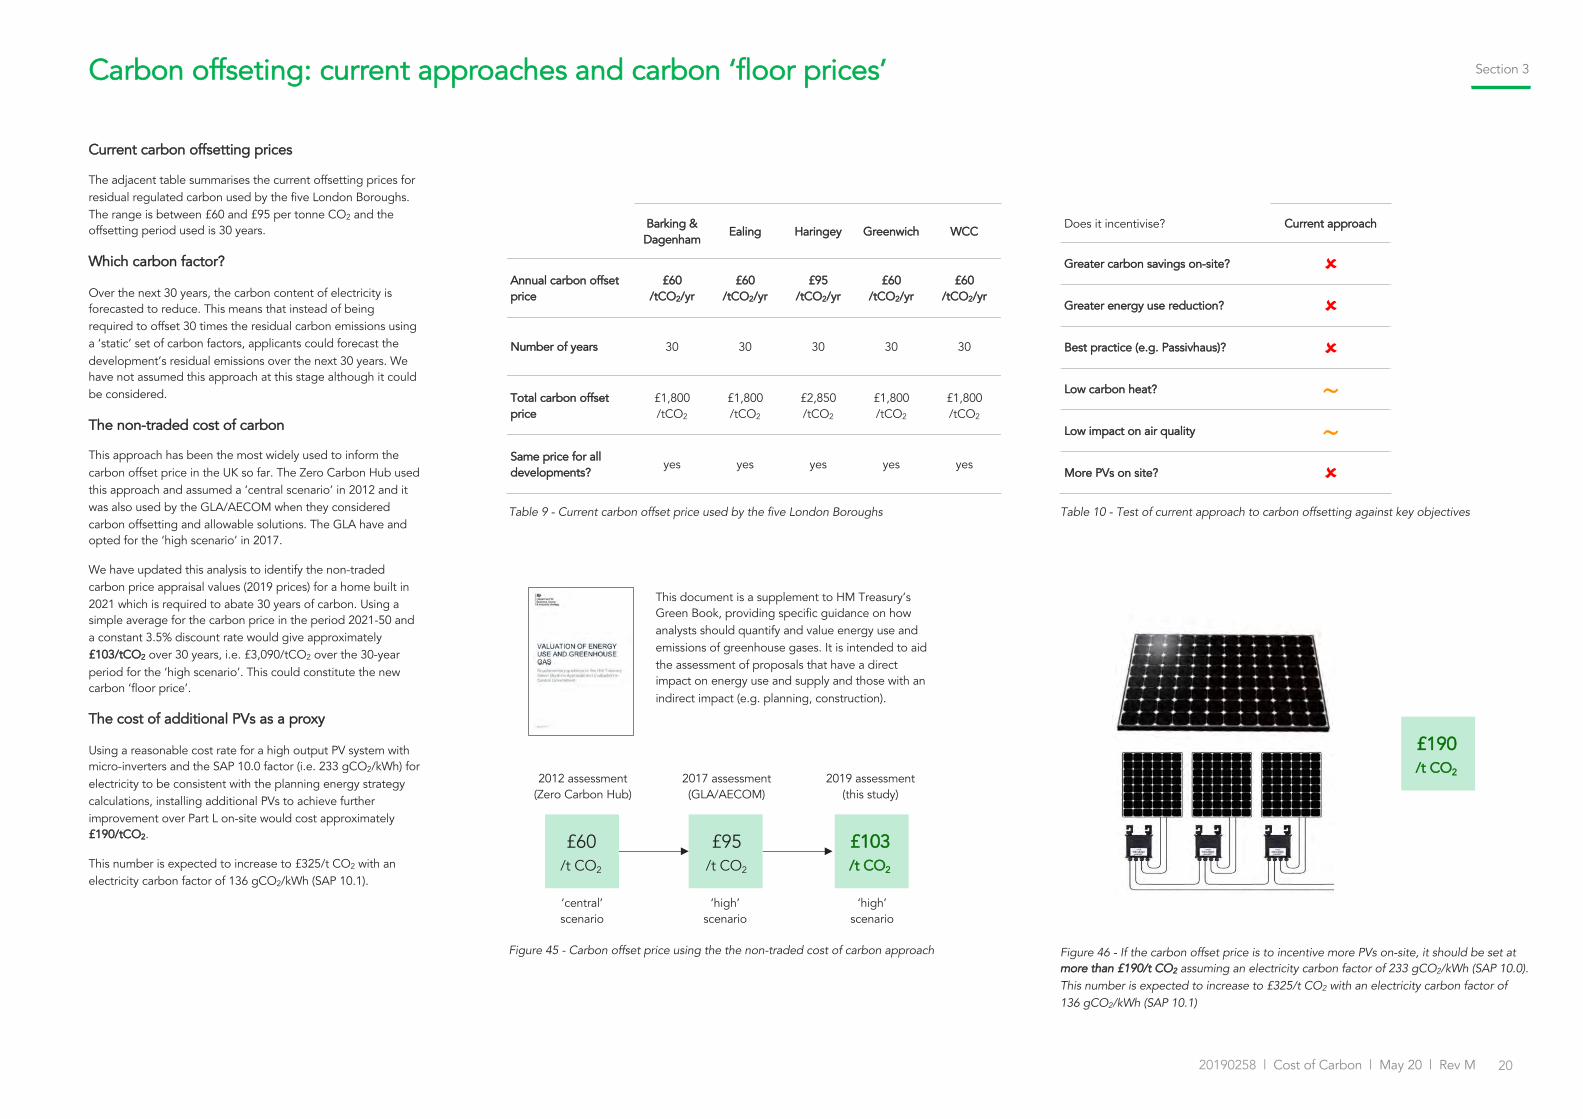
Table 9 - Current carbon offset price used by the five London Boroughs
Figure 45 - Carbon offset price using the the non-traded cost of carbon approach
Current carbon offsetting prices
The adjacent table summarises the current offsetting prices for residual regulated carbon used by the five London Boroughs. The range is between £60 and £95 per tonne CO2 and the offsetting period used is 30 years.
Which carbon factor?
Over the next 30 years, the carbon content of electricity is forecasted to reduce. This means that instead of being required to offset 30 times the residual carbon emissions using a ‘static’ set of carbon factors, applicants could forecast the development’s residual emissions over the next 30 years. We have not assumed this approach at this stage although it could be considered.
The non-traded cost of carbon
This approach has been the most widely used to inform the carbon offset price in the UK so far. The Zero Carbon Hub used this approach and assumed a ‘central scenario’ in 2012 and it was also used by the GLA/AECOM when they considered carbon offsetting and allowable solutions. The GLA have and opted for the ‘high scenario’ in 2017.
We have updated this analysis to identify the non-traded carbon price appraisal values (2019 prices) for a home built in 2021 which is required to abate 30 years of carbon. Using a simple average for the carbon price in the period 2021-50 and a constant 3.5% discount rate would give approximately £103/tCO2 over 30 years, i.e. £3,090/tCO2 over the 30-year period for the ‘high scenario’. This could constitute the new carbon ‘floor price’.
The cost of additional PVs as a proxy
Using a reasonable cost rate for a high output PV system with micro-inverters and the SAP 10.0 factor (i.e. 233 gCO2/kWh) for electricity to be consistent with the planning energy strategy calculations, installing additional PVs to achieve further improvement over Part L on-site would cost approximately £190/tCO2.
This number is expected to increase to £325/t CO2 with an electricity carbon factor of 136 gCO2/kWh (SAP 10.1).
Barking & Dagenham
Ealing Haringey Greenwich WCC
Annual carbon offset price
£60/tCO2/yr
£60/tCO2/yr
£95/tCO2/yr
£60/tCO2/yr
£60/tCO2/yr
Number of years 30 30 30 30 30
Total carbon offset price
£1,800/tCO2
£1,800/tCO2
£2,850/tCO2
£1,800/tCO2
£1,800/tCO2
Same price for all developments?
yes yes yes yes yes
£60/t CO2
£95/t CO2
£103/t CO2
2012 assessment(Zero Carbon Hub)
‘central’ scenario
‘high’ scenario
‘high’ scenario
This document is a supplement to HM Treasury’s Green Book, providing specific guidance on how analysts should quantify and value energy use and emissions of greenhouse gases. It is intended to aid the assessment of proposals that have a direct impact on energy use and supply and those with an indirect impact (e.g. planning, construction).
2017 assessment(GLA/AECOM)
2019 assessment(this study)
Figure 46 - If the carbon offset price is to incentive more PVs on-site, it should be set at more than £190/t CO2 assuming an electricity carbon factor of 233 gCO2/kWh (SAP 10.0). This number is expected to increase to £325/t CO2 with an electricity carbon factor of 136 gCO2/kWh (SAP 10.1)
£190/t CO2
Table 10 - Test of current approach to carbon offsetting against key objectives
Does it incentivise? Current approach
Greater carbon savings on-site? û
Greater energy use reduction? û
Best practice (e.g. Passivhaus)? û
Low carbon heat? ∼Low impact on air quality ∼More PVs on site? û
Section 3

2120190258 | Cost of Carbon | May 20 | Rev M
Gas boiler
Direct electric
Heat pump
Better heat pump
Business as usual
26% 40% 71% 87%
Good practice
36% 51% 77% 91%
Ultra-low energy
51% 66% 86% 96%
Gas boiler
Direct electric
Heat pump
Better heat pump
Business as usual
16% 80% 90% 96%
Good practice
27% 83% 92% 97%
Ultra-low energy
41% 88% 95% 99%
With PV
Fabr
ic &
Ven
tilat
ion
With PV
Fabr
ic &
Ven
tilat
ion
Reduction in CO2 - SAP 10
(reg)
Reduction in CO2 - Future
(reg)
A flat carbon offset price? A tiered or a stepped approach? Our methodology
All residual regulated emissions to be offset at £100/tCO2
over 30 years
Figure 47 - Carbon offsetting price: the flat rate approach Figure 48 - Carbon offsetting price: the tiered rate approachThe total carbon offset contribution will then be the sum of the above calculations
Resi
dual
regu
late
d em
issi
ons
All residual regulated emissions to be offset at £300/tCO2
over 30 years
All residual regulated emissions to be offset at £1,000/tCO2
over 30 years
Flat rateOption 1
Flat rateOption 2
Flat rateOption 3
Testing the impact of different carbon offset prices
The adjacent table summarises the tests we have undertaken with different approaches to carbon pricing. Using carbon pricing to achieve better outcomes is the main objective of this study.
What is technically achievable on-site?
One of the most important outcomes which should be achieved is greater carbon savings on site. Therefore different specifications were modelled for different building typologies to establish which levels of improvement over Part L were technically achievable, particularly by the combinations of specifications which should be incentivised.
Flat rate, tiered rate or stepped rate?
We have considered three different approaches to the carbon offset price. They are explained on the three diagrams below. We have also investigated three carbon prices:
• £1,000/tCO2 as a strong signal that greater carbon savings on site should be achieved.
• £300/tCO2 as it incentivises PVs on site.
• £100/tCO2 as it represents the updated carbon offset ‘floor price’ recommended by the GLA (£95/tCO2).
Higher residual emission tierFirst trench of residual regulated emissions to be offset at a rate of £1,000/tCO2 over 30 years
Resi
dual
regu
late
d em
issi
ons
Medium residual emission tierSecond trench of residual regulated emissions to be offset at a rate of £300/tCO2 over 30 years
Low residual emission tierThird trench of residual regulated emissions to be offset at a rate of £100/tCO2 over 30 years
Does it incentivise? Test
Greater carbon savings on-site? ?
Greater energy use reduction? ?
Best practice (e.g. Passivhaus)? ?
Low carbon heat? ?
Low impact on air quality? ?
More PVs on site? ?
Table 11 - Tests undertaken as part of this study Table 12 - How can carbon offsetting incentivise lower energy and carbon buildings?
Figure 49 - Carbon offsetting price: the stepped rate approach
High emission buildingsFor projects with residual emissions over a certain threshold, the carbon offset price is £1,000/tCO2 over 30 years
Resi
dual
regu
late
d em
issi
ons
Medium emission buildingsFor projects below a lower threshold, the carbon offset price is £300/tCO2 over 30 years
Low emission buildingsFor projects below an even lower threshold, the carbon offset price is £100/tCO2 over 30 years
Section 3
< 0% < 35% < 60% 60-80% > 80%

2220190258 | Cost of Carbon | May 20 | Rev M
Methodology
We carried out Part L modelling using accredited softwares and we post-processed the results using different carbon factors:
• CO2-Building regs: 519 gCO2/kWh for electricity. The outdated carbon factor used for Buildings Regulations.
• CO2-SAP 10.0: 233 gCO2/kWh for electricity. The carbon factor recommended by the current GLA guidance.
• CO2-Future: 71 gCO2/kWh for electricity. The estimated average carbon factor over the period 2020-2050.
Typologies modelled
After discussions with the five boroughs, the typologies summarised in Table 13 were selected and modelled.
Different fabric and ventilation specifications
1. Business as usual aims at representing the average specifications currently being proposed in current planning applications in London.
2. Improved specifications represent an improvement on ’Business as usual’.
3. Ultra-low energy specifications represent best practice and can be considered consistent with Passivhaus levels of specifications.
Different heating systems
As indicated previously, different we modelled four different levels of carbon content of heat for each typology:
A. Gas boilers should not be incentivised (as gas needs to be phased out) but still represent the ‘baseline’*.
B. Direct electric/VRF systems represent the most commercially attractive electric heating systems for domestic and non-domestic buildings respectively.
C. Heat pump represents a heating system based on the heat pump technology (individual, communal or district scale).
D. Better heat pump represents a similar system but with better efficiencies (individual, communal or district scale).
Solar Photovoltaic panels (PVs):
• No PVs
• With PVs: a pragmatic but ambitious level of roof PV coverage
* Gas boilers should only be considered where there is a robust plan for low carbon heat and when they are credibly being used as a stepping stone towards this objective.
Table 13 - Typologies modelled. These are considered to be appropriate representative examples of the predominant development types occurring in the boroughs. Please
note that the results presented in this document reflect the above and should only be considered as indicative of the results to be achieved for the typology
Table 14 - Combination of options investigated
Table 15 - Example of fabric and ventilation specifications for the medium-rise apartment building
Table 16 - Example of heating systems considered for the medium-rise apartment building
1.Business as usual
2.Improved
3.Ultra-low energy
Heating system
Ener
gy e
ffici
ency
Low
High
B. Direct electric
C. Heat pump
A1 B1 C1 D1
A2 B2 C2 D2
B3 C3 D3A3
Fabric and Ventilation level
1.Business as usual
2.Good practice
3.Ultra-low energy
Average wall U-value
0.18 W/m2K 0.15 W/m2K 0.13 W/m2K
Average roof U-value
0.15 W/m2K 0.13 W/m2K 0.10 W/m2K
Ventilation Good quality MVHR long ducts to outside
High quality MVHR long ducts to outside
High quality MVHR short ducts to outside
Effective system heat Recovery efficiency
85% 90% 90%
Ventilation system SFP
0.7 W/I/s 0.5 W/I/s 0.5 W/I/s
Airtightness <3m3/m2h <3m3/m2h <1m3/m2h
D. Better heat pump
A. Gas boiler
A. Gas boiler
B. Direct electric
C. Heat pump
D. Better heat pump
Our methodology
High carbon Low carbonNo of
storeysGIA
(sqm)
Terrace house New build 2/3 95
Medium-rise apartment building New build 5 3,200
High-rise apartment building New build 25 14,600
Education building (e.g. school) New build 3/4 6,000
Hotel New build 9 3,600
Office building New build 7 4,000
Office building Refurbishment 7 4,000
Heating Source
Communal gas boiler serving a communal heating system
Direct electric panel radiators
Heat pumps serving a communal heating system
An ambient loop fed with Individual heat pumps (WSHP) in each residential unit
Heating system
LTHW radiators fed by HIU 70○C /50○C
Direct electric panel radiators
LTHW radiators fed by HIU 65∘C /50∘C
LTHW radiators
Hot water system
HIU provides instantaneous hot water
80L hot water store with immersion heater
HIU provides instantaneous hot water
80L hot water store with immersion heaterWWHR for the showers
Seasonal efficiency
93% 100% 190% space heating 210% water heating
330% space heating 280% water heating
> 250 gCO2/kWh
200-250 gCO2/kWh
100-200 gCO2/kWh
< 100 gCO2/kWh
Section 3

2320190258 | Cost of Carbon | May 20 | Rev M
Gas boiler
Direct electric
Heat pump
Better heat pump
Business as usual
10% 16% 59% 65%
Good practice
19% 24% 62% 68%
Ultra-low energy
37% 43% 69% 74%
Gas boiler
Direct electric
Heat pump Better
heat pump
Business as usual
14% 72% 86% 88%
Good practice
23% 74% 87% 89%
Ultra-low energy
42% 81% 90% 91%
No PV
No PVReduction in CO2 - SAP 10.0
(reg)
Fabr
ic &
Ven
tilat
ion
Fabr
ic &
Ven
tilat
ion
Reduction in CO2 - Future
(reg)
Gas boiler
Direct electric
Heat pump
Better heat pump
Business as usual
47% 53% 96% 103%
Good practice
56% 62% 100% 106%
Ultra-low energy
75% 81% 107% 112%
Gas boiler
Direct electric
Heat pump
Better heat pump
Business as usual
27% 84% 99% 101%
Good practice
36% 87% 100% 102%
Ultra-low energy
55% 94% 102% 104%
With PV
Fabr
ic &
Ven
tilat
ion
With PV
Fabr
ic &
Ven
tilat
ion
Reduction in CO2 - SAP 10.0
(reg)
Reduction in CO2 - Future
(reg)
Performance against ‘be lean’ requirement*
The three Fabric & Ventilation specifications comply with the minimum ‘be lean’ requirement for domestic buildings assuming the SAP 10.0 carbon factors. It is therefore not sufficient to encourage better levels of energy efficiency. The carbon offset price could be used to incentivise this.
What can technically be achieved with energy efficient fabric and services, and low carbon heat?
Focusing on the combinations that the planning system should incentivise, very significant improvements over Part L can be achieved on-site with the SAP 10.0 carbon factors (>80%). This demonstrates that the 35% Part L improvement on-site is not adequate for terrace houses. Unless policy can be changed, the carbon offset price should correct this.
Impact of PVs
PVs are not necessary to achieve the minimum 35% improvement on-site. Unless the carbon offset price is higher than the cost of installing PVs, their inclusion in the design will not be incentivised. This should be considered.
Impact of carbon factor
If the analysis is done using an estimate for the future carbon factor for electricity (i.e. 71 gCO2/kWh) instead of SAP 10.0 (i.e. 233 gCO2/kWh), the conclusions above remain the same.
* Under the ‘be lean’ requirement of the new London Plan, residential buildings should achieve a minimum 10% improvement over Part L from energy efficiency alone (i.e. building fabric and ventilation).
Table 17 - Terrace house - Improvement over Part L assuming 233 gCO2/kWh (SAP 10) for grid-supplied electricity
Table 19 - Terrace house - Impact of changing the electricity carbon factor
Table 18 - Terrace house - Impact of PVs
Terrace house | Performance against Part L
Electricity carbon factor set at 233 gCO2/kWh
(SAP 10)
Electricity carbon factor set at 71 gCO2/kWh
(Estimate 2020-2050)
PVs covering 50% of the roof
Must not be incentivised(gas heating)
Should not be incentivised
A row of 8 terrace houses has been considered as a case study. The mid-
terrace floor area is 95 sqm GIA.
(draft London Plan requirement)
achieved
BE�LEAN�Ͳ�All�Typologies
≥10%
Terraced house
Business as usual
10%
Good practice
19%
Ultra-low energy
37%
Fabr
ic &
Ven
tilat
ion
Be Lean Reduction in CO2 -
SAP 10.0(reg)
Gas boiler
Direct electric
Heat pump
Better heat pump
Business as usual
47% 53% 96% 103%
Good practice
56% 62% 100% 106%
Ultra-low energy
75% 81% 107% 112%
Gas boiler
Direct electric
Heat pump
Better heat pump
Business as usual
27% 84% 99% 101%
Good practice
36% 87% 100% 102%
Ultra-low energy
55% 94% 102% 104%
With PV
Fabr
ic &
Ven
tilat
ion
With PV
Fabr
ic &
Ven
tilat
ion
Reduction in CO2 - SAP 10.0
(reg)
Reduction in CO2 - Future
(reg)
Gas boiler
Direct electric
Heat pump
Better heat pump
Business as usual
47% 53% 96% 103%
Good practice
56% 62% 100% 106%
Ultra-low energy
75% 81% 107% 112%
Gas boiler
Direct electric
Heat pump
Better heat pump
Business as usual
27% 84% 99% 101%
Good practice
36% 87% 100% 102%
Ultra-low energy
55% 94% 102% 104%
With PV
Fabr
ic &
Ven
tilat
ion
With PV
Fabr
ic &
Ven
tilat
ion
Reduction in CO2 - SAP 10.0
(reg)
Reduction in CO2 - Future
(reg)
Section 3
< 0% < 35% < 60% 60-80% > 80%

2420190258 | Cost of Carbon | May 20 | Rev M
Gas boiler
Direct electric
Heat pump
Better heat pump
Business as usual
0.0% -2.9% 0.8% 1.5%
Good practice
1.2% -1.6% 2.1% 2.8%
Ultra-low energy
3.6% 0.8% 4.4% 5.2%
Gas boiler
Direct electric
Heat pump
Better heat pump
Business as usual
0.0% -2.7% 1.6% 3.7%
Good practice
1.8% -0.9% 3.4% 5.5%
Ultra-low energy
3.1% 0.4% 4.7% 6.8%
Mid-rise apartment (~ £2,200/m2 baseline construction cost)
Terrace house (~ £1,800/m2 baseline construction cost)
Fabr
ic &
Ven
tilat
ion
% uplift in cost per m2 of construction
With PV
% uplift in cost per m2 of construction
With PV
Fabr
ic &
Ven
tilat
ion
Gas boiler
Direct electric
Heat pump
Better heat pump
Business as usual
47% 53% 96% 103%
Good practice
56% 62% 100% 106%
Ultra-low energy
75% 81% 107% 112%
Gas boiler
Direct electric
Heat pump
Better heat pump
Business as usual
27% 84% 99% 101%
Good practice
36% 87% 100% 102%
Ultra-low energy
55% 94% 102% 104%
With PV
Fabr
ic &
Ven
tilat
ion
With PV
Fabr
ic &
Ven
tilat
ion
Reduction in CO2 - SAP 10.0
(reg)
Reduction in CO2 - Future
(reg)
Construction costs
The baseline in terms of construction costs is the ‘Business as usual + Gas boiler + PVs’ scenario. This scenario is compliant with the London Plan requirement of a minimum 35% carbon reduction over Part L.
The additional construction costs of the four lowest carbon options compared to this baseline are comprised between 2.1% and 5.2%.
This excludes any carbon offsetting cost.
It is important to note that this comparison is based on exactly the same design and does not include the cost reductions and efficiencies which can be achieved on a low energy design process (e.g. form factor).
Development costs
The impact would be only between 0.8% and 2.1% if the whole development costs were considered.
Additional construction cost vs Part L CO2 reduction
The graph on the right hand side highlights the relationship between uplift in cost and reduction in carbon emissions.
Notes on costs:
The uplift costs associated with each specification option were estimated based on Currie & Brown’s cost datasets for energy efficiency and low carbon technologies which incorporate information from market prices obtained, specific market testing and first principles cost planning by their specialist quantity surveyors. The costs are based on Q3 2019 prices and reflect a London / South East cost base. Costs were developed for each affected element to identify the variance in price between the baseline and the enhanced specifications.
Those elements that are not materially affected by the energy efficiency / low carbon technology options, eg substructure, roof coverings, kitchen and bathrooms, etc, were not costed in detail. Instead these costs were incorporated within the ‘balance of construction’ cost was estimated by reference to a typical whole building construction cost per m2 for the building type in question. This whole building cost was then adjusted for each option based on the variance in the elements costed in detail to determine the overall percentage impact on construction costs.
The potential impact on total development cost was estimated on the basis of the construction cost representing c.40% of the total development costs with the balance being comprised of land cost, finance and project fees and other planning requirements.
Table 21 - Terrace house - Additional construction costs (£/m2) compared with the ‘Business as usual + Gas boiler scenario + PVs’ baseline scenario - Analysis by Currie & Brown
Terrace house | Capital cost
Table 20 - Terrace house - Improvement over Part L assuming 233 gCO2/kWh (SAP 10) for grid-supplied electricity (Same table as previous page)
Figure 48 - Terrace house - Additional construction costs vs Part L reduction
Information required from Naomi
The four lowest carbon options are outlined
TERRACE
-4%
-2%
0%
2%
4%
6%
0% 10% 20% 30% 40% 50% 60% 70% 80% 90% 100% 110% 120%
% U
plift
in c
ost/
m2
cons
truc
tion
% Reduction in CO2 - SAP 10
Uplift in cost vs reduction in carbon
-4%
-2%
0%
2%
4%
6%
0% 10% 20% 30% 40% 50% 60% 70% 80% 90% 100% 110% 120%
% U
plift
in c
ost/
m2
cons
truc
tion
% Reduction in CO2 - SAP 10.0
Uplift in cost vs reduction in carbon
Gas boiler
Direct electric
Heat pump
Better heat pump
Business as usual
Good practice
Ultra-low energy
More expensive
Better Part L performance
Section 3
< 0% < 35% < 60% 60-80% > 80%

2520190258 | Cost of Carbon | May 20 | Rev M
TERRACE
Business as usual 1A 88 1B 11 1C 16 1D 27
Good practice 2A 71 2B 3 2C 37 2D 50
Ultra-low energy 3A 81 3B 22 3C 80 3D 93
Better heat pump
Fabr
ic &
V
entil
atio
n
£/m2 Gas boiler
Direct electric
Heat pump
1A
1B 1C 1D
2A
2B
2C 2D3A
3B
3C 3D
0% 10% 20% 30% 40% 50% 60% 70% 80% 90% 100% 110% 120%
-100
-50
0
50
100
150
200
250
300
% Reduction in CO2 - SAP 10.0
Add
ition
al c
onst
ruct
ion
+ c
arbo
n of
fset
cos
t -£/
m2
Our recommendation: tiered price at £1,000, £300 and £100/tonne
1A
1B
1C 1D2A
2B
2C 2D3A
3B
3C 3D
0% 10% 20% 30% 40% 50% 60% 70% 80% 90% 100% 110% 120%
-100
-50
0
50
100
150
200
250
300
% Reduction in CO2 - SAP 10.0
Add
ition
al c
onst
ruct
ion
+ c
arbo
n of
fset
cos
t -£/
m2
Current approach: flat price at £60/tonne
Business as usual 23 -31 16 27
Good practice 41 -13 37 50
Ultra-low energy 76 22 80 93
Business as usual 69 10 19 27
Good practice 79 21 37 50
Ultra-low energy 98 39 80 93
Business as usual 229 153 30 27
Good practice 213 137 38 50
Ultra-low energy 175 96 80 93
Business as usual 229 153 16 27
Good practice 213 21 37 50
Ultra-low energy 98 22 80 93
Flat price £100/t £/m2
Gas boiler
Direct electric
Heat pump
Better heat pump
Fabr
ic &
V
entil
atio
n
Flat price £300/t £/m2
Gas boiler
Direct electric
Heat pump
Better heat pump
Fabr
ic &
V
entil
atio
n
Flat price £1,000/t £/m2
Gas boiler
Direct electric
Heat pump
Better heat pump
Better heat pump
Fabr
ic &
V
entil
atio
nFa
bric
&
Ven
tilat
ion
Stepped price £1,000, 300, 100/t - £/m2
Gas boiler
Direct electric
Heat pump
TERRACE
Business as usual 1A 88 1B 11 1C 16 1D 27
Good practice 2A 71 2B 3 2C 37 2D 50
Ultra-low energy 3A 81 3B 22 3C 80 3D 93
Better heat pump
Fabr
ic &
V
entil
atio
n
£/m2 Gas boiler
Direct electric
Heat pump
1A
1B 1C 1D
2A
2B
2C 2D3A
3B
3C 3D
0% 10% 20% 30% 40% 50% 60% 70% 80% 90% 100% 110% 120%
-100
-50
0
50
100
150
200
250
300
% Reduction in CO2 - SAP 10.0
Add
ition
al c
onst
ruct
ion
+ c
arbo
n of
fset
cos
t -£/
m2
Our recommendation: tiered price at £1,000, £300 and £100/tonne
1A
1B
1C 1D2A
2B
2C 2D3A
3B
3C 3D
0% 10% 20% 30% 40% 50% 60% 70% 80% 90% 100% 110% 120%
-100
-50
0
50
100
150
200
250
300
% Reduction in CO2 - SAP 10.0
Add
ition
al c
onst
ruct
ion
+ c
arbo
n of
fset
cos
t -£/
m2
Current approach: flat price at £60/tonne
Terrace house | Carbon offsetting scenarios
Flat carbon price (Terraced house) Impact on additional cost + carbon offsetting cost
Stepped carbon price
Current approach with a flat carbon price at £60/t
The baseline scenario (‘Business as usual + Gas boiler + PVs’) would be required to make a carbon offsetting contribution equivalent to approximately £14/m2.
Our recommendation: a tiered carbon price
We recommend a tiered carbon price as follows:
• £1,000/tCO2 for residual emissions worse than a 60% improvement over Part L as our analysis demonstrates that it is possible to achieve at least a 60% reduction with low carbon heat (e.g. heat pump system) and reasonable levels of fabric and ventilation performance. The high price would encourage applicants to consider this approach as ’the new business as usual’.
• £300/tCO2 for residual emissions comprised between a 60 and 80% improvement over Part L to incentivise more savings from fabric and ventilation performance and/or more PVs: it would be cheaper to install more PVs than to pay into the offset fund.
• £100/tCO2 for residual emissions better than a 80 improvement over Part L to signal that achieving an 80% improvement over Part L is a good achievement. To signal this even more strongly, the carbon price could even be reduced further.
As it can be seen on the adjacent graphs, changing the carbon price from the current £60/tCO2 to our recommended tiered approach would increase the costs of the high carbon specifications. It would therefore successfully incentivise applicants to consider and implement lower carbon strategies.
Additional costs and impact on viability
The most economic low carbon scenarios are 3B (Ultra-low energy + Direct electric + PVs) at £22/m2 and 2C (Good practice + Heat pump + PVs) at £37/m2. This represents a total additional cost (construction + offsetting) of only £8-£23/m2 compared to the baseline.
Other approaches to the carbon offsetting price
• Flat carbon price: the flat carbon price approach would only be effective with a very high carbon offset price.
• Stepped carbon price: the stepped approach has the desired effect but creates some potential ‘’threshold’ effects: a development’s carbon offsetting contribution would triple if its residual emissions were to increase by a small margin, but above a threshold.
Table 22 - Terrace house – What would be the effect of the recommended tiered carbon price approach?
More expensive Better Part L performance
More expensive Better Part L performance
Alternative approaches to carbon pricing (Not recommended)
Section 3
< 0% < 35% < 60% 60-80% > 80%

2620190258 | Cost of Carbon | May 20 | Rev M
Performance against ‘be lean’ requirement*
Only the ‘Good practice’ and ‘Ultra-low energy’ Fabric & Ventilation specifications comply with the minimum ‘be lean’ requirement for domestic buildings assuming the SAP 10.0 carbon factors. It is therefore effective at incentivising better levels of energy efficiency. The carbon offset price could be used to go further.
What can technically be achieved with energy efficient fabric and services, and low carbon heat?
Focusing on the combinations that the planning system should incentivise, very significant improvements over Part L can be achieved on-site with the SAP 10.0 carbon factors (>65%). This demonstrates that the 35% Part L improvement on-site is not adequate for mid-rise apartment building. Unless policy can be changed, the carbon offset price should correct this.
Impact of PVs
PVs are not necessary to achieve the minimum 35% improvement on-site. Unless the carbon offset price is higher than the cost of installing PVs, their inclusion in the design will not be incentivised. This should be considered.
Impact of carbon factor
If the analysis is done using an estimate for the future carbon factor for electricity (i.e. 71 gCO2/kWh) instead of SAP 10 (i.e. 233 gCO2/kWh), the conclusions above remain the same.
* Under the ‘be lean’ requirement of the new London Plan, residential buildings should achieve a minimum 10% improvement over Part L from energy efficiency alone (i.e. building fabric and ventilation).
Table 23 - Mid-rise apartment building - Improvement over Part L assuming 233 gCO2/kWh (SAP 10) for grid-supplied electricity
Table 25 - Mid-rise apartment building - Impact of changing the electricity carbon factor
Table 24 - Mid-rise apartment building - Impact of PVs
Mid-rise apartment building | Performance against Part L
Electricity carbon factor set at 233 gCO2/kWh
(SAP 10)
Electricity carbon factor set at 71 gCO2/kWh
(Estimate 2020-2050)
PVs covering 50% of the roof
A 5-storey apartment building has been considered as a case study.
Its floor area is 3,200 sqm GIA.
Must not be incentivised(gas heating)
Should not be incentivised
(draft London Plan requirement)
Climate: GB0001a - London (Central)Building type: Dwelling15.8 kWh/m †́aTFA 2753 m †́ (Direct entry)Heat Loss Form Factor 1.31
BE�LEAN�Ͳ�All�Typologies
≥10%
Mid-rise apartment
Business as usual
4%
Good practice
15%
Ultra-low energy
29%
Fabr
ic &
Ven
tilat
ion
Be Lean Reduction in CO2 -
SAP 10.0(reg)
Gas boiler
Direct electric
Heat pump
Better heat pump
Business as usual
26% 40% 71% 87%
Good practice
36% 51% 77% 91%
Ultra-low energy
51% 66% 86% 96%
Gas boiler
Direct electric
Heat pump
Better heat pump
Business as usual
16% 80% 90% 96%
Good practice
27% 83% 92% 97%
Ultra-low energy
41% 88% 95% 99%
Fabr
ic &
Ven
tilat
ion
With PV
Fabr
ic &
Ven
tilat
ion
Reduction in CO2 - SAP 10.0
(reg)
Reduction in CO2 - Future
(reg)
With PV
Gas boiler
Direct electric
Heat pump
Better heat pump
Business as usual
4% 18% 49% 66%
Good practice
15% 29% 55% 69%
Ultra-low energy
29% 44% 64% 75%
Gas boiler
Direct electric
Heat pump
Better heat pump
Business as usual
8% 72% 83% 88%
Good practice
19% 76% 85% 90%
Ultra-low energy
34% 81% 88% 91%
Fabr
ic &
Ven
tilat
ion
Fabr
ic &
Ven
tilat
ion
Reduction in CO2 - SAP 10.0
(reg)
Reduction in CO2 - Future
(reg)
No PV
No PV
Gas boiler
Direct electric
Heat pump
Better heat pump
Business as usual
26% 40% 71% 87%
Good practice
36% 51% 77% 91%
Ultra-low energy
51% 66% 86% 96%
Gas boiler
Direct electric
Heat pump
Better heat pump
Business as usual
16% 80% 90% 96%
Good practice
27% 83% 92% 97%
Ultra-low energy
41% 88% 95% 99%
Fabr
ic &
Ven
tilat
ion
With PV
Fabr
ic &
Ven
tilat
ion
Reduction in CO2 - SAP 10.0
(reg)
Reduction in CO2 - Future
(reg)
With PV
Section 3
< 0% < 35% < 60% 60-80% > 80%

2720190258 | Cost of Carbon | May 20 | Rev M
MID�RISE
-4%
-2%
0%
2%
4%
6%
0% 10% 20% 30% 40% 50% 60% 70% 80% 90% 100% 110%
% U
plift
in c
ost/
m2
cons
truc
tion
% Reduction in CO2 - SAP 10
Uplift in cost vs reduction in carbon
-4%
-2%
0%
2%
4%
6%
0% 10% 20% 30% 40% 50% 60% 70% 80% 90% 100% 110%
% U
plift
in c
ost/
m2
cons
truc
tion
% Reduction in CO2 - SAP 10.0
Uplift in cost vs reduction in carbon
Gas boiler
Direct electric
Heat pump
Better heat pump
Business as usual
0.0% -2.9% 0.8% 1.5%
Good practice
1.2% -1.6% 2.1% 2.8%
Ultra-low energy
3.6% 0.8% 4.4% 5.2%
Gas boiler
Direct electric
Heat pump
Better heat pump
Business as usual
0.0% -2.7% 1.6% 3.7%
Good practice
1.8% -0.9% 3.4% 5.5%
Ultra-low energy
3.1% 0.4% 4.7% 6.8%
Mid-rise apartment (~ £2,200/m2 baseline construction cost)
Terrace house (~ £1,800/m2 baseline construction cost)
Fabr
ic &
Ven
tilat
ion
% uplift in cost per m2 of construction
With PV
% uplift in cost per m2 of construction
With PV
Fabr
ic &
Ven
tilat
ion
Gas boiler
Direct electric
Heat pump
Better heat pump
Business as usual
26% 40% 71% 87%
Good practice
36% 51% 77% 91%
Ultra-low energy
51% 66% 86% 96%
Gas boiler
Direct electric
Heat pump
Better heat pump
Business as usual
16% 80% 90% 96%
Good practice
27% 83% 92% 97%
Ultra-low energy
41% 88% 95% 99%
Fabr
ic &
Ven
tilat
ion
With PV
Fabr
ic &
Ven
tilat
ion
Reduction in CO2 - SAP 10.0
(reg)
Reduction in CO2 - Future
(reg)
With PV
Construction costs
The baseline in terms of construction costs is the ‘Business as usual + Gas boiler + PVs’ scenario. This scenario is nearly compliant with the London Plan requirement of a minimum 35% carbon reduction over Part L but is not far (i.e. 26%).
The additional construction costs of the four lowest carbon options compared to this baseline are comprised between 3.4% and 6.8%.
This excludes any carbon offsetting cost.
It is important to note that this comparison is based on exactly the same design and does not include the cost reductions and efficiencies which can be achieved on a low energy design process (e.g. form factor).
Development costs
The impact would be only between 1.4% and 2.7% if the whole development costs were considered.
Additional construction cost vs Part L CO2 reduction
The graph on the right hand side highlights the relationship between uplift in cost and reduction in carbon emissions.
Notes on costs:
The uplift costs associated with each specification option were estimated based on Currie & Brown’s cost datasets for energy efficiency and low carbon technologies which incorporate information from market prices obtained, specific market testing and first principles cost planning by their specialist quantity surveyors. The costs are based on Q3 2019 prices and reflect a London / South East cost base. Costs were developed for each affected element to identify the variance in price between the baseline and the enhanced specifications.
Those elements that are not materially affected by the energy efficiency / low carbon technology options, eg substructure, roof coverings, kitchen and bathrooms, etc, were not costed in detail. Instead these costs were incorporated within the ‘balance of construction’ cost was estimated by reference to a typical whole building construction cost per m2 for the building type in question. This whole building cost was then adjusted for each option based on the variance in the elements costed in detail to determine the overall percentage impact on construction costs.
The potential impact on total development cost was estimated on the basis of the construction cost representing c.40% of the total development costs with the balance being comprised of land cost, finance and project fees and other planning requirements.
Mid-rise apartment building | Capital cost
Table 27 - Mid-rise apartment building - Additional construction costs (£/m2) compared with the ‘Business as usual + Gas boiler scenario + PVs’ baseline scenario - Analysis by Currie & Brown
Table 26 - Mid-rise apartment building - Improvement over Part L assuming 233 gCO2/kWh (SAP 10) for grid-supplied electricity (Same table as previous page)
Figure 48 - Mid-rise apartment building - Additional construction costs vs Part L reduction based on system chosen
The four lowest carbon options are outlined
Gas boiler
Direct electric
Heat pump
Better heat pump
Business as usual
Good practice
Ultra-low energy
More expensive
Better Part L performance
Section 3
< 0% < 35% < 60% 60-80% > 80%

2820190258 | Cost of Carbon | May 20 | Rev M
MID�RISE
Business as usual 1A 196 1B 73 1C 59 1D 87
Good practice 2A 186 2B 62 2C 89 2D 124
Ultra-low energy 3A 150 3B 38 3C 110 3D 150
Gas boiler
Direct electric
Heat pump
Better heat pump
Fabr
ic &
V
entil
atio
n
£/m2
1A
1B1C
1D
2A
2B2C
2D3A
3B
3C
3D
0% 10% 20% 30% 40% 50% 60% 70% 80% 90% 100% 110%
-100
-50
0
50
100
150
200
250
300
% Reduction in CO2 - SAP 10.0
Add
ition
al c
onst
ruct
ion
+ c
arbo
n of
fset
cos
t -£/
m2
Our recommendation: tiered price at £1,000, £300 and £100/tonne
1A
1B
1C
1D2A
2B
2C
2D
3A
3B
3C
3D
0% 10% 20% 30% 40% 50% 60% 70% 80% 90% 100% 110%
-100
-50
0
50
100
150
200
250
300
% Reduction in CO2 - SAP 10.0
Add
ition
al c
onst
ruct
ion
+ c
arbo
n of
fset
cos
t -£/
m2
Current approach: flat price at £60/tonne
Mid-rise apartment building | Carbon offsetting scenarios
Flat carbon price (Mid-rise apartment building) Impact on additional cost + carbon offsetting cost
Stepped carbon price
MID�RISE
Business as usual 1A 196 1B 73 1C 59 1D 87
Good practice 2A 186 2B 62 2C 89 2D 124
Ultra-low energy 3A 150 3B 38 3C 110 3D 150
Gas boiler
Direct electric
Heat pump
Better heat pump
Fabr
ic &
V
entil
atio
n
£/m2
1A
1B1C
1D
2A
2B2C
2D3A
3B
3C
3D
0% 10% 20% 30% 40% 50% 60% 70% 80% 90% 100% 110%
-100
-50
0
50
100
150
200
250
300
% Reduction in CO2 - SAP 10.0
Add
ition
al c
onst
ruct
ion
+ c
arbo
n of
fset
cos
t -£/
m2
Our recommendation: tiered price at £1,000, £300 and £100/tonne
1A
1B
1C
1D2A
2B
2C
2D
3A
3B
3C
3D
0% 10% 20% 30% 40% 50% 60% 70% 80% 90% 100% 110%
-100
-50
0
50
100
150
200
250
300
% Reduction in CO2 - SAP 10.0
Add
ition
al c
onst
ruct
ion
+ c
arbo
n of
fset
cos
t -£/
m2
Current approach: flat price at £60/tonne
Business as usual 34 -31 50 87
Good practice 68 2 85 124
Ultra-low energy 90 24 110 150
Business as usual 101 23 76 99
Good practice 125 47 106 132
Ultra-low energy 135 55 123 154
Business as usual 337 215 170 139
Good practice 327 203 179 160
Ultra-low energy 292 163 168 166
Business as usual 337 215 76 87
Good practice 327 203 106 124
Ultra-low energy 292 55 110 150
Fabr
ic &
V
entil
atio
n
Better heat pump
Fabr
ic &
V
entil
atio
n
Stepped price £1,000, 300, 100/t - £/m2
Gas boiler
Direct electric
Heat pump
Better heat pump
Heat pump
Fabr
ic &
V
entil
atio
n
Flat price £1,000/t £/m2
Gas boiler
Direct electric
Better heat pump
Fabr
ic &
V
entil
atio
n
Flat price £300/t £/m2
Gas boiler
Direct electric
Heat pump
Better heat pump
Flat price £100/t £/m2
Gas boiler
Direct electric
Heat pump
Current approach with a flat carbon price at £60/t
The baseline scenario (‘Business as usual + Gas boiler + PVs’) would be required to make a carbon offsetting contribution equivalent to approximately £20/m2.
Our recommendation: a tiered carbon price
We recommend a tiered carbon price as follows:
• £1,000/tCO2 for residual emissions worse than a 60% improvement over Part L as our analysis demonstrates that it is possible to achieve at least a 60% reduction with low carbon heat (e.g. heat pump system) and reasonable levels of fabric and ventilation performance. The high price would encourage applicants to consider this approach as ’the new business as usual’.
• £300/tCO2 for residual emissions comprised between a 60 and 80% improvement over Part L to incentivise more savings from fabric and ventilation performance and/or more PVs: it would be cheaper to install more PVs than to pay into the offset fund.
• £100/tCO2 for residual emissions better than a 80 improvement over Part L to signal that achieving an 80% improvement over Part L is a good achievement. To signal this even more strongly, the carbon price could even be reduced further.
As it can be seen on the adjacent graphs, changing the carbon price from the current £60/tCO2 to our recommended tiered approach would turn the cheapest and lowest performing specifications into the most expensive ones (or make their cost at least comparable to the low carbon alternatives). It would therefore successfully incentivise applicants to consider and implement lower carbon strategies.
Additional costs and impact on viability
The most economic low carbon scenarios are 3B (Ultra-low energy + Direct electric + PVs) at £38/m2, 1C (Business as usual + Heat pump + PVs) at £59/m2 and and 2C (Good practice + Heat pump + PVs) at £89/m2. This represents a total additional cost (construction + offsetting) of £18-£69/m2 compared to the baseline.
Other approaches to the carbon offsetting price
• Flat carbon price: the flat carbon price approach would only be effective with a very high carbon offset price.
• Stepped carbon price: the stepped approach has the desired effect but creates some potential ‘’threshold’ effects: a development’s carbon offsetting contribution would triple if its residual emissions were to increase by a small margin, but above a threshold.
Table 28 - Mid-rise apartment building– What would be the effect of the recommended tiered carbon price approach?
More expensive Better Part L performance
More expensive Better Part L performance
Alternative approaches to carbon pricing (Not recommended)
Section 3
< 0% < 35% < 60% 60-80% > 80%
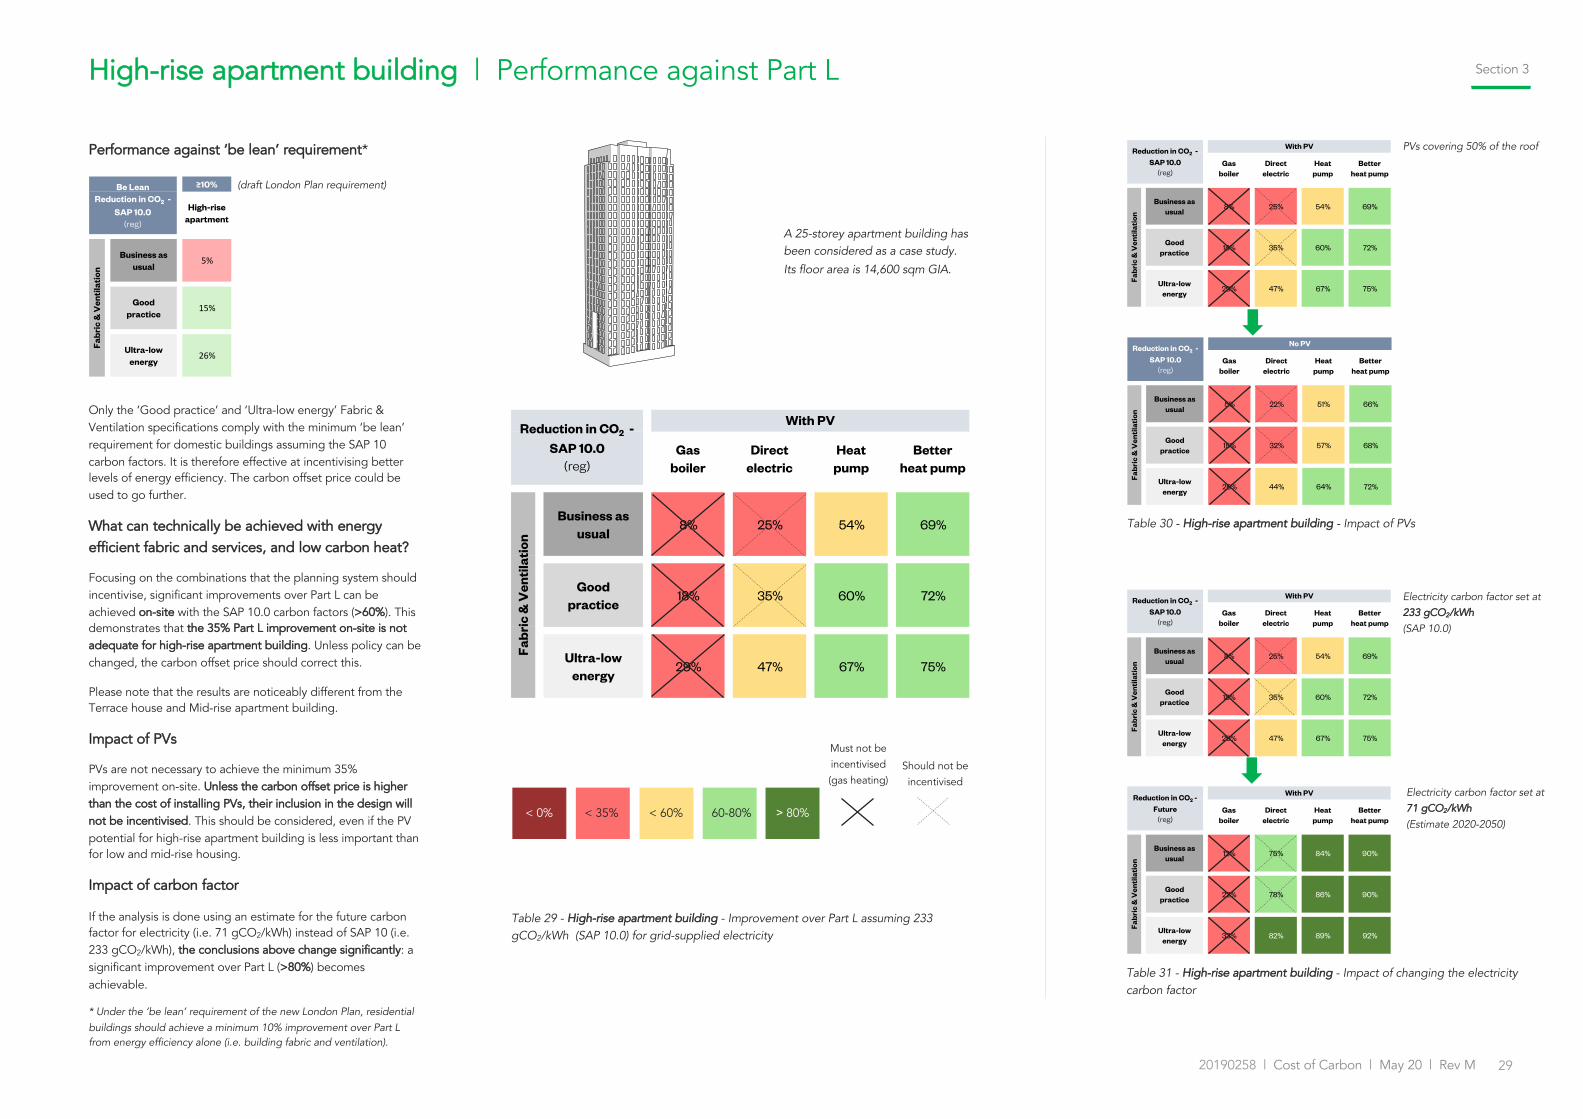
2920190258 | Cost of Carbon | May 20 | Rev M
Performance against ‘be lean’ requirement*
Only the ‘Good practice’ and ‘Ultra-low energy’ Fabric & Ventilation specifications comply with the minimum ‘be lean’ requirement for domestic buildings assuming the SAP 10 carbon factors. It is therefore effective at incentivising better levels of energy efficiency. The carbon offset price could be used to go further.
What can technically be achieved with energy efficient fabric and services, and low carbon heat?
Focusing on the combinations that the planning system should incentivise, significant improvements over Part L can be achieved on-site with the SAP 10.0 carbon factors (>60%). This demonstrates that the 35% Part L improvement on-site is not adequate for high-rise apartment building. Unless policy can be changed, the carbon offset price should correct this.
Please note that the results are noticeably different from the Terrace house and Mid-rise apartment building.
Impact of PVs
PVs are not necessary to achieve the minimum 35% improvement on-site. Unless the carbon offset price is higher than the cost of installing PVs, their inclusion in the design will not be incentivised. This should be considered, even if the PV potential for high-rise apartment building is less important than for low and mid-rise housing.
Impact of carbon factor
If the analysis is done using an estimate for the future carbon factor for electricity (i.e. 71 gCO2/kWh) instead of SAP 10 (i.e. 233 gCO2/kWh), the conclusions above change significantly: a significant improvement over Part L (>80%) becomes achievable.
* Under the ‘be lean’ requirement of the new London Plan, residential buildings should achieve a minimum 10% improvement over Part L from energy efficiency alone (i.e. building fabric and ventilation).
Table 29 - High-rise apartment building - Improvement over Part L assuming 233 gCO2/kWh (SAP 10.0) for grid-supplied electricity
Table 31 - High-rise apartment building - Impact of changing the electricity carbon factor
Table 30 - High-rise apartment building - Impact of PVs
High-rise apartment building | Performance against Part L
Electricity carbon factor set at 233 gCO2/kWh
(SAP 10.0)
Electricity carbon factor set at 71 gCO2/kWh
(Estimate 2020-2050)
PVs covering 50% of the roof
A 25-storey apartment building has been considered as a case study.
Its floor area is 14,600 sqm GIA.
Must not be incentivised(gas heating)
Should not be incentivised
(draft London Plan requirement)
BE�LEAN�Ͳ�All�Typologies
≥10%
High-rise apartment
Business as usual
5%
Good practice
15%
Ultra-low energy
26%
Fabr
ic &
Ven
tilat
ion
Be Lean Reduction in CO2 -
SAP 10.0(reg)
Gas boiler
Direct electric
Heat pump
Better heat pump
Business as usual
8% 25% 54% 69%
Good practice
18% 35% 60% 72%
Ultra-low energy
29% 47% 67% 75%
Gas boiler
Direct electric
Heat pump
Better heat pump
Business as usual
12% 75% 84% 90%
Good practice
22% 78% 86% 90%
Ultra-low energy
33% 82% 89% 92%
Fabr
ic &
Ven
tilat
ion
With PV
Fabr
ic &
Ven
tilat
ion
With PVReduction in CO2 - Future
(reg)
Reduction in CO2 - SAP 10.0
(reg)
Gas boiler
Direct electric
Heat pump
Better heat pump
Business as usual
5% 22% 51% 66%
Good practice
15% 32% 57% 68%
Ultra-low energy
26% 44% 64% 72%
Gas boiler
Direct electric
Heat pump
Better heat pump
Business as usual
11% 73% 83% 89%
Good practice
21% 77% 85% 89%
Ultra-low energy
32% 81% 88% 91%
Fabr
ic &
Ven
tilat
ion
Fabr
ic &
Ven
tilat
ion
No PV
No PVReduction in CO2 - SAP 10.0
(reg)
Reduction in CO2 - Future
(reg)
Gas boiler
Direct electric
Heat pump
Better heat pump
Business as usual
8% 25% 54% 69%
Good practice
18% 35% 60% 72%
Ultra-low energy
29% 47% 67% 75%
Gas boiler
Direct electric
Heat pump
Better heat pump
Business as usual
12% 75% 84% 90%
Good practice
22% 78% 86% 90%
Ultra-low energy
33% 82% 89% 92%
Fabr
ic &
Ven
tilat
ion
With PV
Fabr
ic &
Ven
tilat
ion
With PVReduction in CO2 - Future
(reg)
Reduction in CO2 - SAP 10.0
(reg)
Section 3
< 0% < 35% < 60% 60-80% > 80%

3020190258 | Cost of Carbon | May 20 | Rev M
HIGH�RISE
-4%
-2%
0%
2%
4%
6%
0% 10% 20% 30% 40% 50% 60% 70% 80% 90% 100% 110%
% U
plift
in c
ost/
m2
cons
truc
tion
% Reduction in CO2 - SAP 10
Uplift in cost vs reduction in carbon
-4%
-2%
0%
2%
4%
6%
0% 10% 20% 30% 40% 50% 60% 70% 80% 90% 100% 110%
% U
plift
in c
ost/
m2
cons
truc
tion
% Reduction in CO2 - SAP 10.0
Uplift in cost vs reduction in carbon
Gas boiler
Direct electric
Heat pump
Better heat pump
Business as usual
0.0% -1.9% 1.2% 2.6%
Good practice
1.2% -0.7% 2.4% 3.8%
Ultra-low energy
2.0% 0.1% 3.2% 4.6%
Gas boiler
Direct electric
Heat pump
Better heat pump
Business as usual
0.0% -2.0% 1.1% 4.5%
Good practice
2.2% 0.5% 2.7% 4.6%
Ultra-low energy
3.6% 2.1% 3.6% 4.3%
High-rise apartment (~ £3,100/m2 baseline construction cost)
School (~ £3,000/m2 baseline construction cost)
% uplift in cost per m2 of construction
With PV
Fabr
ic &
Ven
tilat
ion
% uplift in cost per m2 of construction
With PV
Fabr
ic &
Ven
tilat
ion
Gas boiler
Direct electric
Heat pump
Better heat pump
Business as usual
8% 25% 54% 69%
Good practice
18% 35% 60% 72%
Ultra-low energy
29% 47% 67% 75%
Gas boiler
Direct electric
Heat pump
Better heat pump
Business as usual
12% 75% 84% 90%
Good practice
22% 78% 86% 90%
Ultra-low energy
33% 82% 89% 92%
Fabr
ic &
Ven
tilat
ion
With PV
Fabr
ic &
Ven
tilat
ion
With PVReduction in CO2 - Future
(reg)
Reduction in CO2 - SAP 10.0
(reg)
Construction costs
The baseline in terms of construction costs is the ‘Business as usual + Gas boiler + PVs’ scenario. This scenario is not compliant with the London Plan requirement of a minimum 35% carbon reduction over Part L.
The additional construction costs of the four lowest carbon options compared to this baseline are comprised between 2.4% and 4.6%.
This excludes any carbon offsetting cost.
It is important to note that this comparison is based on exactly the same design and does not include the cost reductions and efficiencies which can be achieved on a low energy design process (e.g. form factor).
Development costs
The impact would be only between 1.0% and 1.9% if the whole development costs were considered.
Additional construction cost vs Part L CO2 reduction
The graph on the right hand side highlights the relationship between uplift in cost and reduction in carbon emissions.
Notes on costs:
The uplift costs associated with each specification option were estimated based on Currie & Brown’s cost datasets for energy efficiency and low carbon technologies which incorporate information from market prices obtained, specific market testing and first principles cost planning by their specialist quantity surveyors. The costs are based on Q3 2019 prices and reflect a London / South East cost base. Costs were developed for each affected element to identify the variance in price between the baseline and the enhanced specifications.
Those elements that are not materially affected by the energy efficiency / low carbon technology options, eg substructure, roof coverings, kitchen and bathrooms, etc, were not costed in detail. Instead these costs were incorporated within the ‘balance of construction’ cost was estimated by reference to a typical whole building construction cost per m2 for the building type in question. This whole building cost was then adjusted for each option based on the variance in the elements costed in detail to determine the overall percentage impact on construction costs.
The potential impact on total development cost was estimated on the basis of the construction cost representing c.40% of the total development costs with the balance being comprised of land cost, finance and project fees and other planning requirements.
High-rise apartment building | Capital cost
Table 33 - High-rise apartment building - Additional construction costs (£/m2) compared with the ‘Business as usual + Gas boiler scenario + PVs’ baseline scenario - Analysis by Currie & Brown
Table 32 - High-rise apartment building - Improvement over Part L assuming 233 gCO2/kWh (SAP 10) for grid-supplied electricity (Same table as previous page)
Figure 49 - High-rise apartment building - Additional construction costs vs Part L reduction
The four lowest carbon options are outlined
Gas boiler
Direct electric
Heat pump
Better heat pump
Business as usual
Good practice
Ultra-low energy
More expensive
Better Part L performance
Section 3
< 0% < 35% < 60% 60-80% > 80%

3120190258 | Cost of Carbon | May 20 | Rev M
HIGH�RISE
Business as usual 1A 262 1B 130 1C 97 1D 103
Good practice 2A 259 2B 124 2C 109 2D 137
Ultra-low energy 3A 235 3B 104 3C 127 3D 159
Gas boiler
Direct electric
Heat pump
Better heat pump
Fabr
ic &
V
entil
atio
n
£/m2
1A
1B
1C 1D
2A
2B2C
2D
3A
3B3C
3D
0% 10% 20% 30% 40% 50% 60% 70% 80% 90% 100% 110%
-100
-50
0
50
100
150
200
250
300
% Reduction in CO2 - SAP 10.0
Add
ition
al c
onst
ruct
ion
+ c
arbo
n of
fset
cos
t -£/
m2
Our recommendation: tiered price at £1,000, £300 and £100/tonne
1A
1B
1C
1D2A
2B
2C
2D
3A
3B
3C
3D
0% 10% 20% 30% 40% 50% 60% 70% 80% 90% 100% 110%
-100
-50
0
50
100
150
200
250
300
% Reduction in CO2 - SAP 10.0
Add
ition
al c
onst
ruct
ion
+ c
arbo
n of
fset
cos
t -£/
m2
Current approach: flat price at £60/tonne
Business as usual 40 -26 57 94
Good practice 73 7 91 130
Ultra-low energy 94 27 115 155
Business as usual 121 40 97 120
Good practice 146 64 127 155
Ultra-low energy 156 74 144 176
Business as usual 403 271 238 215
Good practice 400 265 250 243
Ultra-low energy 376 238 245 252
Business as usual 403 271 238 120
Good practice 400 265 127 155
Ultra-low energy 376 238 144 176
Fabr
ic &
V
entil
atio
n
Better heat pump
Fabr
ic &
V
entil
atio
n
Stepped price £1,000, 300, 100/t - £/m2
Gas boiler
Direct electric
Heat pump
Better heat pump
Heat pump
Fabr
ic &
V
entil
atio
n
Flat price £1,000/t £/m2
Gas boiler
Direct electric
Better heat pump
Fabr
ic &
V
entil
atio
n
Flat price £300/t £/m2
Gas boiler
Direct electric
Heat pump
Better heat pump
Flat price £100/t £/m2
Gas boiler
Direct electric
Heat pump
HIGH�RISE
Business as usual 1A 262 1B 130 1C 97 1D 103
Good practice 2A 259 2B 124 2C 109 2D 137
Ultra-low energy 3A 235 3B 104 3C 127 3D 159
Gas boiler
Direct electric
Heat pump
Better heat pump
Fabr
ic &
V
entil
atio
n
£/m2
1A
1B
1C 1D
2A
2B2C
2D
3A
3B3C
3D
0% 10% 20% 30% 40% 50% 60% 70% 80% 90% 100% 110%
-100
-50
0
50
100
150
200
250
300
% Reduction in CO2 - SAP 10.0
Add
ition
al c
onst
ruct
ion
+ c
arbo
n of
fset
cos
t -£/
m2
Our recommendation: tiered price at £1,000, £300 and £100/tonne
1A
1B
1C
1D2A
2B
2C
2D
3A
3B
3C
3D
0% 10% 20% 30% 40% 50% 60% 70% 80% 90% 100% 110%
-100
-50
0
50
100
150
200
250
300
% Reduction in CO2 - SAP 10.0
Add
ition
al c
onst
ruct
ion
+ c
arbo
n of
fset
cos
t -£/
m2
Current approach: flat price at £60/tonne
High-rise apartment building | Carbon offsetting scenarios
Flat carbon price (High-rise apartment building) Impact on additional cost + carbon offsetting cost
Stepped carbon price
Current approach with a flat carbon price at £60/t
The baseline scenario (‘Business as usual + Gas boiler + PVs’) would be required to make a carbon offsetting contribution equivalent to approximately £24/m2.
Our recommendation: a tiered carbon price
We recommend a tiered carbon price as follows:
• £1,000/tCO2 for residual emissions worse than a 60% improvement over Part L as our analysis demonstrates that it is possible to achieve at least a 60% reduction with low carbon heat (e.g. heat pump system) and reasonable levels of fabric and ventilation performance. The high price would encourage applicants to consider this approach as ’the new business as usual’.
• £300/tCO2 for residual emissions comprised between a 60 and 80% improvement over Part L to incentivise more savings from fabric and ventilation performance and/or more PVs: it would be cheaper to install more PVs than to pay into the offset fund.
• £100/tCO2 for residual emissions better than a 80 improvement over Part L to signal that achieving an 80% improvement over Part L is a good achievement. To signal this even more strongly, the carbon price could even be reduced further.
As it can be seen on the adjacent graphs, changing the carbon price from the current £60/tCO2 to our recommended tiered approach would turn the cheapest and lowest performing specifications into the most expensive ones (or make their cost at least comparable to the low carbon alternatives). It would therefore successfully incentivise applicants to consider and implement lower carbon strategies.
Additional costs and impact on viability
The most economic low carbon scenario are 2C (Good practice + Heat pump + PVs) at £109/m2 and 1D (Business as usual + Better heat pump + PVs) at £103/m2. This represents a total additional cost (construction + offsetting) of £79-85/m2 compared to the baseline.
Other approaches to the carbon offsetting price
• Flat carbon price: the flat carbon price approach has a significant disadvantage: it requires a high price to be effective but then adds a significant carbon offsetting cost to the best performing specifications.
• Stepped carbon price: the stepped approach has the desired effect but creates some potential ‘’threshold’ effects: a development’s carbon offsetting contribution would triple if its residual emissions were to increase by a small margin, but above a threshold.
Table 34 – High-rise – What would be the effect of the recommended tiered carbon price approach?
More expensive Better Part L performance
More expensive
Better Part L performance
Alternative approaches to carbon pricing (Not recommended)
Section 3
< 0% < 35% < 60% 60-80% > 80%

3220190258 | Cost of Carbon | May 20 | Rev M
Performance against ‘be lean’ requirement*
None of the Fabric & Ventilation specifications comply with the minimum ‘be lean’ requirement for non-domestic buildings assuming the SAP 10.0 carbon factors. It is therefore unlikely to be complied with. The carbon offset price could be used to incentivise energy efficiency.
What can technically be achieved with energy efficient fabric and services, and low carbon heat?
Focusing on the combinations that the planning system should incentivise, significant improvements over Part L can be achieved on-site with the SAP 10.0 carbon factors (>45%). The carbon offset price should incentivise this.
Impact of PVs
PVs are not necessary to achieve the minimum 35% improvement on-site. Unless the carbon offset price is higher than the cost of installing PVs, their inclusion in the design will not be incentivised. This should be considered, even if the PV potential for high-rise apartment building is less important than for low and mid-rise housing.
Impact of carbon factor
If the analysis is done using an estimate for the future carbon factor for electricity (i.e. 71 gCO2/kWh) instead of SAP 10.0 (i.e. 233 gCO2/kWh), the conclusions above change very significantly: a significant improvement over Part L (>80%) becomes achievable.
* Under the ‘be lean’ requirement of the new London Plan, hotels should achieve a minimum 15% improvement over Part L from energy efficiency alone (i.e. building fabric and ventilation).
Table 35 - Hotel - Improvement over Part L assuming 233 gCO2/kWh (SAP 10.0) for grid-supplied electricity
Table 37 - Hotel - Impact of changing the electricity carbon factor
Table 36 - Hotel - Impact of PVs
Hotel | Performance against Part L
Electricity carbon factor set at 233 gCO2/kWh
(SAP 10.0)
Electricity carbon factor set at 71 gCO2/kWh
(Estimate 2020-2050)
PVs covering 50% of the roof
Must not be incentivised(gas heating)
Should not be incentivised
A 9-storey hotel has been considered as a case study.
Its floor area is 3,600 sqm GIA.
(draft London Plan requirement)
BE�LEAN�Ͳ�All�Typologies
≥15%
Hotel
Business as usual
-4%
Good practice
1%
Ultra-low energy
5%
Fabr
ic &
Ven
tilat
ion
Be Lean Reduction in CO2 -
SAP 10.0(reg)
Gas boiler
VRFHeat
pump Better
heat pump
Business as usual
2% 56% 45% 56%
Good practice
7% 58% 48% 58%
Ultra-low energy
11% 61% 51% 61%
Gas boiler
VRFHeat
pump Better
heat pump
Business as usual
3% 84% 80% 84%
Good practice
6% 85% 81% 85%
Ultra-low energy
10% 86% 82% 86%
With PV
Fabr
ic &
Ven
tilat
ion
With PV
Fabr
ic &
Ven
tilat
ion
Reduction in CO2 - SAP 10.0
(reg)
Reduction in CO2 - Future
(reg)
Gas boiler
VRFHeat
pump Better
heat pump
Business as usual
0% 53% 43% 53%
Good practice
4% 56% 46% 56%
Ultra-low energy
9% 58% 48% 58%
Gas boiler
VRFHeat
pump Better
heat pump
Business as usual
2% 83% 79% 83%
Good practice
5% 84% 80% 84%
Ultra-low energy
9% 85% 81% 85%
No PV
No PV
Fabr
ic &
Ven
tilat
ion
Fabr
ic &
Ven
tilat
ion
Reduction in CO2 - SAP 10.0
(reg)
Reduction in CO2 - Future
(reg)
Gas boiler
VRFHeat
pump Better
heat pump
Business as usual
2% 56% 45% 56%
Good practice
7% 58% 48% 58%
Ultra-low energy
11% 61% 51% 61%
Gas boiler
VRFHeat
pump Better
heat pump
Business as usual
3% 84% 80% 84%
Good practice
6% 85% 81% 85%
Ultra-low energy
10% 86% 82% 86%
With PV
Fabr
ic &
Ven
tilat
ion
With PV
Fabr
ic &
Ven
tilat
ion
Reduction in CO2 - SAP 10.0
(reg)
Reduction in CO2 - Future
(reg)
Section 3
< 0% < 35% < 50% ³ 50%

3320190258 | Cost of Carbon | May 20 | Rev M
HOTEL
-4%
-2%
0%
2%
4%
6%
0% 10% 20% 30% 40% 50% 60% 70% 80% 90% 100% 110%
% U
plift
in c
ost/
m2
cons
truc
tion
% Reduction in CO2 - SAP 10
Uplift in cost vs reduction in carbon
-4%
-2%
0%
2%
4%
6%
0% 10% 20% 30% 40% 50% 60% 70% 80% 90% 100% 110%
% U
plift
in c
ost/
m2
cons
truc
tion
% Reduction in CO2 - SAP 10.0
Uplift in cost vs reduction in carbon
Gas boiler
VRFHeat
pump Better
heat pump
Business as usual
0.0% -3.1% 1.1% 6.5%
Good practice
2.3% -0.1% 3.0% 6.9%
Ultra-low energy
3.2% 1.3% 3.7% 6.7%
Gas boiler
VRFHeat
pump Better
heat pump
Business as usual
0.0% -2.0% 0.6% 3.8%
Good practice
2.8% 1.2% 3.2% 5.6%
Ultra-low energy
4.2% 2.9% 4.4% 6.1%
Fabr
ic &
Ven
tilat
ion
Hotel (~ £3,800/m2 baseline construction cost)
Ofiice (~ £3,600/m2 baseline construction cost)
% uplift in cost per m2 of construction
With PV
Fabr
ic &
Ven
tilat
ion
% uplift in cost per m2 of construction
With PV
Gas boiler
VRFHeat
pump Better
heat pump
Business as usual
2% 56% 45% 56%
Good practice
7% 58% 48% 58%
Ultra-low energy
11% 61% 51% 61%
Gas boiler
VRFHeat
pump Better
heat pump
Business as usual
3% 84% 80% 84%
Good practice
6% 85% 81% 85%
Ultra-low energy
10% 86% 82% 86%
With PV
Fabr
ic &
Ven
tilat
ion
With PV
Fabr
ic &
Ven
tilat
ion
Reduction in CO2 - SAP 10.0
(reg)
Reduction in CO2 - Future
(reg)
Construction costs
The baseline in terms of construction costs is the ‘Business as usual + Gas boiler + PVs’ scenario. This scenario is not compliant with the London Plan requirement of a minimum 35% carbon reduction over Part L.
The additional construction costs of the four lowest carbon options compared to this baseline are comprised between 3.0% and 6.7%.
This excludes any carbon offsetting cost.
It is important to note that this comparison is based on exactly the same design and does not include the cost reductions and efficiencies which can be achieved on a low energy design process (e.g. form factor).
Development costs
The impact would be only between 1.2% and 2.7% if the whole development costs were considered.
Additional construction cost vs Part L CO2 reduction
The graph on the right hand side highlights the relationship between uplift in cost and reduction in carbon emissions.
Notes on costs:
The uplift costs associated with each specification option were estimated based on Currie & Brown’s cost datasets for energy efficiency and low carbon technologies which incorporate information from market prices obtained, specific market testing and first principles cost planning by their specialist quantity surveyors. The costs are based on Q3 2019 prices and reflect a London / South East cost base. Costs were developed for each affected element to identify the variance in price between the baseline and the enhanced specifications.
Those elements that are not materially affected by the energy efficiency / low carbon technology options, eg substructure, roof coverings, kitchen and bathrooms, etc, were not costed in detail. Instead these costs were incorporated within the ‘balance of construction’ cost was estimated by reference to a typical whole building construction cost per m2 for the building type in question. This whole building cost was then adjusted for each option based on the variance in the elements costed in detail to determine the overall percentage impact on construction costs.
The potential impact on total development cost was estimated on the basis of the construction cost representing c.40% of the total development costs with the balance being comprised of land cost, finance and project fees and other planning requirements.
Hotel | Capital cost
Table 39 - Hotel - Additional construction costs (£/m2) compared with the ‘Business as usual + Gas boiler scenario + PVs’ baseline scenario - Analysis by Currie & Brown
Table 38 - Hotel - Improvement over Part L assuming 233 gCO2/kWh (SAP 10.0) for grid-supplied electricity (Same table as previous page)
Figure 50 - Hotel - Additional construction costs vs Part L reduction
The four lowest carbon options are outlined
Gas boiler
VRF
Heat pump
Better heat pump
Business as usual
Good practice
Ultra-low energy
More expensive
Better Part L performance
Section 3
< 0% < 35% < 50% ³ 50%

3420190258 | Cost of Carbon | May 20 | Rev M
HOTEL
Business as usual 1A 815 1B 55 1C 296 1D 422
Good practice 2A 845 2B 159 2C 329 2D 427
Ultra-low energy 3A 823 3B 206 3C 331 3D 408
Gas boiler
Direct electric
Heat pump
Better heat pump
Fabr
ic &
V
entil
atio
n
£/m2
1A
1B
1C
1D
2A
2B
2C
2D
3A
3B
3C3D
0% 10% 20% 30% 40% 50% 60% 70% 80% 90% 100% 110%-100
0
100
200
300
400
500
600
700
800
% Reduction in CO2 - SAP 10.0
Add
ition
al c
onst
ruct
ion
+ c
arbo
n of
fset
cos
t -£/
m2
Our recommendation: tiered price at £1,000 and £300/tonne
1A
1B
1C
1D
2A
2B
2C
2D
3A
3B
3C
3D
0% 10% 20% 30% 40% 50% 60% 70% 80% 90% 100% 110%
-100
-50
0
50
100
150
200
250
300
% Reduction in CO2 - SAP 10.0
Add
ition
al c
onst
ruct
ion
+ c
arbo
n of
fset
cos
t -£/
m2
Current approach: flat price at £60/tonne
Business as usual 128 -61 113 306
Good practice 211 50 182 318
Ultra-low energy 239 102 203 305
Business as usual 383 55 256 422
Good practice 455 159 317 427
Ultra-low energy 471 206 331 408
Business as usual 1277 462 758 827
Good practice 1307 543 791 809
Ultra-low energy 1285 567 779 770
Business as usual 1277 55 758 422
Good practice 1307 159 791 427
Ultra-low energy 1285 206 331 408
Fabr
ic &
V
entil
atio
n
Better heat pump
Fabr
ic &
V
entil
atio
n
Stepped price £1,000, 300/t - £/m2
Gas boiler
Direct electric
Heat pump
Better heat pump
Heat pump
Fabr
ic &
V
entil
atio
n
Flat price £1,000/t £/m2
Gas boiler
Direct electric
Better heat pump
Fabr
ic &
V
entil
atio
n
Flat price £300/t £/m2
Gas boiler
Direct electric
Heat pump
Better heat pump
Flat price £100/t £/m2
Gas boiler
Direct electric
Heat pump
HOTEL
Business as usual 1A 815 1B 55 1C 296 1D 422
Good practice 2A 845 2B 159 2C 329 2D 427
Ultra-low energy 3A 823 3B 206 3C 331 3D 408
Gas boiler
Direct electric
Heat pump
Better heat pump
Fabr
ic &
V
entil
atio
n
£/m2
1A
1B
1C
1D
2A
2B
2C
2D
3A
3B
3C3D
0% 10% 20% 30% 40% 50% 60% 70% 80% 90% 100% 110%-100
0
100
200
300
400
500
600
700
800
% Reduction in CO2 - SAP 10.0
Add
ition
al c
onst
ruct
ion
+ c
arbo
n of
fset
cos
t -£/
m2
Our recommendation: tiered price at £1,000 and £300/tonne
1A
1B
1C
1D
2A
2B
2C
2D
3A
3B
3C
3D
0% 10% 20% 30% 40% 50% 60% 70% 80% 90% 100% 110%
-100
-50
0
50
100
150
200
250
300
% Reduction in CO2 - SAP 10.0
Add
ition
al c
onst
ruct
ion
+ c
arbo
n of
fset
cos
t -£/
m2
Current approach: flat price at £60/tonne
Hotel | Carbon offsetting scenarios
Flat carbon price (Mid-rise apartment building) Impact on additional cost + carbon offsetting cost
Stepped carbon price
Current approach with a flat carbon price at £60/t
The baseline scenario (‘Business as usual + Gas boiler + PVs’) would be required to make a carbon offsetting contribution equivalent to approximately £77/m2.
Our recommendation: a tiered carbon price
We recommend a tiered carbon price as follows:
• £1,000/tCO2 for residual emissions worse than a 50% improvement over Part L as our analysis demonstrates that it is possible to achieve at least a 50% reduction with low carbon heat (e.g. heat pump system) and reasonable levels of fabric and ventilation performance. The high price would encourage applicants to consider this approach as ’the new business as usual’.
• £300/tCO2 for residual emissions equal or better than a 50% improvement over Part L to incentivise more savings from fabric and ventilation performance and/or more PVs: it would be cheaper to install more PVs than to pay into the offset fund.
Contrary to the domestic buildings, there is no clear reason to ‘signal’ an exemplar level of residual regulated emissions (e.g. 80%) as the evidence does not suggest one. This is largely due to the fact that Part L2A modelling significantly underestimates the differences between scenarios.
As it can be seen on the adjacent graphs, changing the carbon price from the current £60/tCO2 to our recommended tiered approach would turn the cheapest and lowest performing specifications into the most expensive ones. It would therefore successfully incentivise applicants to consider and implement lower carbon strategies.
Additional costs and impact on viability
The most economic low carbon scenario is 1B (Business as usual + VRF + PVs) at £55/m2. This represents a saving of £22/m2 in terms of total additional cost (construction + offsetting) compared to the baseline.
Other approaches to the carbon offsetting price
• Flat carbon price: the flat carbon price approach has a significant disadvantage: it requires a high price to be effective but then adds a significant carbon offsetting cost to the best performing specifications.
• Stepped carbon price: the stepped approach does not have the desired effect due to the small difference in Part L performance between the scenarios.
Table 40 - Hotel – What would be the effect of the recommended tiered carbon price approach?
More expensive Better Part L performance
More expensive Better Part L performance
VRF
VRF
VRF
VRF
VRF
Alternative approaches to carbon pricing (Not recommended)
Section 3
< 0% < 35% < 50% ³ 50%

3520190258 | Cost of Carbon | May 20 | Rev M
Performance against ‘be lean’ requirement
None of the Fabric & Ventilation specifications comply with the minimum ‘be lean’ requirement for non-domestic buildings assuming the SAP 10.0 carbon factors. It is therefore unlikely to be complied with. The carbon offset price could be used to incentivise energy efficiency.
The table above also shows one of the issues with Part L2A modelling: as it underestimates space heating demand it also underestimates the benefit of Mechanical Ventilation with Heat Recovery (Good Practice and Ultra-low energy).
What can technically be achieved with energy efficient fabric and services, and low carbon heat?
Focusing on the combinations that the planning system should incentivise, significant improvements over Part L can be achieved on-site with the SAP 10.0 carbon factors (>45%). The carbon offset price should incentivise this.
Impact of PVs
PVs appear to be necessary for the school to comply with the minimum 35% improvement on-site. Ensuring that the carbon offset price is higher than the additional cost of adding more PVs would incentivise greater savings on-site. This should be considered, especially PVs would help reduce schools’ energy bills.
Impact of carbon factor
If the analysis is done using an estimate for the future carbon factor for electricity (i.e. 71 gCO2/kWh) instead of SAP 10.0 (i.e. 233 gCO2/kWh), the conclusions above change significantly: a significant improvement over Part L (>75%) becomes achievable.
* Under the ‘be lean’ requirement of the new London Plan, schools should achieve a minimum 15% improvement over Part L from energy efficiency alone (i.e. building fabric and ventilation).
Table 41 - School - Improvement over Part L assuming 233 gCO2/kWh (SAP 10.0) for grid-supplied electricity
Table 43 - School - Impact of changing the electricity carbon factor
Table 42 - School - Impact of PVs
School | Performance against Part L
Electricity carbon factor set at 233 gCO2/kWh
(SAP 10.0)
Electricity carbon factor set at 71 gCO2/kWh
(Estimate 2020-2050)
PVs covering 50% of the roof
Must not be incentivised(gas heating)
Should not be incentivised
A 3/4 storey school has been considered as a case study.
Its floor area is 6,000 sqm GIA.
(draft London Plan requirement)
The results get worse as Part L penalises ‘good practice’ MVHR against extract only ventilation
BE�LEAN�Ͳ�All�Typologies
≥15%
School
Business as usual
7%
Good practice
0%
Ultra-low energy
8%
Fabr
ic &
Ven
tila
tion
Be Lean Reduction in CO2 -
SAP 10.0(reg)
Gas boiler
Direct electric
Heat pump
Better heat pump
Business as usual
46% 50% 58% 62%
Good practice
43% 46% 47% 47%
Ultra-low energy
51% 53% 53% 54%
Gas boiler
Direct electric
Heat pump
Better heat pump
Business as usual
21% 79% 82% 84%
Good practice
21% 74% 75% 75%
Ultra-low energy
27% 78% 78% 78%
Fabr
ic &
Ven
tilat
ion
With PV
Fabr
ic &
Ven
tilat
ion
Reduction in CO2 - SAP 10.0
(reg)
Reduction in CO2 - Future
(reg)
With PV
Gas boiler
Direct electric
Heat pump
Better heat pump
Business as usual
12% 15% 23% 28%
Good practice
4% 6% 8% 8%
Ultra-low energy
11% 14% 14% 14%
Gas boiler
Direct electric
Heat pump
Better heat pump
Business as usual
7% 64% 68% 70%
Good practice
2% 56% 56% 57%
Ultra-low energy
8% 59% 59% 59%
Fabr
ic &
Ven
tila
tion
Fabr
ic &
Ven
tila
tion
Reduction in CO2 - SAP 10.0
(reg)
Reduction in CO2 - Future
(reg)
No PV
No PV
Gas boiler
Direct electric
Heat pump
Better heat pump
Business as usual
46% 50% 58% 62%
Good practice
43% 46% 47% 47%
Ultra-low energy
51% 53% 53% 54%
Gas boiler
Direct electric
Heat pump
Better heat pump
Business as usual
21% 79% 82% 84%
Good practice
21% 74% 75% 75%
Ultra-low energy
27% 78% 78% 78%
Fabr
ic &
Ven
tilat
ion
With PV
Fabr
ic &
Ven
tilat
ion
Reduction in CO2 - SAP 10.0
(reg)
Reduction in CO2 - Future
(reg)
With PV
Gas boiler
Direct electric
Heat pump
Better heat pump
Business as usual
46% 50% 58% 62%
Good practice
43% 46% 47% 47%
Ultra-low energy
51% 53% 53% 54%
Gas boiler
Direct electric
Heat pump
Better heat pump
Business as usual
21% 79% 82% 84%
Good practice
21% 74% 75% 75%
Ultra-low energy
27% 78% 78% 78%
Fabr
ic &
Ven
tilat
ion
With PV
Fabr
ic &
Ven
tilat
ion
Reduction in CO2 - SAP 10.0
(reg)
Reduction in CO2 - Future
(reg)
With PV
Section 3
< 0% < 35% < 50% ³ 50%

3620190258 | Cost of Carbon | May 20 | Rev M
SCHOOL
-4%
-2%
0%
2%
4%
6%
0% 10% 20% 30% 40% 50% 60% 70% 80% 90% 100% 110%
% U
plift
in c
ost/
m2
cons
truc
tion
% Reduction in CO2 - SAP 10
Uplift in cost vs reduction in carbon
-4%
-2%
0%
2%
4%
6%
0% 10% 20% 30% 40% 50% 60% 70% 80% 90% 100% 110%
% U
plift
in c
ost/
m2
cons
truc
tion
% Reduction in CO2 - SAP 10.0
Uplift in cost vs reduction in carbon
Gas boiler
Direct electric
Heat pump
Better heat pump
Business as usual
46% 50% 58% 62%
Good practice
43% 46% 47% 47%
Ultra-low energy
51% 53% 53% 54%
Gas boiler
Direct electric
Heat pump
Better heat pump
Business as usual
21% 79% 82% 84%
Good practice
21% 74% 75% 75%
Ultra-low energy
27% 78% 78% 78%
Fabr
ic &
Ven
tilat
ion
With PV
Fabr
ic &
Ven
tilat
ion
Reduction in CO2 - SAP 10.0
(reg)
Reduction in CO2 - Future
(reg)
With PV
Gas boiler
Direct electric
Heat pump
Better heat pump
Business as usual
0.0% -1.9% 1.2% 2.6%
Good practice
1.2% -0.7% 2.4% 3.8%
Ultra-low energy
2.0% 0.1% 3.2% 4.6%
Gas boiler
Direct electric
Heat pump
Better heat pump
Business as usual
0.0% -2.0% 1.1% 4.5%
Good practice
2.2% 0.5% 2.7% 4.6%
Ultra-low energy
3.6% 2.1% 3.6% 4.3%
High-rise apartment (~ £3,100/m2 baseline construction cost)
School (~ £3,000/m2 baseline construction cost)
% uplift in cost per m2 of construction
With PV
Fabr
ic &
Ven
tilat
ion
% uplift in cost per m2 of construction
With PV
Fabr
ic &
Ven
tilat
ion
Construction costs
The baseline in terms of construction costs is the ‘Business as usual + Gas boiler + PVs’ scenario. This scenario is compliant with the London Plan requirement of a minimum 35% carbon reduction over Part L.
The additional construction costs of the four lowest carbon options compared to this baseline are comprised between 2.7% and 4.3%.
This excludes any carbon offsetting cost.
It is important to note that this comparison is based on exactly the same design and does not include the cost reductions and efficiencies which can be achieved on a low energy design process (e.g. form factor).
Development costs
The impact would be only between 1.1% and 1.7% if the whole development costs were considered.
Additional construction cost vs Part L CO2 reduction
The graph on the right hand side highlights the relationship between uplift in cost and reduction in carbon emissions.
Notes on costs:
The uplift costs associated with each specification option were estimated based on Currie & Brown’s cost datasets for energy efficiency and low carbon technologies which incorporate information from market prices obtained, specific market testing and first principles cost planning by their specialist quantity surveyors. The costs are based on Q3 2019 prices and reflect a London / South East cost base. Costs were developed for each affected element to identify the variance in price between the baseline and the enhanced specifications.
Those elements that are not materially affected by the energy efficiency / low carbon technology options, eg substructure, roof coverings, kitchen and bathrooms, etc, were not costed in detail. Instead these costs were incorporated within the ‘balance of construction’ cost was estimated by reference to a typical whole building construction cost per m2 for the building type in question. This whole building cost was then adjusted for each option based on the variance in the elements costed in detail to determine the overall percentage impact on construction costs.
The potential impact on total development cost was estimated on the basis of the construction cost representing c.40% of the total development costs with the balance being comprised of land cost, finance and project fees and other planning requirements.
School | Capital cost
Table 45 - School - Additional construction costs (£/m2) compared with the ‘Business as usual + Gas boiler scenario + PVs’ baseline scenario - Analysis by Currie & Brown
Table 44 - School - Improvement over Part L assuming 233 gCO2/kWh (SAP 10.0) for grid-supplied electricity (Same table as previous page)
Figure 51 - School - Additional construction costs vs Part L reduction
The four lowest carbon options are outlined
Gas boiler
Direct electric
Heat pump
Better heat pump
Business as usual
Good practice
Ultra-low energy
More expensive
Better Part L performance
Section 3
< 0% < 35% < 50% ³ 50%

3720190258 | Cost of Carbon | May 20 | Rev M
SCHOOL
Business as usual 1A 64 1B -6 1C 72 1D 169
Good practice 2A 120 2B 62 2C 126 2D 181
Ultra-low energy 3A 147 3B 101 3C 146 3D 166
Gas boiler
Direct electric
Heat pump
Better heat pump
Fabr
ic &
V
entil
atio
n
£/m2
1A
1B
1C
1D
2A
2B
2C
2D3A
3B
3C3D
0% 10% 20% 30% 40% 50% 60% 70% 80% 90% 100% 110%
-100
-50
0
50
100
150
200
250
300
% Reduction in CO2 - SAP 10.0
Add
ition
al c
onst
ruct
ion
+ c
arbo
n of
fset
cos
t -£/
m2
Our recommendation: tiered price at £1,000 and £300/tonne
1A
1B
1C
1D
2A
2B
2C
2D
3A
3B
3C3D
0% 10% 20% 30% 40% 50% 60% 70% 80% 90% 100% 110%
-100
-50
0
50
100
150
200
250
300
% Reduction in CO2 - SAP 10.0
Add
ition
al c
onst
ruct
ion
+ c
arbo
n of
fset
cos
t -£/
m2
Current approach: flat price at £60/tonne
Business as usual 16 -44 47 146
Good practice 82 30 97 151
Ultra-low energy 121 76 121 141
Business as usual 49 -14 72 169
Good practice 112 59 125 179
Ultra-low energy 147 101 146 166
Business as usual 162 93 162 249
Good practice 219 161 225 278
Ultra-low energy 239 188 233 253
Business as usual 162 93 72 169
Good practice 219 161 225 179
Ultra-low energy 147 101 146 166
Fabr
ic &
V
entil
atio
n
Better heat pump
Fabr
ic &
V
entil
atio
n
Stepped price £1,000, 300/t - £/m2
Gas boiler
Direct electric
Heat pump
Better heat pump
Heat pump
Fabr
ic &
V
entil
atio
n
Flat price £1,000/t £/m2
Gas boiler
Direct electric
Better heat pump
Fabr
ic &
V
entil
atio
n
Flat price £300/t £/m2
Gas boiler
Direct electric
Heat pump
Better heat pump
Flat price £100/t £/m2
Gas boiler
Direct electric
Heat pump
SCHOOL
Business as usual 1A 64 1B -6 1C 72 1D 169
Good practice 2A 120 2B 62 2C 126 2D 181
Ultra-low energy 3A 147 3B 101 3C 146 3D 166
Gas boiler
Direct electric
Heat pump
Better heat pump
Fabr
ic &
V
entil
atio
n
£/m2
1A
1B
1C
1D
2A
2B
2C
2D3A
3B
3C3D
0% 10% 20% 30% 40% 50% 60% 70% 80% 90% 100% 110%
-100
-50
0
50
100
150
200
250
300
% Reduction in CO2 - SAP 10.0
Add
ition
al c
onst
ruct
ion
+ c
arbo
n of
fset
cos
t -£/
m2
Our recommendation: tiered price at £1,000 and £300/tonne
1A
1B
1C
1D
2A
2B
2C
2D
3A
3B
3C3D
0% 10% 20% 30% 40% 50% 60% 70% 80% 90% 100% 110%
-100
-50
0
50
100
150
200
250
300
% Reduction in CO2 - SAP 10.0
Add
ition
al c
onst
ruct
ion
+ c
arbo
n of
fset
cos
t -£/
m2
Current approach: flat price at £60/tonne
School | Carbon offsetting scenarios
Flat carbon price (Mid-rise apartment building) Impact on additional cost + carbon offsetting cost
Stepped carbon price
Current approach with a flat carbon price at £60/t
The baseline scenario (‘Business as usual + Gas boiler + PVs’) would be required to make a carbon offsetting contribution equivalent to approximately £10/m2.
Our recommendation: a tiered carbon price
We recommend a tiered carbon price as follows:
• £1,000/tCO2 for residual emissions worse than a 50% improvement over Part L as our analysis demonstrates that it is possible to achieve at least a 50% reduction with low carbon heat (e.g. heat pump system) and reasonable levels of fabric and ventilation performance. The high price would encourage applicants to consider this approach as ’the new business as usual’.
• £300/tCO2 for residual emissions equal or better than a 50% improvement over Part L to incentivise more savings from fabric and ventilation performance and/or more PVs: it would be cheaper to install more PVs than to pay into the offset fund.
Contrary to the domestic buildings, there is no clear reason to ‘signal’ an exemplar level of residual regulated emissions (e.g. 80%) as the evidence does not suggest one. This is largely due to the fact that Part L2A modelling significantly underestimates the differences between scenarios.
As it can be seen on the adjacent graphs, changing the carbon price from the current £60/tCO2 to our recommended tiered approach would help to incentivise applicants to consider and implement lower carbon strategies. However, it also shows that due to the issue associated with Part L2A modelling, it does not help significantly.
Additional costs and impact on viability
The most economic low carbon scenario is 1C (Business as usual + Heat pump + PVs) at £72/m2. This represents a total additional cost (construction + offsetting) of £62/m2 compared to the baseline.
Other approaches to the carbon offsetting price
• Flat carbon price: the flat carbon price approach has a significant disadvantage: it requires a high price to be effective but then adds a significant carbon offsetting cost to the best performing specifications.
• Stepped carbon price: the stepped approach does not have the desired effect due to the small difference in Part L performance between the scenarios.
More expensive Better Part L performance
More expensive Better Part L performance
Alternative approaches to carbon pricing (Not recommended)
Table 47 - School – What would be the effect of the recommended tiered carbon price approach?
Section 3
< 0% < 35% < 50% ³ 50%
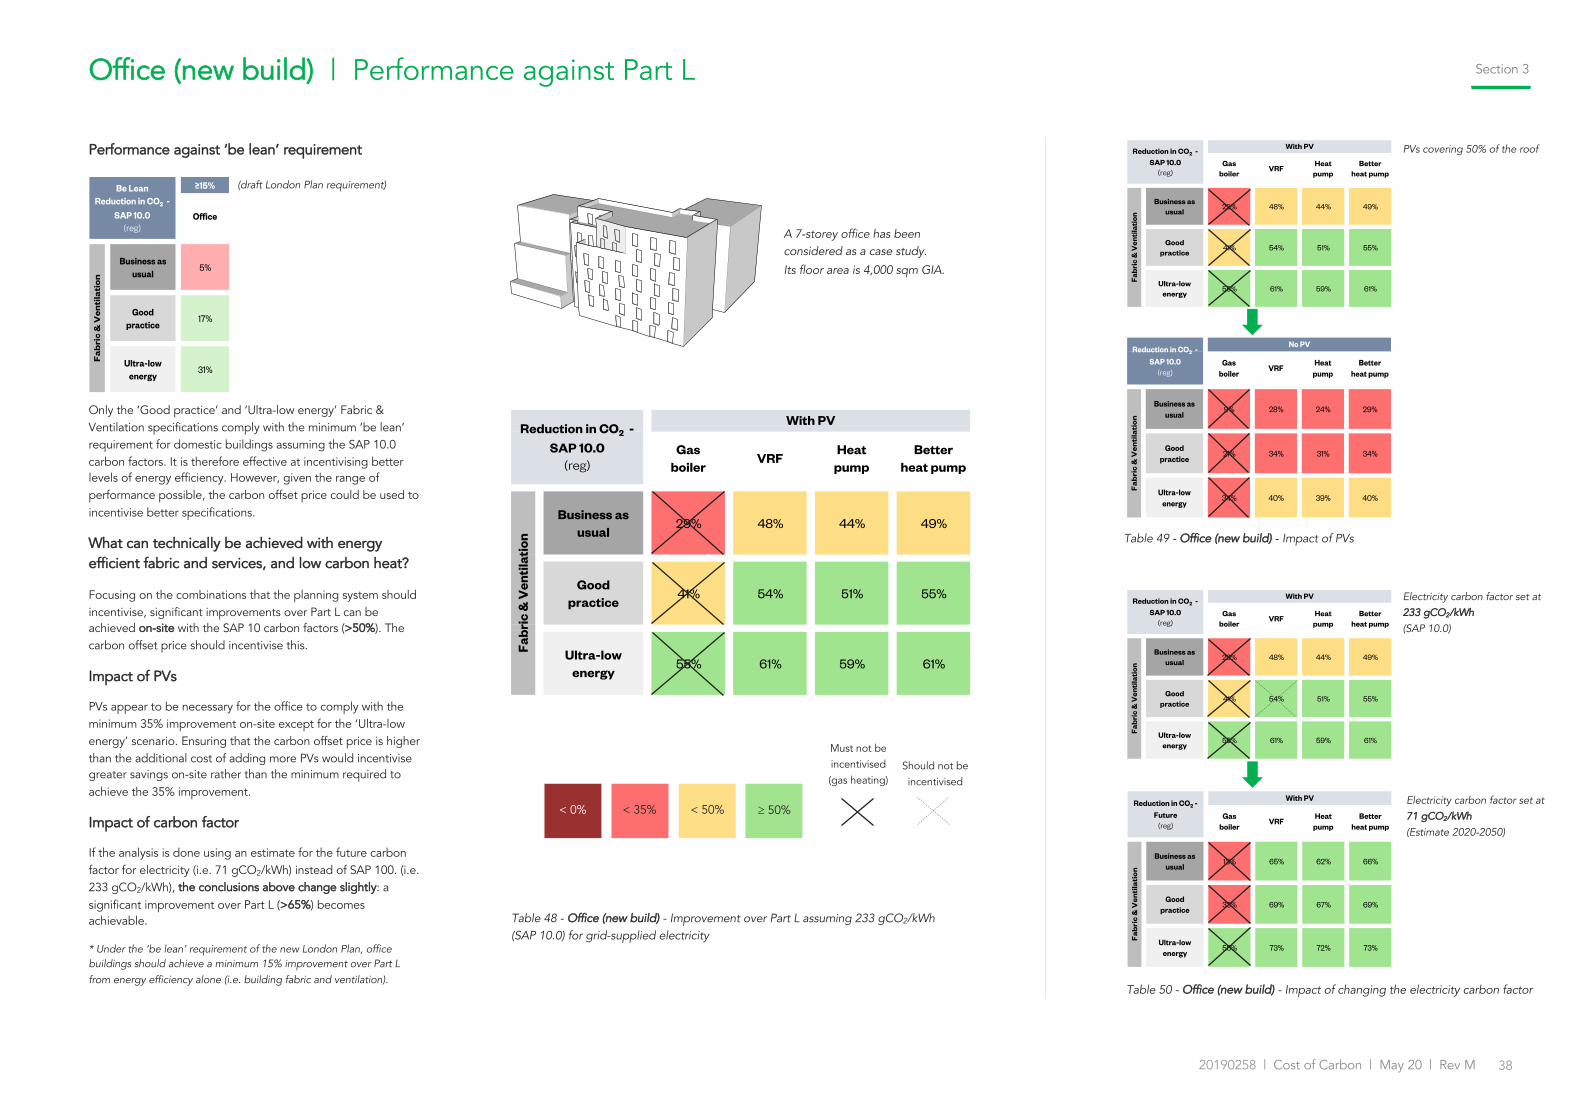
3820190258 | Cost of Carbon | May 20 | Rev M
Performance against ‘be lean’ requirement
Only the ‘Good practice’ and ‘Ultra-low energy’ Fabric & Ventilation specifications comply with the minimum ‘be lean’ requirement for domestic buildings assuming the SAP 10.0 carbon factors. It is therefore effective at incentivising better levels of energy efficiency. However, given the range of performance possible, the carbon offset price could be used to incentivise better specifications.
What can technically be achieved with energy efficient fabric and services, and low carbon heat?
Focusing on the combinations that the planning system should incentivise, significant improvements over Part L can be achieved on-site with the SAP 10 carbon factors (>50%). The carbon offset price should incentivise this.
Impact of PVs
PVs appear to be necessary for the office to comply with the minimum 35% improvement on-site except for the ‘Ultra-low energy’ scenario. Ensuring that the carbon offset price is higher than the additional cost of adding more PVs would incentivise greater savings on-site rather than the minimum required to achieve the 35% improvement.
Impact of carbon factor
If the analysis is done using an estimate for the future carbon factor for electricity (i.e. 71 gCO2/kWh) instead of SAP 100. (i.e. 233 gCO2/kWh), the conclusions above change slightly: a significant improvement over Part L (>65%) becomes achievable.
* Under the ‘be lean’ requirement of the new London Plan, office buildings should achieve a minimum 15% improvement over Part L from energy efficiency alone (i.e. building fabric and ventilation).
Table 48 - Office (new build) - Improvement over Part L assuming 233 gCO2/kWh (SAP 10.0) for grid-supplied electricity
Table 50 - Office (new build) - Impact of changing the electricity carbon factor
Table 49 - Office (new build) - Impact of PVs
Office (new build) | Performance against Part L
Electricity carbon factor set at 233 gCO2/kWh
(SAP 10.0)
Electricity carbon factor set at 71 gCO2/kWh
(Estimate 2020-2050)
PVs covering 50% of the roof
Must not be incentivised(gas heating)
Should not be incentivised
A 7-storey office has been considered as a case study.
Its floor area is 4,000 sqm GIA.
(draft London Plan requirement)
BE�LEAN�Ͳ�All�Typologies
≥15%
Office
Business as usual
5%
Good practice
17%
Ultra-low energy
31%
Fabr
ic &
Ven
tila
tion
Be Lean Reduction in CO2 -
SAP 10.0(reg)
Gas boiler
VRFHeat
pump Better
heat pump
Business as usual
29% 48% 44% 49%
Good practice
41% 54% 51% 55%
Ultra-low energy
55% 61% 59% 61%
Gas boiler
VRFHeat
pump Better
heat pump
Business as usual
13% 65% 62% 66%
Good practice
33% 69% 67% 69%
Ultra-low energy
56% 73% 72% 73%
Reduction in CO2 - SAP 10.0
(reg)
Reduction in CO2 - Future
(reg)
With PV
Fabr
ic &
Ven
tilat
ion
With PV
Fabr
ic &
Ven
tilat
ion
Gas boiler
VRFHeat
pump Better
heat pump
Business as usual
9% 28% 24% 29%
Good practice
21% 34% 31% 34%
Ultra-low energy
34% 40% 39% 40%
Gas boiler
VRFHeat
pump Better
heat pump
Business as usual
-1% 51% 48% 52%
Good practice
19% 55% 53% 55%
Ultra-low energy
43% 59% 59% 60%
No PV
No PV
Reduction in CO2 - Future
(reg)
Reduction in CO2 - SAP 10.0
(reg)
Fabr
ic &
Ven
tila
tion
Fabr
ic &
Ven
tila
tion
Gas boiler
VRFHeat
pump Better
heat pump
Business as usual
29% 48% 44% 49%
Good practice
41% 54% 51% 55%
Ultra-low energy
55% 61% 59% 61%
Gas boiler
VRFHeat
pump Better
heat pump
Business as usual
13% 65% 62% 66%
Good practice
33% 69% 67% 69%
Ultra-low energy
56% 73% 72% 73%
Reduction in CO2 - SAP 10.0
(reg)
Reduction in CO2 - Future
(reg)
With PV
Fabr
ic &
Ven
tilat
ion
With PV
Fabr
ic &
Ven
tilat
ion
Gas boiler
VRFHeat
pump Better
heat pump
Business as usual
29% 48% 44% 49%
Good practice
41% 54% 51% 55%
Ultra-low energy
55% 61% 59% 61%
Gas boiler
VRFHeat
pump Better
heat pump
Business as usual
13% 65% 62% 66%
Good practice
33% 69% 67% 69%
Ultra-low energy
56% 73% 72% 73%
Reduction in CO2 - SAP 10.0
(reg)
Reduction in CO2 - Future
(reg)
With PV
Fabr
ic &
Ven
tila
tion
With PV
Fabr
ic &
Ven
tila
tion
Section 3
< 0% < 35% < 50% ³ 50%

3920190258 | Cost of Carbon | May 20 | Rev M
OFFICE
-4%
-2%
0%
2%
4%
6%
0% 10% 20% 30% 40% 50% 60% 70% 80% 90% 100% 110%
% U
plift
in c
ost/
m2
cons
truc
tion
% Reduction in CO2 - SAP 10
Uplift in cost vs reduction in carbon
-4%
-2%
0%
2%
4%
6%
0% 10% 20% 30% 40% 50% 60% 70% 80% 90% 100% 110%
% U
plift
in c
ost/
m2
cons
truc
tion
% Reduction in CO2 - SAP 10.0
Uplift in cost vs reduction in carbon
Gas boiler
VRFHeat
pump Better
heat pump
Business as usual
29% 48% 44% 49%
Good practice
41% 54% 51% 55%
Ultra-low energy
55% 61% 59% 61%
Gas boiler
VRFHeat
pump Better
heat pump
Business as usual
13% 65% 62% 66%
Good practice
33% 69% 67% 69%
Ultra-low energy
56% 73% 72% 73%
Reduction in CO2 - SAP 10.0
(reg)
Reduction in CO2 - Future
(reg)
With PV
Fabr
ic &
Ven
tilat
ion
With PV
Fabr
ic &
Ven
tilat
ion Gas
boilerVRF
Heat pump
Better heat pump
Business as usual
0.0% -3.1% 1.1% 6.5%
Good practice
2.3% -0.1% 3.0% 6.9%
Ultra-low energy
3.2% 1.3% 3.7% 6.7%
Gas boiler
VRFHeat
pump Better
heat pump
Business as usual
0.0% -2.0% 0.6% 3.8%
Good practice
2.8% 1.2% 3.2% 5.6%
Ultra-low energy
4.2% 2.9% 4.4% 6.1%
Fabr
ic &
Ven
tilat
ion
Hotel (~ £3,800/m2 baseline construction cost)
Ofiice (~ £3,600/m2 baseline construction cost)
% uplift in cost per m2 of construction
With PV
Fabr
ic &
Ven
tilat
ion
% uplift in cost per m2 of construction
With PV
Construction costs
The baseline in terms of construction costs is the ‘Business as usual + Gas boiler + PVs’ scenario. This scenario is almost compliant with the London Plan requirement of a minimum 35% carbon reduction over Part L (i.e. 29%).
The additional construction costs of the four lowest carbon options compared to a this baseline are comprised between 3.2% and 6.1%.
This excludes any carbon offsetting cost.
It is important to note that this comparison is based on exactly the same design and does not include the cost reductions and efficiencies which can be achieved on a low energy design process (e.g. form factor).
Development costs
The impact would be only between 0.8% and 2.1% if the whole development costs were considered.
Additional construction cost vs Part L CO2 reduction
The graph on the right hand side highlights the relationship between uplift in cost and reduction in carbon emissions.
Notes on costs:
The uplift costs associated with each specification option were estimated based on Currie & Brown’s cost datasets for energy efficiency and low carbon technologies which incorporate information from market prices obtained, specific market testing and first principles cost planning by theirspecialist quantity surveyors. The costs are based on Q3 2019 prices and reflect a London / South East cost base. Costs were developed for each affected element to identify the variance in price between the baseline and the enhanced specifications.
Those elements that are not materially affected by the energy efficiency / low carbon technology options, eg substructure, roof coverings, kitchen and bathrooms, etc, were not costed in detail. Instead these costs were incorporated within the ‘balance of construction’ cost was estimated by reference to a typical whole building construction cost per m2 for the building type in question. This whole building cost was then adjusted for each option based on the variance in the elements costed in detail to determine the overall percentage impact on construction costs.
The potential impact on total development cost was estimated on the basis of the construction cost representing c.40% of the total development costs with the balance being comprised of land cost, finance and project fees and other planning requirements.
Office (new build) | Capital cost
Table 52 - Office (new build) - Additional construction costs (£/m2) compared with the ‘Business as usual + Gas boiler scenario + PVs’ baseline scenario - Analysis by Currie & Brown
Table 51 - Office (new build) - Improvement over Part L assuming 233 gCO2/kWh (SAP 10) for grid-supplied electricity (Same table as previous page)
Figure 52- Office (new build) - Additional construction costs vs Part L reduction
The four lowest carbon options are outlined
Gas boiler
VRF
Heat pump
Better heat pump
Business as usual
Good practice
Ultra-low energy
More expensive
Better Part L performance
Section 3
< 0% < 35% < 50% ³ 50%

4020190258 | Cost of Carbon | May 20 | Rev M
OFFICE
Business as usual 1A 100 1B -26 1C 82 1D 183
Good practice 2A 170 2B 83 2C 157 2D 238
Ultra-low energy 3A 188 3B 138 3C 192 3D 252
Gas boiler
Direct electric
Heat pump
Better heat pump
Fabr
ic &
V
entil
atio
n
£/m2
1A
1B
1C
1D
2A
2B
2C
2D
3A
3B
3C
3D
0% 10% 20% 30% 40% 50% 60% 70% 80% 90% 100% 110%
-100
-50
0
50
100
150
200
250
300
% Reduction in CO2 - SAP 10.0
Add
ition
al c
onst
ruct
ion
+ c
arbo
n of
fset
cos
t -£/
m2
Our recommendation: tiered price at £1,000 and £300/tonne
1A
1B
1C
1D
2A
2B
2C
2D3A
3B
3C
3D
0% 10% 20% 30% 40% 50% 60% 70% 80% 90% 100% 110%
-100
-50
0
50
100
150
200
250
300
% Reduction in CO2 - SAP 10.0
Add
ition
al c
onst
ruct
ion
+ c
arbo
n of
fset
cos
t -£/
m2
Current approach: flat price at £60/tonne
Business as usual 20 -58 39 153
Good practice 119 57 129 213
Ultra-low energy 163 116 169 229
Business as usual 60 -29 70 181
Good practice 152 83 157 238
Ultra-low energy 188 138 192 252
Business as usual 199 73 181 281
Good practice 268 174 254 328
Ultra-low energy 278 216 272 329
Business as usual 199 73 181 281
Good practice 268 83 157 238
Ultra-low energy 188 138 192 252
Fabr
ic &
V
entil
atio
n
Better heat pump
Fabr
ic &
V
entil
atio
n
Stepped price £1,000, 300/t - £/m2
Gas boiler
Direct electric
Heat pump
Better heat pump
Fabr
ic &
V
entil
atio
n
Flat price £1,000/t £/m2
Gas boiler
Direct electric
Heat pump
Better heat pump
Fabr
ic &
V
entil
atio
n
Flat price £300/t £/m2
Gas boiler
Direct electric
Heat pump
Better heat pump
Flat price £100/t £/m2
Gas boiler
Direct electric
Heat pump
OFFICE
Business as usual 1A 100 1B -26 1C 82 1D 183
Good practice 2A 170 2B 83 2C 157 2D 238
Ultra-low energy 3A 188 3B 138 3C 192 3D 252
Gas boiler
Direct electric
Heat pump
Better heat pump
Fabr
ic &
V
entil
atio
n
£/m2
1A
1B
1C
1D
2A
2B
2C
2D
3A
3B
3C
3D
0% 10% 20% 30% 40% 50% 60% 70% 80% 90% 100% 110%
-100
-50
0
50
100
150
200
250
300
% Reduction in CO2 - SAP 10.0
Add
ition
al c
onst
ruct
ion
+ c
arbo
n of
fset
cos
t -£/
m2
Our recommendation: tiered price at £1,000 and £300/tonne
1A
1B
1C
1D
2A
2B
2C
2D3A
3B
3C
3D
0% 10% 20% 30% 40% 50% 60% 70% 80% 90% 100% 110%
-100
-50
0
50
100
150
200
250
300
% Reduction in CO2 - SAP 10.0
Add
ition
al c
onst
ruct
ion
+ c
arbo
n of
fset
cos
t -£/
m2
Current approach: flat price at £60/tonne
Office (new build) | Carbon offsetting scenarios
Flat carbon price (Mid-rise apartment building) Impact on additional cost + carbon offsetting cost
Stepped carbon price
Current approach with a flat carbon price at £60/t
The baseline scenario (‘Business as usual + Gas boiler + PVs’) would be required to make a carbon offsetting contribution equivalent to approximately £12/m2.
Our recommendation: a tiered carbon price
We recommend a tiered carbon price as follows:
• £1,000/tCO2 for residual emissions worse than a 50% improvement over Part L as our analysis demonstrates that it is possible to achieve at least a 50% reduction with low carbon heat (e.g. heat pump system) and reasonable levels of fabric and ventilation performance. The high price would encourage applicants to consider this approach as ’the new business as usual’.
• £300/tCO2 for residual emissions equal or better than a 50% improvement over Part L to incentivise more savings from fabric and ventilation performance and/or more PVs: it would be cheaper to install more PVs than to pay into the offset fund.
Contrary to the domestic buildings, there is no clear reason to ‘signal’ an exemplar level of residual regulated emissions (e.g. 80%) as the evidence does not suggest one. This is largely due to the fact that Part L2A modelling significantly underestimates the differences between scenarios.
As it can be seen on the adjacent graphs, changing the carbon price from the current £60/tCO2 to our recommended tiered approach would help to incentivise applicants to consider and implement lower carbon strategies. However, it also shows that due to the issue associated with Part L2A modelling, it does not help significantly.
Additional costs and impact on viability
The most economic low carbon scenario is 2B (Good practice + VRF + PVs) at £83/m2. This represent a total additional cost (construction + offsetting) of £71/m2 compared to the baseline.
Other approaches to the carbon offsetting price
• Flat carbon price: the flat carbon price approach has a significant disadvantage: it requires a high price to be effective but then adds a significant carbon offsetting cost to the best performing specifications.
• Stepped carbon price: the stepped approach does not have the desired effect due to the small difference in Part L performance between the scenarios.
More expensive Better Part L performance
More expensive Better Part L performance
VRF
VRF
VRF
VRF
VRF
Alternative approaches to carbon pricing (Not recommended)
Table 54 - Office (new build) – What would be the effect of the recommended tiered carbon price approach?
Section 3
< 0% < 35% < 50% ³ 50%

4120190258 | Cost of Carbon | May 20 | Rev M
Performance against ‘be lean’ requirement
There is no ‘be lean’ requirement for refurbishment. If there was one, a minimum 30% improvement on existing could be required. In any case, the carbon offset price could be used to incentivise better specifications.
What can technically be achieved with energy efficient fabric and services, and low carbon heat?
Focusing on the combinations that the planning system should incentivise, significant improvements over the existing Part L emissions can be achieved on-site with the SAP 10 carbon factors (>80%). This demonstrates that the 35% Part L improvement on-site (over existing regulated emission) is not adequate for major refurbishments of office buildings. Unless policy can be changed, the carbon offset price should correct this.
Impact of PVs
PVs are not necessary to achieve the minimum 35% improvement on-site. Unless the carbon offset price is higher than the cost of installing PVs, their inclusion in the design will not be incentivised. This should be considered.
Impact of carbon factor
If the analysis is done using an estimate for the future carbon factor for electricity (i.e. 71 gCO2/kWh) instead of SAP 10 (i.e. 233 gCO2/kWh), the conclusions above remain the same.
Cost assessment
A cost assessment has not been undertaken for the office refurbishment ‘typology’ as refurbishment costs are very dependent on the scope of the refurbishment itself and specific to the building being refurbished and its condition.
Table 55 - Office (refurbishment) - Improvement over Part L assuming 233 gCO2/kWh (SAP 10.0) for grid-supplied electricity
Table 57 - Office (refurbishment) - Impact of changing the electricity carbon factor
Table 56 - Office (refurbishment) - Impact of PVs
Office (refurbishment) | Performance against Part L
Electricity carbon factor set at 233 gCO2/kWh
(SAP 10.0)
Electricity carbon factor set at 71 gCO2/kWh
(Estimate 2020-2050)
PVs covering 50% of the roof
Must not be incentivised(gas heating)
Should not be incentivised
A 7-storey office has been considered as a case study.
Its floor area is 4,000 sqm GIA.
(no London Plan requirement)
BE�LEAN�Ͳ�All�Typologies
Office refurb
Office refurb - existing
Business as usual
46% 30%
Good practice
74% n/a
Ultra-low energy
83% n/a
Fabr
ic &
Ven
tila
tion
Be Lean Reduction in CO2 -
SAP 10.0(reg)
Existing system
Gas boiler
VRFHeat
pump Better
heat pump
Business as usual
30% 53% 81% 74% 82%
Good practice
n/a 80% 87% 85% 87%
Ultra-low energy
n/a 89% 90% 90% 90%
Existing system
Gas boiler
VRFHeat
pump Better
heat pump
Business as usual
22% 41% 91% 88% 92%
Good practice
n/a 82% 94% 93% 94%
Ultra-low energy
n/a 93% 96% 95% 96%
Fab
ric
& V
enti
lati
onF
abri
c &
Ven
tila
tion
Reduction in CO2 - SAP 10.0
(reg)
Reduction in CO2 - Future
(reg)
With PV
With PV
Existing system
Gas boiler
VRFHeat
pump Better
heat pump
Business as usual
30% 53% 81% 74% 82%
Good practice
n/a 80% 87% 85% 87%
Ultra-low energy
n/a 89% 90% 90% 90%
Existing system
Gas boiler
VRFHeat
pump Better
heat pump
Business as usual
22% 41% 91% 88% 92%
Good practice
n/a 82% 94% 93% 94%
Ultra-low energy
n/a 93% 96% 95% 96%
Fabr
ic &
Ven
tilat
ion
Fabr
ic &
Ven
tilat
ion
Reduction in CO2 - SAP 10.0
(reg)
Reduction in CO2 - Future
(reg)
With PV
With PV
Existing system
Gas boiler
VRFHeat
pump Better
heat pump
Business as usual
25% 48% 76% 69% 78%
Good practice
n/a 75% 82% 80% 82%
Ultra-low energy
n/a 84% 85% 85% 85%
Existing system
Gas boiler
VRFHeat
pump Better
heat pump
Business as usual
20% 38% 89% 86% 90%
Good practice
n/a 80% 92% 91% 92%
Ultra-low energy
n/a 91% 93% 93% 93%
No PV
No PV
Fabr
ic &
Ven
tilat
ion
Fabr
ic &
Ven
tilat
ion
Reduction in CO2 - Future
(reg)
Reduction in CO2 - SAP 10.0
(reg)
Existing system
Gas boiler
VRFHeat
pump Better
heat pump
Business as usual
30% 53% 81% 74% 82%
Good practice
n/a 80% 87% 85% 87%
Ultra-low energy
n/a 89% 90% 90% 90%
Existing system
Gas boiler
VRFHeat
pump Better
heat pump
Business as usual
22% 41% 91% 88% 92%
Good practice
n/a 82% 94% 93% 94%
Ultra-low energy
n/a 93% 96% 95% 96%
Fabr
ic &
Ven
tilat
ion
Fabr
ic &
Ven
tilat
ion
Reduction in CO2 - SAP 10.0
(reg)
Reduction in CO2 - Future
(reg)
With PV
With PV
Existing system
Gas boiler
VRFHeat
pump Better
heat pump
Business as usual
30% 53% 81% 74% 82%
Good practice
n/a 80% 87% 85% 87%
Ultra-low energy
n/a 89% 90% 90% 90%
Existing system
Gas boiler
VRFHeat
pump Better
heat pump
Business as usual
22% 41% 91% 88% 92%
Good practice
n/a 82% 94% 93% 94%
Ultra-low energy
n/a 93% 96% 95% 96%
Fabr
ic &
Ven
tilat
ion
Fabr
ic &
Ven
tilat
ion
Reduction in CO2 - SAP 10.0
(reg)
Reduction in CO2 - Future
(reg)
With PV
With PV
Section 3
< 0% < 35% < 50% ³ 50%

4220190258 | Cost of Carbon | May 20 | Rev M
Is the carbon offset price sufficient to actually save carbon off-site?
Figure 53 - The London Carbon Offset Price report (© AECOM for the GLA) Figure 54 - Extract of the RE:NEW evaluation report
The AECOM London Carbon Offset price report
In 2017 the GLA commissioned AECOM to undertake the London Carbon Offset Price study. Key results are summarised in the adjacent table for a selection of measures. They indicate that the cost of carbon savings range from £25/tCO2 to £800/tCO2. However, AECOM state in the report that “given the wide variability in the costs and carbon savings for potential carbon offsetting projects, it would be difficult to calculate robust costs per tonne of carbon.”
We agree with that conclusion and consider that the most useful cost data in the tables are probably the whole house refurbishment data. These point to a carbon cost in the range of £185-£285/tCO2. As these costs actually date back from 2012, they would actually be approximately 20% higher if expressed in 2019 terms (i.e. £222-£342).
The true costs would also need to include administration and management of the programme. Initial anecdotal cost feedback from Energiesprong suggests a more significant cost.
Data received from London Boroughs
The Smart Homes programme was delivered for private households across six London boroughs. At a total value of £7,875,000, it delivered carbon savings at a rate of approximately £185/tCO2.
A polybead insulation installation for 270 flats on a hard-to-treat medium-rise estate was delivered at approximately £170/tCO2.
RE-FIT works to three Council buildings in one of the boroughs delivered carbon savings at a rate of £1,085/tCO2.
Feedback from London Boroughs
In his dissertation ‘The Implementation of London’s Zero Carbon Target and carbon pricing mechanisms’, Jon Buick of UCL provides the following commentary on carbon prices, based on interviews with 8 London Boroughs.
“The view amongst boroughs interviewed is that the £60/tCO2
price is neither an accurate reflection of the cost of onsite mitigation nor the cost of offsetting. […].
RE-FIT and RE-NEW
The figure in the top right is an extract from a 2011 RE:NEW evaluation report.
Conclusion
This evidence suggests that it would cost at least £300 t/CO2
to a local authority to save carbon in a sustainable way. Therefore, the current carbon offset price of £60-£95tCO2 is an underestimate and should be increased.
Tables 58 and 59 - Tables extracted from the London Carbon Offset Price (© AECOM for the GLA)
Section 3

4320190258 | Cost of Carbon | May 20 | Rev M
The issue with the current carbon price
The current carbon offset price (£60-£95/tCO2) and the London Plan requirement of a minimum 35% carbon reduction* on-site do not incentivise sufficient savings on site. This means that new buildings have substantially higher on-site carbon emissions that they should if they were to achieve the net zero carbon policy requirement on-site.
Significant improvements over Part L (using SAP 10.0 carbon factors) can be achieved now with efficient fabric, ventilation as well as low carbon heat.
In addition, our analysis suggests that the current carbon offset price is not sufficient for local authorities to deliver the required carbon savings off-site. In order to address the mismatch between the current carbon offset price and the actual cost to deliver carbon offset projects offsite, a carbon price of at least £300/tCO2 is recommended to enable them to deliver these carbon savings.
A new carbon price: our recommendations
We have undertaken extensive energy modelling on several typologies of domestic and non-domestic buildings. Our calculations demonstrate that the significant reduction in the carbon factor for electricity used in the calculations means that, for the same specifications, a greater improvement over Part L is achieved with no extra effort. On this basis, and given the consensus on the need and benefit of a ‘fabric first’ approach and low carbon heat, our recommendations are:
• To incentivise on-site savings by adopting a high first tier price of £1,000/tCO2 for those easily avoidable and unnecessary residual emissions not met on-site, which fall short of a 60% improvement threshold (measured over Part L1A) for domestic and a 50% improvement threshold (measured over Part L2A) for non-domestic developments.
• Once this level of performance is achieved we recommend the introduction of a medium carbon price second tier of £300/tCO2 to continue to incentive PVs**.
• Finally, and only for residential applications for which it is easier to achieve this high level of performance, we recommend a low carbon price third tier of £100/tCO2 as a positive signal. A third tier is not appropriate for non-domestic buildings due to the limitations of the Part L2A modelling methodology.
* The carbon reduction is calculated by comparing the proposed building carbon emissions to those of an equivalent ‘notional’ building using standard assumptions.
** Our analysis suggests that with 233 gCO2/kWh (SAP 10.0) the savings from the use of PVs are equivalent to a carbon cost ratio of around £190/tCO2).
0-60%
Resi
dual
regu
late
d em
issi
ons
and
perc
enta
ge im
prov
emen
t ove
r Par
t L
Residual regulated emissions are offset at a rate of £1,000/tCO2 over 30 years
60-80%Residual regulated emissions are offset at a rate of £300/tCO2 over 30 years
80-100% Residual regulated emissions are offset at a rate of £100/tCO2 over 30 years*
Figure 55 - Recommended tiered carbon prices for domestic buildings
The total carbon offset contribution will then be the sum of the above calculations(e.g. a residential application achieving a 58% improvement over Part L1A 2013 would offset 2% at £1,000/tCO2 + 20% at £300/tCO2 + £20% at £100/tCO2))
0-50%Residual regulated emissions are offset at a rate of £1,000/tCO2 over 30 years
50-100%Residual regulated emissions are offset at a rate of £300/tCO2 over 30 years
Figure 56 - Recommended tiered carbon prices for non-domestic buildings
The total carbon offset contribution will then be the sum of the above calculations(e.g. a non-domestic application achieving a 40% improvement over Part L1A 2013 would offset 10% at £1,000/tCO2 + 50% at £300/tCO2))
Resi
dual
regu
late
d em
issi
ons
and
perc
enta
ge im
prov
emen
t ove
r Par
t L
How can carbon pricing incentivise greater carbon reductions on-site? | Conclusion Section 3
< 0% < 35% < 60% 60-80% > 80%
< 0% < 35% < 50% ³ 50%
Example
Let us consider a mixed-use development including 10,000 sqm of residential space and 6,000 sqm of office space***.
The residential element has a good practice level of building fabric and ventilation, a ‘better’ heat pump system and a PV area covering approximately 60% of the roof. It achieves a 75% improvement over Part L using SAP 10.0 carbon factors. This is equivalent to an area-weighted Dwelling Emission Rating (DER) of approximately 4.1 kgCO2/m2/year compared with the building regulation compliant baseline at 16.4 kgCO2/m2/year.
The office element has a ‘business as usual’ level of building fabric and ventilation, a heat pump and no PVs. It achieves a 47% improvement over Part L using SAP 10.0 carbon factors. This is equivalent to an area-weighted Building Emission Rating (BER) of approximately 11.8 kgCO2/m2/year compared with the building regulation compliant baseline at 22.3 kgCO2/m2/year.
How to calculate the carbon offsetting contribution
The total residential carbon offsetting contribution would be: £73,800+£98,400 = £172,200
The total office carbon offsetting contribution would be: £117,000+£602,100 = £719,100
Therefore, using the recommended tiered carbon prices, the total carbon offsetting contribution required from this large mixed-use application would be £817,500.
Residential < 0% 0-35% 35-60% 60-80% ³ 80%
Development (residential)tCO2/yr (assuming 10,000 sqm)
0 0 0 8.2 32.8
Carbon offsetting rate(residential)
£1000/t £1000/t £1000/t £300/t £100/t
Carbon offsetting contribution(assuming 30 years) - residential
£0 £0 £0 £73,800 £98,400
Office < 0% 0-35% 35-50% 50-100%
Development (office)tCO2/yr (assuming 6,000 sqm)
0 0 3.9 66.9
Carbon offsetting rate(office)
£1000/t £1000/t £1000/t £300/t
Carbon offsetting contribution(assuming 30 years) - office
£0 £0 £117,000 £602,100

4420190258 | Cost of Carbon | May 20 | Rev M
Section 4Beyond Part L – we need to use predicted energy modelling to achieve Net Zero
• Accuracy of carbon savings estimate for domestic buildings
• Accuracy of carbon savings estimate for non-domestic buildings
• Is it a Net Zero Carbon building?
• Energy Use Intensity (EUI)

4520190258 | Cost of Carbon | May 20 | Rev M
0
1
2
3
4
Businessas usual -
SAP
Goodpractice -
SAP
Ultra-lowenergy -
SAP
Businessas usual -
PHPP
Goodpractice -
PHPP
Ultra-lowenergy -
PHPP
kgC
O2/
m2 y
r
Estimating carbon savings | Domestic | Is the Part L1 method (NCM) fit for purpose?
The terrace house and the mid-rise apartment building were modelled with both SAP and using a predicted energy use modelling tool (PHPP - Passivhaus Planning Package) and their results were compared. PHPP is recognised as an accurate tool at predicting energy use in low energy buildings. This page summarises our findings.
The issue with the Part L1 method
Percentage reduction. The requirement for a minimum 35% on-site improvement over Part L1 for domestic buildings in London is driving higher on-site reductions than Building Regulations. However, this ’relative’ approach is based on a comparison with a notional building. Aside from the confusion that it creates among project teams, the issue is that the notional building has the same form factor as the proposed design. The Part L1A method using percentage reduction does not reward efforts to improve the efficiency of the design itself.
Differences between Fabric and Ventilation scenarios. Part L1A (SAP) calculations were not intended to be used to predict the energy consumption breakdown of high performance buildings. In London, decisions on the implementation of energy efficiency measures, are often based on the Part L modelling. This is problematic, as the Part L model will not accurately show the effect of the fabric improvement on energy reductions. In general, Part L1A is likely to underestimate the effect of improving the fabric and ventilation specifications by approximately 30-40%.
Proposed solution
This cannot be rectified by changing the carbon offset price, as this is a relatively blunt instrument which uses Part L. The Part L estimated energy consumption is not just out by a certain factor, both the proportion and magnitude of lighting, ventilation, heating and hot water are often not correct.
In Europe and the US, predicted energy modelling is routinely undertaken to understand how the building will perform in use. This is helpful, as design teams can predict the energy savings from better fabric and ventilation specifications, and understand if it is cost effective to implement energy saving measures.
Terrace house - Cost per carbon tonne due to upgrading the fabric and ventilation from business as usual to ultra-low energy
Figure 58 - Comparison of carbon emissions associated with space heating for the Terrace house: Part L1A (SAP) vs predicted energy use modelling (PHPP)
x1.4reduction in heating carbon emissions due to ultra low energy fabric compared with Business as usual fabric
Capital cost uplift : £72/m2
SAP
Carbon savings : 1.5 kgCO2/m2
Cost per tonne CO2 saved : £1,600
PHPP
Carbon savings : 2.2 kgCO2/m2
Cost per tonne CO2 saved : £1,100
Figure 57 - Despite the reduction in heat loss areas and complexity, the percentage improvement over Part L does not vary much between the designs above. This shows that a relative metric is not as useful and clear as an absolute metric for energy efficiency (e.g. kWh/m2/yr)
Form factor (ratio between external envelope area and internal floor areas)
Improvement over Part L 2013 (assuming good practice specifications)
1.5
-35%
1.2
-35%
0.9
-37%
Section 4

4620190258 | Cost of Carbon | May 20 | Rev M
The School was modelled both with a Part L2A/SBEM tool (TAS) and a predicted energy use modelling tool (PHPP-Passivhaus Planning Package) and their results were compared. PHPP is recognised as an accurate tool at predicting energy use in low energy buildings. This page summarises our findings.
The issue with the Part L2 method
Percentage reduction. The difference in Part L improvement of changes to fabric and ventilation is very small, giving the impression that improving the specifications does not have a significant impact. This is a fundamental problem.
Differences between Fabric and Ventilation scenarios. Part L2A calculations were not intended to be used to predict the energy consumption breakdown of buildings, but they are. This is problematic, as the Part L2A energy calculations significantly underestimate the effect of improving the fabric and ventilation specifications.
Proposed solution
This cannot be rectified by changing the carbon offset price. We would recommend using predicted energy modelling to better estimate the impact of design and construction decisions.
Figure 59 - Improvement in CO2 emissions over Part L of the 3 fabric and ventilation cases for the three typologies (i.e. Hotel, School, Office)
Estimating carbon savings | Non-Domestic | Is the Part L2 method (NCM) fit for purpose?
0
1
2
3
4
5
Businessas usual -
SBEM
Goodpractice -
SBEM
Ultra-lowenergy -SBEM
Businessas usual -
PHPP
Goodpractice -
PHPP
Ultra-lowenergy -
PHPP
kgC
O2/
m2 y
r
School - Cost per carbon tonne due to upgrading the fabric and ventilation from business as usual to ultra-low energy
x4 reduction in
heating carbon emissions due to ultra low energy fabric compared with Business as usual fabric
Capital cost uplift : £75/m2
SAP
Carbon savings : 1 kgCO2/m2
Cost per tonne CO2 saved : £2,500
PHPP
Carbon savings : 4 kgCO2/m2
Cost per tonne CO2 saved : £600
0%
10%
20%
30%
40%
50%
60%
70%
80%
90%
100%
Redu
ctio
n in
CO
2em
issi
ons
over
Par
t L
Business as Usual
Good Practice
Ultra Low Energy
Hotel School Office
The adjacent figure shows that
1. The spread of Part L performance between ‘business as usual’ and ‘ultra-low energy’ is very narrow. The difference in ‘real life’ performance is much wider.
2. The spread of Part L performance between ‘business as usual’ and ‘ultra-low energy’ is also much more narrow (i.e. 5-15%) than for domestic buildings.
3. As the Part L system is based on a relative approach and an underestimation of the space heating demand, it leads to results which do not follow the logical hierarchy (e.g. school).
Figure 60 - Comparison of carbon emissions associated with space heating for the School: Part L2A (SBEM) vs predicted energy use modelling (PHPP)
Section 4

4720190258 | Cost of Carbon | May 20 | Rev M
Net Zero Carbon | Can this building qualify for Net Zero Carbon?
Figure 64 - Residual CO2 emissions of School with good practice fabric and Standard heat pump
Does a 100% improvement over Part L carbon mean Net Zero Carbon?
Many of the boroughs have declared a climate emergency that involves borough wide zero emissions. It is crucial that the new buildings being approved in the next decade meet the requirements of achieving Zero Carbon for the Borough, so that these new buildings do not add to the building stock that requires retrofit.
The current Zero Carbon policy requires 35% carbon emission reductions on site, with the residual emissions offset. If implemented correctly the policy with the correct price of carbon could push to 100% regulated carbon emission reductions. Is that equivalent to Net Zero Carbon?
Case study: Terrace house
The results of the modelling shows that the Terrace house achieves a 107% improvement over Part L with Ultra-low energy fabric and ventilation specifications, the standard heat pump system and 17m2 of PV. Under current policy this would achieve the GLA zero carbon definition on-site and without offsets.
However this only includes regulated carbon emissions (emissions from heating, hot water, lighting, pumps and fans). Once unregulated energy is included, the house would still actually emit approximately 6 kgCO2/m2/yr. Moreover many studies show that there is a significant performance gap between SAP and in use energy and carbon emissions.
Therefore, a 100% improvement over Part L is not equivalent to Net Zero Carbon.
Case study: School
For non residential buildings, SBEM massively underestimates energy consumption and in particular space heating even when including unregulated energy consumption. The results of the SBEM part L model are shown alongside results from PHPP and the new efficient schools benchmark for the good practice fabric and ventilation scenario with the standard heat pump system. Actual emissions are likely to be between 20 and 30 kgCO2/m2/yr, very far from Net Zero Carbon.
107% regulated carbon
emission reduction over Part L
Ultra low energy fabric and vent
Standard heat pump
17m2 of PV
Figure 62 - Residual CO2 emissions of the Terrace house with ultra low energy fabric and ventilation as well as a standard heat pump
42% regulated carbon
emission reductions
Good practice fabric and vent
Standard heat pump
600m2 of PV
-2
-1
0
1
2
3
4
5
6
7
SAP Regulated SAP Regulated andUnregulated
PHPP Regulated andUnregulated
kgC
O2/
m2 /
yr
0
5
10
15
20
25
30
35
SAP Regulated SAP Regulated andUnregulated
PHPP Regulated andUnregulated
kgC
O2/
m2 /
yr
According to the current GLA definition of zero carbon, this house can be deemed a ‘zero carbon home’ on site
Figure 61 - Terrace house modelled
In actual fact, it will still emit approx. 6 kgCO2/m2.yr using 233 gCO2/kWh (SAP 10.0)
There is a very significant difference between a Part L assessment of carbon emissions and a PHPP assessment
Part L Part L
Figure 63 - School modelled
According to the current GLA definition of zero carbon, this school can be deemed a ‘zero carbon school’ if the residual carbon emissions are being offset (by a payment)
Section 4

4820190258 | Cost of Carbon | May 20 | Rev M
The concept of Energy Use Intensity (EUI)
Energy modelling during the design of new buildings is normally restricted to Building Regulations Part L assessments of regulated energy uses, using the National Calculation Methodology (NCM). This approach is meant to be used only for demonstrating compliance with building regulations; rather than predicting energy use, it is based on standardised and simplified inputs and assumptions. The output is therefore not an ‘actual’ energy estimate, and is not meant to be one, but it is unfortunately used as one.
The predicted Energy Use Intensity (or EUI) represents the ‘energy use at the meter’. It is the performance metric we would recommend as it facilitates year-on-year comparisons, and as it can easily be measured and understood by all stakeholders.
The adjacent tables illustrate the scale of EUI on three of the typologies from the PHPP modelling undertaken as part of this study.
Other references on EUI
The RIBA 2030 Climate Challenge has been recently published and refers to operational energy metrics (see extracts below).
EUI and heat networks
If a building is connected to a heat network, its EUI should not only take into the heat used and metered but also take account the generation and distribution losses.
How to calculate the EUI?
There are softwares (e.g. PHPP) and methodologies (e.g. CIBSE TM54) which can be used to predict energy consumption and therefore EUIs.
It is possible that in the future standard tools (e.g. SAP, SBEM) could be used to predict energy use but they are not appropriate at the moment, particularly SBEM.
A new approach based on absolute energy targets | The Energy Use Intensity requirements
Terrace House
Potential EUI requirement for Terrace houses
2020
60kWh/m2/yr
2025
35kWh/m2/yr
TERRACE
Gas boiler
Direct electric
Heat pump
Better heat pump
Business as usual
98 89 48 42
Good practice
86 78 43 38
Ultra-low energy
64 58 35 31
MID-RISE
Gas boiler
Direct electric
Heat pump
Better heat pump
Business as usual
63 59 42 33
Good practice
55 51 38 31
Ultra-low energy
48 41 34 28
SCHOOL
Gas boiler
Direct electric
Heat pump
Better heat pump
Business as usual
114 109 86 76
Good practice
87 83 76 72
Ultra-low energy
71 68 67 66
No PV
No PV
No PV
Energy Use Intensity (EUI)
Energy Use Intensity (EUI)
Fab
ric
& V
enti
lati
on
Fab
ric
& V
enti
lati
on
Fab
ric
& V
enti
lati
on
Energy Use Intensity (EUI)
Mid-rise apartment building
TERRACE
Gas boiler
Direct electric
Heat pump
Better heat pump
Business as usual
98 89 48 42
Good practice
86 78 43 38
Ultra-low energy
64 58 35 31
MID-RISE
Gas boiler
Direct electric
Heat pump
Better heat pump
Business as usual
63 59 42 33
Good practice
55 51 38 31
Ultra-low energy
48 41 34 28
SCHOOL
Gas boiler
Direct electric
Heat pump
Better heat pump
Business as usual
114 109 86 76
Good practice
87 83 76 72
Ultra-low energy
71 68 67 66
No PV
No PV
No PV
Energy Use Intensity (EUI)
Energy Use Intensity (EUI)
Fab
ric
& V
enti
lati
on
Fab
ric
& V
enti
lati
on
Fab
ric
& V
enti
lati
on
Energy Use Intensity (EUI)
School
Potential EUI requirement for Mid-rise apartment
buildings
2020
60kWh/m2/yr
2025
35kWh/m2/yr
Potential EUI requirement for Schools
2020
90kWh/m2/yr
2025
65kWh/m2/yr
Table 62 – Terrace House – Energy Use Intensities (EUI) of different combinations for the modelled house
Table 63 – Mid-rise apartment building – Energy Use Intensities (EUI) of different combinations for the modelled block
Table 64 – School– Energy Use Intensities (EUI) of different combinations for the modelled school
Tables 65 and 66 – Operational Energy Use Intensities (EUI) from the RIBA 2030 Climate Challenge
Section 4

4920190258 | Cost of Carbon | May 20 | Rev M
Conclusion | Towards Net Zero Carbon buildings: a better approach is needed
Our recommendations for a better, simpler system
We recommend to introduce the following changes to the system now in order to set planning requirements on the right path towards Net Zero Carbon, and to step up the requirements over time.
1. Introduce Energy Use Intensity (EUI) requirements: the use of maximum EUIs would help as it is an absolute metric, is independent from carbon and can be easily verified by the building/home owner/tenant after completion.
2. Request the prediction of energy use modelling: We recommend to make the estimate of the building’s future energy use mandatory. This could be done with PHPP (Passivhaus Planning Package) and/or other tools consistent with the CIBSE TM54 methodology.
3. Consider regulated and unregulated energy: unregulated energy needs to be assessed in addition to regulated energy if Net Zero Carbon building is the destination.
4. Include planning conditions to address the performance gap: more energy modelling and quality checks after planning, particularly during detailed design and construction would help to reduce the performance gap.
Net Zero is possible
It is also important to realise that reaching Net Zero operational carbon on new residential buildings is technically possible assuming that an exemplar level of energy efficiency is achieved, that a low carbon heating system is used and that solar PVs are maximised on roofs.
New KPIs for Net Zero
The adjacent table sets out a number of potential Key Performance Indicators (KPIs) for Net Zero Carbon. Our professional opinion is that they are very likely to form the basis of any future Net Zero Carbon standard. The KPIs highlight the importance of all elements below:
• Low energy use• Embodied carbon • Low carbon energy supply• Measurement and verification• Zero carbon balance
The adjacent column provides some indicative design requirements which are likely to comply with the KPIs. These are not mandatory to achieve the KPIs though.
Key Performance Indicators (KPI) Indicative design requirements to comply with KPIs
Low energy use Energy Use Intensity a
< 35 kWh/m2/yr (GIA)
1. Efficient form factor: < 0.8-1.2
2. Proportion of windows: 10-25%
3. External wall U-value < 0.13 W/m2.K
4. Floor U-value < 0.10 W/m2.K
5. Ground floor U-value < 0.10 W/m2.K
6. Thermal bridge free junctions
7. Triple-glazed windows
8. Airtightness < 1 m3/h/m2 at 50 Pa
9. MVHR within 2m of external wall
10. WWHR (Waste Water Heat Recovery System) in each unit
11. Potential external shading to south and west facing windows to
mitigate overheating
Space heating demand b
< 15 kWh/m2/yr (TFA)
Hot water demand b
<18 kWh/m2/yr (TFA)
Other electricity consumption b
<18 kWh/m2/yr (TFA)
Embodied carbon Embodied carbon c
< 500 kgCO2/m2/yr
11. To be detailed as part of project specific embodied carbon assessment
Low carbon energy supply No gas connection for heating/hot water or cooking
Average annual carbon content of heat over 2020-2050 d
< 70 gCO2/kWh
12. No gas boilers
13. Heating system analysis required
PV area
> 50-70% of of the roof area
14. Target PV area > 100 kWh/m2 (Building footprint)/yr
Maximum peak demand
< 4kW/unit (average)
15. 100 litres of hot water storage per unit
Measurement and verification Predicted energy performance at each design stage and during construction
5-year energy monitoring post-construction
16. Adequate sub-metering from key energy uses and renewables.
17. Post Occupancy Evaluation
Zero operational carbon balance Annual carbon balance for the whole development = 0 g
a, b To be calculated using a predicted energy calculation methodology and software (e.g. PHPP). Energy demand represents the energy required and energy consumption represents the energy used by the system(s) to deliver this energy
c Embodied carbon target (Building Life Cycle Stages A1-A5). Includes Substructure, Superstructure, MEP, Facade & Internal Finishes.
d Bespoke calculation, including all losses and assuming an average carbon content of electricity over 2020-2050 of 70gCO2/kWh
Table 67 – Potential Key Performance Indicators for Net Zero Carbon residential buildings and associated (indicative) design requirement
Section 4

5020190258 | Cost of Carbon | May 20 | Rev M
Appendices
• Impact of SAP 10.1 - Domestic example: impact on the mid-rise apartment building
• Impact of SAP 10.1 - Non-domestic example: impact on the school
• Energy and cost modelling assumptions

5120190258 | Cost of Carbon | May 20 | Rev M
MID�RISE
Business as usual 1A 209 1B -28 1C 44 1D 85
Good practice 2A 201 2B 2 2C 81 2D 122
Ultra-low energy 3A 166 3B 18 3C 107 3D 150
Gas boiler
Direct electric
Heat pump
Better heat pump
Fabr
ic &
V
entil
atio
n
£/m2
1A
1B
1C
1D
2A
2B
2C
2D
3A
3B
3C
3D
0% 10% 20% 30% 40% 50% 60% 70% 80% 90% 100% 110%
-100
-50
0
50
100
150
200
250
300
% Reduction in CO2 - SAP 10.1
Add
ition
al c
onst
ruct
ion
+ c
arbo
n of
fset
cos
t -£/
m2
Our recommendation: tiered price at £1,000, £300 and £100/tonne
1A
1B
1C
1D2A
2B
2C
2D
3A
3B
3C
3D
0% 10% 20% 30% 40% 50% 60% 70% 80% 90% 100% 110%
-100
-50
0
50
100
150
200
250
300
% Reduction in CO2 - SAP 10.1
Add
ition
al c
onst
ruct
ion
+ c
arbo
n of
fset
cos
t -£/
m2
Current approach: flat price at £60/tonne
Gas boiler
Direct electric
Heat pump
Better heat pump
Business as usual
26% 40% 71% 87%
Good practice
36% 51% 77% 91%
Ultra-low energy
51% 66% 86% 96%
Gas boiler
Direct electric
Heat pump
Better heat pump
Business as usual
20% 63% 82% 92%
Good practice
30% 70% 86% 95%
Ultra-low energy
45% 79% 91% 98%
With PV
Fabr
ic &
Ven
tilat
ion
With PV
Fabr
ic &
Ven
tilat
ion
Reduction in CO2 - SAP 10
(reg)
Reduction in CO2 - SAP 10.1
(reg)
Gas boiler
Direct electric
Heat pump
Better heat pump
Business as usual
26% 40% 71% 87%
Good practice
36% 51% 77% 91%
Ultra-low energy
51% 66% 86% 96%
Gas boiler
Direct electric
Heat pump
Better heat pump
Business as usual
16% 80% 90% 96%
Good practice
27% 83% 92% 97%
Ultra-low energy
41% 88% 95% 99%
Fabr
ic &
Ven
tilat
ion
With PV
Fabr
ic &
Ven
tilat
ion
Reduction in CO2 - SAP 10.0
(reg)
Reduction in CO2 - Future
(reg)
With PV
MID�RISE
Business as usual 1A 196 1B 73 1C 59 1D 87
Good practice 2A 186 2B 62 2C 89 2D 124
Ultra-low energy 3A 150 3B 38 3C 110 3D 150
Gas boiler
Direct electric
Heat pump
Better heat pump
Fabr
ic &
V
entil
atio
n
£/m2
1A
1B1C
1D
2A
2B2C
2D3A
3B
3C
3D
0% 10% 20% 30% 40% 50% 60% 70% 80% 90% 100% 110%
-100
-50
0
50
100
150
200
250
300
% Reduction in CO2 - SAP 10.0
Add
ition
al c
onst
ruct
ion
+ c
arbo
n of
fset
cos
t -£/
m2
Our recommendation: tiered price at £1,000, £300 and £100/tonne
1A
1B
1C
1D2A
2B
2C
2D
3A
3B
3C
3D
0% 10% 20% 30% 40% 50% 60% 70% 80% 90% 100% 110%
-100
-50
0
50
100
150
200
250
300
% Reduction in CO2 - SAP 10.0
Add
ition
al c
onst
ruct
ion
+ c
arbo
n of
fset
cos
t -£/
m2
Current approach: flat price at £60/tonne
Mid-rise apartment building
From SAP 10.0 to SAP 10.1
This page summarises the impact of a change in electricity carbon factor from 233 gCO2/kWh (SAP 10.0) to 136 gCO2/kWh (SAP 10.1).
Impact on Part L improvement
This change would have a significant positive improvement on Part L improvements for electric solutions, with the higher impact for the scenarios with the highest heating demand. The change would mainly benefit the high carbon heat options electric options:
• The ‘Direct electric’ options would perform better by 13-23 percentage points;
• The ‘Heat pump’ options would perform better by 5-11 percentage points;
• The ‘Better heat pump’ options would perform better by 2-5 percentage points.
Our recommendation for the tiered carbon price
This change would mainly affect the additional construction costs + carbon offsetting costs of the ‘Direct electric’ options, making them more attractive.
Table 70 - Mid-rise apartment building - Improvement over Part L assuming 136 gCO2/kWh (SAP 10.1) for grid-supplied electricity
Impact of SAP 10.1 | Mid-rise apartment buildingClimate: GB0001a - London (Central)Building type: Dwelling15.8 kWh/m †́aTFA 2753 m †́ (Direct entry)Heat Loss Form Factor 1.31
Table 68 - Mid-rise apartment building - Improvement over Part L assuming 233 gCO2/kWh (SAP 10.0) for grid-supplied electricity
Additional construction costs + carbon offsetting
.
Table 69 - Mid-rise apartment building - Improvement over Part L assuming 233 gCO2/kWh (SAP 10.0) for grid-supplied electricity
Table 71 - Mid-rise apartment building - Improvement over Part L assuming 136 gCO2/kWh (SAP 10.1) for grid-supplied electricity
Must not be incentivised(gas heating)
Should not be incentivised
< 0% < 35% < 60% 60-80% > 80%

5220190258 | Cost of Carbon | May 20 | Rev M
OFFICE
Business as usual 1A 49 1B -47 1C 50 1D 163
Good practice 2A 138 2B 67 2C 140 2D 222
Ultra-low energy 3A 175 3B 124 3C 177 3D 238
Gas boiler
Direct electric
Heat pump
Better heat pump
Fabr
ic &
V
entil
atio
n
£/m2
1A
1B
1C
1D
2A
2B
2C
2D
3A
3B
3C
3D
0% 10% 20% 30% 40% 50% 60% 70% 80% 90% 100% 110%
-100
-50
0
50
100
150
200
250
300
% Reduction in CO2 - SAP 10.1
Add
ition
al c
onst
ruct
ion
+ c
arbo
n of
fset
cos
t -£/
m2
Our recommendation: tiered price at £1,000 and £300/tonne
1A
1B
1C
1D
2A
2B
2C
2D3A
3B
3C
3D
0% 10% 20% 30% 40% 50% 60% 70% 80% 90% 100% 110%
-100
-50
0
50
100
150
200
250
300
% Reduction in CO2 - SAP 10.1
Add
ition
al c
onst
ruct
ion
+ c
arbo
n of
fset
cos
t -£/
m2
Current approach: flat price at £60/tonne
Gas boiler
VRFHeat
pump Better
heat pump
Business as usual
29% 48% 44% 49%
Good practice
41% 54% 51% 55%
Ultra-low energy
55% 61% 59% 61%
Gas boiler
VRFHeat
pump Better
heat pump
Business as usual
22% 56% 52% 56%
Good practice
38% 60% 58% 61%
Ultra-low energy
55% 66% 65% 66%
Fabr
ic &
Ven
tilat
ion
With PV
Fabr
ic &
Ven
tilat
ion
With PV
Reduction in CO2 - SAP 10
(reg)
Reduction in CO2 - SAP 10.1
(reg)
Gas boiler
VRFHeat
pump Better
heat pump
Business as usual
29% 48% 44% 49%
Good practice
41% 54% 51% 55%
Ultra-low energy
55% 61% 59% 61%
Gas boiler
VRFHeat
pump Better
heat pump
Business as usual
13% 65% 62% 66%
Good practice
33% 69% 67% 69%
Ultra-low energy
56% 73% 72% 73%
Reduction in CO2 - SAP 10.0
(reg)
Reduction in CO2 - Future
(reg)
With PV
Fabr
ic &
Ven
tilat
ion
With PV
Fabr
ic &
Ven
tilat
ion
OFFICE
Business as usual 1A 100 1B -26 1C 82 1D 183
Good practice 2A 170 2B 83 2C 157 2D 238
Ultra-low energy 3A 188 3B 138 3C 192 3D 252
Gas boiler
Direct electric
Heat pump
Better heat pump
Fabr
ic &
V
entil
atio
n
£/m2
1A
1B
1C
1D
2A
2B
2C
2D
3A
3B
3C
3D
0% 10% 20% 30% 40% 50% 60% 70% 80% 90% 100% 110%
-100
-50
0
50
100
150
200
250
300
% Reduction in CO2 - SAP 10.0
Add
ition
al c
onst
ruct
ion
+ c
arbo
n of
fset
cos
t -£/
m2
Our recommendation: tiered price at £1,000 and £300/tonne
1A
1B
1C
1D
2A
2B
2C
2D3A
3B
3C
3D
0% 10% 20% 30% 40% 50% 60% 70% 80% 90% 100% 110%
-100
-50
0
50
100
150
200
250
300
% Reduction in CO2 - SAP 10.0
Add
ition
al c
onst
ruct
ion
+ c
arbo
n of
fset
cos
t -£/
m2
Current approach: flat price at £60/tonne
Office building (new)
From SAP 10.0 to SAP 10.1
This page summarises the impact of a change in electricity carbon factor from 233 gCO2/kWh (SAP 10.0) to 136 gCO2/kWh (SAP 10.1).
Impact on Part L improvement
This change would have a positive improvement on Part L improvements for electric solutions. The impact would be failrysimilar between the fabric and ventilation options and the heating systems:
• The ‘VRF’ options would perform better by 5-8 percentage points;
• The ‘Heat pump’ options would perform better by 6-8 percentage points;
• The ‘Better heat pump’ options would perform better by 5-7 percentage points.
Our recommendation for the tiered carbon price
This change would generally reduce the additional construction costs + carbon offsetting costs of all options.
Table 74 - Office building (new) - Improvement over Part L assuming 136 gCO2/kWh (SAP 10.1) for grid-supplied electricity
Impact of SAP 10.1 | Office building (new)
Table 72 - Office building (new) - Improvement over Part L assuming 233 gCO2/kWh (SAP 10.0) for grid-supplied electricity
Table 73 - Office building (new) - Improvement over Part L assuming 233 gCO2/kWh (SAP 10.0) for grid-supplied electricity
Table 75 - Office building (new) - Improvement over Part L assuming 136 gCO2/kWh (SAP 10.1) for grid-supplied electricity
Must not be incentivised(gas heating)
Should not be incentivised
Additional construction costs + carbon offsetting
.
< 0% < 35% < 50% ³ 50%
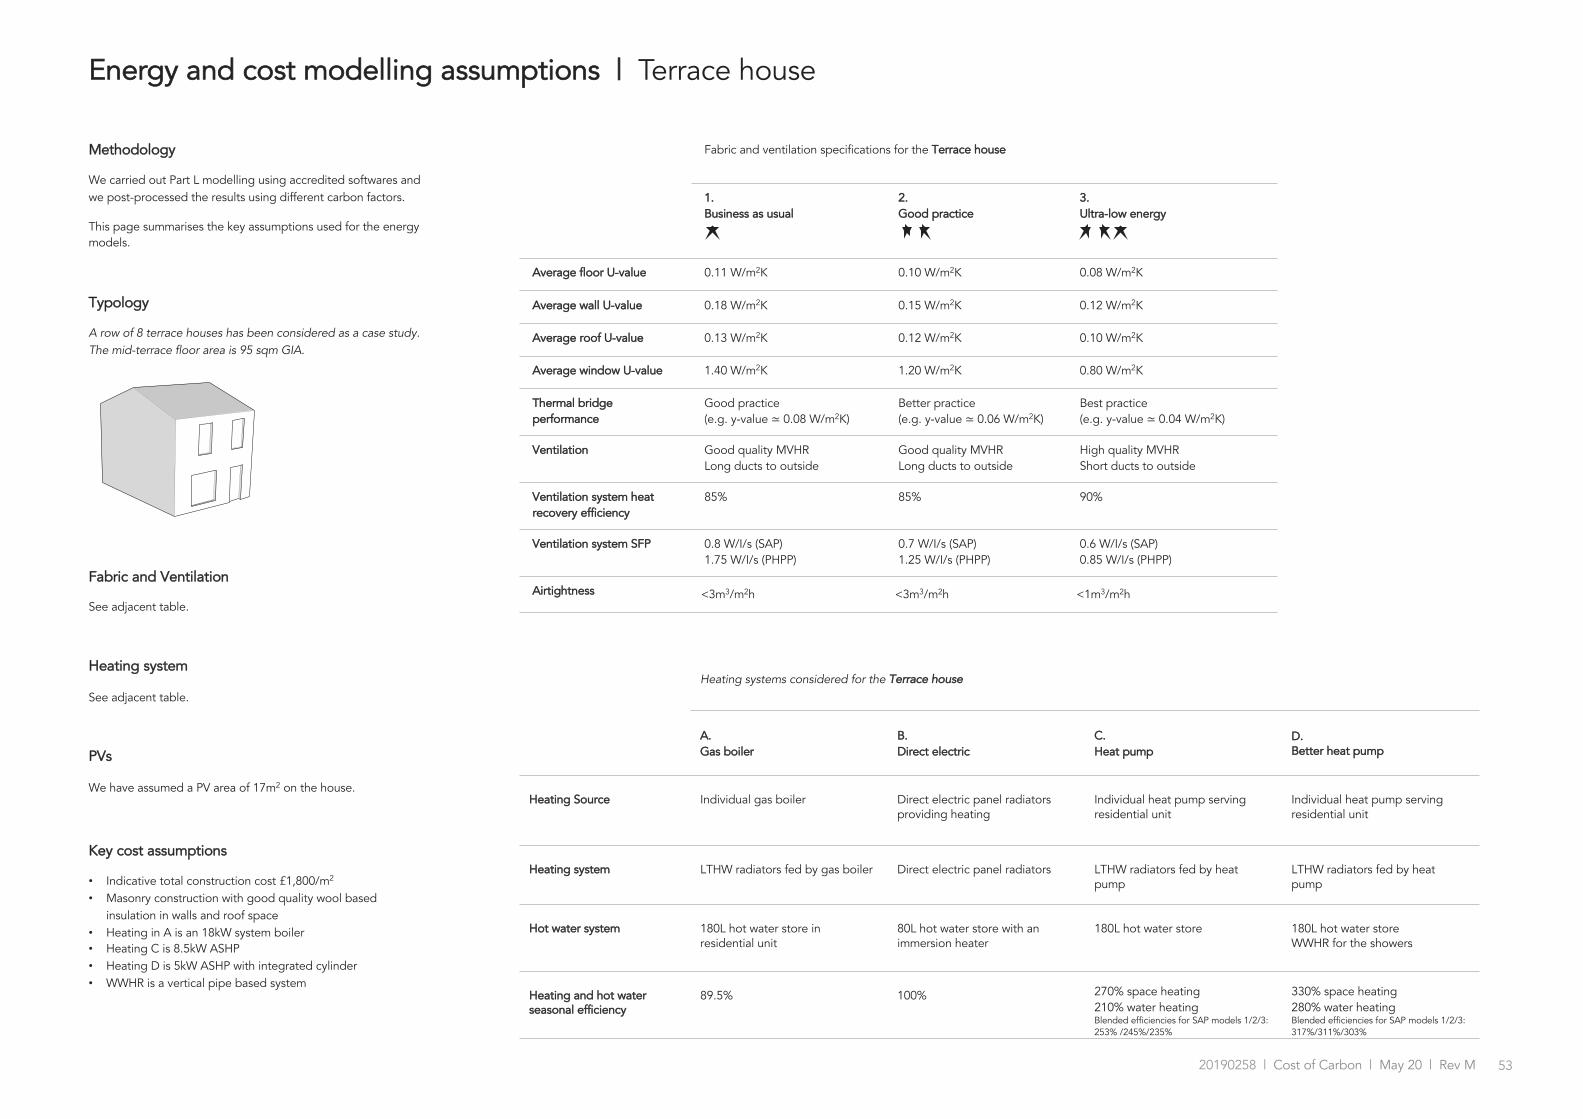
5320190258 | Cost of Carbon | May 20 | Rev M
Methodology
We carried out Part L modelling using accredited softwares and we post-processed the results using different carbon factors.
This page summarises the key assumptions used for the energy models.
Typology
A row of 8 terrace houses has been considered as a case study. The mid-terrace floor area is 95 sqm GIA.
Fabric and Ventilation
See adjacent table.
Heating system
See adjacent table.
PVs
We have assumed a PV area of 17m2 on the house.
Key cost assumptions
• Indicative total construction cost £1,800/m2
• Masonry construction with good quality wool based insulation in walls and roof space
• Heating in A is an 18kW system boiler• Heating C is 8.5kW ASHP• Heating D is 5kW ASHP with integrated cylinder• WWHR is a vertical pipe based system
Fabric and ventilation specifications for the Terrace house
1. Business as usual
2. Good practice
3.Ultra-low energy
Average floor U-value 0.11 W/m2K 0.10 W/m2K 0.08 W/m2K
Average wall U-value 0.18 W/m2K 0.15 W/m2K 0.12 W/m2K
Average roof U-value 0.13 W/m2K 0.12 W/m2K 0.10 W/m2K
Average window U-value 1.40 W/m2K 1.20 W/m2K 0.80 W/m2K
Thermal bridge performance
Good practice(e.g. y-value ≃ 0.08 W/m2K)
Better practice(e.g. y-value ≃ 0.06 W/m2K)
Best practice(e.g. y-value ≃ 0.04 W/m2K)
Ventilation Good quality MVHR Long ducts to outside
Good quality MVHR Long ducts to outside
High quality MVHR Short ducts to outside
Ventilation system heat recovery efficiency
85% 85% 90%
Ventilation system SFP 0.8 W/I/s (SAP)1.75 W/I/s (PHPP)
0.7 W/I/s (SAP)1.25 W/I/s (PHPP)
0.6 W/I/s (SAP)0.85 W/I/s (PHPP)
Airtightness <3m3/m2h <3m3/m2h <1m3/m2h
Energy and cost modelling assumptions | Terrace house
Heating systems considered for the Terrace house
A. Gas boiler
B. Direct electric
C. Heat pump
D. Better heat pump
Heating Source Individual gas boiler Direct electric panel radiators providing heating
Individual heat pump serving residential unit
Individual heat pump serving residential unit
Heating system LTHW radiators fed by gas boiler Direct electric panel radiators LTHW radiators fed by heat pump
LTHW radiators fed by heat pump
Hot water system 180L hot water store in residential unit
80L hot water store with an immersion heater
180L hot water store 180L hot water store WWHR for the showers
Heating and hot water seasonal efficiency
89.5% 100% 270% space heating210% water heatingBlended efficiencies for SAP models 1/2/3: 253% /245%/235%
330% space heating280% water heatingBlended efficiencies for SAP models 1/2/3:317%/311%/303%
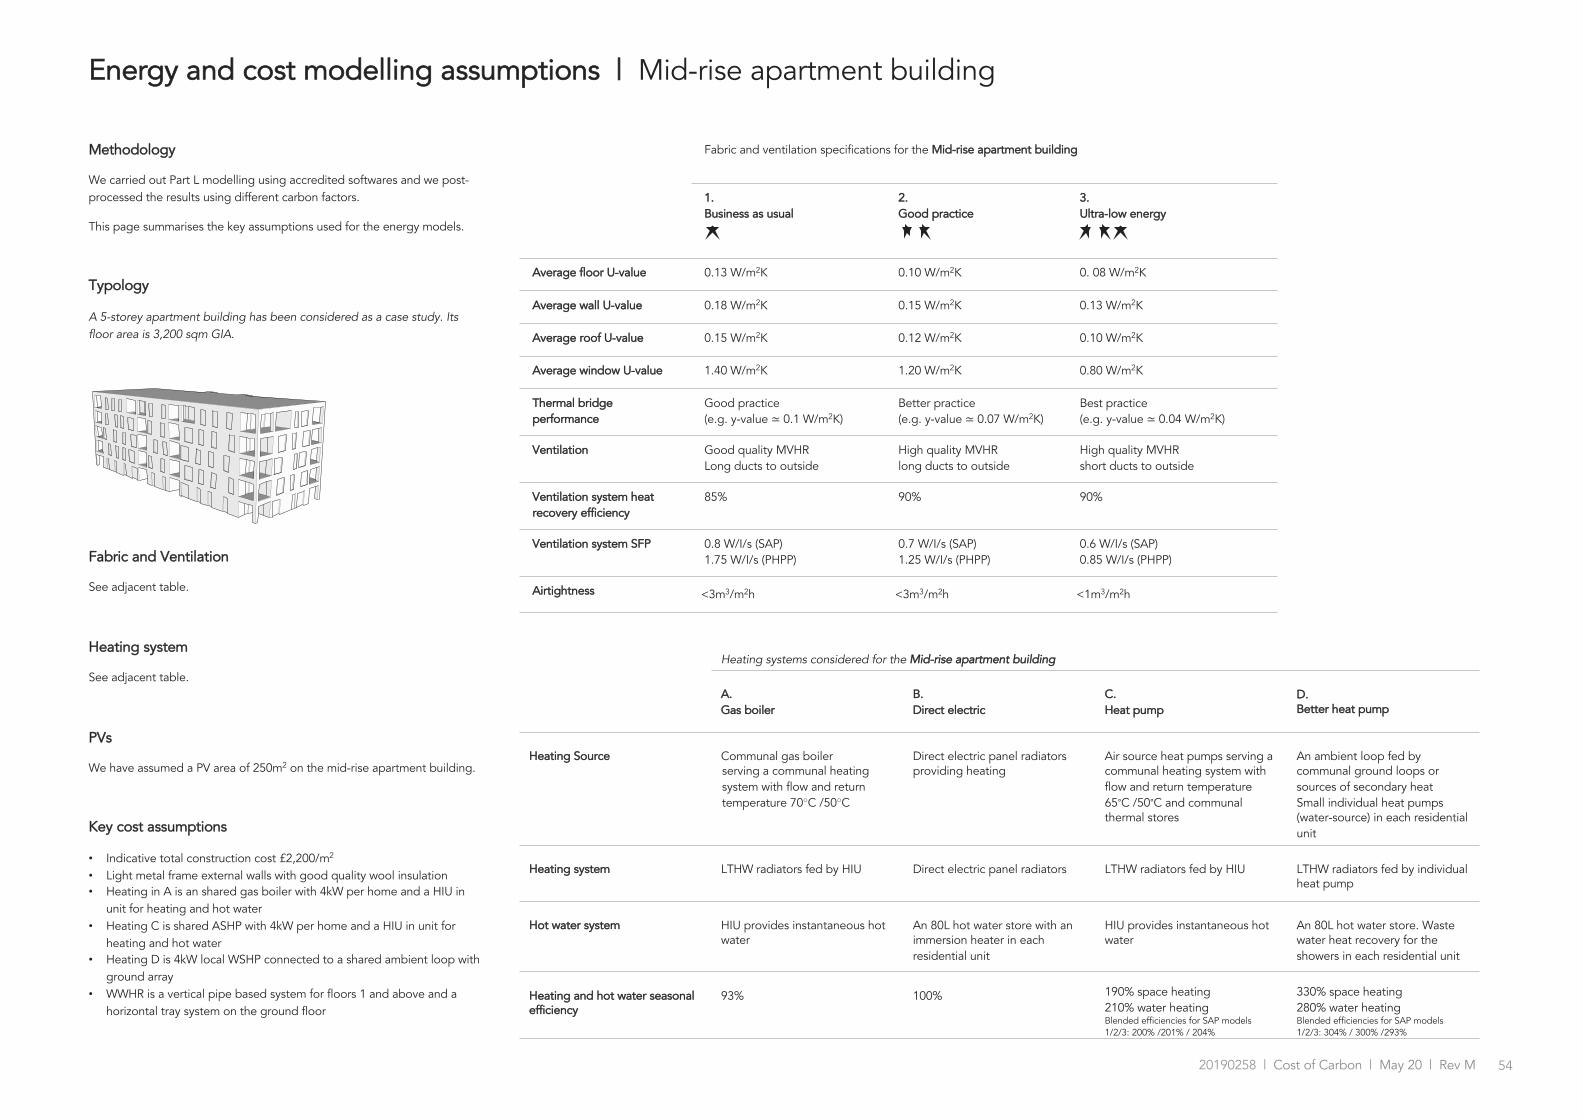
5420190258 | Cost of Carbon | May 20 | Rev M
Methodology
We carried out Part L modelling using accredited softwares and we post-processed the results using different carbon factors.
This page summarises the key assumptions used for the energy models.
Typology
A 5-storey apartment building has been considered as a case study. Its floor area is 3,200 sqm GIA.
Fabric and Ventilation
See adjacent table.
Heating system
See adjacent table.
PVs
We have assumed a PV area of 250m2 on the mid-rise apartment building.
Key cost assumptions
• Indicative total construction cost £2,200/m2
• Light metal frame external walls with good quality wool insulation• Heating in A is an shared gas boiler with 4kW per home and a HIU in
unit for heating and hot water• Heating C is shared ASHP with 4kW per home and a HIU in unit for
heating and hot water• Heating D is 4kW local WSHP connected to a shared ambient loop with
ground array• WWHR is a vertical pipe based system for floors 1 and above and a
horizontal tray system on the ground floor
Fabric and ventilation specifications for the Mid-rise apartment building
1. Business as usual
2. Good practice
3.Ultra-low energy
Average floor U-value 0.13 W/m2K 0.10 W/m2K 0. 08 W/m2K
Average wall U-value 0.18 W/m2K 0.15 W/m2K 0.13 W/m2K
Average roof U-value 0.15 W/m2K 0.12 W/m2K 0.10 W/m2K
Average window U-value 1.40 W/m2K 1.20 W/m2K 0.80 W/m2K
Thermal bridge performance
Good practice(e.g. y-value ≃ 0.1 W/m2K)
Better practice(e.g. y-value ≃ 0.07 W/m2K)
Best practice(e.g. y-value ≃ 0.04 W/m2K)
Ventilation Good quality MVHR Long ducts to outside
High quality MVHR long ducts to outside
High quality MVHR short ducts to outside
Ventilation system heat recovery efficiency
85% 90% 90%
Ventilation system SFP 0.8 W/I/s (SAP)1.75 W/I/s (PHPP)
0.7 W/I/s (SAP)1.25 W/I/s (PHPP)
0.6 W/I/s (SAP)0.85 W/I/s (PHPP)
Airtightness <3m3/m2h <3m3/m2h <1m3/m2h
Energy and cost modelling assumptions | Mid-rise apartment building
Heating systems considered for the Mid-rise apartment building
A. Gas boiler
B. Direct electric
C. Heat pump
D. Better heat pump
Heating Source Communal gas boiler serving a communal heating system with flow and return temperature 70○C /50○C
Direct electric panel radiators providing heating
Air source heat pumps serving a communal heating system with flow and return temperature 65∘C /50∘C and communal thermal stores
An ambient loop fed by communal ground loops or sources of secondary heat Small individual heat pumps (water-source) in each residential unit
Heating system LTHW radiators fed by HIU Direct electric panel radiators LTHW radiators fed by HIU LTHW radiators fed by individual heat pump
Hot water system HIU provides instantaneous hot water
An 80L hot water store with an immersion heater in each residential unit
HIU provides instantaneous hot water
An 80L hot water store. Waste water heat recovery for the showers in each residential unit
Heating and hot water seasonal efficiency
93% 100% 190% space heating210% water heatingBlended efficiencies for SAP models 1/2/3: 200% /201% / 204%
330% space heating280% water heatingBlended efficiencies for SAP models 1/2/3: 304% / 300% /293%
Climate: GB0001a - London (Central)Building type: Dwelling15.8 kWh/m †́aTFA 2753 m †́ (Direct entry)Heat Loss Form Factor 1.31

5520190258 | Cost of Carbon | May 20 | Rev M
Methodology
We carried out Part L modelling using accredited softwares and we post-processed the results using different carbon factors.
This page summarises the key assumptions used for the energy models.
Typology
A 25-storey apartment building has been considered as a case study. Its floor area is 14,600 sqm GIA.
Fabric and Ventilation
See adjacent table.
Heating system
See adjacent table.
PVs
We have assumed a PV area of 150m2 on the high-rise apartment building.
Key cost assumptions
• Indicative total construction cost £3,100/m2
• Light metal frame external walls with good quality wool insulation• Heating in A is an shared gas boiler with 4kW per home and a HIU in
unit for heating and hot water• Heating C is shared ASHP with 4kW per home and a HIU in unit for
heating and hot water• Heating D is 4kW local WSHP connected to a shared ambient loop with
ground array• WWHR is a vertical pipe based system for floors 1 and above and a
horizontal tray system on the ground floor
Fabric and ventilation specifications for the High-rise apartment building
1. Business as usual
2. Good practice
3.Ultra-low energy
Average floor U-value 0.13 W/m2K 0. 10 W/m2K 0. 08 W/m2K
Average wall U-value 0.18 W/m2K 0.15 W/m2K 0.13 W/m2K
Average roof U-value 0.15 W/m2K 0.12 W/m2K 0. 10 W/m2K
Average window U-value 1.40 W/m2K 1.20 W/m2K 0.90 W/m2K
Thermal bridge performance
Good practice(e.g. y-value ≃ 0.15 W/m2K)
Better practice(e.g. y-value ≃ 0.10 W/m2K)
Best practice(e.g. y-value ≃ 0.06 W/m2K)
Ventilation Good quality MVHR Long ducts to outside
High quality MVHR Long ducts to outside
High quality MVHR Short ducts to outside
Ventilation system heat recovery efficiency
85% 90% 90%
Ventilation system SFP 0.8 W/I/s (SAP) 0.7 W/I/s (SAP) 0.6 W/I/s (SAP)
Airtightness <3m3/m2h <3m3/m2h <1m3/m2h
Energy and cost modelling assumptions | High-rise apartment building
Heating systems considered for the High-rise apartment building
A. Gas boiler
B. Direct electric
C. Heat pump
D. Better heat pump
Heating Source Communal gas boiler serving a communal heating system with flow and return temperature 70○C/50○C
Direct electric panel radiators providing heating
Air source heat pumps serving a communal heating system with flow and return temperature 65○C/50○C and communal thermal stores
An ambient loop fed by communal ground loops or sources of secondary heatSmall individual heat pumps (water-source) in each residential unit
Heating system LTHW radiators fed by HIU Direct electric panel radiators LTHW radiators fed by HIU LTHW radiators fed by individual heat pump
Hot water system HIU provides instantaneous hot water
An 80L hot water store with an immersion heater in each residential unit
HIU provides instantaneous hot water
An 80L hot water store. Waste water heat recovery for the showers in each residential unit
Heating and hot water seasonal efficiency
93% 100% 190% space heating210% water heatingBlended efficiencies for SAP models 1/2/3: 200% /201%/204%
330% space heating280% water heatingBlended efficiencies for SAP models 1/2/3:304%/300%/293%

5620190258 | Cost of Carbon | May 20 | Rev M
Methodology
We carried out Part L modelling using accredited softwares and we post-processed the results using different carbon factors.
This page summarises the key assumptions used for the energy models.
Typology
A 9-storey hotel has been considered as a case study. Its floor area is 3,600 sqm GIA.
Fabric and Ventilation
See adjacent table.
Heating system
See adjacent table.
PVs
We have assumed a PV area of 120m2 on the hotel.
Key cost assumptions
• Indicative total construction cost £3,000/m2
• Light metal frame external walls with good quality wool insulation• Heating in A is an gas boiler of 635-180kW depending on fabric
specification• Heating C and D are ASHP or GSHP respectively. Sizes range from
520-65kW depending on fabric specification
Fabric and ventilation specifications for the Hotel
1. Business as usual
2. Good practice
3.Ultra-low energy
Average floor U-value 0.15 W/m2K 0.12 W/m2K 0.09 W/m2K
Average wall U-value 0.25 W/m2K 0.18 W/m2K 0.13 W/m2K
Average roof U-value 0.15 W/m2K 0.13 W/m2K 0.10 W/m2K
Average window U-value 1.40 W/m2K 1.20 W/m2K 0.80 W/m2K
Thermal bridge performance
Ignored(5% of losses)
Good practice(3% of losses)
Best practice(1% of losses)
Ventilation Standard quality AHU Good quality AHU Best practice AHU
Ventilation system heat recovery efficiency
75% 80% 90%
Ventilation system SFP 1.6 W/I/s 1.4 W/I/s 1.2 W/I/s
Airtightness <5m3/m2h <3m3/m2h <1m3/m2h
Energy and cost modelling assumptions | Hotel
Heating systems considered for the Hotel
A. Gas boiler
B. Direct electric
C. Heat pump
D. Better heat pump
Heating Source Gas boiler serving a heating system with flow and return temperature 70○C /50○C
VRF units Heat pumps serving a heating system with flow and return temperature 65○C /50○C
Heat pumps serving a heating system with low flow and return temperature 45○C /40○C fed ground source array
Heating system LTHW Fan Coil Unit fed by gas boiler
Fan Coil Unit fed by VRF LTHW Fan Coil Unit fed by Reversible chiller/heat pump
LTHW Fan Coil Unit fed by Reversible chiller/heat pump
Hot water system A 2,000L hot water store A 2,000L hot water store fed by VRF heat pump
A 2,000L hot water store A 2,000L hot water store
Heating and hot water seasonal efficiency
95% 400% for heating300% for hot water
220% 450% for heating300% for hot water (top up 2nd stage heat pump)
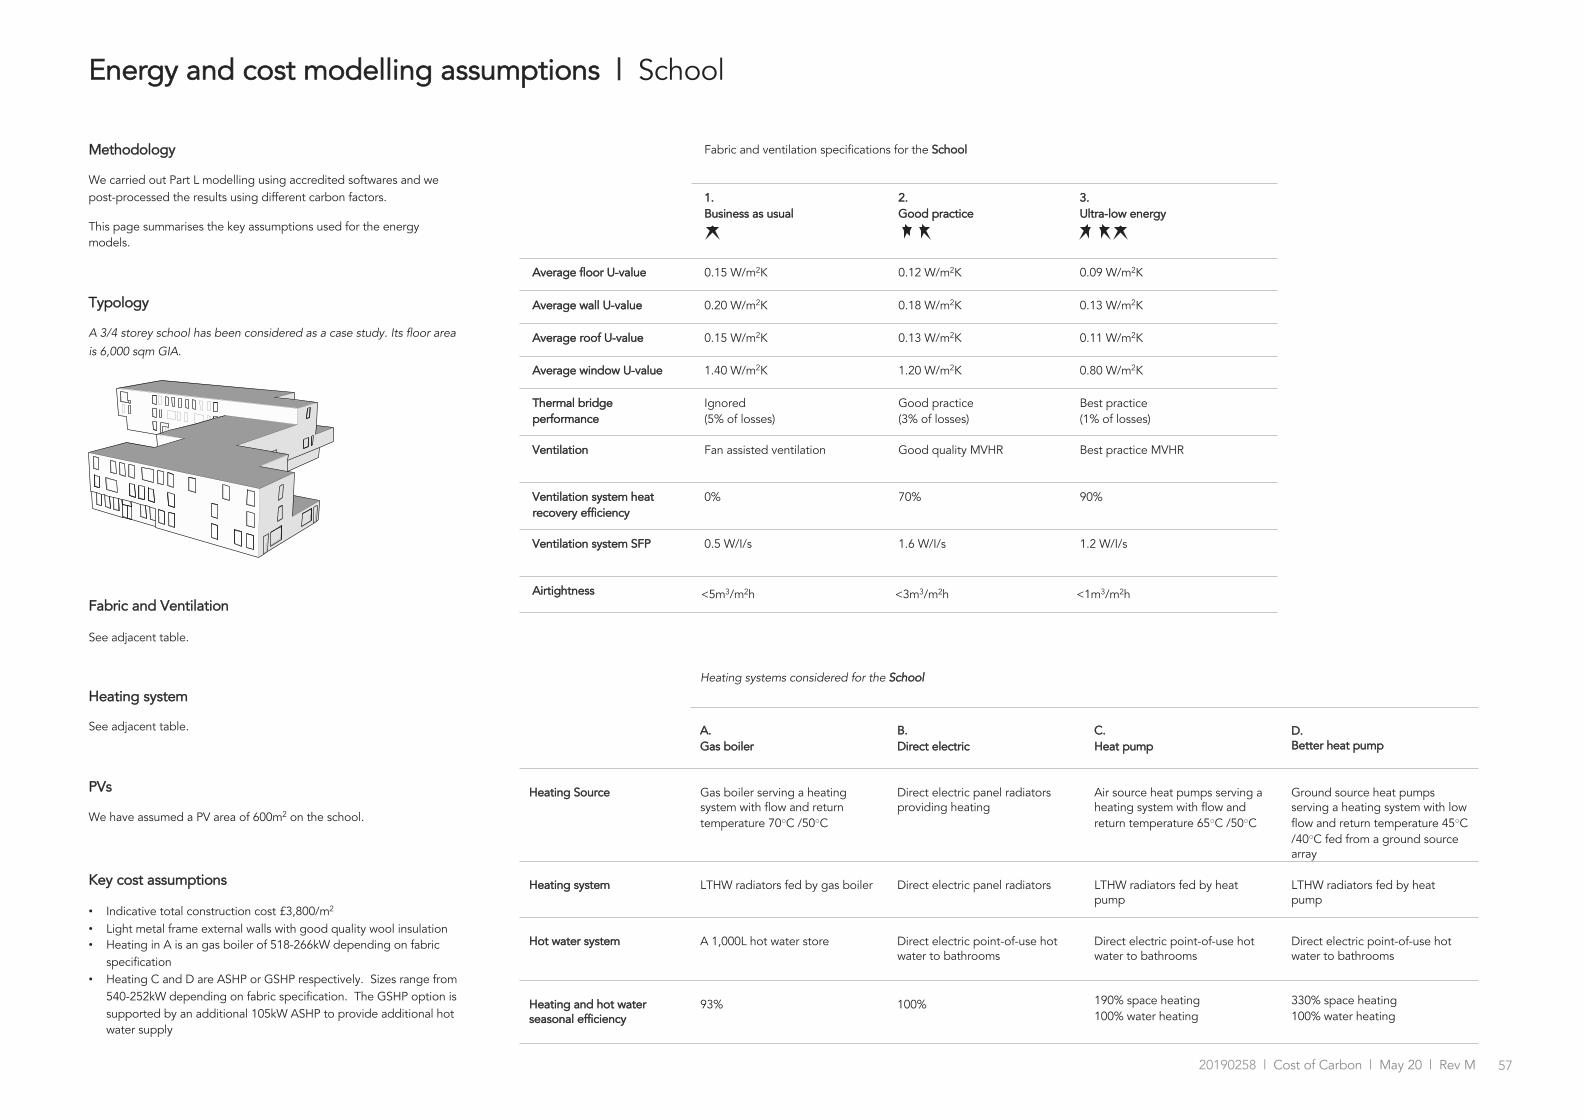
5720190258 | Cost of Carbon | May 20 | Rev M
Methodology
We carried out Part L modelling using accredited softwares and we post-processed the results using different carbon factors.
This page summarises the key assumptions used for the energy models.
Typology
A 3/4 storey school has been considered as a case study. Its floor area
is 6,000 sqm GIA.
Fabric and Ventilation
See adjacent table.
Heating system
See adjacent table.
PVs
We have assumed a PV area of 600m2 on the school.
Key cost assumptions
• Indicative total construction cost £3,800/m2
• Light metal frame external walls with good quality wool insulation• Heating in A is an gas boiler of 518-266kW depending on fabric
specification• Heating C and D are ASHP or GSHP respectively. Sizes range from
540-252kW depending on fabric specification. The GSHP option is supported by an additional 105kW ASHP to provide additional hot water supply
Fabric and ventilation specifications for the School
1. Business as usual
2. Good practice
3.Ultra-low energy
Average floor U-value 0.15 W/m2K 0.12 W/m2K 0.09 W/m2K
Average wall U-value 0.20 W/m2K 0.18 W/m2K 0.13 W/m2K
Average roof U-value 0.15 W/m2K 0.13 W/m2K 0.11 W/m2K
Average window U-value 1.40 W/m2K 1.20 W/m2K 0.80 W/m2K
Thermal bridge performance
Ignored(5% of losses)
Good practice(3% of losses)
Best practice(1% of losses)
Ventilation Fan assisted ventilation Good quality MVHR Best practice MVHR
Ventilation system heat recovery efficiency
0% 70% 90%
Ventilation system SFP 0.5 W/I/s 1.6 W/I/s 1.2 W/I/s
Airtightness <5m3/m2h <3m3/m2h <1m3/m2h
Energy and cost modelling assumptions | School
Heating systems considered for the School
A. Gas boiler
B. Direct electric
C. Heat pump
D. Better heat pump
Heating Source Gas boiler serving a heating system with flow and return temperature 70○C /50○C
Direct electric panel radiators providing heating
Air source heat pumps serving a heating system with flow and return temperature 65○C /50○C
Ground source heat pumps serving a heating system with low flow and return temperature 45○C /40○C fed from a ground source array
Heating system LTHW radiators fed by gas boiler Direct electric panel radiators LTHW radiators fed by heat pump
LTHW radiators fed by heat pump
Hot water system A 1,000L hot water store Direct electric point-of-use hot water to bathrooms
Direct electric point-of-use hot water to bathrooms
Direct electric point-of-use hot water to bathrooms
Heating and hot water seasonal efficiency
93% 100% 190% space heating100% water heating
330% space heating100% water heating

5820190258 | Cost of Carbon | May 20 | Rev M
Methodology
We carried out Part L modelling using accredited softwares and we post-processed the results using different carbon factors.
This page summarises the key assumptions used for the energy models.
Typology
A 7-storey office has been considered as a case study. Its floor area is 4,000 sqm GIA.
Fabric and Ventilation
See adjacent table.
Heating system
See adjacent table.
PVs
We have assumed a PV area of 215m2 on the office.
Key cost assumptions
• Indicative total construction cost £3,600/m2
• Light metal frame external walls with good quality wool insulation• Heating in A is an gas boiler of 246-86kW depending on fabric
specification• Heating C and D are ASHP or GSHP respectively. Sizes range from
348-160W depending on fabric specification. The GSHP option is supported by an additional 21kW ASHP to provide additional hot water supply for shower facilities (instantaneous electric hot water elsewhere).
Fabric and ventilation specifications for the Office (new build)
1. Business as usual
2. Good practice
3.Ultra-low energy
Average floor U-value 0.15 W/m2K 0.12 W/m2K 0.09 W/m2K
Average wall U-value 0.25 W/m2K 0.18 W/m2K 0.13 W/m2K
Average roof U-value 0.15 W/m2K 0.13 W/m2K 0.10 W/m2K
Average window U-value 1.60 W/m2K 1.40 W/m2K 0.80 W/m2K
Thermal bridge performance
Ignored(5% of losses)
Good practice(3% of losses)
Best practice(1% of losses)
Ventilation Standard quality AHU Good quality AHU Best practice AHU
Ventilation system heat recovery efficiency
75% 80% 90%
Ventilation system SFP 1.8 W/I/s 1.6 W/I/s 1.2 W/I/s
Airtightness <5m3/m2h <3m3/m2h <1m3/m2h
Energy and cost modelling assumptions | Office (new build)
Heating systems considered for the Office (new build)
A. Gas boiler
B. VRF
C. Heat pump
D. Better heat pump
Heating Source Gas boiler serving a heating system with flow and return temperature 70○C /50○C
VRF Heat pumps serving a heating system with flow and return temperature 65○C /50○C
Heat pumps serving a heating system with low flow and return temperature 45○C /40○C fed from ambient loop or ground source array
Heating system LTHW Fan Coil Unit fed by gas boiler
Fan Coil Unit fed by VRF LTHW Fan Coil Unit fed by Reversible chiller/heat pump
LTHW Fan Coil Unit fed by Reversible chiller/heat pump
Hot water system Direct electric hot water to toiletsA 400L hot water store for the showers fed by gas boiler
Direct electric hot water to toiletsAnd electric showers
Direct electric hot water to toiletsA 400L hot water store for the showers fed by the heat pump
Direct electric hot water to toiletsA 400L hot water store for the showers fed by the heat pump
Heating and hot water seasonal efficiency
95% 350% for heating100% for hot water
220% 450% for heating300% for hot water (top up 2nd stage heat pump)

5920190258 | Cost of Carbon | May 20 | Rev M
Methodology
We carried out Part L modelling using accredited softwares and we post-processed the results using different carbon factors.
This page summarises the key assumptions used for the energy models.
Typology
A 7-storey office has been considered as a case study. Its floor
area is 4,000 sqm GIA.
Fabric and Ventilation
See adjacent table.
Heating system
See adjacent table.
PVs
We have assumed a PV area of 215m2 on the office.
Fabric and ventilation specifications for the Office (refurbishment)
Existing building1. Business as usual
2. Good practice
3.Ultra-low energy
Average floor U-value 1.0 W/m2K 1.0 W/m2K 1.0 W/m2K 0.09 W/m2K
Average wall U-value 2.1 W/m2K 2.1 W/m2K 0.3 W/m2K 0.13 W/m2K
Average roof U-value 1.4 W/m2K 0.18 W/m2K 0.18 W/m2K 0.10 W/m2K
Average window U-value 5.6 W/m2K 1.80 W/m2K 1.80 W/m2K 0.80 W/m2K
Thermal bridge performance
Ignored(5% of losses)
Ignored(5% of losses)
Ignored(5% of losses)
Best practice(1% of losses)
Ventilation Natural ventilation Natural ventilation Standard quality MVHR
Best practice AHU
Ventilation system heat recovery efficiency
N/A N/A 75% 90%
Ventilation system SFP 0.5 W/I/s - Extract 0.5 W/I/s - Extract 1.8 W/I/s 1.2 W/I/s
Airtightness 20m3/m2h 15m3/m2h 5m3/m2h <1m3/m2h
Energy and cost modelling assumptions | Office (refurbishment)
Heating systems considered for the Office (refurbishment)
Existing systemA. Gas boiler
B. VRF
C. Heat pump
D. Better heat pump
Heating Source Gas boiler serving a heating system with flow and return temperature 70○C /50○C
Gas boiler serving a heating system with flow and return temperature 70○C /50○C
Direct electric panel radiators
Air source heat pumps serving a heating system with flow and return temperature 65○C/50○C
Ground source heat pumps serving a heating system with low flow and return temperature 45○C/40○C fed from a ground source array
Heating system LTHW Fan Coil Unit fed by gas boiler
LTHW Fan Coil Unit fed by gas boiler
Fan Coil Unit fed by VRF
LTHW Fan Coil Unit fed by Reversible chiller/heat pump
LTHW Fan Coil Unit fed by Reversible chiller/heat pump
Hot water system Direct electric hot water to toiletsA 400L hot water store for the showers fed by gas boiler
Direct electric hot water to toiletsA 400L hot water store for the showers fed by gas boiler
Direct electric hot water to toiletsAnd electric showers
Direct electric hot water to toiletsA 400L hot water store for the showers fed by the heat pump
Direct electric hot water to toiletsA 800L hot water store for the showers fed by the heat pump
Heating and hot water seasonal efficiency
70% 95% 400% for heating300% for hot water
220% 400% for heating300% for hot water (top up 2nd stage heat pump)