town cape - connecting repositories · okoth richard oduor february 2009 iv university of cape...
TRANSCRIPT

The copyright of this thesis rests with the University of Cape Town. No
quotation from it or information derived from it is to be published
without full acknowledgement of the source. The thesis is to be used
for private study or non-commercial research purposes only.
Univers
ity of
Cap
e Tow
n
FUNCTIONAL ANALYSES OF THE NOVELSTRESS-INDUCIBLE XVPSAP PROMOTERISOLATED FROM XEROPHYTA VISCOSA
Okoth Richard Oduor
Thesis submitted for the degree of
DOCTOR OF PHILOSOPHY
in the
Department of Molecular and Cellular Biology
at the
UNIVERSITY OF CAPE TOWN
FEBRUARY 2009
Univers
ity of
Cap
e Tow
n
Functional analyses of the stress-inducible XvPsap promoter isolated
from Xerophyta viscosa
Copyright c©Okoth Richard Oduor 2009.
All rights reserved. No part of this thesis may be reproduced or transmitted in any
form or by any means, electronic or mechanical, including photocopying, recording,
or in any information storage and retrieval system, without permission in writing
from the author or the University of Cape Town.
Typeset using PDFLATEX as implemented in MIKTEX.Printed in South Africa at:University of Cape Town,Private Bag,7700, Rondebosch.Cape Town.
Univers
ity of
Cap
e Tow
n

This treatise is dedicated to
my dear wife Roseline,
daughter Zawadi and son Ccoga
The world ranks you according to your own rating. If you view yourself as
small and insignificant like a worm, others will go fishing with you.
Univers
ity of
Cap
e Tow
n

Declaration
I declare that the work presented in this thesis is my original work. I also affirm that
this work has not been presented in this, or any other university for examination,
or for any other purposes. I further declare that the XvPsap promoter sequences
have been patented and are included in this thesis with permission from the other
inventors (Patent File Ref. PA143860/PCT).
OKOTH RICHARD ODUOR
FEBRUARY 2009
iv
Univers
ity of
Cap
e Tow
n
Acknowledgements
Almighty God, You deserve the unconditional gratitude for the precious gift of life,
family, friends, mentors and the academia. My candid and heart-felt thanks go
to my supervisors: Prof. Jennifer Ann Thomson for availing a conducive scientific
environment for my research, her ample intellectual guidance, understanding and
provision towards moulding me into a mature scientist, and Prof. Jesse Machuka
for his incessant dedication, resourceful comments and unconditional support.
To my beloved wife Roseline, daughter Zawadi and son Ccoga, a big thank you for
your unconditional love. It was difficult being away from you. I love you all.
To Dr. Revel Iyer, thanks for your immaculate training, ingenious recommenda-
tions and useful advice thoughout this study. I wish to thank Dr. Rufadeen for his
sincere help and encouragement. To Drs. Lewanika, Maredza, Owor, Govendor,
Morse and Tichwana, thank you guys for reminding me that it can be done. A big
thank you to all my family members: Margaret (my dear mother) and Aloice (my
dear dad, rest in peace), siblings; George, Dismas and Francis for their undiluted
support.
To the past and present All Africa House family, thank you for creating another
home for me. To Cluster B gurus: Tina Noe (your presence punctuated the
monotony of the masculine cluster B), Tuyi, Musa and Deo, thank you for the
moments shared and the memorable family times. My solid appreciation goes to
the USHEPiA office at the University of Cape Town, especially to Nan, Norma,
Masego, Zubaida, Lesley, Carol for their impeccable support throughout my study.
v
Univers
ity of
Cap
e Tow
n

ACKNOWLEDGEMENTS
Your prompt response in my time of need kept my stay at UCT massaged.
I am equally grateful to my laboratory colleagues, both past and present, at Uni-
versity of Cape Town: Wesley, Felix, Pule, Driaan, Tshego, Tafara, Zak, Tamaryn,
Rizqah, Mukani, Jayne, Ali, Shakiera, Alexis, Kamal and Marion (tissue culture
guru) for accommodating my frustrations whenever I suffered experimental fa-
tigues.
To present and past members of Plant Transformation Laboratory at Kenyatta
University especially Allan, John, Omwoyo, Anami, Runo, Taracha, Piero, Amos,
Lydia, Indieka, Jonathan, Philip, Abebe, Dancun, Charles, Abel, Seth and Rasha;
thank you all for your constant moral support and companionship not to mention
the unmatched teamwork that I enjoyed throughout this academic journey.
I am grateful to Dr. Karanja for ushering me into the convenience of LaTex and
Endnote programmes. I am also grateful to Drs. Kaberere, Mumenya and Wachira
for the unparalleled encouragement and keeping my JVC (Jaluo very clever) nick-
name alive. The memorable Kosewe meetings and the irresistible delicacies that
followed are fondly appreciated.
To Drs. Wangenge, Mositu and Ntsoaki, it could not be better, thank you for your
encouragement and the endless cappuccinos.
I am thankful to the Department of Molecular and Cell Biology of University of
Cape Town for providing competent staff members and an irreproachable con-
ducive learning environment during my study. My gratitude also goes to my
employer, Jomo Kenyatta University of Agriculture and Technology (JKUAT),
Nairobi, Kenya for granting me the study leave to undertake this research.
Last but surely not least, I acknowledge the financial support from the Rockefeller
Foundation through the University Sciences, Humanities and Engineering Part-
nerships in Africa (USHEPiA), which enabled this research to join other success
stories in the Scientific arena.
vi
Univers
ity of
Cap
e Tow
n

Abbreviations
The following abbreviations have been used in this thesis. They are defined in
Chapters where they first appear. Unless otherwise defined in the local area of the
text, the definitions for the abbreviations apply throughout the whole text.
µl Microlitre(s)
µg Microgram(s)
µM Micromolar(s)
◦C Degrees Celsius
′ Prime
α Alpha
β Beta
2,4-D 2,4- Dichlorophenoxy acetic acid
ANOVA Analysis of variance
ABRE ABA-responsive element
AS Acetosyringone
BAP Benzyl Amino Purine
BLAST Basic logarithm alignment search tool
BMS Black Mexican Sweetcorn
bp Base pair(s)
BSA Bovine serum albumin
CaMV Cauliflower Mosaic Virus
cDNA Complementary deoxyribonucleic acid
vii
Univers
ity of
Cap
e Tow
n
ABBREVIATIONS
CDP-Star Disodium 2-chloro-5-(4-methoxyspiro{1,2-dioxetane-3,2-(5-chloro)
-tricyclo[3.3.1.13,7]decan}- 4-yl)-1-phenyl phosphate
CTAB Cetyl trimethylammonium bromide
DEPC Diethylpyrocarbonate
DIG Digoxigenin
DMSO Dimethyl sulfoxide
DNA Deoxyribonucleic acid
DNAse Deoxyribonuclease
dNTP Deoxy-nucleotide triphosphate
DPE Downstream promoter element(s)
dTTP Deoxythiamidine triphosphate
dUTP Deoxyuridine triphosphate
g Centrifugal force
g Gram
GE Genetic engineering
GFP Green fluorescent protein
GOI Gene of interest(s)
h Hour(s)
HKG House keeping gene(s)
HSE Heat stress responsive elements
IPTG Isopropyl-β-D-thiogalactoside
kb Kilobase(s)
LB Left border
LS Lansmaier and Skoog
MBS MYB binding sites
MES 2-(4-morpholino)-ethane sulfonic acid
mg Milligram(s)
min Minute(s)
ml Milliliter(s)
mM Millimolar
viii
Univers
ity of
Cap
e Tow
n

ABBREVIATIONS
mRNA Messenger RNA
MS Murashige and Skoog
MTT 3-(4,5-Dimethylthiazol-2-yl)-2,5-diphenyltetrazolium bromide
NCBI National center for biotechnology Information
NEB New England Biolabs
nos Nopaline synthase
OD Optical density
PCR Polymerase chain reaction
qRTPCR Quantitative real time polymerase chain reaction
RB Right border
RLU Relative light unit
RNA Ribonucleic acid
RWC Relative water content
s Second(s)
SSC Saline sodium citrate
T-DNA Transferred DNA of tumour-inducing (Ti) plasmid
TF Transcriptional factor
TFCC Transcription-factor-centric clustering
Triton X-100 Poly(ethylenglycolether)n-octylphenol
tPA Tissue type plasminogen activator
TSS Transcription start site(s)
U Units
UV Ultra violet
Wd Dry weight
Wft Weight at full turgor
Wini Initial weight
w/v Weight per volume
WT Wild type
X-gal 5-bromo-4-chloro-3-indoyl- -D-galactopyranoside
ix
Univers
ity of
Cap
e Tow
n

Abstract
A non-coding sequence, XvPsap1 (2083 bp), was isolated upstream of the XvSap1
gene of Xerophyta viscosa. The sequence was analysed for novelty and the existence
of putative cis-elements. No significant identity was observed to any known plant
promoter. Various putative cis-acting elements were identified including those in-
volved in dehydration, heat stress, abscisic acid, jasmonic acid, light and low tem-
perature responsiveness. Two 5′ promoter deletions were conducted resulting in
truncated promoter fragments designated XvPsap2 (1577 bp) and XvPsap3 (1127
bp) relative to the translation start site. The full length promoter (XvPsap1) and
truncated fragments (XvPsap2 and XvPsap3) were cloned upstream of the coding
regions of either firefly luciferase or the jellyfish green fluorescent protein. The
gene constructs were used to transform Black Mexican Sweetcorn (BMS) cells and
Nicotiana tabacum plants. Only the XvPsap1 construct was used to transform Zea
mays plants. The functional properties of each promoter fragment were assessed
by fluorescence quantitative analyses. The transgenic BMS cells were assessed fol-
lowing 72 h salt stress whereas transgenic tobacco and maize were dehydrated for
8 days. Plants or cells transformed with XvPsap1 promoter fragments displayed
high luciferase activity whereas transformants of XvPsap3 demonstrated the lowest
activity in both transgenic BMS cells and tobacco. Quantitative real time PCR
analysis of the BMS cells indicated that the luc transgene was upregulated within
24 h of salt stress for both XvPsap1 (5.9-fold; P < 0.05) and XvPsap2 (1.9-fold;
P < 0.05) whereas with XvPsap3 (1.9-fold; P < 0.05) upregulation occurred after
48 h. A similar trend was observed with dehydrated tobacco, in which optimal
x
Univers
ity of
Cap
e Tow
n

ABSTRACT
expression levels were recorded three days after initiating dehydration. The in-
crease in XvPsap1 activity was significant (7-fold; P < 0.05) in transgenic tobacco
whereas XvPsap2 and XvPsap3 displayed minimal increases of 2.2- and 1.6-fold,
respectively. In dehydrated maize transformed with XvPsap1, a significant peak in
activity was observed on the third day with a 4-fold increase in luciferase expres-
sion. Together, these results suggest that the XvPsap1 promoter is stress-inducible.
Furthermore, it is the most active of the three sequences assessed. It is postulated
that the promoter is involved in early responses to drought as it peaks shortly
after transgenic plants are subjected to lack of water. This XvPsap1 promoter
could therefore find application in the generation of transgenic drought tolerant
plants. Accordingly, and in a separate study, generation of transgenic maize which
are drought tolerant has now been initiated using constructs containing drought
tolerant genes regulated by the XvPsap1 promoter.
xi
Univers
ity of
Cap
e Tow
n
Contents
Dedication iii
Declaration iv
Acknowledgements v
Abbreviations vii
Abstract x
Table of Contents xii
List of figures xx
List of tables xxiii
1 Introduction and Literature review 1
1.1 Introduction . . . . . . . . . . . . . . . . . . . . . . . . . . . . . . . 1
1.2 Production and consumption of maize . . . . . . . . . . . . . . . . . 2
1.3 Constraints to maize production . . . . . . . . . . . . . . . . . . . . 4
xii
Univers
ity of
Cap
e Tow
n
CONTENTS
1.4 Maize improvement strategies . . . . . . . . . . . . . . . . . . . . . 5
1.4.1 Conventional breeding . . . . . . . . . . . . . . . . . . . . . 5
1.4.2 Genetic engineering . . . . . . . . . . . . . . . . . . . . . . . 5
1.5 Transgenic maize . . . . . . . . . . . . . . . . . . . . . . . . . . . . 6
1.6 Plant promoters and gene expression . . . . . . . . . . . . . . . . . 7
1.7 Bioinformatics as a tool for promoter analysis . . . . . . . . . . . . 8
1.8 Plant responses to abiotic stress . . . . . . . . . . . . . . . . . . . . 9
1.9 Resurrection plants . . . . . . . . . . . . . . . . . . . . . . . . . . . 11
1.10 The XvSap1 gene . . . . . . . . . . . . . . . . . . . . . . . . . . . . 12
1.11 Plant transformation by particle bombardment . . . . . . . . . . . . 12
1.12 Agrobacterium-mediated transformation . . . . . . . . . . . . . . . 13
1.13 Plant tissue culture . . . . . . . . . . . . . . . . . . . . . . . . . . . 13
1.14 Somaclonal variation . . . . . . . . . . . . . . . . . . . . . . . . . . 15
1.15 Motivation and aims of the study . . . . . . . . . . . . . . . . . . . 16
2 Bioinformatic analyses of the XvPsap1 promoter and development
of gene constructs for genetic transformation 18
2.1 Summary . . . . . . . . . . . . . . . . . . . . . . . . . . . . . . . . 18
2.2 Introduction . . . . . . . . . . . . . . . . . . . . . . . . . . . . . . . 19
2.3 Materials and methods . . . . . . . . . . . . . . . . . . . . . . . . . 21
2.3.1 Bionformatic analyses of the XvPsap1 promoter . . . . . . . 21
xiii
Univers
ity of
Cap
e Tow
n

CONTENTS
2.3.2 Cloning of XvPsap1, XvPsap2 and XvPsap3 into pT-
F101.1 . . . . . . . . . . . . . . . . . . . . . . . . . . . . . . 21
2.3.3 Transformation of recombinant pTF101.1::XvPsap into com-
petent E. coli . . . . . . . . . . . . . . . . . . . . . . . . . . 22
2.3.4 Cloning of the nos gene into pDrive . . . . . . . . . . . . . . 23
2.3.5 Cloning of the luc gene into pDrive . . . . . . . . . . . . . . 23
2.3.6 Generation of luc::nos constructs . . . . . . . . . . . . . . . 24
2.3.7 Cloning of luc::nos constructs into pTF101.1 binary vector
containing the XvPsap1, XvPsap2 and XvPsap3 promoter
fragments . . . . . . . . . . . . . . . . . . . . . . . . . . . . 24
2.3.8 Transformation of A. tumefaciens with pTF101.1 containing
XvPsap promoters expressing the luc gene . . . . . . . . . . 24
2.3.9 Cloning of expression cassettes into pA53 . . . . . . . . . . . 25
2.3.10 Cloning of the gfp gene into pA53 . . . . . . . . . . . . . . . 25
2.4 Results . . . . . . . . . . . . . . . . . . . . . . . . . . . . . . . . . . 26
2.4.1 Bioiformatic analyses of XvPsap1 for regulatory motifs . . . 26
2.4.2 Recombinant pA53 constructs for particle bombardment . . 28
2.4.3 Recombinant pTF101.1 constructs for Agrobacterium tume-
faciens-mediated transformation . . . . . . . . . . . . . . . . 29
2.5 Discussion . . . . . . . . . . . . . . . . . . . . . . . . . . . . . . . . 30
3 Functional analysis of XvPsap promoter activity in BMS cells 33
3.1 Summary . . . . . . . . . . . . . . . . . . . . . . . . . . . . . . . . 33
xiv
Univers
ity of
Cap
e Tow
n

CONTENTS
3.2 Introduction . . . . . . . . . . . . . . . . . . . . . . . . . . . . . . . 34
3.3 Materials and Methods . . . . . . . . . . . . . . . . . . . . . . . . . 35
3.3.1 BMS cell culture and growth conditions . . . . . . . . . . . . 35
3.3.2 MTT assay . . . . . . . . . . . . . . . . . . . . . . . . . . . 35
3.3.3 Transformation of BMS cells . . . . . . . . . . . . . . . . . . 35
3.3.4 Detection of transgenic BMS cells . . . . . . . . . . . . . . . 36
3.3.5 Southern blot analysis of transgenic BMS cells . . . . . . . . 36
3.3.6 Salt stress treatment . . . . . . . . . . . . . . . . . . . . . . 37
3.3.7 Analysis of luciferase activity in transgenic BMS cells . . . . 38
3.3.8 RNA extraction from transgenic BMS cells . . . . . . . . . . 38
3.3.9 Synthesis of cDNA . . . . . . . . . . . . . . . . . . . . . . . 39
3.3.10 Real-time quantitative PCR . . . . . . . . . . . . . . . . . . 40
3.3.11 Promoter activity data analyses . . . . . . . . . . . . . . . . 41
3.4 Results . . . . . . . . . . . . . . . . . . . . . . . . . . . . . . . . . . 42
3.4.1 Cell viability and salt treatment . . . . . . . . . . . . . . . . 42
3.4.2 Detection of GFP fluorescence . . . . . . . . . . . . . . . . . 43
3.4.3 Transformation and selection of transgenic BMS cells con-
taining the luc gene . . . . . . . . . . . . . . . . . . . . . . . 44
3.4.4 PCR screening of putative transgenic BMS cells . . . . . . . 45
3.4.5 Southern blot analysis of transgenic BMS cells . . . . . . . . 46
3.4.6 Luciferase activity in primary BMS cell transformants . . . . 47
xv
Univers
ity of
Cap
e Tow
n

CONTENTS
3.4.7 Analysis of luc expression in transgenic BMS cells using qRT-
PCR . . . . . . . . . . . . . . . . . . . . . . . . . . . . . . . 49
3.5 Discussion . . . . . . . . . . . . . . . . . . . . . . . . . . . . . . . . 50
4 Functional analysis of XvPsap promoter activity in transgenic
Nicotiana tabacum 54
4.1 Summary . . . . . . . . . . . . . . . . . . . . . . . . . . . . . . . . 54
4.2 Introduction . . . . . . . . . . . . . . . . . . . . . . . . . . . . . . . 55
4.3 Materials and Methods . . . . . . . . . . . . . . . . . . . . . . . . . 56
4.3.1 Source of explants and surface sterilisation . . . . . . . . . . 56
4.3.2 Seed germination and growth conditions . . . . . . . . . . . 56
4.3.3 Transformation of N. tabacum . . . . . . . . . . . . . . . . . 56
4.3.3.1 Gene constructs . . . . . . . . . . . . . . . . . . . . 56
4.3.3.2 Pre-induction of A. tumefaciens . . . . . . . . . . . 57
4.3.3.3 Infection of explants . . . . . . . . . . . . . . . . . 57
4.3.3.4 Co-cultivation of infected explants . . . . . . . . . 57
4.3.3.5 Selection of putative tobacco transformants . . . . 58
4.3.4 Acclimatisation and growth of putative tobacco transformants 58
4.3.5 Germination of putative transgenic tobacco seeds . . . . . . 58
4.3.6 Basta screening of putative tobacco transformants . . . . . . 59
4.3.7 Detection and determination of transgene integration . . . . 59
4.3.8 Dehydration treatment of transgenic tobacco . . . . . . . . . 59
xvi
Univers
ity of
Cap
e Tow
n
CONTENTS
4.3.9 Determination of relative water content . . . . . . . . . . . . 60
4.3.10 Total RNA extraction, purification and cDNA synthesis . . . 60
4.3.11 Analysis of luciferase activity and qRTPCR . . . . . . . . . 60
4.4 Results . . . . . . . . . . . . . . . . . . . . . . . . . . . . . . . . . . 61
4.4.1 Tissue culture, transformation and growth of putative trans-
formants . . . . . . . . . . . . . . . . . . . . . . . . . . . . . 61
4.4.2 Germination of putative transgenic tobacco seeds . . . . . . 62
4.4.3 Basta screening of putative tobacco transformants and PCR
detection . . . . . . . . . . . . . . . . . . . . . . . . . . . . . 64
4.4.4 Southern blot analysis . . . . . . . . . . . . . . . . . . . . . 67
4.4.5 Analyses of luciferase activity in transgenic plants . . . . . 68
4.4.6 Analyses of transgenic plants by qRTPCR . . . . . . . . . . 70
4.5 Discussion . . . . . . . . . . . . . . . . . . . . . . . . . . . . . . . . 71
5 Functional analysis of XvPsap1 promoter activity in transgenic
Zea mays 74
5.1 Summary . . . . . . . . . . . . . . . . . . . . . . . . . . . . . . . . 74
5.2 Introduction . . . . . . . . . . . . . . . . . . . . . . . . . . . . . . . 75
5.3 Materials and Methods . . . . . . . . . . . . . . . . . . . . . . . . . 76
5.3.1 Source of explants and growth conditions . . . . . . . . . . . 76
5.3.2 Surface sterilisation and dissection of immature embryos . . 76
5.3.3 Gene construct . . . . . . . . . . . . . . . . . . . . . . . . . 76
xvii
Univers
ity of
Cap
e Tow
n

CONTENTS
5.3.3.1 Pre-induction of A. tumefaciens . . . . . . . . . . . 77
5.3.3.2 Infection and co-cultivation of immature maize em-
bryos . . . . . . . . . . . . . . . . . . . . . . . . . 77
5.3.4 Resting of the infected embryos . . . . . . . . . . . . . . . . 77
5.3.5 Selection of the putatively transformed calli . . . . . . . . . 78
5.3.6 Acclimatisation and growth of putative maize transformants 78
5.3.7 Basta screening and PCR detection of putative maize trans-
formants . . . . . . . . . . . . . . . . . . . . . . . . . . . . . 79
5.3.8 Southern blot analysis . . . . . . . . . . . . . . . . . . . . . 79
5.3.9 Dehydration treatment . . . . . . . . . . . . . . . . . . . . . 79
5.3.10 Analysis of luciferase activity and determination of RWC . . 79
5.3.11 Total RNA extraction, cDNA synthesis and qRTPCR analysis 80
5.4 Results . . . . . . . . . . . . . . . . . . . . . . . . . . . . . . . . . . 81
5.4.1 Transformation and selection of putative maize transformants 81
5.4.2 Acclimatisation, growth and development of the putative
maize transformants . . . . . . . . . . . . . . . . . . . . . . 81
5.4.3 Basta screening of putative maize transformants and PCR
detection . . . . . . . . . . . . . . . . . . . . . . . . . . . . . 85
5.4.4 Southern blot, luciferase and qRTPCR analyses . . . . . . . 86
5.5 Discussion . . . . . . . . . . . . . . . . . . . . . . . . . . . . . . . . 89
6 General Discussion 92
6.1 Recommendations for future work . . . . . . . . . . . . . . . . . . . 94
xviii
Univers
ity of
Cap
e Tow
n

CONTENTS
References 95
Appendices 121
A General protocols and media 123
A.1 PCR product purification . . . . . . . . . . . . . . . . . . . . . . . 123
A.2 DNA puification from agarose gels . . . . . . . . . . . . . . . . . . . 124
A.3 Plasmid DNA isolation . . . . . . . . . . . . . . . . . . . . . . . . . 124
A.4 Preparation of glycerol stocks . . . . . . . . . . . . . . . . . . . . . 125
A.5 Controlled pollination of maize . . . . . . . . . . . . . . . . . . . . 125
A.6 Embryo dissection . . . . . . . . . . . . . . . . . . . . . . . . . . . . 126
A.7 LB Media . . . . . . . . . . . . . . . . . . . . . . . . . . . . . . . . 126
B Standard protocols, vector maps, primers and PCR cycling con-
ditions, promoter and gene sequences 128
B.1 Standard protocols . . . . . . . . . . . . . . . . . . . . . . . . . . . 128
B.2 Vector maps . . . . . . . . . . . . . . . . . . . . . . . . . . . . . . . 130
B.3 Primer combinations and cycling conditions . . . . . . . . . . . . . 133
B.4 XvPsap promoter and luc, nos, gfp and XvSap1 sequences . . . . . 136
C XvPsap1 Regulatory elements 141
C.1 XvPsap1 regulatory motifs . . . . . . . . . . . . . . . . . . . . . . . 141
xix
Univers
ity of
Cap
e Tow
n

List of Figures
1.1 Cereal crop consumption trends in Asia and Africa during 1997 . . 3
1.2 Schematic outline of plant responses to water deficit . . . . . . . . . 10
2.1 Schematic illustration of recombinant pA53 expression cassettes used
in biolistic gene delivery . . . . . . . . . . . . . . . . . . . . . . . . 28
2.2 Schematic illustration of the T-DNA region of the standard binary
vectors pTF101.1 comprising varying promoter fragments expressing
luc transgene . . . . . . . . . . . . . . . . . . . . . . . . . . . . . . 29
3.1 Graphical representation of the MTT assay of BMS cells under NaCl
and sorbitol treatments . . . . . . . . . . . . . . . . . . . . . . . . . 42
3.2 GFP expression in transgenic BMS cells following 36 h NaCl treatment 43
3.3 Putative BMS transformants 4 weeks post bombardment under bialaphos
selection . . . . . . . . . . . . . . . . . . . . . . . . . . . . . . . . . 44
3.4 PCR screening of transgenic BMS cells for the presence of the luc
and bar transgenes . . . . . . . . . . . . . . . . . . . . . . . . . . . 45
3.5 Probe synthesis using the PCR DIG probe synthesis kit. . . . . . . 46
3.6 Southern blot analysis of transgenic BMS cell lines for the presence
of luc transgene . . . . . . . . . . . . . . . . . . . . . . . . . . . . . 47
xx
Univers
ity of
Cap
e Tow
n
LIST OF FIGURES
3.7 Luciferase activity in transformed BMS cell lines treated for 72 h
with 200 mM NaCl. . . . . . . . . . . . . . . . . . . . . . . . . . . . 48
3.8 Luciferase expression profile curves in transgenic BMS cells using
qRTPCR analysis . . . . . . . . . . . . . . . . . . . . . . . . . . . . 49
4.1 Transformation and tissue culture of N. tabacum . . . . . . . . . . 62
4.2 Germination of transformed N. tabacum seeds . . . . . . . . . . . . 63
4.3 Basta selection of putative N. tabacum tansformants . . . . . . . . 66
4.4 Screening of putative transgenic N. tabacum for the presence of the
luc and bar transgenes. . . . . . . . . . . . . . . . . . . . . . . . . . 67
4.5 Southern blot analysis of transgenic N. tabacum for the presence of
the luc transgene . . . . . . . . . . . . . . . . . . . . . . . . . . . . 68
4.6 Luciferase activity in transgenic N. tabacum under dehydartion stress 69
4.7 Expression profile curves of luc transcripts in transgenic N. tabacum
under dehydration stress using qRTPCR analysis . . . . . . . . . . 70
5.1 Transformation and selection of putative immature zygotic Z. mays
transformants . . . . . . . . . . . . . . . . . . . . . . . . . . . . . . 82
5.2 Acclimatisation, growth and development of putative Z. mays trans-
formants . . . . . . . . . . . . . . . . . . . . . . . . . . . . . . . . . 83
5.3 Germination and basta screening of putative maize transformants. . 85
5.4 Screening of putative transgenic Z. mays for the presence of luc and
bar transgenes by PCR amplification . . . . . . . . . . . . . . . . . 86
5.5 Southern blot analysis of transgenic Z. mays for the presence of the
luc transgene. . . . . . . . . . . . . . . . . . . . . . . . . . . . . . . 87
xxi
Univers
ity of
Cap
e Tow
n

LIST OF FIGURES
5.6 Luciferase activity in transgenic maize plants under dehydration stress. 88
5.7 Expression profile of luc transcripts in transgenic maize under dehy-
dration stress using qRTPCR analysis . . . . . . . . . . . . . . . . . 88
B.1 pTF101.1 vector . . . . . . . . . . . . . . . . . . . . . . . . . . . . . 130
B.2 pDrive Cloning Vector . . . . . . . . . . . . . . . . . . . . . . . . . 131
B.3 pA53 plasmid used for biolistics transformation . . . . . . . . . . . 132
B.4 Nucleotide sequence for promoter XvPsap1 . . . . . . . . . . . . . . 136
B.5 Nucleotide sequence for promoter XvPsap2 . . . . . . . . . . . . . . 137
B.6 Nucleotide sequence for promoter XvPsap3 . . . . . . . . . . . . . . 138
B.7 Nucleotide sequence for luc gene . . . . . . . . . . . . . . . . . . . . 139
B.8 Nucleotide sequence for nos terminator . . . . . . . . . . . . . . . . 139
B.9 Nucleotide sequence for gfp gene . . . . . . . . . . . . . . . . . . . 140
B.10 Nucleotide sequence for XvSap1 gene . . . . . . . . . . . . . . . . . 140
xxii
Univers
ity of
Cap
e Tow
n

List of Tables
1.1 Annual maize consumption per capita in selected countries in the
world . . . . . . . . . . . . . . . . . . . . . . . . . . . . . . . . . . . 4
2.1 A summary of regulatory elements identified in XvPsap1 promoter
using PlantCARE software . . . . . . . . . . . . . . . . . . . . . . . 27
4.1 Transformation efficiency of N. tabacum . . . . . . . . . . . . . . . 65
5.1 Transformation efficiency of Z. mays . . . . . . . . . . . . . . . . . 84
A.1 LB Media . . . . . . . . . . . . . . . . . . . . . . . . . . . . . . . . 127
B.1 PCR reagents and final volumes used in a standard PCR protocol . 128
B.2 Reagents and final volumes used in a standard double digestion re-
action . . . . . . . . . . . . . . . . . . . . . . . . . . . . . . . . . . 129
B.3 Reagents and final volumes used in a standard ligation protocol . . 129
B.4 Standard ligation-reaction mixture using pDrive cloning vector . . . 129
B.5 Primer sequences used for PCR and qRTPCR amplication . . . . . 134
C.1 Regulatory elements identified in XvPsap1 promoter using Plant-
CARE software . . . . . . . . . . . . . . . . . . . . . . . . . . . . . 142
xxiii
Univers
ity of
Cap
e Tow
n

Chapter 1
Introduction and Literaturereview
1.1 Introduction
The world’s food requirements are expected to double by 2025 as a result of the
projected increase in the world’s population from the current 6 billion to about
7.5 billion by 2020 (Rosegrant et al. 2001). This increased global population will
invariably result in increased demand for food, exacerbated by erratic rainfall,
salinity and reduced arable land (Ericksen 2008). In addition, global warming
has resulted in a progressive decline in crop yield due to increased water shortage
(IPCC 2007). Interestingly, about 97.5% of this increase is expected to occur in
today’s developing world where three of every four people live in rural areas and
depend directly or indirectly on agriculture for their livelihoods (Pardey & Wright
2003).
Due to the decrease in yield, the global grain markets are now facing breaking point.
For instance, experts predict that if China’s recent urbanisation trends continue,
and the country imports just 5% more of its grain, the world’s grain export would
be entirely used up (Simelton et al. 2009). The knock-on effect on food supply, and
on prices, to developing nations would be huge. Therefore, scientists and farmers
particularly those in Africa, must now embrace new technologies in order to feed
1
Univers
ity of
Cap
e Tow
n

1.2. PRODUCTION AND CONSUMPTION OF MAIZE
their people (Machuka 2001, Thomson 2002).
Various strategies, including conventional breeding (Edmeades et al. 1999), have
been employed in the past to develop drought tolerant plants capable of increased
productivity in dry environments. However, limited success has been achieved
suggesting the need to complement such activities with genetic transformation. In
the Molecular and Cellular Biology laboratory at the University of Cape Town,
genes conferring abiotic stress tolerance have been isolated and characterized from
the resurrection plant, Xerophyta viscosa (Mundree & Farrant 2000, Mowla et al.
2002, Garwe et al. 2003, Govender 2006). An example of such a gene is XvSap1,
which was observed to confer drought tolerance to transgenic Arabidopis thaliana
and Nicotian tabacum (Garwe et al. 2006).
Success in manipulating these genes may find application in improving tolerance of
higher plants to various abiotic stresses. However, when such genes are constitu-
tively expressed, drought tolerance is usually accompanied with unwanted pheno-
types such as dwarfism (Su et al. 1998, Hsieh et al. 2002a,b). This study sought to
assess the activity of a putative stress-inducible promoter that naturally regulates
the expression of XvSap1 gene in X. viscosa. Furthermore, functional analysis
of the promoter in various transgenic biosystems such as maize suspension cells,
tobacco and maize was also determined.
1.2 Production and consumption of maize
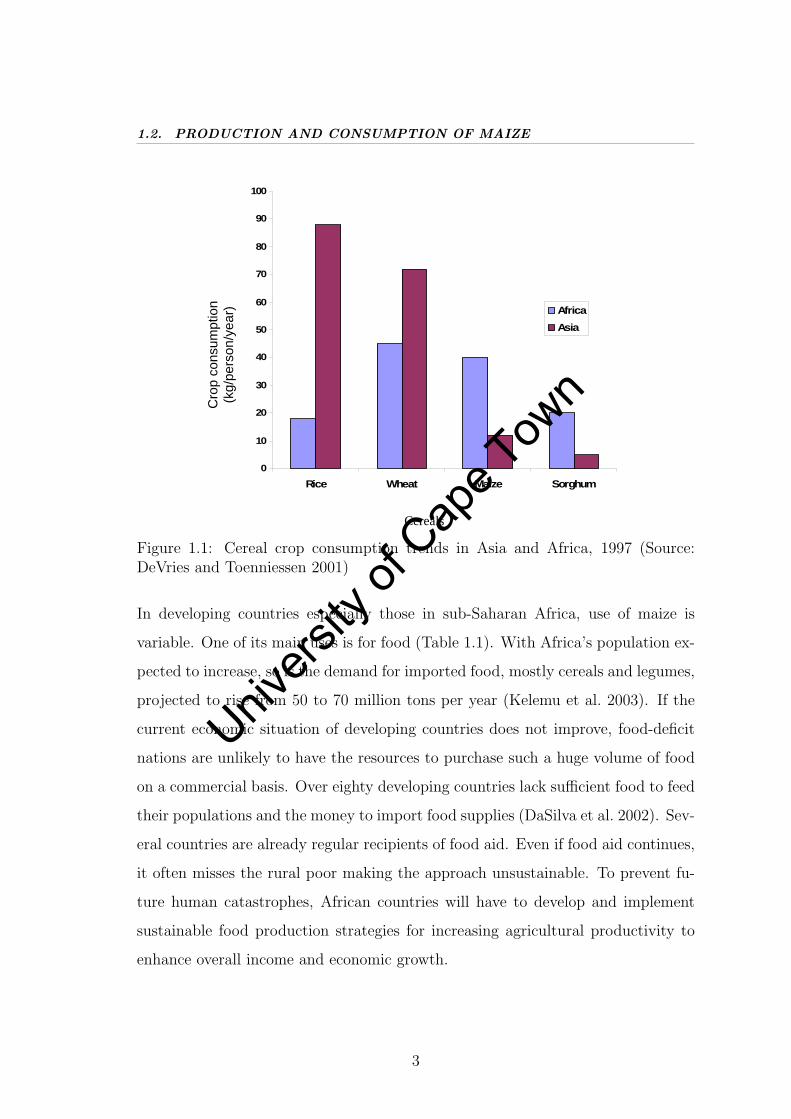
Maize is currently a widely grown cereal crop and is third (Fig. 1.1) after wheat and
rice in area harvested and total production (DeVries & Toenniessen 2001). Globally,
21 % of total grain production is consumed as food with developing countries taking
the greater percentage. Industrialised countries dominate the production of maize
because production is generally concentrated in zones of abundant rainfall and
fertile soils (Morris 1998) and the use of many inputs and technology is extensive
(Pollak & White 1995).
2
Univers
ity of
Cap
e Tow
n
1.2. PRODUCTION AND CONSUMPTION OF MAIZE
Cro
p co
nsum
ptio
n
(kg/
pers
on/y
ear)
Cereals
0
10
20
30
40
50
60
70
80
90
100
Rice Wheat Maize Sorghum
AfricaAsia
Figure 1.1: Cereal crop consumption trends in Asia and Africa, 1997 (Source:DeVries and Toenniessen 2001)
In developing countries especially those in sub-Saharan Africa, use of maize is
variable. One of its main uses is for food (Table 1.1). With Africa’s population ex-
pected to increase, so is the demand for imported food, mostly cereals and legumes,
projected to rise from 50 to 70 million tons per year (Kelemu et al. 2003). If the
current economic situation of developing countries does not improve, food-deficit
nations are unlikely to have the resources to purchase such a huge volume of food
on a commercial basis. Over eighty developing countries lack sufficient food to feed
their populations and the money to import food supplies (DaSilva et al. 2002). Sev-
eral countries are already regular recipients of food aid. Even if food aid continues,
it often misses the rural poor making the approach unsustainable. To prevent fu-
ture human catastrophes, African countries will have to develop and implement
sustainable food production strategies for increasing agricultural productivity to
enhance overall income and economic growth.
3
Univers
ity of
Cap
e Tow
n

1.3. CONSTRAINTS TO MAIZE PRODUCTION
Table 1.1: Annual maize consumption per capita in selected countries in the world(Source: Morris 1998)
Country Annual consumption of maize
per capita (kg)
Malawi 137
Mexico 127
Zambia 113
Guatemala 103
Honduras 98
South Africa 94
El Salvador 93
Kenya 93
Zimbabwe 89
Lesotho 87
Venezuela 68
Nicaragua 56
1.3 Constraints to maize production
The declining trend in food productivity has been largely attributed to both biotic
(Ajanga & Hillocks 2000) and abiotic constraints to crop production (Wang et al.
2003, Lea et al. 2004). Among the abiotic stresses, drought or water stress is
reported to have adverse effects on crop yield resulting in average annual yield
losses estimated at 17% in the tropics although values as high as 60% have been
documented in individual seasons in regions such as South Africa (Sanchez et al.
2006). This yield loss is exacerbated by the fact that the most sensitive phases
of crop growth to water deficit are during crop establishment and flowering (Bray
4
Univers
ity of
Cap
e Tow
n

1.4. MAIZE IMPROVEMENT STRATEGIES
1997, Barnabas et al. 2008). Agriculture accounts for at least 70% of the world’s
total water usage and about 18% of the global farmland is irrigated with up to
46% of the global food supply produced on this land (Inocencio et al. 2003). Other
constraints to maize productivity include environmental degradation, soil nutrient
depletion, low fertilizer inputs, inadequate food processing amenities, poor roads
to markets, and general lack of information to make science-based decisions that
underlie farming methodologies and systems (Machuka 2001).
1.4 Maize improvement strategies
1.4.1 Conventional breeding
Breeding involves improvement through a series of recurrent selection procedures
aimed at maximizing percentages of favourable alleles at each locus of importance
in a given environment (Kling & Edmeades 1997, Lamkey 2002). However, con-
ventional breeding has limitations that impede its sole adoption since it is time
consuming and laborious, difficult to modify single traits and relies only on exist-
ing genetic variability (Holmberg & Bulow 1998, Zhang et al. 2000). Thus other
complementary approaches such as genetic transformation are now being explored.
1.4.2 Genetic engineering
Genetic transformation can now be used as a relatively fast and precise means of
achieving stress tolerance in various crops including maize. Unlike conventional
breeding, advances in genetic engineering has enabled exchange of genes between
sexually incompatible species thus providing a wider gene pool for manipulation.
Furthermore, the ability to transfer single, specific genes by genetic engineering
allows for precise transfer of minimum DNA necessary for the desired trait to be
obtained. This reduces chances for linkage drag which is associated with traditional
breeding in which genetically linked, undesired genes are also transferred. More-
5
Univers
ity of
Cap
e Tow
n
1.5. TRANSGENIC MAIZE
over, genetic engineering enables the transfer of new genes directly into existing
plant lines, thereby minimizing tedious time-consuming plant breeding cycles, in
which many generations are required in order to recover specific lines.
1.5 Transgenic maize
First generation transgenic crops were mainly engineered against biotic constraints
to crop productivity with little efforts directed on abiotic stresses. As a result,
transgenic maize resistant to insect pests and herbicide were among the first crops
to be reported (Pilcher et al. 1997, Lynch et al. 1999). Transgenic maize with
elevated 10kd zein and methionine have also been obtained (Anthony et al. 1997).
In addition, antifungal proteins, such as chitinases and beta-1, 3-glucanases, have
been genetically engineered to attempt expression in the maize kernels with the
aim to prevent the growth of Aspergillus flavus and the production of aflatoxins
(Wu et al. 1994, Wan et al. 1995).
Currently, several studies are being undertaken to address drought stress. Most
recently, Monsanto in collaboration with BASF have developed transgenic drought
tolerant maize currently undergoing field trials in selected African countries under
the water efficient maize for Africa (WEMA) programme (www.aatf.africa.org).
While such efforts are laudable, the quest for developing drought tolerant maize
should still continue given the polygenic nature of drought stress. The low re-
search output in developing transgenic drought tolerant maize could partially be
attributed to insufficient availability of desired genes, appropriate promoters and
reliable gene delivery systems. However, since genes conferring drought toler-
ance have been isolated and characterised in the past especially from X. viscosa
(Mundree & Farrant 2000, Mowla et al. 2002, Garwe et al. 2003), the challenge is
how best these genes can be delivered into the preferred host and be upregulated
only during stress.
6
Univers
ity of
Cap
e Tow
n

1.6. PLANT PROMOTERS AND GENE EXPRESSION
1.6 Plant promoters and gene expression
The interaction between transcription factors and cis-acting regulatory sequences
present in plant promoters is a key step involved in the regulation of plant gene
expression (Yang et al. 2000). To express the coding regions of given genes in trans-
genic plants, a promoter is required upstream (Galun & Breiman 1996). Genetic
transformation commonly involves two genes. One is the transgene that should
be integrated in the plant genome and expressed in the transgenic plant and the
other is a selectable gene, such as rendering a plant resistant to a herbicide. Each
of the two transgenes should thus have its own promoter and the two promoters
may differ. For specific purposes the transgene that serves as a reporter gene may
not be preceded by any promoter. The rationale in such cases is that when the
coding sequence of the reporter gene with its terminator region is integrated in the
plant genome, downstream of a promoter of this genome, the reporter gene will
be expressed and the expression regulated by the host-plant’s promoter (Galun &
Breiman 1996).
Promoters can now be selected that allow either constitutive gene expression or
limit expression to specific cell types or in response to specific environmental stim-
uli. Under constitutive gene expression there is gene expression all the time and
usually at high levels. Examples of constitutive promoters include the Cauliflower
mosaic virus promoter for 35S RNA and the maize ubiquitin promoter. It has been
reported that constitutive expression of proteins involved in abiotic stress resistance
hampers the normal growth of transgenic plants resulting in smaller phenotypes
as compared to wild type plants (Su et al. 1998). This unwanted dwarfing of the
transformed plants may be due to the expression of a protein in amounts more
than normal and at stages when it is not needed thus placing a metabolic burden
on the plant (Liu et al. 1998).
Stress-induced promoters have been reported to have poor levels of expression when
compared to constitutive promoters (Reynolds 1999). It is therefore important
7
Univers
ity of
Cap
e Tow
n

1.7. BIOINFORMATICS AS A TOOL FOR PROMOTER ANALYSIS
that fine manipulations are carried out in such a way that the strength of stress-
responsive promoters is increased without any negative impact on their induction
patterns. An example of a stress-inducible promoter that has widely been reported
is the rd29A promoter from Arabidosis (Kasuga et al. 2004, Shiqing et al. 2005,
Pino et al. 2007). Other stress-inducible promoters such as ABRC from barley
(Lee et al. 2003) and SWPA2 from sweetpotato (Kim et al. 2003) have also been
reported.
1.7 Bioinformatics as a tool for promoter analy-
sis
With recent advances in computational tools, several software tools have been de-
veloped, either for deposition and organisation of biological data and/or for the
prediction of putative functions or the structure of complex molecules specifically
for plants (Venter & Botha 2004). Numerous functional elements have been iden-
tified as promoter constituents for precise and regulated transcriptional initiation
such as TATA box, Initiator (Inr) motif, Downstream Promoter Element (DPE,
found in Drosophila), TFIIB-Recognition Element (BRE), and cis-regulatory ele-
ments (Carey & Smale 2001, Butler & Kadonaga 2002, Smale & Kadonaga 2003).
Moreover, transcription start sites (TSS) in plant promoters have been reported
to have a CG-compositional strand bias, or GC-skew, where C is more frequently
observed in the (+) strand than G (Tatarinova et al. 2003, Fujimori et al. 2005).
The major databases for the identification of TF-binding sites and cis-elements in
plant promoters include, PLACE (Higo et al. 1999), PlantCARE (Rombauts et al.
1999, Lescot et al. 2002), TRANSFAC (Hehl & Wingender 2001), AGRIS (Davuluri
et al. 2003) and AthaMap (Steffens et al. 2004, Bulow et al. 2006). According to
Venture and Botha (2004), the important promoter detection methods, based on
maximum likelihood estimation, are Gibbs-sampling (Lawrence et al. 1993) and
expectation maximisation (MEME) (Bailey & Elkan 1995). Gibbs-sampling and
8
Univers
ity of
Cap
e Tow
n

1.8. PLANT RESPONSES TO ABIOTIC STRESS
MEME are known as probabilistic methods that perform a local optimisation on
motifs in sequences to be unknown (hidden motif in noisy background sequence)
in order to identify the most conserved sequence (Ohler & Niemann 2001).
Other methods used for the identification of transcriptional regulatory elements
include AlignACE (together with CompareACE and ScanACE) based on a Gibbs-
sampling algorithm (Hughes et al. 2000), PROMO using sequence information from
the database TRANSFAC (Messeguer et al. 2002) and transcription-factor-centric
clustering (TFCC) designed to link regulatory promoter elements with the binding
TFs in silico (Zhu et al. 2002). Although most promoter studies have obtained
certain success, the current general knowledge of promoters is still insufficient (Bajic
et al. 2004) suggesting the need for more studies.
1.8 Plant responses to abiotic stress
The understanding of the biochemical and molecular basis by which plants respond
to abiotic stresses is pivotal in the application of various crop improvement strate-
gies including genetic engineering (Ingram & Bartels 1996). Abiotic stress induces
a series of morphological, physiological, biochemical and molecular changes that
adversely affect plant growth and productivity (Wang et al. 2001). In response to
such stresses, plants exhibit a wide range of defense responses at the molecular,
cellular and whole plant levels (Greenway & Munns 1980, Zhu et al. 1997, Yeo
1998, Bohnert et al. 1999, Hasegawa et al. 2000, Lin et al. 2008).
Various genes are induced in response to drought at the transcriptional level with
their gene products thought to function in response to drought resulting in drought
tolerance (Mundree et al. 2002). Studies of expression and functions of stress-
inducible genes at molecular level have revealed complex mechanisms (Fig. 1.2)
involved in gene expression and signal transduction in response to drought stress
(Bray 1993).
9
Univers
ity of
Cap
e Tow
n

1.8. PLANT RESPONSES TO ABIOTIC STRESS
In general, plant responses are of three kinds: (i) maintenance of homeostasis; (ii)
detoxification of harmful elements; and (iii) recovery of growth. All the mechanisms
are probably employed for desiccation-tolerance with individual plants utilising one
strategy more than the others (Oliver & Bewley 1997, Xiong & Zhu 2002). The
duration and severity of the response is a function of the plant species, the stage
of its growth and the type of stress.
Transcriptional Control transcription factors; high mobility group proteins;
chromatin structure; DNA methylation; cell cycle control
Metabolite balance ATP/ADP ratio;
photosystem reduction; cytosol-organelle
transport; one-carbon transfer
Osmolyte Biosynthesis proline; polyols;
quaternary amines; sugars; ions; polyamines
mRNA stability RNA-BP; RNases; ribosome factors;
control of translation
Protein turnover ubiquitin; proteases and inhibitors; chaperones;
dehydrins; LEA proteins; protein modifications
Signalling pathways changes in hormone
sensitivity; acceleration of ontogeny
Ion sequestration cell-specific
compartmentation; plasma membrane and
tonoplast Na+/H+ antiporters
Membrane modification FA saturation level; membrane turnover;
PM-cell wall adhesion
Ion uptake ATPases; potassium
channels and transporters; calcium channels
Ion partitioning tissue-specific sequestration, transport and
storage/excretion
WATER DEFICIT
Figure 1.2: Schematic outline of plant responses to water deficit (Source: Bohnertet al. 1999)
.
10
Univers
ity of
Cap
e Tow
n
1.9. RESURRECTION PLANTS
1.9 Resurrection plants
Resurrection plants are angiosperms that possess the unique ability to withstand
desiccation of their vegetative tissues and to revive from air dry state (Gaff 1987).
These poikilohydrous plants can experience different rates of desiccation depending
upon the water status of the environment and can recover uninjured from complete
dryness within 80 hours (Sherwin & Farrant 1998, Mundree et al. 2002). Resurrec-
tion plants are widely distributed in all continents except Antarctica. According
to Gaff (1987), they are mainly concentrated in arid climates such as South Africa,
eastern South America and Western Australia, while only a few species have been
found in Europe in the Balkan Mountains (Stefanov et al. 1992, Alpert 2005, 2006).
Generally, about 330 species of angiosperms have been found to survive desiccation
(Gaff 1987, Porembski & Barthlott 2000) but no resurrection gymnosperms have
been reported (Hartung et al. 1998). There are both monocotyledonous resurrec-
tion plants such as X. viscosa and Sporobolus stapfianus and dicotyledonous species
such as Myrothamnus flabellifolia, Craterostigma plantagineum and Chamaegigas
intrepidus.
Despite their broad geographical distribution, the ecological range for resurrection
plants is narrow. Usually they are found in habitats subjected to lengthy periods of
drought, where rainfall is extremely sporadic, particularly on rock outcrops below
2000 m in tropical and subtropical areas, and to a lesser extent in temperate zones
(Porembski & Barthlott 2000). Consequently, resurrection plants have evolved
structures and mechanisms to allow survival under extreme conditions. As a result,
these plants are a rich source of unique genes or stress-inducible promoters that can
be used to improve stress tolerance in susceptible crop plants (Ramajulu & Bartels
2002). Accordingly, several genes postulated to play a role in desiccation tolerance
have been isolated from X. viscosa (Mundree & Farrant 2000, Mowla et al. 2002,
Garwe et al. 2003, Govender 2006).
11
Univers
ity of
Cap
e Tow
n

1.10. THE XVSAP1 GENE
1.10 The XvSap1 gene
The XvSap1 gene isolated and characterised by Garwe et al. (2003), is one of the
genes postulated to play a role in desiccation tolerance in X. viscosa. Analysis of
the cDNA sequence indicated a highly hydrophobic protein with six transmembrane
regions. The deduced amino acid sequence showed a 49% identity to WCOR413,
a low temperature-regulated protein from wheat and a 53% identity with another
cold-associated protein in rice. The protein also showed between 25% to 56%
identity to WCOR413-like proteins from Arabidopsis.
The XvSap1 gene is, therefore, postulated to code for an integral membrane protein
which is expressed in response to drought stress. Further studies revealed that the
XvSap1 gene could be a G protein-coupled receptor associated with signal trans-
duction in osmotic stress (Iyer et al. 2007). Furthermore, transgenic A. thaliana
plants transformed with the XvSap1 gene demonstrated improved drought toler-
ance (Garwe et al. 2006). The promoter that controls the expression of the XvSap1
gene in X. viscosa is of interest to the present study.
1.11 Plant transformation by particle bombard-
ment
Biolistics is one of the two major DNA delivery techniques that has gained wide
application in plant transformation. Transformation and recovery of fertile trans-
genic plants via particle bombardment was first reported in the late 20th century
(Gordon-Kamm et al. 1990). Biolistic method involves fixing a plasmid or linearised
DNA containing gene of interest onto tungsten or gold particles (micro-carriers).
The micro-carriers are delivered to host cells at high speed so as to penetrate the
nucleus of the plant cell. However, due to problems associated with biolistics such
as high copy numbers and inability to transfer large DNA segments, this tech-
nology is losing its popularity paving the way for the most recent and promising
12
Univers
ity of
Cap
e Tow
n

1.12. AGROBACTERIUM-MEDIATED TRANSFORMATION
technology of Agrobacterium-mediated transformation.
1.12 Agrobacterium-mediated transformation
Agrobacterium-mediated transformation uses a bacterial plasmid as a vector (Ishida
et al. 1996, Frame et al. 2002). It results in a greater proportion of stable, low copy
number transgenic events than does the biolistic gun (Ishida et al. 1996, Zhao et al.
1998), offers the possibility of transferring larger DNA segments into recipient cells
(Hamilton et al. 1996), is highly efficient and possesses broad host range.
To harness Agrobacterium as a transgene vector, scientists have removed the tumor-
inducing section of T-DNA, while retaining the T-DNA border regions and the vir
genes. During transformation, a modified T-DNA vector is constructed in which the
desired DNA fragment is inserted between the T-DNA border regions of Agrobac-
terium. This vector is transferred into Agrobacterium and virulence gene products
actively recognise, excise, transport and integrate the T-DNA region into the host
plant genome (Hooykaas & Schilperoort 1992). Using selectable markers, putative
transformants are usually selected under stringent tissue culture conditions.
1.13 Plant tissue culture
Modern plant biotechnology has provided novel means for crop improvement through
the integration and expression of defined foreign genes in plant cells, which can then
be grown in vitro to regenerate whole plants. However, a basic prerequisite for the
production of genetically transformed plants is efficient regeneration protocol that
generates normal and fertile plants from single cells (Oduor et al. 2006).
The first somatic embryos in maize tissue culture were produced by Green &
Phillips (1975). Reports of fertile maize plants regenerated from protoplasts (Shillito
et al. 1989) were closely followed by the production of transgenic, fertile maize from
13
Univers
ity of
Cap
e Tow
n

1.13. PLANT TISSUE CULTURE
transformed suspension cell cultures of the hybrid A188 X B73 line (Gordon-Kamm
et al. 1990). Maize cell lines derived from transformation competent sources such as
immature embryos are heterogeneous for cells with differing embryogenic potential
(Che et al. 2006).
Induction of embryogenic callus is genotype-specific in many plant species, includ-
ing maize. Most maize elite lines remain inaccessible to improvement using stan-
dard transformation techniques either because of failure to produce embryogenic
callus from transformation competent tissues, or inability to regenerate efficiently
after embryogenic callus induction. Friable (Type II) callus (Armstrong & Green
1985) was found to be highly embryogenic and readily produced plants.
Previously, regeneration of gramineous species proved to be rather difficult because
of their extreme recalcitrance to tissue culture manipulations in vitro (Zhang et al.
2002). The regeneration ability of any plant is influenced by different factors. The
type of explant is considered one of the main factors that has attracted the concern
of many investigators (El-Itriby et al. 2003). In addition, genetic background or
the genotype of the explants has also been found to influence regeneration poten-
tiality. Reports indicating the effect of the genotype and the role of nuclear genes
in controlling the initiation of somatic embryos and regeneration in maize have
been documented (Tomes & Smith 1985, Hodges et al. 1986, Willman et al. 1989,
Bohorova et al. 1995). Moreover, regenerability is influenced, to a great extent, by
the media composition (Armstrong & Green 1985, Vain et al. 1989a,b, Songstad
et al. 1991, Bohorova et al. 1995, Carvalho et al. 1997).
Immature embryos have been the most widely used explant in many cereals, includ-
ing maize (Green & Phillips 1975, Armstrong & Green 1985, Hodges et al. 1986,
Shillito et al. 1989, Frame et al. 2002, El-Itriby et al. 2003, Oduor et al. 2006).
Successful plant regeneration has also been reported from calli initiated from an-
thers (Ting et al. 1981), glumes (Suprasanna et al. 1986), immature inflorescences
(Pareddy & Petolino 1990), immature tassels (Songstad et al. 1992, Rhodes et al.
14
Univers
ity of
Cap
e Tow
n

1.14. SOMACLONAL VARIATION
1986), leaf segments (Ray & Ghosh 1990, Conger et al. 1987), seedling segments
(Santos et al. 1984), shoot tips (O’Connor-Sanchez et al. 2002, Zhong et al. 1996),
shoot apical meristems (Zhang et al. 2002) and mature embryos (Wang 1987, Rueb
et al. 1994, Ozgen et al. 1998, Akula et al. 1999, Ward & Jordan 2001, Huang &
Wei 2004).
1.14 Somaclonal variation
When regenerated plants are potted from cultures and grown up under standard-
ised environmental conditions, the regenerants can exhibit transient, non-genetic or
epigenetic changes as well as heritable, genetic variation (Karp 1995). Epigenetic
changes appear to be a direct effect of the culture process, being physiological in
origin and perhaps resulting from effects of the growth regulators in the medium
(Fluminhan et al. 1996). Such epigenetic changes are of no value for crop improve-
ment, as they are not expressed in sexual progeny.
However, studies have shown that changes in chromosome number and structure
can occur in plants regenerated from tissue culture and that chromosome instability
can be induced by media components, culture age, explant tissue and even by
plant genotype (Peschke & Phillips 1992, Jain 2001). Chromosome variation in
regenerable maize callus cultures have been investigated in few studies and only
changes in chromosome number have been reported (Fluminhan et al. 1996).
The fact that somaclonal variation can occur in high frequency in regenerants, and
that heritable single gene changes can occur in nuclear and organelle genomes, is
potentially attractive to breeders. The simplest approach is to introduce the best
available varieties into culture and then select for those somaclones that display
incremental improvements as a result of somaclonal variation. The aim would not
only be to retain all the favourable qualities of the variety, but also to add an
additional trait such as drought tolerance, disease resistance or herbicide tolerance
(Lindsey & Jones 1998).
15
Univers
ity of
Cap
e Tow
n

1.15. MOTIVATION AND AIMS OF THE STUDY
1.15 Motivation and aims of the study
Plant genetic engineering has contributed substantially to the understanding of
gene regulation and plant development in the generation of transgenic organisms
for widespread usage in agriculture. As the application of genetically engineered
plants has widened, so has the need to develop methods to fine-tune control of
transgene expression. The availability of broad spectrum promoters that differ in
the ability to regulate the temporal and spatial expression patterns of the trans-
gene can significantly increase the successful application of transgenic technology
(Potenza et al. 2004).
Currently, majority of genetically modified plants against various abiotic stresses
have their transgenes expressed constitutively (Holmberg & Bulow 1998, Frame
et al. 2000, 2002, Garwe et al. 2006). This poses the risk of overproduction of
such proteins, which usually hamper the normal growth of plants and may result in
dwarfism (Su et al. 1998, Lee et al. 2003). Therefore, successful genetic modification
of crops against drought stress does not only require the skillful transfer of drought
tolerant genes but also that the expression of such transgenes be controlled by
stress-inducible promoters (Su et al. 1998, Kasuga et al. 1999, Lee et al. 2003,
Schunmann et al. 2004).
The objectives of the present study were four-fold. The first facet aimed at deter-
mining the novelty of the full length XvPsap1 promoter sequence, predicting the
regulatory elements present in the XvPsap1 promoter as well as developing sin-
gle gene constructs driven by either full length promoter (XvPsap1) or truncated
fragments (XvPsap2 or XvPsap3).
However, such computational predictions of promoter activity need to be validated
by transformation of the XvPsap promoter fragments into various plant systems in
order to verify the actual differential activity of the promoter in biological systems.
As a result, the second aspect of this study focused on determining the most active
16
Univers
ity of
Cap
e Tow
n

1.15. MOTIVATION AND AIMS OF THE STUDY
promoter fragment in a model transgenic monocot system, namely, Black Mexican
Sweetcorn (BMS) cells.
To assess the potential application of XvPsap promoters in improving dicots against
drought stress, the third aspect of the present study was to determine whether the
XvPsap promoter fragments are functional in N. tabacum as well as determining
the most active promoter fragment.
Since the present study was part of the larger project that seeks to genetically
engineer maize for drought tolerance, the fourth aspect of this study aimed at
assessing the activity of the most active promoter fragment in BMS and tobacco
in whole maize.
17
Univers
ity of
Cap
e Tow
n

Chapter 2
Bioinformatic analyses of theXvPsap1 promoter anddevelopment of gene constructsfor genetic transformation
2.1 Summary
A non-coding sequence, XvPsap1 (2083 bp) isolated from the resurrection plant,
X. viscosa, was screened in silico for similarity with existing plant promoters. No
significant similarity with any known plant promoter was identified. The Plant-
CARE computational tool (Lescot et al. 2002) predicted various cis-acting ele-
ments including, but not limited to, those involved in drought stress, heat stress,
abscisic acid, jasmonic acid, light and low temperature responsiveness. In addition,
other regulatory elements commonly found in both promoter and enhancer regions
were identified. These included meristem-specific activation, endosperm expression,
auxin-responsive and circadian control elements. Two 5′ promoter deletions were
generated resulting in truncated promoter fragments designated XvPsap2 (1577
bp) and XvPsap3 (1127 bp) relative to the translation start site. The full length
promoter (XvPsap1) and truncated fragments (XvPsap2 and XvPsap3) were each
cloned upstream of either the luciferase (luc) or green florescent protein (gfp ) re-
18
Univers
ity of
Cap
e Tow
n

2.2. INTRODUCTION
porter genes. The nopaline synthase (nos) terminator was inserted downstream of
each of the reporter genes. Subsequently, the promoter::luc/gfp::nos cassette was
cloned into either the binary expression vector, pTF101.1 or the pA53 plasmid. A
total of nine gene constructs were synthesised.
2.2 Introduction
Plant biotechnology expanded rapidly in the 1980s following the production of novel
chimeric genes (Bevan et al. 1983, Fraley et al. 1983, Herrera-Estrella et al. 1983),
transformation vectors (Hoekema et al. 1983, Bevan 1984), DNA delivery systems
(Hernalsteens et al. 1980, Draper et al. 1982, Krens et al. 1982, Fromm et al.
1985, Sanford et al. 1987), combined with plant regeneration systems (Zambryski
et al. 1983, Paszkowski et al. 1984, Shimamoto et al. 1989, Gordon-Kamm et al.
1990). This progress has made it possible to improve organisms with respect to
agronomic or industrial traits through genetic engineering (Kishore & Shewmaker
1999). Numerous studies are now focussed on developing transgenic crops tolerant
to abiotic stress (Garwe et al. 2006, Cong et al. 2008, Lal et al. 2008, Singla-Pareek
et al. 2008, Takumi et al. 2008).
Sustainable development of transgenic stress-tolerant plants requires that the intro-
duced gene(s) be regulated by a stress-inducible promoter to minimize undesirable
phenotypes due to over expression (Su et al. 1998).
Previously, Garwe et al. (2003) isolated and characterised the XvSap1 gene from
X. viscosa. The gene was identified to confer tolerance to dehydration, high tem-
peratures and salinity in model plants (Garwe et al. 2006). Recently, Iyer et al.
(2007) contended that the XvSap1 gene could be a G protein-coupled receptor
associated with signal transduction in osmotic stress. In order to identify the pro-
moter that naturally regulates the expression of the XvSap1 gene in X. viscosa, a
2083 bp sequence, designated XvPsap1, was isolated upstream of the gene (Ingle,
pers. comm.).
19
Univers
ity of
Cap
e Tow
n

2.2. INTRODUCTION
The bioinformatic analyses of the XvPsap1 promoter was undertaken in this study.
To determine the shortest functional length of the promoter, 5′ promoter deletion
analyses was performed, resulting in two truncated promoter fragments designated
XvPsap2 (1577 bp) and XvPsap3 (1127 bp) relative to the translation start site.
The subsequent cloning of these promoter fragments upstream of either the luc
or gfp reporter gene is described. The cloning of the nos terminator downstream
of each of the reporter genes as well as the cloning of the promoter::luc/gfp::nos
expression cassettes into either the pA53 or the binary expression vector, pTF101.1
is also described.
The objectives were three-fold: (i) to verify the novelty of the full length XvPsap1
promoter sequence using comparative genomics; (ii) to predict the regulatory ele-
ments present in the XvPsap1 promoter using genome browers; and (iii) to develop
single gene constructs driven by either XvPsap1, XvPsap2 or XvPsap3.
20
Univers
ity of
Cap
e Tow
n

2.3. MATERIALS AND METHODS
2.3 Materials and methods
2.3.1 Bionformatic analyses of the XvPsap1 promoter
Following sequencing, the level of sequence homology between XvPsap1 and ex-
isting plant promoters was assessed by searching the National Center for Biotech-
nology Information (NCBI) database using the BLAST algorithm (Altschul et al.
1990). Thereafter, the promoter sequence was analyzed for the presence of regula-
tory elements using the PlantCARE software (Lescot et al. 2002).
2.3.2 Cloning of XvPsap1, XvPsap2 and XvPsap3 into pT-F101.1
The XvPsap1 promoter, which had been previously cloned into pBluescript was
amplified using a forward primer designated SAP-prom-EcoRI-F1 (Appendix Table
B.5) and a reverse primer designated SAP-prom-BamHI-R2 (Appendix Table B.5).
The reverse primer was used in the amplification of all three promoter fragments as
they varied only in the 5′ ends. To amplify XvPsap2 and Xvpsap3, forward primers
designated SAP-prom-EcoRI-F2 and SAP-prom-EcoRI-F3 (Appendix Table B.5)
were used, respectively.
The amplification was carried out with the following cycling conditions: 94◦C for 5
min; 35 cycles of 94◦C for 60 s; 58◦C for 30 s, and 72◦C for 90 s; and a final extension
step of 72◦C for 5 min. The PCR reaction was performed using a GeneAmp
9700 thermal cycler (Applied Biosystems, Singapore). For each amplification, 25
µl reaction volumes were set up with component concentrations as described in
Appendix Table B.1. The Taq DNA polymerase, PCR buffer and MgCl2 were
supplied by New England Biolabs (USA).
Amplimers generated by PCR were electrophoresed on a 1% agarose gel. The
amplimers were thereafter purified using the EZ-10 Spin Column PCR product
purification Kit (Bio Basic, Canada) according to the manufacturer’s instructions
21
Univers
ity of
Cap
e Tow
n

2.3. MATERIALS AND METHODS
(Appendix A.1). The purified amplimers were digested using EcoRI and BamHI
in a 20 µl reaction volume (Appendix Table B.2) and incubated overnight at 37◦C
(Sambrook & Russell 2001). Alternatively, and following the manufacturer’s in-
structions (Appendix Table B.4), the amplimers were initially cloned into pDrive
(Qiagen, USA; Appendix Fig. B.2) prior to performing the restriction digest.
The digested amplimers were electrophoresed on a 1% agarose gel. The DNA frag-
ments of the correct size were excised and purified using the EZ-10 Spin Column
DNA Gel Extraction Kit (Bio Basic, Canada) according to the manufacturer’s in-
structions (Appendix A.2). Similarly, pTF101.1 (Appendix Fig. B.1) was digested
with EcoRI and BamHI, electrophoresed, excised and purified.
The purified digested amplimers and linearised pTF101.1 were ligated using stan-
dard ligation conditions (Appendix Table B.3). The T4 DNA ligase and 10X
ligation buffer were supplied by NEB (USA). The reaction volume was made up to
10 µl, mixed well and incubated overnight at 4◦C. The individual ligation mixtures
of recombinant pTF101.1 containing either XvPsap1, XvPsap2 or XvPsap3 were
transformed into competent E. coli cells.
2.3.3 Transformation of recombinant pTF101.1::XvPsap intocompetent E. coli
The recombinant pTF101.1 plasmids (pTF101.1::XvPsap1, pTF101.1::XvPs-
ap2, and pTF101.1::XvPsap3) were transformed into competent E. coli cells. The
competent cells were allowed to thaw on ice. Ten microlitres of ligation mix was
added to the competent cells and mixed gently. The transformation mix was in-
cubated for 10 min on ice. The cells were thereafter heat shocked by incubation
for 5 min at 37◦C followed immediately by incubation for 2 min on ice. Eight hun-
dred microlitres of LB broth (Appendix Table A.7) was added to the transformed
cells and incubated for 50 min at 37◦C with vigorous shaking. Fifty microlitres
of the transformation mix was plated onto LB agar (Appendix Table A.7) plates
22
Univers
ity of
Cap
e Tow
n

2.3. MATERIALS AND METHODS
supplemented with spectinomycin (100 µg/ml) and incubated overnight at 37◦C.
Colony PCR was performed to screen for positive clones using promoter specific
primers (SAP-prom-BamHI-R2, SAP-prom-EcoRI-F1,
SAP-prom-EcoRI-F2 and SAP-prom-EcoRI-F3). The nucleotide sequence of the
cloned XvPsap promoter fragments in pTF101.1 were confirmed by sequencing.
Colonies confirmed by sequencing to contain the correct recombinant plasmids
were treated with glycerol and stored at −80◦C (Appendix A.4).
2.3.4 Cloning of the nos gene into pDrive
The nos terminator (300 bp; Appendix Fig. B.8) was amplified using gene specific
primers nos-speI XF2 and nos-hindIII XR1 (Appendix Table B.5). The amplifi-
cation was carried out with the following cycling conditions: 94◦C for 5 min; 35
cycles of 94◦C for 30 s; 57◦C for 30 s, and 72◦C for 60 s; and a final extension
step of 72◦C for 5 min. The nos amplimer was purified and ligated into pDrive
(standard protocol, see section 2.3.2).
The recombinant pDrive plasmid (pDrive::nos) was transformed into competent E.
coli cells (standard protocol, see section 2.3.3). The transformed cells were plated
on LB agar supplemented with ampicillin (100 µg/ml), kanamycin (50 µg/ml), X-
gal and 0.2 mM of isopropyl-β-D-thiogalactoside. Colony PCR was performed on
white colonies using specific primers (nos-speI XF2 and nos-hindIII XR1).
2.3.5 Cloning of the luc gene into pDrive
The firefly luciferase gene (1656 bp; Appendix Fig. B.7) was amplified from pBlue-
script using gene specific primers (Luc-BamHI F and Luc-SpeI R2). The PCR
parameters and subsequent cloning into pDrive were according to standard proto-
cols (see sections 2.3.2 and 2.3.4).
23
Univers
ity of
Cap
e Tow
n
2.3. MATERIALS AND METHODS
2.3.6 Generation of luc::nos constructs
The recombinant plasmids, pDrive::luc and pDrive:nos, were isolated from cells that
had been cultured overnight at 37◦C in LB broth supplemented with ampicillin (100
µg/ml). Plasmid DNA extraction was performed using the EZ-10 Spin Column
Plasmid DNA Miniprep Kit (Bio Basic, Canada) according to the manufacturer’s
instructions (Appendix A.3). The pDrive::luc plasmid was thereafter restricted
with BamHI and SpeI to release the luc gene (standard protocol, see section 2.3.2).
Similarly, the pDrive::nos plasmid was linearised following digestion with the same
enzymes. The luc digestion product and linearised pDrive::nos plasmid were ligated
(standard protocol, see section B.3). The recombinant pDrive::luc::nos plasmid was
transformed into competent E. coli cells (standard protocol, see section 2.3.3) and
positive colonies were identified.
2.3.7 Cloning of luc::nos constructs into pTF101.1 binaryvector containing the XvPsap1, XvPsap2 and XvP-sap3 promoter fragments
Recombinant pTF101.1 harbouring the promoter fragments were independently
digested with BamHI and HindIII. Similarly, pDrive::luc::nos was digested with
the same enzymes to release the luc::nos construct. The linearised pTF101.1 and
luc::nos constructs were ligated and thereafter transformed into competent E. coli
cells (standard protocol, see section 2.3.3). The transformed cells were plated
onto LB agar supplemented with spectinomycin (100 µg/ml). Colony PCR was
performed on white colonies using gene specific primers.
2.3.8 Transformation of A. tumefaciens with pTF101.1 con-taining XvPsap promoters expressing the luc gene
The three pTF101.1 recombinant plasmids containing XvPsap1::luc::nos, XvP-
sap2::luc::nos and XvPsap3::luc::nos were isolated from E. coli and transformed
24
Univers
ity of
Cap
e Tow
n

2.3. MATERIALS AND METHODS
into competent A. tumefaciens. The transformed A. tumefaciens cells were incu-
bated at 30◦C instead of 37◦C. In addition, selection was performed using spectino-
mycin (100 µg/ml) and kanamycin (50 µg/ml).
Positive transformants were screened initially by colony PCR using luc specific
primers. Glycerol stocks were synthesised and stored at −80◦C.
2.3.9 Cloning of expression cassettes into pA53
Recombinant pTF101.1 was digested with EcoRI and HindIII to release either XvP-
sap1::luc::nos, XvPsap2::luc::nos or XvPsap::luc::nos. Similarly, the pA53 plasmid
(Appendix Fig. B.3) was digested with EcoRI and HindIII to linearise the vec-
tor. The inserts were individually ligated into pA53 (standard protocol, see section
2.3.2) generating three separate pA53 constructs.
2.3.10 Cloning of the gfp gene into pA53
The gfp gene (759 bp; Appendix Fig. B.9) was amplified using gene specific primers,
GFP-BamHI F and GFP-speI R (Appendix Table B.5). The amplification was
performed under the following cycling conditions: 94◦C for 5 min; 35 cycles of 94◦C
for 60 s; 56◦C for 60 s, and 72◦C for 60 s; and a final extension step of 72◦C for 5 min.
The gfp amplimer was cloned into pDrive. The pDrive::gfp plasmid was digested
with BamHI and SpeI to release the gfp, which was ligated into pA53 to replace
the luc gene in the XvPsap1::luc::nos, XvPsap2::luc::nos and XvPsap3::luc::nos
constructs.
25
Univers
ity of
Cap
e Tow
n

2.4. RESULTS
2.4 Results
2.4.1 Bioiformatic analyses of XvPsap1 for regulatory mo-tifs
Bioinformatic analyses of the XvPsap1 sequence were performed. No significant
identity was observed to any known plant promoter. Various putative cis-acting
elements were identified including those involved in dehydration, heat stress, ab-
scisic acid, jasmonic acid, light and low temperature responsiveness. In addition,
common cis-acting elements involved in meristem specific activation, endosperm
expression, auxin-responsive and circadian control were also identified. The major
regulatory motifs identified in the promoter are listed in Table 2.1. Full infor-
mation on host organism, position, strand, matrix score and motif sequence of
the promoter regulatory elements as predicted by the plantCARE is described in
Appendix Table C.1.
26
Univers
ity of
Cap
e Tow
n

2.4. RESULTS
Table 2.1: A summary of regulatory elements identifiedin XvPsap1 promoter using PlantCARE software (Lescotet al. 2002)
Site name Function
ABRE cis-acting element involved in abscisic acid responsiveness
MBS MYB binding site involved in drought-inducibility
HSE cis-acting element involved in heat stress responsiveness
G-Box cis-acting element involved in light responsiveness
Box I cis-acting element involved light responsiveness
CAAT-box common cis-acting element in promoter and enhancer regions
circadian cis-acting element involved in circadian control
CCGTCC-box cis-acting element related to meristem specific activation
CGTCA-motif cis-acting element involved in MeJA-responsiveness
LTR cis-acting element involved in low-temperature responsiveness
Skn-1 motif cis-acting element required for endosperm expression
TC-rich repeats cis-acting element involved in defense and stress responsiveness
TGA-box part of an auxin-responsive element
TCA-element cis-acting element involved in salicylic acid responsiveness
TATA-box core promoter element around -30 of transcription start
27
Univers
ity of
Cap
e Tow
n
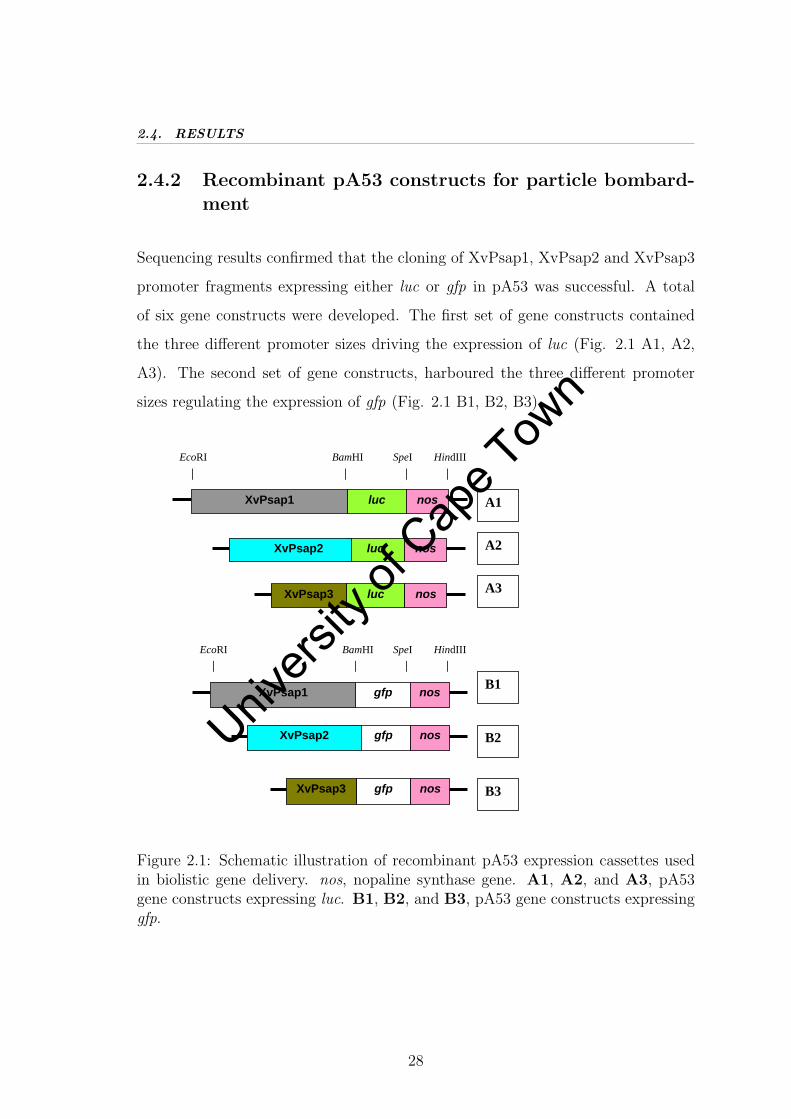
2.4. RESULTS
2.4.2 Recombinant pA53 constructs for particle bombard-ment
Sequencing results confirmed that the cloning of XvPsap1, XvPsap2 and XvPsap3
promoter fragments expressing either luc or gfp in pA53 was successful. A total
of six gene constructs were developed. The first set of gene constructs contained
the three different promoter sizes driving the expression of luc (Fig. 2.1 A1, A2,
A3). The second set of gene constructs, harboured the three different promoter
sizes regulating the expression of gfp (Fig. 2.1 B1, B2, B3).
gfp nos XvPsap1
gfp nos XvPsap2
gfp nos XvPsap3
luc nos XvPsap1
luc nos XvPsap2
luc nos XvPsap3
A1
EcoRI BamHI SpeI HindIII
EcoRI BamHI SpeI HindIII
A3
A2
B1
B3
B2
Figure 2.1: Schematic illustration of recombinant pA53 expression cassettes usedin biolistic gene delivery. nos, nopaline synthase gene. A1, A2, and A3, pA53gene constructs expressing luc. B1, B2, and B3, pA53 gene constructs expressinggfp.
28
Univers
ity of
Cap
e Tow
n

2.4. RESULTS
2.4.3 Recombinant pTF101.1 constructs for Agrobacteriumtumefaciens-mediated transformation
The synthesis of XvPsap1, XvPsap2 and XvPsap3 promoter fragments express-
ing luc in pTF101.1 was successful (Fig. 2.2). A total of three constructs were
generated. Sequencing confirmed the presence of the target sequences.
TEV enhancer
RB LB luc XvPsap1 nos P35S bar Tvsp
RB LB luc XvPsap2 nos P35S bar Tvsp
TEV enhancer
RB LB luc XvPsap3 nos P35S bar Tvsp
TEV enhancer
EcoRI BamHI SpeI HindIII
EcoRI BamHI SpeI HindIII
EcoRI BamHI SpeI HindIII
Figure 2.2: Schematic illustration of the T-DNA region of pTF101.1 containingvarying promoter fragments expressing luc. LB, Left border; Tvsp, soybean veg-etative storage protein terminator; bar, phosphinothricin acetyltransferase gene;P35S, CaMV 35S promoter; XvPsap1, XvPsap2, XvPsap3, truncated fragmentsof the XvPsap promoter; luc, luciferase gene; nos, nopaline terminator; RB, rightborder.
29
Univers
ity of
Cap
e Tow
n

2.5. DISCUSSION
2.5 Discussion
The accumulation of plant biological databases, specifically on plant promoter and
transcription factors has furthered the understanding of the function of genomes
(Yamamoto et al. 2007). These databases can be utilised for more accurate compar-
isons and analyses of plant regulatory elements (Venter & Botha 2004). Of these
databases, the BLAST (Altschul et al. 1990) is the most widely used and well-
established alignment search tool compared to other search systems like ClustalW
and ClustalX (Aiyar 2000).
In this study, in silico screening of XvPsap1 using the BLAST tool revealed that
the XvPsap1 sequence had no significant homology to any known promoter se-
quence. These results clearly demonstrate that the XvPsap1 sequence is novel.
This fact added to other features make XvPsap1 suitable for commercial exploita-
tion. The XvPsap1 sequence has consequently been patented (Patent File Ref.
PA143860/PCT).
Bioinformatic analyses of the XvPsap1 sequence was undertaken as it would allow
predictions regarding promoter positions and expression profiles as well as its hid-
den transcriptional networks (Venter & Botha 2004). Other studies have identified
numerous functional elements as promoter constituents for precise and regulated
transcriptional initiation (Carey & Smale 2001, Butler & Kadonaga 2002, Smale &
Kadonaga 2003). Of the many computational databases that exist, Hehl & Win-
gender (2001) contend that PlantCARE (Rombauts et al. 1999, Lescot et al. 2002),
which is widely used in plant promoter analyses, is the most suited for the identi-
fication of TF-binding sites and cis-acting elements. Using PlantCARE software,
the presence of several regulatory motifs such as ABRE, MBS and HSE were pu-
tatively identified in XvPsap1. These results strongly suggest that the XvPsap1
promoter may be involved in the abiotic stress response. Given that the XvPsap1
promoter was isolated 2083 bp upstream of the XvSap1 gene, which Garwe et al.
(2006) reported to confer stress tolerance to A. thaliana under salinity, osmotic
30
Univers
ity of
Cap
e Tow
n
2.5. DISCUSSION
and high temperature stress, these results strongly support the conclusion that the
XvPsap1 sequence could contain the cis-acting elements, which naturally regulate
the expression of XvSap1 gene in X. viscosa.
The presence of major regulatory motifs does not only point to the XvPsap1 se-
quence being a promoter, but also reveals that it is stress-inducible. Albeit further
research needs to be conducted on XvPsap1 regarding its activity in biosystems,
these preliminary results emphasise the potential utility of this promoter with re-
spect to improving crops such as maize for drought tolerance. Although these
computational genome browsers can be very useful, they do not provide definitive
answers to every question. Hence, the presence of regulatory elements does not
necessarily guarantee promoter activity. It is therefore desirable that such compu-
tational predictions be accompanied by transformation of the XvPsap1 promoter
into various plant systems in order to verify the actual activity of the promoter.
When developing transgenic plants, the use of minimum trans-sequence is desir-
able. This is because changes in trans-sequence organization such as truncation,
inversion, deletion and other complex rearrangements have been reported to in-
crease when long trans-sequences are used (Jorgensen et al. 1996). Trans-sequence
rearrangements are particularly common among transgenic plants derived from bi-
olistic delivery of DNA (Dai et al. 2001). Physical force used to deliver DNA into
cells may contribute to these rearrangements (Bhat & Srinivasan 2002). Further-
more, long trans-sequences coupled with plasmid vector DNA sequences, which
in many instances also get transferred, compromise the transformation efficiency.
This has been documented even for Agrobacterium-mediated transformation where
a more precise mechanism operates in the transfer of T-DNA (Iglesias et al. 1997,
Kononov et al. 1997, De Buck et al. 2000).
It was therefore an important objective of this study to determine the shortest
functional length of the XvPsap1 promoter to minimise the use of long trans-
sequences. Experimental characterisation of regulatory promoter elements are nor-
31
Univers
ity of
Cap
e Tow
n

2.5. DISCUSSION
mally conducted by sequential deletion of promoter fragments and promoter, with
gain-of-function cis-element, activities is assessed on transient and stable level in
transgenic plants (Koch et al. 2001). A similar approach was undertaken in this
study.
Success in genetic engineering requires careful cloning of appropriate expression
cassettes involving promoter regions, target genes and the terminator sequences
all in conducive expression vectors (Conner & Jacob 1999). This study, demon-
strates successful cloning of single gene constructs that would find application in
genetic engineering either via particle bombardment or Agrobacterium-mediated
transformation. Accordingly, transformation of Black Mexican Sweetcorn (BMS)
cells through particle bombardment is reported in Chapter 3.
32
Univers
ity of
Cap
e Tow
n

Chapter 3
Functional analysis of XvPsappromoter activity in BMS cells
3.1 Summary
Gene constructs containing XvPsap1 and its truncated fragments driving the ex-
pression of either luc or gfp were used in the transformation of BMS cells by particle
bombardment. Southern blot analysis was performed to determine stable introgres-
sion of the expression cassette into the genomes of the BMS cells. The functional
properties of each promoter fragment under salt stress treatment were examined
by fluorescence quantitative analyses. Cells transformed with XvPsap1::luc, XvP-
sap2::luc and XvPsap3::luc displayed increased luciferase activity. However, cells
containing XvPsap1::luc displayed the highest luciferase activity while those con-
taining XvPsap3::luc displayed the lowest. The qRTPCR analysis demonstrated
that the luc gene was upregulated within 24 h of salt stress in both transgenic cell
lines containing either XvPsap1 (5-fold) or XvPsap2 (1.9-fold). In contrast, the
XvPsap3 promoter demonstrated mild activity (1.9-fold) only after 48 h of stress.
These results suggest that the longest promoter fragment (XvPsap1, 2083 bp) is
the most active in BMS cells.
33
Univers
ity of
Cap
e Tow
n

3.2. INTRODUCTION
3.2 Introduction
Plant transformation is an important tool in the hands of molecular biologists
(Bhat & Srinivasan 2002). One method of DNA delivery, particle bombardment,
has been widely used to transform recalcitrant species such as cereals (Vain et al.
1995). For example, Shepherd et al. (2007) recently reported the development of
maize streak virus resistant transgenic maize generated by particle bombardment.
Particle bombardment accounted for 25% of all the plant transformations reported
up to 2003 (Vain 2007).
Plant cell cultures are useful model systems to investigate the function and regu-
lation of genes (Hano et al. 2008). For instance, in vivo characterisation of plant
promoters in transgenic maize suspension cells has been reported (Tuerck & Fromm
1994). This is due to the ability to control growth conditions of cell suspensions as
well as the unlimited supply of undifferentiated cells amenable to genetic manipu-
lations (Rasmussen et al. 1994).
When using suspension cells for genetic transformation, the viability of the target
cell lines is usually determined using chemosensitivity assays such as MTT (Plumb
et al. 1989). The MTT assay is a standard colorimetric assay for measuring the
activity of enzymes that reduce MTT to formazan producing a purple colour. This
mainly occurs in mitochondria, and as such it is in large, a measure of mitochondrial
activity (Mosmann 1983, Vistica et al. 1991, Wilson 2000).
Particle bombardment of BMS cells using gfp and luc gene constructs regulated
by varying lengths of the XvPsap promoter is reported. Functional analysis of
promoter activity is described. The primary objective was to determine the most
active promoter fragment in a model monocot system.
34
Univers
ity of
Cap
e Tow
n

3.3. MATERIALS AND METHODS
3.3 Materials and Methods
3.3.1 BMS cell culture and growth conditions
Cell cultures were grown on BMS culture media in the dark at room temperature.
The BMS cells were subcultured onto fresh media every 2 weeks. The BMS culture
media was composed of MS (Murashige & Skoog 1962) salts and vitamins supple-
mented with 2,4-D (1 mg/l), myo-inositol (100 mg/l), sucrose (30 mg/l) and agar
(8 g/l). The pH of the media was adjusted to 5.8. Suspension cells were cultured in
liquid BMS media (excluding agar) at 27◦C in a shaking incubator (MRC, Israel).
3.3.2 MTT assay
Aliquots of cells were collected every 24 h over a 7 day period to determine viability.
The 180 µl aliquot of cells was transferred to a sterile 2 ml Eppendorf tube contain-
ing 20 µl of MTT. The mixture was vortexed for 30 min at room temperature and
thereafter centrifuged for 5 min at 12,000g. The supernatant was transferred to a
fresh tube and 1 ml of DMSO added. The vortexing and centrifugation step was
repeated as described above. Thereafter, 200 µl of cell-free supernatant was trans-
ferred to a 96 well plate and spectrophotometric readings taken at 570 nm using a
microplate reader installed with KC4 software (Bio-Tek instruments, USA).
3.3.3 Transformation of BMS cells
Prior to co-bombardment, BMS cells were subcultured overnight on high osmotic
BMS media (BMS media supplemented with 18 g/l mannitol). One microgram
each of the construct of interest and of pAHC25, containing the bar gene for herbi-
cide selection, were precipitated onto 1 µM gold particles (50 µl of 60 mg/ml gold
suspended in 50% glycerol) (Dunder et al. 1995). Transformation was conducted
using a PDS-1000-He Biolistic Bombardment Delivery System (Bio-Rad Labora-
tories, Germany) with a pressure of 650 psi and a gap distance of 6 mm between
35
Univers
ity of
Cap
e Tow
n

3.3. MATERIALS AND METHODS
the rupture disc and macrocarrier containing the DNA. Each sample was bom-
barded twice. A non-bombarded control plate was included in all experiments. The
BMS cells transformed with the luc containing constructs were initially selected on
BMS media harbouring bialaphos (3 mg/l) prior to imposing salt treatment. Only
bialaphos resistant cells were assessed for the presence of bar and luc transgenes.
3.3.4 Detection of transgenic BMS cells
Genomic DNA was extracted using the CTAB extraction method (Stacey & Isaac
1994, Dehestani & Tabar 2007) with modifications. Instead of grinding cells in
liquid nitrogen using a mortar and pestle, warm CTAB extraction buffer was added
to 300 mg BMS cells in 2 ml Eppendorf tubes. Two 14
inch ceramic spherical beads
(Bio 101, USA) were added and the cells homogenized by vortexing the mixture
for 10 min.
The presence of the bar gene was determined by amplification of a 421 bp fragment
of the gene using the primer pair Bar I and Bar II (Appendix Table B.5) with the
following cycling conditions: 94◦C for 5 min; 35 cycles of 94◦C for 60 s; 57◦C for
30 s, and 72◦C for 90 s; and a final extension step of 72◦C for 5 min. Similarly,
to determine the presence of the luc gene, the primer pair Luc F and Luc-SpeI R2
was used to amplify a 1.2 kb fragment of the gene. The amplification was carried
out with the following cycling conditions: 94◦C for 5 min; 35 cycles of 94◦C for 60
s; 58◦C for 30 s, and 72◦C for 90 s; and a final extension step of 72◦C for 5 min.
3.3.5 Southern blot analysis of transgenic BMS cells
For Southern blot analysis, 10 µg of genomic DNA from each transgenic BMS cell
line was digested overnight with SpeI and BamHI at 37◦C. The digestion products
were electrophoresed overnight at 40 V on a 1% agarose gel. The separated DNA
was blotted onto a nylon membrane (Hybond N+; Amersham Biosciences, USA)
by capillary transfer (Sambrook et al. 1989). The transferred DNA was fixed using
36
Univers
ity of
Cap
e Tow
n

3.3. MATERIALS AND METHODS
a Hoefer UVC 500 crosslinker (Amersham Biosciences, USA). A 1.2 kb fragment
of the luc gene was labeled with digoxigenin (DIG) using the PCR Labeling Kit
(Roche Diagnostics, Germany) according to the manufacturer’s instructions. Hy-
bridisation and detection of probe was carried out using a non-radioactive, DIG
Luminescent Detection Kit for nucleic acids (Roche Diagnostics, Germany) accord-
ing to the manufacturer’s instructions.
The luc gene was amplified using the primer pair, Luc F and Luc-SpeI R2 (see
section 3.3.4). The generated product was electrophoresed on a 1% agarose gel and
a 1.2 kb band was excised and purified (see section 2.3.2). The purified amplimer
was used as template for probe synthesis using a DIG-dUTP:dTTP ratio of 1:6.
Reactions were performed on a Gene Amp 9700 thermocycler with the following
cycling conditions: 94◦C for 5 min; 35 cycles of 94◦C for 60 s; 58◦C for 30 s, and
72◦C for 90 s; and a final extension step of 72◦C for 5 min. Labeling efficiency was
assessed by electrophoresing the labeled product on a 1% agarose gel. The tissue
type plasminogen activator (tPA) was used as positive control.
Hybridisation with the labeled luc probe was performed for 16 h at 42◦C. The
blots were initially washed with 2X SSC buffer at room temperature and thereafter
more stringently with 0.1X SSC buffer. The CDP-star chemiluminescent substrate
(Roche Diagnostics, Germany) for alkaline phosphatase was used for detection
according to the manufacturer’s instructions.
3.3.6 Salt stress treatment
The BMS cells that showed the presence of bar and luc transgenes were further sub-
cultured on selection media before being transferred to BMS media supplemented
with either 200 mM NaCl or sorbitol. Aliquots (100 µl) of cells were collected
every 24 h over a 3 day period. The BMS cells transformed with gfp constructs
were viewed after 36 h of salt stress using an inverted phase contrast epifluores-
cence ELWD microscope (Nikon, Japan). The emitted fluorescence was imaged on
37
Univers
ity of
Cap
e Tow
n

3.3. MATERIALS AND METHODS
a computer using a filter to detect the fluorescence through a 20X magnification
objective at wavelengths longer than 510 nm.
3.3.7 Analysis of luciferase activity in transgenic BMS cells
The activity of luciferase under salt treatment was monitored for 72 h using a
Modulus Microplate Multimode Reader (Tuner Biosystem, USA). Prior to salt in-
duction, samples were treated with a 1 mM beetle luciferin solution to eliminate any
residual luciferase activity. Luciferase assay reagent was reconstituted by adding 10
ml luciferase assay buffer in a vial containing luciferase assay substrate and mixing
thoroughly at room temperature.
The 1X lysate buffer provided with the Luciferase Assay Kit contains triton-X100
which compromises the output of the Braford reaction (Bradford 1976) and conse-
quently was not used. Instead, an alternative extraction buffer (0.1 M potassium
phosphate buffer pH 7; 1 mM dithiothreitol) was prepared. The BMS cell sample
(200 mg) was transferred to a sterile 2 ml Eppendorf tube, ground in 0.5 ml cold
extraction buffer and centrifuged for 5 min at 10,000g at 4◦C (Ow et al. 1986).
The supernatant was transferred to a sterile tube and incubated on ice. An aliquot
(20 µl) of each extract was transferred to a 96 well plate and quantitative mea-
surements taken. Luciferase activity was measured in terms of relative light units
(RLU) following the injection of 100 µl of the assay reagent. Luciferase assays
were performed in triplicate on each extract and the concentration of the extract
determined using BSA.
3.3.8 RNA extraction from transgenic BMS cells
Total RNA was extracted using the TRIzol method (Chomczynski & Sacchi 1987)
according to the manufacturer’s instructions (Life Technologies, USA). An 200 mg
aliquot of BMS cells was ground with liquid nitrogen using a mortar and pestle.
The ground cells were mixed with 1 ml TRIzol reagent and thereafter incubated
38
Univers
ity of
Cap
e Tow
n

3.3. MATERIALS AND METHODS
for 5 min at room temperature. The mixture was centrifuged for 10 min at 12,000g
at 4◦C. The supernatant was transferred to a sterile 2 ml Eppendorf and 200 µl of
chloroform was added. The tube was incubated for 2 min at room temperature,
vortexed for 15 s and allowed to settle for 3 min at room temperature. Thereafter,
the mixture was centrifuged for 15 min at 10,000g at 4◦C and the RNA was precip-
itated from the upper phase by adding a half volume each of isopropanol and 0.8 M
sodium citrate/1.2 M NaCl. The mixture was allowed to settle for 10 min at room
temperature and thereafter pelleted by centrifugation for 10 min at 10,000g at 4◦C
. The pellet was washed with 70% EtOH, vortexed briefly and centrifuged again
for 10 min at 10,000g at 4◦C. The pellet was air dried for 5 min and dissolved in
89 µl of 0.01% DEPC treated water. Dissolution was enhanced by incubating the
tube for 10 min at 55◦C. The RNA sample was centrifuged for 5 min at 10,000g
at room temperature and the insoluble pellet discarded. Ten microlitres of DNase
I buffer (New England Biolabs, USA) was added to each 89 µl RNA sample and
mixed gently. One microliter of DNase I was added to each sample to eliminate
residual DNA followed by incubation for 10 min at 37◦C. The sample was purified
using the EZ-10 Spin Column Total RNA Minipreps Super Kit (Bio Basic, Canada)
according to the manufacturer’s instructions. The purified RNA was quantified at
260 nm using a NanoDrop ND-1000 spectrophotometer (NanoDrop Technologies,
USA). The RNA quality was further assessed by visualizing on a 1.2% agarose gel.
3.3.9 Synthesis of cDNA
One step cDNA synthesis was performed (Clontech, USA) according to the man-
ufacturer’s instruction. Purified RNA (2.5 µg) was reverse transcribed in a 25 µl
reaction. The initial reaction comprised RNA, 0.5 µg of random hexamers and
RNase-free water to 12.5 µl. The reaction contents were gently mixed and there-
after incubated for 2 min at 72◦C. Following the initial incubation the samples was
immediately chilled on ice. The reverse transcription master mix was prepared in
a separate tube and comprised 100 U M-MuLV RNase H− reverse transcriptase
39
Univers
ity of
Cap
e Tow
n

3.3. MATERIALS AND METHODS
(Finnzymes, Finland), 2.5 µl of 10X M-MuLV RT buffer, 2 µM dNTPs and RNase-
free water to a volume of 12.5 µl per reaction. The enzyme mix was transferred to
the individual RNA mixes and the reaction incubated for 1 h at 42◦C. The RNA
was thereafter degraded using 2.5 U RNaseH (New England Biolabs, USA) with
sequential incubation for 5 min at 25◦C followed by 15 min at 37◦C. The cDNA
pool was immediately chilled on ice and diluted 10-fold with DEPC-treated distilled
H2O and stored at −80◦C.
3.3.10 Real-time quantitative PCR
The relative expression of luc was determined by qRTPCR using the SensiMix
DNA Kit (Quantace, Australia). Aliquots of a single cDNA sample were used with
all primer sets. Reactions were performed in a 25 µl volume containing 1 µl of each
primer (10 µM), 2 µl cDNA, 0.5 µl 50X SYBR Green and 12.5 µl 2X SensiMix
PCR master mix.
The primer pair qRTLuc F1 and qRTLuc R2 (Appendix Table B.5) specific for luc
was used to amplify a 192 bp fragment of the gene. The 18S rRNA was used as
reference gene and was detected using the primer pair qRT18S-F2 and qRT18S-R2
(Appendix B.5). The primers were designed using the Primer3 programme (Rozen
& Skaletsky 2000). Real-time PCR was performed on a Rotor-Gene RG-3000A
PCR machine (Corbett Research, Australia) in a 72-well reaction plate with the
following cycling parameters: 95◦C for 10 min; 40 cycles of 95◦C for 10 s, 60◦C
for 15 s, and 72◦C for 5 s. Amplification specificity was verified at the end of the
PCR run by analysing a melting curve of the amplimer generated. In addition, an
aliquot of the amplimer was electrophored on a 2% agarose gel. Each qRTPCR
reaction was performed in triplicate.
Serial dilutions of pooled cDNA from the treated samples were used to generate
five-point standard curves. Reaction efficiencies were determined from the standard
curves. Gene constructs containing the luc gene were used as templates for positive
40
Univers
ity of
Cap
e Tow
n

3.3. MATERIALS AND METHODS
controls.
The standard curve was imported into every run and used to calculate concentra-
tions of the gene of interest (GOI) and the housekeeping gene (HKG). To normalize
the run-to-run variations in PCR efficiencies, one of the standard solutions was in-
cluded in every run and used to correct for variations in the run. The calculated
concentration of the GOI was divided by the calculated concentration of the HKG.
Thereafter, the values obtained from three biological replicates were averaged and
used for relative quantification of transcripts. To evaluate the pattern of luc expres-
sion under stress conditions, the transcript levels in samples prior to the application
of the stress (i.e. time zero) were used as a reference. The mean relative transcript
level was determined and standard deviation values reported as n-fold relative to
the 18S rRNA expression levels (Livak 1997, Brunner et al. 2004, Wong & Medrano
2005).
3.3.11 Promoter activity data analyses
Promoter activity data was analysed using GraphPad Prism (version 5.00; Graph-
Pad Software, USA). The translation and expression levels of luciferase in trans-
genic BMS cells presented as n-fold relative to 0 h stress treatment were assessed
for statistical differences. Statistically significant differences were determined using
a one-way ANOVA (Kruskal-Wallis test) and by making pair-wise comparisons be-
tween least square means. Means were considered significantly different at a level
of 0.05.
41
Univers
ity of
Cap
e Tow
n

3.4. RESULTS
3.4 Results
3.4.1 Cell viability and salt treatment
The BMS cells were aliquoted every 24 h for the MTT assay to minimize variations
due to circadian rhythms. After 4 days of culture, browning of the treated cell
suspension was observed compared to the untreated control. The browning was
accompanied by slow growth with cells treated with NaCl exhibiting a greater effect
than those treated with sorbitol (Fig. 3.1 A). A significant survival inhibition (<
50% survival) was noted in cells treated with NaCl (Fig. 3.1 B) and was therefore
selected for downstream stress treatments.
00.20.40.60.8
11.2
0 2 4 6 8Duration (days)
Abs
orba
nce
at 5
70nm
Control Nacl Sorbitol
020406080
100120
0 2 4 6 8Duration (days)
Per
cent
age
surv
ival
(%)
Control Nacl Sorbitol
B
A
Figure 3.1: Graphical representation of the MTT assay of BMS cells under NaCland sorbitol treatments. A: Growth of BMS cells treated with either 200 mMNaCl or sorbitol. B: Percentage survival of BMS cells under either 200 mM NaClor sorbitol, calculated relative to untreated controls. The data are presented asmeans ± SEM from three independent transgenic BMS cells.
42
Univers
ity of
Cap
e Tow
n
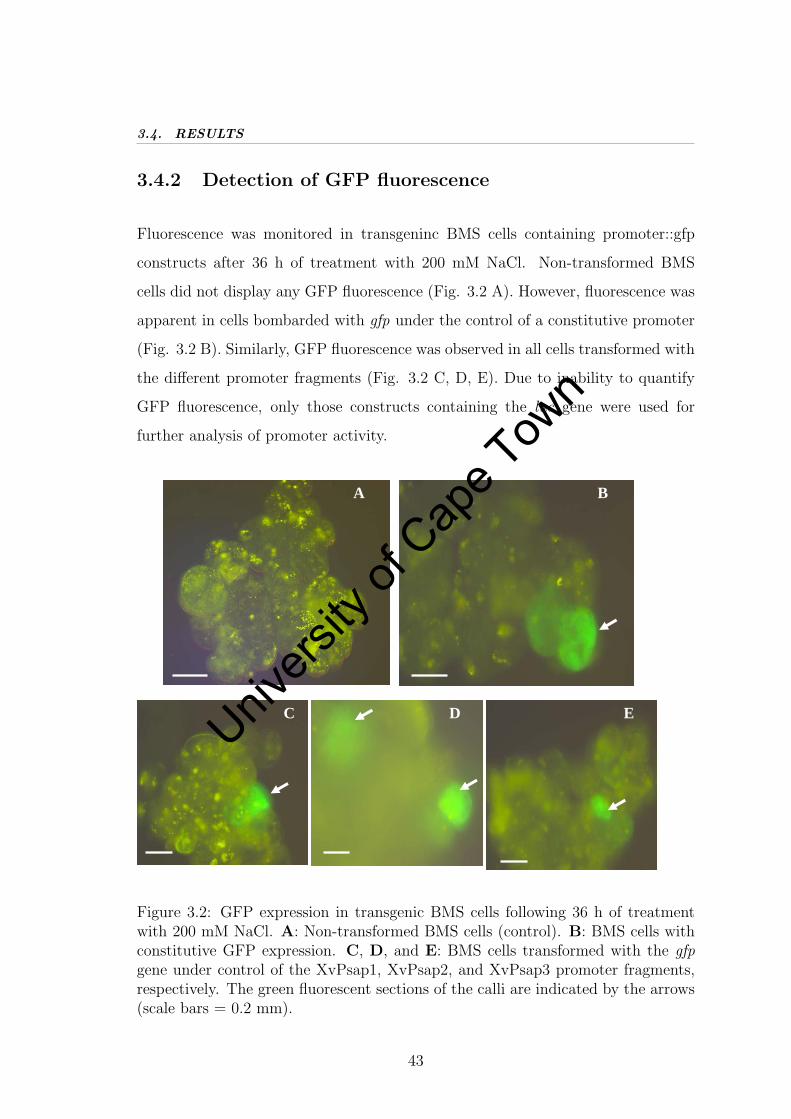
3.4. RESULTS
3.4.2 Detection of GFP fluorescence
Fluorescence was monitored in transgeninc BMS cells containing promoter::gfp
constructs after 36 h of treatment with 200 mM NaCl. Non-transformed BMS
cells did not display any GFP fluorescence (Fig. 3.2 A). However, fluorescence was
apparent in cells bombarded with gfp under the control of a constitutive promoter
(Fig. 3.2 B). Similarly, GFP fluorescence was observed in all cells transformed with
the different promoter fragments (Fig. 3.2 C, D, E). Due to inability to quantify
GFP fluorescence, only those constructs containing the luc gene were used for
further analysis of promoter activity.
A B
D C E
Figure 3.2: GFP expression in transgenic BMS cells following 36 h of treatmentwith 200 mM NaCl. A: Non-transformed BMS cells (control). B: BMS cells withconstitutive GFP expression. C, D, and E: BMS cells transformed with the gfpgene under control of the XvPsap1, XvPsap2, and XvPsap3 promoter fragments,respectively. The green fluorescent sections of the calli are indicated by the arrows(scale bars = 0.2 mm).
43
Univers
ity of
Cap
e Tow
n

3.4. RESULTS
3.4.3 Transformation and selection of transgenic BMS cellscontaining the luc gene
The BMS cells were co-bombarded with pA53 containing the different promoter
fragments and pAHC25 containing the bar gene. Non-transformed cells displayed
complete necrosis following 4 weeks of bialaphos selection (Fig. 3.3 A). However,
these cells thrived on media lacking bialaphos (Fig. 3.3 B). The cells transformed
with the luc gene under the control of XvPsap1, XvPsap2 and XvPsap3 promot-
ers displayed partial necrosis (Fig. 3.3 C, D, E). Only those cells that displayed
bialaphos resistance were subcultured and subjected to PCR screening.
B
D
A
C E
Figure 3.3: Putative BMS transformants 4 weeks post bombardment underbialaphos selection. A: Non-transformed BMS cells on selection media contain-ing 3 mg/l bialaphos displaying total necrosis. B: Non-transformed BMS cells onmedia containing no bialaphos. C, D, and E: BMS cells transformed with the lucgene under control of the XvPsap1, XvPsap2, and XvPsap3 promoter fragments,respectively on selection media containing 3 mg/l bialaphos (scale bars = 2.5 cm).
44
Univers
ity of
Cap
e Tow
n

3.4. RESULTS
3.4.4 PCR screening of putative transgenic BMS cells
Following 5 weeks of selection, bialaphos resistant BMS cell lines were analysed for
the presence of luc transgenes by PCR screening. The majority of cell lines were
positive for the expected 1.2 kb luciferase gene fragment (Fig. 3.4 A). Interestingly,
some cells that survived selection lacked the presence of the luc gene (Fig. 3.4 A).
Consequently, further screening of these lines was conducted using bar specific
primers. The expected 421 bp bar fragment was amplified in all cell lines (Fig. 3.4
B).
M + - 1 2 3 4 5 6 7 8 9
A
0.5kb 0.4kb
L + - 1 2 3 4 5 6 7 8 9
B
1.2kb
A
Figure 3.4: PCR screening of transgenic BMS cells for the presence of the luc andbar transgenes. A: The expected 1.2 kb luciferase fragment was amplified. M,100 bp DNA ladder Plus (Fermentas, Canada); +, 1 ng of pA53 containing the lucgene; -, non-transformed BMS cells. Cells transformed with XvPsap1 (lanes 1-3),XvPsap2 (lanes 4-6) and XvPsap3 (lanes 7-9) constructs. B: The expected 421 bpbar fragment was amplified; L, 100 bp DNA ladder (Fermentas, Canada); +, 1 ngof pAHC25 containing the bar gene.
45
Univers
ity of
Cap
e Tow
n

3.4. RESULTS
3.4.5 Southern blot analysis of transgenic BMS cells
To assess the integration of the luc transgene in the BMS genome, Southern blot
analysis was performed. Success in labeling was confirmed by gel electrophoresis
of the DIG labeled-probe. As expected, the labeled probe migrated slower than
the unlabeled control due to the presence of the DIG label (Fig. 3.5). The actual
size of the tPA amplicon (positive control) is 442 bp, however the presence of DIG
slowed its migration hence the expected fragment was between 500-550 bp.
M + 1 2
1.5kb 1kb 0.5kb 0.25kb
Figure 3.5: Probe synthesis using the PCR DIG probe synthesis kit. M, 1 kb DNAladder (New England Biolabs, USA); +, tissue type plasminogen activator (tPA).Lane 1, unlabeled control probe with expected size of 1.2 kb; lane 2, labeled probe.
Following digestion with SpeI and BamHI, the digested genomic DNA was suc-
cessfully electrophpresed on a 1% agarose gel (Fig. 3.6 A). Capillary transfer onto
nylon membrane was successful (Fig. 3.6 B). A single band (1645 bp) representing
the luc transgene was observed in all samples. The BMS cell lines containing the
same copy numbers of the luc transgene were predicted by comparing the band
intensities given that an equal concentration of DNA was loaded in every well.
Accordingly, BMS cell lines marked 4-15 (Fig. 3.6 B) were considered to possess
the same copy number and were subsequently used for the luciferase assay. No
hybridisation was detected for the non-transformed cell samples (Fig. 3.6 B).
46
Univers
ity of
Cap
e Tow
n

3.4. RESULTS
Kb 2 1.5 1 0.5
M + - 1 2 3 4 5 + - 6 7 8 9 10 + - 11 12 13 14 15
+ - 1 2 3 4 5 + - 6 7 8 9 10 + - 11 12 13 14 15 A
B
1.2kb
Figure 3.6: Southern blot analysis of transgenic BMS cell lines for the presenceof luc transgene. A: Digested genomic DNA separated on a 1% agarose gel. B:Autoradiograph of membrane probed with a DIG-labeled probe specific to a 1.2kb fragment of the luc gene. M, 1 kb DNA ladder (New England Biolabs, USA);Cell lines transformed with the XvPsap1 (lanes 1-5), XvPsap2 (lanes 6-10), andXvPsap3 (lanes 11-15) constructs. +, 200 pg of the 1.2 kb PCR luc fragment usedto synthesise the probe. -, digested genomic DNA of non-transformed cell lines.
3.4.6 Luciferase activity in primary BMS cell transformants
Transgenic BMS cells from independent transformation events were examined to
determine the levels of luciferase activity following 200 mM NaCl stress. Some
transformation events yielded more than one transgenic clone due to the way the
cells were split up during subculture. The BMS cells transformed with XvPsap1
displayed the highest activity (3-fold) following 24 h of salt stress (Fig. 3.7A). The
XvPsap2 and XvPsap3 fragments displayed lower activities of 1.4- and 1.2-fold,
47
Univers
ity of
Cap
e Tow
n

3.4. RESULTS
respectively (Fig. 3.7A). The MTT assay conducted after 24 h of stress indicated
a percentage survival of greater than 60% for all the promoter fragments (Fig.
3.7B). After 48 h and 72 h of salt stress, when cell survival was barely above 50%,
luciferase activity dropped dramatically to almost undetectable levels in all the
transgenic cell lines (Fig. 3.7 A, B). While varying luciferase activity was recorded
for the different promoter fragments, these values were not significantly different
(P < 0.05 ).
020406080
100120
0 20 40 60 80
Stress period (h)
Sur
viva
l (%
)
WT XvPsap1 XvPsap2 XvPsap3
0
1
2
3
4
5
0 10 20 30 40 50 60 70 80Stress period (h)
RLU
/µg
XvPsap1 XvPsap2 XvPsap3
A
B
Figure 3.7: Luciferase activity in transformed BMS cell lines treated for 72 h with200 mM NaCl. A: Luciferase activity in transgenic BMS cells. B: Percentagesurvival of transgenic BMS cells. The data are presented as means ± SEM fromthree independent transgenic BMS cells.
48
Univers
ity of
Cap
e Tow
n

3.4. RESULTS
3.4.7 Analysis of luc expression in transgenic BMS cellsusing qRTPCR
The qRTPCR analysis of BMS cells pointed to the luc mRNA being upregulated
within 24 h of salt stress for both XvPsap1 (5-fold; P < 0.05) and XvPsap2 (1.9-
fold; P < 0.05) whereas with XvPsap3 (1.9-fold; P < 0.05) upregulation occurred
after 48 h (Fig. 3.8). Longer salt stress periods of up to 72 h did not induce luc
expression as the transcripts rapidly declined to undetectable levels.
02468
10
0 20 40 60 80Salt stress period (h)
Rel
ativ
e ex
pres
sion
XvPsap1 XvPsap2 XvPsap3
Figure 3.8: Luciferase expression profile curves in transgenic BMS cells followingtreatment over a 72 h period with 200 mM NaCl. The data are presented as means± SEM from three independent transgenic BMS cells.
49
Univers
ity of
Cap
e Tow
n

3.5. DISCUSSION
3.5 Discussion
In the present study, the growth pattern of BMS cells under salt stress was de-
termined using the MTT assay (Plumb et al. 1989). The assay has been widely
adopted following the findings of Plumb et al. (1989) who reported the establish-
ment of conditions under which MTT reduction could be used quantitatively to
determine surviving cell numbers in a chemosensitivity assay that could be applied
to both adherent and non-adherent cell lines.
Common data variations usually encountered when experimenting on BMS cells
were never observed in this study. A plausible explanation is that since cell samples
were collected at the same time point during the day, any variation due to circadian
rhythms was minimised. In addition, the concentration of MTT and D-glucose as
well as the culture pH were standardised (Plumb et al. 1989). This is necessary
since MTT reduction correlates well with D-glucose concentration in the medium
at the time of assay. Cell lines which metabolise the sugar extensively tend to
exhibit the greatest decrease in the production of MTT formazan (Vistica et al.
1991) thus leading to variations in the data output.
Salt stress was observed to inhibit the growth of BMS cells. This observation
could be attributed to the fact that salt stress causes inhibition of plant growth
due to a reduction in water availability, sodium ion accumulation, and mineral
imbalances leading to cellular and molecular damage (Silva-Ortega et al. 2008). The
growth reduction is a specific characteristic of salt sensitive plants. However, this
characteristic has also been identified in higher plants such as Opuntia subjected
to months of salt stress (Murillo-Amador et al. 2001, Silva-Ortega et al. 2008).
The jellyfish green fluorescent protein and the firefly luciferase protein are two
commonly used molecular reporters that can be detected non-invasively in living
cells. The properties that make GFP or Luc useful for a particular experimental
application are quite distinct. Thus a recombinant protein with both fluorescent
50
Univers
ity of
Cap
e Tow
n

3.5. DISCUSSION
and bioluminescent characteristics might take advantage of the strengths of both
reporter genes (Day et al. 1998).
In the present study, GFP fluorescence was observed in the salt treated transgenic
BMS cells transformed with the three promoter fragments. The differential activ-
ity of the individual promoter fragments could not be elucidated from the GFP
florescence observed due to lack of equipment for quantifying GFP fluorescence.
Nevertheless, the data served a useful function as a preliminary visual indicator of
promoter activity. The GFP fluorescence was insignificant following 72 h of salt
stress. This decline points to the fact that the XvPsap1 promoter is involved in
early responses to abiotic stress (Iyer et al. 2007). Recently, the expression of the
gfp gene has been reported to peak 24 h post introduction followed by a rapid
decline thereafter (Chiera et al. 2008). Such declines in expression, have previously
been attributed to pre-integrative DNA events that involve the loss of introduced
DNA or cell death (Chiera et al. 2008). However, Chiera et al. (2008) ascribe
the declines to post-transcriptional gene silencing. The GFP fluorescence was ex-
tended to well over 100 h when GFP was expressed as a translational fusion to
the RNA silencing suppressor protein HCPro from tobacco etch potyvirus (Chiera
et al. 2008).
Selectable marker genes that confer resistance to antibiotics or herbicides are gen-
erally incorporated along with the gene of interest in most plant transformation
systems to allow transgenic material to be identified and to give transgenic cells the
chance to proliferate without being overgrown by non-transformed cells (Harwood
et al. 2002, Jaiwal et al. 2002). The use of the bar gene, which confers tolerance
to bialaphos effectively inhibited the growth of non-transformed BMS cells. When
bialaphos resistant BMS cells were sreened for presence of the bar gene, all tested
positive. In contrast, when the same cell samples were assessed for the presence
of the luc transgene, some tested negative. This observation could be linked to
the drawbacks associated with biolistic transformation in terms of stability and
integration of transgenes (Shrawat 2007) as well as low transformation efficiency
51
Univers
ity of
Cap
e Tow
n
3.5. DISCUSSION
in comparison to other transformation strategies (Sharma et al. 2005). Moreover,
because this study employed co-bombardment, it is likely that some BMS cell lines
only received the pAHC25 plasmid (that harbours the bar gene) and not the pA53
plasmid (that contains the luc transgene) resulting in the observed bialaphos tol-
erance. Similar observations have been reported in whole plant transformation in
different studies. For instance, while assessing the application of gene silencing
as a tool for development of resistance to maize streak virus, Owor (2008) noted
that some of the transgenic Digitaria sanguinalis and maize generated that were
positive for the bar gene, tested negative for the rep∆I678 transgene.
Stable introgression of the luc transgene was confirmed by Southern blot analysis.
Varying transgene copy numbers has been reported to cause instability as well as
variation in transgene expression (Finnegan & McElroy 1994). In this study, such
variations in luciferase activity and qRTPCR were minimised by using only those
cell lines predicted to possess the same gene copy numbers.
Of the three promoter fragments, XvPsap1 (2083 bp) recorded the highest lu-
ciferase activity of 3-fold followed by XvPsap2 and XvPsap3 in descending order
of activity. The fact that luciferase activity peaked at 24 h and was followed by a
rapid decline thereafter, strongly suggests that the XvPsap1 promoter is involved
in early response to stress. Significantly, the XvPsap1 sequence was isolated up-
stream of the XvSap1 gene, which Garwe et al. (2006) reported to confer tolerance
to dehydration, high temperatures and salinity in transgenic A. thaliana.
While these results provide a profound understanding of the activity of the promot-
ers, it should be noted that luciferase activity can be affected by several factors.
The fact that the luciferase reaction is ATP-dependent suggests that the reaction
output is prone to variations depending on the energy status of the cells at the
time of the assay. Luciferase can also be degraded by proteases. However, protein
inhibitor was used in the present study to prevent such degradations. Furthermore,
when living cell cultures stably expressing the GFP::Luc fusion were treated with
52
Univers
ity of
Cap
e Tow
n

3.5. DISCUSSION
the protein translation-inhibitor cycloheximide, the half-life for luciferase protein
activity was determined to be approximately 2 h at 37◦C (Day et al. 1998). This
suggests that the protein is somewhat stable.
In light of these possible sources of variation, the activity of the XvPsap promoters
was further analysed by performing qRTPCR. The XvPsap1 promoter recorded
the highest levels of luc transcripts following 24 h of salt stress. Previously, Iyer
et al. (2007) reported a similar trend with the expression of the XvSap1 gene in
dehydrated X. viscosa, which is believed to be naturally driven by the XvPsap1
promoter. They noted an up-regulation of the XvSap1 mRNA at 60% RWC. There-
after, expression decreased but again increased at 15% RWC. This observation led
Iyer et al. (2007) to conclude that XvSap1 could be involved in the initial and late
stages of the protective response to dehydration. The discrepancy observed between
the transcriptional (5-fold) and translational (3-fold) levels could be attributed to
factors including but not limited to luc mRNA degradation, translational control as
well as post-translational modification (Gallie 1996, Yanagisawa 1998). Together,
these results clearly demonstrate the differential activity of XvPsap promoters in
BMS cells under salt stress.
The end point of a chemosensitivity assay is usually an estimate, either direct or
indirect, of surviving cell numbers. It is therefore uncertain that the expression
trends reported in this study would apply to the whole plant system, particularly
to dicots. Furthermore, use of particle bombardment for transformation presents
notable drawbacks. Consequently, transformation of N. tabacum using the same
gene constructs by Agrobacterium-mediated transformaton is reported in chapter
4.
53
Univers
ity of
Cap
e Tow
n

Chapter 4
Functional analysis of XvPsappromoter activity in transgenicNicotiana tabacum
4.1 Summary
The chimeric constructs harbouring XvPsap1 and its truncated fragments regulat-
ing the expression of luc were used to transform N. tabacum by Agrobacterium-
mediated transformation. The functional properties of each promoter fragment was
examined by fluorescence quantitative analyses of transgenic tobacco leaves follow-
ing dehydration stress for eight days. Of the three promoter fragments, XvPsap1
was the most active with optimal activity attained after three days of dehydration
stress. The qRTPCR analysis confirmed the upregulation of the luc gene (7-fold;
P< 0.05) under control of XvPsap1 within three days of stress whereas XvPsap2
and XvPsap3 displayed minimal activities of 2.2- and 1.6-fold, respectively. These
results are significant in that the XvPsap1 promoter displays activity in a dicot
system although it was isolated from a monocotyledonous system. This suggests
that the promoter has added potential for use in the generation of transgenic di-
cotyledonous crops tolerant to drought stress.
54
Univers
ity of
Cap
e Tow
n

4.2. INTRODUCTION
4.2 Introduction
Over the past 30 years, N. tabacum has been used as a key plant model for the
development of transformation technology and molecular analyses. This proba-
bly reflects the fact that tobacco was the first plant species to be regenerated in
vitro (Skoog & Miller 1957) and was used to develop standardised tissue culture
conditions (Murashige & Skoog 1962). Tobacco plants are ideal for biotechnology
procedures because it is leafy, readily accepts the procedures, grows quickly, is rela-
tively easy to harvest, and yields millions of seeds per plant. Consequently, tobacco
has become a preferred system for the expression of genes following Agrobacterium-
mediated transformation (Florack et al. 1994, Kasuga et al. 2004).
The transformation of N. tabacum using luc constructs described in chapter 2,
through Agrobacterium-mediated transformation is reported. The expression and
relative activity of luciferase is also described. The main objectives were: (i) to
determine whether the XvPsap promoter fragments are functional in a dicot system;
and (ii) to determine the most active promoter fragment in a model dicot system.
55
Univers
ity of
Cap
e Tow
n

4.3. MATERIALS AND METHODS
4.3 Materials and Methods
4.3.1 Source of explants and surface sterilisation
All N. tabacum seeds were surface sterilised for 2 min in 70% ethanol followed by
soaking for 15 min in 3.5% commercial bleach (active ingredient 2.5% w/v sodium
hypochlorite) supplemented with a single drop of wetting agent (Tween 20). The
bleach treatment was repeated once before rinsing the seeds six times with sterile
distilled water.
4.3.2 Seed germination and growth conditions
To promote even germination on plates, the sterile seeds were stratified in 0.1%
agar at 4◦C prior to germination. The seeds were germinated and propagated
on germination medium comprising 4 g/l MS medium supplemented with 10 g/l
sucrose, 2 mg/l glycine, 0.5 g/l 2- (4-morpholino)-ethane sulfonic acid and 0.8%
agar. The pH was adjusted to 5.7.
Unless stated otherwise, all growth regulators, herbicides and antibiotics were filter
sterilised and freshly added to the media following autoclaving. All plants were
grown under the following conditions except where stated otherwise: 16 h day, 8 h
night, 24◦C and 65% humidity. Once the tobacco seeds germinated the seedlings
were transferred onto fresh media in culture bottles.
4.3.3 Transformation of N. tabacum
4.3.3.1 Gene constructs
The chimeric pTF101.1 constructs described in chapter 2, carrying the luc gene in
the sense orientation, were transformed into A. tumefaciens strain EHA101 by the
freeze-thaw method (An et al. 1988). The transformation of tobacco leaf discs was
56
Univers
ity of
Cap
e Tow
n

4.3. MATERIALS AND METHODS
according to the procedures outlined by Horsch et al. (1985). The recombinant
bacteria cultures were selected on YEP media comprising 5 g/l yeast extract, 10
g/l peptone, 5 g/l sodium chloride, 100 mg/l spectinomycin, 50 mg/l kanamycin
and 30 mg/l chloramphenicol. The pH was adjusted to 6.8.
4.3.3.2 Pre-induction of A. tumefaciens
Freshly cultured A. tumefaciens was resuspended in filter sterilised infection media.
The infection media comprised MS medium supplemented with 30 g/l sucrose, 2
mg/l glycine and 100 µM/l acetosyringone. The pH was adjusted to 5.2. Cell
cultures were incubated in the dark at 30◦C in a shaker until an optical density
(650 nm) of 0.6 was attained.
4.3.3.3 Infection of explants
Sterile tobacco leaf discs were pricked prior to slicing into uniform segments. The
leaves were immediately submerged in infection media to minimise wilting. The
leaf discs were infected for 30 min in the dark and thereafter blot dried on sterilised
filter paper. Negative controls infected with A. tumefaciens containing pTF101.1
vector were also included.
4.3.3.4 Co-cultivation of infected explants
Each infected explant was transferred to co-cultivation medium and incubated for
three days in the dark at 19◦C with the adaxial part of the leaf in contact with
the medium. The co-cultivation media comprised MS basal salts supplemented
with B5 vitamins, 30 g/l sucrose, 0.1 mg/l α-naphthaleneacetic acid, 1 mg/l 6-
benzylamino purine and 100 µM/l acetosyringone. For co-cultivation, shooting
and rooting media the pH was adjusted to 5.9.
57
Univers
ity of
Cap
e Tow
n
4.3. MATERIALS AND METHODS
4.3.3.5 Selection of putative tobacco transformants
Following co-cultivation, leaf discs were selected on shooting medium compris-
ing MS basal salts supplemented with B5 vitamins, 30 g/l sucrose, 0.1 mg/l α-
naphthaleneac-
etic acid, 1 mg/l 6-benzylamino purine, 250 mg/l carbenicillin and 2 mg/l bialaphos.
Putative transformants were subcultured fortnightly onto fresh medium until siz-
able shoots were formed. Bialaphos resistant shoots were selected and transferred
to root induction medium. The rooting media comprised half strength hormone-
free MS basal salts supplemented with 10 mg/l sucrose, 250 mg/l carbenicillin and
1 mg/l bialaphos.
4.3.4 Acclimatisation and growth of putative tobacco trans-formants
Putative transformants were transferred to pots containing sterile peat moss. The
plants were covered using transparent plastic bags to minimise dehydration. The
plants were acclimatised for eight days prior to transplanting to soil. The putative
transformants were grown in a greenhouse at 26◦C under natural lighting supple-
mented with fluorescent lamps to maintain the 16 h photoperiod. The mature
transgenic plants were self-pollinated and seeds were harvested. Transformation
efficiency was calculated as follows:
Transformation Efficiency =
{No. of Positive TransformantsNo. of Explants Transformed
}x 100
4.3.5 Germination of putative transgenic tobacco seeds
Seeds of putative tobacco transformants were surface sterilised (see section 4.3.1)
and plated on germination medium. The germination media comprised MS media
supplemented with 2 mg/l glycine, 0.5 g/l sucrose, 8 g/l agar and 2 mg/l bialaphos.
58
Univers
ity of
Cap
e Tow
n

4.3. MATERIALS AND METHODS
The pH was adjusted to 5.7. Only bialaphos-resistant seedlings were transplanted
to pots for further screening.
4.3.6 Basta screening of putative tobacco transformants
Basta screening was conducted on putative transformants. Basta (0.75%) was
supplemented with a single drop of Tween 20 and painted directly onto leaves.
Herbicide resistance was scored 5-7 days following herbicide application.
4.3.7 Detection and determination of transgene integration
The presence of luc and bar transgenes was detected by PCR amplification (see
section 3.3.4). Stable introgression of the luc transgene was determined by Southern
blot analysis. The restriction endonucleases, SpeI and BamHI were used to digest
the genomic DNA overnight at 37◦C. Hybridisation and detection of probe was
carried out using a non-radioactive, DIG Luminescent Detection Kit for nucleic
acids (see section 3.3.5). To detect Agrobacterium contamination in plant tissues,
the primer pair VCF and VCR (Sawada et al. 1995) with expected amplimer size
of 730 bp was used to detect the bacterial virC gene. The amplification conditions
was as follows: 94◦C for 150 s; 35 cycles of 94◦C for 60 s; 55◦C for 60 s, and 72◦C
for 120 s; and a final extension step of 72◦C for 7 min.
4.3.8 Dehydration treatment of transgenic tobacco
Dehydration stress was imposed by withholding water for eight days. Thereafter
stressed tobacco leaves were harvested at 0, 3, 6 and 8 days. Leaf samples from at
least three independent T2 homozygous tobacco transformants were immediately
frozen in liquid nitrogen upon harvesting and stored at −70◦C.
59
Univers
ity of
Cap
e Tow
n

4.3. MATERIALS AND METHODS
4.3.9 Determination of relative water content
The relative water content (RWC) was determined for leaf samples at each sampling
time point. The initial weight (Wini) of each sample was determined prior to
immersion in sterile distilled water. Weight at full turgor (Wft) was determined
following 24 h incubation in water. Leaf samples were dried for 2 days at 70◦C
prior to the dry weight (Wd) being determined. The formula described by Jin
et al. (2000) was used to calculate the RWC:
RWC =(Wini - Wd)
(Wft - Wd)x 100
4.3.10 Total RNA extraction, purification and cDNA syn-thesis
Total RNA was isolated from leaf samples using the TRIzol method (see section
3.3.8). Thereafter, total RNA was purified using the EZ-10 Spin Column Total
RNA Minipreps Super Kit followed by one step cDNA synthesis using random
hexamers (see section 3.3.9).
4.3.11 Analysis of luciferase activity and qRTPCR
Protein was extracted from three dehydrated independent T2 homozygous tobacco
leaf samples (see section 3.3.7). Thereafter, luciferase activity was measured using a
Modulus Microplate Multimode Reader (see section 3.3.7). The protein concentra-
tion of the extract was determined using the Braford reaction and luciferase activity
was expressed as RLU/µg protein. The relative expression of the luc transgene
was determined using qRTPCR (see section 3.3.10). Promoter activity data was
analyzed for significant difference (see section 3.3.11).
60
Univers
ity of
Cap
e Tow
n

4.4. RESULTS
4.4 Results
4.4.1 Tissue culture, transformation and growth of puta-tive transformants
Tobacco seeds used in this study were determined to be viable as germination was
observed within one week after plating onto germination media (Fig. 4.1 A). Tissue
culture of tobacco was successful and no growth hormone was required for propaga-
tion (Fig. 4.1 B). Following incubation for three days on co-cultivation media, the
infected leaf discs started to brown (Fig. 4.1 C). When non-transformed leaf discs
were transferred to shooting media containing 2 mg/l of bialaphos, total necrosis
was observed (Fig. 4.1 D). In contrast, shoots emerged on the transformed explants
with only partial necrosis observed in isolated areas of the explants (Fig. 4.1 E).
The shoots only developed roots after being transferred to the rooting media with
reduced bialaphos concentration (1 mg/l; Fig. 4.1 F). Successful acclimatisation
of the transformants was observed with all transformants surviving the hardening
process (Fig. 4.1 G). The putative transformants did not display any abnormal
phenotypes and grew normally to maturity (Fig. 4.1 H). The pollination was con-
trolled (Fig. 4.1 I) and the transformants were self-pollinated thereafter.
61
Univers
ity of
Cap
e Tow
n

4.4. RESULTS
B C
D
H G
F E
I
A
Figure 4.1: Transformation and tissue culture of N. tabacum. A: Non-transformedsterile tobacco seeds after 1 week on germination media. B: Non-transformedtobacco that served as the source of explant cultured on hormone-free propaga-tion media. C: Transformed tobacco leaf discs on co-cultivation media. D: Non-transformed tobacco leaf discs 3 weeks after infection showing total necrosis onshooting media. E: Shoots emerging from transformed leaf discs with partial necro-sis observed on non-transformed areas after 3 weeks on shoot selection media. F:Transformants forming roots on rooting media 5 weeks after infection. G: Trans-formants covered with polythene bags to minimise water loss during hardening. H:Putative transformants growing to flowering in glass house. I: Flowers of putativetransformants covered with pollination bags (scale bars: A-E = 2 cm; F-G = 3cm; H-I = 20 cm).
.
4.4.2 Germination of putative transgenic tobacco seeds
Following sterilisation, the seeds of the putative transformants were successfully
plated on germination media supplemented with 2 mg/l bialaphos (Fig. 4.2 A).
62
Univers
ity of
Cap
e Tow
n

4.4. RESULTS
Interestingly all seeds, including the non-transformed seeds, germinated (Fig. 4.2
B). However, when the seedlings were further incubated for 3 weeks on germina-
tion media, the non-transformed seedlings displayed total necrosis (Fig. 4.2 C).
The transformants of XvPsap1, XvPsap2 and XvPsap2 displayed partial survival
on bialaphos containing media (Fig. 4.2 D, E, F), respectively. Only transfor-
mants that germinated and developed at least four rosette leaves were regarded as
resistant.
F
A B
E D
C
Figure 4.2: Germination of transformed N. tabacum seeds. A: Transformed tobaccoseeds 1 day after plating. B: Non-transformed seedlings 2 weeks after plating. C:Non-transformed seedlings showing total necrosis 3 weeks after plating. D, E:and F: Seedlings transformed with XvPsap1, XvPsap2 and XvPsap3 promoterfragments, respectively showing partial necrosis 3 weeks after plating (scale bars =2 cm).
63
Univers
ity of
Cap
e Tow
n

4.4. RESULTS
4.4.3 Basta screening of putative tobacco transformantsand PCR detection
Non-transformed tobacco seedlings were observed to be susceptible to basta screen-
ing whereas transformed plants displayed tolerance (Fig. 4.3). The presence of the
luc transgene was observed following amplification with the expected 1.2 kb frag-
ment of the gene being detected (Fig. 4.4 A). All transformants that tested positive
for the luc transgene also showed the presence of the bar transgene (Fig. 4.4 B).
Transformation efficiency was greater than 55% for all constructs and there was no
significant difference among individual constructs (Table 4.1).
64
Univers
ity of
Cap
e Tow
n

4.4. RESULTSTab
le4.
1:Tra
nsf
orm
atio
neffi
cien
cyof
N.ta
bacu
m
Con
stru
ctN
o.of
tra-
No.
ofN
o.of
Tra
nsfo
rmat
ion
nsfo
rmat
ion
infe
cted
posi
tive
effici
ency±
SE*
even
tsex
plan
tstr
ansf
orm
ants
XvP
sap1
::luc
556
037
066±
6.3a
XvP
sap2
::luc
670
040
658±
9.3a
XvP
sap3
::luc
552
031
260±
5.0a
*SE
:St
anda
rdde
viat
ion
ofth
em
ean
oftr
ansf
orm
atio
nev
ents
a:
No
sign
ifica
ntdi
ffere
nce
amon
gth
ege
neco
nstr
ucts
,P
<0.
05
65
Univers
ity of
Cap
e Tow
n

4.4. RESULTS
A D C B
Figure 4.3: Basta selection of putative N. tabacum tansformants. Columns A, Band C: Plants transformed with XvPsap1, XvPsap2 and XvPsap3, respectively.D: Non-transformed plants (scale bar = 15 cm).
66
Univers
ity of
Cap
e Tow
n

4.4. RESULTS
M + - 1 2 3 4 5 6 7 8 9 10 11 12 13 M
1.2 kb
0.4 kb
L + - 1 2 3 4 5 6 7 8 9 10 11 12 13 L
B
A
Figure 4.4: Screening of putative transgenic N. tabacum by PCR for the presenceof the luc (A) and bar (B) transgenes. A: The expected 1.2 kb fragment of theluc gene was amplified. M; 100 bp DNA ladder plus (Fermentas, Canada). +: 1ng of pTF101.1 containing the luc gene. -: non-transformed N. tabacum. Planttransformed with XvPsap1 (lanes 1-5), Xvsap2 (lanes 6-9), and XvPsap3 (lanes10-13) constructs. B: The expected 421 bp fragment of the bar gene was amplified.L: 100 bp DNA ladder (Fermentas, Canada).
4.4.4 Southern blot analysis
Southern blot analysis of transgenic N. tabacum genomic DNA probed with a 1.2
kb fragment of the luc gene was performed to confirm the presence of the luc
transgene in the genome of transgenic plants and also to estimate gene copy num-
ber. The SpeI and BamHI restriction endonucleases were successfully used in the
digestion of tobacco genomic DNA. The digested genomic DNA was successfully
electrophoresed on a 1% agarose gel (Fig. 4.5 A). Capillary transfer onto nylon
membrane was also successful (Fig. 4.5 B). The expected single band (1645 bp) rep-
resenting the luc transgene was observed in all the samples. The non-transformed
67
Univers
ity of
Cap
e Tow
n

4.4. RESULTS
plants showed no hybridization product. Plants possessing transgenes at similar
copy numbers were predicted by comparing band intensities and patterns.
+ - 1 2 3 4 5 + - 6 7 8 9 10 + - 11 12 13 14 15 16
B
1.2 kb
M + - 1 2 3 4 5 + - 6 7 8 9 10 + - 11 12 13 1 4 15 16
Kb 2 1.5 1 0.5 0.25
A
Figure 4.5: Southern blot analysis of transgenic N. tabacum for the presence ofthe luc transgene. A: Digested genomic DNA separated on a 1% agarose gel. B:Autoradiograph of membrane probed with a DIG-labeled probe specific to a 1.2kb fragment of the luc gene. M: 1 kb DNA ladder (New England Biolabs, USA).Plants transformed with XvPsap1 (lanes 1-5), XvPsap2 (lanes 6-10), and XvPsap3(lanes 11-16) constructs. +: 200 pg of the 1.2 kb PCR luc fragment used tosynthesise the probe. -: genomic DNA of non-transformed tobacco.
4.4.5 Analyses of luciferase activity in transgenic plants
Following protein extraction from dehydrated tobacco leaf samples, luciferase ac-
tivity was determined. The XvPsap1 promoter recorded the highest luciferase
activity (3.97-fold; Fig. 4.6 A). The plants transformed with XvPsap2 and XvP-
68
Univers
ity of
Cap
e Tow
n

4.4. RESULTS
sap3 demonstrated lower luciferase activities of 1.4- and 1.3-fold, respectively (Fig.
4.6 A). For all the plants, luciferase activity was observed to be optimal shortly
after initiation of the dehydration stress with RWC above 70% (Fig. 4.6 B)
0
2
4
6
0 2 4 6 8 10Dehydration period (days)
RLU
/µg
XvPsap1 XvPsap2 XvPsap3
0
20
40
60
80
100
0 2 4 6 8 10Dehydration period (days)
RW
C
XvPsap1 XvPsap2 XvPsap3
A
B
Figure 4.6: Luciferase activity (A) and relative water content (B) in transgenic N.tabacum under dehydartion stress. The data are presented as means ± SEM fromthree independent homozygous tobacco transformants.
.
69
Univers
ity of
Cap
e Tow
n

4.4. RESULTS
4.4.6 Analyses of transgenic plants by qRTPCR
The ability of the promoter fragments to express the luc gene under dehydration
stress was determined by qRTPCR. Optimal expression levels were observed three
days after initiating the dehydration stress. The increase in XvPsap1 activity was
significant (7-fold; P< 0.05) in transgenic tobacco whereas XvPsap2 and XvPsap3
displayed lower increases of 2.2- and 1.6-fold, respectively.
02468
10
0 2 4 6 8 10Dehydration period (days)
Rel
ativ
e ex
pres
sion
XvPsap1 XvPsap2 XvPsap3
Figure 4.7: Expression profile curves of luc transcripts in transgenic N. tabacumfollowing dehydration treatment. The data are presented as means ± SEM fromthree independent homozygous tobacco transformants.
70
Univers
ity of
Cap
e Tow
n

4.5. DISCUSSION
4.5 Discussion
Transcription factors or trans-acting factors are capable of specifically binding with
cis-acting elements in the promoter domains located upstream of genes. These fac-
tors therefore control the expression of downstream genes and regulate various
physiological and biochemical reactions (Kasuga et al. 2004). In this study, the
activity of the three XvPsap promoter fragments was demonstrated in N. tabacum.
Of the promoter fragments, XvPsap1 displayed the highest activity. Optimal activ-
ity was recorded shortly after initiation of dehydration when RWC was above 70%.
This suggests that XvPsap1 may be involved in early response to abiotic stress.
This observation is consistent with the XvPsap1 activity in BMS cells reported in
chapter 3. Given that the promoter originated from a monocot system, the ob-
served activity in tobacco clearly points to the fact that the XvPsap1 promoter has
overcome possible cross-species hindrances. This is not unique. In previous stud-
ies, trans-species application of promoters has been reported. For example, Shiqing
et al. (2005) reported the successful application of the stress-inducible rd29A pro-
moter from Arabidopsis in generating transgenic wheat tolerant to drought and
salt stress.
Transgenic plants generated in this study within the same transformation event,
were observed to exhibit varying promoter activity. This phenomenon is correlated
to a variety of factors such as uncertain insertion site of the transgene in the
genome, instability of gene expression caused by multiple copy numbers (Finnegan
& McElroy 1994), as well as DNA methylation which ultimately causes transgenic
silence (Srivastava et al. 1999).
Bialaphos was used in this study to select the putative transformants. Interestingly,
the seeds of both the transformed and non-transformed controls also germinated on
media containing bialaphos. However, longer incubation periods on the same media
inhibited the growth of non-transformed plants. This observation is attributable to
the fact that bialaphos is a unique tripeptide composed of alanylalanine and phos-
71
Univers
ity of
Cap
e Tow
n
4.5. DISCUSSION
phinothricin joined by a C-P-C bond (Kunitaka 2003), wherein phosphinothricin
inhibits glutamine synthetase, accumulates ammonia, and inhibits photosynthesis
in plants (White et al. 1990).
Since tobacco is susceptible to Agrobacterium infection and has established regen-
eration protocol (Florack et al. 1994, Kasuga et al. 2004), higher transformation
efficiencies of above 60% were achieved in this study. All transgenic plants that
tested positive for the presence of the luc transgene also showed the presence of the
bar transgene. This is a significant difference to the findings observed in chapter
3 where BMS cells were transformed via particle bombardment. The fact that the
bar and luc transgenes were cloned within the T-DNA region of a single vector ex-
plains the difference in the results obtained. Furthermore, Agrobacterium-mediated
transformation displays desirable precision in terms of insertional loci (Deroles &
Gardner 1988, Cluster et al. 1996, Frame et al. 2002, Vain et al. 2003, Afolabi et al.
2004, Frame et al. 2006, Crowell et al. 2008). For instance, while elucidating the
T-DNA integration category and mechanism in the rice genome, Jiang et al. (2005)
found that the integrated ends of the T-DNA right border occurred mainly on five
nucleotides (TGACA) in inverse repeat sequence of 25 bp, especially on the third
base A.
Overexpression of genes has been reported to cause abnormal phenotypes such as
dwarfism (Su et al. 1998). For instance, transgenic tomato overexpressing CBF1
demonstrated the dwarf phenotype under unstressed normal growth conditions
(Hsieh et al. 2002a,b). However, the use of the stress-inducible rd29A promoter
instead of the constitutive 35S CaMV promoter for the overexpression of DREB1A
in transgenic Arabidopsis and tobacco, has been reported to minimise the negative
effects on plant growth (Kasuga et al. 1999, 2004). The transgenic tobacco plants
generated in this study did not display any significant abnormal agronomic traits
compared to the wild type. This may be attributed to the fact that XvPsap1 is
stress-inducible.
72
Univers
ity of
Cap
e Tow
n

4.5. DISCUSSION
Overall, this study has demonstrated the activity of XvPsap1 promoter in a model
system, namely tobacco. Since this study is part of a larger project that seeks
to transform maize for drought tolerance, the activity of the XvPsap1 promoter
in maize remains uncertain. As a result, the Agrobacterium tumefaciens-mediated
transformation of maize is reported in chapter 5.
73
Univers
ity of
Cap
e Tow
n

Chapter 5
Functional analysis of XvPsap1promoter activity in transgenicZea mays
5.1 Summary
Analysis of the promoter fragments in transgenic BMS cells and N. tabacum re-
vealed XvPsap1 as the most active of the three promoter fragments. Consequently,
only the XvPsap1 construct was selected for further analyses in maize. Transforma-
tion of maize was achieved by Agrobacterium-mediated transformation. Southern
blot and qRTPCR analyses were conducted on transgenic maize leaves following
dehydration for eight days. Luciferase activity peaked (2.2-fold increase) on the
third day of dehydration stress and was followed by a significant decline there-
after. The expression profile of luc transcripts displayed an optimal expression of
4-fold after three days of stress treatment. The transgenic maize were observed
to display normal growth with insignificant phenotypic variations. These results
demonstrate that the XvPsap1 promoter is both active and stress-inducible. The
XvPsap1 promoter could therefore find application in the generation of transgenic
drought tolerant monocot plants.
74
Univers
ity of
Cap
e Tow
n

5.2. INTRODUCTION
5.2 Introduction
Maize is mainly used for two purposes in industrialised countries: (i) to feed ani-
mals directly in the form of grain and forage or sold to the feed industry; and (ii) as
raw material for extractive industries, indicating that maize has little significance
as human food (Morris 1998). However, in developing countries especially in sub-
Saharan Africa, maize serves as a staple food. Cereals production has been reported
to decline in sub-Saharan Africa due to abiotic stresses (Kelemu et al. 2003). In
the past, attempts to improve crops for drought tolerance employed conventional
breeding (Lamkey 2002). However, with the advances in genetic engineering, accel-
erated by the limitations of conventional breeding, plant transformation has now
gained wide application.
In both transgenic BMS cells (chapter 3) and tobacco (chapter 4) the XvPsap1
promoter was observed to be the most active. Given that this study is part of a
larger project that aims to genetically engineer maize for drought tolerance, the fo-
cus of this part of the study was to transform Z. mays using the XvPsap1 promoter
fragment expressing the luc transgene by A. tumefaciens-mediated transformation.
Luciferase expression and relative activity is described. The main objective was to
determine the XvPsap1 activity in whole maize.
75
Univers
ity of
Cap
e Tow
n

5.3. MATERIALS AND METHODS
5.3 Materials and Methods
5.3.1 Source of explants and growth conditions
Maize plants of inbred line (A188) grown either in the field or green house were
used as the source of immature embryos. Planting was routinely conducted every
three weeks to ensure constant supply of explants. Prompt weeding, top dressing,
mulching and regular watering twice a week were performed to promote healthy
growth and development of plants. Pollination was controlled (Appendix A.5) and
the self-pollinated ears were harvested for transformation experiments.
5.3.2 Surface sterilisation and dissection of immature em-bryos
Maize ears 13 days post-pollination, with embryo sizes ranging between 1-3 mm
in length, were harvested. The ears were either used immediately or stored for a
maximum of 3 days at 4◦C while still in the husk. Dehusked ears were thereafter
surface sterilised for 3 min in 70% ethanol followed by soaking for 18 min in 3.5%
commercial bleach (active ingredient 2.5% w/v sodium hypochlorite) supplemented
with a singe drop of wetting agent (Tween 20). Ears were rinsed three times with
sterile distilled water prior to embryo dissection (Appendix A.6).
5.3.3 Gene construct
The recombinant pTF101.1 vector containing the XvPsap1 promoter expressing the
luc gene was transformed into A. tumefaciens strain EHA 101 by the freeze-thaw
method (An et al. 1988). The recombinant bacterial culture was selected on YEP
and sodium chloride medium supplemented with the appropriate antibiotics (see
section 4.3.3.1). The transformation of immature maize embryos was according to
the procedures outlined by Frame et al. (2002) with modifications.
76
Univers
ity of
Cap
e Tow
n
5.3. MATERIALS AND METHODS
5.3.3.1 Pre-induction of A. tumefaciens
The A. tumefaciens cultures were resuspended in filter sterilised infection media.
The cell cultures were incubated in the dark at 30◦C in a shaker until the appro-
priate bacterial optical density was attained (see section 4.3.3.2). The infection
media comprised basal MS salts and modified Linsmaier and Skoog (LS) vitamins
(Linsmaier & Skoog 1965) supplemented with 68.4 g/l sucrose, 36 g/l glucose, 2
mg/l 2,4-dichlorophenoxyacetic acid, 1 mg/l casein hydrolysate and filter sterilised
100 µM/l acetosyringone. The pH was adjusted to 5.2. The modified LS vitamin
comprised 0.5 mg/l nicotinic acid, 0.5 mg/l pyridoxine, 1 mg/l thiamine and 100
mg/l myoinositol.
5.3.3.2 Infection and co-cultivation of immature maize embryos
Immature embryos were immersed for 5 min in pre-induced A. tumefaciens in the
dark followed by blot drying on sterilised filter paper. Thereafter, the infected em-
bryos were cultured for three days on co-cultivation media in the dark at 19◦C, with
the embryo axis in contact with the media. The co-cultivation media comprised
basal MS salts and modified LS vitamins supplemented with 0.7 g/l proline, 30 g/l
sucrose, 10 g/l glucose, 1.5 mg/l 2,4-dichlorophenoxyacetic acid, 0.5 g/l MES, 8
g/l agar and 100 µM/l acetosyringone. The pH was adjusted to 5.8.
5.3.4 Resting of the infected embryos
Following co-cultivation, the infected embryos were initially washed 3-4 times with
sterile distilled water. This was followed by 2 times washing with liquid MS me-
dia containing 250 mg/l cefotaxime to eliminate residual bacteria prior to blot
drying. The embryos were subcultured on resting media and incubated for 10
days in the dark at 26◦C. The resting media comprised basal MS salts and mod-
ified LS vitamins supplemented with 0.7 g/l proline, 30 g/l sucrose, 1.5 mg/l 2,4-
77
Univers
ity of
Cap
e Tow
n

5.3. MATERIALS AND METHODS
dichlorophenoxyacetic acid, 0.5 g/l MES, 1.6 mg/l silver nitrate, 8 g/l agar, 250
mg/l cefotaxime and 250 mg/l carbenicillin.
5.3.5 Selection of the putatively transformed calli
Calli were selected for 2 weeks on selection I media in the dark at 26◦C. The se-
lection media comprised basal MS salts and modified LS vitamins supplemented
with 0.7 g/l proline, 30 g/l sucrose, 1.5 mg/l 2,4-dichlorophenoxyacetic acid, 0.5
g/l MES, 8 g/l agar, 1.5 mg/l bialaphos, 250 mg/l cefotaxime and 250 mg/l car-
benicillin. Thereafter, the bialaphos resistant calli were transferred to selection II
media for a period of 6 weeks with fortnightly subculturing to fresh media. Selec-
tion II media was identical to selection I media except that bialaphos concentration
was doubled to 3 mg/l. The putatively transformed somatic embryos were matured
by subculturing on somatic maturation media for 2 weeks in the dark. Somatic
maturation media was identical to selection II media except that the sucrose con-
centration was increased to 60 mg/l and 1 mg/l α-napthaleneacetic acid and 2 mg/l
glycine added. The bialaphos resistant calli were transferred to MS hormone-free
regeneration media to develop shoots and roots at 26◦C under the 16 h light and
8 h dark photo-regime. The MS hormone-free media comprised basal MS salts
and modified LS media supplemented with 0.7 g/l proline, 30 g/l sucrose, 2 mg/l
glycine, 250 mg/l cefotaxime, 250 mg/l carbenicillin and 8 g/l agar.
5.3.6 Acclimatisation and growth of putative maize trans-formants
Putative maize transformants were hardened for seven days (see section 4.3.4 for
conditions). The transformation efficiency was calculated (see section 4.3.4). The
putative transformants were self-pollinated and the seeds harvested.
78
Univers
ity of
Cap
e Tow
n

5.3. MATERIALS AND METHODS
5.3.7 Basta screening and PCR detection of putative maizetransformants
The transformed seeds were germinated in hydrated vermiculite prior to basta
treatment (see section 4.3.6). The presence of luc and bar transgenes was detected
by PCR amplification using gene specific primers (see section 3.3.4).
5.3.8 Southern blot analysis
Transgenic maize genomic DNA was digested overnight at 37◦C using SpeI and
BamHI. Hybridisation and detection of probe was carried out using a non-radioactive,
DIG Luminescent Detection Kit for nucleic acids (see section 3.3.5). The full length
luc gene (1656 bp) was used to synthesise the probe using primer pair Luc-BamHI
F and Luc-SpeI R2 (Appendix B.5). Any A. tumefaciens contamination in plant
tissues was detected using primer pair VCF and VCR (see section 4.3.7).
5.3.9 Dehydration treatment
Dehydration stress was induced by withholding water for eight days. Stressed maize
leaves were harvested at 0, 3, 6 and 8 days. Leaf samples were immediately frozen
in liquid nitrogen upon collection and thereafter stored at −70◦C. Dehydration
treatment was done on independent T1 maize leaf samples.
5.3.10 Analysis of luciferase activity and determination ofRWC
The relative water content of the maize plants was calculated (see section 4.3.9).
Protein was extracted from dehydrated independent T1 maize leaf samples and
luciferase activity measured (see section 3.3.7).
79
Univers
ity of
Cap
e Tow
n

5.3. MATERIALS AND METHODS
5.3.11 Total RNA extraction, cDNA synthesis and qRT-PCR analysis
Total RNA for each treatment was extracted from T1 maize leaf samples using
the TRIzol method (see section 3.3.8). A one step cDNA synthesis using random
hexamers was conducted (see section 3.3.9). The qRTPCR was performed using the
SYBR green method. Gene specific primers qRTLuc F1 and qRTLuc R2 (Appendix
B.5) were used. The 18S rRNA was used as the internal control. The data were
normalised and analysed (see section 3.3.10).
80
Univers
ity of
Cap
e Tow
n

5.4. RESULTS
5.4 Results
5.4.1 Transformation and selection of putative maize trans-formants
Following infection, the immature embryos were transferred onto co-cultivation
media (Fig. 5.1 A). Browning of the infected immature embryos was observed
especially when the infection period was elongated. Visible calli appeared within
5-10 days on resting media. However, longer incubation on resting media resulted
in elongated radicles (Fig. 5.1 B). Under selection media lacking bialaphos, growth
of non-transformed calli was sustained (Fig. 5.1 C). The selection media containing
3 mg/l bialaphos inhibited the growth of non-transformed embryos (Fig. 5.1 D).
Transformed embryos formed compact, opaque, white to pale yellow embryogenic
calli on selection media containing 3 mg/l bialaphos (Fig. 5.1 E). However, when
transferred to regeneration media in light, the colour of embryogenic calli initially
turned green followed by root and shoot development within 7-14 days (Fig. 5.1
F).
5.4.2 Acclimatisation, growth and development of the pu-tative maize transformants
Acclimatisation was successful as all the putative transformants survived the process
(Fig. 5.2 A). The transformants grew normally without noticeable abnormal traits
(Fig. 5.2 B). The putative transformants were self-pollinated (Fig. 5.2 C) and the
ears were covered by pollination bags to maturity (Fig. 5.2 D). The seeds were
harvested thereafter. However, tassel seeds were observed (Fig. 5.2 E). A total of
13 putative transformants were generated from three transformation events with a
transformation efficiency of 2.3% (Table 5.1).
81
Univers
ity of
Cap
e Tow
n

5.4. RESULTS
A C B
FE D
Figure 5.1: Transformation and selection of putative immature zygotic Z. maystransformants. A: Transformed immature zygotic maize embryos on co-cultivationmedia. B: Transformed immature zygotic maize embryos on resting media lackingbialaphos. C: Non-transformed calli 4 weeks after initiation on selection II medialacking bialaphos. D: Non-transformed immature zygotic embryos (negative con-trol) 4 weeks after infection showing total necrosis on selection II media containing3 mg/l bialaphos. E: Transformed maize calli 4 weeks after infection showing par-tial necrosis on selection II media. F: Shoots and roots developed on hormone-freeregeneration media (scale bars: A-E = 2.5 cm; F = 3 cm).
82
Univers
ity of
Cap
e Tow
n

5.4. RESULTS
A B
C D E
Figure 5.2: Acclimatisation, growth and development of putative Z. mays transfor-mants. A: Putative maize transformants covered with polythene bags to minimizewater loss during hardening. B: Putative maize transformants in pots containingloam soil mixed with sand and phytomix growing to flowering. C: Putative maizetransformants covered with pollination bags to control cross pollination. D: Earsof the putative maize transformants covered after pollination to develop seeds. E:Putative maize transformants showing tassel seed formation (scale bars: A = 5cm; B, C, E = 10 cm; D = 2 cm).
83
Univers
ity of
Cap
e Tow
n

5.4. RESULTSTab
le5.
1:Tra
nsf
orm
atio
neffi
cien
cyof
Z.
may
susi
ng
XvP
sap1:
:luc
const
ruct
No.
oftr
a-N
o.of
No.
ofTra
nsfo
rmat
ion
Ave
rage
nsfo
rmat
ion
infe
cted
posi
tive
effici
ency
tran
sfor
mat
ion
even
tsem
bryo
str
ansf
orm
ants
Effi
cien
cy±
SE*
I24
05
2.1
II32
02
0.6
III
140
64.
32.
3±1.
8a
*SE
:St
anda
rdde
viat
ion
ofth
etr
ansf
orm
atio
nev
ents
a:
No
sign
ifica
ntdi
ffere
nce
amon
gth
etr
ansf
orm
atio
nev
ents
,P
<0.
05
84
Univers
ity of
Cap
e Tow
n

5.4. RESULTS
5.4.3 Basta screening of putative maize transformants andPCR detection
All transformed maize seeds germinated in hydrated vermiculite (Fig. 5.3 A).
The seedlings were successfully transferred to pots containing soil prior to basta
treatment (Fig. 5.3 B). Non-transformed maize seedlings were observed to be
susceptible to basta screening (Fig. 5.3 C) whereas transformed plants displayed
tolerance (Fig. 5.3 D). The presence of the luc transgene was detected by amplifying
the expected 1.2 kb fragment of the gene (Fig. 5.4 A). All transformants that tested
positive for the luc transgene also showed the presence of the bar transgene (Fig.
5.4 B).
B
D
A
C
Figure 5.3: Germination and basta screening of putative maize transformants. A:Transformed maize seeds germinated on moist vermiculite. B: Transformed maizeseedlings transferred to pots containing loam soil mixed with sand and phytomix.C: Non-transformed maize seedlings susceptible to basta. D: Putative maize trans-formants tolerant to basta (scale bars: A = 5 cm; B-D = 10 cm).
85
Univers
ity of
Cap
e Tow
n
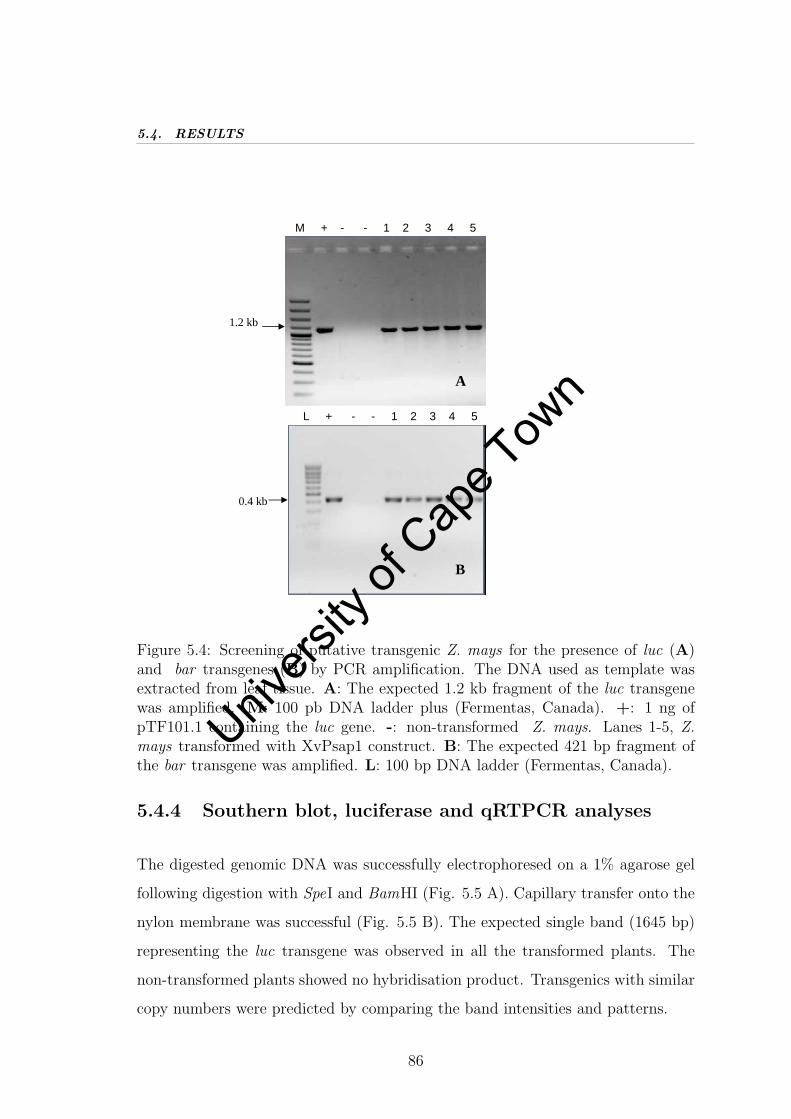
5.4. RESULTS
M + - - 1 2 3 4 5
1.2 kb
A
0.4 kb
L + - - 1 2 3 4 5
B
Figure 5.4: Screening of putative transgenic Z. mays for the presence of luc (A)and bar transgenes (B) by PCR amplification. The DNA used as template wasextracted from leaf tissue. A: The expected 1.2 kb fragment of the luc transgenewas amplified. M: 100 pb DNA ladder plus (Fermentas, Canada). +: 1 ng ofpTF101.1 containing the luc gene. -: non-transformed Z. mays. Lanes 1-5, Z.mays transformed with XvPsap1 construct. B: The expected 421 bp fragment ofthe bar transgene was amplified. L: 100 bp DNA ladder (Fermentas, Canada).
5.4.4 Southern blot, luciferase and qRTPCR analyses
The digested genomic DNA was successfully electrophoresed on a 1% agarose gel
following digestion with SpeI and BamHI (Fig. 5.5 A). Capillary transfer onto the
nylon membrane was successful (Fig. 5.5 B). The expected single band (1645 bp)
representing the luc transgene was observed in all the transformed plants. The
non-transformed plants showed no hybridisation product. Transgenics with similar
copy numbers were predicted by comparing the band intensities and patterns.
86
Univers
ity of
Cap
e Tow
n

5.4. RESULTS
The transgenic maize displayed mild luciferase activity (2.2-fold; P< 0.05; Fig. 5.6).
However, qRTPCR demonstrated a significant peak in luc expression (4.5-fold; P<
0.05; Fig. 5.7) following three days of dehydration stress.
0.5
M + + + - - 1 2 3 4 5 6 7 8 9 10 11 + + + - - 1 2 3 4 5 6 7 8 9 10 11
Kb 3 2 1.5
A B
Figure 5.5: Southern blot analysis of transgenic Z. mays for the presence of theluc transgene. A: Digested genomic DNA separated on a 1% agarose gel. B:Autoradiograph of membrane probed with a DIG-labeled probe specific to the lucgene. M: 1 kb DNA ladder (New England Biolabs, USA). Plants transformed withXvPsap1 construct (lanes 1-11). +: 200 pg of the full length PCR luc gene (1656bp) used to synthesise the probe. -: genomic DNA of non-transformed maize.
87
Univers
ity of
Cap
e Tow
n

5.4. RESULTS
0
20
40
60
80
100
0 3 6 8Dehydration period (days)
RW
C
0
1
2
3
4
5
RLU
/µg
RWC Relative light unit (RLU/µg)
Figure 5.6: Luciferase activity in transgenic maize plants under dehydration stress.The RWC (bars) is plotted on the primary axis and the luciferase activity (line) isplotted on the secondary axis. Luciferase activity was expressed as relative lightunits (RLU)/µg of protein. The data are presented as means ± SEM from threeindependent maize transformants.
0
2
4
6
8
0 2 4 6 8 10Dehydration period (days)
Rel
ativ
e ex
pres
sion
XvPsap1
Figure 5.7: Expression profile of luc transcripts in transgenic maize following de-hydration treatment. The data are presented as means ± SEM from three inde-pendent maize transformants
88
Univers
ity of
Cap
e Tow
n

5.5. DISCUSSION
5.5 Discussion
In the present study a transformation efficiency of 2.3% was achieved. These results
are consistent with the findings of Frame et al. (2002) who reported a transforma-
tion efficiency that ranged from 1.1% to 22.2% in transgenic maize generated by
Agrobacterium-mediated transformation. However, these values are still low given
that higher transformation efficiencies greater than 50% have been reported for
other monocots such as rice (Ali et al. 2007) and wheat (Wu et al. 2008). This
observation is attributable to the fact that the transfer of T-DNA from bacterium
to plant cell is a tightly regulated process and multiple factors from both plant
and bacterial cells are simultaneously required for the transformation process (Tz-
fira & Citovsky 2002). Parameters for the optimal activity of Agrobacterium such
as acidic pH (Turk et al. 1991), the presence of phenolic inducers such as ace-
tosyringone (Hei et al. 1999) and sugar sources (Cangelosi et al. 1990) were used
in this study. However, variations in Agrobacterium-mediated transformation ef-
ficiency has been reported to be genotype- as well as strain-dependent (Ali et al.
2007). For instance, Agrobacterium strain EHA105 is reported to exhibit maximal
activity at pH 6.0 irrespective of explant genotype (Ali et al. 2007).
The low transformation efficiency reported in this study can additionally be at-
tributed to the fact that no multiple vir genes were used in the helper plasmid.
Recently, Wu et al. (2008) reported that the presence of an additional virG gene
in pAL155 and virG, virB, virC in pAL154 had beneficial effects, both on T-DNA
delivery or transient expression and on the numbers of stable transgenic wheat
plants obtained.
Shortly after transfer onto regeneration media, somatic embryos initially turned
green prior to the development of shoots and roots. Germination of somatic em-
bryos has been reported to be accompanied by the up-regulation of a number of
stress response and membrane transporter genes, and that greening is associated
with the up-regulation of many genes encoding photosynthetic and chloroplast
89
Univers
ity of
Cap
e Tow
n

5.5. DISCUSSION
components (Che et al. 2006).
The presence of bialaphos in the regeneration media appeared to slow the regen-
eration of the transformed maize calli. Consequently, regeneration media lacked
bialaphos in this study. This observation emphasises the fact that phosphinothricin
inhibits photosynthesis in plants (White et al. 1990). Although transformed maize
calli possessed phosphinothricin acetyl transferase enzyme and are therefore ex-
pected to detoxify bialaphos, the stress imposed by bialaphos may have contributed
to the slow regeneration process observed.
The activity of the XvPsap1 promoter in whole maize was assessed in the present
study. The fact that the activity peaked shortly after initiating dehydration stress
strongly suggests the involvement of the promoter in early responses to drought
stress. Furthermore, these results are consistent with the XvPsap1 activity ob-
served in transgenic BMS cells (chapter 3) and tobacco (chapter 4).
Whereas growth and development of maize transformants did not display abnor-
mal traits, tassel seeds were occasionally observed. This phenomenon could be
associated with the fact that tissue culture could result in both epigenetic and
heritable variation (Larkin & Scowcroft 1981, Jain 2001). Moreover, activation of
transposons (Hirochika et al. 1996), DNA amplification, point mutations, altered
methylation patterns (Pereza-Echeverria et al. 2001) have been shown to contribute
to variation among tissue culture generated plants (Phillips et al. 1994). Further-
more, in spite of rigorous selection for transgenic cells during transformation and
regeneration, chimeric plants carrying transgenic and non-transgenic tissues have
been reported to persist in T0 generation (Berthomieu et al. 1994) especially in
transgenics generated by shoot tip transformation procedures. The magnitude and
type of variation that arise due to somaclonal variation are usually unpredictable
and not strictly controllable (Karp 1995).
Most variations observed among transgenics relate to the traits that are directly
expected to be influenced by the transgene (Bhat & Srinivasan 2002). However,
90
Univers
ity of
Cap
e Tow
n

5.5. DISCUSSION
in the present study the transgenic plants that formed tassel seeds did not display
other unwanted phenotypes such as dwarfism commonly associated with transgenic
plants containing constitutive promoters. This observation strongly points to the
fact that the XvPsap1 is indeed stress-inducible.
It is important to note that gene expression in an organism is influenced by a
complex interaction of external factors and internal products. Therefore, transgene
expression reported in this study cannot be viewed in isolation. However, in light
of these results, the XvPsap1 promoter could therefore find application in the
generation of transgenic drought tolerant monocot plants.
91
Univers
ity of
Cap
e Tow
n

Chapter 6
General Discussion
Yield losses of major cereals such as maize, rice and wheat caused by abiotic stresses
represent a significant economic and political factor and contribute to food short-
ages in many under-developed countries. In sub-Saharan Africa, it is estimated
that one third of all children go to bed hungry and have their mental and physical
development compromised by poor nutrition (Rosegrant et al. 2001, Toenniessen
et al. 2003).
The application of biotechnology within the agricultural sector can potentially im-
prove food security by making crops more tolerant to adverse weather and soil
conditions thus improving yields. According to Abdalla et al. (2003), the poten-
tial gains from the uptake of biotechnology are highest for developing countries,
particularly those in the low income regions.
With the yield losses attributed to drought stress increasing, so is the need to
develop transgenic drought tolerant crops. In order to avoid the unwanted phe-
notypes commonly observed when transgenes are constitutively expressed, use of
stress-inducible promoters is therefore desirable. Whereas the application of stress-
inducible promoters such as rd29A from Arabidosis (Kasuga et al. 2004, Shiqing
et al. 2005, Pino et al. 2007), ABRC from barley (Lee et al. 2003) and SWPA2
from sweetpotato (Kim et al. 2003) have been reported, the current knowledge and
availability of stress-inducible promoters is still insufficient.
92
Univers
ity of
Cap
e Tow
n
The results reported here not only strongly advance the search for a novel stress-
inducible promoter but also meet the primary objective of this study, of assessing
the XvPsap promoter activity in different plant systems. The novelty of the pro-
moter was confirmed as no significant similarity with any known plant promoter
was observed. The presence of various cis-acting elements usually associated with
abiotic stress responsiveness was predicted and various constructs were generated.
To augment such computational predictions, the activity of the XvPsap promoters
in BMS suspension cells was assessed. The XvPsap1 fragment was revealed to be
the most active. It was postulated that the promoter activity observed in BMS cells
would not apply for whole plants. Importantly, the activity of the XvPsap promoter
in a dicot system would extend its application regarding crop improvement. As a
result, the activity of the XvPsap promoters was assessed in tobacco. The XvPsap1
fragment was observed to be the most active. Given that this study is part of
a larger project that seeks to genetically engineer maize for drought tolerance,
analysis of the XvPsap promoters in maize is imperative. Since, analysis of the
promoter fragments in transgenic BMS cells and N. tabacum revealed XvPsap1
as the most active of the three promoter fragments, the XvPsap1 fragment was
selected and used to transform maize. The XvPsap1 promoter was observed to be
both active and stress-inducible. The results reported in this study emphasise the
potential utility of the XvPsap1 promoter with respect to improving crops such as
maize for drought tolerance.
In conclusion, genetic transformation has the potential to play a significant role
in more rapidly advancing agricultural productivity in developing countries while
protecting the environment for future generations. Accordingly, and in a separate
study, generation of drought tolerant transgenic maize has been initiated, using
constructs containing genes postulated to confer drought tolerance regulated by
the XvPsap1 promoter.
93
Univers
ity of
Cap
e Tow
n
6.1. RECOMMENDATIONS FOR FUTURE WORK
6.1 Recommendations for future work
The presence of a cis-acting element involved in salicylic acid responsiveness sug-
gests that the XvPsap1 promoter may be involved in biotic stress response. Sali-
cylic acid is recognised as an endogenous signal, mediating in plant defense against
pathogens by inducing the production of pathogenesis-related proteins (Galis &
Matsuoka 2007). To extend the application of the XvPsap1 promoter to include
generation of transgenic crops tolerant to biotic stress, analysis of the XvPsap1
promoter activity following biotic stress needs to be assessed.
Stress-inducible promoters usually present the limitation of low activity. Therefore
specific nucleotide deletions or insertions aimed at creating additional known cis-
acting regulatory sites needs to be performed in order to enhance the activity of
the XvPsap1. Such manipulations would create new binding sites for a variety of
transcription factors thus widening the application of the XvPsap1 promoter. Fur-
thermore, the activity of XvPsap1 promoter compared to other existing inducible
promoters such as Rd29A needs to studied. Inducibility of XvPsap1 promoter
under light and MeJA also calls for further studies.
One of the criticism of the first-generation transgenic plants is the application of
antibiotic resistant genes for selection thus presenting the potential risk of gene
flow. The new transplastomic crops (Ahmadabadi et al. 2007, De Marchis et al.
2009) are likely to be free of this undesirable trait, as there already exit various
protocols for the production of marker-free transplastomic plants (Maliga & Small
2007). Since consumer acceptance in the market place is the bottom line, future
work involving the XvPsap1 promoter should employ such new technologies in order
to address sensitive issues related to the risks perceived by the consumers, which
slows the process of commercialisation of genetically modified organisms. Moreover,
generation of cisgenics involving the transfer of genes from the same species should
also be explored in order to minimise resistance to genetically modified organisms.
94
Univers
ity of
Cap
e Tow
n

References
Abdalla, A., Berry, P., Connell, P., Tran, Q. T. & Buetre, B. (2003), Agricul-
tural biotechnology: Potential for use in developing countries, Technical report,
ABARE eReport 03.17.
Afolabi, A. S., Worland, B., Snape, J. W. & Vain, P. (2004), ‘A large-scale study of
rice plants transformed with different T-DNAs provides new insights into locus
composition and T-DNA linkage configurations.’, Theor. Appl. Genet. 109, 815–
826.
Ahmadabadi, M., Ruf, S. & Bock, R. (2007), ‘A leaf-based regeneration and trans-
formation system for maize (Zea mays L.)’, Transgenic Res. 16, 437–448.
Aiyar, A. (2000), ‘The use of CLUSTAL W and CLUSTAL X for multiple sequence
alignment’, Meth. Mol. Biol. 132, 221–241.
Ajanga, S. & Hillocks, R. J. (2000), ‘Maize cob rot in Kenya and its association
with stalk borer damage’, Crop Protection 19, 297–300.
Akula, A., Akula, C. & Henry, R. (1999), ‘Improved regeneration efficiency from
mature embryos of barley cultivars’, Biologia Plantarum 42, 505–513.
Ali, S., Xianyin, Z., Xue, Q., Hassan, M. J. & Qian, H. (2007), ‘Investigations
for improved genetic transformantion by Agrobacterium tumefaciens in two rice
cultivars’, Biotechnology 6(1), 138–147.
Alpert, P. (2005), ‘The limits and frontiers of desiccation-tolerant life’, Integr.
Comp. Biol. 45, 485–495.
95
Univers
ity of
Cap
e Tow
n

REFERENCES
Alpert, P. (2006), ‘Constraints of tolerance: why are desiccation-tolerant organisms
so small or rare?’, J. Exp. Biol. 209, 1575–1584.
Altschul, S. F., Gish, W., Miller, W., Myers, E. W. & Lipman, D. J. (1990), ‘Basic
local alignment search tool’, Nucl. Acids. Res. 215, 403–410.
An, G., Ebert, P. R., Mitre, A. & Ha, S. B. (1988), Binary vectors, in S. B. Gelvin
& R. A. Schilperoort, eds, ‘Plant molecular biology manual’, Dordrecht, Kluwer,
p. 119.
Anthony, J., Buhr, W. L., Ronhovde, D., Genovesi, G., Lane, D., Yingling, T.,
Aves, R., Rosato, M. K. & Anderson, P. (1997), Transgenic maize with elevated
10 kd zein and methionine, in W. Cram, ed., ‘Sulphur Metabolism in Higher
Plants: Molecular, Ecophysiological and Nutrition Aspects’, Backhuys Publish-
ers, pp. 295–297.
Armstrong, C. L. & Green, C. E. (1985), ‘Establishment and maintenance of friable,
embryogenic maize callus and involvement of L-proline’, Planta 164, 207–214.
Bailey, T. L. & Elkan, C. (1995), ‘Unsupervised learning of multiple motifs in
biopolymers using expectation maximization’, Mach Learn 21, 51–80.
Bajic, V. B., Tan, S. L., Suzuki, Y. & Sugano, S. (2004), ‘Promoter prediction
analysis on the whole human genome’, Nat. Biotechnol. 22, 1467–1473.
Barnabas, B., Jager, K. & Feher, A. (2008), ‘The effect of drought and heat on
reproductive processes in cereals’, Plant, Cell and Envir. 31, 11–38.
Berthomieu, P., Beclin, Charlot, F., Dore, C. & Jouanin, L. (1994), ‘Routine trans-
formation of rapid cycling cabbage (Brassica oleracea)-molecular evidence for
regeneration of chimeras,’, Plant Sci. 96, 223–235.
Bevan, M. (1984), ‘Binary Agrobacterium vectors for plant transformation’, Nucleic
Acids Res. 12, 8711–8721.
96
Univers
ity of
Cap
e Tow
n

REFERENCES
Bevan, M. W., Flavell, R. B. & Chilton, M. D. (1983), ‘A chimaeric antibiotic-
resistance gene as a selectable marker for plant cell transformation.’, Nature
304, 184–187.
Bhat, S. R. & Srinivasan, S. (2002), ‘Molecular and genetic analyses of transgenic
plants: Considerations and approaches’, Plant Science 163, 673–681.
Bohnert, H. J., Su, H. & Shen, B. (1999), Molecular mechanisms of salinity toler-
ance, in K. Shinozaki & K. Yamaguchi-Shinozaki, eds, ‘Molecular Responses to
Cold, Drought, Heat, and Salt Stress in Higher Plants’, R.G. Landes Company,
Austin, TX., pp. 29–62.
Bohorova, N. E., Luna, B., Briton, R. M., Huerta, L. D. & Hoistington, D. A.
(1995), ‘Regeneration potential of tropical, and subtropical, mid altitude, and
highland maize inbreds’, Maydica 40, 275–281.
Bradford, M. M. (1976), ‘A rapid and sensitive method for the quantitation of
microgram quantities of protein utilizing the principal of protein-dye binding.’,
Anal. Biochem 72, 248–254.
Bray, E. (1993), ‘Molecular responses to water deficit’, Plant Physiol. 103, 1035–
1040.
Bray, E. A. (1997), ‘Plant responses to water deficit’, Trends in Plant Science
2, 1360–1385.
Brunner, A. M., Yakovlev, I. A. & Strauss, S. H. (2004), ‘Validating internal con-
trols for quantitative plant gene expression studies’, BMC Plant Biology p. 4:14.
Bulow, L., Steffens, N. O., Galuschka, C., Shindler, M. & Hehl, R. (2006),
‘Athamap: from in silico data to real transcription factor binding sites’, In Silico
Biol 6, 23.
Butler, J. E. & Kadonaga, J. T. (2002), ‘The RNA polymerase II core promoter: a
97
Univers
ity of
Cap
e Tow
n

REFERENCES
key component in the regulation of gene expression’, Genes Dev. 16(20), 2583–
2592.
Cangelosi, G. A., Ankenbauer, R. G. & Neste, E. W. (1990), ‘Sugars induce
the Agrobacterium virulence genes through a periplasmic binding protein and a
Compton, M. E. 1999. dark pre-treatment improves adventitious shoot organo-
genesis from cotyledons of diploid watermelon.’, Plant Cell Tissue and Organ
Culture 58, 185–188.
Carey, M. & Smale, S. T. (2001), Concepts and strategies: I. promoter and the
general transcription machinery, in ‘Transcriptional regulation in eukaryotes’,
Cold Spring Harbor Laboratory Press, New York.
Carvalho, C. H. S., Bohorova, N., Bordallo, P. N., Abreu, L. L., VaJicentle, F. R.,
Bressan, W. & Paiva, E. (1997), ‘Type II callus production and plant regenera-
tion in tropical maize genotypes’, Plant Cell Reports 17, 73–76.
Che, P., Love, T. M., Frame, B. R., Wang, K., Carriquiry, A. L. & Howell, S. H.
(2006), ‘Gene expression patterns during somatic embryo development and ger-
mination in maize Hi II callus cultures’, Plant Mol. Biol. 62, 1–14.
Chiera, J. M., Lindbo, J. A. & Finer, J. J. (2008), ‘Quantification and extension
of transient GFP expression by the co-introduction of a suppressor of silencing’,
Transgenic Res. 17, 1143–1154.
Chomczynski, P. & Sacchi, N. (1987), ‘Single-step method of RNA isolation by
acid guanidinium thiocyanate-phenol-chloroform extraction.’, Anal. Biochem.
162, 156–159.
Cluster, P., Odell, M., Metzlaff, M. & Flavell, R. (1996), ‘Details of t-dna structural
organization from a transgenic petunia population exhibiting co-suppression’,
Plant Mol. Biol. 32, 11971203.
98
Univers
ity of
Cap
e Tow
n

REFERENCES
Cong, L., Zheng, H., Zhang, Y. & Chai, T. (2008), ‘Arabidopsis DREB1A con-
fers high salinity tolerance and regulates the expression of GA dioxygenases in
tobacco’, Plant Science 174, 156–164.
Conger, B. V., Novak, F. J., Afza, R. & Erdelsky, K. E. (1987), ‘Somatic embryo-
genesis from cultured leaf segments of Zea mays ’, Plant Cell Reports 6, 345–347.
Conner, A. J. & Jacob, J. M. E. (1999), ‘Genetic engineering of crops as potential
source of genetic hazard in the human diet.’, Mutation Res. 443, 223–234.
Crowell, E. F., McGrath, J. M. & Douches, D. S. (2008), ‘Accumulation of vitamin
e in potato (Solanum tuberosum) tubers’, Transgenic Res. 17, 205217.
Dai, S., Zhang, P., Marmey, P., Zhang, S., Tian, W., Chen, S., Beachy, R. N.
& Fauquet, C. (2001), ‘Comparative analysis of transgenic rice plants obtained
by agrobacterium -mediated transformation and particle bombardment,’, Mol.
Breed. 7, 69–79.
DaSilva, E. J., Baydoun, E. & Badran, A. (2002), ‘Biotechnology and the develop-
ing world’, Electronic Journal of Biotechnology 5(1), 64–92.
Davuluri, R. V., Sun, H., Palaniswamy, S. K., Matthews, N., Molina, C., Kurtz, M.
& Grotewold, E. (2003), ‘GRIS: Arabidopsis gene regulatory information server,
an information resource of Arabidopsis cis-regulatory elements and transcription
factors.’, ABMC Bioinformatics 4, 25.
Day, R. N., Kawecki, M. & Berry, D. (1998), ‘Dual-function reporter protein for
analysis of gene expression in living cells’, Bio. Techniques 25(5), 848–856.
De Buck, S., De Wilde, C., Van Montagu, M. & Depicker, A. (2000), ‘T-DNA
vector backbone sequences are frequently integrated into the genome of trans-
genic plants obtained by Agrobacterium-mediated transformation’, Mol. Breed.
6, 459–468.
99
Univers
ity of
Cap
e Tow
n
REFERENCES
De Marchis, F., Wang, Y., Stevanato, P., Arcioni, S. & Bellucci, M. (2009), ‘Genetic
transformation of the sugar beet plastome’, Transgenic Res. 18, 17–30.
Dehestani, A. & Tabar, S. K. K. (2007), ‘A rapid efficient method for DNA isolation
from plants with high levels of secondary metabolites’, Asian Journal of Plant
Sciences 6(6), 977–981.
Deroles, S. C. & Gardner, R. (1988), ‘Analysis of the T-DNA structure in a large
number of transgenic petunias generated by Agrobacterium-mediated transfor-
mation’, Plant Mol. Biol. 11, 365–377.
DeVries, J. & Toenniessen, G. (2001), Securing the harvest: Biotechnology, breeding
and seed systems for African crops, CABI, New Yolk.
Draper, J., Davey, M. R., Freeman, J. P., Cocking, E. C. & Cox, B. J. (1982), ‘Ti
plasmid homologous sequences present in tissues from Agrobacterium plasmid
transformed petunia protoplasts’, Plant Cell Physiol. 23, 451–458.
Dunder, E., Dawson, J., Suttie, J. & Pace, G. (1995), Maize transformation by mi-
croprojectile bombardment of immature embryos, in I. Potrykus & G. Spanger-
berg, eds, ‘Gene Transfer to Plants’, Springer-Verlag, Berlin, pp. 127–138.
Edmeades, G. O., Bolanos, J., Chapman, S. C., Lafitte, H. R. & Banziger, M.
(1999), ‘Selection improves tolerance to mid/late season drought in tropical maize
populations. I. Gains in biomass, grain yield and harvest index’, Crop Science
39, 1306–1315.
El-Itriby, A. H., Assem, S. K., Hussein, E. H. A., Abdel-Galil, F. M. & Madkour,
M. A. (2003), ‘Regeneration and transformation of egyptian maize inbred lines
via immature embryo culture and biolistic particle delivery system’, In vitro
Cellular and Development Biology-Plant 39, 524– 531.
Ericksen, P. (2008), ‘Conceptualizing food systems for global environmental change
research’, Global Environmental Change 18 (1), 234–245.
100
Univers
ity of
Cap
e Tow
n

REFERENCES
Finnegan, L. & McElroy, D. (1994), ‘Transgene interaction: Plant fight back’,
Biotechnol. Adv. 12, 883–888.
Florack, D. E. A., Dirkse, W. G., Visser, B., Heidekamp, F. & Stiekema, W. J.
(1994), ‘Expression of biologically active hordothionins in tobacco. effects of pre-
and pro-sequences at the amino- and carboxyl-termini of the hordothionin pre-
cursor on mature protein expression and sorting’, Plant Mol. Biol. 24, 83–96.
Fluminhan, A., De Aguir-Perencin, M. L. R. & Dos Santos, J. A. (1996), ‘Evi-
dence for heterochromatin involvement in chromosome breakage in maize callus
culture’, Annals of Botany 78, 73–81.
Fraley, R. T., Rogers, S. G., Horsch, R. B., Sanders, P. R., Flick, J. S., Adams,
S. P., Bittner, M. L., Brand, L. A., Fink, C. L., Fry, J. S., Galluppi, G. R.,
Goldberg, S. B., Hoffmann, N. L. & Woo, S. C. (1983), ‘Expression of bacterial
genes in plant cells’, Proc. Natl. Acad. Sci. 80, 4803–4807.
Frame, B. R., McMurray, J. M., Fonger, T. M., Main, M. L., Taylor, K. W., Torney,
F. J., Paz, M. M. & Wang, K. (2006), ‘Improved Agrobacterium-mediated trans-
formation of three maize inbred lines using ms salts’, Plant Cell Rep 25, 1024–
1034.
Frame, B. R., Shou, H., Chikwamba, R. K., Zhang, Z., Xiang, C., Fonger, T. M.,
Pegg, S. E. K., Li, B., Nettleton, D. S., Pei, D. & Wang, K. (2002), ‘Agrobac-
terium tumefaciens-mediated transformation of maize embryos using a standard
binary vector system’, Plant Physiology 129, 13–22.
Frame, B. R., Zhang, H., Cocciolone, S. M., Sidorexko, L. V., Dietrich, C. R., Pegg,
S. E. K., Zhen, S., Schnable, P. S. & Wang, K. (2000), ‘Production of transgenic
maize from bombarded type ii callus: effect of gold particle size and callus mor-
phology on transformation efficiency’, In vitro Cell Development Biology- Plant
36, 21–29.
101
Univers
ity of
Cap
e Tow
n

REFERENCES
Fromm, M., Taylor, L. P. & Walbot, V. (1985), ‘Expression of genes transferred
into monocot and dicot plant cells by electroporation’, Proc. Natl. Acad. Sci.
82, 5824–5828.
Fujimori, S., Washio, T. & Tomita, M. (2005), ‘Gc-compositional strand bias
around transcription start sites in plants and fungi’, BMC Genomics 6(1), 26.
Gaff, D. F. (1987), ‘Desiccation tolerant plants in South America’, Oecologia
74, 133–136.
Galis, I. & Matsuoka, K. (2007), Transcriptomic analysis of salicylic acid-responsive
genes in tobacco by-2 cells, in ‘Salicylic Acid: A Plant Hormone’, Springer
Netherlands, pp. 371–396.
Gallie, D. (1996), ‘Translational control of cellular and viral mrnas.’, Plant MoI.
Biol 32, 145–158.
Galun, E. & Breiman, A. (1996), Transgenic plants, Imperical College Press, USA.
Garwe, D., Thomson, J. A. & Mundree, S. G. (2003), ‘Molecular characterization
of XvSap1, a stress-responsive gene from the resurrection plant Xerophyta viscosa
Baker ’, J. Exp. Bot. 54, 191–201.
Garwe, D., Thomson, J. A. & Mundree, S. G. (2006), ‘XvSap1 from Xerophyta
viscosa improves osmotic-, salinity and highh-temperature-stress tolerance in
Arabidopsis ’, Biotechnology Journal. 1(10), 1137–1146.
Gordon-Kamm, W. J., Mangano, T. J., Adams, M. L., Daines, T. R., Start, W. G.,
O’Brien, J. V., Chambers, S. A., Adams, W. R., Willets, N. G., Rice, T. B.,
Mackey, C. J., Krueger, R. W., Kausch, A. P. & Lemaux, P. G. (1990), ‘Trans-
formation of maize cells and regeneration of fertile transgenic plants’, Plant Cell
Reports 2, 603–618.
Govender, K. (2006), Characterisation of XvPrx2, a type II peroxiredoxin isolated
102
Univers
ity of
Cap
e Tow
n

REFERENCES
from the resurrection plant Xerophyta viscosa, Baker, PhD Thesis, University of
Cape Town.
Green, C. E. & Phillips, R. L. (1975), ‘Plant regeneration from tissue culture of
maize’, Crop Science 15, 417–421.
Greenway, H. & Munns, R. (1980), ‘Mechanisms of salt tolerance in non-
halophytes’, Annual Review of Plant Physiology 31, 149190.
Hamilton, C. M., Frary, A., Lewis, C. & Tunksley, S. D. (1996), ‘Stable transfer
of intact high molecular weidgt dna into plant chromosomes’, Proc. Natl. Acad.
Sci USA 93, 9975–9979.
Hano, C., Addi, M., Fliniaux, O., Bensaddek, L., Duverger, E., Mesnard, F., Lam-
blin, F. & Eric Laine, E. (2008), ‘Molecular characterization of cell death induced
by a compatible interaction between Fusarium oxysporum f. sp. linii and flax
(Linum usitatissimum) cells’, Plant Physiology and Biochemistry 46, 590–600.
Hartung, W., Schiller, P. & Dietz, K. (1998), ‘Physiology of poikilohydric plants’,
Progress in Botany 59, 299–327.
Harwood, W. A., Ross, S. M., Bulley, S. M., Travella, S., Busch, B., Harden, J.
& Snape, J. W. (2002), ‘Use of the firefly luciferase gene in a barley (Hordeum
vulgare) transformation system’, Plant Cell Rep. 21, 320–326.
Hasegawa, P. M., Bressan, R. A., Zhu, J. K. & Bohnert, H. J. (2000), ‘Plant cellular
and molecular responses to high salinity’, Annual Review of Plant Physiology and
Plant Molecular Biology 51, 463–499.
Hehl, R. & Wingender, E. (2001), ‘Database-assisted promoter analysis’, Trends
Plant Sci. 6, 251–255.
Hei, Y., Komari, T. & Kubo, T. (1999), Agrobacterium-madiated transformation,
in K. Shimamoto, ed., ‘Molecular Biology of rice’, Springer, Heidelberg, pp. 235–
255.
103
Univers
ity of
Cap
e Tow
n

REFERENCES
Hernalsteens, J. P., Vanvliet, F., Debeuckeleer, M., Depicker, A., Engler, G., Lem-
mers, M., Holsters, M., Van Montagu, M. & Schell, J. (1980), ‘The Agrobacterium
tumefaciens Ti plasmid as a host vector system for introducing foreign DNA in
plant cells.’, Nature 287, 654–656.
Herrera-Estrella, L., Depicker, A., Van Montagu, M. & Schell, J. (1983), ‘Expres-
sion of chimaeric genes transferred into plant cells using a Ti-plasmid-derived
vector.’, Nature 303, 209–213.
Higo, K., Ugawa, Y., Iwamoto, M. & Korenaga, T. (1999), ‘Plant cis-acting regu-
latory DNA elements (PLACE) database’, Nucl. Acids Res. 270, 297–30.
Hirochika, H., Sugimoto, K., Tsugawa, H. & Kauda, M. (1996), ‘Retrotransposons
of rice involved in mutations induced by tissue culture’, Proc. Natl. Acad. Sci.
93, 7783–7788.
Hodges, T. K., Kamo, K. K., Imbrie, C. W. & Becwar, M. R. (1986), ‘Genotype
specificity of somatic embryogenesis and regeneration in maize’, Biotechnology
4, 219–224.
Hoekema, A., Hirsch, P. R., Hooykaas, P. J. J. & Schilperoort, R. A. (1983), ‘A
binary plant vector strategy based on separation of Vir-region and T-region of
the Agrobacterium tumefaciens Ti-plasmid’, Nature 303, 179–180.
Holmberg, N. & Bulow, L. (1998), ‘Improving stress tolerance in plants by gene
transfer’, Trends in Plant Science 3, 61–66.
Hooykaas, P. J. J. & Schilperoort, R. A. (1992), ‘Agobacterium and plant genetic
engineering’, Plant Mol. Biol. Rep. 19, 15–38.
Horsch, R. B., Fry, J. E., Hoffman, N. C., Eicholtz, D., Rogers, S. G. & Fraley,
R. T. (1985), ‘A simple and general method for transforming gene into plants.’,
Science 227, 1229–1231.
104
Univers
ity of
Cap
e Tow
n

REFERENCES
Hsieh, T. H., Lee, J. T., Charng, Y. Y. & Chan, M. T. (2002a), ‘Tomato plants ec-
topically expressing Arabidopsis CBF1 show enhanced resistance to water deficit
stress’, Plant Physiol 130, 618–626.
Hsieh, T. H., Lee, J. T., Yang, P. T., Chiu, L. H., Charng, Y. Y., Wang,
Y. C. & Chan, M. T. (2002b), ‘Heterology expression of the Arabidopsis C-
repeat/dehydration response element binding factor 1 gene confers elevated tol-
erance to chilling and oxidative stresses in transgenic tomato.’, Plant Physiol.
129, 1086–1094.
Huang, X. Q. & Wei, Z. M. (2004), ‘High frequency plant regeneration through
callus initiation from mature embryos of maize’, Plant Cell Reports 22, 793–
800.
Hughes, J. D., Estep, P. W., Tavazoie, S. & Church, G., M. (2000), ‘Computational
identification of cis-regulatory elements associated with groups of functionally
related genes in Saccharomyces cerevisiae’, J. Mol. Biol. 296, 1205–1214.
Iglesias, V. A., Moscone, E., Papp, I., Neuhuber, F., Michalowaski, S., Phelan, T.,
Spiker, S., Matzke, M. & Matzke, A. J. M. (1997), ‘Molecular and cytogenetic
analyses of stably and unstably expressed transgenic loci in tobacco’, Plant Cell
9, 1251–1264.
Ingram, J. & Bartels, D. (1996), ‘The molecular basis of dehydration tolerance in
plants’, Annu. Rev. Plant. Physiol. 47, 377– 403.
Inocencio, A., Ally, S. H. & Errey, M. D. J. (2003), Innovative approaches to agri-
cultural water improving food security in sub-Saharan Africa, Technical report,
International water management Institute.
IPCC (2007), The physical science basis. contribution of working Group I to the
Fourth Assessment Report of the Intergovernmental Panel on Climate Change, in
S. Solomon, D. Qin, M. Manning, Z. Chen, M. Marquis, K. B. Averyt, M. Tignor
105
Univers
ity of
Cap
e Tow
n

REFERENCES
& H. L. Miller, eds, ‘Climate Change 2007’, Cambridge University Press, Cam-
bridge, United Kingdom and New York, NY, USA, p. 996.
Ishida, Y., Satto, H., Ohta, S., Hiei, Y., Komari, T. & Kumashiro, T. (1996), ‘High
efficiency transformation of maize (Zea mays L.) mediated by Agrobacterium
tumefaciens ’, Nature Biotechnology 14, 745 –750.
Iyer, R., Mundree, S. G., Rafudeen, M. S. & Thomson, J. A. (2007), XvSap1, a
Desiccation Tolerance Associated Gene with Potential for Crop Improvement,
in M. A. Jenks & A. J. Wood, eds, ‘Plant Desiccation Tolerance’, Blackwell
Publishing Ltd, Oxford, UK, pp. 283–296.
Jain, S. M. (2001), ‘Tissue culture-derived variation in crop improvement’, Euphyt-
ica 118, 153–166.
Jaiwal, P. K., Sahoo, L., Singh, N. D. & Singh, R. P. (2002), ‘Strategies to deal
with the concern about marker genes in transgenic plants: Some environment
friendly approaches’, Current Science 83(2), 128–136.
Jiang, W., Lin, L., Zhen-Ying, S., Xin-Shan, W., Lin-Sheng, A. & Jing-Liu, Z.
(2005), ‘T-DNA Integration Category and Mechanism in Rice Genome’, Journal
of Integrative Plant Biology 47(3), 350–361.
Jin, S., Chen, C. C. S. & Plant, A. L. (2000), ‘Regulation by aba of osmotic
stress-induced changes in protein synthesis in tomato root’, Plant Cell Environ.
23, 51–60.
Jorgensen, R., Cluster, P., Que, Q., English, J. & Napoli, C. (1996), ‘Chalcone
synthase cosuppression phenotypes in Petunia flowers: comparison of sense vs.
antisense constructs and single vs. complex TDNA sequences’, Plant Mol. Biol.
31, 957–973.
Karp, A. (1995), ‘Somaclonal variation as a tool for crop improvement’, Euphytica
85, 295–302.
106
Univers
ity of
Cap
e Tow
n

REFERENCES
Kasuga, M., Liu, Q., Miura, S., Yamaguchi-Shinozaki, K. & Shinozaki, K. (1999),
‘Improving plant drought, salt, and freezing tolerance by gene transfer of a single-
inducible transcription factors.’, Nature Biotechnology 17, 287–291.
Kasuga, M., Miura, S., Shinozaki, K. & Yamaguchi-Shinozaki, K. (2004), ‘A combi-
nation of the Arabidopsis DREB1A Gene and Stress-Inducible rd29A Promoter
Improved Drought- and Low-Temperature Stress Tolerance in Tobacco by Gene
Transfer’, Plant Cell Physiol. 45(3), 346–350.
Kelemu, S., Mahuku, G., Fregene, M., Pachico, D., Johnson, N., Calvert, L., Rao,
I., Buruchara, R., Amede, T., Kimani, P., Kirkby, R., Kaaria, S. & Ampofo,
K. (2003), ‘Harmonizing the agricultural biotechnology debate for the benefit of
African farmers’, African Journal of Biotechnology 2 (11), 394–416.
Kim, K. Y., Kwon, S. Y., Lee, H. S., Hur, Y., Bang, J. W. & Kwak, S. S. (2003), ‘A
novel oxidative stress-inducible peroxidase promoter from sweetpotato: molecu-
lar cloning and characterization in transgenic tobacco plants and cultured cells.’,
Plant MoI. Biol 51(6), 831–838.
Kishore, G. & Shewmaker, C. (1999), ‘Biotechnology: Enhancing human nutrition
in developing and developed worlds’, Proceedings of the National Academy of
Sciences USA 96, 5968–5972.
Kling, J. G. & Edmeades, G. (1997), Morphology and growth of maize,
IITA/CIMMYT Research Guide 9, Ibadan, Nigeria.
Koch, M. A., Weisshaar, B., Kroymann, J., Haubold, B. & Mithell-Olds, T. (2001),
‘Comparative genomics and regulaory evolution: Conservation and function of
the Chs and Apetala3 promoters’, Mol. Biol. Evol. 18, 1882–1891.
Kononov, M., Bassuner, B. & Gelvin, S. (1997), ‘Integration of T-DNA binary
vector backbone sequences into tobacco genome: evidence of multiple complex
patterns of integration’, Plant J. 10, 165–174.
107
Univers
ity of
Cap
e Tow
n

REFERENCES
Krens, F. A., Molendijk, L., Wullems, G. J. & Schilperoort, R. A. (1982), ‘In vitro
transformation of plant protoplasts with Ti-plasmid DNA’, Nature 296, 72–74.
Kunitaka, T. (2003), ‘Bialaphos, a natural herbicide’, Scientific Reports of Meiji
Seika Kaisha 42, 44–57.
Lal, S., Gulyani, V. & Khurana, P. (2008), ‘Overexpression of HVA1 gene from
barley generates tolerance to salinity and water stress in transgenic mulberry
(Morus indica)’, Transgenic Res. 17, 651–663.
Lamkey, K. (2002), Gmo’s gene flow: A plant breeding perspective., in ‘Biotech-
nology, Gene Flow, and Intellectual Property Rights’, Purdue University.
Larkin, P. J. & Scowcroft, S. C. (1981), ‘Somaclonal variation- a novel source of
variability from cell cultures for crop improvement’, Theor. Appl. Genet. 60, 197–
214.
Lawrence, C. E., Altschul, S. F., Boguski, M. S., Liu, J. S., Neuwald, A. F. &
Wootton, J. C. (1993), ‘Detecting subtle sequence signals: a Gibbs sampling
strategy for multiple alignment’, Science 262, 208–214.
Lea, P. J., Parry, M. A. J. & Medrano, H. (2004), ‘Improving resistance to drought
and salinity in plants’, Ann. appl. Biol. 144, 249–250.
Lee, J. T., Prasad, V., Yang, P. T., Wu, J. F., David Ho, T. H., Charng,
Y. Y. & Chan, M. T. (2003), ‘Expression of Arabidopsis CBF1 regulated by
an ABA/stress inducible promoter in transgenic tomato confers stress tolerance
without affecting yield’, Plant, Cell and Environment 26, 1181–1190.
Lescot, M., Dhais, P., Moreau, Y., De Moor, B., Rouz, P. & Rombauts, S. (2002),
‘PlantCARE: a database of plant cis-acting regulatory elements and a portal to
tools for in silico analysis of promoter sequences.’, Nucleic Acids Res., Database
issue 30(1), 325–327.
108
Univers
ity of
Cap
e Tow
n

REFERENCES
Lin, C., Hong-Chun, Z., Yu-Xiu, Z. & Tuan-Yao, C. (2008), ‘Arabidopsis DREB1A
confers high salinity tolerance and regulates the expression of GA dioxygenases
in Tobacco’, Plant Science 174, 156–164.
Lindsey, K. & Jones, M. G. K. (1998), Plant Biotechnology in Agriculture.
Linsmaier, E. M. & Skoog, F. (1965), ‘Organic growth factor requirements of to-
bacco tissue cultures’, Physiologia Plantarum 18, 100–27.
Liu, Q., Kasuga, M., Sakuma, Y., Abe, H., Miura, S., Yamaguchi-Shinozaki, K.
& Shinozaki, K. (1998), ‘Two transcriptional factors, DREB1 and DREB2, with
an EREBP/AP2 DNA binding domain separate two cellular signal transduction
pathways in drought and low temperature-responsive gene expression, respec-
tively, in Arabidopsis ’, Plant Cell 10, 1391–1406.
Livak, K. J. (1997), ‘Comparative Ct method. ABI Prism 7700 Sequence Detection
System.’, PE Applied Biosystems User Bulletin no. 2 .
Lynch, R. E., Wiseman, B. R., Plaisted, D. & Warnick, D. (1999), ‘Evaluation of
transgenic sweet corn hybrids expressing CryIA(b) toxin for resistance to corn
earworm and fall armyworm (Lepidoptera: Noctuidae).’, J. Econ. Entomol. .
92, 246–252.
Machuka, J. (2001), ‘Agricultural biotechnology for Africa. African scientists and
farmers must feed their own people’, Plant Physiology 126, 16–19.
Maliga, P. & Small, I. (2007), ‘Plant biotechnology 2007: all three genomes make
contributions to progress’, Current Opinion in Biotechnology 18, 97–99.
Messeguer, X., Escudero, R., Farre, D., Nunez, O., Martinez, J. & Alba, M. M.
(2002), ‘PROMO: detection of known transcription regulatory elements using
species-tailored searches’, Bioinformatics 18, 333–334.
Morris, M. L. (1998), Overview of the world maize economy, in M. L. Morris, ed.,
109
Univers
ity of
Cap
e Tow
n

REFERENCES
‘Maize Seed Industries in Developing Countries’, Lynne Rienner Publishers Inc.
and CIMMYT, International, pp. 13–34.
Mosmann, T. (1983), ‘Rapid colorimetric assay for cellular growth and survival:
Application to proliferation and cytotoxicity assays’, J. Immunol. Meth 65, 55–
63.
Mowla, S. B., Thomson, J. A., Farrant, J. M. & Mundree, S. G. (2002), ‘A novel
stress-inducible antioxidant enzyme identified from the resurrection plant Xero-
phyta viscosa Baker.’, Planta 215, 716–726.
Mundree, S. G., Baker, B., Mowla, S., Peters, S., Marais, S., Vander-Willigen, C.,
Govender, K., Maredza, A., Muyanga, S., Farrant, J. M. & Thomson, J. A.
(2002), ‘Physiogical and molecular insights into drought tolerance.’, African
Journal of Biotechnology 1, 28–38.
Mundree, S. G. & Farrant, J. M. (2000), Some physiological and molecular insights
into the mechanisms of dessication tolerance in the resurrection plant Xerophyta
viscosa Baker,, in J. C. e. al, ed., ‘Plant Tolerance to Abiotic Stresses in Agricul-
ture: Role of Genetic Engineering.’, Kluwer Academic Publishers, Netherlands,
pp. 201–222.
Murashige, T. & Skoog, F. (1962), ‘A revised medium for rapid growth and bioas-
says with tobacco cultures’, Physiol. Plant 15, 473.
Murillo-Amador, B., Cortes-Avila, A., Troyo-Dieguez, E., Nieto-Garibay, A., Jones,
H. G. & . (2001), ‘Effects of NaCl salinity on growth and production of young
cladodes of Opuntia ficus-indica, J. Agron.’, Crop Sci. 187, 269–279.
O’Connor-Sanchez, A., Cabrera-Ponce, J. L., Valdez-Melara, M., TeI1ez-
Rodriguez, P., Pons-Hernandez, J. L. & Herrera-Estrella, L. (2002), ‘Transgenic
maize plants of tropical and subtropical genotypes obtained from calluses con-
taining organogenic and embryogenic-like structures derived from shoot tips.’,
Plant Cell Reports 21, 302–312.
110
Univers
ity of
Cap
e Tow
n

REFERENCES
Oduor, R. O., Njagi, E. N. M., Ndungu, S. & Machuka, J. S. (2006), ‘In vitro
Regeneration of Dryland Kenyan Maize Genotypes Through Somatic Embryoe-
nesis’, Intl. J. Bot. 2(2), 146–151.
Ohler, U. & Niemann, H. (2001), ‘Identification and analysis of eukaryotic promot-
ers: recent computational approaches’, Trends Genet 17, 56–60.
Oliver, M. J. & Bewley, J. D. (1997), ‘Desiccation tolerance of tissues: A mecha-
nistic overview’, Horticultural review 18, 171–214.
Ow, D. W., Wood, K., DeLuca, M., de Wet, J. R., Helinski, D. R. & Howell, S. H.
(1986), ‘Transient and stable expression of the firefly luciferase gene in plant cells
and transgenic plants’, Science 234, 856–859.
Owor, B. E. (2008), Maize Streak Virus (MSV) diversity in Uganda and the as-
sessment of gene silencing as a tool for development of resistance to MSV, PhD
thesis, University of Cape Town.
Ozgen, M., Tilret, M., Altmok, S. & Sancak, C. (1998), ‘Efficient Callus culture
induction and plant regeneration from mature embryo culture of winter wheat
(Triticum aestivum L) genotypes.’, Plant Cell Reports 18, 331–335.
Pardey, P. G. & Wright, B. D. (2003), Agricultural R and D, productivity, and
global food prospects. In: Plants, genes, and crop biotechnology, American So-
ciety of Plant Biologists, ASPB Education Foundation, and Jones and Bartlett
Publishers, Sudbury, MA. pp 22-51.
Pareddy, D. R. & Petolino, J. F. (1990), ‘Somatic embryogenesis and plant re-
generation from immature inflorescences of several elite inbreds of maize’, Plant
Science 67, 211–219.
Paszkowski, J., Shillito, R. D., Saul, M., Mandak, V., Hohn, T., Hohn, B. &
Potrykus, I. (1984), ‘Direct gene transfer to plants’, EMBO J. 3, 2717–2722.
111
Univers
ity of
Cap
e Tow
n

REFERENCES
Pereza-Echeverria, S., Herra-Valencia, V. A. & James, A. (2001), ‘Detection of
DNA methylation changes in micropropagated banana plants using methylation-
sensitive amplification polymorphism (MSAP)’, Plant Sci. 161, 359–367.
Peschke, V. M. & Phillips, R. L. (1992), ‘Genetic implications of somaclonal vari-
ation in plants’, Advances in Genetics 30, 41–75.
Phillips, R. L., Kaeppler, S. M. & Olhoft, P. (1994), ‘Genetic instability of plant
tissue cultures: breakdown of normal controls’, Proc. Natl. Acad. Sci. 91, 5222–
5226.
Pilcher, C. D., Rice, M. E., Obrycki, J. J. & Lewis, L. C. (1997), ‘Field and
laboratory evaluations of transgenic Bacillus thuringiensis corn on secondary
Lepidopteran pests (Lepidoptera: Noctuidae).’, J. Econ. Entomol. 90, 669–678.
Pino, M., Skinner, J. S., Park, E., Jecknic, Z., Hayes, P. M., Thomashow, M. F.
& Chen, T. H. H. (2007), ‘Use of a stress inducible promoter to drive ectopic
AtCBF expression improves potato freezing tolerance while minimizing negative
effects on tuber yield’, Plant Biotechnology Journal 5(5), 591–604.
Plumb, J. A., Milroy, R. & Kaye, S. B. (1989), ‘Effects of the ph dependence of 3-
(4,5-dimethylthiazol-2-yl)-2,5-diphenyltetrazolium bromide-formazan absorption
on chemosensitivity determined by a novel tetrazolium-based assay1’, Cancer
research 49, 4435–4440.
Pollak, L. M. & White, P. J. (1995), Corn as a Food Source in the United States:
Part I. Historical and Current Perspectives. Cereal Foods World, Technical re-
port.
Porembski, S. & Barthlott, W. (2000), ‘Granitic and gneissic outcrops (insel-
bergs) as centers for diversity for desiccation tolerant vascular plants’, Plant.
Ecol 151, 19–28.
112
Univers
ity of
Cap
e Tow
n

REFERENCES
Potenza, C., Alemana, L. & Sengupta-Gopalan, C. (2004), ‘Invited review: Tar-
geting transgene expression in research, agricultural, and environmental appli-
cations: Promoters used in plant transformation’, In Vitro Cellular and Devel-
opmental Biology - Plant 40(1), 1–22.
Ramajulu, S. & Bartels, D. (2002), ‘Drought- and desiccation-induced modulation
of gene expression in plants’, Plant, Cell and Environment 25, 141–151.
Rasmussen, J. L., Kikkert, J. R., Roy, M. K. & Sanford, J. C. (1994), ‘Biolistic
transformation of tobacco and maize suspension cells using bacterial cells as
microprojectiles’, Plant Cell Reports 13, 212–217.
Ray, D. S. & Ghosh, P. D. (1990), ‘Somatic embryogenesis and plant regeneration
from cultured leaf explants of zea mays’, Annal of Botany 66, 497–500.
Reynolds, P. H. S. (1999), Inducible Gene Expression in Plants, CABI Publishing,
Oxon, UK.
Rhodes, C. A., Green, C. E. & Phillips, R. L. (1986), ‘Factors affecting tissue
culture initiation from maize tassels’, Plant Science 46, 225–232.
Rombauts, S., De hais, P., Van Montagu, M. & Rouze, P. (1999), ‘PlantCARE, a
plant cis-acting regulatory element database’, Nucl. Acids Res. 27, 295–297.
Rosegrant, M. W., Paisner, M. S., Meijer, S. & Witcover, J. (2001), 2020
Global Food Outlook, Trends, Alternatives, and Choices: A 2020 Vision for
Food,Agriculture, and the Environment Initiative., Technical report, Interna-
tional Food Policy Research Institute.
Rozen, S. & Skaletsky, H. (2000), ‘Primer3 on the www for general users and for
biologist programmers’, Methods Mol Biol 132, 365–386.
Rueb, S., Leneman, M., Schilperoort, R. A. & Hensgens, L. A. M. (1994), ‘Efficient
plant regeneration through somatic embryogenesis from callus induced on mature
113
Univers
ity of
Cap
e Tow
n
REFERENCES
rice embryos (Oryza sativa L.)’, Plant Cell Tissue and Organ Culture 36, 259–
264.
Sambrook, J., Fritsch, E. F. & Maniatis, T. (1989), Molecular cloning. A laboratory
manual, 2nd edn, Cold Springs Harbor Laboratory Press, Cold Spring Harbor,
NY.
Sambrook, J. & Russell, D. W. (2001), Molecular cloning. A laboratory manual,
3rd edn, Cold Spring Harbor, Cold Springs Harbor Laboratory Press, New York.
Sanchez, C., Monneveux, P., Beck, D. & Edmeades, G. O. (2006), ‘Drought tol-
erance improvement in tropical maize source populations: evidence of progress’,
Crop Science 46, 180–191.
Sanford, J. C., Klein, T. M., Wolf, E. D. & Allen, N. (1987), ‘Delivery of sub-
stances into cells and tissues using a particle bombardment process’, J. Part.
Sci. Technol. 5, 27–37.
Santos, M. A., Tome, J. M. & Blanco, J. L. (1984), ‘Methods of obtaining maize
totipotent tissues. i. seedling segments culture’, Plant Science Letter 33, 309–315.
Sawada, H., Ieki, H. & Matsuda, I. (1995), ‘PCR detection of Ti and Ri plasmids
from phytopathogenic Agrobacterium strains’, Appl Environ Microbiol 61, 828–
831.
Schunmann, P. H. D., Richardson, A. E., Vickers, C. E. & Delhaize, E. (2004),
‘Promoter analysis of the barley Pht1;1 phosphate transporter gene identifies
regions controlling root expression and responsiveness to phosphate deprivation’,
Plant Physiology Preview pp. 1–10.
Sharma, K., Bhatnagar-Mathur, P. & Thorpe, T. (2005), ‘Genetic transformation
technology: Status and problems’, In Vitro Cell and Developmental Biology Plant
41, 102–112.
114
Univers
ity of
Cap
e Tow
n
REFERENCES
Shepherd, D. N., Mangwende, T., Martin, D. P., Bezuidenhout, M., Kloppers,
F. J., Carolissen, C. H., Monjane, A. L., Rybicki, E. P. & Thomson, J. A.
(2007), ‘Maize streak virus-resistant transgenic maize: a first for africa’, Plant
Biotechnology Journal 5, 759 – 767.
Sherwin, H. W. & Farrant, J. M. (1998), ‘Protection mechanisms against excess
light in the resurrection plants Craterostigma wilmsii and Xerophyta viscosa.’,
Plant Growth Regulation 24, 203–210.
Shillito, R. D., Carswell, G. K., Johnson, C. M., DiMaio, J. J. & Harms, C. T.
(1989), ‘Regeneration of fertile plants from protoplasts of elite inbred maize’,
Biotechnology 7, 581–587.
Shimamoto, K., Terada, R., Izawa, T. & Fujimoto, H. (1989), ‘Fertile transgenic
rice plants regenerated from transformed protoplasts.’, Nature 338, 274–276.
Shiqing, G., Huijun, X., Xianguo, C., Ming, C., Zhaoshi, X., Liancheng, L., Xing-
guo, Y., Lipu, D., Xiaoyan, H. & Youzhi, M. (2005), ‘Improvement of wheat
drought and salt tolerance by expression of a tressinducible transcription factor
GmDREB of soybean (Glycine max)’, Chinese Science Bulletin 50(23), 2714–
2723.
Shrawat, A. (2007), Genetic transformation of cereals mediated by Agrobacterium:
potential and problems, Technical report.
Silva-Ortega, C. O., Ochoa-Alfaro, A. E., Reyes-Aguero, J. A., Aguado-Santacruz,
G. A. & Jimenez-Bremont, J. F. (2008), ‘Salt stress increases the expression of
p5cs gene and induces proline accumulation in cactus pear’, Plant Physiology
and Biochemistry 46, 82–92.
Simelton, E., Fraser, E. D. G., Termansen, M., Forster, P. M. & Dougill,
A. J. (2009), ‘Typologies of crop-drought vulnerability: an empirical analysis
of the socio-economic factors that influence the sensitivity and resilience to
115
Univers
ity of
Cap
e Tow
n

REFERENCES
drought of three major food crops in china (1961-2001)’, Environ. Sci. Policy
p. doi:10.1016/j.envsci.2008.11.005.
Singla-Pareek, S. L., Yadav, S. K., Pareek, A., Reddy, M. K. & Sopory, S. K.
(2008), ‘Enhancing salt tolerance in a crop plant by overexpression of glyoxalase
II’, Transgenic Res. 17, 171–180.
Skoog, F. & Miller, C. (1957), ‘Chemical regulation of growth and organ formation
in plant tissue cultured in vitro’, Symp. Soc. Exp. Biol. 11, 118–130.
Smale, S. T. & Kadonaga, J. T. (2003), ‘The RNA polymerase II core promoter’,
Annu. Rev. Biochem. 72, 449–479.
Songstad, D. D., Armstrong, C. L. & Peterson, W. L. (1991), ‘Silver nitrate in-
creases type II callus production from immature embryos of maize inbred B73
and its derivatives’, Plant Cell Reports 9, 699–702.
Songstad, D. D., Peterson, W. L. & Armstrong, C. L. (1992), ‘Establishment of fri-
able embryogenic (type II) callus from immature tassels of Zea mays (Poaceae)’,
American Journal of Botany 79, 761–764.
Srivastava, V., Anderson, O. D. & Ow, D. W. (1999), ‘Single-copy transgenic wheat
generated through the resolution of complex integration patterns’, Proc. Natl.
Acad. Sci. 99, 11117–11121.
Stacey, J. & Isaac, P. (1994), Isolation of dna from plants, in methods, in P. Isaac,
ed., ‘Molecular biologyprotocols for nucleic acid analysis by nonradioactive
probes’, Vol. 28, Humana Press Inc., Totowa, pp. 9–15.
Stefanov, K., Markovska, Y., Kimenov, G. & Popov, S. (1992), ‘Lipid and sterol
changes in leaves of Haberlea rhodopensis and Ramonda serbica at transition
from biosis into anabiosis and vice versa caused by water stress’, Phytochemistry
31, 2309–2314.
116
Univers
ity of
Cap
e Tow
n
REFERENCES
Steffens, N. O., Galuschka, C., Schindler, M., Bulow, L. & Hehl, R. (2004),
‘AthaMap: an online resource for in silico transcription factor binding sites in the
Arabidopsis thaliana genome’, Nucleic Acids Res. 32(Database issue), D368–
372.
Su, J., Shen, Q., Ho, D. T. & Wu, R. (1998), ‘Dehydration-stress-regulated trans-
gene expression in stably transformed rice plants’, Plant Physiol 117, 913–922.
Suprasanna, P., Rao, K. V. & Reddy, G. M. (1986), ‘Plantlet regeneration from
glume calli of maize (Zea mays L.)’, Theoritical and Applied Genetics 72, 120–
122.
Takumi, S., Shimamura, C. & Kobayashi, F. (2008), ‘Increased freezing tolerance
through up-regulation of downstream genes via the wheat cbf gene in transgenic
tobacco’, Plant Physiology and Biochemistry 46, 205–211.
Tatarinova, T., Brover, V., Troukhan, M. & Alexandrov, N. (2003), ‘Skew in CG
content near the transcription start site in Arabidopsis thaliana’, Bioinformatics
19 Suppl 1, i313–4.
Thomson, J. A. (2002), Genes for Africa-genetically modified crops in the develop-
ing world, UCT Press.
Ting, Y. C., Yu, M. & Zheng, W. Z. (1981), ‘Improved anther culture of maize’,
Plant Science Letters 23, 139–145.
Toenniessen, G. H., O’Toole, J. C. & DeVries, J. (2003), ‘Advances in plant biotech-
nology and its adoption in developing countries.’, Current Opinion in Plant Bi-
ology 6, 191–198.
Tomes, D. T. & Smith, O. S. (1985), ‘The effect of parental genotype on initiation
of embryogenic callus from elite maize (Zea mays) germplasm’, Theoritical and
Applied Genetics 70, 505–509.
117
Univers
ity of
Cap
e Tow
n

REFERENCES
Tuerck, J. A. & Fromm, M. E. (1994), ‘Elements of the Maize A1 Promoter Re-
quired for Transactivation by the Anthocyanin B/C1 or Phlobaphene P Regula-
tory Genes’, The Plant Cell. 6, 1655–1663.
Turk, S. C. H. J., Melchers, L. S., den Dulk-Ras, H., Regensberg-Tunk, A. J. G. &
Hookaas, P. J. J. (1991), ‘Environmental conditions differentially affect vir gene
induction in different Agrobacterium strains. Role of Vir A sensor proteins.’,
Plant MoI. Biol 16, 1051–1059.
Tzfira, T. & Citovsky, V. (2002), ‘Partners-in-infection: Host proteins involved in
the transformation of plant cells by Agrobacterium.’, Trends Cell Biol. 12, 121–
129.
Vain, P. (2007), ‘Thirty years of plant transformation technology development’,
Plant Biotechnology Journal 5, 221–229.
Vain, P., Afolabi, A. S., Worland, B. & Snape, J. W. (2003), ‘Transgene behaviour
in populations of rice plants transformed using a new dual binary vector system:
pGreen/pSoup’, Theor. Appl. Genet. 107, 210–217.
Vain, P., DeBuyser, J., Trang, V. B., Haicour, R. & Henry, Y. (1995), ‘Foreign
gene delivery into monocotyledonous species’, Biotechnol. Adv. 13, 653–671.
Vain, P., Flament, P. & Soudain, P. (1989a), ‘Role of ethylene in embryogenic callus
initiation and regeneration in Zea mays L.’, Journal Plant Physiology 135, 537–
540.
Vain, P., Yean, H. & Flament, P. (1989b), ‘Enhancement of production and regen-
eration of embryogenic type ii callus in zea mays l. by agn03.’, Plant Cell Tissue
and Organ Culture 18, 143–151.
Venter, M. & Botha, F. C. (2004), ‘Promoter analysis and transcription profiling:
Integration of genetic data enhances understanding of gene expression’, Physi-
ologia Planturum 120, 74–83.
118
Univers
ity of
Cap
e Tow
n

REFERENCES
Vistica, D. T., Skehan, P., Scudiero, D., Monks, A., Pittman, A. & Boyd, M. R.
(1991), ‘Tetrazolium-based Assays for Cellular Viability: A Critical Examina-
tion of Selected Parameters Affecting Formazan Production’, Cancer research
51, 2515–2520.
Wan, Y., Widholm, J. M. & Lemaux, P. G. (1995), ‘Type I callus as a bombardment
target for generating fertile, transgenic plants’, Planta 196, 7–14.
Wang, A. S. (1987), ‘Callus induction and plant regeneration from mature maize
embryos’, Plant Cell Reports 6, 360–362.
Wang, W. X., Vinocur, B. & Altman, A. (2003), ‘Plant responses to drought, salin-
ity and extreme temperatures: towards genetic engineering for stress tolerance.’,
Planta 218, 1–14.
Wang, W. X., Vinocur, B., Shoseyov, O. & Altman, A. (2001), ‘Biotechnology of
plant osmotic stress tolerant: Physiological and molecular considerations’, Acta
Hort 560, 285–292.
Ward, K. A. & Jordan, M. C. (2001), ‘Callus formation and plant regeneration
from immature and mature embryos of rye (Secale cereale L.)’, In Vitro Cell
Biologia Plantarum 37, 361–368.
White, J., Chang, S. Y. P. & Bibb, M. J. (1990), ‘A cassette containing the bar gene
of Streptomyces hygroscopicus : A selectable marker for plant transformation’,
Nucl. Acids Res. 18, 1062.
Willman, M. R., Schroll, S. M. & Hodges, T. K. (1989), ‘Inheritance of somatic
embryogenesis and plantlet regeneration from primary (type I) callus in maize’,
In vitro Cell Development and Biology Plant 25, 95–100.
Wilson, A. P. (2000), Cytotoxicity and Viability Assays in Animal Cell Culture: A
Practical Approach, Vol. 1, 3rd edn, Oxford University Press, oXford.
119
Univers
ity of
Cap
e Tow
n

REFERENCES
Wong, M. L. & Medrano, J. F. (2005), ‘Real-time PCR for mRNA quantitation.’,
Biotechniques 39, 75–85.
Wu, H., Doherty, A. & Huw, D. J. (2008), ‘Efficient and rapid Agrobacterium-
mediated genetic transformation of durum wheat (Triticum turgidum L. var.
durum) using additional virulence genes’, Transgenic Res 17, 425–436.
Wu, S., Kriz, A. L. & Widholm, J. M. (1994), ‘Molecular analysis of two cDNA
clones encoding acidic class I chitinase in maize’, Plant Physiology 105, 1097–
1105.
Xiong, L. & Zhu, J. K. (2002), ‘Molecular and genetic aspects of plant responses
to osmotic stress’, Plant, Cell and Environ 25, 131–139.
Yamamoto, Y. Y., Ichida, H., Matsui, M., Obokata, J., Sakurai, T., Satou, M., Seki,
M., Shinozaki, K. & Abe, T. (2007), ‘Identification of plant promoter constituents
by analysis of local distribution of short sequences’, BMC Genomics 8, 67doi.
Yanagisawa, S. (1998), ‘Transcription factors in rants: Physiological functions and
regulation of expression’, J. Plant Res. 111, 363–371.
Yang, Y., Li, R. & Qi, M. (2000), ‘In vivo analysis of plant promotera and transcrip-
tion factors by agroinfiltration of tobacco leaves’, The Plant Journal 22(6), 543–
551.
Yeo, A. (1998), ‘Molecular biology of salt tolerance in the context of whole-plant
physiology’, Journal of Experimental Botany 49, 913–929.
Zambryski, P., Joos, H., Genetello, C., Leemans, J., Van Montagu, M. & Schell,
J. (1983), ‘Ti-plasmid vector for the introduction of dna into plant cells without
alteration of their normal regeneration capacity’, EMBO J. 2, 2143–2150.
Zhang, J., Klueva, N., Wang, Z., Wu, R., David-Ho, T. & Nguyen, H. T. (2000),
‘Genetic engineering for abiotic stress resistance in crop plants’, In vitro Devel-
opment and Biology -Plant 36, 108–114.
120
Univers
ity of
Cap
e Tow
n

REFERENCES
Zhang, S., Williams, C. & Cmaux, P. G. (2002), ‘Transformation of recalcitrant
maize elite inbreds using in vitro shoot meristematic cultures induced from ger-
minated seedlings.’, Plant Cell Report 21, 263–270.
Zhao, Z. Y., Gu, W., Cai, T., Tagliani, L. A., Hondred, D. A., Bond, D., Krell,
S., Rudert, M. I., Bruce, W. B. & Pierce, D. A. (1998), ‘Molecular analyses
of T0 plants transformed by Agrobacterium and comparison of Agrobacterium-
mediated transformation with bombardment transformation in maize’, Maize
Genetic Cooperative Newsletter 72, 34–37.
Zhong, H., Sun, B., Warkentin, D., Zhang, S., Wu, R., Wu, T. & Sticklen, M. B.
(1996), ‘The competence of maize shoot meristems for integrative transformation
and inherited expression of transgenes’, Plant Physiology 110, 1097–1107.
Zhu, J. K., Hasegawa, P. M. & A., B. R. (1997), ‘Molecular aspects of osmotic
stress in plants’, Critical Review of Plant Science 16, 253–277.
Zhu, Z., Pilpel, Y. & Church, G. M. (2002), ‘Computational identification of tran-
scription factor binding sites via a transcription-factorcentric clustering (TFCC)
algorithm’, J Mol Biol 318, 71–81.
121
Univers
ity of
Cap
e Tow
n

Appendices
122
Univers
ity of
Cap
e Tow
n

Appendix A
General protocols and media
A.1 PCR product purification
Amplified DNA was purified using the EZ-10 Spin Column PCR product purifi-
cation Kit (Bio Basic, Canada). The PCR product was transferred to a 1.5 ml
microfuge tube and 3 volumes of Binding Buffer I added. After pulsing, the mix-
ture was transferred to the column and let to stand for 2 min at room temperature
before spinning for 1 min at 5,000g. The flow-through was discarded and the column
placed back on the same collection tube. Five hundred microlitres Wash Buffer was
added to the column and centrifuged for 1 min at 8,000g. The flow-through was
discarded and the column again combined with the collection tube. The washing
step was repeated with centrifugation for 60 s of 10,000g. To remove the residual
Wash Solution, the above step was repeated. The collection tube was discarded
and the column inserted into a sterile 1.5 ml microfuge tube. To the center part of
the column, 40 µl Elution Buffer was added and incubated at room temperature for
2 minutes before centrifuging at 10,000g for 1 min. For DNA intended for cloning,
water was used for elution. The purified DNA was stored at 4◦C for regular use or
at −20◦C for long term storage.
123
Univers
ity of
Cap
e Tow
n

A.2. DNA PUIFICATION FROM AGAROSE GELS
A.2 DNA puification from agarose gels
Excised DNA fragments from agarose gels were purified using the EZ-10 Spin Col-
umn DNA Gel Extraction Kit (Bio Basic, Canada). Upon excision of the band
of interest from the agarose gel, the gel slice was placed in a sterile previously
weighed 1.5 ml Eppendorf tube and the mass estimated. For every 100 mg of ex-
cised agarose, 300 µl of Binding Buffer II was added to the Eppendorf tube. The
tube was vortexed for 45 s to resuspend the gel slice in Binding Buffer II. The
suspension was incubated for 10 min at 55◦C and vortexed briefly every 2-3 min
during this period.
The mixture solution was added to the spin column and let to stand for 2 min at
room temperature before centrifuging for 1 min at 5,000g. The flow-through was
discarded and the column placed back on the same collection tube. Five hundred
microlitres of Wash Buffer was added to the column and centrifuged for 1 min at
8,000g. The flow-through was discarded and the column again combined with the
collection tube. Five hundred microlitres of Wash Buffer was added and the sample
centrifuged for 1 min at 10,000g. The above step was repeated. The collection tube
was discarded and the column inserted into a sterile 1.5 ml microfuge tube. To the
center part of the column, 40 µl Elution Buffer was added and incubated for 2 min
at room temperature before centrifuging for 1 min at 10,000g. The purified DNA
was stored at 4◦C for regular use or at −20◦C for long term storage.
A.3 Plasmid DNA isolation
Plasmid DNA was isolated using the EZ-10 Spin Column Plasmid DNA Miniprep
Kit (Bio Basic, Canada). To the 1.5 ml microfuge, 1.5 ml of overnight culture was
added and centrifuged for 15 s at 10,000g. The supernatant was completely drained,
100 µl Solution I added to the pellet and gently mixed at room temperature.
Two hundred microlitres of Solution II was added to the mixture, gently mixed
124
Univers
ity of
Cap
e Tow
n

A.4. PREPARATION OF GLYCEROL STOCKS
by inverting 6 times then allowed to stand for 5 min on ice. Three hundred and
fifty microlitres of Solution III was added to the mixture and gently mixed before
incubating for 5 min on ice. The mixture was centrifuged for 15 min at 12,000g.
Thereafter the supernatant was transferred to the column, allowed to stand for 2
min then centrifuged for 1 minute at 5,000g.
The flow-through was discarded and the column again combined with the collec-
tion tube. Five hundred microlitres of Wash Buffer was added and the sample
centrifuged for 1 min at 8,000g. The above step was repeated. Further centrifu-
gation for 30 s at 10,000g was performed to remove the residual wash buffer. The
collection tube was discarded and the column inserted into a sterile 1.5 ml mi-
crofuge tube. To the center part of the column, 40 µl double distilled water was
added and incubated for 2 min at 37◦C before centrifuging for 1 min at 10,000g.
The purified plasmid DNA was stored at 4◦C for regular use or at −20◦C for long
term storage.
A.4 Preparation of glycerol stocks
Following overnight culture, cells were pelleted down for 1 min at 3,000g. Two
hundred microlitres of autoclaved 50% glycerol was added and gently mixed. The
glycerol stocks were then stored at −80◦C.
A.5 Controlled pollination of maize
Growth and development of maize plants was closely monitored to mark the sprout-
ing ears. The shootbags were tightly secured on the emerging top ear of the plant
to cover the shoot before the silk emerged to prevent pollen contamination. A day
before pollination, ears were cut to ensure growth of fresh silk for pollination. The
shootbags were promptly placed over the freshly cut ears to protect them. To in-
dicate which ears were to be pollinated the following day, the top of the shootbags
125
Univers
ity of
Cap
e Tow
n

A.6. EMBRYO DISSECTION
were folded away from the ears. The plant’s tassels were routinely checked to ensure
that the plants would shed enough pollen for pollination. After identifying the ma-
ture tassels, pollination bags were carefully placed over the plant’s tassels and the
tassels grasped by holding the bag and making a central ridge for better support.
The bag’s flaps were then secured with non-skid paper clip. On the day of pollina-
tion, the bags were tapped five to seven times to release pollen from the tassels. The
bags were carefully taken down to avoid contamination from other pollen sources by
keeping shut the opening of the bag. The shootbags were pulled out while covering
the shoot with the pollination bag to prevent the silk from getting exposed. The
bags were straightened and tapped slightly to allow the pollen to be introduced
to the fresh silk. All the four flaps of the bags were finally tightly stapled against
the stalk. This protocol was adopted from Schnable Laboratory of Iowa state
University http://schnablelab.plantgenomics.iastate.edu/resources/pollination/
A.6 Embryo dissection
Following sterilization, a long forceps was inserted into the top of the ears to act as
a handle. The top half of kernels were cut off while still attached to the sterilized
ears using a scalpel. With a spatula, the endosperm was scooped meticulously
and discarded leaving the embryo, which could be gently removed with the spat-
ula under aseptic conditions. These manipulations were carried out in a sterile
larmina flow chamber using sterile forceps and scalpels sterilized with 70% alcohol
or methylated spirit followed by flaming.
A.7 LB Media
All components were mixed and the pH adjusted to 7.0 and autoclaved for 20 min
at 121◦C and 15 psi. The appropriate antibiotic was filter sterilised and added
prior to use. For blue-white screening for positive clones, X-gal and IPTG were
126
Univers
ity of
Cap
e Tow
n

A.7. LB MEDIA
added to the LB Agar.
Table A.1: LB Media
Components LB Agar (1l) LB Broth (1l)
Tryptone 10 g/l 10 g/l
Yeast extract 5 g/l 5 g/l
NaCl 5 g/l 5 g/l
Agar 15 g -
dH2O Add upto 1l Add upto 1l
127
Univers
ity of
Cap
e Tow
n

Appendix B
Standard protocols, vector maps,primers and PCR cyclingconditions, promoter and genesequences
B.1 Standard protocols
Table B.1: PCR reagents and final volumes used in a standard PCR protocol
Components Final volume
Forward primer (10 µM) 1 µlReverse primer (10 µM) 1 µldNTPs (2.5 mM) 2.5 µlBuffer (10X) 2.5 µlMgCl2 (25 mM) 1.5 µldH2O 15.3 µlSupertherm Taq (5U/µl) 0.5 µlTemplate (10 ng/µl) 1 µl
128
Univers
ity of
Cap
e Tow
n
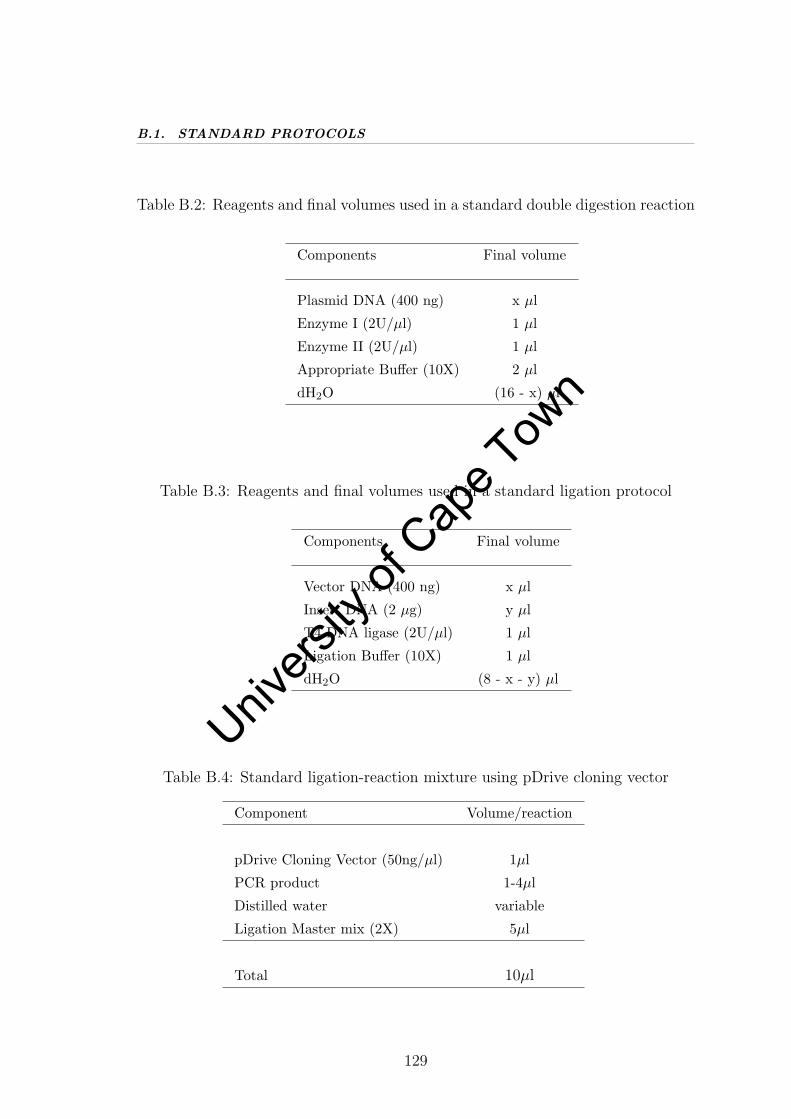
B.1. STANDARD PROTOCOLS
Table B.2: Reagents and final volumes used in a standard double digestion reaction
Components Final volume
Plasmid DNA (400 ng) x µl
Enzyme I (2U/µl) 1 µl
Enzyme II (2U/µl) 1 µl
Appropriate Buffer (10X) 2 µl
dH2O (16 - x) µl
Table B.3: Reagents and final volumes used in a standard ligation protocol
Components Final volume
Vector DNA (400 ng) x µl
Insert DNA (2 µg) y µl
T4 DNA ligase (2U/µl) 1 µl
Ligation Buffer (10X) 1 µl
dH2O (8 - x - y) µl
Table B.4: Standard ligation-reaction mixture using pDrive cloning vector
Component Volume/reaction
pDrive Cloning Vector (50ng/µl) 1µl
PCR product 1-4µl
Distilled water variable
Ligation Master mix (2X) 5µl
Total 10µl
129
Univers
ity of
Cap
e Tow
n

B.2. VECTOR MAPS
B.2 Vector maps
Figure B.1: pTF101.1 vector
130
Univers
ity of
Cap
e Tow
n

B.2. VECTOR MAPS
Figure B.2: pDrive Cloning Vector
131
Univers
ity of
Cap
e Tow
n
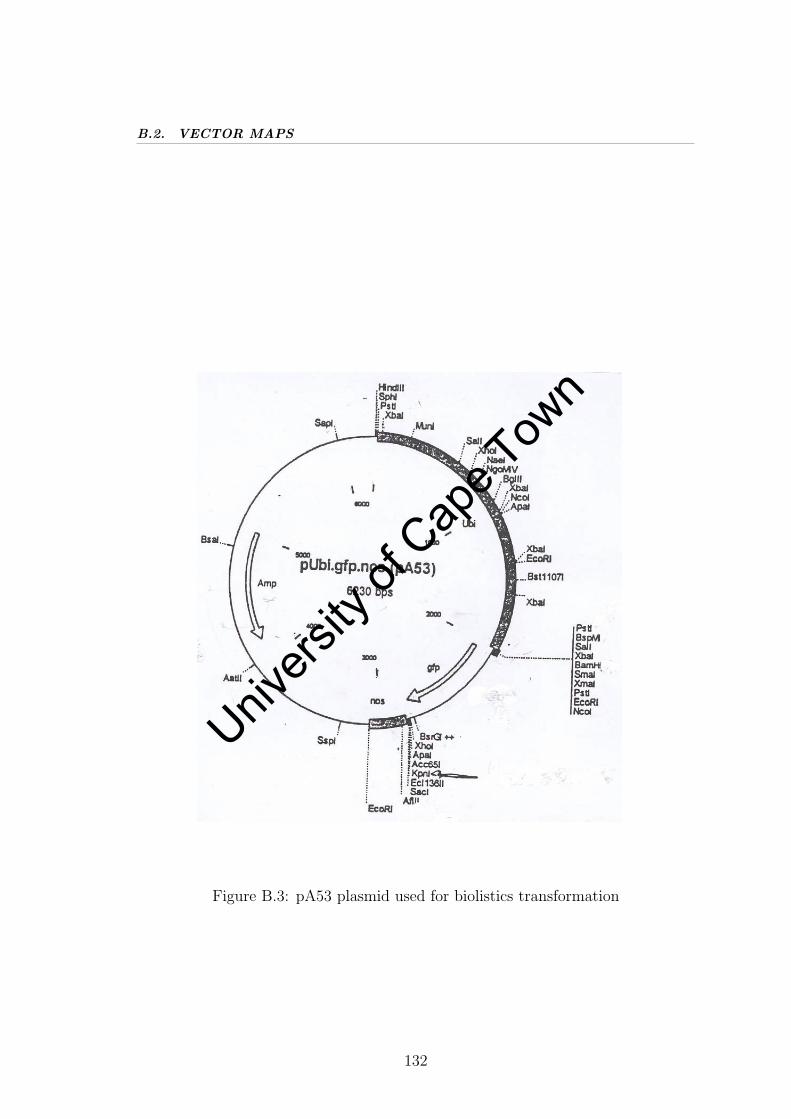
B.2. VECTOR MAPS
Figure B.3: pA53 plasmid used for biolistics transformation
132
Univers
ity of
Cap
e Tow
n

B.3. PRIMER COMBINATIONS AND CYCLING CONDITIONS
B.3 Primer combinations and cycling conditions
133
Univers
ity of
Cap
e Tow
n

B.3. PRIMER COMBINATIONS AND CYCLING CONDITIONS
Tab
leB
.5:
Pri
mer
sequen
cesuse
dfo
rP
CR
and
qRT
PC
Ram
plifica
tion
incl
udin
gth
ecy
clin
gco
ndit
ions
Pri
mer
Tar
get
Pri
mer
Pro
duct
Cyc
lena
me
sequ
ence
sequ
ence
*5′→
3′si
ze(b
p)co
ndit
ions
SAP
-pro
m-E
coR
I-F
1X
vPsa
p1G
GA
AT
TC
AC
TG
TC
TG
GG
TA
GC
TG
G20
8394
oC
,60
s;SA
P-p
rom
-Bam
HI-
R2
TC
CG
GA
TC
CT
CC
CTA
ATA
TC
TC
TC
GC
TC
58oC
,30
s;72
oC
,90
sSA
P-p
rom
-Eco
RI-
F2
XvP
sap2
GG
AA
TT
CC
GT
CA
CT
TT
CC
AT
GG
G15
7794
oC
,60
s;SA
P-p
rom
-Bam
HI-
R2
TC
CG
GA
TC
CT
CC
CTA
ATA
TC
TC
TC
GC
TC
58oC
,30
s;72
oC
,90
s.SA
P-p
rom
-Eco
RI-
F3
XvP
sap2
GG
AA
TT
CG
AC
CC
CC
AA
AA
CA
CC
1127
94oC
,60
s;SA
P-p
rom
-Bam
HI-
R2
TC
CG
GA
TC
CT
CC
CTA
ATA
TC
TC
TC
GC
TC
58oC
,30
s;72
oC
,90
sno
s-sp
eIX
F2
nos
AC
TA
GT
GA
AT
TT
CC
CC
GA
TC
GT
TC
300
94oC
,30
s;no
s-hi
ndII
IX
R1
GA
AA
GC
TT
AG
GG
AT
CTA
GTA
AC
ATA
GA
TG
AC
57oC
,30
s;72
oC
,60
sLuc
-Bam
HI
Flu
cG
GA
TC
CA
TG
GT
CA
CC
GA
CG
CC
AA
AA
AC
1656
94oC
,30
s;Luc
-Spe
IR
2G
AA
CTA
GT
TA
CA
CG
GC
GA
TC
TT
TC
C58
oC
,30
s;72
oC
,90
sG
FP
-Bam
HI
Fgf
pG
GA
TC
CC
CA
TG
GT
GA
GC
AA
759
94oC
,60
s;G
FP
-spe
IR
CG
AC
TA
GT
GC
CG
CT
TTA
CT
T58
oC
,60
s;72
oC
,60
sB
arI
bar
GG
TC
TG
CA
CC
AT
CG
TC
AA
CC
421
94oC
,60
s;B
arII
GT
CA
TG
CC
AG
TT
CC
CG
TG
CT
57oC
,30
s;72
oC
,90
s.Luc
F2
luc
CA
CG
TT
CG
TC
AC
AT
CT
CA
TC
1200
94oC
,60
s;C
ontinued
...
134
Univers
ity of
Cap
e Tow
n

B.3. PRIMER COMBINATIONS AND CYCLING CONDITIONSTab
leB
.5–
Con
tinued
Pri
mer
Tar
get
Pri
mer
Pro
duct
Cyc
lena
me
sequ
ence
sequ
ence
*5′→
3′si
ze(b
p)co
ndit
ions
Luc
-Spe
IR
2 2G
AA
CTA
GT
TA
CA
CG
GC
GA
TC
TT
TC
C58
oC
,30
s;72
oC
,90
s.qR
TLuc
F1
luc
GA
GG
CG
AA
CT
GT
GT
GT
GA
GA
192
95oC
,5s
;qR
TLuc
R1
GA
GC
CA
CC
TG
ATA
GC
CT
TT
G60
oC
,8s
;72
oC
,12
sqR
T18
S-F2
18Sr
RN
AC
GT
TG
GC
CT
TC
GG
GA
TC
GG
AG
200-
250
95oC
,5s
;qR
T18
S-R
2C
ATA
AG
GT
GC
CG
GC
GG
TG
TC
C60
oC
,8s
;72
oC
,12
sV
CF
virC
AT
CA
TT
TG
TA
GC
GA
CT
730
95oC
,60
s;V
CR
5’-
AG
CT
CA
AA
CC
TG
CT
TC
55oC
,60
s;72
oC
,120
s*T
heun
derl
ined
nucl
eoti
des
inth
epr
imer
sequ
ence
sre
pres
ent
the
rest
rict
ion
site
s
135
Univers
ity of
Cap
e Tow
n

B.4. XVPSAP PROMOTER AND LUC, NOS, GFP AND XVSAP1SEQUENCES
B.4 XvPsap promoter and luc, nos, gfp and XvSap1
sequences
1 ACTGTCTGGG TAGCTGGCAA TATAGAGACG TAAGAAATTC ATGGATCATC ACCCTAATTC 61 GGTCTTTCAC TCATTTTATC CTAGACCTGA CTAAAAAACT TGGTCAGAGT TTTACTTATT 121 TAAAAAAAAG AGGACTTCAT GGCATCCATG TGCAGGTACA GCTCCCAGAA AAAAAAAGCA 181 TGAAACACGA CAGGATCAAT AGCATTCGAT CTGAAACAAA AGGTTGGAGC TCAAGACTTT 241 CTCCAAAATA TTAAGATGAT CCAAAGAATT ACCCCAAGAT ATCCAACGTA TACCAATGTG 301 TATACCGAAA GTAAGAAAGT TCACGTGCAT TCTTTGATTT TTCTCCCGAG TGTTCTTTTC 361 TGAAATGAGT AAATAAGACT AGAATAAGAG CTAATGTATT TTTTTTCTAA AAAAAAGTTG 421 AATGTGGATA CAATATGATT ATACATTCAT TAGCTATTTT AAGTATATTC TATTTTTTTT 481 CCCCCCAAAA GAACACAAAT GTGTTCCGTC ACTTTCCATG GGGCAAATTA CAACTTAGGC 541 TTTATCTTAG TTGGTATGAT CTTAATTTTA TTATACTTTA AACAACTTAT CGCTAATAAT 601 TTTGTTTTGA TTTATGCGCC AATTGTAAAT ATAAATCGGA TAAATTTGAA CATTAATACT 661 TTTAGTCAGT TTCAAAAAAG AAAAAGATAA CTATGACGTT AGAGTTTGGA ATCCAGTCAA 721 ATGGAACTTA TTTTTTAGTT CATCAGAATC AACTTGATGA GATTTTTTGT ACTAGACAAT 781 CATCTTGAAT GATAGATAGG GGACTTACCA ATCAGCCCCC CATATTTTGA AACTTTCAAC 841 GCGCCCCTCA ACATTTTTCT CTTTCAACGC GCCCTTCCAT CACTTTTCTC TTTTCATCGC 901 CCCTCCCTCA ACTTTTTGGT CGGACGGAAA TACCTCTATA TATATTTCAT CATTTCGACC 961 CCCAAAACAC CTATTTAGAA GTATTTTTTG GAAAAAATTT TAACATGAAA GTTTTAGATC 1021 TTGATGAGAT CTACAATTTT TATGTTGAAA GTTTTTCCAA AAAATACTTT TAGATAGATA 1081 TTTTGGAACT CCGAAGTGTT AATGGGTCGA CCCGCTAACT TGCGGAAATA GAAAAACATC 1141 AAGATCTACA ACTTTTATGT TGAAAGTTTT TTCAAAAAAT ACTTCTAGAT AGATATTTGA 1201 TTTGTAATTT TAATGTTGAA AGTTTTTTCA AAAAATACTT CTAGATAGAT ACTTTGGGGC 1261 TCCGGAGTGT TAACAAGTAT AGGAATATTT TTGTCTGCAA AAAATTAATT TTTCGGACAA 1321 GAGGCCGATC AGTAAGGAAT CTGGTCGGAG GGGCTGTTCG GCAATATAAG TTCAGATAGG 1381 AGAACTGATC GGATATTTTT CCTTAATTTA ATTCCAATTT GATACTATTA AGAATGAAAA 1441 CATCCTAATA ATTGTGACCA CTTTATAGCA CCACATTTAT TTTAATTTAA ATCTTTTAAA 1501 TCTTAGAATT GGACAGGGTG CTTATGATAA CAAACTTGTT CCTATCAACA ACTGCATGTT 1561 AGACAGCGCC GAATTTACAG TCCTACTGGG CGCCACTTTT CAACCCACAT CATCAAGATG 1621 AACACCACGT TATCTTCATC CGCTCCAACC ACATGGTCCA GCGCCACTGG CCAAGACCGC 1681 CAGCCAGCCA GGCCATCCAA CGTGGTGCAT TTTCTAACAC TCCACGTTCG CTGTACGGCA 1741 TTATTTCTCC AGCCAGAAAG ACCGAGACAG CGACGCTGTT GGGCGGGCCC GCGGCCTGCT 1801 CTCTCTGCTT CCCCATGAGA TTCACGGGCA TCGCTCCTCG CTCGTGCCTA CGCCCGCGCC 1861 CGCGCCCGAC CGCGCCGGTC CACGTGACGT GGCGCAGCAA TCGTTCTTAC TAGGCGCTTG 1921 CACGTGTCGT TCGCATGCGA AGCGTCCACA CTGCCAACGA CCTCCTTAAA TATCCTTGTG 1981 ATATTCGCCT TACGATCTCA CACTTCGCAC GCAAAGGCCA GTCGCAGATT TGGGTTGAAT 2041 TTGCTGCGTT TTGGCAGATT TTGAGCGAGA GATATTAGGG AAG
Figure B.4: Nucleotide sequence for promoter XvPsap1: 2083 bp (SEQ ID NO: 1);Composition 626 A; 435 C; 367 G; 648 T; 7 other; Percentage: 30.1% A; 20.9% C;17.6% G; 31.1% T; 0.3% other; Molecular Weight (kDa): ssDNA: 641.55 dsDNA:1283.94
136
Univers
ity of
Cap
e Tow
n
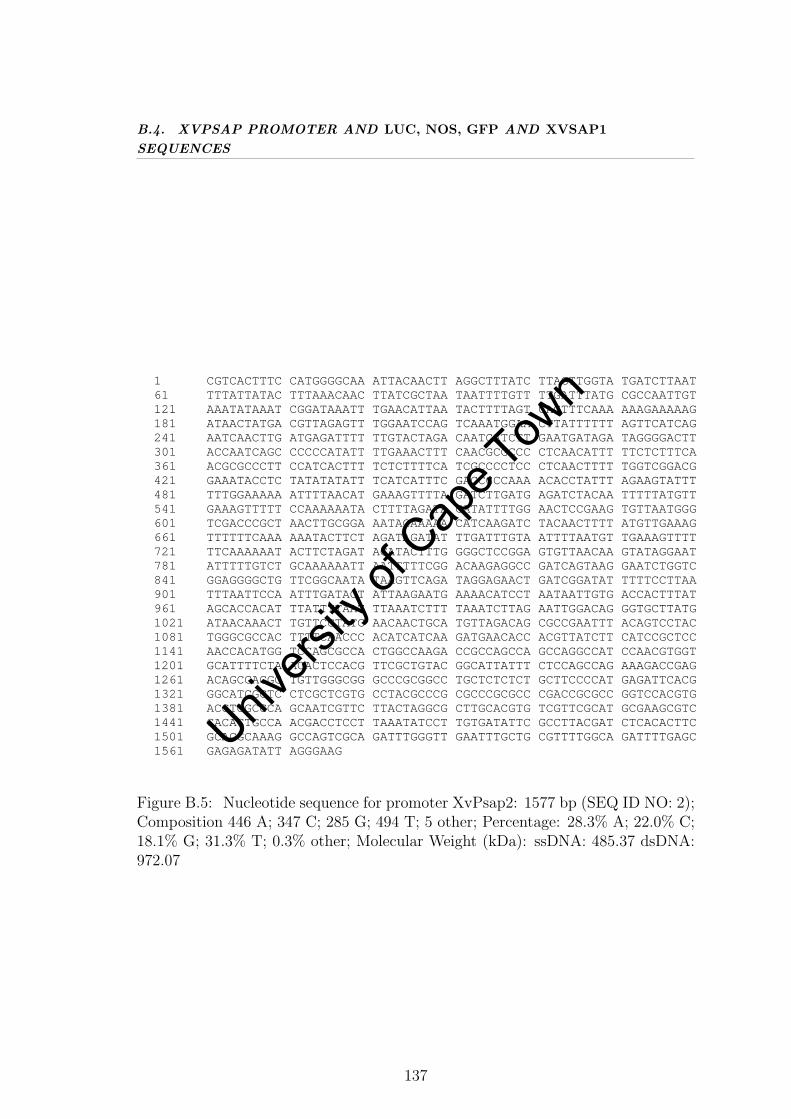
B.4. XVPSAP PROMOTER AND LUC, NOS, GFP AND XVSAP1SEQUENCES
1 CGTCACTTTC CATGGGGCAA ATTACAACTT AGGCTTTATC TTAGTTGGTA TGATCTTAAT 61 TTTATTATAC TTTAAACAAC TTATCGCTAA TAATTTTGTT TTGATTTATG CGCCAATTGT 121 AAATATAAAT CGGATAAATT TGAACATTAA TACTTTTAGT CAGTTTCAAA AAAGAAAAAG 181 ATAACTATGA CGTTAGAGTT TGGAATCCAG TCAAATGGAA CTTATTTTTT AGTTCATCAG 241 AATCAACTTG ATGAGATTTT TTGTACTAGA CAATCATCTT GAATGATAGA TAGGGGACTT 301 ACCAATCAGC CCCCCATATT TTGAAACTTT CAACGCGCCC CTCAACATTT TTCTCTTTCA 361 ACGCGCCCTT CCATCACTTT TCTCTTTTCA TCGCCCCTCC CTCAACTTTT TGGTCGGACG 421 GAAATACCTC TATATATATT TCATCATTTC GACCCCCAAA ACACCTATTT AGAAGTATTT 481 TTTGGAAAAA ATTTTAACAT GAAAGTTTTA GATCTTGATG AGATCTACAA TTTTTATGTT 541 GAAAGTTTTT CCAAAAAATA CTTTTAGATA GATATTTTGG AACTCCGAAG TGTTAATGGG 601 TCGACCCGCT AACTTGCGGA AATAGAAAAA CATCAAGATC TACAACTTTT ATGTTGAAAG 661 TTTTTTCAAA AAATACTTCT AGATAGATAT TTGATTTGTA ATTTTAATGT TGAAAGTTTT 721 TTCAAAAAAT ACTTCTAGAT AGATACTTTG GGGCTCCGGA GTGTTAACAA GTATAGGAAT 781 ATTTTTGTCT GCAAAAAATT AATTTTTCGG ACAAGAGGCC GATCAGTAAG GAATCTGGTC 841 GGAGGGGCTG TTCGGCAATA TAAGTTCAGA TAGGAGAACT GATCGGATAT TTTTCCTTAA 901 TTTAATTCCA ATTTGATACT ATTAAGAATG AAAACATCCT AATAATTGTG ACCACTTTAT 961 AGCACCACAT TTATTTTAAT TTAAATCTTT TAAATCTTAG AATTGGACAG GGTGCTTATG 1021 ATAACAAACT TGTTCCTATC AACAACTGCA TGTTAGACAG CGCCGAATTT ACAGTCCTAC 1081 TGGGCGCCAC TTTTCAACCC ACATCATCAA GATGAACACC ACGTTATCTT CATCCGCTCC 1141 AACCACATGG TCCAGCGCCA CTGGCCAAGA CCGCCAGCCA GCCAGGCCAT CCAACGTGGT 1201 GCATTTTCTA ACACTCCACG TTCGCTGTAC GGCATTATTT CTCCAGCCAG AAAGACCGAG 1261 ACAGCGACGC TGTTGGGCGG GCCCGCGGCC TGCTCTCTCT GCTTCCCCAT GAGATTCACG 1321 GGCATCGCTC CTCGCTCGTG CCTACGCCCG CGCCCGCGCC CGACCGCGCC GGTCCACGTG 1381 ACGTGGCGCA GCAATCGTTC TTACTAGGCG CTTGCACGTG TCGTTCGCAT GCGAAGCGTC 1441 CACACTGCCA ACGACCTCCT TAAATATCCT TGTGATATTC GCCTTACGAT CTCACACTTC 1501 GCACGCAAAG GCCAGTCGCA GATTTGGGTT GAATTTGCTG CGTTTTGGCA GATTTTGAGC 1561 GAGAGATATT AGGGAAG
Figure B.5: Nucleotide sequence for promoter XvPsap2: 1577 bp (SEQ ID NO: 2);Composition 446 A; 347 C; 285 G; 494 T; 5 other; Percentage: 28.3% A; 22.0% C;18.1% G; 31.3% T; 0.3% other; Molecular Weight (kDa): ssDNA: 485.37 dsDNA:972.07
137
Univers
ity of
Cap
e Tow
n

B.4. XVPSAP PROMOTER AND LUC, NOS, GFP AND XVSAP1SEQUENCES
1 GACCCCCAAA ACACCTATTT AGAAGTATTT TTTGGAAAAA ATTTTAACAT GAAAGTTTTA 61 GATCTTGATG AGATCTACAA TTTTTATGTT GAAAGTTTTT CCAAAAAATA CTTTTAGATA 121 GATATTTTGG AACTCCGAAG TGTTAATGGG TCGACCCGCT AACTTGCGGA AATAGAAAAA 181 CATCAAGATC TACAACTTTT ATGTTGAAAG TTTTTTCAAA AAATACTTCT AGATAGATAT 241 TTGATTTGTA ATTTTAATGT TGAAAGTTTT TTCAAAAAAT ACTTCTAGAT AGATACTTTG 301 GGGCTCCGGA GTGTTAACAA GTATAGGAAT ATTTTTGTCT GCAAAAAATT AATTTTTCGG 361 ACAAGAGGCC GATCAGTAAG GAATCTGGTC GGAGGGGCTG TTCGGCAATA TAAGTTCAGA 421 TAGGAGAACT GATCGGATAT TTTTCCTTAA TTTAATTCCA ATTTGATACT ATTAAGAATG 481 AAAACATCCT AATAATTGTG ACCACTTTAT AGCACCACAT TTATTTTAAT TTAAATCTTT 541 TAAATCTTAG AATTGGACAG GGTGCTTATG ATAACAAACT TGTTCCTATC AACAACTGCA 601 TGTTAGACAG CGCCGAATTT ACAGTCCTAC TGGGCGCCAC TTTTCAACCC ACATCATCAA 661 GATGAACACC ACGTTATCTT CATCCGCTCC AACCACATGG TCCAGCGCCA CTGGCCAAGA 721 CCGCCAGCCA GCCAGGCCAT CCAACGTGGT GCATTTTCTA ACACTCCACG TTCGCTGTAC 781 GGCATTATTT CTCCAGCCAG AAAGACCGAG ACAGCGACGC TGTTGGGCGG GCCCGCGGCC 841 TGCTCTCTCT GCTTCCCCAT GAGATTCACG GGCATCGCTC CTCGCTCGTG CCTACGCCCG 901 CGCCCGCGCC CGACCGCGCC GGTCCACGTG ACGTGGCGCA GCAATCGTTC TTACTAGGCG 961 CTTGCACGTG TCGTTCGCAT GCGAAGCGTC CACACTGCCA ACGACCTCCT TAAATATCCT 1021 TGTGATATTC GCCTTACGAT CTCACACTTC GCACGCAAAG GCCAGTCGCA GATTTGGGTT 1081 GAATTTGCTG CGTTTTGGCA GATTTTGAGC GAGAGATATT AGGGAAG
Figure B.6: Nucleotide sequence for promoter XvPsap3: 1127 bp (SEQ ID NO: 3);Composition 315 A; 256 C; 226 G; 330 T; 0 other; Percentage: 28.0% A; 22.7% C;20.1% G; 29.3% T; 0.0% other; Molecular Weight (kDa): ssDNA: 347.25 dsDNA:694.71
138
Univers
ity of
Cap
e Tow
n
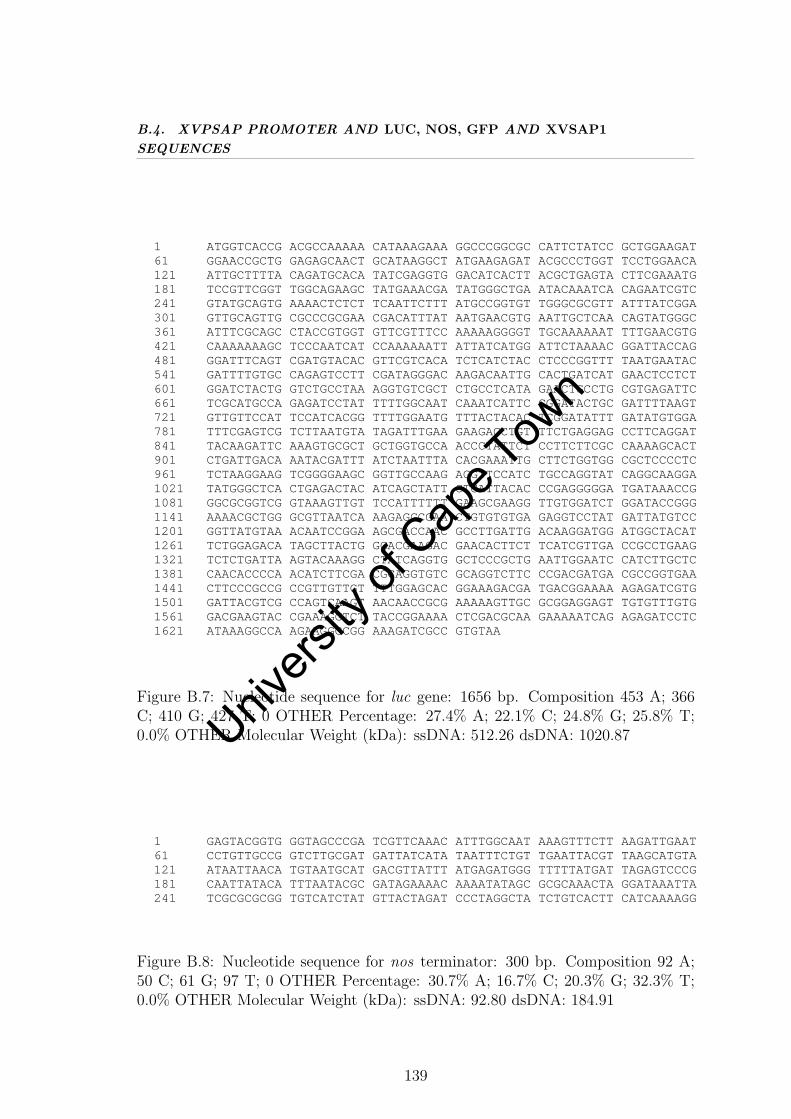
B.4. XVPSAP PROMOTER AND LUC, NOS, GFP AND XVSAP1SEQUENCES
1 ATGGTCACCG ACGCCAAAAA CATAAAGAAA GGCCCGGCGC CATTCTATCC GCTGGAAGAT 61 GGAACCGCTG GAGAGCAACT GCATAAGGCT ATGAAGAGAT ACGCCCTGGT TCCTGGAACA 121 ATTGCTTTTA CAGATGCACA TATCGAGGTG GACATCACTT ACGCTGAGTA CTTCGAAATG 181 TCCGTTCGGT TGGCAGAAGC TATGAAACGA TATGGGCTGA ATACAAATCA CAGAATCGTC 241 GTATGCAGTG AAAACTCTCT TCAATTCTTT ATGCCGGTGT TGGGCGCGTT ATTTATCGGA 301 GTTGCAGTTG CGCCCGCGAA CGACATTTAT AATGAACGTG AATTGCTCAA CAGTATGGGC 361 ATTTCGCAGC CTACCGTGGT GTTCGTTTCC AAAAAGGGGT TGCAAAAAAT TTTGAACGTG 421 CAAAAAAAGC TCCCAATCAT CCAAAAAATT ATTATCATGG ATTCTAAAAC GGATTACCAG 481 GGATTTCAGT CGATGTACAC GTTCGTCACA TCTCATCTAC CTCCCGGTTT TAATGAATAC 541 GATTTTGTGC CAGAGTCCTT CGATAGGGAC AAGACAATTG CACTGATCAT GAACTCCTCT 601 GGATCTACTG GTCTGCCTAA AGGTGTCGCT CTGCCTCATA GAACTGCCTG CGTGAGATTC 661 TCGCATGCCA GAGATCCTAT TTTTGGCAAT CAAATCATTC CGGATACTGC GATTTTAAGT 721 GTTGTTCCAT TCCATCACGG TTTTGGAATG TTTACTACAC TCGGATATTT GATATGTGGA 781 TTTCGAGTCG TCTTAATGTA TAGATTTGAA GAAGAGCTGT TTCTGAGGAG CCTTCAGGAT 841 TACAAGATTC AAAGTGCGCT GCTGGTGCCA ACCCTATTCT CCTTCTTCGC CAAAAGCACT 901 CTGATTGACA AATACGATTT ATCTAATTTA CACGAAATTG CTTCTGGTGG CGCTCCCCTC 961 TCTAAGGAAG TCGGGGAAGC GGTTGCCAAG AGGTTCCATC TGCCAGGTAT CAGGCAAGGA 1021 TATGGGCTCA CTGAGACTAC ATCAGCTATT CTGATTACAC CCGAGGGGGA TGATAAACCG 1081 GGCGCGGTCG GTAAAGTTGT TCCATTTTTT GAAGCGAAGG TTGTGGATCT GGATACCGGG 1141 AAAACGCTGG GCGTTAATCA AAGAGGCGAA CTGTGTGTGA GAGGTCCTAT GATTATGTCC 1201 GGTTATGTAA ACAATCCGGA AGCGACCAAC GCCTTGATTG ACAAGGATGG ATGGCTACAT 1261 TCTGGAGACA TAGCTTACTG GGACGAAGAC GAACACTTCT TCATCGTTGA CCGCCTGAAG 1321 TCTCTGATTA AGTACAAAGG CTATCAGGTG GCTCCCGCTG AATTGGAATC CATCTTGCTC 1381 CAACACCCCA ACATCTTCGA CGCAGGTGTC GCAGGTCTTC CCGACGATGA CGCCGGTGAA 1441 CTTCCCGCCG CCGTTGTTGT TTTGGAGCAC GGAAAGACGA TGACGGAAAA AGAGATCGTG 1501 GATTACGTCG CCAGTCAAGT AACAACCGCG AAAAAGTTGC GCGGAGGAGT TGTGTTTGTG 1561 GACGAAGTAC CGAAAGGTCT TACCGGAAAA CTCGACGCAA GAAAAATCAG AGAGATCCTC 1621 ATAAAGGCCA AGAAGGGCGG AAAGATCGCC GTGTAA
Figure B.7: Nucleotide sequence for luc gene: 1656 bp. Composition 453 A; 366C; 410 G; 427 T; 0 OTHER Percentage: 27.4% A; 22.1% C; 24.8% G; 25.8% T;0.0% OTHER Molecular Weight (kDa): ssDNA: 512.26 dsDNA: 1020.87
1 GAGTACGGTG GGTAGCCCGA TCGTTCAAAC ATTTGGCAAT AAAGTTTCTT AAGATTGAAT 61 CCTGTTGCCG GTCTTGCGAT GATTATCATA TAATTTCTGT TGAATTACGT TAAGCATGTA 121 ATAATTAACA TGTAATGCAT GACGTTATTT ATGAGATGGG TTTTTATGAT TAGAGTCCCG 181 CAATTATACA TTTAATACGC GATAGAAAAC AAAATATAGC GCGCAAACTA GGATAAATTA 241 TCGCGCGCGG TGTCATCTAT GTTACTAGAT CCCTAGGCTA TCTGTCACTT CATCAAAAGG
Figure B.8: Nucleotide sequence for nos terminator: 300 bp. Composition 92 A;50 C; 61 G; 97 T; 0 OTHER Percentage: 30.7% A; 16.7% C; 20.3% G; 32.3% T;0.0% OTHER Molecular Weight (kDa): ssDNA: 92.80 dsDNA: 184.91
139
Univers
ity of
Cap
e Tow
n

B.4. XVPSAP PROMOTER AND LUC, NOS, GFP AND XVSAP1SEQUENCES
1 GAGGATCCCC GGGTACCGGT CGCCACCATG GTGAGCAAGG GCGAGGAGCT GTTCACCGGG 61 GTGGTGCCCA TCCTGGTCGA GCTGGACGGC GACGTAAACG GCCACAAGTT CAGCGTGTCC 121 GGCGAGGGCG AGGGCGATGC CACCTACGGC AAGCTGACCC TGAAGTTCAT CTGCACCACC 181 GGCAAGCTGC CCGTGCCCTG GCCCACCCTC GTGACCACCC TGACCTACGG CGTGCAGTGC 241 TTCAGCCGCT ACCCCGACCA CATGAAGCAG CACGACTTCT TCAAGTCCGC CATGCCCGAA 301 GGCTACGTCC AGGAGCGCAC CATCTTCTTC AAGGACGACG GCAACTACAA GACCCGCGCC 361 GAGGTGAAGT TCGAGGGCGA CACCCTGGTG AACCGCATCG AGCTGAAGGG CATCGACTTC 421 AAGGAGGACG GCAACATCCT GGGGCACAAG CTGGAGTACA ACTACAACAG CCACAACGTC 481 TATATCATGG CCGACAAGCA GAAGAACGGC ATCAAGGTGA ACTTCAAGAT CCGCCACAAC 541 ATCGAGGACG GCAGCGTGCA GCTCGCCGAC CACTACCAGC AGAACACCCC CATCGGCGAC 601 GGCCCCGTGC TGCTGCCCGA CAACCACTAC CTGAGCACCC AGTCCGCCCT GAGCAAAGAC 661 CCCAACGAGA AGCGCGATCA CATGGTCCTG CTGGAGTTCG TGACCGCCGC CGGGATCACT 721 CTCGGCATGG ACGAGCTGTA CAAGTAAAGC GGCCGCGAC
Figure B.9: Nucleotide sequence for gfp gene : 759 bp. Composition 180A; 256C;217 G; 106 T; 0 other. Percentage: 23.7% A; 33.7% C; 28.6% G; 14.0% T; 0.0%other. Molecular Weight (kDa): ssDNA: 133.94 dsDNA: 468.02
1 ATGAGGAACG AGGGTTTTCT GAAAATGAAG ACCGACGTTG GAGTCGCCGA CGAGGTGATC 61 TCCGGAGATC TCAAGCAGCT TGGTGACGCT GCAAAGCGGC TAGCTAAACA TGCGATCAAG 121 CTCGGCGCCA GCTTCGGGGT TGGCTCTACC ATAGTCCAGG CTATTGCTTC GATCGCTGCT 181 ATCTATTTGT TGATATTGGA CCGGACAAAC TGGCGTACAA ATATCTTGAC ATCACTTCTA 241 ATTCCATATG TTTACTTGAG TCTTCCTTCA GTGATATTCA ACCTATTCAG GGGCGACCTG 301 GGCAGATGGC TTTCATTCAT TGGCGTAGTA ATGAAGCTCT TCTTCCACCG ACACTTCCCA 361 GTTACCTTGG AACTGCTTGT GTCTCTCATT CTCCTGATTG TGGTTTCCCC CACTTTCATT 421 GCCCACACAA TCAGAGGCAG TCTCATTGGA GTCTTCATCT TCCTTGTCAT CGCCTGCTAC 481 CTCCTCCAAG AGCACATTAG ATCAGCTGGT GGCTTCAAAA ACGCGTTCAC AAAGAGCAAT 541 GGGATTTCAA ACAGCGTCGG GATCATCATT CTACTGATCC ACCCGATCTG GAGCTTGGTG 601 GTGTATTTCC TCTACACGTC TTTGCTGCAA CTTCTTGCAT ACTCTCCTTC CCCTTGTTGT 661 TGCATATTAT ACAATAAGTG GTTTAATTTC ATGCATGTTT GTAAATGTGT AAGCCTTCAT 721 ATGTATTCTC AGTCAATTGG GTCATGCGTG TCCATATTTT TCGTGCAGTT TGTATTCATC 781 TATGAAGCTG AATTTTAA
Figure B.10: Nucleotide sequence for XvSap1 gene: 798 bp. Composition 180 A;193 C; 170 G; 255 T; 0 OTHER Percentage: 22.6% A; 24.2% C; 21.3% G; 32.0%T; 0.0%OTHER Molecular Weight (kDa): ssDNA: 245.57 dsDNA: 491.93
140
Univers
ity of
Cap
e Tow
n

Appendix C
XvPsap1 Regulatory elements
C.1 XvPsap1 regulatory motifs
141
Univers
ity of
Cap
e Tow
n

C.1. XVPSAP1 REGULATORY MOTIFSTab
leC
.1:
Reg
ula
tory
elem
ents
iden
tified
inX
vP
sap1
pro
mot
erusi
ng
PLA
NT
CA
RE
soft
war
e(L
esco
tet
al.,
2002
)
Sit
eO
rgan
ism
*Pos
itio
nStr
and
Mat
rix
Seq
uen
ceFunct
ion
nam
esc
ore
AB
RE
A.th
alia
na32
2+
6C
AC
GT
Gci
s-ac
ting
elem
ent
invo
lved
inth
eab
-sc
isic
acid
resp
onsi
vene
ss
AB
RE
A.th
alia
na18
81+
6C
AC
GT
Gci
s-ac
ting
elem
ent
invo
lved
inth
eab
-sc
isic
acid
resp
onsi
vene
ss
AB
RE
H.vu
lgar
e19
19+
9C
GC
AC
GT
GT
Cci
s-ac
ting
elem
ent
invo
lved
inth
eab
-sc
isic
acid
resp
onsi
vene
ss
AB
RE
A.th
alia
na18
87+
7A
CG
TG
GC
cis-
acti
ngel
emen
tin
volv
edin
the
ab-
scis
icac
idre
spon
sive
ness
AB
RE
A.th
alia
na19
21+
6C
AC
GT
Gci
s-ac
ting
elem
ent
invo
lved
inth
eab
-sc
isic
acid
resp
onsi
vene
ss
A-b
oxP.cr
ispu
m92
2-
6C
CG
TC
Cci
s-ac
ting
regu
lato
ryel
emen
t
AC
EP.cr
ispu
m39
1+
9C
TA
AC
GTA
TT
cis-
acti
ngel
emen
tin
volv
edin
light
re-
spon
sive
ness
AC
EP.cr
ispu
m16
97-
9A
CTA
CG
TT
GG
cis-
acti
ngel
emen
tin
volv
edin
light
re-
spon
sive
ness
AC
EP.cr
ispu
m18
79-
7A
CG
TG
GA
cis-
acti
ngel
emen
tin
volv
edin
light
re-
spon
sive
ness
AC
EP.cr
ispu
m17
21-
7A
CG
TG
GA
cis-
acti
ngel
emen
tin
volv
edin
light
re-
spon
sive
ness
Con
tinued
...
142
Univers
ity of
Cap
e Tow
n

C.1. XVPSAP1 REGULATORY MOTIFSTab
leC
.1–
Con
tinued
Sit
eO
rgan
ism
*Pos
itio
nStr
and
Mat
rix
Seq
uen
ceFunct
ion
nam
esc
ore
AT
CT
-mot
ifZ.m
ays
1338
+9
AA
TC
TG
AT
CG
part
ofa
cons
erve
dD
NA
mod
ule
in-
volv
edin
light
resp
onsi
vene
ss
Box
4P.cr
ispu
m65
2+
6A
TTA
AT
part
ofa
cons
erve
dD
NA
mod
ule
in-
volv
edin
light
resp
onsi
vene
ss
Box
4P.cr
ispu
m13
04+
6A
TTA
AT
part
ofa
cons
erve
dD
NA
mod
ule
in-
volv
edin
light
resp
onsi
vene
ss
Box
IP.sa
tivu
m67
0+
7T
TT
CA
AA
light
resp
onsi
veel
emen
t
Box
IP.sa
tivu
m82
6-
7T
TT
CA
AA
light
resp
onsi
veel
emen
t
Box
IP.sa
tivu
m11
70+
7T
TT
CA
AA
light
resp
onsi
veel
emen
t
Box
IP.sa
tivu
m12
26+
7T
TT
CA
AA
light
resp
onsi
veel
emen
t
Box
IIP.ho
rten
se18
79+
9T
CC
AC
GT
GG
Cpa
rtof
alig
htre
spon
sive
elem
ent
Box
III
P.sa
tivu
m75
-9
CA
TT
TA
CA
CT
prot
ein
bind
ing
site
CA
TT
-mot
ifZ.m
ays
202
+6
GC
AT
TC
part
ofa
light
resp
onsi
veel
emen
t
CA
TT
-mot
ifZ.m
ays
327
+6
GC
AT
TC
part
ofa
light
resp
onsi
veel
emen
t
CA
AT
-box
G.m
ax10
34+
5C
AA
TT
com
mon
cis-
acti
ngel
emen
tin
pro-
mot
eran
den
hanc
erre
gion
s
CA
AT
-box
G.m
ax14
50-
5C
AA
TT
com
mon
cis-
acti
ngel
emen
tin
pro-
mot
eran
den
hanc
erre
gion
s
CA
AT
-box
H.vu
lgar
e13
62+
4C
AA
Tco
mm
onci
s-ac
ting
elem
ent
inpr
o-m
oter
and
enha
ncer
regi
ons
CA
AT
-box
H.vu
lgar
e18
98+
4C
AA
Tco
mm
onci
s-ac
ting
elem
ent
inpr
o-m
oter
and
enha
ncer
regi
ons
Con
tinued
...
143
Univers
ity of
Cap
e Tow
n

C.1. XVPSAP1 REGULATORY MOTIFSTab
leC
.1–
Con
tinued
Sit
eO
rgan
ism
*Pos
itio
nStr
and
Mat
rix
Seq
uen
ceFunct
ion
nam
esc
ore
CA
AT
-box
B.ra
pa12
00-
5C
AA
AT
com
mon
cis-
acti
ngel
emen
tin
pro-
mot
eran
den
hanc
erre
gion
s
CA
AT
-box
G.m
ax15
07-
5C
AA
TT
com
mon
cis-
acti
ngel
emen
tin
pro-
mot
eran
den
hanc
erre
gion
s
CA
AT
-box
G.m
ax14
15+
5C
AA
TT
com
mon
cis-
acti
ngel
emen
tin
pro-
mot
eran
den
hanc
erre
gion
s
CA
AT
-box
B.ra
pa20
28-
5C
AA
AT
com
mon
cis-
acti
ngel
emen
tin
pro-
mot
eran
den
hanc
erre
gion
s
CA
AT
-box
B.ra
pa11
95-
5C
AA
AT
com
mon
cis-
acti
ngel
emen
tin
pro-
mot
eran
den
hanc
erre
gion
s
CA
AT
-box
H.vu
lgar
e14
51-
4C
AA
Tco
mm
onci
s-ac
ting
elem
ent
inpr
o-m
oter
and
enha
ncer
regi
ons
CA
AT
-box
A.th
alia
na14
14+
5C
CA
AT
com
mon
cis-
acti
ngel
emen
tin
pro-
mot
eran
den
hanc
erre
gion
s
CA
AT
-box
P.hy
brid
a19
52+
7T
GC
CA
AC
com
mon
cis-
acti
ngel
emen
tin
pro-
mot
eran
den
hanc
erre
gion
s
CA
AT
-box
A.th
alia
na13
60+
6G
GC
AA
Tco
mm
onci
s-ac
ting
elem
ent
inpr
o-m
oter
and
enha
ncer
regi
ons
CA
AT
-box
A.th
alia
na15
08-
5C
CA
AT
com
mon
cis-
acti
ngel
emen
tin
pro-
mot
eran
den
hanc
erre
gion
s
CA
AT
-box
B.ra
pa14
17-
5C
AA
AT
com
mon
cis-
acti
ngel
emen
tin
pro-
mot
eran
den
hanc
erre
gion
s
Con
tinued
...
144
Univers
ity of
Cap
e Tow
n

C.1. XVPSAP1 REGULATORY MOTIFSTab
leC
.1–
Con
tinued
Sit
eO
rgan
ism
*Pos
itio
nStr
and
Mat
rix
Seq
uen
ceFunct
ion
nam
esc
ore
CA
AT
-box
B.ra
pa20
39-
5C
AA
AT
com
mon
cis-
acti
ngel
emen
tin
pro-
mot
eran
den
hanc
erre
gion
s
CA
T-b
oxA
.th
alia
na15
92+
6G
CC
AC
Tci
s-ac
ting
regu
lato
ryel
emen
tre
late
dto
mer
iste
mex
pres
sion
CA
T-b
oxA
.th
alia
na16
63+
6G
CC
AC
Tci
s-ac
ting
regu
lato
ryel
emen
tre
late
dto
mer
iste
mex
pres
sion
circ
adia
nL.
escu
len-
tum
274
+9
CA
AA
GA
TA
TC
cis-
acti
ngre
gula
tory
elem
ent
invo
lved
inci
rcad
ian
cont
rol
circ
adia
nL.
escu
len-
tum
639
-6
CA
AN
NN
NA
TC
cis-
acti
ngre
gula
tory
elem
ent
invo
lved
inci
rcad
ian
cont
rol
CG
TC
A-m
otif
H.vu
lgar
e18
85-
5C
GT
CA
cis-
acti
ngre
gula
tory
elem
ent
invo
lved
inth
eM
eJA
-res
pons
iven
ess
G-B
oxP.sa
tivu
m16
26+
6C
AC
GT
Tci
s-ac
ting
regu
lato
ryel
emen
tin
volv
edin
light
resp
onsi
vene
ss
G-B
oxP.sa
tivu
m19
21+
6C
AC
GT
Gci
s-ac
ting
regu
lato
ryel
emen
tin
volv
edin
light
resp
onsi
vene
ss
G-B
oxP.sa
tivu
m32
2+
6C
AC
GT
Gci
s-ac
ting
regu
lato
ryel
emen
tin
volv
edin
light
resp
onsi
vene
ss
G-B
oxP.sa
tivu
m17
23+
6C
AC
GT
Tci
s-ac
ting
regu
lato
ryel
emen
tin
volv
edin
light
resp
onsi
vene
ss
G-B
oxP.sa
tivu
m16
99-
6C
AC
GT
Tci
s-ac
ting
regu
lato
ryel
emen
tin
volv
edin
light
resp
onsi
vene
ss
Con
tinued
...
145
Univers
ity of
Cap
e Tow
n

C.1. XVPSAP1 REGULATORY MOTIFSTab
leC
.1–
Con
tinued
Sit
eO
rgan
ism
*Pos
itio
nStr
and
Mat
rix
Seq
uen
ceFunct
ion
nam
esc
ore
G-B
oxP.sa
tivu
m18
81+
6C
AC
GT
Gci
s-ac
ting
regu
lato
ryel
emen
tin
volv
edin
light
resp
onsi
vene
ss
G-B
oxS.
tube
ro-
sum
146
-7
CA
CA
TG
Gci
s-ac
ting
regu
lato
ryel
emen
tin
volv
edin
light
resp
onsi
vene
ss
G-B
oxA
.th
alia
na32
2+
6C
AC
GT
Gci
s-ac
ting
regu
lato
ryel
emen
tin
volv
edin
light
resp
onsi
vene
ss
G-B
oxZ.m
ays
186
+6
CA
CG
AC
cis-
acti
ngre
gula
tory
elem
ent
invo
lved
inlig
htre
spon
sive
ness
G-B
oxZ.m
ays
1626
+6
CA
CG
TT
cis-
acti
ngre
gula
tory
elem
ent
invo
lved
inlig
htre
spon
sive
ness
G-B
oxA
.th
alia
na18
81+
6C
AC
GT
Gci
s-ac
ting
regu
lato
ryel
emen
tin
volv
edin
light
resp
onsi
vene
ss
G-B
oxA
.th
alia
na18
79-
9G
CC
AC
GT
GG
Aci
s-ac
ting
regu
lato
ryel
emen
tin
volv
edin
light
resp
onsi
vene
ss
G-B
oxZ.m
ays
1886
-6
CA
CG
TC
cis-
acti
ngre
gula
tory
elem
ent
invo
lved
inlig
htre
spon
sive
ness
GA
TA
-mot
ifA
.th
alia
na13
75+
7G
ATA
GG
Apa
rtof
alig
htre
spon
sive
elem
ent
GA
TA
-mot
ifA
.th
alia
na15
40-
7G
ATA
GG
Apa
rtof
alig
htre
spon
sive
elem
ent
HSE
B.ol
erac
ea75
9-
9A
AA
AA
AT
TT
Cci
s-ac
ting
elem
ent
invo
lved
inhe
atst
ress
resp
onsi
vene
ss
HSE
B.ol
erac
ea99
2+
9A
AA
AA
AT
TT
Cci
s-ac
ting
elem
ent
invo
lved
inhe
atst
ress
resp
onsi
vene
ss
Con
tinued
...
146
Univers
ity of
Cap
e Tow
n

C.1. XVPSAP1 REGULATORY MOTIFSTab
leC
.1–
Con
tinued
Sit
eO
rgan
ism
*Pos
itio
nStr
and
Mat
rix
Seq
uen
ceFunct
ion
nam
esc
ore
HSE
B.ol
erac
ea10
47-
9A
AA
AA
AT
TT
Cci
s-ac
ting
elem
ent
invo
lved
inhe
atst
ress
resp
onsi
vene
ss
HSE
B.ol
erac
ea12
18-
9A
AA
AA
AT
TT
Cci
s-ac
ting
elem
ent
invo
lved
inhe
atst
ress
resp
onsi
vene
ss
HSE
B.ol
erac
ea11
62-
9A
AA
AA
AT
TT
Cci
s-ac
ting
elem
ent
invo
lved
inhe
atst
ress
resp
onsi
vene
ss
CC
GT
CC
-box
A.th
alia
na92
2-
6C
CG
TC
Cci
s-ac
ting
regu
lato
ryel
emen
tre
late
dto
mer
iste
msp
ecifi
cac
tiva
tion
CG
-mot
ifL.gi
bba
516
+8
CC
AT
GG
GG
part
ofa
light
resp
onsi
veel
emen
t
CG
TC
A-m
otif
H.vu
lgar
e50
7+
5C
GT
CA
cis-
acti
ngre
gula
tory
elem
ent
invo
lved
inth
eM
eJA
-res
pons
iven
ess
CG
TC
A-m
otif
H.vu
lgar
e69
4-
5C
GT
CA
cis-
acti
ngre
gula
tory
elem
ent
invo
lved
inth
eM
eJA
-res
pons
iven
ess
EIR
EN
.ta
bacu
m65
4+
7T
TC
GA
CC
elic
itor
-res
pons
ive
elem
ent
GA
TA
-mot
ifP.sa
tivu
m79
5+
7G
ATA
GG
Gpa
rtof
alig
htre
spon
sive
elem
ent
I-bo
xfN
.pl
umba
gini
-fo
lia
381
-9
CT
CT
TA
TG
CT
part
ofa
light
resp
onsi
veel
emen
t
I-bo
xZ.m
ays
795
+7
GA
TA
GG
Gpa
rtof
alig
htre
spon
sive
elem
ent
LTR
H.vu
lgar
e13
11-
6C
CG
AA
Aci
s-ac
ting
elem
ent
invo
lved
inlo
w-
tem
pera
ture
resp
onsi
vene
ss
Con
tinued
...
147
Univers
ity of
Cap
e Tow
n

C.1. XVPSAP1 REGULATORY MOTIFSTab
leC
.1–
Con
tinued
Sit
eO
rgan
ism
*Pos
itio
nStr
and
Mat
rix
Seq
uen
ceFunct
ion
nam
esc
ore
MB
SA
.th
alia
na15
49+
6C
AA
CT
GM
YB
bind
ing
site
invo
lved
indr
ough
t-in
duci
bilit
y
O2-
site
Z.m
ays
1605
-10
GA
TG
AT
GT
GG
cis-
acti
ngre
gula
tory
elem
ent
invo
lved
inze
inm
etab
olis
mre
gula
tion
O2-
site
Z.m
ays
137
-9
GA
TG
AC
AT
GA
cis-
acti
ngre
gula
tory
elem
ent
invo
lved
inze
inm
etab
olis
mre
gula
tion
Sp1
O.sa
tiva
1781
+6
GG
GC
GG
light
resp
onsi
veel
emen
t
TG
A-e
lem
ent
B.ol
erac
ea19
26-
6A
AC
GA
Cau
xin-
resp
onsi
veel
emen
t
TG
A-e
lem
ent
B.ol
erac
ea19
56+
6A
AC
GA
Cau
xin-
resp
onsi
veel
emen
t
TG
AC
G-m
otif
H.vu
lgar
e18
85+
5T
GA
CG
cis-
acti
ngre
gula
tory
elem
ent
invo
lved
inth
eM
eJA
-res
pons
iven
ess
P-b
oxO
.sa
tiva
217
-7
CC
TT
TT
Ggi
bber
ellin
-res
pons
ive
elem
ent
Skn-
1m
otif
O.sa
tiva
693
-5
GT
CA
Tci
s-ac
ting
regu
lato
ryel
emen
tre
quir
edfo
ren
dosp
erm
expr
essi
on
TC
-ric
hre
-pe
ats
N.ta
bacu
m17
09+
9A
TT
CT
CTA
AC
cis-
acti
ngel
emen
tin
volv
edin
defe
nse
and
stre
ssre
spon
sive
ness
TC
T-m
otif
A.th
alia
na19
05+
6T
CT
TA
Cpa
rtof
alig
htre
spon
sive
elem
ent
TG
A-b
oxG
.m
ax18
85+
9T
GA
CG
TG
GC
part
ofan
auxi
n-re
spon
sive
elem
ent
TC
A-e
lem
ent
B.ol
erac
ea35
3-
9C
AG
AA
AA
GG
Aci
s-ac
ting
elem
ent
invo
lved
insa
licyl
icac
idre
spon
sive
ness
Sp1
Z.m
ays
481
+5
CC
(G/A
)CC
Clig
htre
spon
sive
elem
ent
Sp1
Z.m
ays
902
+5
CC
(G/A
)CC
Clig
htre
spon
sive
elem
ent
Con
tinued
...
148
Univers
ity of
Cap
e Tow
n

C.1. XVPSAP1 REGULATORY MOTIFSTab
leC
.1–
Con
tinued
Sit
eO
rgan
ism
*Pos
itio
nStr
and
Mat
rix
Seq
uen
ceFunct
ion
nam
esc
ore
Sp1
Z.m
ays
816
+5
CC
(G/A
)CC
Clig
htre
spon
sive
elem
ent
Unn
amed
-1G
.m
ax14
03-
11G
AA
TT
TA
AT
TA
A60
Kpr
otei
nbi
ndin
gsi
te
TC
-ric
hre
-pe
ats
N.ta
bacu
m23
6+
9A
TT
TT
CT
CC
Aci
s-ac
ting
elem
ent
invo
lved
inde
fens
ean
dst
ress
resp
onsi
vene
ss
TC
-ric
hre
-pe
ats
N.ta
bacu
m98
9-
9A
TT
TT
CT
CC
Aci
s-ac
ting
elem
ent
invo
lved
inde
fens
ean
dst
ress
resp
onsi
vene
ss
TC
T-m
otif
A.th
alia
na30
-6
TC
TTA
Cpa
rtof
alig
htre
spon
sive
elem
ent
TC
T-m
otif
A.th
alia
na31
1-
6T
CT
TA
Cpa
rtof
alig
htre
spon
sive
elem
ent
TG
AC
G-m
otif
H.vu
lgar
e50
7-
5T
GA
CG
cis-
acti
ngre
gula
tory
elem
ent
invo
lved
inth
eM
eJA
-res
pons
iven
ess
TG
AC
G-m
otif
H.vu
lgar
e69
4+
5T
GA
CG
cis-
acti
ngre
gula
tory
elem
ent
invo
lved
inth
eM
eJA
-res
pons
iven
ess
TA
TA
-box
A.th
alia
na19
-9
TC
TA
TA
TA
TT
core
prom
oter
elem
ent
arou
nd-3
0of
tran
scri
ptio
nst
art
TA
TA
-box
A.th
alia
na21
+4
TA
TA
core
prom
oter
elem
ent
arou
nd-3
0of
tran
scri
ptio
nst
art
TA
TA
-box
L.
escu
len-
tum
74+
5T
TT
TA
core
prom
oter
elem
ent
arou
nd-3
0of
tran
scri
ptio
nst
art
TA
TA
-box
L.
escu
len-
tum
92-
5T
TT
TA
core
prom
oter
elem
ent
arou
nd-3
0of
tran
scri
ptio
nst
art
TA
TA
-box
L.
escu
len-
tum
110
+5
TT
TTA
core
prom
oter
elem
ent
arou
nd-3
0of
tran
scri
ptio
nst
art
Con
tinued
...
149
Univers
ity of
Cap
e Tow
n

C.1. XVPSAP1 REGULATORY MOTIFSTab
leC
.1–
Con
tinued
Sit
eO
rgan
ism
*Pos
itio
nStr
and
Mat
rix
Seq
uen
ceFunct
ion
nam
esc
ore
TA
TA
-box
A.th
alia
na11
7+
8TA
TT
TA
AA
core
prom
oter
elem
ent
arou
nd-3
0of
tran
scri
ptio
nst
art
TA
TA
-box
Z.m
ays
119
+8
TT
TA
AA
AA
core
prom
oter
elem
ent
arou
nd-3
0of
tran
scri
ptio
nst
art
TA
TA
-box
L.
escu
len-
tum
121
-5
TT
TTA
core
prom
oter
elem
ent
arou
nd-3
0of
tran
scri
ptio
nst
art
TA
TA
-box
G.m
ax24
9-
5TA
ATA
core
prom
oter
elem
ent
arou
nd-3
0of
tran
scri
ptio
nst
art
TA
TA
-box
A.th
alia
na28
9+
4TA
TA
core
prom
oter
elem
ent
arou
nd-3
0of
tran
scri
ptio
nst
art
TA
TA
-box
H.an
nuus
299
-6
TA
TA
CA
core
prom
oter
elem
ent
arou
nd-3
0of
tran
scri
ptio
nst
art
TA
TA
-box
A.th
alia
na30
1+
4TA
TA
core
prom
oter
elem
ent
arou
nd-3
0of
tran
scri
ptio
nst
art
TA
TA
-box
L.
escu
len-
tum
408
-5
TT
TTA
core
prom
oter
elem
ent
arou
nd-3
0of
tran
scri
ptio
nst
art
TA
TA
-box
B.na
pus
438
+6
AT
TA
TA
core
prom
oter
elem
ent
arou
nd-3
0of
tran
scri
ptio
nst
art
TA
TA
-box
A.th
alia
na43
9-
5TA
TA
Aco
repr
omot
erel
emen
tar
ound
-30
oftr
ansc
ript
ion
star
t
TA
TA
-box
A.th
alia
na44
0+
4TA
TA
core
prom
oter
elem
ent
arou
nd-3
0of
tran
scri
ptio
nst
art
Con
tinued
...
150
Univers
ity of
Cap
e Tow
n

C.1. XVPSAP1 REGULATORY MOTIFSTab
leC
.1–
Con
tinued
Sit
eO
rgan
ism
*Pos
itio
nStr
and
Mat
rix
Seq
uen
ceFunct
ion
nam
esc
ore
TA
TA
-box
L.
escu
len-
tum
457
+5
TT
TTA
core
prom
oter
elem
ent
arou
nd-3
0of
tran
scri
ptio
nst
art
TA
TA
-box
A.th
alia
na46
4+
4TA
TA
core
prom
oter
elem
ent
arou
nd-3
0of
tran
scri
ptio
nst
art
TA
TA
-box
L.
escu
len-
tum
566
+5
TT
TTA
core
prom
oter
elem
ent
arou
nd-3
0of
tran
scri
ptio
nst
art
TA
TA
-box
G.m
ax56
9-
5TA
ATA
core
prom
oter
elem
ent
arou
nd-3
0of
tran
scri
ptio
nst
art
TA
TA
-box
B.na
pus
570
+6
AT
TA
TA
core
prom
oter
elem
ent
arou
nd-3
0of
tran
scri
ptio
nst
art
TA
TA
-box
A.th
alia
na57
1-
5TA
TA
Aco
repr
omot
erel
emen
tar
ound
-30
oftr
ansc
ript
ion
star
t
TA
TA
-box
A.th
alia
na57
2+
4TA
TA
core
prom
oter
elem
ent
arou
nd-3
0of
tran
scri
ptio
nst
art
TA
TA
-box
G.m
ax59
4+
5TA
ATA
core
prom
oter
elem
ent
arou
nd-3
0of
tran
scri
ptio
nst
art
TA
TA
-box
A.th
alia
na62
4+
11TA
TA
AA
TA
TA
AA
core
prom
oter
elem
ent
arou
nd-3
0of
tran
scri
ptio
nst
art
TA
TA
-box
A.th
alia
na62
8+
9TA
TA
TA
AA
TC
core
prom
oter
elem
ent
arou
nd-3
0of
tran
scri
ptio
nst
art
TA
TA
-box
B.ol
erac
ea62
9+
6A
TA
TA
Aco
repr
omot
erel
emen
tar
ound
-30
oftr
ansc
ript
ion
star
t
Con
tinued
...
151
Univers
ity of
Cap
e Tow
n

C.1. XVPSAP1 REGULATORY MOTIFSTab
leC
.1–
Con
tinued
Sit
eO
rgan
ism
*Pos
itio
nStr
and
Mat
rix
Seq
uen
ceFunct
ion
nam
esc
ore
TA
TA
-box
G.m
ax65
4+
5TA
ATA
core
prom
oter
elem
ent
arou
nd-3
0of
tran
scri
ptio
nst
art
TA
TA
-box
L.
escu
len-
tum
660
+5
TT
TTA
core
prom
oter
elem
ent
arou
nd-3
0of
tran
scri
ptio
nst
art
TA
TA
-box
L.
escu
len-
tum
733
+5
TT
TTA
core
prom
oter
elem
ent
arou
nd-3
0of
tran
scri
ptio
nst
art
TA
TA
-box
O.sa
tiva
765
-7
TA
CA
AA
Aco
repr
omot
erel
emen
tar
ound
-30
oftr
ansc
ript
ion
star
t
TA
TA
-box
A.th
alia
na93
3-
9TA
CA
AA
Aco
repr
omot
erel
emen
tar
ound
-30
oftr
ansc
ript
ion
star
t
TA
TA
-box
A.th
alia
na93
5+
9TA
CA
AA
Aco
repr
omot
erel
emen
tar
ound
-30
oftr
ansc
ript
ion
star
t
TA
TA
-box
A.th
alia
na93
7+
8TA
CA
AA
Aco
repr
omot
erel
emen
tar
ound
-30
oftr
ansc
ript
ion
star
t
TA
TA
-box
B.na
pus
938
+6
TA
CA
AA
Aco
repr
omot
erel
emen
tar
ound
-30
oftr
ansc
ript
ion
star
t
TA
TA
-box
A.th
alia
na93
9+
4TA
CA
AA
Aco
repr
omot
erel
emen
tar
ound
-30
oftr
ansc
ript
ion
star
t
TA
TA
-box
B.na
pus
940
+6
ATA
TA
Tco
repr
omot
erel
emen
tar
ound
-30
oftr
ansc
ript
ion
star
t
TA
TA
-box
A.th
alia
na94
1+
4TA
TA
core
prom
oter
elem
ent
arou
nd-3
0of
tran
scri
ptio
nst
art
Con
tinued
...
152
Univers
ity of
Cap
e Tow
n

C.1. XVPSAP1 REGULATORY MOTIFSTab
leC
.1–
Con
tinued
Sit
eO
rgan
ism
*Pos
itio
nStr
and
Mat
rix
Seq
uen
ceFunct
ion
nam
esc
ore
TA
TA
-box
L.
escu
len-
tum
998
+5
TT
TTA
core
prom
oter
elem
ent
arou
nd-3
0of
tran
scri
ptio
nst
art
TA
TA
-box
L.
escu
len-
tum
1012
+5
TT
TTA
core
prom
oter
elem
ent
arou
nd-3
0of
tran
scri
ptio
nst
art
TA
TA
-box
L.
escu
len-
tum
1038
+5
TT
TTA
core
prom
oter
elem
ent
arou
nd-3
0of
tran
scri
ptio
nst
art
TA
TA
-box
G.m
ax14
46+
5TA
ATA
core
prom
oter
elem
ent
arou
nd-3
0of
tran
scri
ptio
nst
art
TA
TA
-box
A.th
alia
na12
78+
4TA
TA
core
prom
oter
elem
ent
arou
nd-3
0of
tran
scri
ptio
nst
art
TA
TA
-box
L.
escu
len-
tum
1480
+5
TT
TTA
core
prom
oter
elem
ent
arou
nd-3
0of
tran
scri
ptio
nst
art
TA
TA
-box
L.
escu
len-
tum
1153
+5
TT
TTA
core
prom
oter
elem
ent
arou
nd-3
0of
tran
scri
ptio
nst
art
TA
TA
-box
A.th
alia
na14
63-
5TA
TA
Aco
repr
omot
erel
emen
tar
ound
-30
oftr
ansc
ript
ion
star
t
TA
TA
-box
A.th
alia
na13
65+
4TA
TA
core
prom
oter
elem
ent
arou
nd-3
0of
tran
scri
ptio
nst
art
TA
TA
-box
G.m
ax20
73-
5TA
ATA
core
prom
oter
elem
ent
arou
nd-3
0of
tran
scri
ptio
nst
art
TA
TA
-box
L.
escu
len-
tum
1068
+5
TT
TTA
core
prom
oter
elem
ent
arou
nd-3
0of
tran
scri
ptio
nst
art
Con
tinued
...
153
Univers
ity of
Cap
e Tow
n

C.1. XVPSAP1 REGULATORY MOTIFSTab
leC
.1–
Con
tinued
Sit
eO
rgan
ism
*Pos
itio
nStr
and
Mat
rix
Seq
uen
ceFunct
ion
nam
esc
ore
TA
TA
-box
A.th
alia
na14
62-
6TA
TA
AA
core
prom
oter
elem
ent
arou
nd-3
0of
tran
scri
ptio
nst
art
TA
TA
-box
B.ol
erac
ea13
64+
6A
TA
TA
Aco
repr
omot
erel
emen
tar
ound
-30
oftr
ansc
ript
ion
star
t
TA
TA
-box
L.
escu
len-
tum
1494
+5
TT
TTA
core
prom
oter
elem
ent
arou
nd-3
0of
tran
scri
ptio
nst
art
TA
TA
-box
L.
escu
len-
tum
1208
+5
TT
TTA
core
prom
oter
elem
ent
arou
nd-3
0of
tran
scri
ptio
nst
art
TA
TA
-box
A.th
alia
na14
64+
4TA
TA
core
prom
oter
elem
ent
arou
nd-3
0of
tran
scri
ptio
nst
art
TA
TA
-box
G.m
ax14
26-
5TA
ATA
core
prom
oter
elem
ent
arou
nd-3
0of
tran
scri
ptio
nst
art
Org
anis
m*
154
Univers
ity of
Cap
e Tow
n