train induced ground vibration – optimised rolling … improved process for wheel profiling with...
TRANSCRIPT
RIVAS
SCP0-GA-2010-265754
RIVAS_CHALMERS_ WP5_D5_4_FINAL Page 1 of 81 26/2/2013
RIVAS
Railway Induced Vibration Abatement Solutions
Collaborative project
Train Induced Ground Vibration –
Optimised Rolling Stock Mitigation Measures and the ir Parameters
Deliverable D5.4
Submission date: 26/02/2013
Project Coordinator:
Bernd Asmussen
International Union of Railways (UIC)

RIVAS
SCP0-GA-2010-265754
RIVAS_CHALMERS_ WP5_D5_4_FINAL Page 2 of 81 26/2/2013
Title Train Induced Ground Vibration – Optimis ed Rolling Stock Mitigation Measures and their Parameters
Domain WP 5
Date 26/02/2013
Author/Authors Jens Nielsen, Adam Mirza, Steven Cervello, Anders Frid, Roger Müller, Brice Nelain, Philipp Ruest
Partner Chalmers University of Technology, Bombardier Transportation, Lucchini, SBB, Vibratec
Document Code RIVAS_CHALMERS_ WP5_D5_4_FINAL Version 3 Status Final
Dissemination level:
Document history
Revision Date Description
0 16/10/2012 First Draft
1 18/12/2012 First Version
2 17/1/2013 Second Version – comments by Adam Mirza, Brice Nelain and Roger Müller have been considered
3 26/2/2013 Final Version – reviewed by Bernd Asmussen
Project co-funded by the European Commission within the Seventh Framework Programme
Dissemination Level PU Public X PP Restricted to other programme participants (including the Commission Services) RE Restricted to a group specified by the consortium (including the Commission) Services) CO Confidential, only for members of the consortium (including the Commission Services)

RIVAS
SCP0-GA-2010-265754
RIVAS_CHALMERS_ WP5_D5_4_FINAL Page 3 of 81 26/2/2013
1. EXECUTIVE SUMMARY
The RIVAS project aims at reducing train induced ground vibration by measures applied on track superstructure, ground and vehicle. Measures applied for the ground address the propagation of vibrations while measures applied on the track superstructure and the vehicle aim at controlling the excitation and the response of the vehicle-track system.
It was concluded in previous RIVAS deliverables, see D5.1 and D5.2, that unsprung wheelset mass and wheel out-of-roundness (OOR) are key vehicle parameters in the generation of ground vibration. This conclusion was based on both field measurements and numerical simulations.
In this RIVAS deliverable, an overview of the present knowledge on causes for OOR growth is presented. Various types of OOR are classified and discussed. Unfortunately, for many types of OOR the causes are unknown and the most commonly applied mitigation measure seems to be early detection of out-of-round wheels followed by wheel turning. Nevertheless, potential mitigation measures include more wear resistant wheel materials, design and optimisation of braking systems, an improved process for wheel profiling with stricter tolerances, and improved bogie steering.
The ground vibration measurements on Swiss track performed by SBB are further evaluated. Based on these field measurements and simulations presented here and in D5.2, it is concluded that vibration spectra are dominated by two mechanisms: the sleeper passing frequency and the resonance frequency of the unsprung mass on the track stiffness (sometimes referred to as the P2 resonance). Significant levels of ground vibration are generated by locomotives of the types Re420, Re474 and TRAXX. Several wheels on these locomotives have large levels of OOR although there seems to be a large spread between different wheels. The unsprung mass of TRAXX and Re420 is 4500 kg and 3200 kg, respectively. The Re420 has a semi-suspended drive. In contrast, the Re460 locomotives do not generate severe ground vibrations related to wheel OOR while vibration generated at sleeper passing frequency are at levels comparable to other locomotive types. The Re460 reaches long reprofiling intervals due to the slow OOR growth, has a fully-suspended drive and a significantly lower unsprung mass of 1900 kg. Future work in WP5 will focus on field measurements for a smaller selection of these vehicles and to carry out OOR measurements in workshops using another dedicated instrument for direct measurement of deviation from nominal wheel radius around the wheel circumference (including a wider range of wavelengths compared to previous measurements). The development of wheel OOR will be studied to investigate the influence of the most important design differences so that recommendations can be given.
For simulations of train induced ground vibration, the previously rigid wheelset model is refined by implementing a flexible beam model where the mass distribution and the influence of eigenmodes can be studied. In D5.2, the numerical simulations were based on a model (TRAFFIC software developed by KUL) where the vehicle was stationary (standing still) at a fixed position along the track. In this report, a revised version of TRAFFIC is applied which enables an investigation of a moving vehicle such that design parameters related to distances between wheelsets (axle and bogie passing frequencies) can also be investigated. Based on the new simulations, it is still concluded that the most effective means to reduce ground vibration by vehicle optimisation is minimising the unsprung mass as this increases the vehicle receptance in a wide frequency range. The influence of wheelset resonances in bending seems to be negligible. Reducing the stiffness of the primary suspension could have a positive effect in reducing ground vibration for soils where the free field mobility is high at frequencies near the wheelset resonance on the primary suspension. No consistent conclusions can be drawn for the influence of wheelset and bogie distances on ground vibration as the results seem to vary from one combination of vehicle speed and track irregularity profile to another. Also, note that modifying the properties of the primary suspension and/or the

RIVAS
SCP0-GA-2010-265754
RIVAS_CHALMERS_ WP5_D5_4_FINAL Page 4 of 81 26/2/2013
wheelset and bogie distances may simply shift the problem of ground vibration from one octave band to the next. This means that (1) a vehicle that has been optimised for certain soil conditions might be non-optimal at other soil conditions and (2) a consistent reduction of ground vibration cannot be expected even if the soil conditions are similar since different combinations of vehicle speed and wavelength content of wheel/track irregularities at different sites will induce different excitation frequencies.
A technology assessment (including functional constraints and cost efficiency) of vehicle and wheelset designs is presented. Different means of reducing the unsprung mass are discussed, such as wheel design, axle design and the design concept and suspension of the mechanical drive system. Reduction of wheel OOR by wheel material selection, improved traction and braking control as well as considering the curving ability of the vehicle are suggested. The assessment shows that a reduction of unsprung mass is possible. However, any design change can only be carried out after a careful consideration of the overall performance of the bogie and its subsystems. The unsprung mass of a powered wheelset primarily consists of the wheelset mass and part of the drive system mass. A reduction of the wheelset mass will directly translate to the same reduction in unsprung mass, while the effect of the drive system will to a large extent depend on the drive suspension concept. The conceptual design of a bogie is carried out at an early stage in the vehicle design process and hence a low unsprung mass has to be a pronounced design target from the very beginning.

RIVAS
SCP0-GA-2010-265754
RIVAS_CHALMERS_ WP5_D5_4_FINAL Page 5 of 81 26/2/2013
2. TABLE OF CONTENTS
1. Executive Summary 3
2. Table of Contents 5
3. Introduction 7
4. Literature Survey on OOR Growth 8
4.1 Tread defects and their causes 8
4.1.1 Localised tread defects 9
4.1.2 Periodic tread defects 13
4.1.3 Measurement of wheel tread defects 16
4.2 Mitigation measures for reduction of wheel OOR 17
4.2.1 Wheel material 17
4.2.2 Steering bogies 19
5. Measurements - Analysis of SBB Data 21
5.1 Review of measured OOR by SBB 21
5.1.1 Re620 and Re420 22
5.1.2 TRAXX 25
5.1.3 Discussion on possible causes of OOR for TRAXX compared to Re420/620 26
5.2 Future measurements 27
6. Simulations 28
6.1 Flexible wheelset model 32
6.2 Vehicle input data 36
6.3 Results – passenger vehicle model 38
6.4 Results – freight vehicle model 47
6.4.1 Lincent 47
6.4.2 Horstwalde 48
6.4.3 Furet 49
6.4.4 Summary 49
7. Technology Assessment 59
7.1 Reduced unsprung mass – contribution from drive system 59
7.1.1 Definition of the mechanical drive 59
7.1.2 Drive suspension concepts 59
7.1.3 Other drive arrangement principles 62
7.1.4 Indicative impact of drive concept on total mass and unsprung mass 64
7.1.5 Drive concepts 65
7.2 Reduction of unsprung mass – contribution from wheelset 67
RIVAS
SCP0-GA-2010-265754
RIVAS_CHALMERS_ WP5_D5_4_FINAL Page 6 of 81 26/2/2013
7.2.1 Axle 67
7.2.2 Wheel 68
7.2.3 Negative consequences of mass reduction 69
7.3 Reduction of wheel OOR with respect to vehicle design 69
7.3.1 Traction 70
7.3.2 Braking 70
7.3.3 Axle guidance (curving ability) 70
7.3.4 Suspension stiffness and damping 71
7.3.5 Unsprung mass (drive types) 71
7.3.6 Wheel diameter 72
7.4 Reduction of wheel OOR with respect to wheelset design 72
7.4.1 Wheel material to reduce RCF and growth of OOR 72
7.4.2 Influence of traction/braking control on unsprung mass and OOR growth 74
7.4.3 Reduction of OOR in manufacturing and maintenance operations 74
7.4.4 Resilient wheels 75
7.5 Cost aspects 75
8. Discussion and Concluding Remarks 77
8.1 Next steps – field tests 78
9. Acknowledgements 78
10. References 79
11. Appendix 81

RIVAS
SCP0-GA-2010-265754
RIVAS_CHALMERS_ WP5_D5_4_FINAL Page 7 of 81 26/2/2013
3. INTRODUCTION
The RIVAS project aims at reducing train induced ground vibration by measures applied on track superstructure, ground and vehicle. Measures applied for the ground address the propagation of vibrations while measures applied on track superstructure and vehicle aim at controlling the excitation and the response of the vehicle-track system. The perceivable ground vibration has a frequency content ranging from a few Hz up to around 80 Hz [1,2]. The ground-borne noise is containing frequencies in the interval 30 – 250 Hz and is generated by vibration propagating in the ground which is radiated as noise from for example building walls [1].
A state-of-the-art survey on the influence of rolling stock on induced ground vibration was presented in RIVAS deliverable D5.1 [3]. An inventory was made of previous studies where simulations and measurements had been used to investigate vehicle influence. The potential of optimising various vehicle design parameters to reduce ground vibration emissions was discussed. When introducing new vehicle designs and performance requirements, it was concluded that these must be achieved without jeopardising the compliance with other existing requirements. For example, bogie parameters such as wheelset mass, drive concept and suspension properties need to be designed in order to meet requirements on ride comfort and stability as well as on curving performance. Thus, when modifying the vehicle aiming to reduce ground vibration it must be assured that such changes do not conflict with the vehicle performance in other areas.
It was concluded in RIVAS D5.1 [3] and D5.2 [4] that unsprung wheelset mass and wheel out-of-roundness (OOR) are key parameters in the generation of ground vibration. This conclusion was based on both field measurements and numerical simulations. Aspects of vehicle design, such as the selection of braking system and primary suspension, and/or tolerances in production and maintenance of wheels may have an impact on the deterioration of the wheel tread (generation and growth of wheel OOR) and hence an indirect influence on the excitation of ground vibration.
In this RIVAS deliverable, a further assessment of field test data for the wide range of vehicles passing a test station in Switzerland is performed. The previously rigid wheelset model is refined by implementing a flexible beam model where the mass distribution and the influence of eigenmodes can be studied. Further, a technology assessment (functional constraints and cost efficiency) of vehicle and wheelset designs is provided. In D5.2, the numerical simulations were based on a model (TRAFFIC software) where the vehicle was stationary (standing still) at a fixed position along the track. In this report, a revised version of TRAFFIC is applied which enables an investigation of a moving vehicle such that design parameters related to distances between wheelsets (axle and bogie passing frequencies) can also be investigated.
Considering the great influence of wheel OOR, and the identification of unsprung mass as the most important vehicle parameter, focus in RIVAS WP5 has been shifted to look closer at wheel OOR growth and the relation between vehicle parameters and wheel condition. A brief literature survey on causes for OOR growth is presented.
RIVAS
SCP0-GA-2010-265754
RIVAS_CHALMERS_ WP5_D5_4_FINAL Page 8 of 81 26/2/2013
4. LITERATURE SURVEY ON OOR GROWTH
Based on field and workshop measurements, it was shown in RIVAS D5.2 [4] that wheel OOR is the main vehicle parameter influencing emission of ground-borne vibration. The level of wheel OOR scattering from one vehicle type to another, and also among vehicles of the same type, explained the scatter in measured vibration levels.
Reduction of wheel OOR, and in particular avoiding or delaying the OOR growth, is important to reduce ground vibration. OOR level and growth are influenced by parameters that will be discussed here, such as train design (bogie design and presence of radial steering, type of braking system), wheel design and material (wheel type, manufacturing process and tolerances), block material (for tread brakes), maintenance policy (intervals, tolerances, reprofiling process), operating conditions (acceleration and deceleration of locomotives/engines). The main aim of this chapter is to provide an overview of the present knowledge on causes for OOR growth. This chapter is to a large extent a summary of a report by Müller [5].
Only few papers in the literature concern wheel OOR related to ground-borne vibration. Most papers are focused on air-borne noise effects, and hence a higher frequency range, or on maintenance for security purposes.
4.1 TREAD DEFECTS AND THEIR CAUSES
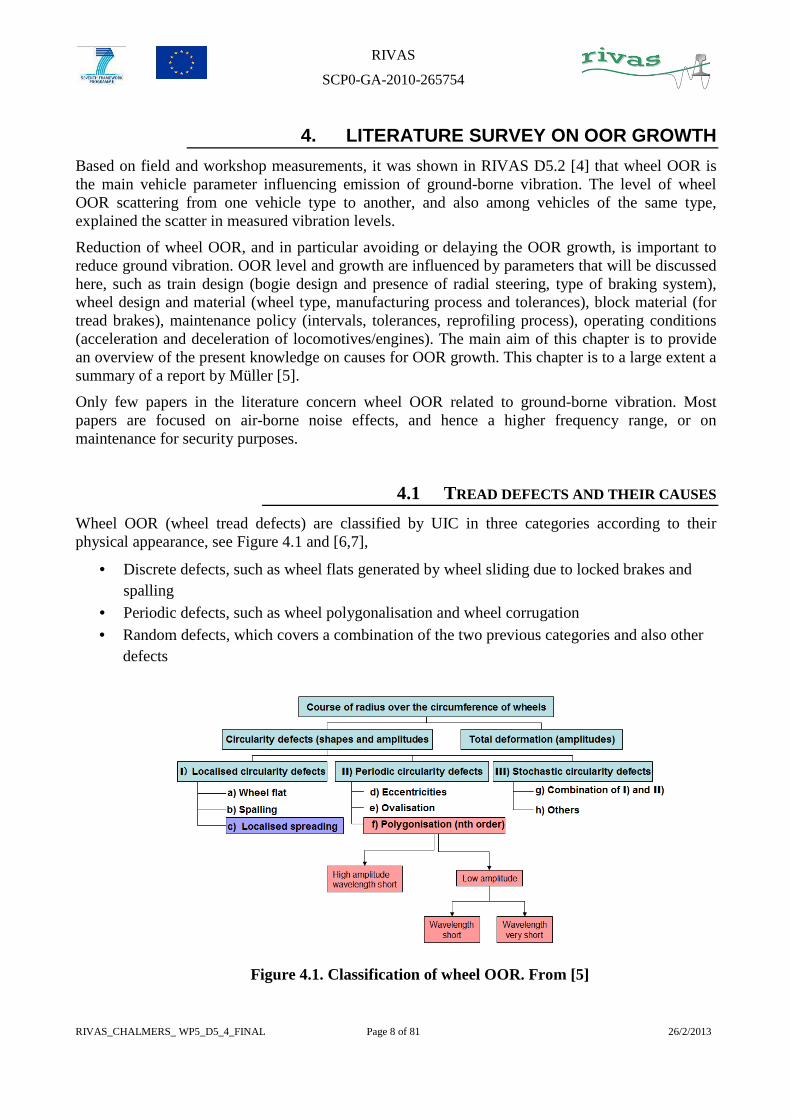
Wheel OOR (wheel tread defects) are classified by UIC in three categories according to their physical appearance, see Figure 4.1 and [6,7],
• Discrete defects, such as wheel flats generated by wheel sliding due to locked brakes and spalling
• Periodic defects, such as wheel polygonalisation and wheel corrugation • Random defects, which covers a combination of the two previous categories and also other
defects
Figure 4.1. Classification of wheel OOR. From [5]

RIVAS
SCP0-GA-2010-265754
RIVAS_CHALMERS_ WP5_D5_4_FINAL Page 9 of 81 26/2/2013
Three categories of direct causes can be identified. Each category is related to defects generated by different types of mechanical contact with the wheel tread.
• Defects due to contact between wheel and rail, leading mainly to rolling contact fatigue deterioration
• Defects due to contact between wheel and brake, mainly for trains with tread brake systems but also for trains with disk brakes
• Defects due to contact between wheel and machining tool at reprofiling (initial profile after manufacturing and profile after turning for maintenance)
These three categories generate different types of wheel defect.
Table 4.1 lists defects covered by two extensive literature reviews performed at Chalmers [8,9]. Proposed solutions are described in the table as well as ranges of wavelengths and frequencies which are concerned. It appears that tread brake systems are mainly responsible for the generation of short-wavelength wheel irregularities which excite relatively high frequencies (450 – 950 Hz at 100 km/h). Such frequencies are out of the range of interest for ground vibration and noise (8 - 250 Hz). The table is not exhaustive and some items need further investigations.
4.1.1 Localised tread defects
Localised tread defects are characterised by a discrete section of material degradation on the wheel tread. If such a tread defect is not corrected in time the defect may spread over the wheel circumference and give rise to other type of defects. Table 4.2 gives a summary of the major defects recorded by operators.
Thermal cracks are the most dangerous defects because they may results in wheel failure. While wheel flats have been studied thoroughly in terms of contact force generation and ground-borne vibration, see [4,10], it is important to note that wheel spalling and localised spreading have not been investigated in terms of ground-borne vibration.
Localised spreading is often due to the enlarging of an initial flat that was not maintained, hence giving rise to additional impact loads at other parts of the wheel tread, and sometimes inducing damage or failure of material in the non-suspended part of the running gear. Investigations have shown that localised spreading can also be explained by a hardness deviation around the wheel circumference, see Figure 4.2. In this case, the hardness deviation was due to inappropriate tempering of the wheel.
Figure 4.2. Correlation of wheel spreading with hardness reduction. Measurement on
locomotive Re460 wheel in the 1990’s. From [5]

RIVAS
SCP0-GA-2010-265754
RIVAS_CHALMERS_ WP5_D5_4_FINAL Page 10 of 81 26/2/2013
Table 4.1. Summary of classification of wheel tread defects
Physical description Occurrence (when does it occur?)
Causes Wavelength range
Frequency range
(@100km/h)
Amplitude Possible solutions Importance for GBV
Eccentricity All type of wheels Misalignment of profiling fixation Wheel circumference
~10 Hz Better precision on profiling process
Discrete defects : Wheel flats
Unintentional sliding
Deficient braking system (e.g. frozen)
Excessive braking force compared to wheel/rail friction
Altering wheel / rail friction (reduce wheel slip)
High
Initial wheel profile All types of wheel Manufacturing Improved wheel material and precision of manufacturing
High
Periodic OOR:
polyganisation
Disc-braked - 3 point claw clamping during profiling
- inhomogeneous material
- wheelset modes
[14cm-wheel perimeter]
[~10 – 200 Hz] Up to 1 mm - More precise profiling method
- Change clamping method
- Improved wheel material
High
Non-periodic OOR Disc-braked and block braked
Unbalanced wheelset
Inhomogeneous material
[4 cm –wheel perimeter]
[~10 – 700 Hz] 1 mm? Improved wheel material High
Corrugation Block braked Tread/brake contact [3-6 cm] [450 – 950 Hz] < 10 µm - Change brake material (sinter, composite)
- Change brake design (slotted)
- Improve wheel material
Low
Rolling contact fatigue High contact force Wheel/rail contact Reduce track stiffness, use rubber-sprung wheel, improved
wheel material

RIVAS
SCP0-GA-2010-265754
RIVAS_CHALMERS_ WP5_D5_4_FINAL Page 11 of 81 26/2/2013
Table 4.2. Summary of local (discrete) tread defects. From [5]
TREAD DEFECT Visual aspect Occurrences Consequences
Thermal crack
Usual with block brake systems
Failure of wheel if not corrected
Wheel flat
Excessive braking force compared to wheel/rail friction
High impact load
Spalling
Combination of the following
conditions: poor track / excessive speed / excessive braking / wheels with insufficient
hardness
No investigations in terms of ground borne vibration
Scaled wheels
Brake block, rail debris welded to
wheel tread due to heavy hauling. Mechanism not fully understood
High impact load
Localised spreading
Wheel flat not removed from
service / inhomogeneous
material hardness
Failure of non suspended
running gears / high impact
loads

RIVAS
SCP0-GA-2010-265754
RIVAS_CHALMERS_ WP5_D5_4_FINAL Page 12 of 81 26/2/2013
In the SBB field tests previously analysed in RIVAS [4], several wheels on locomotive types Re420 and Re620 were subjected to spalling and localised spreading. These locomotives were pointed out as high vibration vehicles in these tests, which suggested a correlation of these types of tread defect with ground vibration. The cast iron block brake design of these locomotives is probably the reason for these defects, which are characteristics of thermal damage. Figure 4.3 and Figure 4.4 present examples of measured localised spreading and spalling on one locomotive of type Re420.
Note that it is difficult to detect the localised spreading by photos and visual inspection because the extent of the defect is relatively large (an angle of 45° corresponding to about 15 cm around the wheel circumference). This type of defect is easier to detect by an out-of-roundness measurement, see Figure 4.3.
Figure 4.3. Example of localised spreading observed on Re420 locomotive in SBB field test
Figure 4.4. Example of spalling observed on Re420 locomotive in SBB field test
Rad
ius
devi
atio
n (m
icro
ns) Wheel circumference (angle in degree)
45° ~ 49 cm
0.6mm
RIVAS
SCP0-GA-2010-265754
RIVAS_CHALMERS_ WP5_D5_4_FINAL Page 13 of 81 26/2/2013
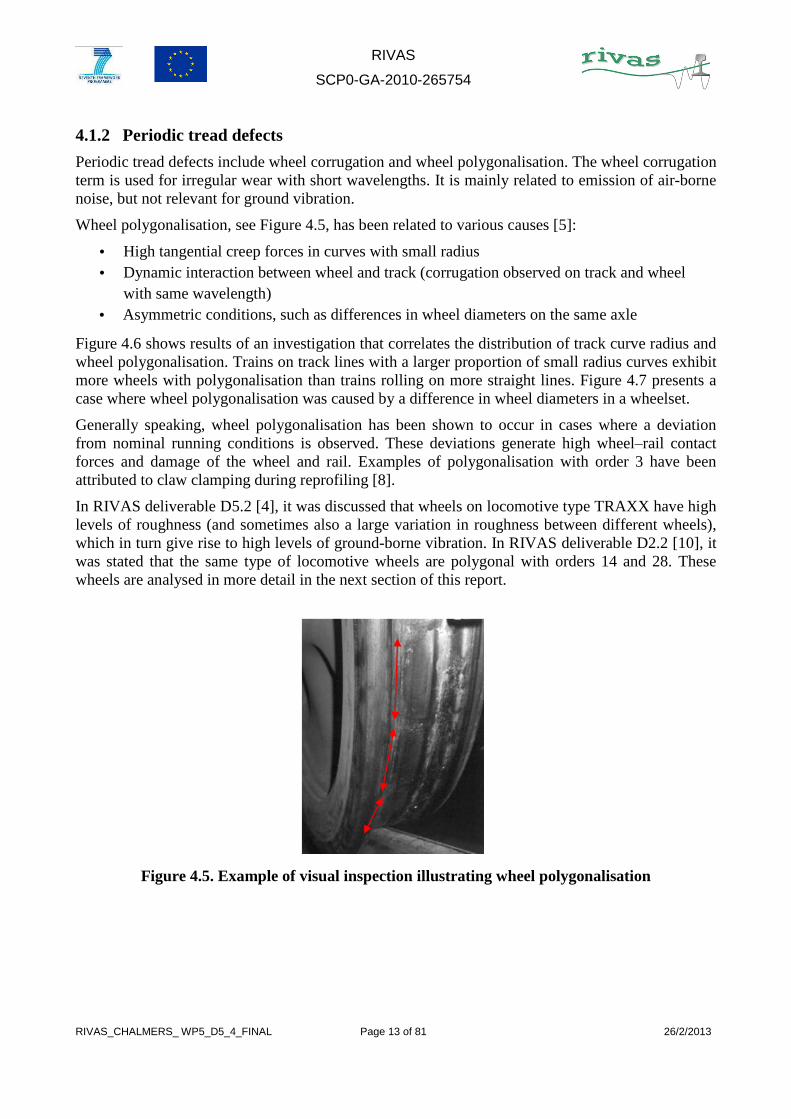
4.1.2 Periodic tread defects
Periodic tread defects include wheel corrugation and wheel polygonalisation. The wheel corrugation term is used for irregular wear with short wavelengths. It is mainly related to emission of air-borne noise, but not relevant for ground vibration.
Wheel polygonalisation, see Figure 4.5, has been related to various causes [5]:
• High tangential creep forces in curves with small radius • Dynamic interaction between wheel and track (corrugation observed on track and wheel
with same wavelength)
• Asymmetric conditions, such as differences in wheel diameters on the same axle
Figure 4.6 shows results of an investigation that correlates the distribution of track curve radius and wheel polygonalisation. Trains on track lines with a larger proportion of small radius curves exhibit more wheels with polygonalisation than trains rolling on more straight lines. Figure 4.7 presents a case where wheel polygonalisation was caused by a difference in wheel diameters in a wheelset.
Generally speaking, wheel polygonalisation has been shown to occur in cases where a deviation from nominal running conditions is observed. These deviations generate high wheel‒rail contact forces and damage of the wheel and rail. Examples of polygonalisation with order 3 have been attributed to claw clamping during reprofiling [8].
In RIVAS deliverable D5.2 [4], it was discussed that wheels on locomotive type TRAXX have high levels of roughness (and sometimes also a large variation in roughness between different wheels), which in turn give rise to high levels of ground-borne vibration. In RIVAS deliverable D2.2 [10], it was stated that the same type of locomotive wheels are polygonal with orders 14 and 28. These wheels are analysed in more detail in the next section of this report.
Figure 4.5. Example of visual inspection illustrating wheel polygonalisation

RIVAS
SCP0-GA-2010-265754
RIVAS_CHALMERS_ WP5_D5_4_FINAL Page 14 of 81 26/2/2013
Figure 4.6. Correlation between wheel polygonalisation and distribution of curve radius
Distribution of curve radius in track sections
Polygons observed on train
Tracks with almost no small radii
Tracks with curves with small radii
Tracks with curves with very small radii

RIVAS
SCP0-GA-2010-265754
RIVAS_CHALMERS_ WP5_D5_4_FINAL Page 15 of 81 26/2/2013
Figure 4.7. Wheel polygonalisation due to difference in wheel diameters in a wheelset, green line: left wheel, red line: right wheel

RIVAS
SCP0-GA-2010-265754
RIVAS_CHALMERS_ WP5_D5_4_FINAL Page 16 of 81 26/2/2013
4.1.3 Measurement of wheel tread defects
The wheel OOR should be measured along several lines around the wheel circumference as the defect may vary in the transverse direction on the wheel tread. Figure 4.8 illustrates a case with a variation of wheel OOR as a function of the transverse position on the tread.
Based on this observation, it is recommended to perform wheel OOR measurements according to the following:
• If no tread defects are visible on the wheel, three measurements should be performed: one at the nominal rolling radius and (at least) at two other lines separated by 10 mm from the centre line (see the example in Figure 4.9). If consistent values are obtained on several lines, averaging can be performed
• If tread defects are visible, then depending on the size of the tread, several measurement lines should be performed
Figure 4.8. Wheel OOR measured at several transverse positions on the wheel tread

RIVAS
SCP0-GA-2010-265754
RIVAS_CHALMERS_ WP5_D5_4_FINAL Page 17 of 81 26/2/2013
Figure 4.9. Recommendation for measurement of OOR. From [11]
4.2 M ITIGATION MEASURES FOR REDUCTION OF
WHEEL OOR
RIVAS deliverable D5.2 [4] was focused on the relationship between ground vibration and vehicle design. Here the focus is on vehicle design and wheel tread defects.
4.2.1 Wheel material
The main mitigation measure is the use of a wheel material with high wear resistance. Improving the material quality is the most efficient procedure to reduce roughness growth. The frequently used wheel material R7 [12] is a steel grade with predominantly pearlitic structure containing hard cementite lamellae, which guarantees a high resistance to wear [5]. The classification of steel grades according to EN 13262 is presented in Figure 4.10 (UTS = ultimate tensile strength).
Figure 4.10. Classification of wheel material. From EN 13262 [12]

RIVAS
SCP0-GA-2010-265754
RIVAS_CHALMERS_ WP5_D5_4_FINAL Page 18 of 81 26/2/2013
Materials with a higher resistance to wear are already used in service, for example on the Shinkansen trains in Japan [5]. This material has been compared to R7, both in laboratory and in service, and has been demonstrated to be more resistant. For an equivalent wheel roughness degradation, the Shinkansen material performed 31 500 km, while the standard R7 performed 10 000 km, see Figure 4.11. In service, the Shinkansen material required much less reprofiling than the R7 steel for the same period. Other grades of steel that were more resistant than R7 in laboratory are also discussed in [5] but these materials could not be tested in service due to difficulties in manufacturing.
The material quality is defined by the grain size (lowest possible for highest quality) and the content of inclusions (lowest percentage for highest quality). The inclusions are non-metallic inclusions arising from the manufacturing process. The manufacturing process determines the steel grade (pearlite, martensite, ...) and its quality.
A second mitigation measure concerns the design of the braking system. Tread brakes directly affect the wheel tread and may lead to the generation of wheel corrugation. It is not clear if this is relevant for ground vibration in terms of frequency range. For ground-borne noise, there is an indication from SBB measurements of an increasing vibration reduction above around 100 Hz when using noise-improved braking systems. However, malfunctioning of both disc brakes and tread brakes can lead to wheel sliding and hence wheel flats and spalling. Better control of the braking period and braking force can reduce the wheel roughness growth.
Another mitigation measure envisaged from the literature is to improve the process of machining for wheel profiling. For example, it has been concluded that clamping the wheel by a three-jaw chuck during reprofiling could lead to the generation of an initial periodic OOR with order 3 [9]. Also, minimising the initial wheel roughness by better precision of the machining tools will delay the roughness growth.
Figure 4.11. Comparison of material quality in terms of tread defects [13]. left: laboratory (test rig) running distance for a given roughness degradation, right: in service running
distance between reprofilings
RIVAS
SCP0-GA-2010-265754
RIVAS_CHALMERS_ WP5_D5_4_FINAL Page 19 of 81 26/2/2013
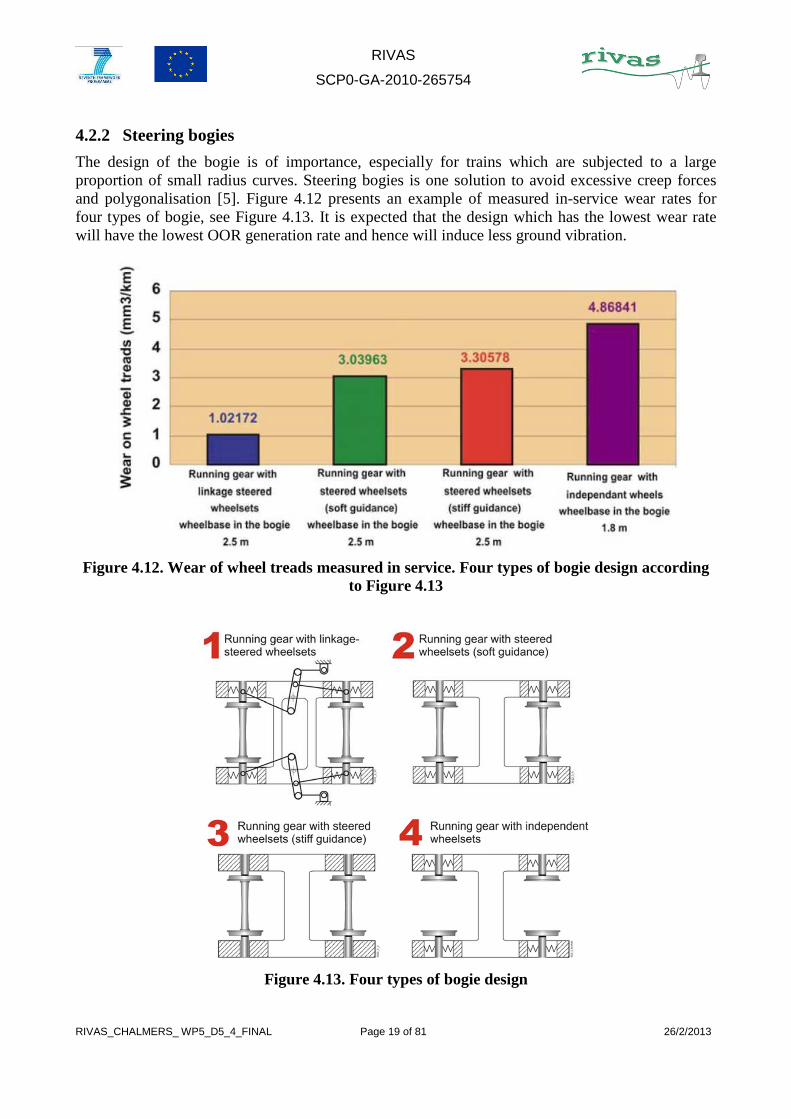
4.2.2 Steering bogies
The design of the bogie is of importance, especially for trains which are subjected to a large proportion of small radius curves. Steering bogies is one solution to avoid excessive creep forces and polygonalisation [5]. Figure 4.12 presents an example of measured in-service wear rates for four types of bogie, see Figure 4.13. It is expected that the design which has the lowest wear rate will have the lowest OOR generation rate and hence will induce less ground vibration.
Figure 4.12. Wear of wheel treads measured in service. Four types of bogie design according to Figure 4.13
Figure 4.13. Four types of bogie design

RIVAS
SCP0-GA-2010-265754
RIVAS_CHALMERS_ WP5_D5_4_FINAL Page 20 of 81 26/2/2013
Figure 4.14 illustrates the bogie design for different types of rolling stock. According to Figure 4.12, Intercity trains (bottom row of the table) should be subjected to less wheel wear and hence induce less ground vibration, while locomotives and Y25 bogies should give rise to higher levels of vibration. This is in agreement with observations made in RIVAS D5.2 [4]. However, this conclusion is partial because the wheel wear is also significantly dependent on track characteristics, such as curve radius distribution, stiffness, etc.
Figure 4.14. Examples of bogie design and applications
4.2.3 Unsprung mass
Significant levels of ground vibration are generated by locomotives of the types Re420/620 and TRAXX, see Section 5. Several wheels on these locomotives have large levels of OOR although there seems to be a large spread between different wheels. The unsprung mass of TRAXX and Re420 is 4500 kg and 3200 kg, respectively. In contrast, the Re460 locomotives do not generate severe ground vibrations related to wheel OOR (at least outside the range of the sleeper passing frequency). The Re460 reaches long reprofiling intervals due to the low OOR growth, has a fully-suspended drive and a significantly lower unsprung mass of 1900 kg.
Increasing the unsprung mass will increase the vertical wheel-rail contact forces and have a significant influence on the so-called P2 resonance. Possibly there is an interaction between a magnification of the dynamics at the P2 resonance and the generation of wheel out-of-roundness.

RIVAS
SCP0-GA-2010-265754
RIVAS_CHALMERS_ WP5_D5_4_FINAL Page 21 of 81 26/2/2013
5. MEASUREMENTS - ANALYSIS OF SBB DATA
The experimental analysis in RIVAS D5.2 [4] was based on measurements of ground vibration excited by a large number of different vehicles on three different sites on the Swiss railway network. The data was analysed statistically to capture the performance of different vehicle types in order to relate the results to different vehicle designs. Unsprung mass and wheel roughness (or other wheel defects) were identified to be the most influencing parameters on ground vibration. These effects were observed for several measurement sites, soil models and vehicle types. It was concluded that the wide scatter in wheel roughness level among measured vehicles masked much of the influence of other parameters. The direct quantification of wheel roughness for measured trains needs therefore be included in future test activities.
5.1 REVIEW OF MEASURED OOR BY SBB
In RIVAS D5.2, train categories with high levels of ground vibration and with high scatter within the same category were identified. It was shown that the roughness mean level and scatter was closely linked to the statistics of ground vibration, at least for the Re420 and Re620 locomotives. The TRAXX locomotives also induced high ground vibration and scatter, see Figure 5.1. The three types of locomotive are analysed here in some further detail. The main differences between the locomotives are highlighted in Table 5.1.
Figure 5.1. Statistics of ground vibration measurements for different vehicle types at test site Thun
V r
ms
fast
[mm
/s]
0.1
0.2
0.3
0.4
0.5
0.6
0.7
Re
46
0
TR
AX
X/
Re
47
4
Re
42
0
Re
62
0
NIN
A
IC 2
00
0
EW
IV
EW
II
RIC
Bp
m (
EC
)
Fre
igh
t wag
on
(1
.8 m
axl
e d
ist)
Fre
igh
t wag
on
(2 m
axl
e d
ist)
Fre
igh
t wag
on
(2 a
xles
)
Ro
La

RIVAS
SCP0-GA-2010-265754
RIVAS_CHALMERS_ WP5_D5_4_FINAL Page 22 of 81 26/2/2013
Table 5.1. Differences in design of locomotives Re420, Re620 and TRAXX
Wagon description
Type of braking system
Wagon weight (tonnes)
Unsprung mass (kg)
Damping type (primary suspension)
Primary suspension stiffness (N/m)
Spoked wheel
TRAXX Disc braked
85 4500 Steel spring 3,92E+06 No
Re 620 CI-block braked
120 3480 Friction 2,46E+06 Yes
Re 420 CI-block braked
84 3200 Friction 2,48E+06 Yes
5.1.1 Re620 and Re420
The two types of locomotive Re420 (4 wheelsets) and Re620 (6 wheelsets) are similar and both locomotives have spoked wheels with 12 spokes. For both types, the OOR was measured and it was shown in RIVAS D5.2 that the spectrum from one wheel to another can vary significantly.
Figure 5.2 presents the roughness level spectrum for the same locomotive measured with an interval of almost one year. Each curve in the figure corresponds to one wheel. The shapes are very different. In September 2010, all wheels had a similar OOR but in August 2011 significant differences were observed from one wheel to another.
The measurements in September 2010 illustrate two main peaks. The explanation for the peak at 63 cm is currently unknown. The second peak is spread on three one third octave bands, 16 -10 cm, which for a range of speeds 50 - 100 km/h corresponds to the frequency range 80 - 200 Hz. This might be correlated with the resonance of the vehicle unsprung mass on the track stiffness.
The measurements performed in August 2011 do not show any particular trends. One of the wheels stands out from the others for wavelengths below 13 cm. Some of the wheels have peaks at 63 cm and 32 cm. The 32 cm peak corresponds to the distance between two spokes of the wheel, see Figure 5.3.

RIVAS
SCP0-GA-2010-265754
RIVAS_CHALMERS_ WP5_D5_4_FINAL Page 23 of 81 26/2/2013
(a)
(b)
Figure 5.2. Measured roughness level for locomotive no 11620: (a) September 2010, (b) August 2011

RIVAS
SCP0-GA-2010-265754
RIVAS_CHALMERS_ WP5_D5_4_FINAL Page 24 of 81 26/2/2013
Figure 5.3. Spoked wheel on a Re620 locomotive
Figure 5.4 shows photos of the wheel tread, which present spalling, indicating either thermal causes due to cast-iron block brake design or rolling contact fatigue due to excessive pressure with regard to steel grade.
Figure 5.4. Loss of material on wheels of locomotive no 11146, July 2011
~30 cm

RIVAS
SCP0-GA-2010-265754
RIVAS_CHALMERS_ WP5_D5_4_FINAL Page 25 of 81 26/2/2013
5.1.2 TRAXX
Fewer OOR measurements are available for the TRAXX locomotive compared to for Re420/620. However, the few measurements show good consistence and trends can be described.
The wheel OOR level illustrated in Figure 5.5(a) shows peaks at 63 cm, 32 cm – 20 cm and 16 cm (only for axle 4). As for Re420/620, the peak at 63 cm is unknown. The peak at 32 cm is less explainable (polygonalisation, see Figure 5.5(b)) as the wheels on TRAXX do not have spokes.
Figure 5.5(a). Wheel OOR level for TRAXX locomotive no 484010
Figure 5.5(b). Wheel OOR (micrometer, 360°) for TRAXX locomotive no 484010

RIVAS
SCP0-GA-2010-265754
RIVAS_CHALMERS_ WP5_D5_4_FINAL Page 26 of 81 26/2/2013
Figure 5.6 presents an atypical wheel roughness. The left wheel of axle 1 has a peak between 40 and 50 cm, which is not seen on the other wheels. Also, the right wheels of axles 1 and 2 have higher levels than the other wheels below wavelength 6 cm.
Figure 5.6. Wheel OOR level for TRAXX locomotive no 484016
5.1.3 Discussion on possible causes of OOR for TRAXX compared to Re420/620
The analysis showed that the shapes of OOR are different for these two types. TRAXX presents more regular patterns (with periodic tread defects) than Re420 and Re620. The causes of defects seem to be different. The periodic defects on TRAXX suggest that the train design is a possible cause, see Sections 4.2.2 and 7.3.3.
Further investigations with long term measurements are required in order to correlate with more precision the causes and the OOR observed for these two types.

RIVAS
SCP0-GA-2010-265754
RIVAS_CHALMERS_ WP5_D5_4_FINAL Page 27 of 81 26/2/2013
5.2 FUTURE MEASUREMENTS
Three vehicle design parameters that may influence the generation of wheel OOR are discussed in Section 4.2. In 2013, tests with a small selection of freight locomotives (Re420/TRAXX) and freight wagons (with different parameters) will be carried out to study the influence of the three parameters on OOR generation and growth. For the selected vehicles (wheels), the tests will include OOR measurements in workshops using an instrument for direct measurement of deviation from nominal wheel radius around the wheel circumference. In addition, frequent measurements of dynamic wheel-rail contact force and ground vibration induced by the selected wheels at existing test sites on the Swiss network (see Section 5) will provide indication on the development of OOR. These additional measurements will lead to a better understanding of the influence of the three vehicle design differences such that design recommendations can be given. Further, it is suggested that Lucchini studies the influence of wheel material on OOR generation.

RIVAS
SCP0-GA-2010-265754
RIVAS_CHALMERS_ WP5_D5_4_FINAL Page 28 of 81 26/2/2013
6. SIMULATIONS
The simulation tool for numerical prediction of free field ground vibration used in RIVAS WP5 is the MATLAB toolbox TRAFFIC developed at Katholieke Universiteit Leuven (KUL) in Belgium [14-16]. The model accounts for dynamic interaction between train, track and layered soil. The track model is assumed to be invariant in the direction of the rail (y), which allows for an efficient solution in the frequency-wavenumber domain (a double forward Fourier transform from the space-time domain (y,t) to the wavenumber-frequency domain (ky,ω) can be applied). Continuous (linearised Hertzian) wheel–rail contact is assumed leading to a compatibility equation where prescribed vertical wheel/track geometry irregularities are considered.
In previous simulations, see [4], the motion of the vehicle along the track was neglected. This meant that important excitation mechanisms such as the axle passing frequency and the bogie passing frequency were ignored. However, based on revised input files accounting for recent features in TRAFFIC, these two excitation mechanisms are considered in the current work. Note that since the track model is invariant in the direction of the rail, the sleeper passing frequency is not accounted for.
In the analysis of dynamic response from a moving train in TRAFFIC it is necessary to represent the unevenness (track irregularity) by a spatial profile generated from the PSD spectrum of the unevenness. A number of sample profiles (having the same PSD) were tested as was suggested by Lombaert et al [15]. It was confirmed in the present study that the spatial profile, indeed, has a large influence on the results and a statistical approach was applied where the results from five samples were averaged. This fact together with the considerably longer computation times in TRAFFIC for the dynamic analysis of a moving train compared to the dynamic analysis of a stationary train turned out to be a bit of a practical obstacle for this parameter study.
The vehicle is modelled as a multi-degree of freedom system, where the axles (wheelsets), bogies and car body are considered as rigid parts and the primary and secondary suspensions are represented by spring and damper elements. One example of vehicle model where the suspensions are described by 2-parameter viscous damping models is illustrated in Figure 6.1. This type of suspension model is used for the passenger vehicle model. Different models for the primary suspension of the Y25 bogie were studied in [4]. In the present work, the primary suspension of the freight vehicle is modelled by a frequency-independent 2-parameter hysteretic damping model.
mc
mb
mw mw
c1k1
c2k2
k1 c1
mb
mw mw
c1k1
c2k2
k1 c1
lwlb
Figure 6.1. Vehicle model where wheelsets, bogie frames and car body are modelled as rigid masses. In this example, the primary and secondary suspensions are described by 2-
parameter viscous damping models

RIVAS
SCP0-GA-2010-265754
RIVAS_CHALMERS_ WP5_D5_4_FINAL Page 29 of 81 26/2/2013
The track is assumed to be located on the surface of a horizontally layered half-space. No embankment is considered. The model for a ballasted track in TRAFFIC is shown in Figure 6.2. The rails are modelled as continuously supported Euler-Bernoulli beams. The rail pads are described by spring-damper connections (2-parameter viscous damping models) and the sleepers are assumed to be rigid. The ballast bed is assumed to act as a set of distributed non-interacting springs and dampers. The distance d in Figure 6.2 is used to calculate a continuously distributed sleeper mass which means that no parametric excitation from the discrete sleeper supports is accounted for. Each layer in the half-space soil model is characterised by its thickness, dynamic soil characteristics E and ν (or the longitudinal and transversal wave velocities Cp and Cs), material density ρ and material damping ratios βp and βs in volumetric and deviatoric deformation, respectively. The soil stiffness is calculated by assuming a strip foundation model on a layered half-space (‘foundation_strip’ in TRAFFIC). Here, layered soil data corresponding to the three RIVAS reference sites Lincent, Horstwalde and Furet are considered [17]. The input data for the track model and three different soil models are listed in Tables 6.1 and 6.2.
The dynamic vertical ground vibration response in the free field as induced by a moving train with four wagons/coaches is calculated. The influence of the quasistatic excitation is neglected. A prescribed relative displacement excitation of the wheel‒rail contacts caused by a vertical track geometry irregularity is considered. In this study, it is assumed that the levels of wheel irregularity are negligible compared to the track irregularity. Based on the track quality class ORE B176 high [18,19], see Figure 6.3, five different samples of irregularity profile along the track have been generated. Depending on the randomly selected phase information used to generate each track irregularity sample, the calculated free field vibration at a given position adjacent to the track will vary from sample to sample. To consider this and to obtain some statistical information on the free field response, the simulation of free field vibration is repeated five times for each combination of vehicle, track and soil data using the five samples of track irregularity as input.
Figure 6.2. Model of track on ballast in TRAFFIC [16]

RIVAS
SCP0-GA-2010-265754
RIVAS_CHALMERS_ WP5_D5_4_FINAL Page 30 of 81 26/2/2013
Table 6.1. Input data for track superstructure model [17]
Rail (60E1) Bending stiffness per rail 6.4 · 106 Nm2
Mass per unit length per rail 60 kg/m
Position of left rail -0.7175 m
Position of right rail 0.7175 m
Rail pad Stiffness 500 · 106 (N/m)/m
Viscous damping 25 · 103 (Ns/m)/m
Sleeper Sleeper distance 0.60 m
Mass 541.7 kg/m
Mass moment of inertia 306.9 kgm
Length 2.6 m
Ballast Mass 520 kg/m
Stiffness 1.39 · 109 (N/m)/m
Viscous damping 4.41 · 105 (Ns/m)/m
Table 6.2. Ground model input data for the three reference sites Lincent, Furet and Horstwalde [17]. HS denotes an infinite half-space supporting the upper layers of the ground
model
Model (site)
Layer
Shear wave
velocity [m/s]
Dilatation wave
velocity [m/s]
Shear damping ratio [-]
Dilatation damping ratio [-]
Density [kg/m3]
Thickness, h
[m]
Linc
ent 1 128 286 0.044 0.044 1800 1.4
2 176 286 0.038 0.038 1800 2.7
HS 355 1667 0.037 0.037 1800 Infinite
Fur
et 1 154 375 0.025 0.025 1800 2
2 119 290 0.025 0.025 1850 10 HS 200 490 0.025 0.025 1710 Infinite
Hor
st-
wal
de
HS 250 1470 0.025 0.025 1945 Infinite

RIVAS
SCP0-GA-2010-265754
RIVAS_CHALMERS_ WP5_D5_4_FINAL Page 31 of 81 26/2/2013
Figure 6.3. Track quality classes defined as single-sided PSD spectra of longitudinal level
10-1
100
101
102
10-14
10-12
10-10
10-8
10-6
10-4
Wavenumber [rad/m]
Sin
gle-
side
d P
SD
tra
ck ir
regu
larit
y [m
2 /(ra
d/m
)]
ORE B176 low
ORE B176 highSNCF class 1
SNCF class 2
6.28 m
0.628 m
10-1
100
101
102
10-14
10-12
10-10
10-8
10-6
10-4
Wavenumber [rad/m]
Sin
gle-
side
d P
SD
tra
ck ir
regu
larit
y [m
2 /(ra
d/m
)]
ORE B176 low
ORE B176 highSNCF class 1
SNCF class 2
6.28 m
0.628 m

RIVAS
SCP0-GA-2010-265754
RIVAS_CHALMERS_ WP5_D5_4_FINAL Page 32 of 81 26/2/2013
6.1 FLEXIBLE WHEELSET MODEL
According to RIVAS D5.2 [4], the unsprung wheelset mass is a significant vehicle parameter in terms of generation of ground vibration. For a freight wagon wheelset, the unsprung mass is mainly the summed mass of axle, two wheels and two axle boxes. Parts of the primary suspension may also be added to the unsprung mass. For a locomotive wheelset or a driven (powered) wheelset of a passenger coach, the unsprung mass also includes the mass of brake discs and axle-hung components of the mechanical drive system. In the vehicle model applied in the simulations reported in D5.2, each wheelset was represented by a rigid mass. This means the distribution of mass within the wheelset and the influence of axle bending were neglected. For the present investigation, a refined flexible wheelset model has been implemented in the simulations of ground vibration generated by freight wagons. The refined model will make it possible to account for the lowest wheelset bending mode which typically has an eigenfrequency in the frequency range of interest for ground vibration.
Wheelset models including structural flexibility have been reviewed by Chaar [20]. Various models have been suggested from those based on a continuum description (using a differential equation to describe the axle bending) to discretised ones (lumped or FEM models). It was concluded that up to the frequency corresponding to the first wheelset eigenmode in bending, the wheels (and brake discs) can be modelled as rigid. In [21], axle bending was accounted for using a beam model whereas the wheels and brake discs were modelled as rigid elements. Hempelmann et al [22] used a beam model to account for bending and shear of the axle while the wheels were modelled by so-called shear plate discs.
Lilja [23] developed a 3D FEM model of a SJ57H freight vehicle wheelset where the axle was described by Timoshenko beam elements and the wheels were represented by quadratic tetrahedron elements. Eigenfrequencies of the wheelset were determined based on frequency response functions measured for a wheelset in a laboratory. The FEM model was updated by minimising the error between some of the measured and calculated pairs of eigenfrequencies. The properties that were changed in the updated model were the Young’s modulus of wheel and axle and the mass of the bearings (axle boxes). Good agreement was obtained between the measured and calculated eigenfrequencies of several eigenmodes, including the first symmetric and first antisymmetric bending modes at 84 Hz and 152 Hz, respectively. The wheelset was resiliently supported at the axle boxes.
In this study, a flexible beam model representing a SJ57H wheelset (wheel diameter 920 mm) is implemented. It is assumed that the wheelset design and the dynamic interaction between wheels and rails are symmetric with respect to the centre of the wheelset. Thus, the model contains half of the solid axle, one wheel, one axle box and symmetry boundary conditions at the centre of the axle. The (half) axle model contains 44 Euler-Bernoulli beam elements to describe the axle bending and it accounts for the variation in diameter along the axle with the smallest diameter being at the end of the axle and the largest diameter at the wheel seat. All beam elements have the same length, and a consistent mass matrix of the axle is employed. The masses of the wheel and axle box are distributed on the axle by applying lumped masses on the axle nodes along the sections of the axle where the wheel and axle box are mounted. The rotational inertia of the wheel with respect to axle bending is accounted for by adding the rotational inertia of a rigid (solid) cylinder in the mass matrix. The solid cylinder has radius equal to the wheel radius multiplied by a factor 1.10 to account for the wheel flange, and width equal to the width of the wheel at the tyre. The masses of one wheel and one complete axle are 380 kg and 378 kg, respectively. The mass of one axle box is here taken as 40 kg, see [23]. Thus, the total mass of the nominal SJ57H wheelset design (with axle

RIVAS
SCP0-GA-2010-265754
RIVAS_CHALMERS_ WP5_D5_4_FINAL Page 33 of 81 26/2/2013
boxes) is here 1220 kg. The length of the complete wheel axle is 2.2 m. The number of degrees-of-freedom (dofs) of the flexible wheelset model is 89.
To speed up the simulation time, a reduced model based on the Craig-Bampton method is generated [25]. Two interface dofs are selected as (1) the vertical translation of the wheel at the wheel–rail contact point (at the position of the nominal rolling radius, 70 mm from the inside of the wheel flange) and (2) the vertical translation of the axle where the primary suspension is attached (1.0 m from the centre of the axle). In addition, two generalised dofs representing the lowest two fixed interface (symmetric) eigenmodes of the wheelset are accounted for. The size of the stiffness and mass matrices of the reduced wheelset model is 4×4.
To validate the implemented wheelset model (based on beam elements), a finite element model of the (half) wheelset including wheel and axle was derived by use of 8-node linear brick finite elements. Also this model was reduced by using Craig-Bampton modes. The mass of the axle box is accounted for by a lumped mass at the dof where the primary suspension is connected. The point receptance at the nominal wheel–rail contact position of the wheelset suspended on the primary suspension (with hysteretic damping) has been calculated. The receptances of the two flexible wheelset models are compared with the receptance of a rigid wheelset model in Figure 6.4. The peak at 15 Hz is the eigenfrequency of the wheelset vibrating on the primary suspension. The receptances of the flexible models display an eigenfrequency at 82.2 Hz (detailed FEM model) and 87.4 Hz (simple FEM model), respectively. This is the eigenfrequency of the first symmetric eigenmode in bending. It is concluded that the calculated eigenfrequencies are in good agreement with the corresponding eigenfrequency 84 Hz measured by Lilja [23], and that the simple FEM model is an acceptable representation of a freight wagon wheelset in the frequency range of interest for ground vibration.
Figure 6.4. Calculated point receptance at nominal wheel–rail contact position for wheelset with axle boxes. Rigid wheelset model and flexible wheelset models based on beam elements or
brick elements are compared. Wheelset model suspended on primary suspension with stiffness 5.5 kN/mm and hysteretic damping factor 0.5
100
101
102
10-10
10-9
10-8
10-7
10-6
Frequency [Hz]
Rec
epta
nce
mag
nitu
de [
m/N
]
Rigid model
Craig-Bampton: simple FEM modelCraig-Bampton: detailed FEM model

RIVAS
SCP0-GA-2010-265754
RIVAS_CHALMERS_ WP5_D5_4_FINAL Page 34 of 81 26/2/2013
(a)
(b)
Figure 6.5. Influence of (a) wheel mass and (b) axle diameter multiplication factor on point receptance at nominal wheel–rail contact position. Wheelset model suspended on primary
suspension with stiffness 5.5 kN/mm and hysteretic damping factor 0.5
100
101
102
10-10
10-9
10-8
10-7
10-6
Frequency [Hz]
Rec
epta
nce
mag
nitu
de [
m/N
]
Wheel 380 kg, Wheelset 1220 kg
Wheel 330 kg, Wheelset 1120 kgWheel 430 kg, Wheelset 1320 kg
100
101
102
10-10
10-9
10-8
10-7
10-6
Frequency [Hz]
Rec
epta
nce
mag
nitu
de [
m/N
]
Axle factor 1.00, Wheelset 1200 kg
Axle factor 0.85, Wheelset 1114 kgAxle factor 1.15, Wheelset 1342 kg
RIVAS
SCP0-GA-2010-265754
RIVAS_CHALMERS_ WP5_D5_4_FINAL Page 35 of 81 26/2/2013
(a)
(b)
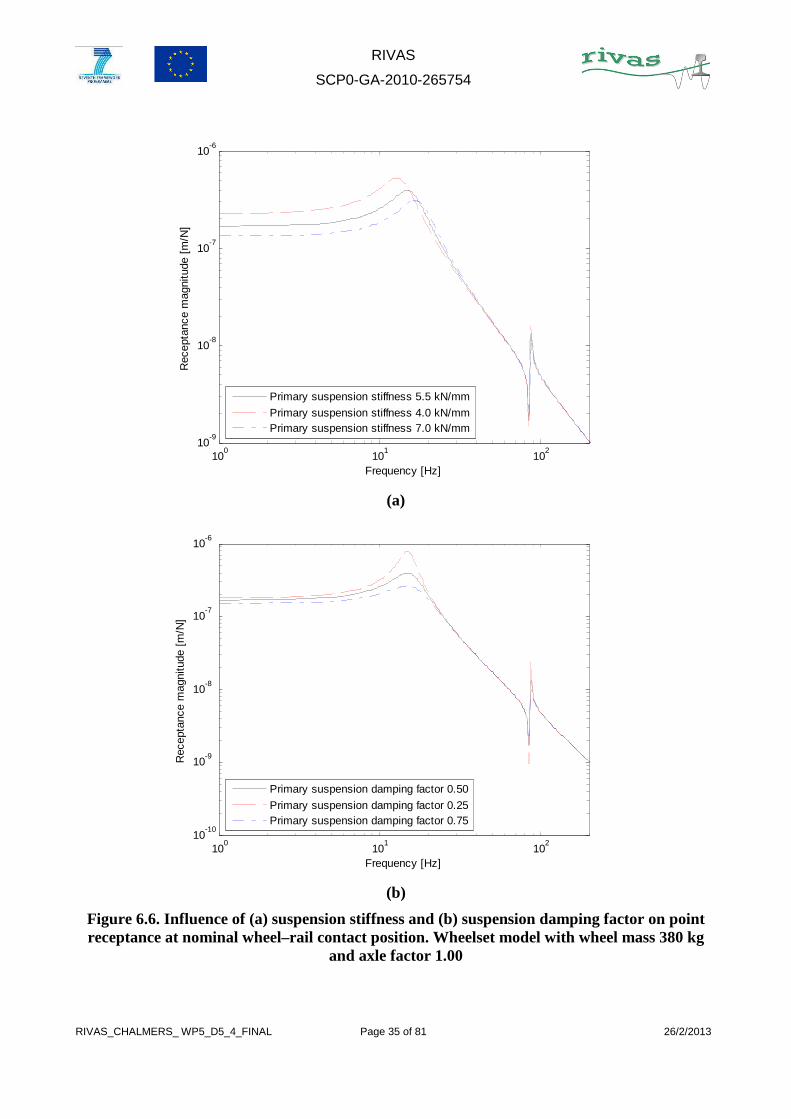
Figure 6.6. Influence of (a) suspension stiffness and (b) suspension damping factor on point receptance at nominal wheel–rail contact position. Wheelset model with wheel mass 380 kg
and axle factor 1.00
100
101
102
10-9
10-8
10-7
10-6
Frequency [Hz]
Rec
epta
nce
mag
nitu
de [
m/N
]
Primary suspension stiffness 5.5 kN/mm
Primary suspension stiffness 4.0 kN/mmPrimary suspension stiffness 7.0 kN/mm
100
101
102
10-10
10-9
10-8
10-7
10-6
Frequency [Hz]
Rec
epta
nce
mag
nitu
de [
m/N
]
Primary suspension damping factor 0.50
Primary suspension damping factor 0.25Primary suspension damping factor 0.75

RIVAS
SCP0-GA-2010-265754
RIVAS_CHALMERS_ WP5_D5_4_FINAL Page 36 of 81 26/2/2013
The properties of the flexible wheelset model can be altered by changing the wheel mass and by applying a multiplication factor on the axle diameters. Both of these parameters will influence the total mass of the wheelset (unsprung mass) and the eigenfrequencies of the symmetric bending modes. The influences of wheel mass and axle diameter multiplication factor on the point receptance at the nominal wheel–rail contact position are illustrated in Figure 6.5. It is shown that eigenfrequencies are increasing with decreasing wheel mass. Increasing the axle diameter leads to an increase in wheelset mass, a lower eigenfrequency for the wheelset mass vibrating on the suspension stiffness and a higher eigenfrequency of the first symmetric bending mode. For roughly the same wheelset mass, the eigenfrequency of the first symmetric bending mode is more affected by the axle diameter than by the wheel mass.
The influence of suspension properties on the point receptance is illustrated in Figure 6.6. It is observed that the eigenfrequency of the first symmetric bending mode is not affected by the suspension properties. However, as expected, the influence of the suspension properties on the receptance at the peak around 15 Hz is significant.
6.2 VEHICLE INPUT DATA
The purpose of the simulation study is to investigate the influence of various vehicle design parameters on ground vibration with more control over the parameters compared to an experimental data analysis. As in [4], the influence of each individual vehicle parameter (main effect) as well as interactions between the parameters (interaction effects) will be studied using a fractional factorial design approach. In a field experiment this would mean that different components of the vehicle are modified or replaced, one at a time and in different combinations. The required time, high cost and safety risk for such a field experiment motivates the simulation approach.
The study is carried out for two different vehicle models; one freight wagon equipped with Y25 bogies (flexible wheelset models) and one passenger vehicle model corresponding to a double deck coach (rigid wheelset models). For the freight wagon, six parameters are chosen where each parameter (design variable) is given a high and a low numerical level. The bogie mass parameter which in [4] was shown to have a small influence on ground vibration has been replaced by the wheelset axle diameter. The study on the passenger vehicle comprises 9 parameters, the same as in [4]. The parameter values are set to slightly above or below the values of the nominal vehicle design but still within the range of what could be possible for an alternative vehicle design.
In order to perform a full set of simulations covering all different combinations of the vehicle parameters, 26 = 64 simulations would be necessary for the freight wagon and 29 = 512 simulations for the passenger vehicle. To reduce the number of simulations, a fractional factorial design approach is chosen which consists of a strategic selection of input data combinations such that all main effects (effects of individual parameters) and up to a certain level of interactions (say interaction effects between two parameters but not interaction effects between three parameters etc) can be resolved. The fractional factorial design study is described by a design matrix which indicates which combinations of parameter input data to be tested. Here a design matrix including 32 specified combinations of vehicle data is used. The same 32 sets are studied for different vehicle speeds, soil models and track irregularity samples. For comparison, set 33 with nominal vehicle data is also studied.
Table 6.3 contains the adopted vehicle data for the two vehicle models with low and high levels for each parameter according to the factorial design approach. The upper and lower levels were

RIVAS
SCP0-GA-2010-265754
RIVAS_CHALMERS_ WP5_D5_4_FINAL Page 37 of 81 26/2/2013
determined based on the spread of existing vehicles and discussions with experts on railway vehicle dynamics. The nominal values are given by the arithmetic average of the low and high levels.
Table 6.3. Input data for vehicle models
Design variable Double deck coach LVNG
Freight wagon, Y25 bogies
Low High Low Nominal High
Car body mass [kg] mc 35000 45000 90156
Bogie mass [kg] mb 2072
Unsprung wheelset mass [kg]
mw 1500 2000 N.A.
Wheel mass [kg] mwheel N.A. N.A. 330 380 430
Wheelset axle diameter scale factor [-]
Dw N.A. N.A. 0.85 1.00 1.15
c-c distance between axles [m]
lw 2.0 3.5 1.6 1.8 2.0
c-c distance between bogies [m]
lb 17 23 8.0 8.9 9.8
Primary suspension stiffness [kN/mm]
k1 4.0 5.5 7.0
Primary suspension viscous damping [kNs/m]
c1 N.A.
Primary suspension hysteretic damping factor [-]
η1 0.25 0.50 0.75
Secondary suspension stiffness [kN/mm]
k2 50
Secondary suspension viscous damping [kNs/m]
c2 20

RIVAS
SCP0-GA-2010-265754
RIVAS_CHALMERS_ WP5_D5_4_FINAL Page 38 of 81 26/2/2013
6.3 RESULTS – PASSENGER VEHICLE MODEL
The main purpose of switching from a stationary train analysis to a moving train analysis was to capture the influence of axle distances that were not considered in the stationary analysis reported in D5.2 [4]. However, as can be seen in Figure 6.7, the scatter in the calculated free field response spectra is quite significant. The five samples leading to the response in Figure 6.7 are shown in Figure 6.8. From Figures 6.13 – 6.17 it is also evident that the spread in calculated main effects for the axle and bogie distances lw and lb are large when comparing the results from different unevenness samples whereas the main effects for the other vehicle design parameters are quite consistent. As a consequence, due to the sensitivity to the actual spatial appearance of the unevenness, it was found that it is not appropriate to include the axle distance as a parameter in this kind of analysis.
The results from the present study are mainly in line with the results from the previous study [4] using a less advanced calculation model: the unsprung mass is by far the most influential parameter. The overall vibration levels are similar with one exception: for the Horstwalde soil model the vibration amplitudes have increased by a factor four. In Figure 6.9, the receptances of the nominal vehicle model are compared with the “best” and “worst” designs. Essentially this means low and high unsprung mass, respectively. For comparison, also the track receptances of the three sites Furet, Horstwalde and Lincent are included in the diagram. Figure 6.10 is a close-up of the receptances from Figure 6.9 in a narrower frequency range and includes also the combined track and vehicle receptances. It is interesting to see the behaviour of the combined receptances in the important frequency range 50 - 100 Hz. Here Horstwalde has the lowest combined receptance of the three soil types, which in turn also means that Horstwalde has the strongest excitation.
The end results are presented in Figures 6.11 – 6.12 as insertion loss in 1/3 octave bands and overall insertion loss given in the legends. The insertion loss (IL) is taken as the difference between the nominal case and the best set of vehicle design parameters. Due to the long calculation times some combinations of soil types and train speeds have been omitted but the results for the omitted cases are expected to be consistent with the presented ones. Even if all overall IL values are positive (0.4 < IL < 2.4 dB) it is difficult to see any clear trends in the spectra that look very jagged. This is typical appearance if a vehicle design change leads to a frequency shift in the response.
Detailed results in the form of main effects and two-parameter interactions for the different combinations of soil type and vehicle speed, leading to the insertion loss results, are presented in Figures 6.13 – 6.17. The overall vibration levels are noticeably higher for Horstwalde than for the other two, which are similar. As discussed above, the low combined track and vehicle receptance for the Horstwalde case implies that the excitation forces are higher, and not surprisingly, the vibration response in the ground is stronger.

RIVAS
SCP0-GA-2010-265754
RIVAS_CHALMERS_ WP5_D5_4_FINAL Page 39 of 81 26/2/2013
Figure 6.7. Level of RMS free field ground vibration at 8 m from track evaluated in 1/3 octave
bands for the five different track irregularity samples in Figure 6.8. Soil type Lincent and train speed 200 km/h. Mean value and bars representing ±1 standard deviation are included
Figure 6.8. Five different spatial samples of track irregularity profile based on the same track
irregularity spectrum ORE B176 high and used in the analysis for passenger vehicle
1 2 4 8 16 32 64
10-3
10-2
10-1
100
Frequency (Hz)
v RM
S (
mm
/s)
Lincent 200 km/h
Mean (0.56 mm/s)seed 1 (0.59 mm/s)
seed 2 (0.54 mm/s)
seed 3 (0.63 mm/s)
seed 4 (0.57 mm/s)seed 5 (0.45 mm/s)
-1000 -500 0 500 1000Track position [m]
Tra
ck u
neve
nnes
s [m
]

RIVAS
SCP0-GA-2010-265754
RIVAS_CHALMERS_ WP5_D5_4_FINAL Page 40 of 81 26/2/2013
Figure 6.9. Vehicle and track receptances for three soil types (Furet, Horstwalde, Lincent)
and three vehicle parameter sets (nominal, worst, best)
Figure 6.10. Vehicle, track and combined receptances for nominal vehicle and the three soil
types in Figure 6.9. Note that the frequency range is different than in Figure 6.9
100
101
102
10-9
10-8
10-7
10-6
10-5
Frequency [Hz]
Veh
icle
and
tra
ck r
ecep
tanc
e [m
/N]
Nominal unsprung mass
Low unsprung mass
High unsprung massFuret
Horstwalde
Lincent
101
102
10-9
10-8
10-7
Frequency [Hz]
Veh
icle
and
tra
ck r
ecep
tanc
e [m
/N]
Nominal vehicle
Furet
Horstwalde
LincentTotal Furet+vehicle
Total Horstwalde+vehicle
Total Lincent+vehicle

RIVAS
SCP0-GA-2010-265754
RIVAS_CHALMERS_ WP5_D5_4_FINAL Page 41 of 81 26/2/2013
Figure 6.11 Insertion loss (best parameter set compared to nominal parameter set) for train
speed 200 km/h and three different soil types (Furet, Horstwalde and Lincent)
Figure 6.12 Insertion loss (best parameter set compared to nominal parameter set) for soil
type Lincent and three different train speeds: 150 km/h, 200 km/h and 250 km/h
1 2 4 8 16 32 64-15
-10
-5
0
5
10
15
20
25
Frequency (Hz)
Inse
rtio
n lo
ss (
dB)
200 km/h
Horstwalde - Overall IL 2.4 dB
Lincent - Overall IL 0.4 dBFuret - Overall IL 2.1 dB
1 2 4 8 16 32 64-15
-10
-5
0
5
10
15
20
25
Frequency (Hz)
Inse
rtio
n lo
ss (
dB)
Lincent
150 km/h - Overall IL 2.4 dB
200 km/h - Overall IL 0.4 dB250 km/h - Overall IL 2.2 dB

RIVAS
SCP0-GA-2010-265754
RIVAS_CHALMERS_ WP5_D5_4_FINAL Page 42 of 81 26/2/2013
(a)
(b)
Figure 6.13. Influence of passenger vehicle design parameters on RMS free field ground vibration [mm/s] at 8 m from track evaluated in frequency interval 1 – 100 Hz: Soil
conditions: Lincent, track geometry irregularity spectrum: ORE B176 high. RMS vibration level (mean value) of the nominal vehicle at 150 km/h: 0.50 mm/s. Statistics based on
simulations with five samples of track irregularity profile. (a) Overall main effects, (b) octave frequency band spectra main effects two-parameter interactions
mc mb mw lb lw k1 c1 k2 c2-0.25
-0.2
-0.15
-0.1
-0.05
0
0.05
0.1
0.15
0.2
0.25
Vehicle parameters
RM
S f
ree
field
vib
ratio
n @
8 m
[m
m/s
] -
mai
n ef
fect
Lincent_ORE_2
Average
Seed 1-5
Octave band centre frequency [Hz]
Mai
n ef
fect
s an
d tw
o-pa
ram
eter
inte
ract
ions
[m
m/s
]
Lincent_ORE_2 - 150 km/h
2 4 8 16 31.5 63
mcmbmw
lblwk1c1k2c2
mc*mb + k1*c1mc*mw + k1*k2
mc*lb + k1*c2mc*lw
mc*c1 + mb*k1mc*k2 + mw*k1
mc*c2 + lb*k1mb*mw + c1*k2
mb*lb + c1*c2mb*lw
mb*k2 + mw*c1mb*c1 + lb*c1mw*lb + k2*c2
mw*lwk1*c2 + lb*k2
lb*lwlw*k1lw*c1lw*k2lw*c2 -0.06
-0.04
-0.02
0
0.02
0.04
0.06

RIVAS
SCP0-GA-2010-265754
RIVAS_CHALMERS_ WP5_D5_4_FINAL Page 43 of 81 26/2/2013
(a)
(b)
Figure 6.14. Influence of passenger vehicle design parameters on RMS free field ground vibration [mm/s] at 8 m from track evaluated in frequency interval 1 – 100 Hz: Soil
conditions: Lincent, track geometry irregularity spectrum: ORE B176 high. RMS vibration level (mean value) of the nominal vehicle at 200 km/h: 0.56 mm/s. Statistics based on
simulations with five samples of track irregularity profile. (a) Overall main effects, (b) octave frequency band spectra main effects two-parameter interactions
mc mb mw lb lw k1 c1 k2 c2-0.25
-0.2
-0.15
-0.1
-0.05
0
0.05
0.1
0.15
0.2
0.25
Vehicle parameters
RM
S f
ree
field
vib
ratio
n @
8 m
[m
m/s
] -
mai
n ef
fect
Lincent_ORE_2
Average
Seed 1-5
Octave band centre frequency [Hz]
Mai
n ef
fect
s an
d tw
o-pa
ram
eter
inte
ract
ions
[m
m/s
]
Lincent_ORE_2 - 200 km/h
2 4 8 16 31.5 63
mcmbmw
lblwk1c1k2c2
mc*mb + k1*c1mc*mw + k1*k2
mc*lb + k1*c2mc*lw
mc*c1 + mb*k1mc*k2 + mw*k1
mc*c2 + lb*k1mb*mw + c1*k2
mb*lb + c1*c2mb*lw
mb*k2 + mw*c1mb*c1 + lb*c1mw*lb + k2*c2
mw*lwk1*c2 + lb*k2
lb*lwlw*k1lw*c1lw*k2lw*c2 -0.08
-0.06
-0.04
-0.02
0
0.02
0.04
0.06
0.08

RIVAS
SCP0-GA-2010-265754
RIVAS_CHALMERS_ WP5_D5_4_FINAL Page 44 of 81 26/2/2013
(a)
(b)
Figure 6.15. Influence of passenger vehicle design parameters on RMS free field ground vibration [mm/s] at 8 m from track evaluated in frequency interval 1 – 100 Hz: Soil
conditions: Lincent, track geometry irregularity spectrum: ORE B176 high. RMS vibration level (mean value) of the nominal vehicle at 250 km/h: 0.73 mm/s. Statistics based on
simulations with five samples of track irregularity profile. (a) Overall main effects, (b) octave frequency band spectra main effects two-parameter interactions
mc mb mw lb lw k1 c1 k2 c2-0.25
-0.2
-0.15
-0.1
-0.05
0
0.05
0.1
0.15
0.2
0.25
Vehicle parameters
RM
S f
ree
field
vib
ratio
n @
8 m
[m
m/s
] -
mai
n ef
fect
Lincent_ORE_2
Average
Seed 1-5
Octave band centre frequency [Hz]
Mai
n ef
fect
s an
d tw
o-pa
ram
eter
inte
ract
ions
[m
m/s
]
Lincent_ORE_2 - 250 km/h
2 4 8 16 31.5 63
mcmbmw
lblwk1c1k2c2
mc*mb + k1*c1mc*mw + k1*k2
mc*lb + k1*c2mc*lw
mc*c1 + mb*k1mc*k2 + mw*k1
mc*c2 + lb*k1mb*mw + c1*k2
mb*lb + c1*c2mb*lw
mb*k2 + mw*c1mb*c1 + lb*c1mw*lb + k2*c2
mw*lwk1*c2 + lb*k2
lb*lwlw*k1lw*c1lw*k2lw*c2
-0.1
-0.08
-0.06
-0.04
-0.02
0
0.02
0.04
0.06
0.08
0.1

RIVAS
SCP0-GA-2010-265754
RIVAS_CHALMERS_ WP5_D5_4_FINAL Page 45 of 81 26/2/2013
(a)
(b)
Figure 6.16. Influence of passenger vehicle design parameters on RMS free field ground vibration [mm/s] at 8 m from track evaluated in frequency interval 1 – 100 Hz: Soil
conditions: Horstwalde, track geometry irregularity spectrum: ORE B176 high. RMS vibration level (mean value) of the nominal vehicle at 200 km/h: 1.22 mm/s. Statistics based on simulations with five samples of track irregularity profile. (a) Overall main effects, (b) octave
frequency band spectra main effects two-parameter interactions
mc mb mw lb lw k1 c1 k2 c2-0.25
-0.2
-0.15
-0.1
-0.05
0
0.05
0.1
0.15
0.2
0.25
Vehicle parameters
RM
S f
ree
field
vib
ratio
n @
8 m
[m
m/s
] -
mai
n ef
fect
Horstwalde_ORE_2
Average
Seed 1-5
Octave band centre frequency [Hz]
Mai
n ef
fect
s an
d tw
o-pa
ram
eter
inte
ract
ions
[m
m/s
]
Horstwalde_ORE_2 - 200 km/h
2 4 8 16 31.5 63
mcmbmw
lblwk1c1k2c2
mc*mb + k1*c1mc*mw + k1*k2
mc*lb + k1*c2mc*lw
mc*c1 + mb*k1mc*k2 + mw*k1
mc*c2 + lb*k1mb*mw + c1*k2
mb*lb + c1*c2mb*lw
mb*k2 + mw*c1mb*c1 + lb*c1mw*lb + k2*c2
mw*lwk1*c2 + lb*k2
lb*lwlw*k1lw*c1lw*k2lw*c2
-0.15
-0.1
-0.05
0
0.05
0.1
0.15

RIVAS
SCP0-GA-2010-265754
RIVAS_CHALMERS_ WP5_D5_4_FINAL Page 46 of 81 26/2/2013
(a)
(b)
Figure 6.17. Influence of passenger vehicle design parameters on RMS free field ground vibration [mm/s] at 8 m from track evaluated in frequency interval 1 – 100 Hz: Soil
conditions: Furet, track geometry irregularity spectrum: ORE B176 high. RMS vibration level (mean value) of the nominal vehicle at 200 km/h: 0.40 mm/s. Statistics based on
simulations with five samples of track irregularity profile. (a) Overall main effects, (b) octave frequency band spectra main effects two-parameter interactions
mc mb mw lb lw k1 c1 k2 c2-0.25
-0.2
-0.15
-0.1
-0.05
0
0.05
0.1
0.15
0.2
0.25
Vehicle parameters
RM
S f
ree
field
vib
ratio
n @
8 m
[m
m/s
] -
mai
n ef
fect
Furet_ORE_2
Average
Seed 1-5
Octave band centre frequency [Hz]
Mai
n ef
fect
s an
d tw
o-pa
ram
eter
inte
ract
ions
[m
m/s
]
Furet_ORE_2 - 200 km/h
2 4 8 16 31.5 63
mcmbmw
lblwk1c1k2c2
mc*mb + k1*c1mc*mw + k1*k2
mc*lb + k1*c2mc*lw
mc*c1 + mb*k1mc*k2 + mw*k1
mc*c2 + lb*k1mb*mw + c1*k2
mb*lb + c1*c2mb*lw
mb*k2 + mw*c1mb*c1 + lb*c1mw*lb + k2*c2
mw*lwk1*c2 + lb*k2
lb*lwlw*k1lw*c1lw*k2lw*c2
-0.08
-0.06
-0.04
-0.02
0
0.02
0.04
0.06
0.08

RIVAS
SCP0-GA-2010-265754
RIVAS_CHALMERS_ WP5_D5_4_FINAL Page 47 of 81 26/2/2013
6.4 RESULTS – FREIGHT VEHICLE MODEL
The freight vehicle model, accounting for the flexibility in wheelset bending, has been applied to study the influence of six vehicle parameters: wheelset distance lw, bogie distance lb, wheel mass mwheel, hysteretic damping η1 of the primary suspension, stiffness k1 of the primary suspension and wheelset axle diameter multiplication factor Dw. Input data (low and high levels) for the vehicle parameters according to Table 6.3 have been adopted. The full train model includes four identical freight wagons. The fraction factorial design approach has been repeated for different combinations of vehicle speed, soil model and track irregularity profile sample. Note that the same five irregularity profile samples were used for all combinations of vehicle speed and soil model.
6.4.1 Lincent
The results from the parameter study for the reference site Lincent are summarised in Figures 6.18 – 6.20. Figure 6.18 illustrates the influences (main effects) of the six freight vehicle parameters on the total RMS (evaluated in the frequency range 1 – 200 Hz) of free field vibration at distance 8 m from track. A main effect is the change in RMS as a given vehicle parameter is changed from low level to high level. A positive numerical value for a main effect means that the RMS is increased by the numerical value if the vehicle parameter is changed from low to high level. Thus, a negative numerical value means a decrease in RMS if the vehicle parameter is changed from low to high level.
Figure 6.18(a) illustrates the mean values of the main effects evaluated for the five track irregularity profile samples, whereas Figure 6.18(b) shows the standard deviations of the main effects. It is observed that wheel mass and axle diameter has a significant influence on the RMS of free field vibration. Increasing the wheel mass and axle diameter increases the ground vibration. Since the standard deviations of these main effects are small in relation to the corresponding mean values, it is concluded that the influence of these parameters is consistent for different samples of track irregularity profile. The influence of the primary suspension (stiffness and damping) on the total RMS of ground vibration is small (although it may have some significance for frequencies near the eigenfrequency of the wheelset vibrating on the primary suspension). The calculated influences of axle distance and bogie distance varies significantly between different combinations of vehicle speed and track irregularity profile sample. For some combinations of vehicle speed and irregularity profile sample, these main effects are positive while for other combinations they are negative.
For vehicle speed 100 km/h and the second sample of the track irregularity profile, Figure 6.19(a) shows the calculated ground vibration level evaluated in 1/3 octave bands. Three spectra are shown corresponding to three combinations of vehicle input data. For the current load case, vehicle parameter combination 10 resulted in the lowest total vibration level evaluated in the frequency interval 1 – 200 Hz, whereas parameter combination 29 led to the highest total vibration level. For comparison, the spectrum for the nominal vehicle model (33) is shown. For all vehicle parameter combinations, it is observed that the ground vibration is highest in the frequency range from about 25 Hz to 63 Hz. It was shown in RIVAS D5.2 [4] that the free field mobility at 8 m from track was highest in the frequency range from about 20 Hz to 60 Hz. The vehicle parameter combination 10 with low levels for lw, mwheel, η1 and Dw and high levels for lb and k1 reduces the vibration in this frequency range but increases the vibration at frequencies below 10 Hz. Vehicle parameter combination 29 with high levels for lw, lb, mwheel and Dw and low levels for η1 and k1 has the opposite effect. The corresponding insertion losses (using parameter combination 33 as a reference) are shown in Figure 6.19(b).

RIVAS
SCP0-GA-2010-265754
RIVAS_CHALMERS_ WP5_D5_4_FINAL Page 48 of 81 26/2/2013
In Figure 6.20(a), all main effects and two-factor interactions evaluated in octave bands (for the same load case as in Figure 6.19) are shown. Since the main contributions to the total RMS free field vibration are in the octave bands 16, 31.5 and 63 Hz, the effects at lower frequencies are negligible despite the significant insertion losses. It is observed that increasing mwheel and Dw from low to high level generates an increase in ground vibration in octave bands 16, 31.5 and 63 Hz. The low influence of the primary suspension is consistent in the entire evaluated frequency interval. For the present load case (track irregularity profile sample 2), increasing the axle and bogie distances seems to increase the ground vibration in octave band 31.5 Hz and decrease the vibration in octave band 63 Hz. Also, the figure indicates that some two-factor interactions are significant. However, based on the large standard deviations for the axle and bogie distances displayed in Figure 6.18, the real significance of these effects may be regarded as uncertain.
The results in Figures 6.18, 6.19 and 6.20(a) can be easier understood by observing the combined vehicle and track receptance for different vehicle parameter combinations in Figure 6.20(b). For a stationary vehicle, it is shown in RIVAS D3.2 [24] that the combined vehicle and track receptance relates the dynamic axle loads to the track irregularity. For a given track irregularity spectrum, reducing the combined vehicle and track receptance (thus, increasing the dynamic stiffness of the coupled vehicle‒track system) in a certain frequency range increases the dynamic axle loads and ground vibration in the same frequency range. The combined receptances for vehicle parameter combinations 10 and 29 are compared in Figure 6.20(b). Vehicle 10 with the stiffer primary suspension shifts the wheelset resonance on the primary suspension to a higher frequency. The combined receptance is lower in the frequency range up to about 10 Hz which leads to higher ground vibration levels in the 1/3 octave bands below 10 Hz, see Figure 6.19(a). On the other hand, the lower unsprung mass (due to low levels for both mwheel and Dw) of vehicle 10 reduces the dynamic stiffness at higher frequencies and thus lower ground vibration is generated for frequencies above 10 Hz. The influence of the resonance due to the lowest symmetric eigenmode in wheelset bending on the combined receptance is small. The assumed low damping of the eigenmode leads to a narrow resonance peak. Further, the resonance peak leads to an increase in combined receptance which reduces the dynamic axle loads. From this, it is concluded that the main benefit of a smaller axle diameter (as indicated in Figure 6.18(a)) is the smaller contribution to the unsprung mass.
6.4.2 Horstwalde
The corresponding results when using the soil model for Horstwalde are shown in Figures 6.21 – 6.23. The results for Lincent and Horstwalde are similar. The most important main effects are again the wheel mass and axle diameter, see Figure 6.21. The main effects of these two vehicle parameters are increasing with increasing vehicle speed. The influence of the primary suspension (stiffness and damping) on the total RMS of ground vibration is small.
For vehicle speed 100 km/h and the first sample of the track irregularity profile, Figure 6.22(a) shows the calculated ground vibration level evaluated in 1/3 octave bands. For the current load case, vehicle parameter combination 28 resulted in the lowest total vibration level evaluated in the frequency interval 1 – 200 Hz, whereas parameter combination 23 led to the highest total vibration level. For all vehicle parameter combinations, it is observed that the ground vibration is highest in the frequency range from about 40 Hz to 125 Hz. This is consistent with the free field mobility at 8 m from track which is displayed in RIVAS D5.2 [4]. The vehicle parameter combination 28 with low levels for mwheel and Dw and high levels for lw, lb, η1 and k1 reduces the vibration in this frequency range but increases the vibration at frequencies below 10 Hz. Vehicle parameter combination 23 with high levels for lw, mwheel, η1 and Dw and low levels for lb and k1 has the opposite effect. The corresponding insertion losses (using parameter combination 33 as a reference) are

RIVAS
SCP0-GA-2010-265754
RIVAS_CHALMERS_ WP5_D5_4_FINAL Page 49 of 81 26/2/2013
shown in Figure 6.22(b). The optimum vehicle parameter configurations are again best explained by viewing the combined vehicle and track receptance in Figure 6.23(b).
6.4.3 Furet
The corresponding results when using the soil model for Furet are shown in Figures 6.24 – 6.26. Again, increasing the wheel mass and axle diameter increases the total RMS of ground vibration, see Figure 6.24. However, the most important main effect for this soil model is the stiffness of the primary suspension.
For vehicle speed 100 km/h and the second sample of the track irregularity profile, Figure 6.25(a) shows the calculated ground vibration level evaluated in 1/3 octave bands. For the current load case, vehicle parameter combination 25 resulted in the lowest total vibration level evaluated in the frequency interval 1 – 200 Hz, whereas parameter combination 8 led to the highest total vibration level. It was shown in RIVAS D5.2 that the free field mobility at 8 m from track is consistently high from about 5 Hz to 50 Hz. This explains why the influence of the primary suspension is more important for the Furet site than for the Lincent and Horstwalde sites. This is also consistent with Figure 6.25(a) which shows that the calculated ground vibration is highest in this frequency range. The vehicle parameter combination 25 with low levels for mwheel, η1, k1 and Dw and high levels for lw and lb reduces the vibration in most of the investigated frequency range. Vehicle parameter combination 8 with high levels for mwheel, η1, k1 and Dw and low levels for lw and lb has the opposite effect. The corresponding insertion losses (using parameter combination 33 as a reference) are shown in Figure 6.25(b). The optimum vehicle parameter configurations are again best explained by viewing the combined vehicle and track receptance in Figure 6.26(b) which shows that the combined receptance is higher for parameter combination 25 compared to parameter combination 8 for most frequencies above 7 Hz.
6.4.4 Summary
It is concluded that the most effective means to reduce ground vibration by vehicle optimisation is minimising the unsprung mass as this increases the vehicle receptance in a wide frequency range. This is in agreement with the conclusions from RIVAS D5.2 [4]. The influence of wheelset resonances in bending seems to be negligible. Reducing the stiffness of the primary suspension could have a positive effect in reducing ground vibration for soils where the free field mobility is high at frequencies near the wheelset resonance on the primary suspension (such as for the Furet site). No consistent conclusions can be drawn for the influence of wheelset and bogie distances on ground vibration as the results seem to vary from one combination of vehicle speed and track irregularity profile to another. Also, note that modifying the properties of the primary suspension and/or the wheelset and bogie distances may simply shift the problem of ground vibration from one octave band to the next. This means that (1) a vehicle that has been optimised for certain soil conditions might be non-optimal at other soil conditions and (2) a consistent reduction of ground vibration cannot be expected even if the soil conditions are similar since different combinations of vehicle speed and wavelength content of wheel/track irregularities at different sites will induce different sets of excitation frequencies. On the other hand, it is possible that some of these vehicle parameters might have an indirect influence on ground vibration in terms of OOR growth.
In [4], simulations of the quasi-static ground response showed a weak influence of vehicle geometry and low levels of vibration compared to the dynamic response. This is expected when the evaluation is performed at 8 m from the track since most of the quasi-static contribution is attenuated in the soil. Unless the vehicle speed is high enough to exceed the wave speed in the ground, problems

RIVAS
SCP0-GA-2010-265754
RIVAS_CHALMERS_ WP5_D5_4_FINAL Page 50 of 81 26/2/2013
with the quasi-static response will only occur in cases where the receiver is positioned within a few metres from the track.
(a)
(b)
Figure 6.18. Influence of freight vehicle design parameters on RMS free field ground vibration [mm/s] at 8 m from track. Main effects evaluated in frequency interval 1 – 200 Hz: (a) mean value, (b) standard deviation. Soil conditions: Lincent. Track geometry irregularity spectrum: ORE B176 high. RMS vibration level (mean value) of the nominal vehicle at 100
km/h: 0.25 mm/s. Statistics based on simulations with five samples of track irregularity profile
lw lb mwheel eta1 k1 Dw-0.03
-0.02
-0.01
0
0.01
0.02
0.03
0.04
0.05
0.06
0.07
Vehicle parameters
RM
S f
ree
field
vib
ratio
n @
8 m
[m
m/s
] -
mai
n ef
fect
(m
ean)
Lincent ORE high
70 km/h
100 km/h120 km/h
lw lb mwheel eta1 k1 Dw-0.03
-0.02
-0.01
0
0.01
0.02
0.03
0.04
0.05
0.06
0.07
Vehicle parameters
RM
S f
ree
field
vib
ratio
n @
8 m
[m
m/s
] -
mai
n ef
fect
(st
d)
Lincent ORE high
70 km/h
100 km/h120 km/h

RIVAS
SCP0-GA-2010-265754
RIVAS_CHALMERS_ WP5_D5_4_FINAL Page 51 of 81 26/2/2013
(a)
(b)
Figure 6.19. (a) Level of RMS free field ground vibration at 8 m from track evaluated in 1/3 octave bands, nominal vehicle parameters (33), studied vehicle model with combination of
parameters leading to lowest vibration (10), studied vehicle model with combination of parameters leading to highest vibration (29). (b) Insertion loss compared to nominal vehicle. Vehicle speed 100 km/h. Soil conditions: Lincent. Sample 2 of track irregularity profile based
on spectrum ORE B176 high
1 2 4 8 16 31.5 63 125100
110
120
130
140
150
160
170
180
Frequency [Hz]
Lv [
dB r
e 1
µm/s
]
Lincent, ORE high sample 2, 100 km/h
33
1029
1 2 4 8 16 31.5 63 125-20
-15
-10
-5
0
5
10
15
20
Frequency [Hz]
Inse
rtio
n lo
ss c
ompa
red
to n
omin
al v
ehic
le 3
3 [d
B]
Lincent, ORE high sample 2, 100 km/h
Vehicle 10 - Overall IL 2.2 dB
Vehicle 29 - Overall IL -4.2 dB

RIVAS
SCP0-GA-2010-265754
RIVAS_CHALMERS_ WP5_D5_4_FINAL Page 52 of 81 26/2/2013
(a)
(b)
Figure 6.20. (a) Influence of freight vehicle design parameters on RMS free field ground vibration [mm/s] at 8 m from track, main effects and two-parameter interactions evaluated in
octave bands at vehicle speed 100 km/h. Soil conditions: Lincent. Sample 2 of track irregularity profile based on spectrum ORE B176 high. (b) Magnitude of combined vehicle and track receptance for vehicle parameter combinations leading to lowest (10: 0.17 mm/s)
and highest (29: 0.36 mm/s) RMS free field vibration
Octave band centre frequency [Hz]
Mai
n ef
fect
s an
d tw
o-pa
ram
eter
inte
ract
ions
[m
m/s
]
Lincent_ORE_2_2 - 100 km/h
2 4 8 16 31.5 63 125
lwlb
mwheeleta1
k1Dw
lw*lblw*mwheel
lw*eta1lw*k1
lw*Dwlb*mwheel
lb*eta1lb*k1
lb*Dwmwheel*eta1
mwheel*k1mwheel*Dw
eta1*k1eta1*Dw
k1*Dw -0.025
-0.02
-0.015
-0.01
-0.005
0
0.005
0.01
0.015
0.02
0.025
100
101
102
10-11
10-10
10-9
10-8
10-7
10-6
10-5
Frequency [Hz]
Rec
epta
nce
mag
nitu
de [
m/N
]
Lincent - 100 km/h
Track
Vehicle 10
Track + Vehicle 10Vehicle 29
Track + Vehicle 29
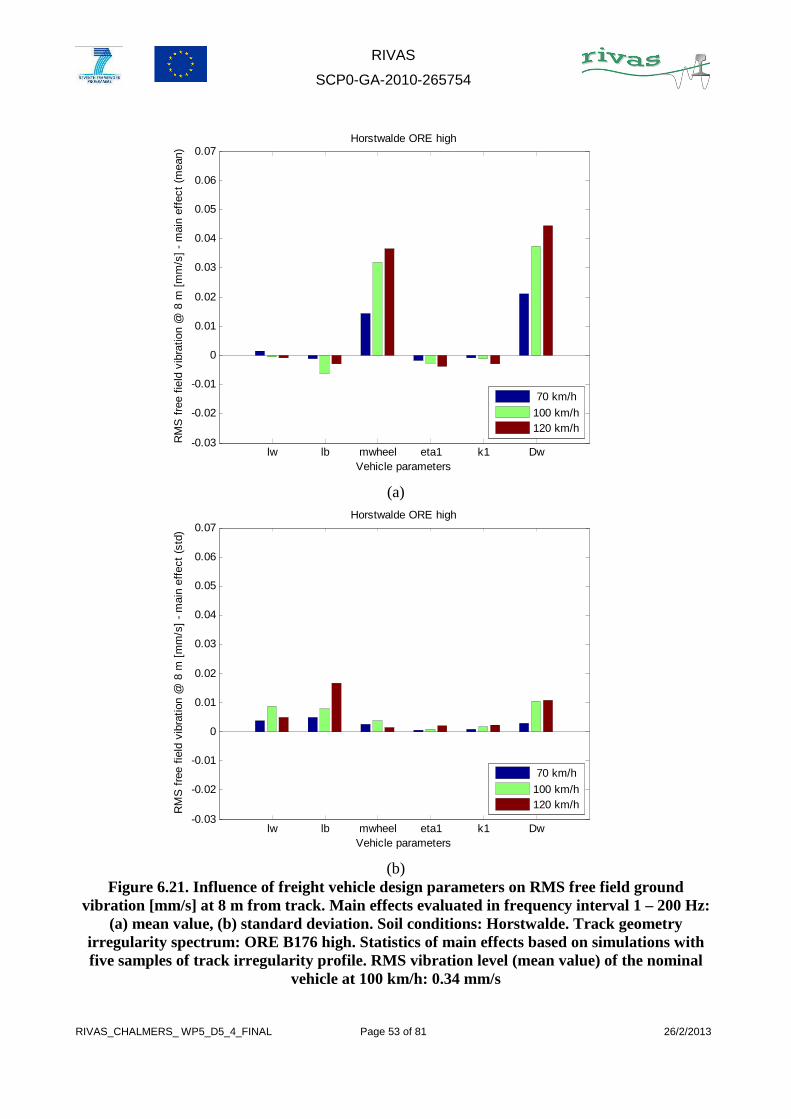
RIVAS
SCP0-GA-2010-265754
RIVAS_CHALMERS_ WP5_D5_4_FINAL Page 53 of 81 26/2/2013
(a)
(b)
Figure 6.21. Influence of freight vehicle design parameters on RMS free field ground vibration [mm/s] at 8 m from track. Main effects evaluated in frequency interval 1 – 200 Hz:
(a) mean value, (b) standard deviation. Soil conditions: Horstwalde. Track geometry irregularity spectrum: ORE B176 high. Statistics of main effects based on simulations with five samples of track irregularity profile. RMS vibration level (mean value) of the nominal
vehicle at 100 km/h: 0.34 mm/s
lw lb mwheel eta1 k1 Dw-0.03
-0.02
-0.01
0
0.01
0.02
0.03
0.04
0.05
0.06
0.07
Vehicle parameters
RM
S f
ree
field
vib
ratio
n @
8 m
[m
m/s
] -
mai
n ef
fect
(m
ean)
Horstwalde ORE high
70 km/h
100 km/h120 km/h
lw lb mwheel eta1 k1 Dw-0.03
-0.02
-0.01
0
0.01
0.02
0.03
0.04
0.05
0.06
0.07
Vehicle parameters
RM
S f
ree
field
vib
ratio
n @
8 m
[m
m/s
] -
mai
n ef
fect
(st
d)
Horstwalde ORE high
70 km/h
100 km/h120 km/h

RIVAS
SCP0-GA-2010-265754
RIVAS_CHALMERS_ WP5_D5_4_FINAL Page 54 of 81 26/2/2013
(a)
(b)
Figure 6.22. (a) Level of RMS free field ground vibration at 8 m from track evaluated in 1/3 octave bands, nominal vehicle parameters (33), studied vehicle model with combination of
parameters leading to lowest vibration (28), studied vehicle model with combination of parameters leading to highest vibration (23). (b) Insertion loss compared to nominal vehicle. Vehicle speed 100 km/h. Soil conditions: Horstwalde. Sample 1 of track irregularity profile
based on spectrum ORE B176 high
1 2 4 8 16 31.5 63 125100
110
120
130
140
150
160
170
180
Frequency [Hz]
Lv [
dB r
e 1
µm/s
]
Horstwalde, ORE high sample 1, 100 km/h
33
2823
1 2 4 8 16 31.5 63 125-20
-15
-10
-5
0
5
10
15
20
Frequency [Hz]
Inse
rtio
n lo
ss c
ompa
red
to n
omin
al v
ehic
le 3
3 [d
B]
Horstwalde, ORE high sample 1, 100 km/h
Vehicle 28 - Overall IL 3.4 dB
Vehicle 23 - Overall IL -1.0 dB

RIVAS
SCP0-GA-2010-265754
RIVAS_CHALMERS_ WP5_D5_4_FINAL Page 55 of 81 26/2/2013
(a)
(b)
Figure 6.23. (a) Influence of freight vehicle design parameters on RMS free field ground vibration [mm/s] at 8 m from track, main effects and two-parameter interactions evaluated in
octave bands at vehicle speed 100 km/h. Soil conditions: Horstwalde. Sample 1 of track irregularity profile based on spectrum ORE B176 high. (b) Magnitude of combined vehicle and track receptance for vehicle parameter combinations leading to lowest (28: 0.24 mm/s)
and highest (23: 0.40 mm/s) RMS free field vibration
Octave band centre frequency [Hz]
Mai
n ef
fect
s an
d tw
o-pa
ram
eter
inte
ract
ions
[m
m/s
]
Horstwalde_ORE_2_1 - 100 km/h
2 4 8 16 31.5 63 125
lwlb
mwheeleta1
k1Dw
lw*lblw*mwheel
lw*eta1lw*k1
lw*Dwlb*mwheel
lb*eta1lb*k1
lb*Dwmwheel*eta1
mwheel*k1mwheel*Dw
eta1*k1eta1*Dw
k1*Dw
-0.03
-0.02
-0.01
0
0.01
0.02
0.03
100
101
102
10-11
10-10
10-9
10-8
10-7
10-6
10-5
Frequency [Hz]
Rec
epta
nce
mag
nitu
de [
m/N
]
Horstwalde - 100 km/h
Track
Vehicle 28
Track + Vehicle 28Vehicle 23
Track + Vehicle 23

RIVAS
SCP0-GA-2010-265754
RIVAS_CHALMERS_ WP5_D5_4_FINAL Page 56 of 81 26/2/2013
(a)
(b)
Figure 6.24. Influence of freight vehicle design parameters on RMS free field ground vibration [mm/s] at 8 m from track. Main effects evaluated in frequency interval 1 – 200 Hz: (a) mean value, (b) standard deviation. Soil conditions: Furet. Track geometry irregularity
spectrum: ORE B176 high. Statistics of main effects based on simulations with five samples of track irregularity profile. RMS vibration level (me an value) of the nominal vehicle at
100 km/h: 0.23 mm/s
lw lb mwheel eta1 k1 Dw-0.03
-0.02
-0.01
0
0.01
0.02
0.03
0.04
0.05
0.06
0.07
Vehicle parameters
RM
S f
ree
field
vib
ratio
n @
8 m
[m
m/s
] -
mai
n ef
fect
(m
ean)
Furet ORE high
70 km/h
100 km/h120 km/h
lw lb mwheel eta1 k1 Dw-0.03
-0.02
-0.01
0
0.01
0.02
0.03
0.04
0.05
0.06
0.07
Vehicle parameters
RM
S f
ree
field
vib
ratio
n @
8 m
[m
m/s
] -
mai
n ef
fect
(st
d)
Furet ORE high
70 km/h
100 km/h120 km/h

RIVAS
SCP0-GA-2010-265754
RIVAS_CHALMERS_ WP5_D5_4_FINAL Page 57 of 81 26/2/2013
(a)
(b)
Figure 6.25. (a) Level of RMS free field ground vibration at 8 m from track evaluated in 1/3 octave bands, nominal vehicle parameters (33), studied vehicle model with combination of
parameters leading to lowest vibration (25), studied vehicle model with combination of parameters leading to highest vibration (8). (b) Insertion loss compared to nominal vehicle.
Vehicle speed 100 km/h. Soil conditions: Furet. Sample 2 of track irregularity profile based on spectrum ORE B176 high
1 2 4 8 16 31.5 63 125100
110
120
130
140
150
160
170
180
Frequency [Hz]
Lv [
dB r
e 1
µm/s
]
Furet, ORE high sample 2, 100 km/h
33
258
1 2 4 8 16 31.5 63 125-20
-15
-10
-5
0
5
10
15
20
Frequency [Hz]
Inse
rtio
n lo
ss c
ompa
red
to n
omin
al v
ehic
le 3
3 [d
B]
Furet, ORE high sample 2, 100 km/h
Vehicle 25 - Overall IL 0.9 dB
Vehicle 8 - Overall IL -7.2 dB

RIVAS
SCP0-GA-2010-265754
RIVAS_CHALMERS_ WP5_D5_4_FINAL Page 58 of 81 26/2/2013
(a)
(b)
Figure 6.26. (a) Influence of freight vehicle design parameters on RMS free field ground vibration [mm/s] at 8 m from track, main effects and two-parameter interactions evaluated in octave bands at vehicle speed 100 km/h. Soil conditions: Furet. Sample 2 of track irregularity
profile based on spectrum ORE B176 high. (b) Magnitude of combined vehicle and track receptance for vehicle parameter combinations leading to lowest (25: 0.13 mm/s) and highest
(8: 0.33 mm/s) RMS free field vibration
Octave band centre frequency [Hz]
Mai
n ef
fect
s an
d tw
o-pa
ram
eter
inte
ract
ions
[m
m/s
]
Furet_ORE_2_2 - 100 km/h
2 4 8 16 31.5 63 125
lwlb
mwheeleta1
k1Dw
lw*lblw*mwheel
lw*eta1lw*k1
lw*Dwlb*mwheel
lb*eta1lb*k1
lb*Dwmwheel*eta1
mwheel*k1mwheel*Dw
eta1*k1eta1*Dw
k1*Dw-0.04
-0.03
-0.02
-0.01
0
0.01
0.02
0.03
0.04
100
101
102
10-11
10-10
10-9
10-8
10-7
10-6
10-5
Frequency [Hz]
Rec
epta
nce
mag
nitu
de [
m/N
]
Furet - 100 km/h
Track
Vehicle 25
Track + Vehicle 25Vehicle 8
Track + Vehicle 8

RIVAS
SCP0-GA-2010-265754
RIVAS_CHALMERS_ WP5_D5_4_FINAL Page 59 of 81 26/2/2013
7. TECHNOLOGY ASSESSMENT
7.1 REDUCED UNSPRUNG MASS – CONTRIBUTION FROM DRIVE
SYSTEM
Previous investigations carried out during the RIVAS project, see deliverable 5.2 [4], pointed out that the unsprung mass is the single most important vehicle design parameter directly influencing the generation of ground-borne vibration (parameters influencing OOR growth are important as well). One of the major factors determining the size of the unsprung mass is the drive mounting arrangement. This section will present some different drive concepts and alternative drive suspensions for railway vehicles. As the main objective of RIVAS is to reduce ground vibration generated by mainline vehicles, here the focus will be on typical drive arrangements for metro, regional and high-speed vehicles, as well as for locomotives.
7.1.1 Definition of the mechanical drive
In this document, the mechanical drive is defined as the traction motor, the gearbox and any mechanical elements designed to compensate for relative motion between the wheelset axle and the bogie frame. The individual components are defined as follows:
The traction motor converts electrical energy into mechanical energy. The most common traction motor is a 3-phase asynchronous electrical machine, although other designs can be found. The traction motor is connected to the gear box which reduces the rotational speed of the output shaft of the motor and transfers the torque to the wheelset. Depending on the suspension concept of the drive (which is discussed in the following sections) a flexible coupling is introduced either between the motor and the gearbox or between the gearbox and the wheelset in order to compensate for any relative motion in the respective interfaces.
7.1.2 Drive suspension concepts
This section will review drive arrangement concepts in common use. It mainly focuses on transversal drive units (motor mounted perpendicular to the direction of the track) as these are by far the most common for mainline vehicles. A few words are said about other drive concepts. However, this survey has no pretention of completeness.
In Figures 7.1 to 7.3, the traction motors are illustrated by the two pink bodies inside the green bogie frame. The gearboxes are the two blue bodies which are oriented perpendicular to the white wheelset axle. The red elements illustrate flexible couplings and suspension bushings (in Figure 7.3, also the hollow shaft is marked in red).

RIVAS
SCP0-GA-2010-265754
RIVAS_CHALMERS_ WP5_D5_4_FINAL Page 60 of 81 26/2/2013
Nose-suspended drive
Nose suspended drives are riding the wheelset axle with two bearings, see Figure 7.1. The third suspension point connects the traction motor flexibly to the centre of the middle bogie beam. Alternatively, the traction motor is mounted on a tube riding the axle.
The nose suspended drive has the gearbox mass and most of the traction motor mass on the wheelset axle, which leads to a high unsprung mass. It will therefore feature a lower passenger ride comfort and is limited to low-speed applications (vehicle speeds below 100-140 km/h). As the gear ratio is limited due to lack of installation space, the traction motor tends to be large to achieve the required torque at vehicle start-up thus leading to a high total drive mass. The suspension tube on which the motor rides the wheelset axle also contributes to the high mass. The nose-suspended drives are of a simple and proven design. The limited number of rubber mountings will ensure a low life cycle cost. In general it requires little space (in lateral and vertical directions) and dismounting of the motor is possible.
Figure 7.1. Nose suspended drive arrangement
Semi-suspended drive
The semi-suspended drive, sometimes also called partly-suspended, features a traction motor mounted on the bogie middle beam according to Figure 7.2. The gearbox is riding on the wheelset axle and is connected to the bogie by a reaction rod to prevent rotation of the gearbox. The relative movements between the axle (with the gearbox) and the traction motor (suspended to the bogie frame) are allowed for by a flexible coupling.
Figure 7.2. Semi-suspended drive arrangement

RIVAS
SCP0-GA-2010-265754
RIVAS_CHALMERS_ WP5_D5_4_FINAL Page 61 of 81 26/2/2013
The semi-suspended drive has the gearbox connected directly to the wheelset axle while the motor is completely sprung by the primary suspension. The semi-suspended drives have low unsprung mass and are adapted to high speed applications. The motor will be subjected to less stress, as the shock and vibrations induced at the wheel-rail contact will be partly attenuated by the primary suspension.
The semi-suspended drives are of simple and proven designs. They need large lateral space, as the coupling has to be fitted on the traction motor output shaft. Semi-suspended drives are not appropriate for bogies with inboard bearings as such bogies offer less space inside the bogie frame. The traction motor is easily maintained, as the coupling can be dismounted and the traction motor replaced without the whole wheelset having to be dismounted.
Fully-suspended drive
In a fully suspended mechanical drive, the traction motor and the gearbox are forming one unit and the gearbox is directly flanged to the motor, see Figure 7.3. The relative movements between wheelset and drive are compensated by a hollow shaft. The fully-suspended drives always feature a two-stage gearbox.
The fully-suspended drive has all of its mass sprung by the primary suspension, and thus leads to a lower unsprung mass. As for the semi-suspended drive, the fully-suspended drive will be subjected to less stress in terms of shock and vibrations compared to the nose-suspended drive. The fully-suspended designs are more appropriate for applications with critical mass management, such as high-speed trains, double-deck trains or trains with Jacob bogie design. The initial cost of a fully-suspended drive is usually high due to the need of a two-stage gearbox and a hollow shaft coupling. The life cycle costs can be high due to the coupling via rubber bushings. The flanged design of the fully-suspended drive makes dismounting of only the motor impossible. Any significant maintenance operation will involve the dismounting of the wheelset as a whole.
Figure 7.3. Fully suspended drive arrangement

RIVAS
SCP0-GA-2010-265754
RIVAS_CHALMERS_ WP5_D5_4_FINAL Page 62 of 81 26/2/2013
7.1.3 Other drive arrangement principles
This section describes two less common drive principles which both have a significant effect on the unsprung mass.
Cardan shaft
A cardan shaft driven vehicle will have one traction motor mounted underfloor outside of the bogie area which is linked to the wheelset via a longitudinal output shaft, see Figure 7.4. The torque is transmitted via an axle mounted gearbox which is also mounted to the bogie middle beam. The cardan shaft is linked to the traction motor output and the gearbox by flexible couplings.
In a cardan shaft arrangement the traction motor is suspended by the secondary suspension. This application is only possible for high floor trains, as the motor will require space under the car body.
Figure 7.4. Cardan drive arrangement
Wheel hub motor
A wheel hub motor features a traction motor directly flanged on the wheel, see Figure 7.5. There is no gearbox. The motor shaft is also the wheelset axle.
The wheel hub drive arrangement will lead to a higher unsprung mass as the traction motor is directly mounted on the wheel. This arrangement is only used in very low speed applications such as tramways.
Figure 7.5. Wheel hub drive arrangement

RIVAS
SCP0-GA-2010-265754
RIVAS_CHALMERS_ WP5_D5_4_FINAL Page 63 of 81 26/2/2013
Table 7.1 gives a summary of the three most common drive suspension concepts described in the previous sections. Their respective effect on the resulting unsprung mass is presented together with other related consequences of the concept choice.
Table 7.1. Summary of drive suspension concepts
Principle
Name Nose-suspended Semi-suspended Fully-suspended
Mounting
characteristics
Motor riding the axle with
bearing. Third connection
point on the bogie middle
beam
Motor suspended on the
bogie middle beam. Gear
riding the axle. Coupling
connecting both
Drive fully supported on the
bogie frame. Hollow shaft
compensating the relative
movements
Cost of drive:
initial Medium Low High
Reliability of
the drive High-Medium High Low
Dismounting
of the motor Possible Easy No
Maintenance
effort Medium Low High
Unsprung
mass High Medium Low
Needed place
Lateral: medium
Longitudinal: high
Lateral: high
Longitudinal: low
Lateral: medium
Longitudinal: low
Drive weight High Low High

RIVAS
SCP0-GA-2010-265754
RIVAS_CHALMERS_ WP5_D5_4_FINAL Page 64 of 81 26/2/2013
7.1.4 Indicative impact of drive concept on total mass and unsprung mass
The figures presented in Table 7.2 are from an investigation of the drive concept for a new regional vehicle for operation up to 160 km/h. The considered drive designs were fully suspended or partly suspended. Note that the unsprung mass is part of the total mass.
Table 7.2. Comparison of two drive suspension concepts with respect to mass
Total mass Fully suspended Semi suspended
Gearbox 640 kg 325 kg
Motor 640 kg 725 kg
Coupling 0 kg 40 kg
Torque reaction rod 0 kg 68 kg
Frame 0 kg 300 kg
Total weight per bogie 1280 kg 1458 kg
Unsprung mass Fully suspended Semi suspended
Vertical 55 kg 260 kg
Lateral 55 kg 340 kg

RIVAS
SCP0-GA-2010-265754
RIVAS_CHALMERS_ WP5_D5_4_FINAL Page 65 of 81 26/2/2013
7.1.5 Drive concepts
When designing the drive system for a new railway vehicle, several decisions regarding the conceptual design have to be made. These decisions are made based on alternatives which are more or less proven solutions and commonly used in already existing vehicles. In the end, the selected drive system will be influenced by a number of factors such as cost, mass, maintainability and noise emission which in turn are governed by a large number of parameters. In Table 7.3 some of these parameters are collected without striving for completeness. The purpose of the table is merely to illustrate the complexity of the problem and hence no detailed descriptions are given.
Table 7.3. Parameters influencing the drive system design
General vehicle data Mechanical and geometrical conditions
Motor design Commercial aspects
Wheel diameter Axle movements - primary and secondary (static and dynamic)
Maximum motor speed Procurement cost
Axle load Geometry of the wheelset axle
Maximum addendum diameter of the gear wheel
Life Cycle Cost (LCC)
Maximum vehicle speed
Ground clearance Gear ratios / central distance
Reliability, Availability, Maintainability and Safety
Force-speed / torque speed diagram (load, initial acceleration, residual acceleration at maximum speed)
Wheel gauge Motor size - outer diameter of the lamination
Standardisation matters: use of proven techniques, supplier preferences, modularity, e.g. vehicle families
Load cycle Bogie concept Cooling concept Energy consumption (sometimes included in the Life Cycle Cost)
Allowed wheel diameter difference
Available fitting space (floor height, brake arrangement, ...)
Number of pairs of poles
Ambient conditions (temperature range, track quality, dirtiness of the environment)
Number of stator slots
Application (locomotive, electrical multiple unit, …)
Drive arrangement type

RIVAS
SCP0-GA-2010-265754
RIVAS_CHALMERS_ WP5_D5_4_FINAL Page 66 of 81 26/2/2013
When designing the cooling of the traction motor, primarily two different concepts are applied: a self-ventilated traction motor or a forced ventilated motor. The self-ventilated motor features a fan mounted directly on the motor shaft, while a forced ventilated traction motor has a separate fan mounted either on the roof or under the floor of the car body. In the latter case, the air is brought to the traction motor through ducts.
One of the main advantages of the self-ventilated motor is the easier integration in the vehicle design. With the fan mounted directly on the motor shaft no separate cooling fan is necessary and no air ducts are required (these two additional parts require space and increases the total mass of the system). However, the unsprung mass will increase due to the additional mass of the fan on the motor. The self-ventilated solution is considered to be more reliable when it comes to the operation of the fan. As long as the motor is running, the fan will be spinning.
The fan of a self-ventilated motor will always rotate with the same rpm as the motor. At high rpm’s this could create a lot of fan noise which partly is avoided with the forced ventilated motor. With a separate cooling fan, the cooling power can be adapted independently of the motor rpm and hence be kept as low as possible. Another advantage of the forced ventilated motor is that the cooling air can be taken from a place where it is cleaner compared to the air in the bogie area. This means that the motor is subjected to less dirt.
The most common motor used for railway vehicles is the asynchronous electrical motor. However there are alternatives and one of them, which is relatively new in commercial application, is the permanent magnet motor. This motor allows for a higher power to mass and volume ratio and it is hence used for trains where high power traction is needed and the allocated space is limited. Concretely, it is often used to allow for the installation of self-ventilated or water cooled drives for high power application. For a given motor power and motor cooling concept, the unsprung mass of the drive is therefore lower compared with the asynchronous motor. Furthermore the permanent magnet motor requires having only one traction converter per motor and not two or four converters per motor as is usually designed for the asynchronous drive. This will affect the total mass of the vehicle but not the unsprung mass.
The total mass of all drive related equipment on a train will depend on the general concept of how the train is powered. When using a locomotive to haul a number of coaches, the heavy drive of the locomotive will contribute to a high unsprung mass of the locomotive while the unsprung mass of the coaches will have no contribution from the drive. On the other hand, trains with all bogies motorised will have more drives and therefore normally higher total mass (and unsprung mass). As smaller drives can be installed in each bogie, this concept is beneficial in terms of reducing the maximum unsprung mass associated with one single bogie. The total unsprung mass of the entire train will however be higher.
When deciding the concept of the gearbox, primarily two main alternatives are at hand: the one-stage gearbox and the two-stage gearbox featuring an intermediate pinion as illustrated in Figure 7.6.
Two-stage gearboxes are installed in bogies where the vertical and lateral space is limited. It is the standard design of fully suspended drives. These gearboxes are more complex, noisier and feature higher mass which leads to a higher unsprung mass in the case of a semi-suspended drive. One-stage gearboxes are usually more robust, quieter and lighter, however they require more space.

RIVAS
SCP0-GA-2010-265754
RIVAS_CHALMERS_ WP5_D5_4_FINAL Page 67 of 81 26/2/2013
Figure 7.6. Scheme of a two-stage gearbox
7.2 REDUCTION OF UNSPRUNG MASS – CONTRIBUTION
FROM WHEELSET
The wheelset mass will constitute the major part of the unsprung mass (at least for a fully-suspended drive). Considering that the conceptual design of a wheelset is rather fixed (two wheels rigidly connected by an axle), the possible design modifications are mostly related to the wheel and axle geometry and the selection of material. This section will assess various wheelset designs and give an indication of their respective impact on the unsprung mass.
7.2.1 Axle
In Europe, the selection of steel grade to be used in the manufacturing of a wheelset axle is regulated by the EN 13261 [26] and EN 13260 [27]. Two materials (called A1N and A4T) are defined in terms of chemical and mechanical characteristics including the fatigue limits of different parts of the axle, the body, the press fitted areas, the journals and the internal bore.
Based on different levels of fatigue resistance, the use of A4T instead of A1N can allow for a mass reduction of about 11 %. For example, replacing a typical A1N trailer axle (fatigue limit 200 MPa, weight 505 kg) with an A4T axle (fatigue limit 240 MPa, weight 455 kg) leads to a saving of 50 kg.
A further possibility is to make a bore in the axle. A typical bore diameter of 65 mm gives a mass reduction of 50 kg. The bore is also normal practice on modern axles (especially in high-speed applications) for in-service NDT (non-destructive testing) inspection using the so-called ultrasonic bore probe.
For high-speed vehicles, developed starting from the early 1990’s, alloy steel grades were used in order to reduce mass. One of these materials successfully used for the Pendolino trains, developed by former Fiat Ferroviaria (now Alstom), is the 30NiCrMoV12 (fatigue limit 300 MPa). The use of this material would enable a further reduction of 11 %. In the example above, the axle weight would be 397 kg saving 120 kg. Further, if the axle has a 65 mm bore, the mass would become 347 kg. A summary of possible mass reductions by applying different materials is presented in Table 7.4.
The use of alloy steel grade designs leads to higher stresses in the axle surface and the crack propagation speed will be higher. This means that appropriate surface corrosion and impact protection (as from flying ballast or ice) and periodic NDT inspection need to be applied. Increasing the mechanical resistance also increases the cost. In practice, periodic NDT inspection (especially through the axle bore) has become normal practice for all new passenger vehicles. However, the definition of inspection interval in relation to axle steel grade and actual loading conditions has not yet been standardised. For this reason, intervals used at present tend to be quite conservative. On the other hand, improvements have been made in the technology for protecting axles from high power
Gearbox

RIVAS
SCP0-GA-2010-265754
RIVAS_CHALMERS_ WP5_D5_4_FINAL Page 68 of 81 26/2/2013
impacts by using a special coating that significantly reduces the probability that surface defects will generate and grow into fatigue cracks.
From the point of view of geometry optimisation, some mass reduction may be obtained by designing axles with a conical profile between the wheels (smaller diameter at the axle centre). This optimisation is not common and the mass reduction may be around 10 to 20 kg.
Table 7.4. Possible axle mass reductions by use of different materials
Steel grade Body fatigue limit (MPa)
Axle type Mass (kg) % mass reduction
A1N 200 Solid axle 505
Bored axle 455 10%
A4T 240 Solid axle 455 10%
Bored axle 405 20%
30NiCrMoV12 300 Solid axle 397 21%
Bored axle 347 31%
7.2.2 Wheel
In Europe, the selection of steel grade to be used in the manufacturing of a wheel is regulated by the EN 13262 [28]. Here the materials ER6, ER7, ER8 and ER9 are defined in terms of chemical and mechanical characteristics, but the fatigue limit (to be verified) is the same for all materials (240 MPa). The reason is that steel grade is normally selected according to experience from service related wear and RCF (rolling contact fatigue) performance and a precise characterisation of the fatigue limit is not yet available.
The design of a solid wheel is regulated by the EN 13979 [29]. In the design calculation, static loads multiplied by dynamic magnification factors are applied. The evaluation of the equivalent fatigue stress amplitudes on the wheel web surface is made using finite element models. Since the fatigue limit is independent of the material used, the only way to reduce the wheel mass is to perform an optimisation of the geometry (normally of the web) but the benefit is normally limited to 5 - 10 % . The typical mass of a high-speed passenger wheel with 920 mm diameter is 350 kg, while a design optimisation could reduce it to 310 kg. Before the EN standard for wheel design was issued, the safety margins could be lower depending on the designer’s experience and similar wheels were designed with a mass of about 280 kg. This procedure is no longer possible.
The wheel mass can be reduced considerably by reducing the rim radial thickness, but this is against the need to have a certain rim wear thickness in order to guarantee a required life of the wheel. Normally the wear thickness ranges from 20 to 35 mm depending on the requirements of the railway operator. Depending on service conditions, the wheel can lose about 5 mm between each reprofiling, including actual wear achieved in service and the loss of thickness that is needed during reprofiling in order to restore the new profile geometry. The running distance between reprofilings is dependent on the service conditions (loading, curve distribution, track conditions, cold or wet

RIVAS
SCP0-GA-2010-265754
RIVAS_CHALMERS_ WP5_D5_4_FINAL Page 69 of 81 26/2/2013
weather) and ranges from 100 000 km in bad conditions to 350 000 km in good conditions. Thus, good service conditions can allow for a reduction of rim radial thickness and wheel mass.
Wheel diameter reduction may also be a solution but this is always defined by the vehicle designer. The range of wheel diameters are normally defined depending on axle load. High-speed and passenger vehicles typically have diameters of 890 or 920 mm, locomotives between 1000 and 1200 mm and lower weight vehicles between 850 and 700 mm. Trams have smaller wheel diameters (500 - 600 mm).
7.2.3 Negative consequences of mass reduction
Possibly, it can be expected that a lighter wheel will generate larger vibration amplitudes at high frequencies and radiate more air-borne noise. For wheels with the same mass, experience shows that wheels with a straight web will radiate less noise than wheels with a curved or bent web. Various solutions exist to reduce wheel noise (by damping devices). These solutions will increase the cost (and mass) but at least for high-speed vehicles they are a requirement as new vehicles have to comply with the TSI noise limits.
There is no experience indicating that light-weight wheelsets would produce more OOR.
7.3 REDUCTION OF WHEEL OOR WITH RESPECT TO
VEHICLE DESIGN
This section contains a technology assessment of vehicle design parameters which may have an influence on generation and growth of wheel out-of-roundness (OOR). According to D5.2 [4], OOR is one of two key vehicle factors leading to the generation of ground vibration. The technology assessment considers design changes on bogie and/or vehicle level which potentially could reduce the growth of OOR. The assessment includes
• Systems which may influence initiation and growth of OOR • Interaction with mechanisms driving OOR growth • Potential design modifications which could contribute to reduction of OOR growth • Conflicts between various design targets
o Noise & vibration o Structural integrity, vehicle dynamics, aero-/thermo-dynamics, mass, space, etc.
• Cost (manufacturing and LCC) of any identified vehicle design improvement mitigating OOR
Long-term investigations and research projects on OOR growth have previously been carried out in e.g. Germany and Switzerland, involving DB and SBB. These projects did not lead to any clear conclusions regarding the mechanisms driving the growth of wheel OOR, and thus in many cases the causes for OOR growth remain unknown. In the following, observations from field measurements and the experience of RIVAS members are discussed.
The ground vibration measurements on Swiss track performed by SBB and evaluated in RIVAS have shown significant ground vibration generated by freight locomotives of the types Re420, Re474 and TRAXX. As discussed in D5.2 and in Section 5.1.1, the vibration spectra are dominated by two excitation mechanisms: the sleeper passing frequency (for all vehicles) and the wheel OOR (large spread between different wheels). In contrast, the Re460 locomotives do not generate severe ground vibrations related to wheel OOR while vibration generated at sleeper passing frequency are at levels comparable to other locomotive types.

RIVAS
SCP0-GA-2010-265754
RIVAS_CHALMERS_ WP5_D5_4_FINAL Page 70 of 81 26/2/2013
It appears that even when operated in Swiss transalpine freight traffic, the Re460 locomotives (with sinter block tread brakes, fully-suspended drive and curve friendly cross coupled wheelsets) reach very long wheel reprofiling intervals. This is only possible with very slow or no OOR growth. In similar operation, the older Re420 locomotives (with cast iron block tread brakes, semi-suspended drive and conventional axle guidance) seem to have much faster OOR growth of mainly the 14th order. This is probably also the reason for the comparably short reprofiling intervals.
The locomotives currently used in Swiss transalpine freight traffic, Re474 and TRAXX (with disc brakes, nose suspended drive and conventional axle guidance with longitudinal dynamic stiffness 53 kN/mm), generate a wide range of ground vibration levels at frequencies corresponding to a wavelength of about 270 mm. OOR measurements on some of these locomotive wheels confirm amplitudes and wavelengths with a wide spread of OOR levels of predominantly the 14th order. One fundamental question arising from these observations is what is the cause of the OOR growth?
Vehicle system and design parameters that might affect OOR growth are discussed below, as well as associated conflicting requirements from various areas.
7.3.1 Traction
Freight locomotives need to apply high traction forces also under conditions with low wheel‒rail friction. This inevitably leads to high longitudinal creepage in the wheel-rail contact. In order to generate a high traction bound, an increased wheel tread roughness is often aimed for and achieved through tread braking or (on locomotives without tread brakes) by applying high traction forces which generate high longitudinal creepage. It is possible that operation with high longitudinal creepage accelerates the growth of wheel OOR.
7.3.2 Braking
While tread brakes with cast-iron blocks are known to generate high wheel roughness levels at short wavelengths inducing rolling noise, their effect on OOR growth at longer wavelengths is less evident. The abrasion of the wheel tread by tread brakes with sinter blocks (if applied) could even be imagined to reduce OOR growth. Insufficient brake control can generate wheel flats.
7.3.3 Axle guidance (curving ability)
The design of the axle guidance is usually determined by vehicle dynamics, aiming at a best compromise (in case of a conventional design) between running stability and curving ability. The axle guidance stiffness consists of the effective axle guidance itself (taking the kinematics into account) and typically the longitudinal stiffness of the primary springs. Unconventional active or passive concepts of axle guidance include cross coupling of the wheelsets in a bogie (e.g. SBB Re460), steered wheelsets via a mechanical rod transmission of the car-body versus bogie steering angle (e.g. SBB ICN), steered individual wheelsets or steered independent wheels (e.g. Talgo Pendular), actively controlled steering of wheelset or independent wheels.
The use of soft (conventional design) axle guidance in small radius curves, where there is insufficient difference of the effective wheel radii in a wheelset, may lead to the generation of OOR, and possibly also to the growth of rail roughness of the corresponding wavelength if the traffic is uniform (several vehicles of the same type operating on the track), e.g. freight wagons or LRV’s. For a given combination of wheel load and wheel-rail friction coefficient, a softer axle guidance is more critical for this rail roughness generation mechanism because of the higher energy released during the slip phase. The corresponding maximum force in the axle guidance (reached at the end of the stick phase in the wheel-rail contact) is proportional to the axle guidance stiffness and

RIVAS
SCP0-GA-2010-265754
RIVAS_CHALMERS_ WP5_D5_4_FINAL Page 71 of 81 26/2/2013
deflection, while the stored energy released during the short slip phase is proportional to the axle guidance stiffness and the square of the deflection. Accordingly for given axle load and wheel-rail friction characteristics, the abrasive energy in the wheel-rail contacts is proportional to the inverse of the effective axle guidance stiffness.
The long wavelength rail roughness generated by this mechanism might also lead to OOR of the corresponding wavelength on other vehicles, e.g. with stiffer axle guidance. It can be imagined that at sections of the rail which have been affected by the described wheel slip, slip in the longitudinal or lateral direction might occur with an increased probability also on vehicles with a different axle guidance design. On vehicles with better (sufficient) curving ability, e.g. achieved by cross coupled or steered wheelsets, the OOR growth might be smaller or totally compensated for by the uniform wear and material degradation from rolling contact with lower creepage, e.g. on track without significant vertical gradients.
Bogies with cross coupled wheelsets are not only more complicated and expensive but also more prone to cause hollow wheel wear (flange growth) unless the vehicles are mostly operated on track with a high proportion of small radius curves, e.g. SBB transalpine operation.
7.3.4 Suspension stiffness and damping
The vertical stiffness and damping of the primary suspension are designed to fulfil requirements on vehicle dynamics (especially safety against derailment, roll coefficient), structural integrity and space. While the bogie bounce frequency may have some impact on ground vibration, e.g. if coinciding with the sleeper passing frequency at low speeds, it is hardly expected to generate wheel OOR. The secondary suspension level implicates frequencies much lower than those related to wheel OOR.
7.3.5 Unsprung mass (drive types)
The vibration of the unsprung vehicle mass on the track stiffness, i.e. the so-called P2 resonance, could contribute to the generation and growth of OOR. The P2 resonance has been shown to be the wavelength-fixing mechanism of several types of rail corrugation [9]. The unsprung mass also scales the ground vibration energy caused by a certain OOR.
For driven vehicles, the unsprung mass is widely determined by the selection of drive type, e.g. fully, semi/partly suspended or unsuspended drive, see Section 7.1. The drive type is mostly chosen based on criteria such as permissible wheel-rail contact forces occurring at service speed on tracks with different quality, expected life cycle cost and space restrictions.
On trailer vehicles the unsprung mass consists of the wheelset, the axle bearing/axle boxes, part of the axle guidance and primary suspension and if applicable the brake discs. The related mass and energy of P2 resonance oscillations are limited in comparison with most driven vehicles.
A further reduction of the unsprung mass would require the use of different, probably innovative, materials which can be expected to lead to higher cost but also to problems related to acceptance by authorities and customers.

RIVAS
SCP0-GA-2010-265754
RIVAS_CHALMERS_ WP5_D5_4_FINAL Page 72 of 81 26/2/2013
7.3.6 Wheel diameter
The relation between the order of the OOR and the wavelength depends on the wheel diameter. The wheel diameter is normally determined by the axle load and wheel‒rail contact forces, the maximum vehicle speed, wear rate, maintenance intervals and by the dimensions of the vehicle and the bogie. The wheel diameter can possibly be of interest for the generation of low order OOR which can be imagined to grow more if an integer multiple of the excitation wavelength corresponds to the wheel circumference. For a given wheel load, the wheel-rail contact stresses decrease by increasing the wheel diameter.
7.4 REDUCTION OF WHEEL OOR WITH RESPECT TO
WHEELSET DESIGN
7.4.1 Wheel material to reduce RCF and growth of OOR
For a given combination of line and vehicle, a best material steel grade can be selected in order to reduce RCF, wear and OOR. Apart from the standard steel grades, some manufactures have developed materials with variations in the chemical composition (for example silicon-manganese solutions) and manufacturing process. The experience from using such materials in service is positive. The main objective has so far been the increase of wheel life, but the reduction of vibration would be an interesting target for future optimisation. The cost of these improved wheels is normally higher but since their life is longer, the cost increase is not really an issue.
The generation and growth of wheel OOR can be due to:
• High initial OOR already after the wheel reprofiling. A high initial OOR may lead to faster growth of OOR.
• Wheel flats are generated by the wheel sliding on the rail due to locked brakes or insufficient wheel-rail friction. As the wheel starts rolling again, the repeated impacts of the flat over the rail may lead to further wheel tread degradation in terms of a corrugation wavelength that is generated on the rolling circle after the initial tread discontinuity. In this case, the selection of wheel steel grade only reduces the possibility for crack generation (increased material toughness).
• Non-homogeneous mechanical characteristics (hardness) around the wheel tread circumference. This can generate a variation in wear rate and possibly a sort of wheel polygonalisation. The cause for the non-homogeneous characteristics is normally introduced in the wheel manufacturing process (heat treatment).
The consequences of wheel tread cracks due to rolling contact fatigue (RCF) can be small parts of material breaking out (peats). Higher wheel-rail contact forces are generated leading to more cracking or a corrugation wear developing around the tread. Both the large peats and the OOR will induce ground vibration. Examples of RCF are illustrated in Figure 7.7. Improved steel grades can be applied to reduce RCF. Lucchini RS has introduced the so-called Superlos steel grade, which is a pearlitic silicon and manganese carbon steel derived from the standard R8T. The chemical composition of R8T and Superlos are compared in Table 7.5. The use of Superlos increases impact toughness and fracture toughness, see Figure 7.8.

RIVAS
SCP0-GA-2010-265754
RIVAS_CHALMERS_ WP5_D5_4_FINAL Page 73 of 81 26/2/2013
Table 7.5. Comparison of chemical composition in R8T and Superlos wheel steel grades
Grade Of Steel Elements
C Max
Si Max
Mn Max P Max S Max
Cr Max
Cu Max
Mo Max
Ni Max
V Max
Cr + Mo + Ni Max
R8T - 0.56 0.40 0.80 0.040 0.040 0.30 0.30 0.08 0.30 0.05 0.60
SUPERLOS
Min (%) 0.49 0.60 0.60 - - - - - - - -
Max (%) 0.56 1.10 1.10 0.020 0.015 0.30 0.30 0.08 0.30 0.08 ≤0.50
Parts of tread material fallen off from growing cracks
Figure 7.7. Examples of wheel tread damage due to RCF

RIVAS
SCP0-GA-2010-265754
RIVAS_CHALMERS_ WP5_D5_4_FINAL Page 74 of 81 26/2/2013
Figure 7.8. (left) Diagrams of impact toughness tests at 20 and -20 °C and (right) fracture toughness tests for Superlos and ER8 steel grades
7.4.2 Influence of traction/braking control on unsprung mass and OOR growth
Braking systems not working correctly can lead to wheel sliding and the generation of wheel flats. Field experience has shown that variations (waves) of material degradation along the wheel tread can emanate from a small local tread defect such as a wheel flat. Increasing rolling distance leads to further irregular wear. The only solution is then to reprofile the wheels.
Similar problems can occur for powered wheelsets and are normally related to poor traction control. In particular, when the rail is wet (low wheel-rail friction) the wheel may start to slide and then to vibrate at the wheelset first torsional frequency that normally is around 70 - 80 Hz. This situation can also lead to high stresses in the axle.
Both issues must be solved by improving the control system of the brake or the traction.
7.4.3 Reduction of OOR in manufacturing and maintenance operations
According to EN 13262, for a new wheel the initial OOR should be below 0.1 mm (intended as the difference between the maximum and minimum radial deviations). For high-speed vehicles, the initial OOR may be required to be below 0.05 mm. After the assembly of the wheels on the axle the resulting OOR of the wheelset increases but should be below 0.3 mm (EN 13260). In order to reduce this tolerance to 0.1 or 0.2 mm, the assembled wheelset needs to be mounted on a lathe for reprofiling of the wheels. This operation introduces an extra cost in the manufacturing process. Nevertheless this machining operation (reprofiling) is performed several times during the life of the wheelset.
The reduction of the OOR tolerance after machining should extend the period until the OOR grows to a level at which the induced vibrations are not acceptable.
A survey is suggested where some railway operator maintenance depots are visited to verify the actual tolerances applied and the possibility to actually reduce them with the available machines. Then, by periodically repeating OOR measurements of the wheels in service, the results could be compared to investigate the influence of initial tolerance on the actual level of OOR obtained after different running distances.
0
5
10
15
20
25
30
35
Superlos ER8
Joul
e
Steel grade
KCU and KV - Comparative diagramKCU KV
KCU +20°C KV -20°C
0
20
40
60
80
100
Superlos ER8
MP
a√m
Steel grade
Kq - Comparative diagram
Kq

RIVAS
SCP0-GA-2010-265754
RIVAS_CHALMERS_ WP5_D5_4_FINAL Page 75 of 81 26/2/2013
7.4.4 Resilient wheels
Resilient wheels are today a standard product for trams. For such vehicles, considerations in relation to ground vibration are different from those of conventional trains. The tram speed is lower (50 km/h) and the influences of unsprung wheelset mass and OOR are probably less important. Nevertheless ground vibration is an important issue due to the fact that trams run very near to houses and buildings.
Resilient wheels will not enable any significant total mass reduction but will reduce unsprung mass, dynamic wheel-rail contact force and transmission of vibrations to bogie, car body and track.
Resilient wheels with a radial stiffness of 150 kN/mm are a normal application for trams and metros but not for heavier or faster vehicles.
For urban applications, some new wheel designs are being developed to further reduce the radial stiffness (for example from 150 kN/mm to 30 kN/mm). The reason for such a requirement was to increase the suspension and damping function already at wheel level as the space available for a common primary suspension was limited due to the characteristic low floor design of the coach that sacrifices the development of the bogie. The introduction of very low stiffness resilient wheels is today limited due to technical problems related to the rubber elements that make them less reliable after long-time service. Nevertheless investigations to improve such components are on-going and it would be interesting to study how this level of low stiffness may influence the reduction of ground vibration.
7.5 COST ASPECTS
Estimations of the influence of wheelset design and material selection on mass reduction and market cost are presented in Tables 7.6 and 7.7. Note that the actual cost may be different depending on various reasons. The higher cost for alloy steel grade is partly due to the fact that not many manufacturers produce this type of axles and the use is not as common as for A4T.
The cost implications will always play a crucial part when designing a new railway vehicle. This cost does not only concern the initial cost of purchasing a vehicle but also the maintenance cost throughout the life of the vehicle. Commonly customers require the vehicle manufacturer to calculate the life cycle cost (LCC) of the vehicle, sometimes including the energy consumption. This leads to a better transparency of the costs and enables the comparison between e.g. less expensive design solutions associated with higher maintenance costs and more expensive designs with a smaller need for maintenance.
Some of the different design alternatives reviewed in this technology assessment will affect primarily the initial cost of the vehicle while others will influence more the cost in operation. When comparing the material and manufacturing costs of the three different drive suspension concepts, nose-, semi- and fully-suspended it can generally be stated that the differences are fairly small compared to the total price of the vehicle. Furthermore bearing in mind the 30 years of expected life of the vehicle, the extra cost for the two-stage gearbox and hollow shaft which are needed for the fully-suspended drive appears to be even less significant. In other words, the fully-suspended solution which is the most expensive one would give the extra benefits of high ride comfort, less ground vibration and a more protected motor at a reasonable extra cost. In some cases this solution is however discarded due to the higher maintenance cost caused by the extra wearing parts in terms of rubber bushings and the more complicated maintenance.

RIVAS
SCP0-GA-2010-265754
RIVAS_CHALMERS_ WP5_D5_4_FINAL Page 76 of 81 26/2/2013
Table 7.6. Estimation of market cost for different axle designs
Steel grade Fatigue limit [MPa]
Axle type Mass [kg] Mass reduction [%]
Axle cost increase [%]
A1N 200 Solid 505 0 0
Bored 455 10 20
A4T 240 Solid 455 10 40
Bored 405 20 70
Special high strength alloy
steel grade
300 Solid 397 21 225
Bored 347 31 250
Table 7.7. Estimation of market cost for different wheel designs
Wheel cost increase [%]
Diameter [mm]
Steel grade 700 - 850 890 - 920 1000 - 1200
ER7 - 9 0 37
ER8 3
ER9 7
Anti RCF steel grade 20
Resilient wheel 230
The forced-ventilated concept requires a separate cooling fan and ducts which increases the cost. The self-ventilated motor is at the same time considered to be more reliable implicating less maintenance cost. The self-ventilated concept is therefore in many cases considered the cheaper alternative both in terms of initial cost and LCC. In that situation it can be challenging to motivate a different design.
Requirements on ground vibration emissions will be considered secondary compared to requirements on e.g. vehicle speed. Often when choosing the overall vehicle concept only the main vehicle specifications are considered while other requirements on e.g. noise and vibrations are dealt with at a later stage. Fulfilment of all the requirements put by the customer will generate an expensive vehicle and the requirements will therefore be considered in an order corresponding to their respective importance to either the customer or the relevant legislation. The manufacturer will strive for a balance between a high performance product and an affordable product and hence the definition of what is considered high performance will be governing. Optimisation of the vehicle to reduce ground vibration will in many cases increase the cost of the vehicle and can only be motivated by a strong emphasis on the topic by the customer or the legislation. At the same time it is crucial to identify the main problem of the vehicle-track-ground system in order to reduce the vibration emissions at the lowest cost possible.

RIVAS
SCP0-GA-2010-265754
RIVAS_CHALMERS_ WP5_D5_4_FINAL Page 77 of 81 26/2/2013
8. DISCUSSION AND CONCLUDING REMARKS
It was concluded in previous RIVAS WP5 deliverables, see D5.1 and D5.2, that unsprung wheelset mass and wheel out-of-roundness (OOR) are key vehicle parameters having a significant influence on the generation of ground vibration.
In this RIVAS WP5 deliverable, an overview of present knowledge on causes for OOR growth has been presented. Various types of OOR have been classified and discussed. Suggested mitigation measures include more wear resistant wheel materials, optimisation of braking systems, improved process for wheel profiling with stricter tolerances and improved bogie steering.
The ground vibration measurements on Swiss track performed by SBB have been further evaluated. Based on these field measurements and simulations presented here and in D5.2, it is concluded that vibration spectra are dominated by two mechanisms: the sleeper passing frequency and the resonance frequency of the unsprung mass on the track stiffness (sometimes referred to as the P2 resonance). Significant levels of ground vibration are generated by locomotives of the types Re420, Re474 and TRAXX. Several wheels on these locomotives have large levels of OOR although there seems to be a large spread between different wheels. According to Table 5.1, the unsprung mass of TRAXX and Re420 is 4500 kg and 3200 kg, respectively. The Re420 has a semi-suspended drive. In contrast, the Re460 locomotives do not generate severe ground vibrations related to wheel OOR (at least outside the range of the sleeper passing frequency), while vibration generated at sleeper passing frequency are at levels comparable to other locomotive types. The Re460 reaches long reprofiling intervals due to the low OOR growth, has a fully-suspended drive and a significantly lower unsprung mass of 1900 kg.
Based on the simulation results, it is concluded that the most effective means to reduce ground vibration by vehicle optimisation is minimising the unsprung mass as this increases the vehicle receptance in a wide frequency range. The influence of wheelset resonances in bending seems to be negligible. Reducing the stiffness of the primary suspension could have a positive effect in reducing ground vibration for soils where the free field mobility is high at frequencies near the wheelset resonance on the primary suspension (such as for the Furet site). No consistent conclusions can be drawn for the influence of wheelset and bogie distances on ground vibration as the results seem to vary from one combination of vehicle speed and track irregularity profile to another. Also, note that modifying the properties of the primary suspension and/or the wheelset and bogie distances may simply shift the problem of ground vibration from one octave band to the next.
From these observations, it is concluded that wheels with OOR containing wavelengths that for a given vehicle speed excite the track at the P2 resonance frequency (or at any frequency with high ground mobility) will amplify the ground vibration in this frequency range. Reducing the unsprung mass will reduce the dynamic stiffness of the vehicle at the wheel‒rail contacts (and also shift the P2 resonance to a higher frequency). In the frequency domain, it can be shown that the wheel‒rail contact forces are proportional to the product of the dynamic stiffness of the coupled vehicle‒track system and the frequency spectrum of the wheel/rail irregularities. Thus, vehicles with high unsprung mass and severe OOR with wavelengths that for the given line speed excites frequencies at the P2 resonance will generate high wheel‒rail contact forces. If in addition the ground mobility is high in this frequency range severe ground vibration can be induced.
The technology assessment has shown that a reduction of unsprung mass is possible. However, any design change can only be carried out after a careful consideration of the overall performance of the bogie and its subsystems. The unsprung mass of a powered wheelset primarily consists of the wheelset mass and part of the drive system mass. A reduction of the wheelset mass will directly translate to the same reduction in unsprung mass, while the effect of the drive system will to a large

RIVAS
SCP0-GA-2010-265754
RIVAS_CHALMERS_ WP5_D5_4_FINAL Page 78 of 81 26/2/2013
extent depend on the drive suspension concept. The conceptual design of a bogie is carried out at an early stage in the vehicle design process and hence a low unsprung mass has to be a pronounced design target from the very beginning.
With a combination of a lighter wheelset material, wheel geometry optimisation and a bore hole in the axle, a reduction of about 250 kg per wheelset is achievable. According to Table 7.2, the selection of a fully suspended-drive instead of a semi-suspended one could lead to an additional reduction of about 200 kg. The combined mass reduction of these measures is in the same range as the difference between the high and low levels of unsprung mass used in the simulations The calculated effect on ground vibrations can therefore be considered as an indication of the effectiveness of these design changes, i.e. a reduction of 1 to 2.5 dB can be expected on the overall RMS level (2-200Hz).
To sort out the influence of bogie design on unsprung mass is definitely an easier task compared to describing its influence on OOR growth. Indications can be seen on the influence of e.g. wheel material, traction, braking system and radial steering. However, the understanding of OOR generation and growth is a challenge that despite several extensive research projects in the past have not yet been solved.
8.1 NEXT STEPS – FIELD TESTS
In 2013, further field tests are planned in WP2/WP5. Three vehicle design parameters (wheel material, steering bogie, unsprung mass) that may influence wheel OOR are discussed in Section 4.2. For a small selection of freight locomotives (Re420/TRAXX) and freight wagons, tests are planned to study the influence of the three parameters on OOR generation and growth. For the selected vehicles, the tests will include OOR measurements in workshops at different times using an instrument for direct measurement of deviation from nominal wheel radius around the wheel circumference. Also, frequent measurements of wheel-rail contact force and ground vibration induced by the selected wheels at existing Swiss test sites will provide further indications and statistical data on the growth of wheel OOR (these data are also important as input to wheel OOR maintenance planning). The measurements will lead to a better understanding of the influence of the three vehicle design parameters and finally vehicle design recommendations can be given. It is suggested that Lucchini performs measurements to examine the influence of wheel material on OOR growth.
Improvements in maintenance procedures will be studied in WP2. A survey is suggested where some railway operator maintenance depots are visited to verify the actual tolerances applied and the possibility to actually reduce them with the available machines. Then, by periodically repeating OOR measurements of the wheels in service, the results could be compared to investigate the influence of initial tolerance on the actual level of OOR obtained after different running distances.
9. ACKNOWLEDGEMENTS
The input files to TRAFFIC were developed in collaboration with Stijn Francois and Geert Lombaert, Katholieke Universiteit in Leuven.

RIVAS
SCP0-GA-2010-265754
RIVAS_CHALMERS_ WP5_D5_4_FINAL Page 79 of 81 26/2/2013
10. REFERENCES
[1] J G Walker, G S Paddan, M J Griffin, RENVIB II Phase 1 – UIC Railway Vibration Project, State of the Art Review, 1997
[2] X Sheng, C J C Jones, D J Thompson, A theoretical model for ground vibration from trains generated by vertical track irregularities, Journal of Sound and Vibration 272(3-5) (2004) 937-965
[3] A Mirza, J C O Nielsen, P Ruest, Train induced ground vibration – influence of rolling stock: state-of-the-art survey, RIVAS (SCP0-GA-2010-265754), Deliverable 5.1, September 2011, 53 pp
[4] J C O Nielsen, B Nelain, R Müller, A Frid, A Mirza, Train induced ground vibration – influence of rolling stock: important vehicle parameters, RIVAS (SCP0-GA-2010-265754), Deliverable 5.2, August 2012, 60 pp
[5] R Müller, State of the art OOR and wheel/rail mechanisms, Gleislauftechnikmüller Technical Report 07/01/12, December 2012, 103 pp
[6] ERRI B169, Standardisierung der Radsätze, Erhöhte Anforderungen an die Radlaufflächen bei den Fahrzeugen des Güterverkehrs, Studie über die Ortung von Fehlern an den Radlaufflächen von Güterwagenrädern, 2002
[7] UIC B169/DT 405: Schadkatalog Räder/Radsatzwellen/Radsätze, Teil 1: Einleitung, Terminologie, Klassierung der Fehler, Fehlerarten am Radsatz
[8] J C O Nielsen, A Johansson, Out-of-round railway wheels - a literature survey, Proceedings of the Institution of Mechanical Engineers Part F Journal of Rail and Rapid Transit 214 (2000) 79–91
[9] J C O Nielsen, R Lundén, A Johansson, T Vernersson, Train-track interaction and mechanisms of irregular wear on wheel and rail surfaces, Vehicle System Dynamics 40(1–3) (2003) 3–54
[10] J C O Nielsen, R Müller, M Krüger, T Lölgen, P Mora, P Gratacos, Classification of wheel out-of-roundness conditions with respect to vibration emission, RIVAS (SCP0-GA-2010-265754), Deliverable 2.2, August 2012, 91 pp
[11] A Johansson, Out-of-round railway wheels—assessment of wheel tread irregularities in train traffic, Journal of Sound and Vibration 293(3–5) (2006) 795–806
[12] EN 13262 Railway applications - Wheelsets and bogies - Wheels: Product requirements.
[13] K Mädler, M Bannasch, Materials used for wheels on rolling stock, Deutsche Bahn AG, Technical Centre, Brandenburg-Kirchmöser, Germany
[14] G Lombaert, G Degrande, Ground-borne vibration due to static and dynamic axle loads of InterCity and high-speed trains, Journal of Sound and Vibration, 319(3-5) (2009) 1036-1066
[15] G Lombaert, G Degrande, J Kogut, S François, The experimental validation of a numerical model for the prediction of railway induced vibrations, Journal of Sound and Vibration, 297(3-5) (2006) 512-535
RIVAS
SCP0-GA-2010-265754
RIVAS_CHALMERS_ WP5_D5_4_FINAL Page 80 of 81 26/2/2013
[16] G Lombaert, S François, G Degrande, TRAFFIC, matlab toolbox for traffic induced vibrations manual, 2011
[17] P Coulier et al, Scope of the parametric study on mitigation measures on the transmission path, RIVAS (SCP0-GA-2010-265754), Deliverable 4.1, October 2011, 90 pp
[18] ORE, Question B176: Bogies with steered or steering wheelsets, Report No 1 Specifications and preliminary studies, Volume 2: Specification for a bogie with improved curving characteristics, Utrecht, September 1989
[19] ORE, Question C116: Wechselwirkung zwischen Fahrzeugen und Gleis, Bericht Nr. 1: Spektrale Dichte der Unregelmassigkeiten in der Gleislage, Utrecht, the Netherlands, 1971
[20] N Chaar, Wheelset structural flexibility and track flexibility in vehicle-track dynamic interaction, PhD thesis, Department of Aeronautical and Vehicle Engineering, Royal Institute of Technology, Stockholm, Sweden, 2007
[21] P Meinke, S Meinke, Polygonalization of wheel treads caused by static and dynamic imbalances, Journal of Sound and Vibration 227(5) (1999) 979-986
[22] K Hempelmann, B Ripke, S Dietz, Modelling of dynamic interaction of wheelset and track, Railway Gazette International, September 1992
[23] J Lilja, Identification of a finite element railway wheel-set model, MSc thesis, Department of Applied Mechanics, Chalmers University of Technology, Gothenburg, Sweden, 2003, 62 pp
[24] B Faure, E Bongini, H Verbraken, G Degrande, G Lombaert, L Auersch, Results of the parameter studies and prioritization for prototype construction for ballasted track, RIVAS (SCP0-GA-2010-265754), Deliverable 3.2, February 2012, 171 pp
[25] R R Craig, M C C Bampton, Coupling of substructures for dynamic analysis, AIAA Journal 8 (1968) 1313–1319
[26] EN 13261, Railway application. Wheelsets and bogies. Axles – Product requirements
[27] EN 13260, Railway application. Wheelsets and bogies. Wheelsets – Product requirements
[28] EN 13262, Railway application. Wheelsets and bogies. Wheels – Product requirements
[29] EN 13979, Railway application. Wheelsets and bogies. Monobloc wheels – Technical approval procedure

RIVAS
SCP0-GA-2010-265754
RIVAS_CHALMERS_ WP5_D5_4_FINAL Page 81 of 81 26/2/2013
11. APPENDIX
Table A.1 – Technical and corresponding schematic layout of the bogies and drives
Technical drawing of three types of drive
Schematic situation
Nose suspended
TBA
Semi-suspended
Fully-suspended