transition from education to work egypt country … · transition from education to work egypt...
TRANSCRIPT
1
TRANSITION FROM EDUCATION TO WORK
EGYPT COUNTRY REPORT
by Mona Amer
ETF Working document, January 2007 [not edited]
Acknowledgments
I would like to express my gratitude to the project members from the European Training Foundation, to the international expert and to the members of the steering committee for their help, provision of documents and for their constructive comments on the first draft of this report.
European Training Foundation (ETF)
Elena Carrero Perez, Country Manager
Henrik Huitfeldt, Project Team Leader
Anastasia Fetsi, Project Coordinator
Artur Valiev, Project assistant
International expert
Walter Van Trier, Senior Researcher, Faculty of Applied Economics, University of Antwerp
Members of the national steering committee
Azza Ahmed Gheita, Vocational Training Senior Researcher / Director General (HRD expert), General Department for Vocational Training Center Affairs, Central Department for Vocational Training & HRD, Ministry of Manpower and Migration
Laila Nawar, Research Advisor, Cairo Demographic Center
Ali Sayed, Counsellor Ministry of Education International Cooperation, Director Mubarak-Kohl Initiative (MKI), Ministry of Education

2
Introduction
The Egypt country report on transitions from education to work is part of a larger project on the analysis of transition from education to work of two other ETF partner countries: Serbia and Ukraine. The objective of this study is to better understand the links between the education and training system and labour market insertion of the youth in Egypt.
The analysis of transition from education to work is of particular importance in Egypt. First, little is known on how young people1 insert into the labour market and on the implication of the labour market policies and the educational and training systems on their insertion. Second, the youth represent a very large share of the Egyptian population and very large cohorts of new entrants into the labour market leading to high pressure. Moreover, the youth and in particular highly educated young people, face the biggest difficulty to insert into the labour market as they experience high unemployment rates. This raises the issue of labour market mismatch between supply and demand and questions the role of the Egyptian educational and training system.
This study uses the conceptual framework developed by a consortium of five European research centres namely the Comparative Analysis Of Transitions from Education to Work in Europe (CATEWE). This framework aims at describing and analysing to what extent the education and training institutions and employment policies affect the outcomes of transitions from education to work. It gives a comprehensive tool to determine the main factors and their influence on the success or failure of transitions from education to work (Van Trier, 2006).
Following the CATEWE framework, the country report is divided into three parts. The first one describes the educational and vocational training system in Egypt. The main challenges and responses given by the policy makers are discussed. The second part presents an assessment of two programmes of the national youth employment programme launched at the beginning of the millennium. Finally, the third part takes advantages of two nationally representative surveys that have been carried out very recently to give more insight on the youth employment/unemployment problems and determine the characteristics of the education to work transition.
As listed below, this paper uses various sources of information:
papers and reports on the technical, vocational and educational system and on the labour market in Egypt;
statistical data from the Ministry of Education and the Ministry of Higher Education;
a report on the assessment of two components of the national youth employment programme (De Gobbi, 2005);
reports on recent surveys related to transitions from education to work such as the school-to-work transition survey (ILO, 2005); the survey assessing the impact of vocational training programs on graduates' employability (ILO, 2006) and the Cairo Demographic Centre survey on youth (CDC, 2006) and
comprehensive micro-data on the Egyptian labour market. This paper uses three comparable labour market surveys, namely the Labor Force Sample Survey of 1988 (LFSS 1988), the Egyptian Labor Market Survey of 1998 (ELMS 1998) and the very recent Egyptian Labor Market Panel Survey of 2006 (ELMPS 2006)2.
I. The Egyptian education and vocational training systems
This part describes the educational system in parallel with the vocational training system. It is divided into two main sections. The first one presents the Egyptian educational system (general, technical and
1Young people are defined in this study as those aged between 15 and 29 years old. 2LFSS 1988, ELMS 1998 and ELMPS 2006 are nationally representative surveys. The sample size is 27,631 individuals in LFSS 1988, 23,997 individuals in ELMS 1998 and 37,649 individuals in ELMPS.
3
vocational). Particular attention is given to the degree of standardisation of education and to the extent of differentiation between general and technical tracks as they may affect the outcomes of transitions to the labour market. Moreover, it presents the progress achieved during the past decade in terms of access and quality of education. The second section describes the vocational training system and points out the challenges of this system and the main responses proposed by policy makers.
1. The education system
The institutions responsible for education in Egypt are the Ministry of Education (MoE) for pre-university education and the Ministry of Higher Education for higher and university education. Four main educational levels are distinguished as described below:
pre-primary
basic education and compulsory education (9 years)3
- primary education (6 years)
- general or vocational preparatory education (3 years)
secondary education (3 years)
- general secondary
- vocational secondary
- technical secondary
higher education or tertiary education
- middle technical institutes (2 years)
- higher technical institutes (4 years)
- university (4 to 7 years)
In Egypt, the right to free education is guaranteed by the constitution and education through university is largely subsidised. Three types of school are distinguished: publicly-funded and publicly-managed schools; privately-funded and privately-managed schools; publicly-funded but privately-managed schools called Al-Azhar schools (offering religious instruction as part of the curriculum). As shown in table 1A in annex, education is largely public as more than 90% of the pupils are enrolled in public schools at all levels of education.
This high share of public schools guarantees a certain degree of standardisation at least in terms of curriculum, examinations and books used in schools. Other than in religious subjects, Al-Azhar schools offer the same curricula but examinations are somewhat different than in public schools. However, Al-Azhar education represents only 8% of total pre-university education.
3 Law 139 issued in 1981 stipulated compulsory education for 9 years, including the primary stage (6 years) and the preparatory stage (3 years). In 1988, law 233 reduced compulsory education to 8 years, 5 for primary and 3 for preparatory. Law 53 of 1999 rectified this situation by restoring the sixth primary academic year (Ministry of Education, 2003).
4
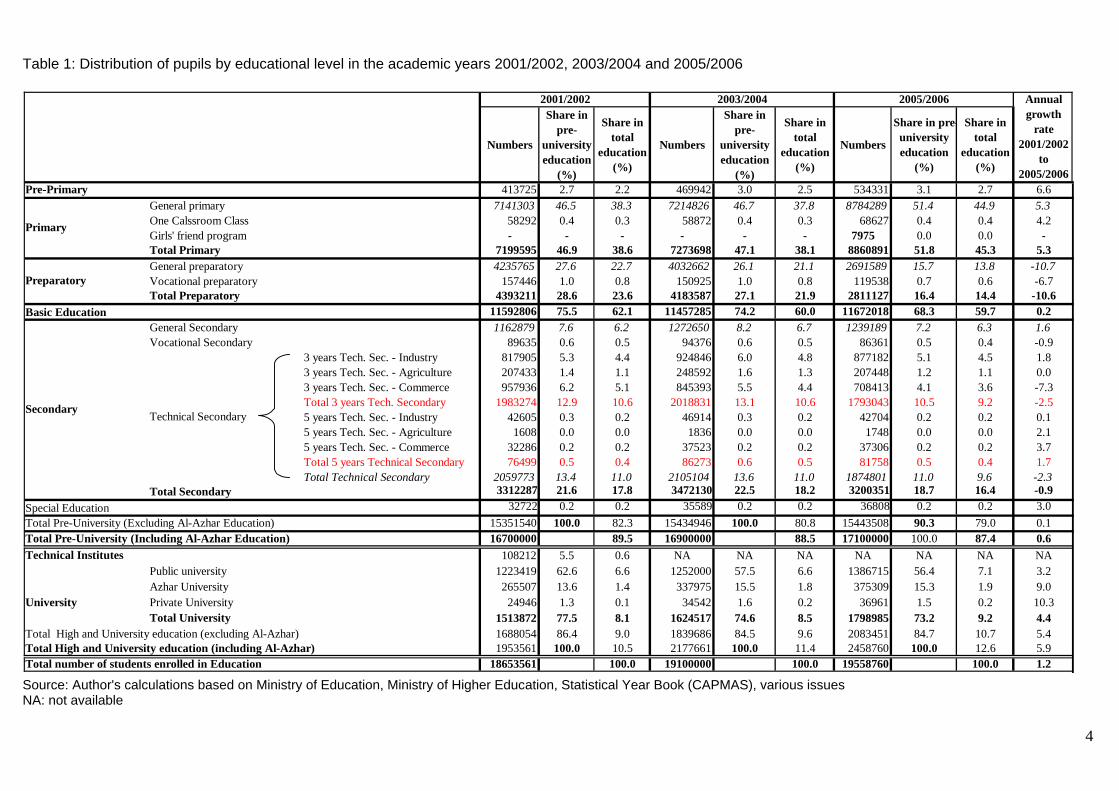
Table 1: Distribution of pupils by educational level in the academic years 2001/2002, 2003/2004 and 2005/2006
2001/2002 2003/2004 2005/2006
Numbers
Share in pre-
university education
(%)
Share in total
education (%)
Numbers
Share in pre-
university education
(%)
Share in total
education (%)
Numbers
Share in pre-university education
(%)
Share in total
education (%)
Pre-Primary 413725 2.7 2.2 469942 3.0 2.5 534331 3.1 2.7 6.6General primary 7141303 46.5 38.3 7214826 46.7 37.8 8784289 51.4 44.9 5.3One Calssroom Class 58292 0.4 0.3 58872 0.4 0.3 68627 0.4 0.4 4.2Girls' friend program - - - - - - 7975 0.0 0.0 -Total Primary 7199595 46.9 38.6 7273698 47.1 38.1 8860891 51.8 45.3 5.3General preparatory 4235765 27.6 22.7 4032662 26.1 21.1 2691589 15.7 13.8 -10.7Vocational preparatory 157446 1.0 0.8 150925 1.0 0.8 119538 0.7 0.6 -6.7Total Preparatory 4393211 28.6 23.6 4183587 27.1 21.9 2811127 16.4 14.4 -10.6
Basic Education 11592806 75.5 62.1 11457285 74.2 60.0 11672018 68.3 59.7 0.2General Secondary 1162879 7.6 6.2 1272650 8.2 6.7 1239189 7.2 6.3 1.6Vocational Secondary 89635 0.6 0.5 94376 0.6 0.5 86361 0.5 0.4 -0.9
3 years Tech. Sec. - Industry 817905 5.3 4.4 924846 6.0 4.8 877182 5.1 4.5 1.83 years Tech. Sec. - Agriculture 207433 1.4 1.1 248592 1.6 1.3 207448 1.2 1.1 0.03 years Tech. Sec. - Commerce 957936 6.2 5.1 845393 5.5 4.4 708413 4.1 3.6 -7.3Total 3 years Tech. Secondary 1983274 12.9 10.6 2018831 13.1 10.6 1793043 10.5 9.2 -2.55 years Tech. Sec. - Industry 42605 0.3 0.2 46914 0.3 0.2 42704 0.2 0.2 0.15 years Tech. Sec. - Agriculture 1608 0.0 0.0 1836 0.0 0.0 1748 0.0 0.0 2.15 years Tech. Sec. - Commerce 32286 0.2 0.2 37523 0.2 0.2 37306 0.2 0.2 3.7Total 5 years Technical Secondary 76499 0.5 0.4 86273 0.6 0.5 81758 0.5 0.4 1.7Total Technical Secondary 2059773 13.4 11.0 2105104 13.6 11.0 1874801 11.0 9.6 -2.3
Total Secondary 3312287 21.6 17.8 3472130 22.5 18.2 3200351 18.7 16.4 -0.9Special Education 32722 0.2 0.2 35589 0.2 0.2 36808 0.2 0.2 3.0
15351540 100.0 82.3 15434946 100.0 80.8 15443508 90.3 79.0 0.116700000 89.5 16900000 88.5 17100000 100.0 87.4 0.6
Technical Institutes 108212 5.5 0.6 NA NA NA NA NA NA NAPublic university 1223419 62.6 6.6 1252000 57.5 6.6 1386715 56.4 7.1 3.2Azhar University 265507 13.6 1.4 337975 15.5 1.8 375309 15.3 1.9 9.0Private University 24946 1.3 0.1 34542 1.6 0.2 36961 1.5 0.2 10.3Total University 1513872 77.5 8.1 1624517 74.6 8.5 1798985 73.2 9.2 4.4
1688054 86.4 9.0 1839686 84.5 9.6 2083451 84.7 10.7 5.41953561 100.0 10.5 2177661 100.0 11.4 2458760 100.0 12.6 5.9
18653561 100.0 19100000 100.0 19558760 100.0 1.2
Annual growth
rate 2001/2002
to 2005/2006
Total Pre-University (Excluding Al-Azhar Education)Total Pre-University (Including Al-Azhar Education)
Primary
Total number of students enrolled in Education
Total High and University education (excluding Al-Azhar)Total High and University education (including Al-Azhar)
University
Technical SecondarySecondary
Preparatory
Source: Author's calculations based on Ministry of Education, Ministry of Higher Education, Statistical Year Book (CAPMAS), various issues NA: not available
5
1.1 Trend in the distribution of enrolled pupils by educational level
Table 1 presents the evolution of the distribution of pupils by educational level in the academic years 2001/2002, 2003/2004 and 2005/2006.
First, it shows that a very large and increasing number of young people are enrolled in education. Indeed, the number of students enrolled in education reaches 19.6 million in the academic year 2005/2006 representing almost 30% of the total Egyptian population. Out of them, the vast majority are in pre-university education (17.1 millions or 87%) and only 2.5 millions or 13% are in high and university education. The bulk of education is concentrated in basic education (11.7 million individuals) and in particular in primary (8.9 million pupils representing 52% of pre-university education).
Second, the structure of the educational system shows a slight change between 2001/2002 and 2005/2006. In fact, the share of pre-university education has slightly reduced from 62.1% in 2001/2002 to 59.7% while the share of high and university education has gone up from 10.5% to 12.6% over the same period. While the number of pupils in pre-university has slightly increased by 0.6% per year, the number of those enrolled in pre-university has increased at much higher rates (5.9% per annum). This trend can be explained by a combination of two facts. On the one hand, it is due to the decline in the share and absolute number of children (less than 15 years old) in the population since the end of the nineties. Consequently, the demographic pressure on basic education has reduced. On the other hand, enrolment rates at the primary and preparatory stages have greatly improved in the last decades reaching very high levels (above 95% in primary and around 90% in preparatory) and thus they cannot increase at the same rate anymore.
The sharp increase in the number of pupils in primary and the sharp decline in the number of preparatory pupils between 2001/2002 and 2005/2006 are only due to the fact that the sixth primary academic year has been restored for those joining first primary in 1999/2000. Thus they did not enter yet preparatory in 2005/2006 (see footnote 3 in page 4). However, total enrolment in basic education has not changed much, increasing by only 0.2% per year between 2001/2002 and 2005/200 for the reasons mentioned above.
1.2 Pathways in formal education
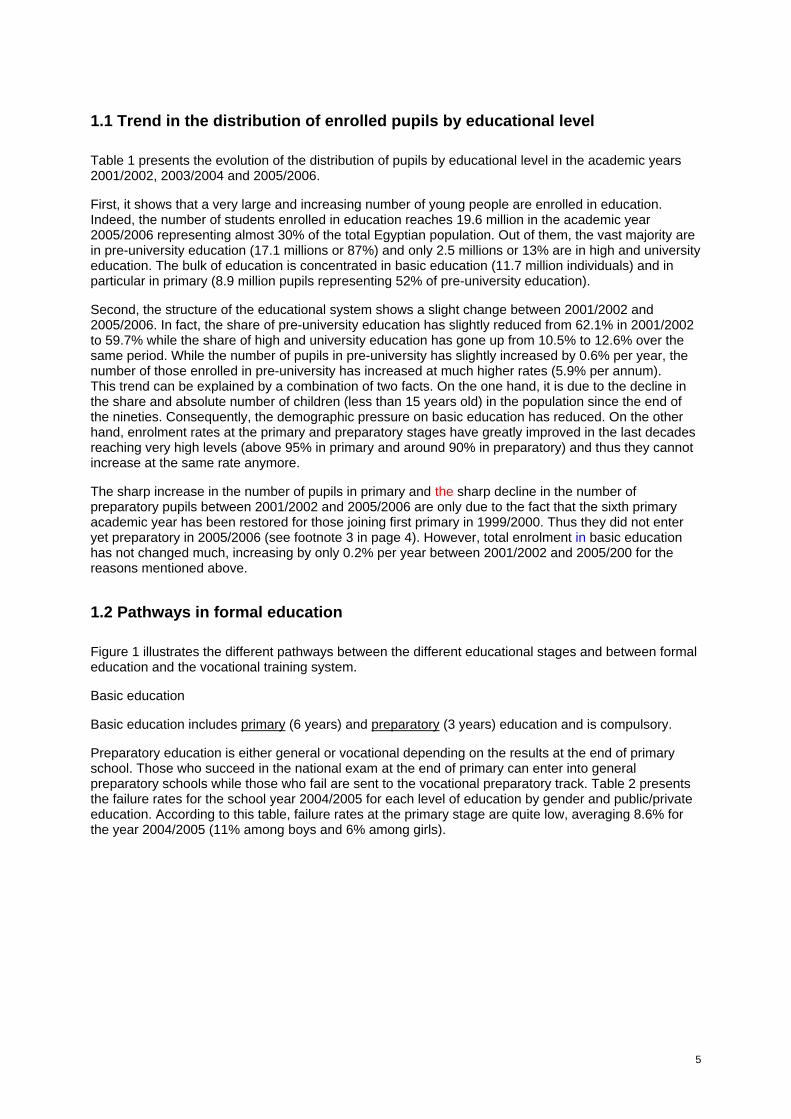
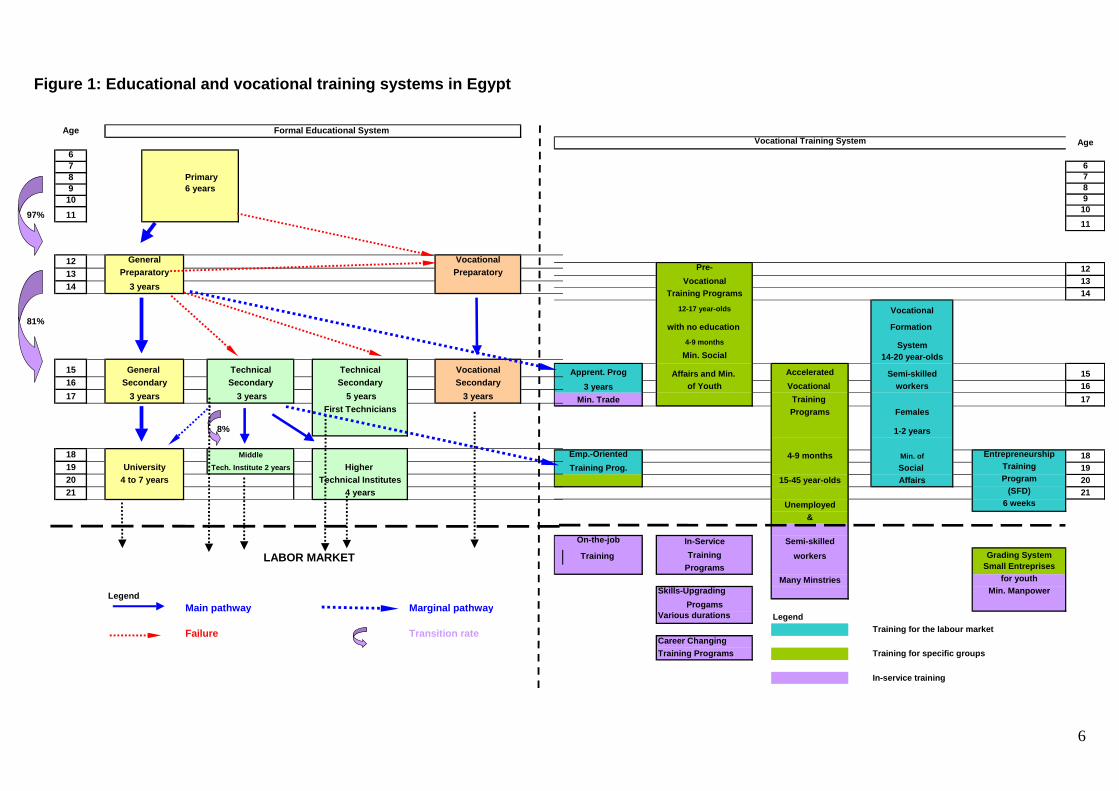
Figure 1 illustrates the different pathways between the different educational stages and between formal education and the vocational training system.
Basic education
Basic education includes primary (6 years) and preparatory (3 years) education and is compulsory.
Preparatory education is either general or vocational depending on the results at the end of primary school. Those who succeed in the national exam at the end of primary can enter into general preparatory schools while those who fail are sent to the vocational preparatory track. Table 2 presents the failure rates for the school year 2004/2005 for each level of education by gender and public/private education. According to this table, failure rates at the primary stage are quite low, averaging 8.6% for the year 2004/2005 (11% among boys and 6% among girls).
6
Vocational Training System Age
67891011
Pre- 12Vocational 13
Training Programs 14
12-17 year-olds Vocational
with no education Formation
4-9 months SystemMin. Social 14-20 year-olds
Apprent. Prog Affairs and Min. Accelerated Semi-skilled 153 years of Youth Vocational workers 16
Min. Trade Training 17Programs Females
1-2 years
Emp.-Oriented 4-9 months Min. of Entrepreneurship 18Training Prog. Social Training 19
15-45 year-olds Affairs Program 20(SFD) 21
Unemployed 6 weeks&
On-the-job In-Service Semi-skilledTraining Training workers Grading System
Programs Small EntreprisesMany Minstries for youth
Skills-Upgrading Min. ManpowerProgams
Various durations LegendTraining for the labour market
Career Changing Training Programs Training for specific groups
In-service training
Age Formal Educational System
678 Primary9 6 years10
97% 11
12 General Vocational 13 Preparatory Preparatory14 3 years
81%
15 General Technical Technical Vocational16 Secondary Secondary Secondary Secondary17 3 years 3 years 5 years 3 years
First Technicians
8%
18 Middle19 University Tech. Institute 2 years Higher 20 4 to 7 years Technical Institutes21 4 years
LegendMain pathway Marginal pathway
Failure Transition rate
LABOR MARKET
Figure 1: Educational and vocational training systems in Egypt
7
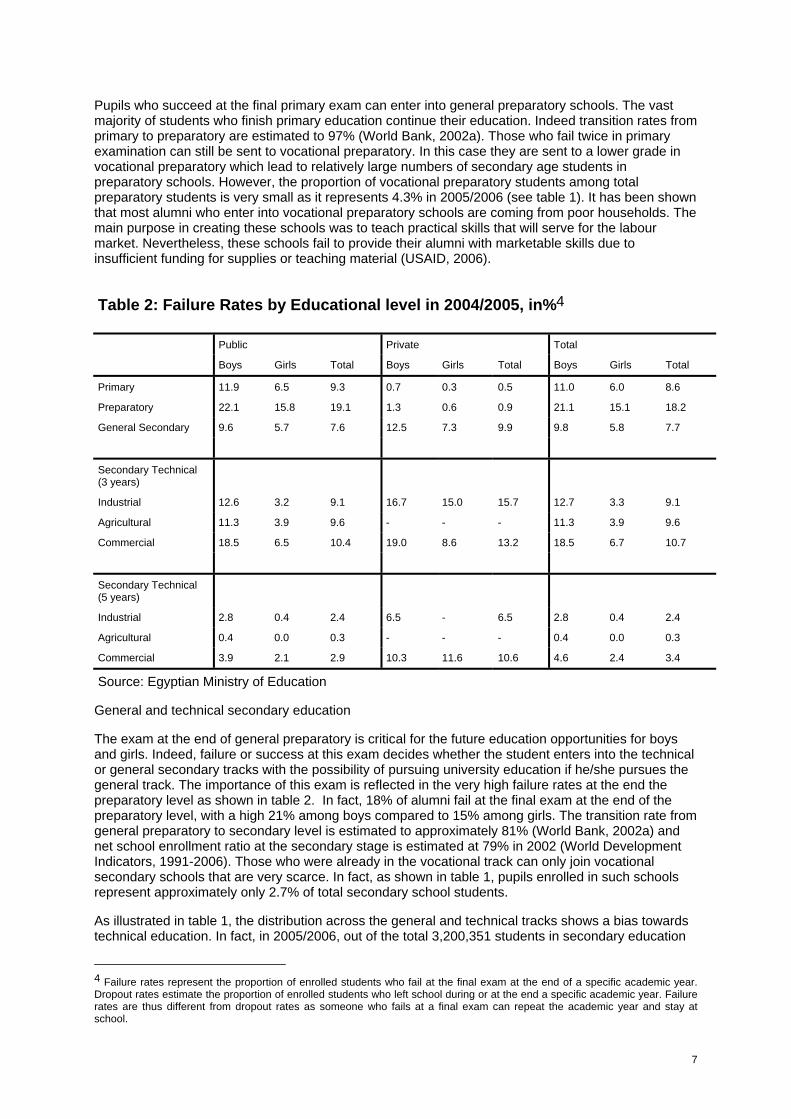
Pupils who succeed at the final primary exam can enter into general preparatory schools. The vast majority of students who finish primary education continue their education. Indeed transition rates from primary to preparatory are estimated to 97% (World Bank, 2002a). Those who fail twice in primary examination can still be sent to vocational preparatory. In this case they are sent to a lower grade in vocational preparatory which lead to relatively large numbers of secondary age students in preparatory schools. However, the proportion of vocational preparatory students among total preparatory students is very small as it represents 4.3% in 2005/2006 (see table 1). It has been shown that most alumni who enter into vocational preparatory schools are coming from poor households. The main purpose in creating these schools was to teach practical skills that will serve for the labour market. Nevertheless, these schools fail to provide their alumni with marketable skills due to insufficient funding for supplies or teaching material (USAID, 2006).
Table 2: Failure Rates by Educational level in 2004/2005, in%4
Public Private Total
Boys Girls Total Boys Girls Total Boys Girls Total
Primary 11.9 6.5 9.3 0.7 0.3 0.5 11.0 6.0 8.6
Preparatory 22.1 15.8 19.1 1.3 0.6 0.9 21.1 15.1 18.2
General Secondary 9.6 5.7 7.6 12.5 7.3 9.9 9.8 5.8 7.7
Secondary Technical (3 years)
Industrial 12.6 3.2 9.1 16.7 15.0 15.7 12.7 3.3 9.1
Agricultural 11.3 3.9 9.6 - - - 11.3 3.9 9.6
Commercial 18.5 6.5 10.4 19.0 8.6 13.2 18.5 6.7 10.7
Secondary Technical (5 years)
Industrial 2.8 0.4 2.4 6.5 - 6.5 2.8 0.4 2.4
Agricultural 0.4 0.0 0.3 - - - 0.4 0.0 0.3
Commercial 3.9 2.1 2.9 10.3 11.6 10.6 4.6 2.4 3.4
Source: Egyptian Ministry of Education
General and technical secondary education
The exam at the end of general preparatory is critical for the future education opportunities for boys and girls. Indeed, failure or success at this exam decides whether the student enters into the technical or general secondary tracks with the possibility of pursuing university education if he/she pursues the general track. The importance of this exam is reflected in the very high failure rates at the end the preparatory level as shown in table 2. In fact, 18% of alumni fail at the final exam at the end of the preparatory level, with a high 21% among boys compared to 15% among girls. The transition rate from general preparatory to secondary level is estimated to approximately 81% (World Bank, 2002a) and net school enrollment ratio at the secondary stage is estimated at 79% in 2002 (World Development Indicators, 1991-2006). Those who were already in the vocational track can only join vocational secondary schools that are very scarce. In fact, as shown in table 1, pupils enrolled in such schools represent approximately only 2.7% of total secondary school students.
As illustrated in table 1, the distribution across the general and technical tracks shows a bias towards technical education. In fact, in 2005/2006, out of the total 3,200,351 students in secondary education
4 Failure rates represent the proportion of enrolled students who fail at the final exam at the end of a specific academic year. Dropout rates estimate the proportion of enrolled students who left school during or at the end a specific academic year. Failure rates are thus different from dropout rates as someone who fails at a final exam can repeat the academic year and stay at school.

8
38.7% are enrolled in the general track (1,239,189 individuals) and 58.6% in the technical track (1,874,801).
Technical secondary schools provide either 3 or 5 years of education. The 5-year technical schools were introduced recently; graduates from these schools acquire the grade of technicians. However, there are very few 5 years technical schools. Indeed, in the academic year 2005/2006, there were 1179 technical schools of 3 years and only 80 schools with the 5-year system (representing 6%). The purpose of technical schools is to prepare students to the labour market. Indeed, contrarily to those who followed the general track, the vast majority of technical secondary school graduates enter directly into the labour market. Very few will pursue higher education. Only 8% will join technical institutes (see table 1).
Technical secondary pupils can choose between three specialities: industry, agriculture and commerce. In 2005/2006, the distribution of technical secondary students (3-year program) in the three specialisations is as follows: 49% in industrial; 40% in commercial and 12% in agricultural. It is to be noted that between 2001/2002 and 2005/2006 a shift occurred in the structure of technical secondary education. While the numbers of students enrolled in industrial specialisation has increased, the number of those in the commercial track has greatly decreased (by 7.3% per year) and the proportion of agricultural specialisation remained the same (see table 1).
The composition of secondary school enrolment between general and technical tracks and within the different technical branches has changed several times during the last decades. Indeed, during the seventies, the technical stream and in particular its commercial branch were favoured and grew rapidly. In the eighties, it is enrolment in the industrial branch that increased very rapidly. During the second half of the nineties, the number of technical secondary graduates declined in absolute terms. And since the beginning of the new millennium, this trend has reversed again and translated into a large proportion of technical secondary school students and in particular of the industrial specialisation. These reversal trends reveal a great degree of instability in the educational policy (Amer, Assaad and El Khawaga, 2004).
Figure 1 shows that preparatory schools' graduates can complete their education by joining apprenticeship training programs. These programs are provided by the Ministry of Foreign Trade and Industry (MoFTI) through its Productivity and Vocational Training Department (PVTD) and are divided into two stages. The first one consists of a two-year-training in vocational centres and includes 24 hour/week of practical training. The second stage consists of a one-year on-the-job training in companies through apprenticeship programs. Graduates from this program acquire a certificate issued by MoFTI which is equivalent to the one obtained by graduates from technical secondary schools (ILO, 2006b).
Higher education
Higher education includes Middle Technical Institutes or MTIs (two years), Higher Technical Institutes (four years) and universities (four to seven years depending on specialities). Graduates of general secondary schools may go to the university, while graduates of technical secondary schools may go to non-university institutes (higher and middle technical institutes) or enter into the labour market (see figure 1).
Thus, transition rates from secondary to higher education depend greatly on the type of secondary school chosen. The vast majority of those who finish general secondary pursue their education at the university level. For example, in 1998/1999, transition rate from general secondary to university was 91% as 243,000 academic-track students passed their examinations, and new university enrolments in that year were 221,000 (World Bank, 2002a).
On the opposite, the majority of those who finish the technical track do not complete their education and enter directly into the labour market. If technical secondary students want to continue their education they can join Technical Institutes. For instance, in 1998/1999, 523,000 technical track students passed their graduate examination, but only 8.4% of them, or 44,000, entered into the MTIs. Very few can join the university as the only way is to get very high scores. Indeed, only the top 5% of technical secondary education can join the university (World Bank, 2002a).
9
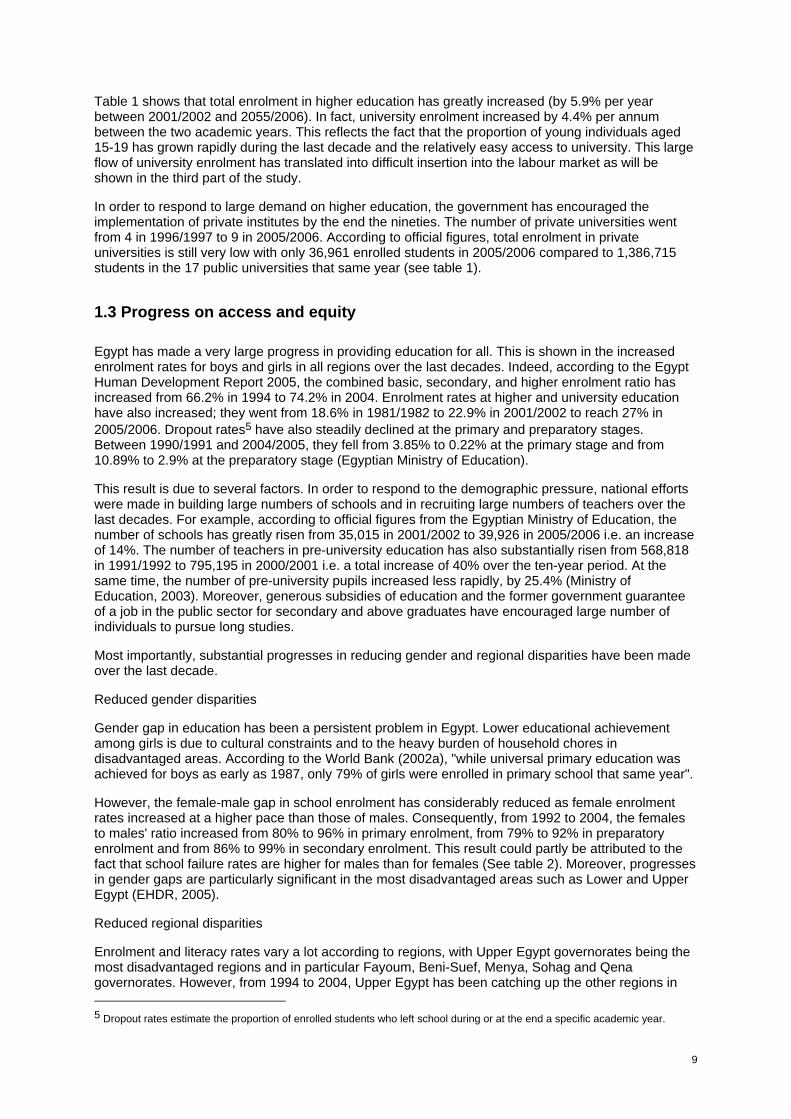
Table 1 shows that total enrolment in higher education has greatly increased (by 5.9% per year between 2001/2002 and 2055/2006). In fact, university enrolment increased by 4.4% per annum between the two academic years. This reflects the fact that the proportion of young individuals aged 15-19 has grown rapidly during the last decade and the relatively easy access to university. This large flow of university enrolment has translated into difficult insertion into the labour market as will be shown in the third part of the study.
In order to respond to large demand on higher education, the government has encouraged the implementation of private institutes by the end the nineties. The number of private universities went from 4 in 1996/1997 to 9 in 2005/2006. According to official figures, total enrolment in private universities is still very low with only 36,961 enrolled students in 2005/2006 compared to 1,386,715 students in the 17 public universities that same year (see table 1).
1.3 Progress on access and equity
Egypt has made a very large progress in providing education for all. This is shown in the increased enrolment rates for boys and girls in all regions over the last decades. Indeed, according to the Egypt Human Development Report 2005, the combined basic, secondary, and higher enrolment ratio has increased from 66.2% in 1994 to 74.2% in 2004. Enrolment rates at higher and university education have also increased; they went from 18.6% in 1981/1982 to 22.9% in 2001/2002 to reach 27% in 2005/2006. Dropout rates5 have also steadily declined at the primary and preparatory stages. Between 1990/1991 and 2004/2005, they fell from 3.85% to 0.22% at the primary stage and from 10.89% to 2.9% at the preparatory stage (Egyptian Ministry of Education).
This result is due to several factors. In order to respond to the demographic pressure, national efforts were made in building large numbers of schools and in recruiting large numbers of teachers over the last decades. For example, according to official figures from the Egyptian Ministry of Education, the number of schools has greatly risen from 35,015 in 2001/2002 to 39,926 in 2005/2006 i.e. an increase of 14%. The number of teachers in pre-university education has also substantially risen from 568,818 in 1991/1992 to 795,195 in 2000/2001 i.e. a total increase of 40% over the ten-year period. At the same time, the number of pre-university pupils increased less rapidly, by 25.4% (Ministry of Education, 2003). Moreover, generous subsidies of education and the former government guarantee of a job in the public sector for secondary and above graduates have encouraged large number of individuals to pursue long studies.
Most importantly, substantial progresses in reducing gender and regional disparities have been made over the last decade.
Reduced gender disparities
Gender gap in education has been a persistent problem in Egypt. Lower educational achievement among girls is due to cultural constraints and to the heavy burden of household chores in disadvantaged areas. According to the World Bank (2002a), "while universal primary education was achieved for boys as early as 1987, only 79% of girls were enrolled in primary school that same year".
However, the female-male gap in school enrolment has considerably reduced as female enrolment rates increased at a higher pace than those of males. Consequently, from 1992 to 2004, the females to males' ratio increased from 80% to 96% in primary enrolment, from 79% to 92% in preparatory enrolment and from 86% to 99% in secondary enrolment. This result could partly be attributed to the fact that school failure rates are higher for males than for females (See table 2). Moreover, progresses in gender gaps are particularly significant in the most disadvantaged areas such as Lower and Upper Egypt (EHDR, 2005).
Reduced regional disparities
Enrolment and literacy rates vary a lot according to regions, with Upper Egypt governorates being the most disadvantaged regions and in particular Fayoum, Beni-Suef, Menya, Sohag and Qena governorates. However, from 1994 to 2004, Upper Egypt has been catching up the other regions in 5 Dropout rates estimate the proportion of enrolled students who left school during or at the end a specific academic year.

10
terms of enrolment and literacy rates (EHDR, 2005). For instance, at the primary stage, while the gross enrolment rate increased the most among the poorest regions, improvements were less important in urban and Lower Egypt governorates, as they had already attained high levels of enrolment during the mid-1990s (World Bank, 2002a). This result is due to the fact that the government efforts have targeted the poorest regions.
These improvements are also directly linked to the efforts of the government by increasing steadily expenditures in education. In fact, the share of education in the GNP increased from 4.8% in 1990/1991 to 5.5% in 1996/1997. Moreover, the share of education in total government expenditures increased from 10% in 1990/91 to 18% in 1998/99, a high rate by international standards (Egyptian Ministry of Education, 2003).
1.4 Progress on quality and relevance still to be achieved
While a substantial progress has been achieved in terms of access to education, the main challenge is the improvement of the quality of education. The main challenges/problems are described below.
First, education in Egypt lacks of funds. As mentioned above, education is mainly public but public funds are insufficient to cover the shortage of school buildings and to improve the quality dimension of education. Moreover, the allocation of resources shows some imbalances. On the one hand, current expenditures (wages and allowances) represent the largest share of total expenditures. For instance, in the public budget of pre-university education for the year 2001/2002, current expenditures constitute 88% while investment allocations represent only 12%. On the other hand, there are imbalances between educational levels. While pre-university education represents almost 90% of total education, its share in total expenditures is relatively low (Egyptian Ministry of Education, 2003).
Second, teaching methods and teachers' qualifications need to be enhanced. The main problems are listed below:
- Learning is based on rote learning and does not encourage self learning and autonomy. The fact that education is based on selection and examination does not motivate teachers to experiment with new teaching methods (World Bank, 2002a).
- Teachers in pre-university education are inadequately qualified. They are better qualified at the preparatory and secondary levels than at the primary level. The low qualification of teachers at the primary level is due to the policy that allowed, until recently, hiring teachers with no pedagogical training and with less than higher education as shortage of teachers. To compensate the lack of qualification, 575,000 teachers received in-service training between 1996 and 2000 (World Bank, 2002a). Moreover, the proportion of graduates from faculties of education varies a lot across regions, public/private institutions and educational levels (Egyptian Ministry of Education)
- Low levels of wages of teachers have lead to widespread private tutoring which represents a very high share of total household expenditures.
Third, student-to-teacher ratios, class size and school facilities still to be improved
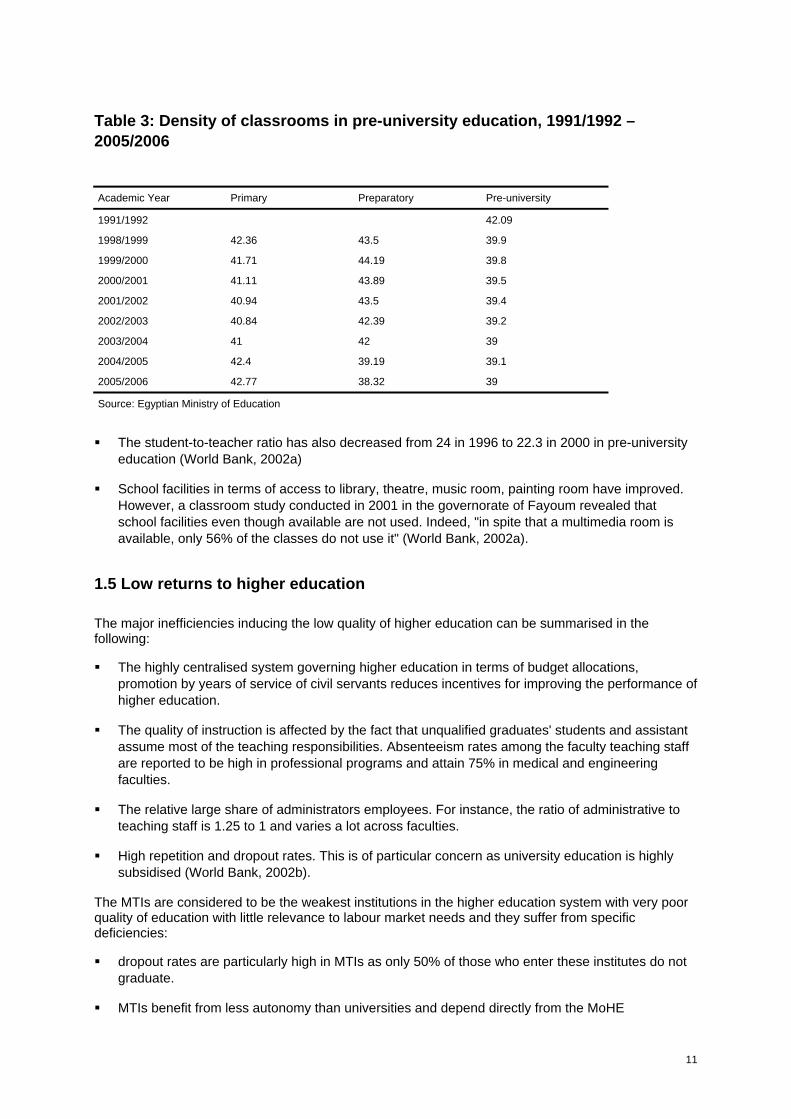
- Density of classrooms went down over the last decade at various educational levels. As shown in table 3, it went down from 42 in pre-university education from 42 in 1991/1992 to 39 in 2005/2006
11
Table 3: Density of classrooms in pre-university education, 1991/1992 – 2005/2006
Academic Year Primary Preparatory Pre-university
1991/1992 42.09
1998/1999 42.36 43.5 39.9
1999/2000 41.71 44.19 39.8
2000/2001 41.11 43.89 39.5
2001/2002 40.94 43.5 39.4
2002/2003 40.84 42.39 39.2
2003/2004 41 42 39
2004/2005 42.4 39.19 39.1
2005/2006 42.77 38.32 39
Source: Egyptian Ministry of Education
The student-to-teacher ratio has also decreased from 24 in 1996 to 22.3 in 2000 in pre-university
education (World Bank, 2002a)
School facilities in terms of access to library, theatre, music room, painting room have improved. However, a classroom study conducted in 2001 in the governorate of Fayoum revealed that school facilities even though available are not used. Indeed, "in spite that a multimedia room is available, only 56% of the classes do not use it" (World Bank, 2002a).
1.5 Low returns to higher education
The major inefficiencies inducing the low quality of higher education can be summarised in the following:
The highly centralised system governing higher education in terms of budget allocations, promotion by years of service of civil servants reduces incentives for improving the performance of higher education.
The quality of instruction is affected by the fact that unqualified graduates' students and assistant assume most of the teaching responsibilities. Absenteeism rates among the faculty teaching staff are reported to be high in professional programs and attain 75% in medical and engineering faculties.
The relative large share of administrators employees. For instance, the ratio of administrative to teaching staff is 1.25 to 1 and varies a lot across faculties.
High repetition and dropout rates. This is of particular concern as university education is highly subsidised (World Bank, 2002b).
The MTIs are considered to be the weakest institutions in the higher education system with very poor quality of education with little relevance to labour market needs and they suffer from specific deficiencies:
dropout rates are particularly high in MTIs as only 50% of those who enter these institutes do not graduate.
MTIs benefit from less autonomy than universities and depend directly from the MoHE

12
curricula are outdated and there are no links with the private employers
the majority of instructors have no practical work experience
equipment and laboratories are limited, old an in very poor repair. Computers and IT are absent from the MTI system (World Bank, 2002b).
Returns to higher education are alarming. Indeed, technical secondary graduates experience very high unemployment rates. For instance, in 2006, while the average unemployment rate among young individuals aged 15-29 is 10.7%, unemployment rate reaches 17.6% among male technical secondary graduates and 26.2% among university graduates. Results are even worse among women whose unemployment rate attain 42.2% among technical secondary graduates and 41.1% among university graduates (see part 3 of this report). Moreover, unemployment rates among university graduates have increased between 1998 and 2006. This very high unemployment rate can be explained by the fact that large cohorts or the youth enter the technical secondary track and because they do not learn practical skills needed in the private sector.
The Higher Education Enhancement project (HEEP)
In order to improve the quality and returns to education of higher education in Egypt, a comprehensive reform of technical institutes and of university education has been launched under the auspices of the World Bank by the end of the nineties. This project called the Higher Education Enhancement Project or HEEP aims at supporting improvements in the quality, relevance, governance and efficiency of higher education in Egyptian public universities and higher education institutions. This objective is to be achieved through three main channels:
legislative reform of the framework governing higher education by giving universities more autonomy and a new legislative framework for the new Technical College system. A project of a new law for university governance is undergoing.
institutions restructuring. 47 Middle Technical Institutes should be consolidated into 8 Egyptian Technical Colleges.
creation of independent quality assurance mechanisms and monitoring systems. This component is in its experimental phase in a few faculties such as the Faculty of Economics and Political Sciences and the Faculty of Agriculture, Cairo University. (World Bank, 2002b and Al Mahdy Said, 2005).
As this project has been implemented very recently (by 2002) it is difficult to assess its impact.
2. The vocational training system
2.1 The main challenges of the Vocational Training System
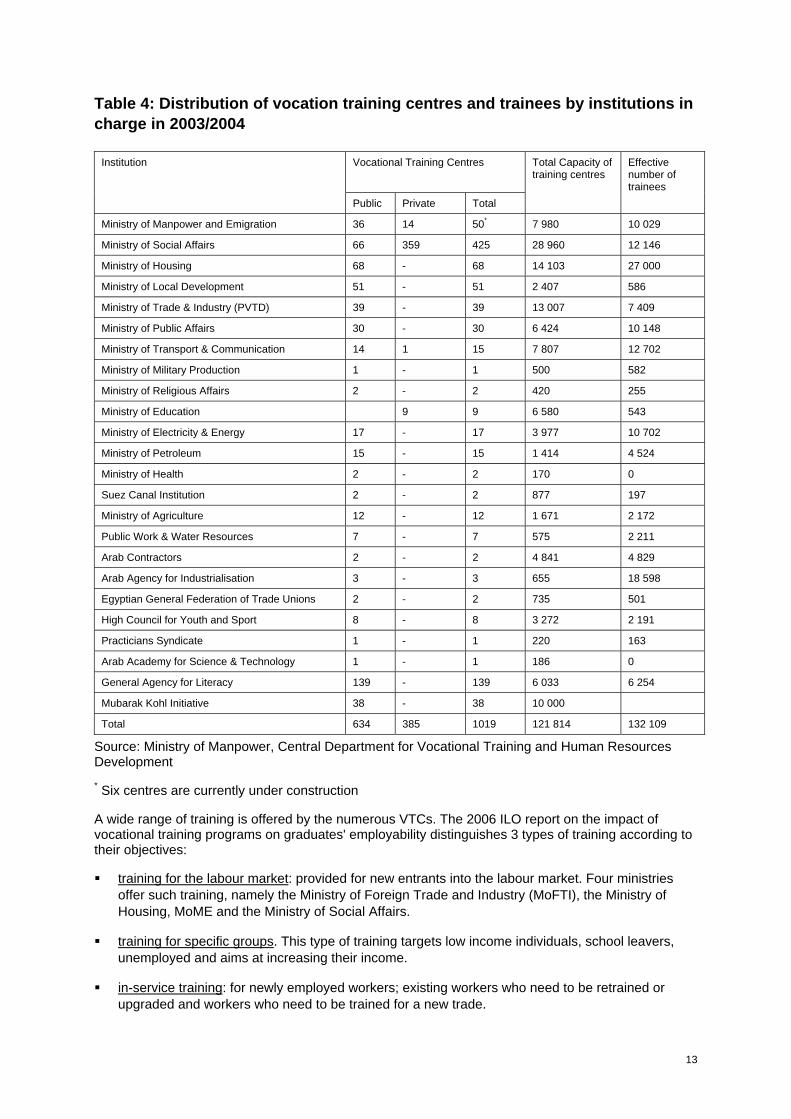
A very large number of institutions are in charge of vocational training in Egypt. As shown in table 4, more than 20 institutions, 14 ministries as well as agencies and public enterprises provide training in their affiliated vocational training centres (VTCs). The Ministry of Manpower and Emigration (MoME) plays a significant role in the provision of training as it is responsible for the supervision of most of vocational training activities in Egypt. Apart from this ministry, the main providers in terms of total capacity of training are: the Ministry of Social Affairs, Ministry of Housing and Ministry of Trade and Industry. The vocational training system is mainly public as 62% of VTCs belong to the public sector in 2003/2004.
13
Table 4: Distribution of vocation training centres and trainees by institutions in charge in 2003/2004
Vocational Training Centres
Institution
Public Private Total
Total Capacity of training centres
Effective number of trainees
Ministry of Manpower and Emigration 36 14 50* 7 980 10 029
Ministry of Social Affairs 66 359 425 28 960 12 146
Ministry of Housing 68 - 68 14 103 27 000
Ministry of Local Development 51 - 51 2 407 586
Ministry of Trade & Industry (PVTD) 39 - 39 13 007 7 409
Ministry of Public Affairs 30 - 30 6 424 10 148
Ministry of Transport & Communication 14 1 15 7 807 12 702
Ministry of Military Production 1 - 1 500 582
Ministry of Religious Affairs 2 - 2 420 255
Ministry of Education 9 9 6 580 543
Ministry of Electricity & Energy 17 - 17 3 977 10 702
Ministry of Petroleum 15 - 15 1 414 4 524
Ministry of Health 2 - 2 170 0
Suez Canal Institution 2 - 2 877 197
Ministry of Agriculture 12 - 12 1 671 2 172
Public Work & Water Resources 7 - 7 575 2 211
Arab Contractors 2 - 2 4 841 4 829
Arab Agency for Industrialisation 3 - 3 655 18 598
Egyptian General Federation of Trade Unions 2 - 2 735 501
High Council for Youth and Sport 8 - 8 3 272 2 191
Practicians Syndicate 1 - 1 220 163
Arab Academy for Science & Technology 1 - 1 186 0
General Agency for Literacy 139 - 139 6 033 6 254
Mubarak Kohl Initiative 38 - 38 10 000
Total 634 385 1019 121 814 132 109
Source: Ministry of Manpower, Central Department for Vocational Training and Human Resources Development * Six centres are currently under construction
A wide range of training is offered by the numerous VTCs. The 2006 ILO report on the impact of vocational training programs on graduates' employability distinguishes 3 types of training according to their objectives:
training for the labour market: provided for new entrants into the labour market. Four ministries offer such training, namely the Ministry of Foreign Trade and Industry (MoFTI), the Ministry of Housing, MoME and the Ministry of Social Affairs.
training for specific groups. This type of training targets low income individuals, school leavers, unemployed and aims at increasing their income.
in-service training: for newly employed workers; existing workers who need to be retrained or upgraded and workers who need to be trained for a new trade.

14
According to these three types of training and as illustrated in figure 1 (page 7), I propose the following classification of training programs in Egypt6:
Training for the labour market
- Apprenticeship programs. It refers to the two-year of training in vocational centres and a one year on-the-job training through apprenticeship contracts. The graduates of this program acquire certificates issued by the PVTD which are equivalent to technical secondary school graduates.
- Pre-vocational training programs: short-term courses (4 to 9 months) for uneducated young people aged between 12 and 17. Most of the training is offered by the Ministry of Social Affairs and the Ministry of Youth. This type of training has a social dimension by offering an activity for out-of-school adolescents and preventing them, at least temporarily, from being left alone the street.
- Vocational Formation systems: provided by the Ministry of Social Affairs through the Productive Family training centres. For people aged 14-20 targeting females with the aim of raising the household income. The duration of the training ranges between one and two years. Part of instruction is theoretical and the other part is given in a VTC.
- Employment-oriented training: targeting unemployed graduates from technical schools of from vocational training centres. This type of training is demand-driven as employers participate in the design of the training program and select trainees. Training centres help trainees in finding a job.
- Entrepreneurship training programs: developed by the Social Fund for Development (SFD) providing managerial and technical skills needed to start its own business. It concerns people 18 years old and above and lasts for 6 weeks.
Training for low income families, school leavers and the unemployed
- Pre-vocational training programs: see above
- Vocational Formation systems: see above
- Employment-oriented training programs: see above
- Accelerated vocational training: short term courses of vocational training (from 4 to 9 months) for semi-skilled workers and targeting uneducated unemployed aged 15-45. Many ministries such as the MoME offer this type of training.
In-service training
- On-the-job training: provided for new workers to introduce them with the skills needed in the enterprise.
- In-service training: provided for new employees to adapt their skills to new techniques and to prepare them for promotion.
- Skills-upgrading: implemented in enterprises and some governmental agencies to upgrade the skills of their employees.
- Grading system: program that aims at encouraging small enterprises to train young people.
6 Some training programs can belong to more than one category. For instance, as pre-vocational training targets unemployed people it belongs to both the training for the labour market and to the training for specific groups' categories.

15
- Career changing training: provided to workers who want to change their career or find a new job.
According to various studies (ILO, 2006b; Ahmed Gheita, 2005; ETF and World Bank, 2005; World Bank, 2003 and ETES report, 2000), the technical vocational and education training (TVET) system in Egypt is facing numerous problems as described below:
Fragmentation of the institutions providing training
As mentioned above, vocational training centres are affiliated with more than 20 institutions. The main problem related to this fragmentation is the absence of a national agency responsible for the enhancement and implementation of vocational training and thus the lack of coordination among the various providers of training. Each centre decides its own program content, conditions, duration (from a few weeks to 4 years), curricula and examinations standards. Indeed, the quality of vocational training differs substantially across the various providers.
Supply-driven system
Ministries allocate their vocational training budgets to their providers on a mechanical basis, with no respect to the quality, market-relevance, or efficiency of the training being provided. Training programs fail to adjust to the type and quality of skills that employers need. A survey conducted by the World Bank on 211 employers regarding the training system indicates that employers consider the training provided by the VTCs and MTIs as low in quality and in market relevance. Employer federations representing small and medium enterprises have reported that the demand for semi-skilled workers and technicians is increasing rapidly, but that trained technicians and skilled workers are in short supply. At the same time, private sector firms have only a limited understanding of the benefits of training, given the few options available for relevant training and the lack of capacity in small and medium size firms to assess their training needs and to formulate training plans. These findings are confirmed by the employers' perspective through the school-to-work transition survey carried out by the ILO in 2005 (see part 3).
Low quality of training
The efficiency and quality of the training are low due to the separation of theory from practice which is the norm in VTCs providing pre-employment training. According to a CAPMAS survey, few instructors acquired an acceptable training: only 35% had any pedagogical training and only 50% had attended any advanced practical training.
The VTCs suffer from a lack of knowledge about curriculum development methodologies and the inability to monitor, evaluate and modify curricula. In addition, the vast majority of equipment in training centres is in bad conditions and of insufficient relevance to program design and to trainees’ needs. Moreover, even when the adequate equipment is available it is underutilised. This is due to the fact that the person in charge of the equipment and its maintenance is reluctant to its use as he/she is personally responsible in case of any damage.
- Insufficient budget allocations
Budget allocations to vocational training are not established on the performance of the training centres but according to previous year allocation. Moreover, training levies collected on public enterprises and cost recovery are modest for the financing TVET.
2.2 Recent TVET initiatives
Many initiatives have been conducted in order to improve the Egyptian TVET system. In 2000, the Education, training and Employment Sub-committee (ETES) report asked for reform. In 2002, the Egyptian government adopted a Policy statement on TVET. The Supreme Council on Human Resources Development (SCHRD) is responsible for the implementation of the reform. In 2000, a
16
presidential decree re-established the SCHRD as a tripartite body7. The SCHRD is chaired by the MoME and is composed by the relevant institutions for TVET (Ministry of Education, Ministry of Higher Education, representatives from the SFD, the ETUF and Federations of Employers). The SCHRD has an Executive Committee and a Technical Secretariat. The presidential decree also created local Councils of Human Resource Development. The role of the SCHRD is “to set up a national policy related to planning and developing manpower and training and set up comprehensive and global national programme for the development and optimum use thereof” (ETES report, 2000).
In this perspective many programs are being developed:
The National Skills Standard and Certification Project
The creation of the National Training Fund
The World Bank Higher Education Enhancement project (see part 1.5 of this report)
Mubarak Kohl Initiative (MKI)
Skill Development Program of the World Bank
TVET project (European Commission)
National Skill Standards Project
The market information system is very weak in Egypt and there are very few studies on skill needs have been conducted. However two donor funded programs (National Skills Standard and Certification Project and the Egyptian Labour Market Service Reform program) aim at filling this gap.
The National Skills Standard and Certification Project (NSSP) is a joint project between the Egyptian government (through the SFD) and a consortium of European donors8 led by the British Council. The NSSP is a four-year program that started in 2000 and extended to June 2005. This project aims at enhancing the Egyptian workforce competencies in order to attain international skill levels and to meet the needs of the Egyptian and international labour markets. The NSSP has been granted a fund that amounts to $5.5 million and LE 5.5 million. The National Skills Standard Project is responsible for the development of a national system to set up Egyptian vocational skills standards, an evaluation process and a certification system. The project focuses on three key sectors: tourism, construction and manufacturing. The NSSP has developed the Egyptian Vocational Qualifications (EVQs) up to level three9. EVQ guarantees a national award system. The main outcome of the NSSP is the development of skill standards for 105 trades in the manufacturing (59 trades), tourism (24 trades) and construction (22 trades) sectors.
The National Training Fund
The creation of this fund has been established by the new labour law of 2003. Its resources are expected to be drawn from 1% of the annual net profits of enterprises, government funds and other donations). The labour law is vague regarding the authority under which the Fund will be placed (it mentions “the concerned Ministry”). The aim of the National Training Fund is to finance the creation, enhancement, and modernisation of training centres and programmes in order to match the needs of the labour market. However, this fund is not yet fully operational.
The Higher Education Enhancement Project (HEEP) - See section 1.5
The Mubarak-Kohl initiative
In 1991, the Mubarak-Kohl Initiative (MKI) was adopted. An Egyptian-German Cooperation implemented a dual vocational education system in partnership between the public and private sectors. Under this system, students have to spend two days per week in a technical secondary
7 It was first created in 1982 by a presidential decree. 8 SQA (Scotland), AFPA (France), IB (Germany) and Carl Bro (Denmark) 9 Level 1 is basic skills ; level 2 is trade skills and level 3 is advanced skills/technician
17
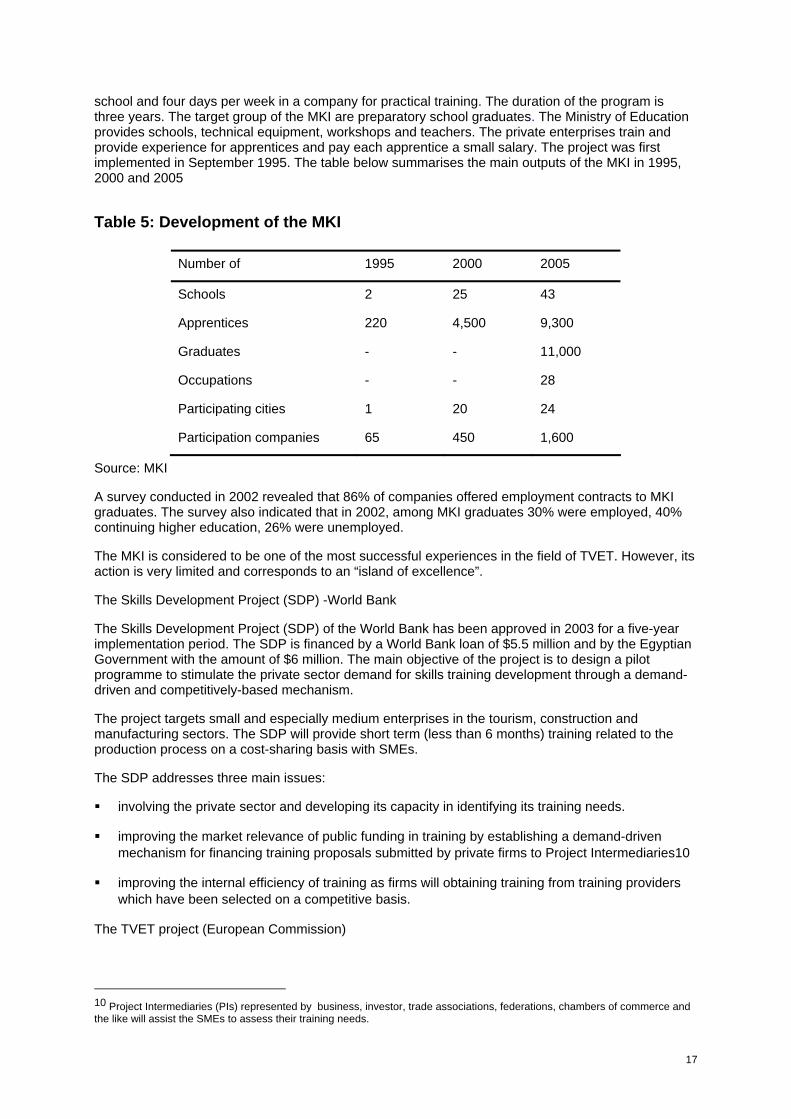
school and four days per week in a company for practical training. The duration of the program is three years. The target group of the MKI are preparatory school graduates. The Ministry of Education provides schools, technical equipment, workshops and teachers. The private enterprises train and provide experience for apprentices and pay each apprentice a small salary. The project was first implemented in September 1995. The table below summarises the main outputs of the MKI in 1995, 2000 and 2005
Table 5: Development of the MKI
Number of 1995 2000 2005
Schools 2 25 43
Apprentices 220 4,500 9,300
Graduates - - 11,000
Occupations - - 28
Participating cities 1 20 24
Participation companies 65 450 1,600
Source: MKI
A survey conducted in 2002 revealed that 86% of companies offered employment contracts to MKI graduates. The survey also indicated that in 2002, among MKI graduates 30% were employed, 40% continuing higher education, 26% were unemployed.
The MKI is considered to be one of the most successful experiences in the field of TVET. However, its action is very limited and corresponds to an “island of excellence”.
The Skills Development Project (SDP) -World Bank
The Skills Development Project (SDP) of the World Bank has been approved in 2003 for a five-year implementation period. The SDP is financed by a World Bank loan of $5.5 million and by the Egyptian Government with the amount of $6 million. The main objective of the project is to design a pilot programme to stimulate the private sector demand for skills training development through a demand-driven and competitively-based mechanism.
The project targets small and especially medium enterprises in the tourism, construction and manufacturing sectors. The SDP will provide short term (less than 6 months) training related to the production process on a cost-sharing basis with SMEs.
The SDP addresses three main issues:
involving the private sector and developing its capacity in identifying its training needs.
improving the market relevance of public funding in training by establishing a demand-driven mechanism for financing training proposals submitted by private firms to Project Intermediaries10
improving the internal efficiency of training as firms will obtaining training from training providers which have been selected on a competitive basis.
The TVET project (European Commission)
10 Project Intermediaries (PIs) represented by business, investor, trade associations, federations, chambers of commerce and the like will assist the SMEs to assess their training needs.
18
The TVET project is complementary to the SDP. It aims at establishing enterprise-TVET partnerships at the local level; improving the quality of training; and developing national regulatory and support functions through improving governance, identifying means of sustainable financing, and research, monitoring and evaluation. Though the TVET program was to begin in 2003, it has only started in July 2005.
School to Work (STW) Component of the Education Reform Program (USAID)
The school to work program is part of the Education Reform Program launched in 2002 by USAID in seven governorates11. The school to work component aims at improving the quality of the technical secondary education to better serve the current and future market needs. The main objective is to enable technical education schools to provide communities with skilled workforce that respond to the needs of a particular locality. The community is largely involved by the establishment of boards of trustees (BOT) in the participating technical schools. In order to ensure the effectiveness of the program, three levels are involved. At the school level a STW sub-committee is formed from the BOT. Businessmen and NGOs representatives are invited to collaborate with this committee. At the governorate level a STW sub-committee is formed from the GEAC (Government Education Advisory Committee). 35 Members from the STW committees in 7 governorates participated in a study visit to USA to gain experience and induce it to their colleagues. At the national level a committee (Technical Education Reform Committee) has been established including representatives from the 7 governorates’ committees and representatives from other line ministries, authorities and stakeholders. Finally, the main outcomes anticipated are to provide a pathway to good jobs and further learning for students; provide employers with a pipeline of qualified workforce and enhance the skill base that is required for community economic development. (El, Fateh, 2006).
In conclusion
First, this part has shown that contrarily to the vocational training system, formal education benefits from a high degree of standardisation. The fact that more than 90% of education is public guarantees at least standard curricula and examinations. Of course, the quality of education may differ across regions and across public/private schools.
Second, almost all children attain the preparatory level. Thus, the dichotomy in the education system appears at the end of this level when pupils join either general or secondary schools with very different instructional outcomes. While general secondary graduates continue their education at the university level, technical secondary graduates join technical institutes, enter directly into the labour market, or follow training programs delaying their entry into the labour force.
Third, the declining share of children below 15 in total population since the end of the nineties will reduce pressure on basic education. The window opportunity for development has opened. Thus, the government has the opportunity to start investing in improving education quality by reducing class sizes and increasing expenditure per child if it maintains the same level of investment in education.
Finally, comprehensive reforms of higher education and TVET have been initiated recently. The impact of these programs will depend on their degree of implementation.
II. Active Labour Market Policies towards the Youth- The National Youth Employment Programme
This part presents some active labour market policies implemented recently and affecting the insertion of the youth into the labour market. First it describes the projects of improving labour market information and upgrading and modernising the employment services. Then it focuses on the National
11 "The Education Reform Program (ERP) works with a wide variety of partners to provide learning opportunities within communities ranging from school readiness for pre-school children, literacy programs for men & women, multi-grade classrooms, scholarship programs for girls, as well as Life-Skills and School-to-Work programs for young men & women" (El Fateh, 2006).
19
Employment Youth Programme (YEP) launched at the beginning of the new millennium12. Finally it gives a synthesis of an evaluation by De Gobbi (2005) on two sub-programmes of YEP: youth training and the credit for artisans' workshops.
1. Improving Labour Market Information and Employment Services
Since the end of the nineties and in the context of massive flows of new entrants into the labour market, the successive governments have declared at several occasions that employment is one of their major preoccupations. This part briefly presents the efforts that have been made in improving labour market information and in upgrading and modernising the employment services.
The Egyptian Labour Market Service Reform (ELMSR)
One of the main responsibilities of the MoME is to match job seekers and job vacancies through a wide network of employment offices. There are 360 employment offices throughout Egypt that provide employment services and register job seekers and vacancies from employers in order to match them. They recruit primarily for private enterprises. However, these offices are not efficient enough (in terms of infrastructure, staff competences, information system…) to respond to the needs of the job seekers and employers who are therefore reluctant to deal with them. Although counselling services can be very effective, they are undeveloped in Egypt. Employment service offices are currently under a modernization project called ELMSR (Egyptian Labour Market Service Reform) undertaken by CIDA and the SFD. This project started in October 1st, 2000 for 5 years and should be extended to September 2007. The Egyptian partner is the Ministry of Manpower and Emigration and the implementing agency is the Human Resources Development Program (HRDP) of the Social Fund for Development.
The purpose of ELMSR is to assist the Egyptian government in developing and delivering a modern and efficient national employment service that is effective, sustainable, user-friendly, and gender sensitive. It consists of establishing employment centres, strengthening the capacity of professional staff to operate the employment service and enhancing the Occupational Information System for Egypt (OISE), including and automated Electronic Labour Exchange. The service will be an adaptation of the Canadian model.
The first mission of ELMSR is the establishment of a comprehensive system of delivery, programs and services in a network of employment offices throughout Egypt.
This activity aims at providing accurate labour market information, referring job-seekers to appropriate centres for skills development, and matching jobseekers and employers.
The expected outputs of this mission are the following:
26 pilot employment offices will be established throughout Egypt (one in each of the 26 governorates).
An additional 75 employment offices, 3 per governorate, will be established by September 2007. These offices will be established under the supervision of the project but at the expenses of the Egyptian government.
All employment offices will have automated capabilities and will be connected to a Headquarters office located in Cairo through a Wide Area Network (NAW).
As of July 2005, the status of this first pillar is as follows: 12 employment offices are fully operational13, 8 are under development14 and 7 are still to be
developed.
12 For further details on the various active labour market policies see the ETF report on "The Functioning of the Labour Markets in the Mediterranean Region and the Implications for Employment Policy and Training Systems" submitted in September 2005.

20
An operational manual has been developed and distributed to all office staff. It outlines the basic organisational structure for the employment offices. Each office has a manager, 2 employment officers, a receptionist and a secretary.
The second mission of ELMSR is strengthening the capacity of professional staff to operate the employment services The main expected outputs from this activity include the following:
fully trained and qualified staff in all employment offices
trainer’s manuals, trainee workbooks, and training support materials for all key skill areas available in Arabic
A roster of fully qualified trainers (Koeltz, 2005)
Improving labour market information
The Ministry of Manpower and Emigration (MoME) is responsible for providing a labour market information system. However, this system is very weak as it lacks trained staff and an efficient information system. The monthly National Employment Bulletin on job vacancies issued by the MoME is not comprehensive and does not meet the needs of job seekers and employers.
The other part of ELMSR mission is to enhance the Occupational Information System for Egypt (OISE) including an automated Electronic Labour Exchange. The OISE incorporates all occupational codes and titles according to the Egyptian Occupational Classification system produced by the Central Agency for Public Mobilization and Statistics (CAPMAS). Basic job descriptions have been developed for approximately 630 job titles and are judged to be sufficient to represent the overall labour market in Egypt. These jobs descriptions have been shared and reviewed with representatives from all occupational sectors within Egypt. Additional information fields have been developed and will be added to the system by the end of 2005. OISE has been installed on the computers in the new employment offices in ten of the twelve governorates selected. Additionally, programming for a second data base has been incorporated into the OISE to allow for access to all data developed through the NSSP (Koeltz, 2005).
In 2003, the government launched a monthly publication on the "Labour Market Demand Index" or LMDI. It gives an indicator of the trends of labour market demand based on job vacancies published in official newspapers. The index presents three main indexes: the share of local to foreign demand; the geographical distribution of local demand and the educational level and fields mostly needed. However, this index is partial as job vacancies published in the newspapers usually target skilled workers. The main findings are as follows: local demand represents around 90% of total demand; Cairo absorbs most of labour demand and the highly educated are the most demanded (ILO, 2006b).
2. The National Youth Employment Programme
Since the end of the nineties the Egyptian government declared in many occasions that job creation for youth is on top priority of its agenda.
In July 2001, the Egyptian government launched the National Youth Employment Programme (YEP). This programme is to be coordinated by the Information and Decision Support Centre (IDSC). YEP objective is to create 800,000 jobs in its first year in order to meet the annual increment of labour supply that ranges approximately between 650,000 and 800,000 individuals in the five coming years (Amer, Assaad and El Khawaga, 2004). This ambitious programme with a total cost of L.E. 5 billion focuses primarily on job creation in the public sector and in particular in the government sector. This goal contradicts somehow the government strategy of giving the private sector the primary role in labour absorption whereas the public sector and in particular the government sector is well known to be over staffed (De Gobbi, 2005 and El-Ehwany and El-Laithy, 2001). YEP is composed of five sub-programmes: 13 10th of Ramadan, Agouza, Luxor, El Tur, Mansura, Hurghada, Borg El Arab, Kafr El Sheikh, Assuit, Aswan, Maadi and
Bateem 14 Port Said, Sohag, Qena, Bani Sueif, Maeraera, Shibeen El Kom, Damanhur and Tanta

21
1. Job creation in the Government Sector
The objective of this first component is to recruit 170,000 youth in the government each year and this has been achieved in the first year of implementation. The main target group for this "government employment scheme" is educated young people. Indeed, one of the main conditions for this group to be eligible is to have graduated between 1995 and 2000. These government jobs were either substituting retired civil servants or jobs newly created. Both education and health sectors absorbed most of these job vacancies (De Gobbi, 2005).
2. Employment in jobs for the collection of information in villages
The second component is to recruit 30,000 persons in order to collect and process data on applicants for government jobs that will work in regional and local information centres (De Gobbi, 2005).
3. Jobs in the private sector
The government aims at creating 100,000 jobs in the private sector through employment offices (De Gobbi, 2005).
4. Youth training
In May 2001, the government launched a "national plan for training graduates and youth". This fourth component aims to train 400,000 young educated people each year. The total budget allocated for this programme is L.E. 500 million. The Ministry of Military Production which is the most competent institution in the field of training is the implementing authority. In total, 558 training centres were selected from different institutions/ministries to participate in this programme. A High Coordination Committee composed by the IDSC among others is responsible for assuring that the training programs match the labour market needs.
Eligible trainees must hold at least a secondary school or equivalent certificate. They are given a grant of L.E.100 or L.E.150 according to their educational level. Some of them received support to get a job after graduation mostly through loans from the SFD.
The programme provides training for 310 different occupations (agriculture, industry and commerce) in addition to training in computer science for a duration that varies between one and ten months. However, most training courses last between three to six months.
The number of trainees and occupations targeted has been determined through a training needs assessment that was based on the following information gathered from:
a CAPMAS survey on the needs of the labour market for the period 2001-2005;
the labour demand information system and
job advertisements in the newspapers
In 2005, De Gobbi carried out an evaluation for the Youth Training for the ILO. This study was based on a survey that included 37 training centres and 220 trainees. It highlighted various weaknesses as described below:
The target of 400,000 trainees annually is far from being reached. At the beginning of the implementation very few trainees benefited from the programme. Only around 40,000 people were trained by March 2002. This number increased substantially over time and between July 2002 to July 2003, approximately 143,500 individuals attended training courses. However, this is still very low as it is less than half of the objective.
Finding a job after attending training sessions is not the panacea. Only 42% of trainees who were interviewed declared that they obtained a job after completion their training. Among those, 65%

22
declared that the training was the main reason for obtaining this job. In conclusion, only 27% have obtained a job because of the training courses they attended.
The participation of the private sector in the training programme is very poor. Joint public and private training need to be initiated. Business associations should be strengthened in order to involve private partners in the training programmes. Practical experiences should be offered for trainees.
The objective of matching skills to market needs was not reached. De Gobbi identified the following reasons:
- Data on labour demand needs are either not available or old dated
- The number of professions offered (310)²during these training courses is too large and jeopardizes the quality of the training.
- Difficulty of adapting curricula according to changes in labour market needs
- Lack of proper guidance from the implementing authority to training centres was common. In fact, only 5% received guidance.
Lack of quality of the training can be explained by:
- Lack of competent trainers
- Lack of modern equipment and innovative methods
- Insufficient course duration
- Very large classes
- Lack of sufficient financial resources
5. Credit for artisans' workshops
This sub-programme launched in 2001 had a total budget of L.E. 400 million. Its objectives are twofold:
modernise and develop micro and small handicraft enterprises through lending programs and
encourage formal recruitments with the target of creating of 52,000 new jobs
For this component, the Productive Cooperative Union (PCU) is the implementing authority. The Ministry of Finance, the Ministry of Local Development, the SFD and the Egyptian National Bank are partners in this programme.
The programme is limited to formal micro and small handicraft enterprises and applicants to credit programme must own a formal economic unit (registered and paying social insurance fees). Moreover, in order to receive a loan these enterprises must follow controlled modalities for credit provision.
The average loan size is approximately L.E. 20,000 with an interest rate of 7%15 . Loan duration varies between one to five years and time of disbursement between one to 1.5 month. The condition is to hire at least one employee per L.E. 10,000 borrowed.
15 The interest rate of 7% is lower than that of the market.
23
In 2005, De Gobbi evaluated the Credit for Artisans' Workshops components for the ILO. Although data vary a lot according to the source, some strength and weaknesses can be summarized as follows:
strengths:
- The novelty of this programme is to encourage the creation of formal jobs (social security subsidised). Once a person is formally employed, the social insurance fees are financed by the Ministry of Local Development. However, most borrowers simply formalize the employment situation of based on existing employees instead of recruiting new ones. The threshold of L.E. 10,000 seems to be too low for creating new jobs.
- Very high reimbursement rate reaching the level of 95%. However this figure seems a bit doubtful (De Gobbi, 2005).
- Marketing and selling support from the PCU.
weaknesses:
- The credit programme is far from reaching the target of creating 52,000 jobs. Indeed, by October 2003, the number of enterprises who benefited from this program varies between 614 and 687 and the number of formal jobs created varies between 1,206 and 1,428 depending on the source16.
- Insufficient available resources
- Slow implementation
- The modernisation objective is not reached nor encouraged. It could be conditioned to the credit provision or higher loan amount, lower interest rate…
In conclusion
The national youth employment programme launched at the beginning of the new millennium announced very ambitious objectives. The programme aimed to offer 800,000 job opportunities each year in order to respond to the large labour supply of new entrants.
However, the YEP did not reach its goal in both quantitative and qualitative terms. Indeed, according to the assessment made by De Gobbi the objective of training 400,000 individuals through the youth training component and the objective of creating 52,000 formal job opportunities are far from being reached. Moreover, the quality and the relevance of the training provided through the training programme are questionable as it permitted better access to employment to only 27% of trainees. The effect of the credit programme on better work conditions is also very small as the number of formal jobs created is less than 1,500 which is almost insignificant compared to the size of the youth labour market.
16 PCU or Ministry of Local Development
24
III. Transitions from Education to Work
This part aims at presenting transitions from education to work. In order to better understand these transitions, this part is divided into three sections. The first one gives a brief overview of the Egyptian labour market. It presents the main disparities between public and private sectors in terms of law enforcement, wage setting rules and social security coverage. It also describes the main sectors absorbing labour. The second section focuses on the main characteristics of the youth labour market and the changes that occurred from 1998 to 2006. Finally, the last section describes the transitions from education to work based on a specific ILO survey on school-to-work transitions and on the most recent Egypt labour market surveys.
1. The Egyptian Labour Market
One of the most striking features of the Egyptian labour market is its segmentation along public and private sectors' lines. Because the private sector is mainly composed of informal enterprises, most of the rules governing the public sector (wage setting, contract and social security) are not respected. Moreover, the introduction of the public employment guarantee in the sixties has accentuated disparities between public and private sectors.
The evolution of the main sectors absorbing labour shows that the share of the private and services sectors in total employment have increased.
1.1 Public/private disparities
The Egyptian labour market is clearly segmented across public/private sectors. There are big disparities in terms of law enforcement, wage setting rules, social security coverage. While employees in the public sector benefit from high social insurance coverage, workers of the private sector are mainly employed informally being deprived from social security and/or written contract.
Labour Law Enforcement
In June 2003, the People’s Assembly adopted the new Labour Law 12/2003 after ten years of tough discussions17. The main innovations of this law are presented below:
It has introduced more flexibility in the hiring and firing rules18:
The creation of a National Training Fund drawing its resources from 1% of the enterprises' annual net profits, government funds and other donations. The aim of the National Training Fund is to finance the creation, enhancement, and modernisation of training centres and programmes in order to match the needs of the labour market.
The creation of an emergency fund for the compensation of workers in case of partial or complete closure of their establishment;
The creation of a National Council of Wages. Its main mission is to set up a national minimum wages structure (to be revised every two years) and it stipulates a minimum annual increment of 7% of the basic salary. The project of increasing the minimum wage by 100% is currently under discussion;
The recognition of the right to peaceful strike even though this right is strictly limited19.
17 This law does not apply to civil servants, domestic workers and family workers. Civil servants include employees of the central administrative organs of the state, the local government entities and general organisations. Thus the new law applies to public enterprises. 18 The renewal of a definite contract does not imply an indefinite contract as was specified in the old law. Layoffs are facilitated: dismissal for cause is made easier and termination of a contract is possible under economic conditions (under restrictions); termination of a contract by the employer without valid justification entitles only to compensations. 19 The trade union committee organising the strike must get the approval of the two-thirds of the board members of the relevant trade union federation at the national level. In addition, the employer and the concerned administration must be notified at least 10 days in advance.

25
However, there are very big disparities between the private and the public sectors in terms of enforcement of the legislation (contract, wage setting rules, social security...). The public and private sectors are strictly segmented. The private sector which is mainly composed of the informal20 enterprises does not respect the main legal employment regulations.
Because job security provisions were very rigid under the old labour law, private employers were used to employ workers without contract and sometimes to force their new employees to sign an undated letter of resignation before starting their job. Most small and medium enterprises do not even provide a contract to their employees. The vast majority of jobs created in the private non agricultural sector between 1988 and 1998 were unprotected by legal employment contract (Assaad, 2002). Moreover, private employers often underestimate the wages offered to their workers in order to lower the burden of their social contributions which are calculated on basic and variable wages (see section on social security below).
As the new labour law applies only for new employment contracts rather than to existing ones, its effect on labour market regulations is likely to be small. It is considered that it will affect positively the most foreign companies that were reluctant to invest in Egypt in the past. It should also be significant to privatised firms that have a significant share of their workforce under the protection of legal contracts (Amer, Assaad and El Khawaga, 2004).
Wage setting rules
In the public sector and in particular in the government, wages are not flexible at all and follow a centralised uniform structure. The basic wage levels are determined according to education (“certificate pricing” system) rather than job content or performance. Promotions depend only on seniority. Overtime payments and incentives can be used in a way to raise the average wage. There are some disparities among the different government agencies as supplementary payments vary substantially within each government agencies. The variable salary can constitute up to 83% of the basic salary (Handoussa and El Oraby, 2004). In order to avoid the rigidities of the public system (in particular due to life-term contracts), government and public enterprises sometimes resort to temporary employment. Sometimes these temporary workers do not have the same advantages as permanent workers as they do not benefit from a contract and/or social security. At the same time a parallel system is established within ministries where some units employ highly-educated and better paid employees in order to enhance the government productivity.
On the contrary, in the private sector, wages are very flexible. According to Mona Said (2006) real wages have substantially declined between 1988 and 1998 and have recovered from 1998 to 2006. As mentioned above, private employers (formal and informal) do not take into account the annual increment of wages stipulated by the law. Thus, if the private sector is not creating sufficient jobs it is not because of labour market rigidity but because of other significant factors such as high tax rates, tax administration and high cost of finance. Three years after the creation of the National Council for wages, its output seems very limited. Most employers do not abide the law concerning the annual wage increment stipulated by the labour law as very few private enterprises have increased their employees’ wages by the 7% annual increment set up by the National Council for wages. Many enterprises have referred their case to the Council justifying their inability to increase wages due to difficult economic conditions.
However, wage setting in public enterprises now closely resembles that in the private sector. According to Mona Said (2006), the opposition is more government versus non-government (including public enterprises).
Social insurance
Social insurance in Egypt is virtually universal as the various insurance laws provide the opportunity for social insurance for the vast majority of the labour force. Civil service employees, public enterprise workers, and wage workers in the private sector are covered by law.
Civil servants benefit from an indefinite contract and high level of social security (retirement, disability, death, unemployment and work injury, and health insurance). On the contrary most private sector
20 The vast majority of the informal sector is composed of very small informal enterprises employing less than 5 workers.

26
workers lack the privilege of a definite contract and social security is scarce. This is explained by the fact that insurance contribution rates are high. They represent 41% of the basic salary and 15% of the variable salary. Moreover, employers bear the two-thirds of this burden. Employees’ contributions rates represent 14% of basic wages and 10% of variable wages while employers’ contributions represent 26% of basic wages and 15% of variables wages. This has lead many employers to evade paying the social security contributions in the context of a weak inspection system. It is estimated that 30% of employers in the private sector do not pay their contributions and that 40% of workers and employers underestimate the wages in order to pay lower contributions. Pensions represent the largest share of social contributions. Workers (either from the public or the private sector) become eligible for retirement pension benefits at the age of 60 if they were covered for at least ten years. Early retirees who leave their job prior the age of 60 can benefit from reduced pension benefits if they worked for more than 20 years. However, the reductions are not very steep21. It is estimated that 7.2 million workers (or their beneficiaries) were receiving pension benefits in 2002. However, even though contributions rates are relatively high, pensions are low and do not allow pensioners to meet their demands (Helmy, 2004).
In the old labour law civil service employees, workers fired from their positions for cause, casual and temporary workers were not eligible for unemployment insurance. Thus, the only workers who would qualify for benefits were workers laid off as a result of court-approved final closure of a firm. The number of unemployment insurance beneficiaries was accordingly very small (Assaad, 1996). In order to improve this situation, a separate Law (156/2002) has established an emergency relief fund for workers whose wages have been discontinued from partially or wholly closed establishments. The fund draws its resources from contributions of 1% of the basic wages of workers in all sectors, whether public or private, along with aid and donations (Assaad, 1996 and Amer, Assaad and El Khawaga, 2004). However, the benefits of this fund are virtually inexistent.
The Public Employment Guarantee Scheme
The Public Employment Guarantee scheme has been introduced in the sixties. Under this scheme, university graduates (1961) and then secondary technical school graduates (1964) were guaranteed an employment in the public sector. The general administration of graduates used to distribute the eligible graduates in the different government offices and state-owned enterprises. In the mid-eighties, when the public sector suffered from overstaffing the queue for governmental job began to increase substantially reaching for some occupations more than 10 years. Nowadays this scheme has been suspended but the government continues to hire large numbers of graduates in the education and health sectors.
The employment guarantee scheme created a distortion in the functioning of the labour market. First, it has given incentives for individuals to pursue longer studies (till technical secondary or university) all the more as education is largely subsidised. Second, it has encouraged the eligible candidates and in particular women to wait for the public sector job that offers a life-term contract, social security coverage and better work conditions that are compatible with their household responsibilities compared to the private sector where they face many barriers to entry.
1.1 The evolution of the Labour Market Structure
Out of a total population of 73.6 million in 2006, 71.3 million reside in Egypt. The main characteristic of the Egyptian population is its youth. In fact, according to the CAPMAS, the share of those less than 15 years old is around 37% in 2006. However, the demographic window of opportunity has opened as the proportion of children is declining and therefore the dependency ratio is going down. Accordingly, the working-age population (15-64) is growing at a faster rate than the population but as it is concentrated among the youth (15-24) it is leading to high pressure on the labour market.
Recent developments of the labour market revealed by Ragui Assaad (2006b) are briefly described below22:
21 They are not reduced if the age of retirement is between 55 and 59. Pension benefits are reduced by 5% if the age of retirement is between 50 and 54, 10% if it is between age 45 and 49 and 15% if it is under 45. 22 Unless mentioned, this report uses the extended definition of economic activity. The market definition of participation in economic activity refers to someone engaged in activity for the purpose of market exchange, either as wage worker, on own account or as unpaid family worker for at least 1 hour in reference week. The extended definition of economic activity refers to
27
Labour force participation (15-64) has slightly increased from 59.8% in 1998 to 61.4% in 2006 as the labour force grew (from 17.8 million in 1998 to 21.9 million in 2006) at a higher rate than the working-age population. This is mainly due to the fact that male participation growth has compensated the decline in female participation23.
The unemployment rate (15-64) has sharply declined from 7.9% in 1998 to 5.8% in 2006. According to the market definition, the unemployment rate went down from 11.7% to 7.8%. This translated also in the decline in the absolute numbers of the unemployed over the eight-year period. The change in the educational structure of unemployed will be discussed in the following section.
Employment has increased substantially between 1998 and 2006 among both males and females. Employment to population ratios have gone up from about 42 to 47% using the market definition of economic activity, and from 55 to 58% using the extended definition. The share of private non-agricultural wage work has increased from 26% to 29% over the 1998-2006 period. Non-wage work, including employers, self-employed individuals, and unpaid family workers, has also grown rapidly at about 8% per annum. "Agricultural non-wage work was one of the fastest growing sectors, but that result may be due to improved measurement of women’s home-based market activities. Notwithstanding the measurement issues, the rapid growth of male agricultural non-wage work (at 6.7% per annum) shows that this sector had very vigorous growth" (Assaad, 2006b).
Tables 6 and 7 present the distribution of total employment by sector of ownership and economic activity in 1990, 1995, 2000 and 2004 according to the regular labour force sample surveys (LFSS).
Sector of Ownership
Table 6 presents the distribution of employment by sector of ownership. It clearly shows important changes from 1990 to 2004.
First, although the Egyptian economy has been implementing a program of structural adjustment in the beginning of the 1990s aiming at reducing the role of the state, the public sector (including the government sector and public enterprises) is still a major employer. Moreover, the share of the public sector in total employment has increased from 31.8% in 1990 to 34.4% in 2003. This is due to the substantial increase in the share of the government sector which grew from 22.1% in 1990 to reach a high 28.7% in 2003. This indicates that government employment grew more rapidly than overall employment although its growth slowed down by the end of the nineties. The increase in the government employment can be explained by the very high demand in public services such as health and education in which the government sector continues to hire at high levels.
Second, table 6 shows that this increase in government employment has offset the large downsizing and contraction of public enterprises which share in total employment fell from 9.7% in 1990 to only 5.3% in 2004, especially beginning from 1995 with the implementation of the privatisation program.
Table 6: Distribution of Total Employment by Sector of Ownership (1990-2004) in%
someone engaged in market work or any activity involving the production or processing of primary goods, and animal husbandry for purposes of household consumption (subsistence activities) for at least 1 hour in reference week. 23 When the market definition of economic activity is used, on the contrary, female participation increases significantly from 21.4% in 1998 to 25.5% in 2006. Male participation is not affected by the definition of economic activity that is used.
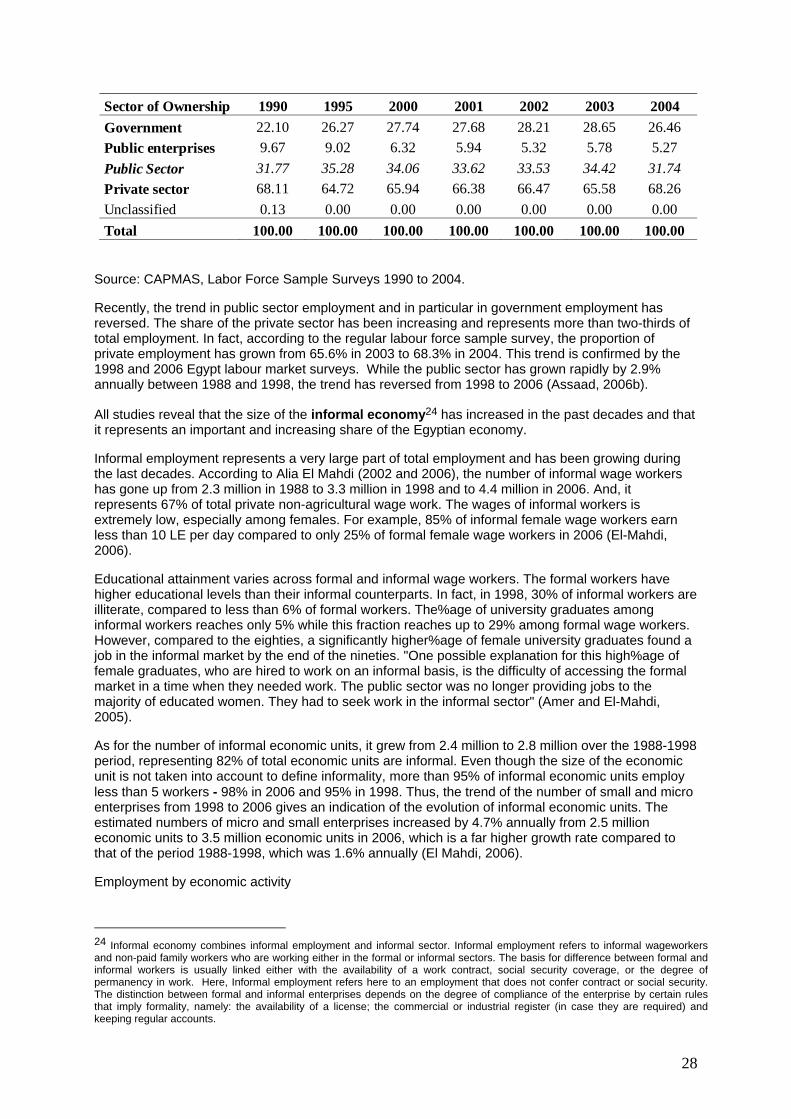
28
Sector of Ownership 1990 1995 2000 2001 2002 2003 2004 Government 22.10 26.27 27.74 27.68 28.21 28.65 26.46 Public enterprises 9.67 9.02 6.32 5.94 5.32 5.78 5.27 Public Sector 31.77 35.28 34.06 33.62 33.53 34.42 31.74 Private sector 68.11 64.72 65.94 66.38 66.47 65.58 68.26 Unclassified 0.13 0.00 0.00 0.00 0.00 0.00 0.00 Total 100.00 100.00 100.00 100.00 100.00 100.00 100.00
Source: CAPMAS, Labor Force Sample Surveys 1990 to 2004.
Recently, the trend in public sector employment and in particular in government employment has reversed. The share of the private sector has been increasing and represents more than two-thirds of total employment. In fact, according to the regular labour force sample survey, the proportion of private employment has grown from 65.6% in 2003 to 68.3% in 2004. This trend is confirmed by the 1998 and 2006 Egypt labour market surveys. While the public sector has grown rapidly by 2.9% annually between 1988 and 1998, the trend has reversed from 1998 to 2006 (Assaad, 2006b).
All studies reveal that the size of the informal economy24 has increased in the past decades and that it represents an important and increasing share of the Egyptian economy.
Informal employment represents a very large part of total employment and has been growing during the last decades. According to Alia El Mahdi (2002 and 2006), the number of informal wage workers has gone up from 2.3 million in 1988 to 3.3 million in 1998 and to 4.4 million in 2006. And, it represents 67% of total private non-agricultural wage work. The wages of informal workers is extremely low, especially among females. For example, 85% of informal female wage workers earn less than 10 LE per day compared to only 25% of formal female wage workers in 2006 (El-Mahdi, 2006).
Educational attainment varies across formal and informal wage workers. The formal workers have higher educational levels than their informal counterparts. In fact, in 1998, 30% of informal workers are illiterate, compared to less than 6% of formal workers. The%age of university graduates among informal workers reaches only 5% while this fraction reaches up to 29% among formal wage workers. However, compared to the eighties, a significantly higher%age of female university graduates found a job in the informal market by the end of the nineties. "One possible explanation for this high%age of female graduates, who are hired to work on an informal basis, is the difficulty of accessing the formal market in a time when they needed work. The public sector was no longer providing jobs to the majority of educated women. They had to seek work in the informal sector" (Amer and El-Mahdi, 2005).
As for the number of informal economic units, it grew from 2.4 million to 2.8 million over the 1988-1998 period, representing 82% of total economic units are informal. Even though the size of the economic unit is not taken into account to define informality, more than 95% of informal economic units employ less than 5 workers - 98% in 2006 and 95% in 1998. Thus, the trend of the number of small and micro enterprises from 1998 to 2006 gives an indication of the evolution of informal economic units. The estimated numbers of micro and small enterprises increased by 4.7% annually from 2.5 million economic units to 3.5 million economic units in 2006, which is a far higher growth rate compared to that of the period 1988-1998, which was 1.6% annually (El Mahdi, 2006).
Employment by economic activity
24 Informal economy combines informal employment and informal sector. Informal employment refers to informal wageworkers and non-paid family workers who are working either in the formal or informal sectors. The basis for difference between formal and informal workers is usually linked either with the availability of a work contract, social security coverage, or the degree of permanency in work. Here, Informal employment refers here to an employment that does not confer contract or social security. The distinction between formal and informal enterprises depends on the degree of compliance of the enterprise by certain rules that imply formality, namely: the availability of a license; the commercial or industrial register (in case they are required) and keeping regular accounts.
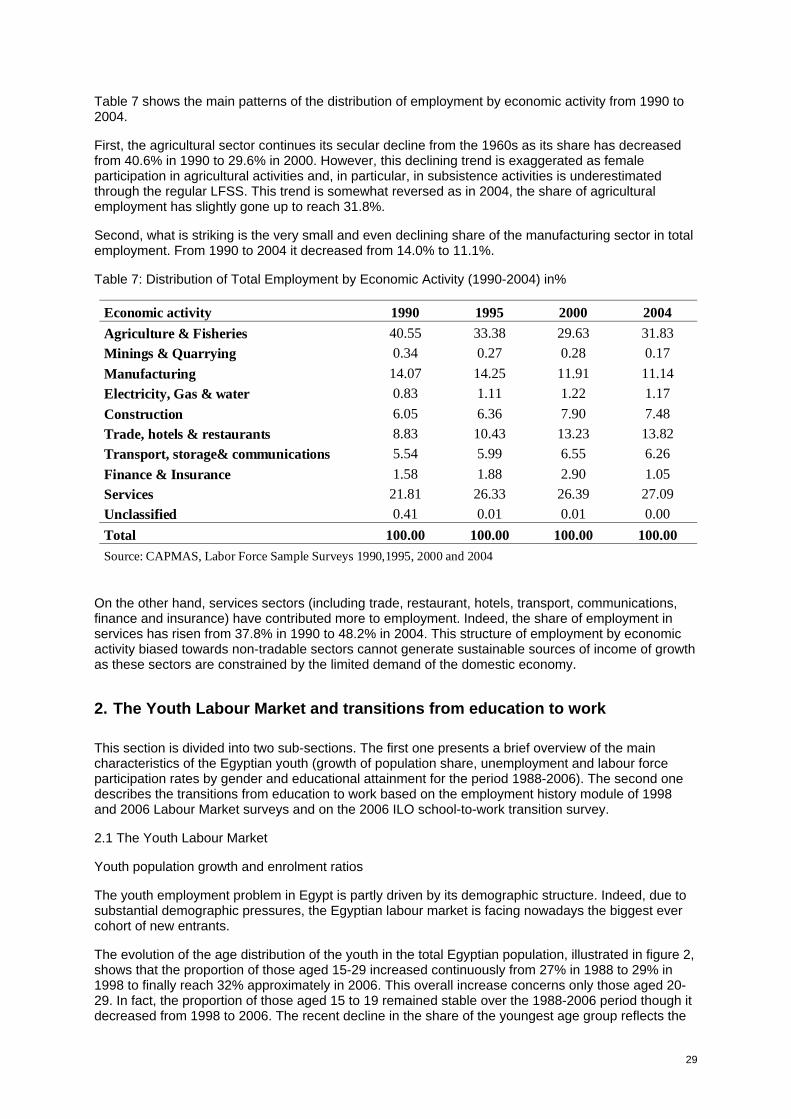
29
Table 7 shows the main patterns of the distribution of employment by economic activity from 1990 to 2004.
First, the agricultural sector continues its secular decline from the 1960s as its share has decreased from 40.6% in 1990 to 29.6% in 2000. However, this declining trend is exaggerated as female participation in agricultural activities and, in particular, in subsistence activities is underestimated through the regular LFSS. This trend is somewhat reversed as in 2004, the share of agricultural employment has slightly gone up to reach 31.8%.
Second, what is striking is the very small and even declining share of the manufacturing sector in total employment. From 1990 to 2004 it decreased from 14.0% to 11.1%.
Table 7: Distribution of Total Employment by Economic Activity (1990-2004) in%
Economic activity 1990 1995 2000 2004 Agriculture & Fisheries 40.55 33.38 29.63 31.83 Minings & Quarrying 0.34 0.27 0.28 0.17 Manufacturing 14.07 14.25 11.91 11.14 Electricity, Gas & water 0.83 1.11 1.22 1.17 Construction 6.05 6.36 7.90 7.48 Trade, hotels & restaurants 8.83 10.43 13.23 13.82 Transport, storage& communications 5.54 5.99 6.55 6.26 Finance & Insurance 1.58 1.88 2.90 1.05 Services 21.81 26.33 26.39 27.09 Unclassified 0.41 0.01 0.01 0.00 Total 100.00 100.00 100.00 100.00 Source: CAPMAS, Labor Force Sample Surveys 1990,1995, 2000 and 2004
On the other hand, services sectors (including trade, restaurant, hotels, transport, communications, finance and insurance) have contributed more to employment. Indeed, the share of employment in services has risen from 37.8% in 1990 to 48.2% in 2004. This structure of employment by economic activity biased towards non-tradable sectors cannot generate sustainable sources of income of growth as these sectors are constrained by the limited demand of the domestic economy.
2. The Youth Labour Market and transitions from education to work
This section is divided into two sub-sections. The first one presents a brief overview of the main characteristics of the Egyptian youth (growth of population share, unemployment and labour force participation rates by gender and educational attainment for the period 1988-2006). The second one describes the transitions from education to work based on the employment history module of 1998 and 2006 Labour Market surveys and on the 2006 ILO school-to-work transition survey.
2.1 The Youth Labour Market
Youth population growth and enrolment ratios
The youth employment problem in Egypt is partly driven by its demographic structure. Indeed, due to substantial demographic pressures, the Egyptian labour market is facing nowadays the biggest ever cohort of new entrants.
The evolution of the age distribution of the youth in the total Egyptian population, illustrated in figure 2, shows that the proportion of those aged 15-29 increased continuously from 27% in 1988 to 29% in 1998 to finally reach 32% approximately in 2006. This overall increase concerns only those aged 20-29. In fact, the proportion of those aged 15 to 19 remained stable over the 1988-2006 period though it decreased from 1998 to 2006. The recent decline in the share of the youngest age group reflects the
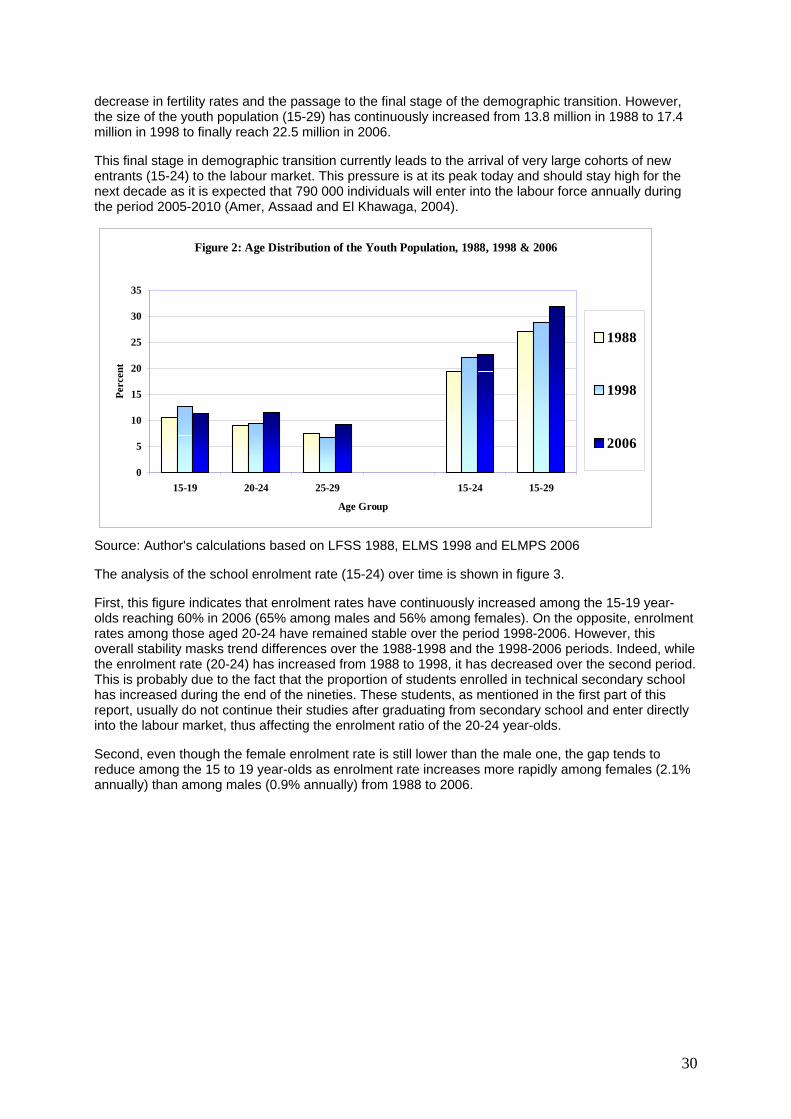
30
decrease in fertility rates and the passage to the final stage of the demographic transition. However, the size of the youth population (15-29) has continuously increased from 13.8 million in 1988 to 17.4 million in 1998 to finally reach 22.5 million in 2006.
This final stage in demographic transition currently leads to the arrival of very large cohorts of new entrants (15-24) to the labour market. This pressure is at its peak today and should stay high for the next decade as it is expected that 790 000 individuals will enter into the labour force annually during the period 2005-2010 (Amer, Assaad and El Khawaga, 2004).
Figure 2: Age Distribution of the Youth Population, 1988, 1998 & 2006
0
5
10
15
20
25
30
35
15-19 20-24 25-29 15-24 15-29
Age Group
Perc
ent
1988
1998
2006
Source: Author's calculations based on LFSS 1988, ELMS 1998 and ELMPS 2006
The analysis of the school enrolment rate (15-24) over time is shown in figure 3.
First, this figure indicates that enrolment rates have continuously increased among the 15-19 year-olds reaching 60% in 2006 (65% among males and 56% among females). On the opposite, enrolment rates among those aged 20-24 have remained stable over the period 1998-2006. However, this overall stability masks trend differences over the 1988-1998 and the 1998-2006 periods. Indeed, while the enrolment rate (20-24) has increased from 1988 to 1998, it has decreased over the second period. This is probably due to the fact that the proportion of students enrolled in technical secondary school has increased during the end of the nineties. These students, as mentioned in the first part of this report, usually do not continue their studies after graduating from secondary school and enter directly into the labour market, thus affecting the enrolment ratio of the 20-24 year-olds.
Second, even though the female enrolment rate is still lower than the male one, the gap tends to reduce among the 15 to 19 year-olds as enrolment rate increases more rapidly among females (2.1% annually) than among males (0.9% annually) from 1988 to 2006.
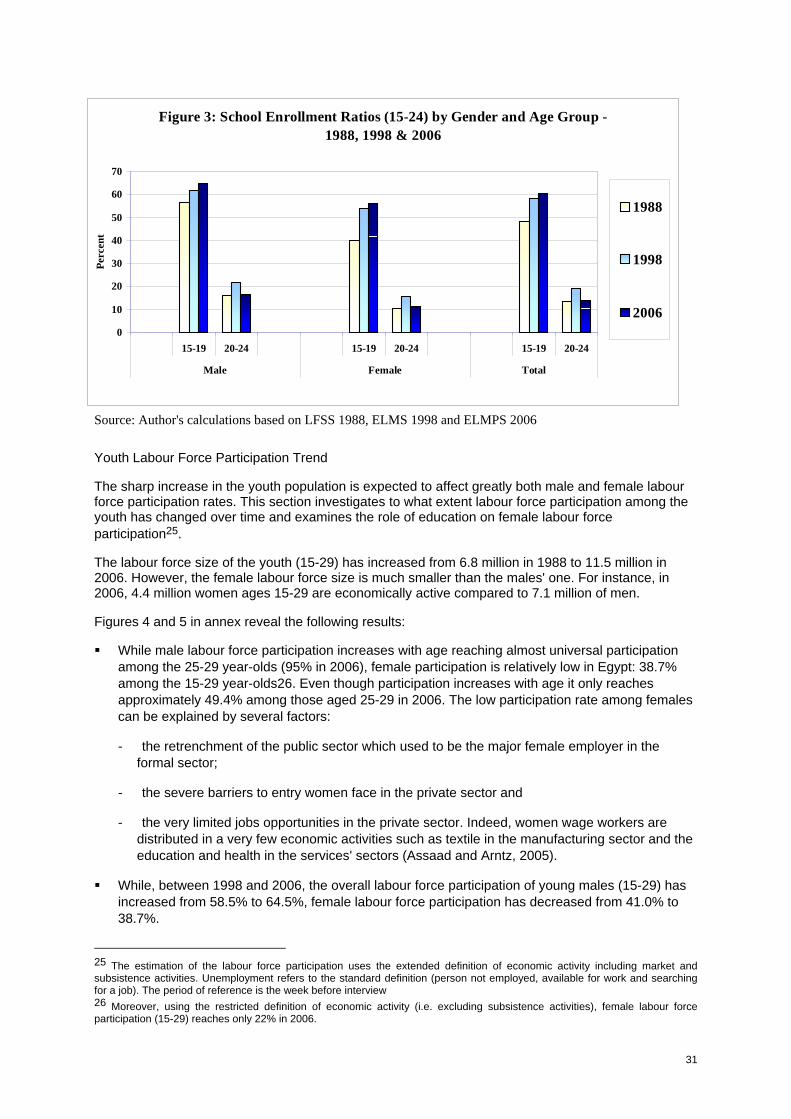
31
Figure 3: School Enrollment Ratios (15-24) by Gender and Age Group - 1988, 1998 & 2006
0
10
20
30
40
50
60
70
15-19 20-24 15-19 20-24 15-19 20-24
Male Female Total
Perc
ent
1988
1998
2006
Source: Author's calculations based on LFSS 1988, ELMS 1998 and ELMPS 2006
Youth Labour Force Participation Trend
The sharp increase in the youth population is expected to affect greatly both male and female labour force participation rates. This section investigates to what extent labour force participation among the youth has changed over time and examines the role of education on female labour force participation25.
The labour force size of the youth (15-29) has increased from 6.8 million in 1988 to 11.5 million in 2006. However, the female labour force size is much smaller than the males' one. For instance, in 2006, 4.4 million women ages 15-29 are economically active compared to 7.1 million of men.
Figures 4 and 5 in annex reveal the following results:
While male labour force participation increases with age reaching almost universal participation among the 25-29 year-olds (95% in 2006), female participation is relatively low in Egypt: 38.7% among the 15-29 year-olds26. Even though participation increases with age it only reaches approximately 49.4% among those aged 25-29 in 2006. The low participation rate among females can be explained by several factors:
- the retrenchment of the public sector which used to be the major female employer in the formal sector;
- the severe barriers to entry women face in the private sector and
- the very limited jobs opportunities in the private sector. Indeed, women wage workers are distributed in a very few economic activities such as textile in the manufacturing sector and the education and health in the services' sectors (Assaad and Arntz, 2005).
While, between 1998 and 2006, the overall labour force participation of young males (15-29) has increased from 58.5% to 64.5%, female labour force participation has decreased from 41.0% to 38.7%.
25 The estimation of the labour force participation uses the extended definition of economic activity including market and subsistence activities. Unemployment refers to the standard definition (person not employed, available for work and searching for a job). The period of reference is the week before interview 26 Moreover, using the restricted definition of economic activity (i.e. excluding subsistence activities), female labour force participation (15-29) reaches only 22% in 2006.
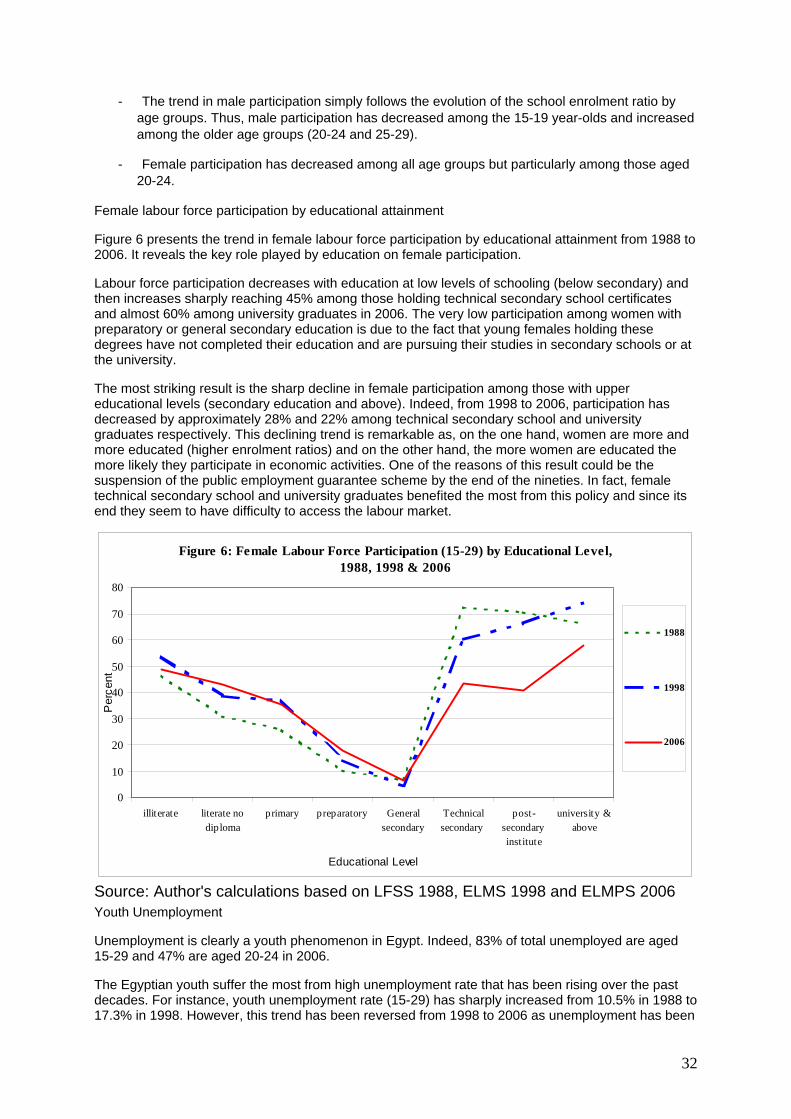
32
- The trend in male participation simply follows the evolution of the school enrolment ratio by age groups. Thus, male participation has decreased among the 15-19 year-olds and increased among the older age groups (20-24 and 25-29).
- Female participation has decreased among all age groups but particularly among those aged 20-24.
Female labour force participation by educational attainment
Figure 6 presents the trend in female labour force participation by educational attainment from 1988 to 2006. It reveals the key role played by education on female participation.
Labour force participation decreases with education at low levels of schooling (below secondary) and then increases sharply reaching 45% among those holding technical secondary school certificates and almost 60% among university graduates in 2006. The very low participation among women with preparatory or general secondary education is due to the fact that young females holding these degrees have not completed their education and are pursuing their studies in secondary schools or at the university.
The most striking result is the sharp decline in female participation among those with upper educational levels (secondary education and above). Indeed, from 1998 to 2006, participation has decreased by approximately 28% and 22% among technical secondary school and university graduates respectively. This declining trend is remarkable as, on the one hand, women are more and more educated (higher enrolment ratios) and on the other hand, the more women are educated the more likely they participate in economic activities. One of the reasons of this result could be the suspension of the public employment guarantee scheme by the end of the nineties. In fact, female technical secondary school and university graduates benefited the most from this policy and since its end they seem to have difficulty to access the labour market.
Figure 6: Female Labour Force Participation (15-29) by Educational Level,1988, 1998 & 2006
0
10
20
30
40
50
60
70
80
illiterate literate nodiploma
primary preparatory Generalsecondary
Technicalsecondary
post-secondaryinstitute
university &above
Educational Level
Per
cent
1988
1998
2006
Source: Author's calculations based on LFSS 1988, ELMS 1998 and ELMPS 2006 Youth Unemployment
Unemployment is clearly a youth phenomenon in Egypt. Indeed, 83% of total unemployed are aged 15-29 and 47% are aged 20-24 in 2006.
The Egyptian youth suffer the most from high unemployment rate that has been rising over the past decades. For instance, youth unemployment rate (15-29) has sharply increased from 10.5% in 1988 to 17.3% in 1998. However, this trend has been reversed from 1998 to 2006 as unemployment has been
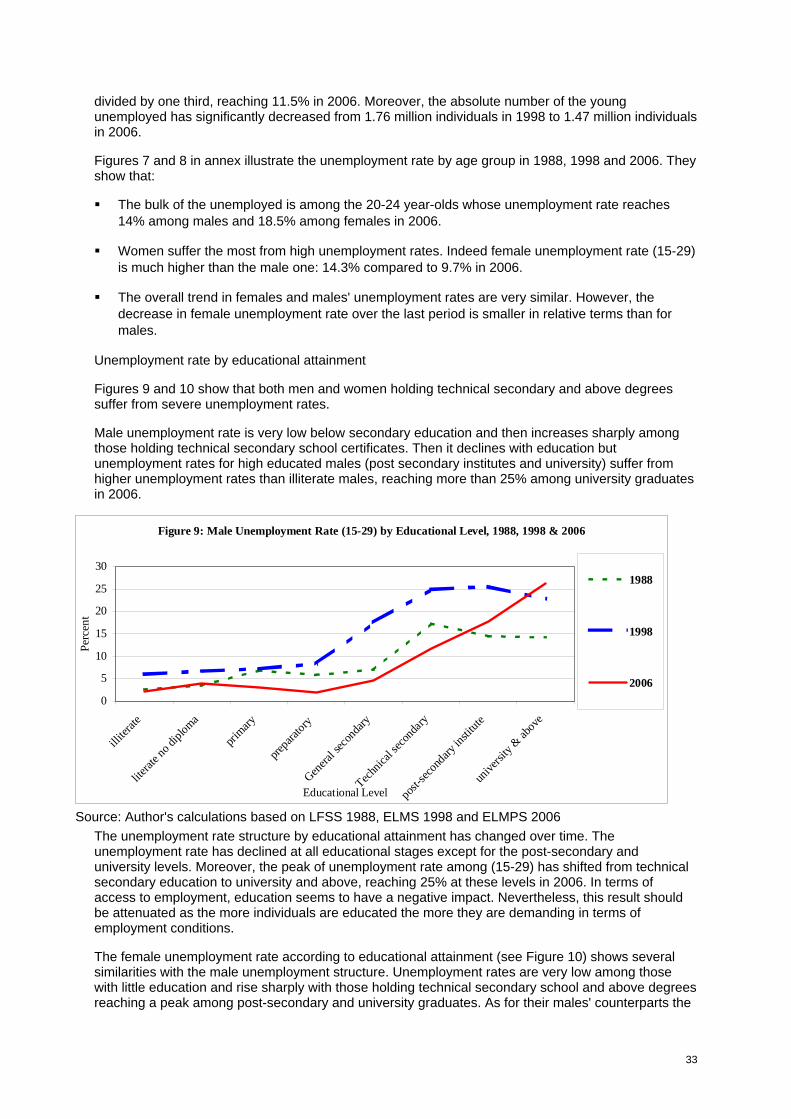
33
divided by one third, reaching 11.5% in 2006. Moreover, the absolute number of the young unemployed has significantly decreased from 1.76 million individuals in 1998 to 1.47 million individuals in 2006.
Figures 7 and 8 in annex illustrate the unemployment rate by age group in 1988, 1998 and 2006. They show that:
The bulk of the unemployed is among the 20-24 year-olds whose unemployment rate reaches 14% among males and 18.5% among females in 2006.
Women suffer the most from high unemployment rates. Indeed female unemployment rate (15-29) is much higher than the male one: 14.3% compared to 9.7% in 2006.
The overall trend in females and males' unemployment rates are very similar. However, the decrease in female unemployment rate over the last period is smaller in relative terms than for males.
Unemployment rate by educational attainment
Figures 9 and 10 show that both men and women holding technical secondary and above degrees suffer from severe unemployment rates.
Male unemployment rate is very low below secondary education and then increases sharply among those holding technical secondary school certificates. Then it declines with education but unemployment rates for high educated males (post secondary institutes and university) suffer from higher unemployment rates than illiterate males, reaching more than 25% among university graduates in 2006.
Figure 9: Male Unemployment Rate (15-29) by Educational Level, 1988, 1998 & 2006
0
5
10
15
20
25
30
illiter
ate
literat
e no d
iplom
a
primary
prepa
ratory
Genera
l seco
ndary
Technic
al sec
onda
ry
post-
secon
dary
institu
te
unive
rsity
& abov
e
Educational Level
Perc
ent
1988
1998
2006
Source: Author's calculations based on LFSS 1988, ELMS 1998 and ELMPS 2006 The unemployment rate structure by educational attainment has changed over time. The unemployment rate has declined at all educational stages except for the post-secondary and university levels. Moreover, the peak of unemployment rate among (15-29) has shifted from technical secondary education to university and above, reaching 25% at these levels in 2006. In terms of access to employment, education seems to have a negative impact. Nevertheless, this result should be attenuated as the more individuals are educated the more they are demanding in terms of employment conditions.
The female unemployment rate according to educational attainment (see Figure 10) shows several similarities with the male unemployment structure. Unemployment rates are very low among those with little education and rise sharply with those holding technical secondary school and above degrees reaching a peak among post-secondary and university graduates. As for their males' counterparts the
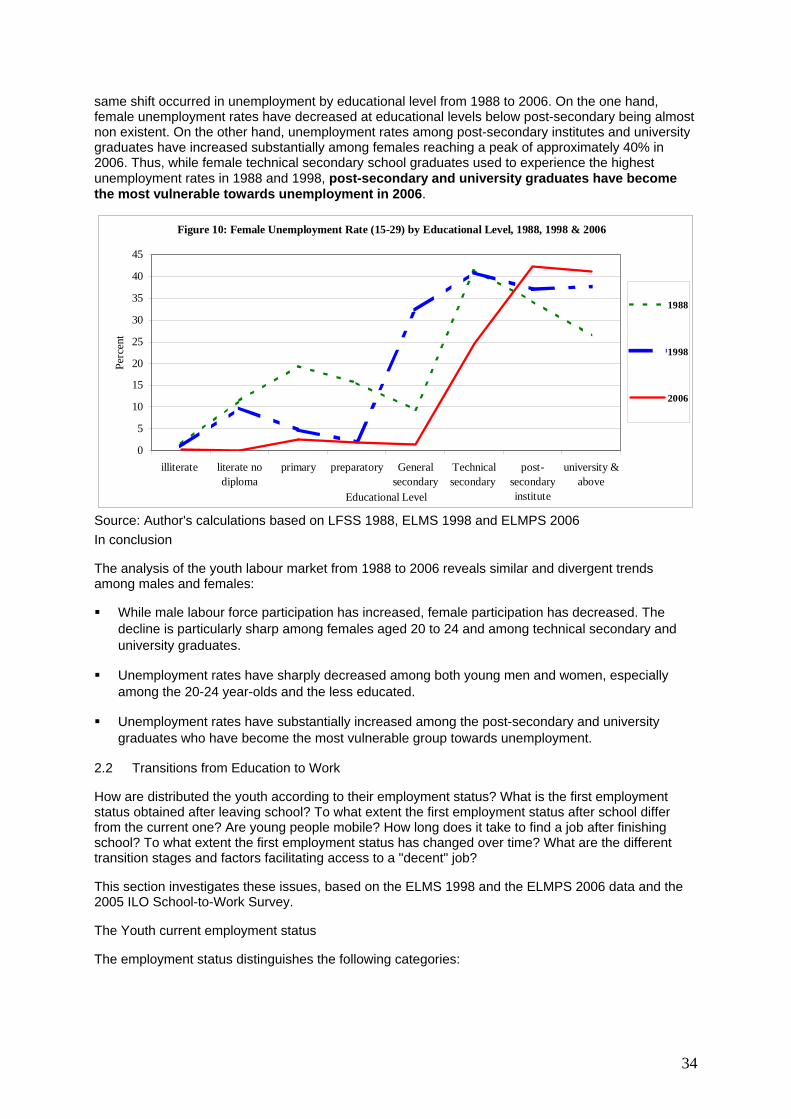
34
same shift occurred in unemployment by educational level from 1988 to 2006. On the one hand, female unemployment rates have decreased at educational levels below post-secondary being almost non existent. On the other hand, unemployment rates among post-secondary institutes and university graduates have increased substantially among females reaching a peak of approximately 40% in 2006. Thus, while female technical secondary school graduates used to experience the highest unemployment rates in 1988 and 1998, post-secondary and university graduates have become the most vulnerable towards unemployment in 2006.
Figure 10: Female Unemployment Rate (15-29) by Educational Level, 1988, 1998 & 2006
0
5
10
15
20
25
30
35
40
45
illiterate literate nodiploma
primary preparatory Generalsecondary
Technicalsecondary
post-secondaryinstitute
university &above
Educational Level
Perc
ent
1988
1998
2006
Source: Author's calculations based on LFSS 1988, ELMS 1998 and ELMPS 2006 In conclusion
The analysis of the youth labour market from 1988 to 2006 reveals similar and divergent trends among males and females:
While male labour force participation has increased, female participation has decreased. The decline is particularly sharp among females aged 20 to 24 and among technical secondary and university graduates.
Unemployment rates have sharply decreased among both young men and women, especially among the 20-24 year-olds and the less educated.
Unemployment rates have substantially increased among the post-secondary and university graduates who have become the most vulnerable group towards unemployment.
2.2 Transitions from Education to Work
How are distributed the youth according to their employment status? What is the first employment status obtained after leaving school? To what extent the first employment status after school differ from the current one? Are young people mobile? How long does it take to find a job after finishing school? To what extent the first employment status has changed over time? What are the different transition stages and factors facilitating access to a "decent" job?
This section investigates these issues, based on the ELMS 1998 and the ELMPS 2006 data and the 2005 ILO School-to-Work Survey.
The Youth current employment status
The employment status distinguishes the following categories:

35
employment: public employment, formal and informal private employment and unpaid family work27
unemployment
student
out of the labour force
The distribution of the youth by current employment status is presented in tables 11 and 12. These tables show that a large proportion of the 15-29 year-olds are studying. For instance, 32% of the males and 23% of the females are students in 2006. However, these large proportions vary a lot among the various age groups (from 65% among the 15-19 to only 1% among the 25-29 in 2006).
Males
First, table 11 indicates that, in 2006, 42% of young males are out of the labour force (32% are studying and 10% inactive for other reasons)28, 7% are unemployed and 50% are employed. However, they are mainly informally employed, either in the private sector (22%) or in unpaid family work (13%).
Second, the distribution of young men according to their current employment status has changed over the 8-year period.
From 1998 to 2006, the proportion of males in school has increased among the 15-19 year-olds from 60% to 65% and has slightly decreased among the older groups. This result confirms the evolution in enrolment ratios that increased among those aged 15-19 and decreased among those aged 20-24 (see figure 3 above).
At the same time, the proportion of young males working in the informal private sector has decreased (from 25 to 22%), especially among the 15-19 year-olds while the proportion of those in private formal work has greatly increased (from 5 to 8%), especially among the 25-29 year-olds. Moreover, the proportion of those unemployed has also decreased, especially among the youngest males. For instance, it has been divided by almost 2 among the 15-19 year-olds.
Table 11: Distribution of the Males (Ages 15-29) by their Current Employment Status in 1998 and 2006
15-19 20-24 25-29 Total 15-29
1998 2006 1998 2006 1998 2006 1998 2006
Public 0.7 0.5 6.7 4.7 19.2 19.2 6.9 7.0
Private Formal 0.8 0.9 5.3 6.4 13.5 21.1 5.2 8.3
Private Informal 18.2 9.8 25.4 23.5 38.8 36.9 25.2 21.9
Unpaid Family worker 8.2 14.7 7.3 13.6 9.1 10.1 8.1 13.1
Unemployed 6.0 3.6 11.1 11.5 9.6 7.6 8.5 7.4
Student 60.2 65.0 20.9 19.4 2.8 1.1 34.1 32.1
Out of LF 5.9 5.6 23.2 20.9 6.9 3.9 12.0 10.3
27 Public employment includes government and public enterprises' employment. Formal private employment refers to employment with a written contract or social security. On the opposite, private informal employment refers to employment with no written contract and no social security. 28 The high proportion of young males (20-24) out of the labour force but not at school is due to the fact that some of them are undergoing their military service. Military service is mandatory for males and lasts one to three years according to the educational level. It is done after finishing education or at the age of 18.
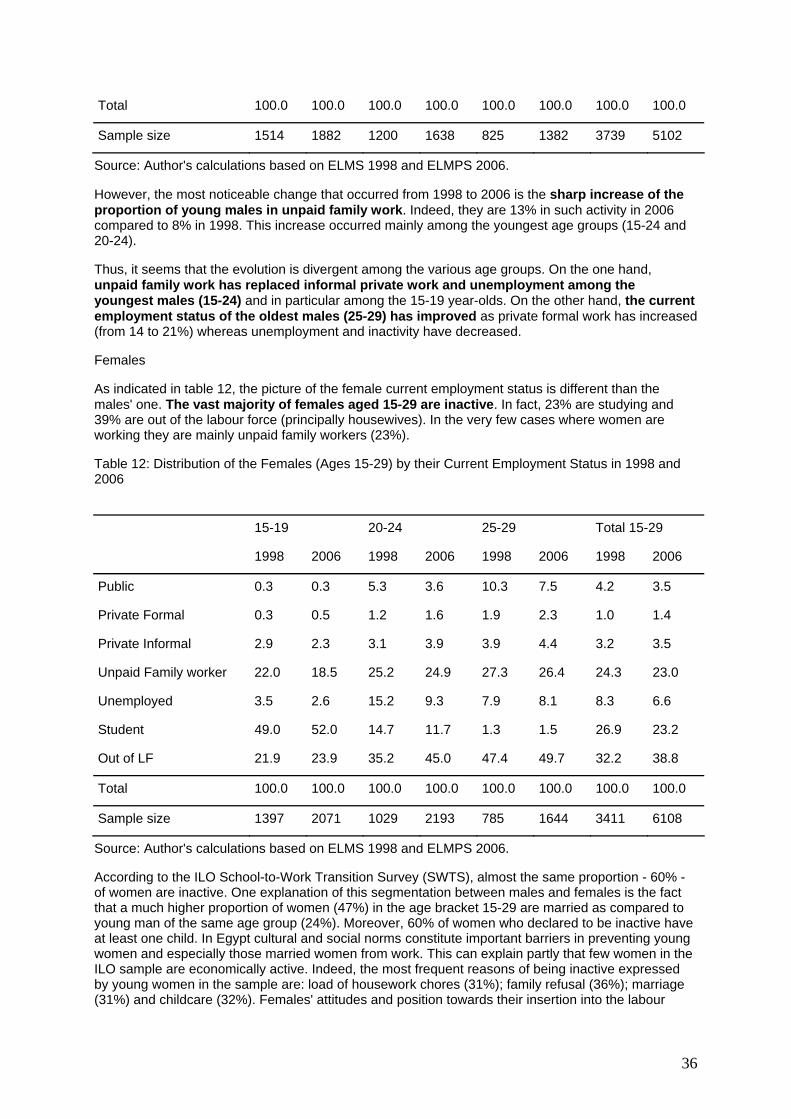
36
Total 100.0 100.0 100.0 100.0 100.0 100.0 100.0 100.0
Sample size 1514 1882 1200 1638 825 1382 3739 5102
Source: Author's calculations based on ELMS 1998 and ELMPS 2006.
However, the most noticeable change that occurred from 1998 to 2006 is the sharp increase of the proportion of young males in unpaid family work. Indeed, they are 13% in such activity in 2006 compared to 8% in 1998. This increase occurred mainly among the youngest age groups (15-24 and 20-24).
Thus, it seems that the evolution is divergent among the various age groups. On the one hand, unpaid family work has replaced informal private work and unemployment among the youngest males (15-24) and in particular among the 15-19 year-olds. On the other hand, the current employment status of the oldest males (25-29) has improved as private formal work has increased (from 14 to 21%) whereas unemployment and inactivity have decreased.
Females
As indicated in table 12, the picture of the female current employment status is different than the males' one. The vast majority of females aged 15-29 are inactive. In fact, 23% are studying and 39% are out of the labour force (principally housewives). In the very few cases where women are working they are mainly unpaid family workers (23%).
Table 12: Distribution of the Females (Ages 15-29) by their Current Employment Status in 1998 and 2006
15-19 20-24 25-29 Total 15-29
1998 2006 1998 2006 1998 2006 1998 2006
Public 0.3 0.3 5.3 3.6 10.3 7.5 4.2 3.5
Private Formal 0.3 0.5 1.2 1.6 1.9 2.3 1.0 1.4
Private Informal 2.9 2.3 3.1 3.9 3.9 4.4 3.2 3.5
Unpaid Family worker 22.0 18.5 25.2 24.9 27.3 26.4 24.3 23.0
Unemployed 3.5 2.6 15.2 9.3 7.9 8.1 8.3 6.6
Student 49.0 52.0 14.7 11.7 1.3 1.5 26.9 23.2
Out of LF 21.9 23.9 35.2 45.0 47.4 49.7 32.2 38.8
Total 100.0 100.0 100.0 100.0 100.0 100.0 100.0 100.0
Sample size 1397 2071 1029 2193 785 1644 3411 6108
Source: Author's calculations based on ELMS 1998 and ELMPS 2006.
According to the ILO School-to-Work Transition Survey (SWTS), almost the same proportion - 60% - of women are inactive. One explanation of this segmentation between males and females is the fact that a much higher proportion of women (47%) in the age bracket 15-29 are married as compared to young man of the same age group (24%). Moreover, 60% of women who declared to be inactive have at least one child. In Egypt cultural and social norms constitute important barriers in preventing young women and especially those married women from work. This can explain partly that few women in the ILO sample are economically active. Indeed, the most frequent reasons of being inactive expressed by young women in the sample are: load of housework chores (31%); family refusal (36%); marriage (31%) and childcare (32%). Females' attitudes and position towards their insertion into the labour
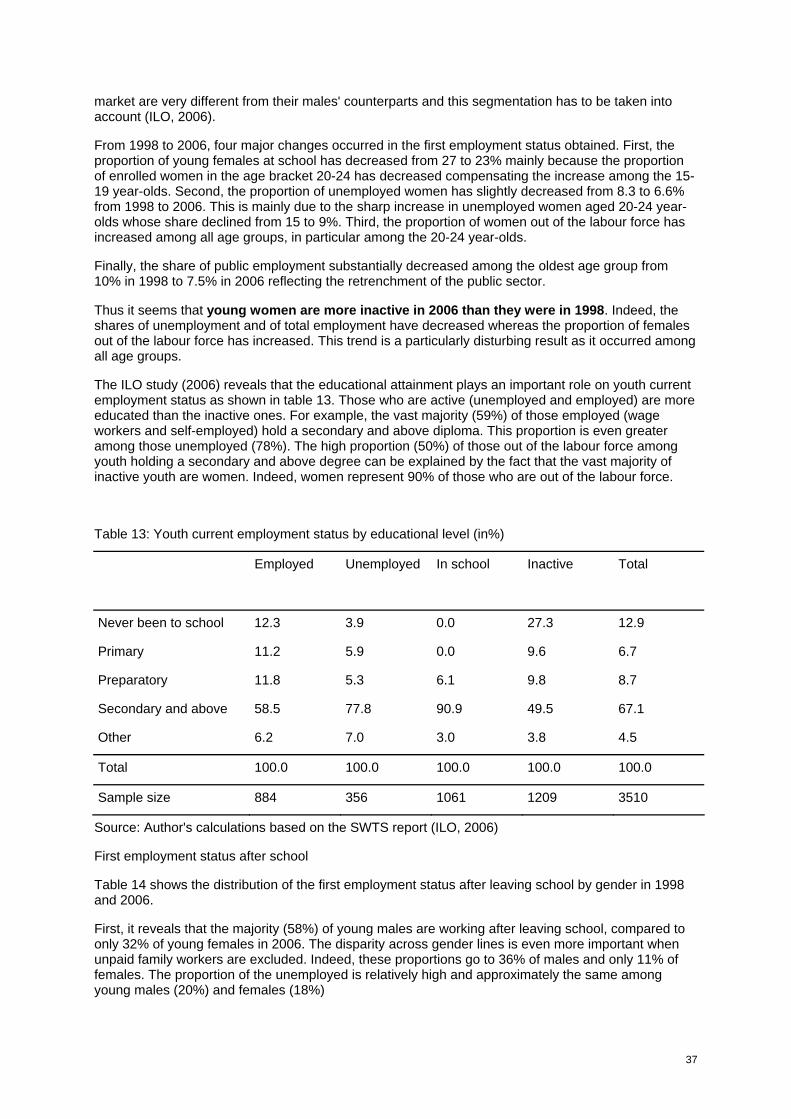
37
market are very different from their males' counterparts and this segmentation has to be taken into account (ILO, 2006).
From 1998 to 2006, four major changes occurred in the first employment status obtained. First, the proportion of young females at school has decreased from 27 to 23% mainly because the proportion of enrolled women in the age bracket 20-24 has decreased compensating the increase among the 15-19 year-olds. Second, the proportion of unemployed women has slightly decreased from 8.3 to 6.6% from 1998 to 2006. This is mainly due to the sharp increase in unemployed women aged 20-24 year-olds whose share declined from 15 to 9%. Third, the proportion of women out of the labour force has increased among all age groups, in particular among the 20-24 year-olds.
Finally, the share of public employment substantially decreased among the oldest age group from 10% in 1998 to 7.5% in 2006 reflecting the retrenchment of the public sector.
Thus it seems that young women are more inactive in 2006 than they were in 1998. Indeed, the shares of unemployment and of total employment have decreased whereas the proportion of females out of the labour force has increased. This trend is a particularly disturbing result as it occurred among all age groups.
The ILO study (2006) reveals that the educational attainment plays an important role on youth current employment status as shown in table 13. Those who are active (unemployed and employed) are more educated than the inactive ones. For example, the vast majority (59%) of those employed (wage workers and self-employed) hold a secondary and above diploma. This proportion is even greater among those unemployed (78%). The high proportion (50%) of those out of the labour force among youth holding a secondary and above degree can be explained by the fact that the vast majority of inactive youth are women. Indeed, women represent 90% of those who are out of the labour force.
Table 13: Youth current employment status by educational level (in%)
Employed
Unemployed
In school
Inactive
Total
Never been to school 12.3 3.9 0.0 27.3 12.9
Primary 11.2 5.9 0.0 9.6 6.7
Preparatory 11.8 5.3 6.1 9.8 8.7
Secondary and above 58.5 77.8 90.9 49.5 67.1
Other 6.2 7.0 3.0 3.8 4.5
Total 100.0 100.0 100.0 100.0 100.0
Sample size 884 356 1061 1209 3510
Source: Author's calculations based on the SWTS report (ILO, 2006)
First employment status after school
Table 14 shows the distribution of the first employment status after leaving school by gender in 1998 and 2006.
First, it reveals that the majority (58%) of young males are working after leaving school, compared to only 32% of young females in 2006. The disparity across gender lines is even more important when unpaid family workers are excluded. Indeed, these proportions go to 36% of males and only 11% of females. The proportion of the unemployed is relatively high and approximately the same among young males (20%) and females (18%)
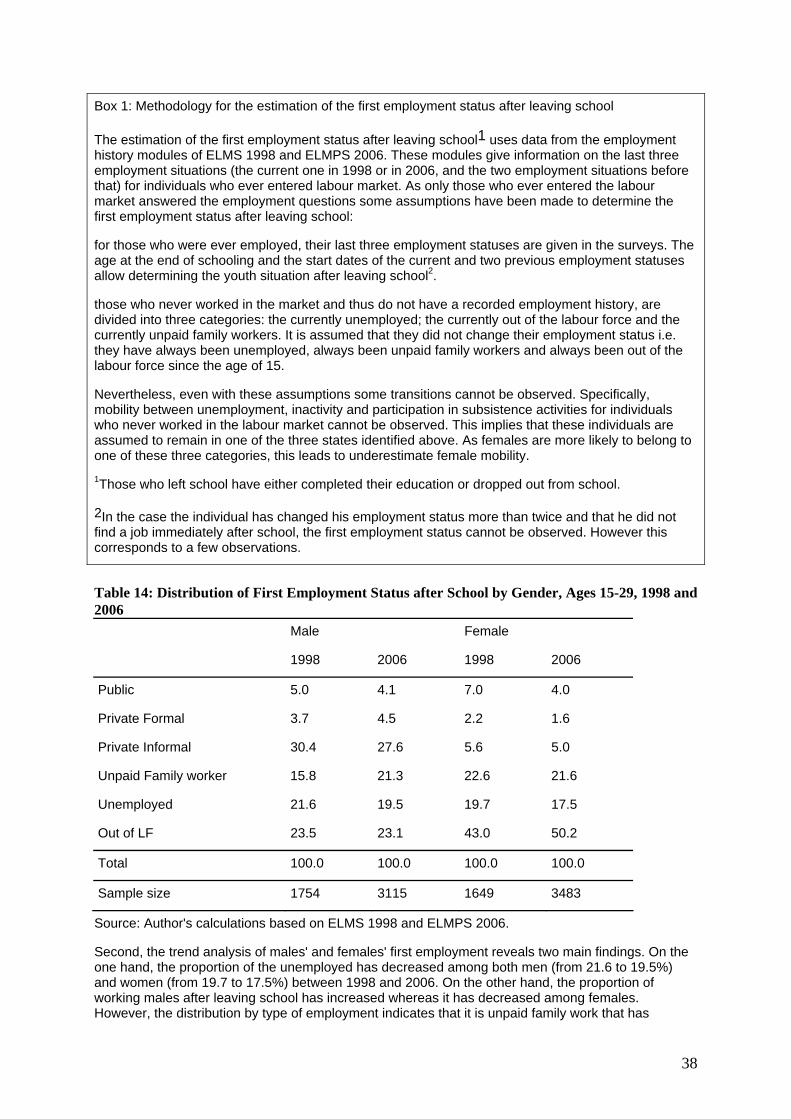
38
Box 1: Methodology for the estimation of the first employment status after leaving school
The estimation of the first employment status after leaving school1 uses data from the employment history modules of ELMS 1998 and ELMPS 2006. These modules give information on the last three employment situations (the current one in 1998 or in 2006, and the two employment situations before that) for individuals who ever entered labour market. As only those who ever entered the labour market answered the employment questions some assumptions have been made to determine the first employment status after leaving school:
for those who were ever employed, their last three employment statuses are given in the surveys. The age at the end of schooling and the start dates of the current and two previous employment statuses allow determining the youth situation after leaving school2.
those who never worked in the market and thus do not have a recorded employment history, are divided into three categories: the currently unemployed; the currently out of the labour force and the currently unpaid family workers. It is assumed that they did not change their employment status i.e. they have always been unemployed, always been unpaid family workers and always been out of the labour force since the age of 15.
Nevertheless, even with these assumptions some transitions cannot be observed. Specifically, mobility between unemployment, inactivity and participation in subsistence activities for individuals who never worked in the labour market cannot be observed. This implies that these individuals are assumed to remain in one of the three states identified above. As females are more likely to belong to one of these three categories, this leads to underestimate female mobility. 1Those who left school have either completed their education or dropped out from school.
2In the case the individual has changed his employment status more than twice and that he did not find a job immediately after school, the first employment status cannot be observed. However this corresponds to a few observations.
Table 14: Distribution of First Employment Status after School by Gender, Ages 15-29, 1998 and 2006 Male Female
1998 2006 1998 2006
Public 5.0 4.1 7.0 4.0
Private Formal 3.7 4.5 2.2 1.6
Private Informal 30.4 27.6 5.6 5.0
Unpaid Family worker 15.8 21.3 22.6 21.6
Unemployed 21.6 19.5 19.7 17.5
Out of LF 23.5 23.1 43.0 50.2
Total 100.0 100.0 100.0 100.0
Sample size 1754 3115 1649 3483
Source: Author's calculations based on ELMS 1998 and ELMPS 2006.
Second, the trend analysis of males' and females' first employment reveals two main findings. On the one hand, the proportion of the unemployed has decreased among both men (from 21.6 to 19.5%) and women (from 19.7 to 17.5%) between 1998 and 2006. On the other hand, the proportion of working males after leaving school has increased whereas it has decreased among females. However, the distribution by type of employment indicates that it is unpaid family work that has

39
substantially increased for men (from 16 to 21%). As opposed to men, 50% of women are inactive in 2006 compared to 43% in 1998. Furthermore, the proportions of all types of employment have decreased, and especially the public employment one.
The duration of the Transition from School to Work
How long does it take for a young individual to find a job after leaving school? Has this duration changed over time? To investigate these issues, failure and hazard estimates of the time to get the first job according to gender, marital status and type of first job over time are examined.
The first job refers to the first job that lasted at least 6 months ever obtained by an individual in both 1998 and 2006 surveys. The 6 months threshold has been chosen to avoid considering summer jobs as first jobs. As educated young people are those who suffer the most from difficult access to employment and high unemployment rates, the analysis is restricted to young people who finished school. Particular attention is given to secondary and post-secondary graduates. Time between the end of schooling and the time individuals obtain their first job is estimated in number of years. In the case a young individual has found a job before finishing school, time to get a job after school has been set to 0 ( i.e. immediate entry)29. The estimation of the cumulative probability of having obtained a first job by year since the individual left school is given in figures 15, 16, 17 and 18 in annex. They show the following results:
Young individuals and especially young men tend to find a job more rapidly after leaving school in 2006 compared to 1998. In 2006, 50% of males have found a job within two years after leaving school compared to 3 years in 199830.
Less than 25% of females have found a job 8 years after leaving school.
The duration in obtaining a job after leaving school has decreased for women and particularly for the unmarried ones from 1998 to 2006.
Education does not longer play a key role among young males in the duration to get their first job.
On the opposite, educational attainment plays a greater role among females. However, it tends to be less significant as the gap in the duration to obtain the first job between less than secondary and more than secondary graduates has decreased from 1998 to 2006.
Youth mobility
This section gives an indication of the youth mobility through the comparison of the first and the current employment statuses for young individuals who left school and aged between 15 and 29 in 200631. Results are shown in tables 14 and 15. The figures in the diagonal cells indicate the persistency rate in one employment status. The total row represents the current employment status distribution of the youth who left school.
Males
Table 19 shows that persistency rates are high in public (93%) and formal private employment (83%). When young males obtain their first job in such sectors they are not likely to move to another employment status.
29 Hazard estimates are not statistically significant for those who enter the labour market lately (i.e. after 8 years of schooling among males and after 12 years of schooling among females) because the number of observations is too small (less than 30). Thus, the analysis of hazard estimates is restricted to those who obtained their first job in a range of 0 to 12 years after leaving school. 30 This result could be explained by the increasing proportion of informal jobs obtained (see below) that are easier to find. Moreover, the fact that the length of the military service depends on the educational level could have also played a role. Indeed, the less educated (less than university) spend one year in military service while university graduates spend 3 years. The fact that a greater proportion of young men joined technical secondary schools and do not pursue higher education (see part 1) and thus spend "only" 1 year in military service could have shortened the duration to find the first job. 31 The transition rates are only indicative as the time between the first and the current employment status is not taken into account.

40
On the opposite, unemployment, unpaid family work and private informal work are not permanent statuses. Indeed, almost half of those who were unemployed after school have found a job, mainly an informal private one (18% of those initially unemployed). One quarter of those who were initially unpaid family workers have found a job, also mainly an informal one (17%). Thus, the private informal sector drains young males who were unemployed or started as unpaid family workers.
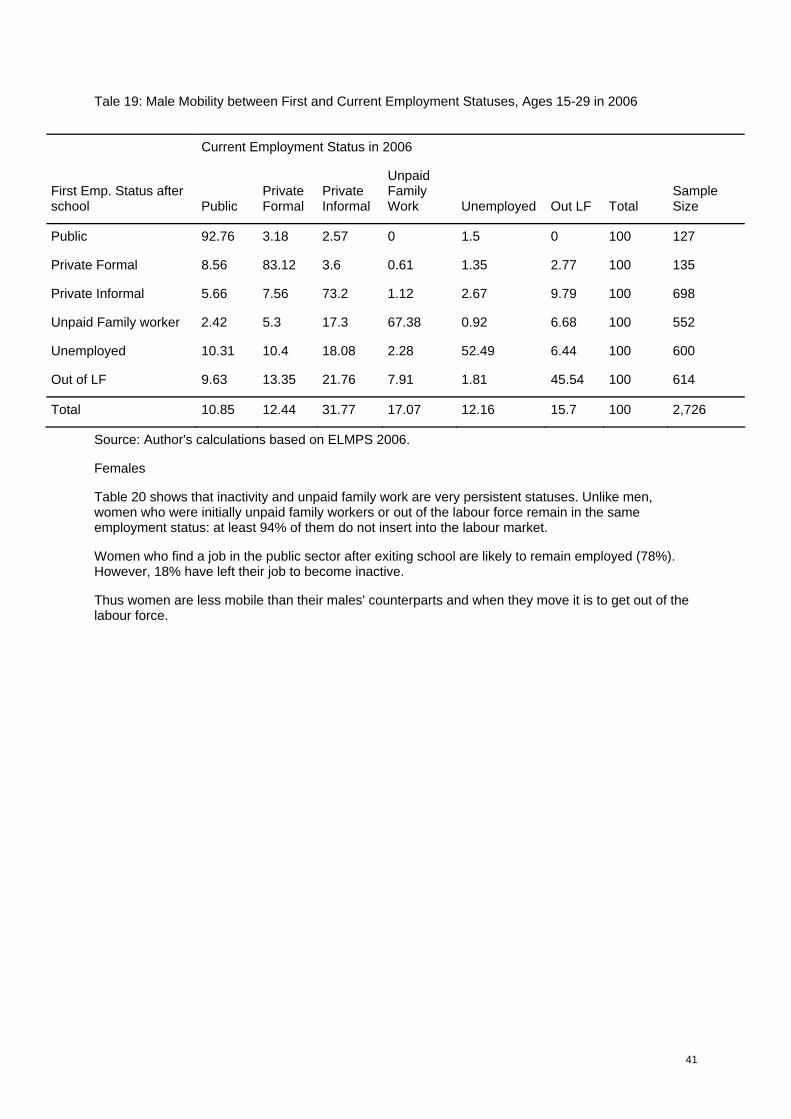
41
Tale 19: Male Mobility between First and Current Employment Statuses, Ages 15-29 in 2006
Current Employment Status in 2006
First Emp. Status after school Public
Private Formal
Private Informal
Unpaid Family Work Unemployed Out LF Total
Sample Size
Public 92.76 3.18 2.57 0 1.5 0 100 127
Private Formal 8.56 83.12 3.6 0.61 1.35 2.77 100 135
Private Informal 5.66 7.56 73.2 1.12 2.67 9.79 100 698
Unpaid Family worker 2.42 5.3 17.3 67.38 0.92 6.68 100 552
Unemployed 10.31 10.4 18.08 2.28 52.49 6.44 100 600
Out of LF 9.63 13.35 21.76 7.91 1.81 45.54 100 614
Total 10.85 12.44 31.77 17.07 12.16 15.7 100 2,726
Source: Author's calculations based on ELMPS 2006.
Females
Table 20 shows that inactivity and unpaid family work are very persistent statuses. Unlike men, women who were initially unpaid family workers or out of the labour force remain in the same employment status: at least 94% of them do not insert into the labour market.
Women who find a job in the public sector after exiting school are likely to remain employed (78%). However, 18% have left their job to become inactive.
Thus women are less mobile than their males' counterparts and when they move it is to get out of the labour force.
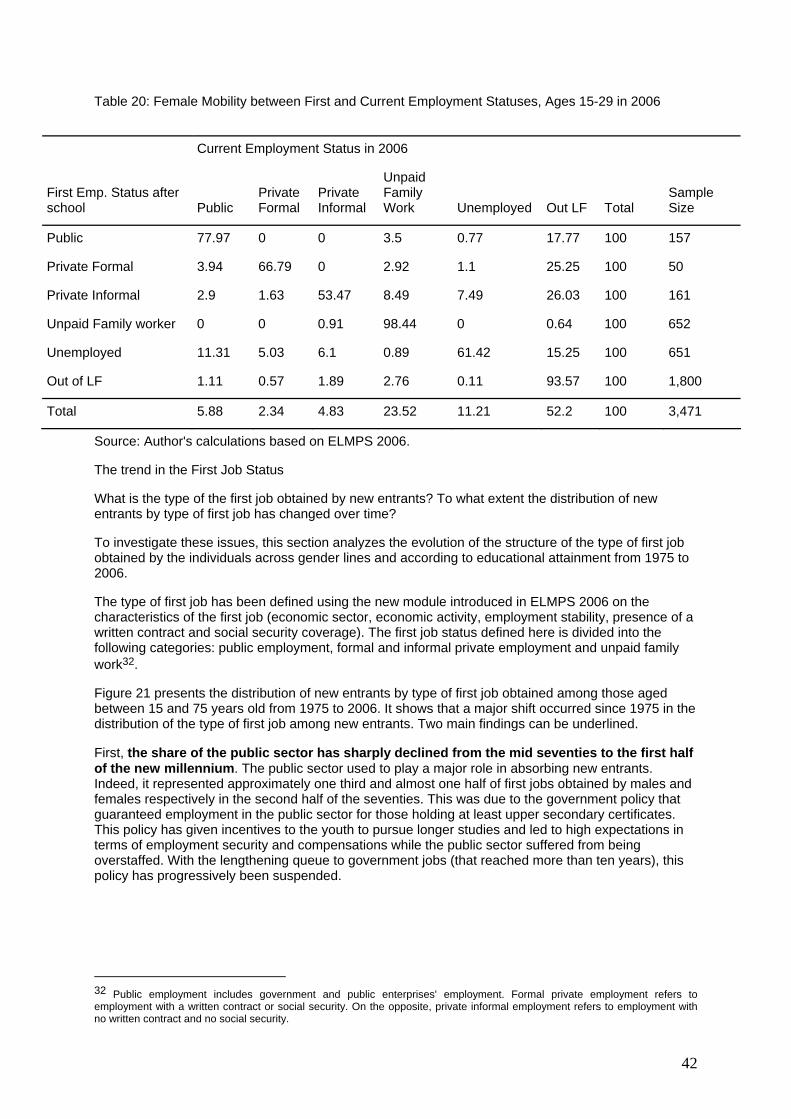
42
Table 20: Female Mobility between First and Current Employment Statuses, Ages 15-29 in 2006
Current Employment Status in 2006
First Emp. Status after school Public
Private Formal
Private Informal
Unpaid Family Work Unemployed Out LF Total
Sample Size
Public 77.97 0 0 3.5 0.77 17.77 100 157
Private Formal 3.94 66.79 0 2.92 1.1 25.25 100 50
Private Informal 2.9 1.63 53.47 8.49 7.49 26.03 100 161
Unpaid Family worker 0 0 0.91 98.44 0 0.64 100 652
Unemployed 11.31 5.03 6.1 0.89 61.42 15.25 100 651
Out of LF 1.11 0.57 1.89 2.76 0.11 93.57 100 1,800
Total 5.88 2.34 4.83 23.52 11.21 52.2 100 3,471
Source: Author's calculations based on ELMPS 2006.
The trend in the First Job Status
What is the type of the first job obtained by new entrants? To what extent the distribution of new entrants by type of first job has changed over time?
To investigate these issues, this section analyzes the evolution of the structure of the type of first job obtained by the individuals across gender lines and according to educational attainment from 1975 to 2006.
The type of first job has been defined using the new module introduced in ELMPS 2006 on the characteristics of the first job (economic sector, economic activity, employment stability, presence of a written contract and social security coverage). The first job status defined here is divided into the following categories: public employment, formal and informal private employment and unpaid family work32.
Figure 21 presents the distribution of new entrants by type of first job obtained among those aged between 15 and 75 years old from 1975 to 2006. It shows that a major shift occurred since 1975 in the distribution of the type of first job among new entrants. Two main findings can be underlined.
First, the share of the public sector has sharply declined from the mid seventies to the first half of the new millennium. The public sector used to play a major role in absorbing new entrants. Indeed, it represented approximately one third and almost one half of first jobs obtained by males and females respectively in the second half of the seventies. This was due to the government policy that guaranteed employment in the public sector for those holding at least upper secondary certificates. This policy has given incentives to the youth to pursue longer studies and led to high expectations in terms of employment security and compensations while the public sector suffered from being overstaffed. With the lengthening queue to government jobs (that reached more than ten years), this policy has progressively been suspended.
32 Public employment includes government and public enterprises' employment. Formal private employment refers to employment with a written contract or social security. On the opposite, private informal employment refers to employment with no written contract and no social security.
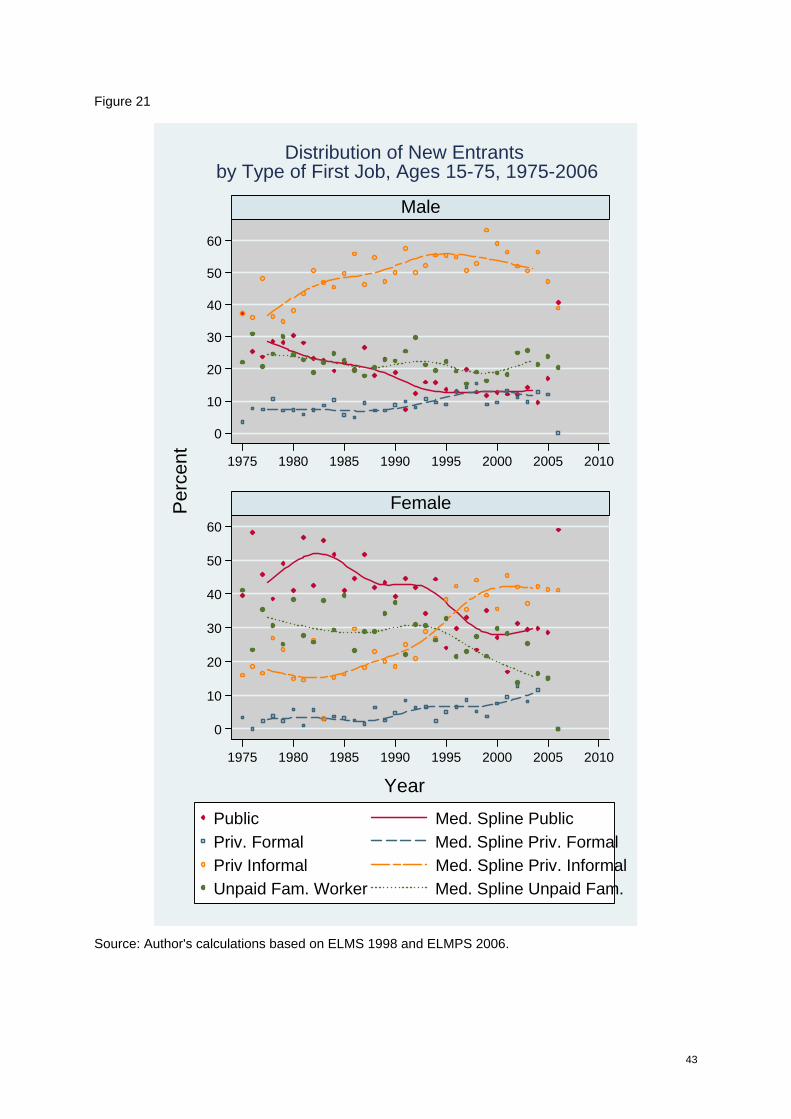
43
Figure 21
0
10
20
30
40
50
60
1975 1980 1985 1990 1995 2000 2005 2010
Male
0
10
20
30
40
50
60
1975 1980 1985 1990 1995 2000 2005 2010
Female
Public Med. Spline PublicPriv. Formal Med. Spline Priv. FormalPriv Informal Med. Spline Priv. InformalUnpaid Fam. Worker Med. Spline Unpaid Fam.
Per
cent
Year
Distribution of New Entrants by Type of First Job, Ages 15-75, 1975-2006
Source: Author's calculations based on ELMS 1998 and ELMPS 2006.
44
Moreover, the share of public enterprises in first employment has also been significantly reduced due to a major privatisation program within the context of the economic reform launched in the beginning of the 1990s. As a result, the share of total public employment has shrunk over time to represent around one tenth of male first employment and less than a third of female first employment in 2006. However, contrarily to men, the trend in public employment among women is not smooth. Public employment has first increased in the second half of the seventies reaching a peak of approximately 50% in the first half of the eighties. Since then, the share in public employment has gradually decreased reaching approximately one third of female first jobs by the beginning of the new millennium.
As shown in figures 22 and 23 in annex, the decline in public employment is more dramatic among technical secondary school and university graduates who used to be the main beneficiaries of the public employment guarantee scheme. Indeed, among university graduates, the share of public employment has been divided by 3 among males and by 2 among females from 1975 to 2006. The figures are even worse among technical secondary graduates. For instance, the share of the public sector has decreased from 54% in mid seventies to less than 5% in the beginning of the new millennium among male new entrants and from almost 100% to less than 20% among their females' counterparts.
Second, the share of the private sector in first employment has substantially increased over the period 1975-2006. Indeed, the proportion of total private employment has increased from one half to two-third among males and from approximately 40% to more than 50% among females. Both formal and informal employment shares have greatly increased among male and female new entrants.
However, in the beginning of the new millennium, formal private employment still represents a small share of new entrants' first jobs (less than 15%) whereas informal private employment represents almost half first jobs obtained by new entrants (56% among males and 42% among females).
The rise in informal employment share is striking among technical secondary school and university graduates new entrants (see Figures 22 and 23 in annex). Indeed, from 1975 to 2006 it has doubled among male technical secondary school graduates and tripled among male university graduates. Among female technical secondary school graduates the figures are even more dramatic: in 2006, informal first employment represents half first jobs obtained whereas it was almost non existent in 1975. Moreover, unpaid family work has greatly risen among both male and female secondary and above new entrants.
In conclusion, a major shift occurred in the distribution of new entrants according to the type of job obtained from 1975 to 2006. Informal employment has replaced public employment as major employer of new entrants. The informalisation of the entry into the labour market is particularly significant among secondary and above graduates and especially among women who used to be absorbed by the public sector through the public employment guarantee scheme.

45
Transition stages
This section presents the results of the first nationally representative school-to-work transition survey (SWTS) in Egypt and, in particular, the different transition stages and factors that facilitate or make difficult the access to a "good" job are presented.
Box 2: The ILO School-to-Work Survey
In the framework of the Millennium Declaration, the Youth Employment Network (YEN) was created in partnership with the UN, the World Bank and the ILO. In this context and as Egypt is a "lead country" within YEN, the ILO with a contribution from UNFPA conducted the first nationally representative school-to-work transition survey (SWTS) in Egypt in 2005/20061.
The main objective of SWTS is to identify the factors that impede or facilitate the entry of young people aged 15-29 to the labour market as they first exit school in order to respond to the challenges of youth insertion into the labour market.
Methodology of the survey
The survey is representative at the level of ten governorates1. Data was collected between mid September and mid October 2005.
The main target group of the SWTS is young people aged between 15 and 29. The wide age bracket has been chosen in order to take into account the following two facts:
Many young people choose long schooling tracks and thus finish their education by age of 22-25.
The compulsory military service for males last one or three years after they finish their education depending on the educational level. Thus, the entry of males to the labour market can be delayed till the age of 28-29 if they have pursued long educational tracks.
In order to tackle both supply and demand sides the survey targets five different groups of respondents:
in-school youth;
job seekers;
young employees;
young self employed and own account workers and
employers hiring young people
Three questionnaires were designed in order to take into consideration the different above mentioned categories:
a household questionnaire in order to select one young individual per household
a youth questionnaire for individuals 15-29 year of age
an employer questionnaire for those hiring young people.
Finally, the total sample size is as follows:
out of 5423 household selected 3510 young people aged 15-29 were interviewed (1,724 males and 1,789 females) and
347 enterprises were selected, divided into 171 formal and 184 informal enterprises.
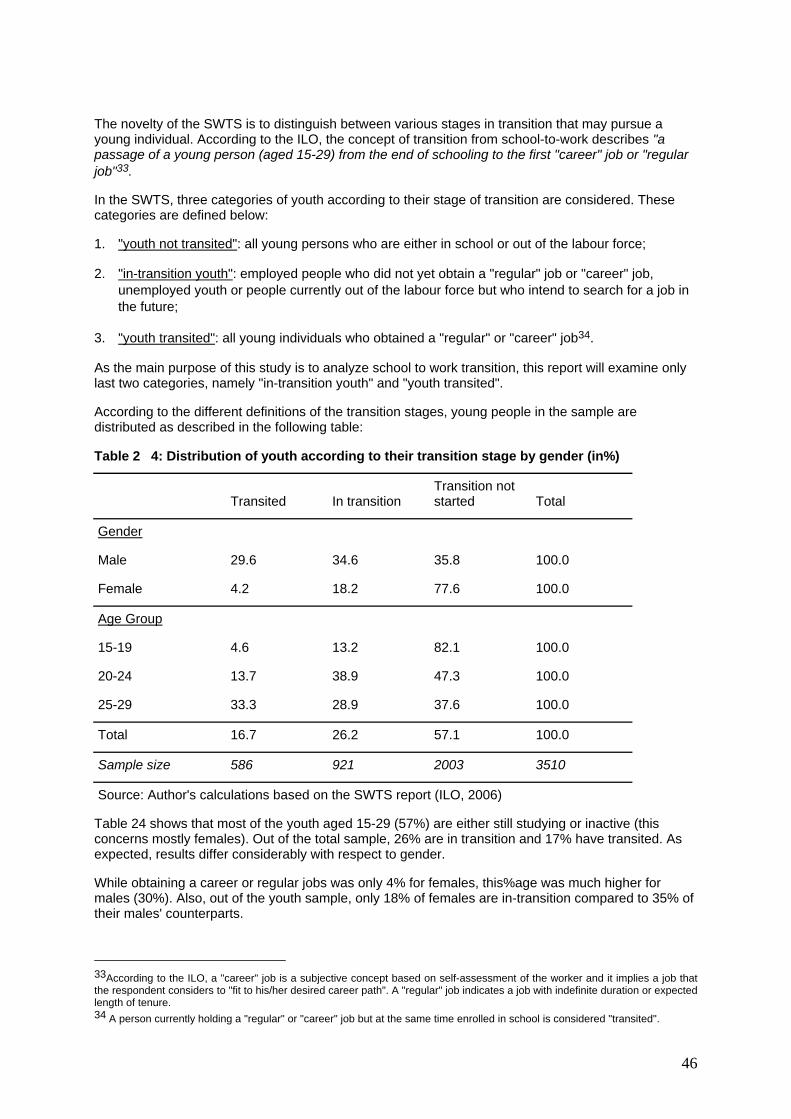
46
The novelty of the SWTS is to distinguish between various stages in transition that may pursue a young individual. According to the ILO, the concept of transition from school-to-work describes "a passage of a young person (aged 15-29) from the end of schooling to the first "career" job or "regular job"33.
In the SWTS, three categories of youth according to their stage of transition are considered. These categories are defined below:
1. "youth not transited": all young persons who are either in school or out of the labour force;
2. "in-transition youth": employed people who did not yet obtain a "regular" job or "career" job, unemployed youth or people currently out of the labour force but who intend to search for a job in the future;
3. "youth transited": all young individuals who obtained a "regular" or "career" job34.
As the main purpose of this study is to analyze school to work transition, this report will examine only last two categories, namely "in-transition youth" and "youth transited".
According to the different definitions of the transition stages, young people in the sample are distributed as described in the following table:
Table 2 4: Distribution of youth according to their transition stage by gender (in%)
Transited In transition Transition not started Total
Gender
Male 29.6 34.6 35.8 100.0
Female 4.2 18.2 77.6 100.0
Age Group
15-19 4.6 13.2 82.1 100.0
20-24 13.7 38.9 47.3 100.0
25-29 33.3 28.9 37.6 100.0
Total 16.7 26.2 57.1 100.0
Sample size 586 921 2003 3510
Source: Author's calculations based on the SWTS report (ILO, 2006)
Table 24 shows that most of the youth aged 15-29 (57%) are either still studying or inactive (this concerns mostly females). Out of the total sample, 26% are in transition and 17% have transited. As expected, results differ considerably with respect to gender.
While obtaining a career or regular jobs was only 4% for females, this%age was much higher for males (30%). Also, out of the youth sample, only 18% of females are in-transition compared to 35% of their males' counterparts.
33According to the ILO, a "career" job is a subjective concept based on self-assessment of the worker and it implies a job that the respondent considers to "fit to his/her desired career path". A "regular" job indicates a job with indefinite duration or expected length of tenure. 34 A person currently holding a "regular" or "career" job but at the same time enrolled in school is considered "transited".
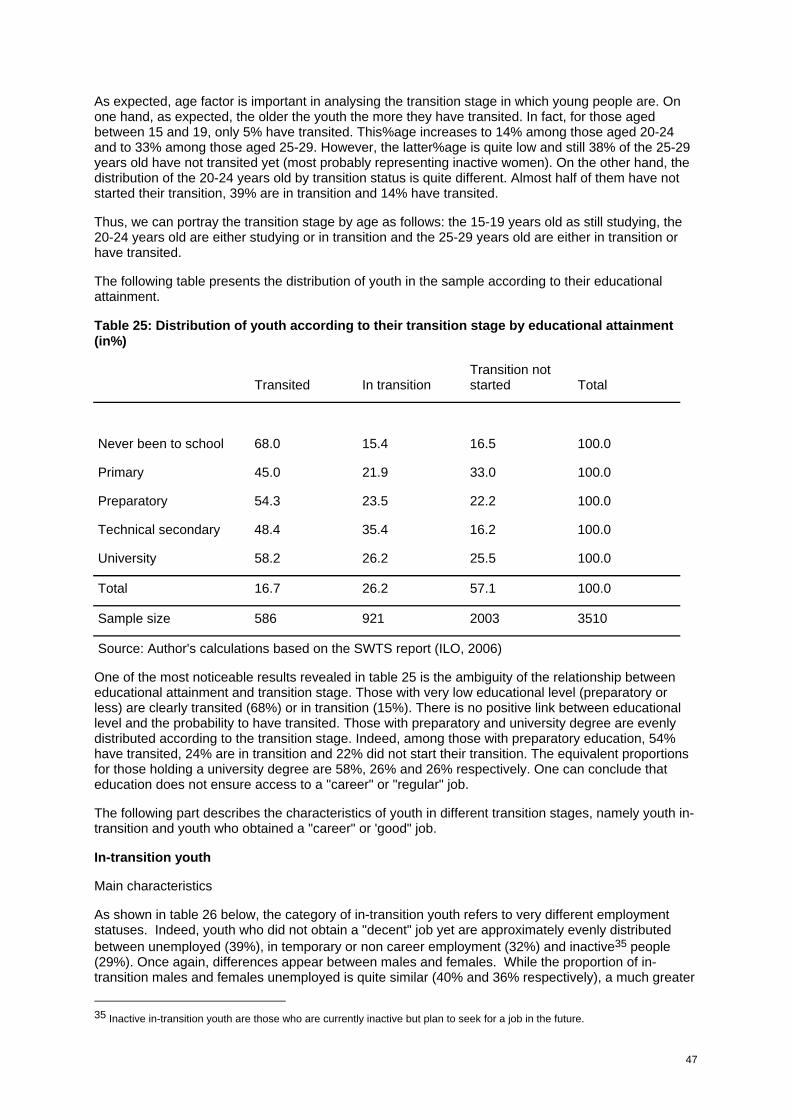
47
As expected, age factor is important in analysing the transition stage in which young people are. On one hand, as expected, the older the youth the more they have transited. In fact, for those aged between 15 and 19, only 5% have transited. This%age increases to 14% among those aged 20-24 and to 33% among those aged 25-29. However, the latter%age is quite low and still 38% of the 25-29 years old have not transited yet (most probably representing inactive women). On the other hand, the distribution of the 20-24 years old by transition status is quite different. Almost half of them have not started their transition, 39% are in transition and 14% have transited.
Thus, we can portray the transition stage by age as follows: the 15-19 years old as still studying, the 20-24 years old are either studying or in transition and the 25-29 years old are either in transition or have transited.
The following table presents the distribution of youth in the sample according to their educational attainment.
Table 25: Distribution of youth according to their transition stage by educational attainment (in%)
Transited In transition Transition not started Total
Never been to school 68.0 15.4 16.5 100.0
Primary 45.0 21.9 33.0 100.0
Preparatory 54.3 23.5 22.2 100.0
Technical secondary 48.4 35.4 16.2 100.0
University 58.2 26.2 25.5 100.0
Total 16.7 26.2 57.1 100.0
Sample size 586 921 2003 3510
Source: Author's calculations based on the SWTS report (ILO, 2006)
One of the most noticeable results revealed in table 25 is the ambiguity of the relationship between educational attainment and transition stage. Those with very low educational level (preparatory or less) are clearly transited (68%) or in transition (15%). There is no positive link between educational level and the probability to have transited. Those with preparatory and university degree are evenly distributed according to the transition stage. Indeed, among those with preparatory education, 54% have transited, 24% are in transition and 22% did not start their transition. The equivalent proportions for those holding a university degree are 58%, 26% and 26% respectively. One can conclude that education does not ensure access to a "career" or "regular" job.
The following part describes the characteristics of youth in different transition stages, namely youth in-transition and youth who obtained a "career" or 'good" job.
In-transition youth
Main characteristics
As shown in table 26 below, the category of in-transition youth refers to very different employment statuses. Indeed, youth who did not obtain a "decent" job yet are approximately evenly distributed between unemployed (39%), in temporary or non career employment (32%) and inactive35 people (29%). Once again, differences appear between males and females. While the proportion of in-transition males and females unemployed is quite similar (40% and 36% respectively), a much greater
35 Inactive in-transition youth are those who are currently inactive but plan to seek for a job in the future.
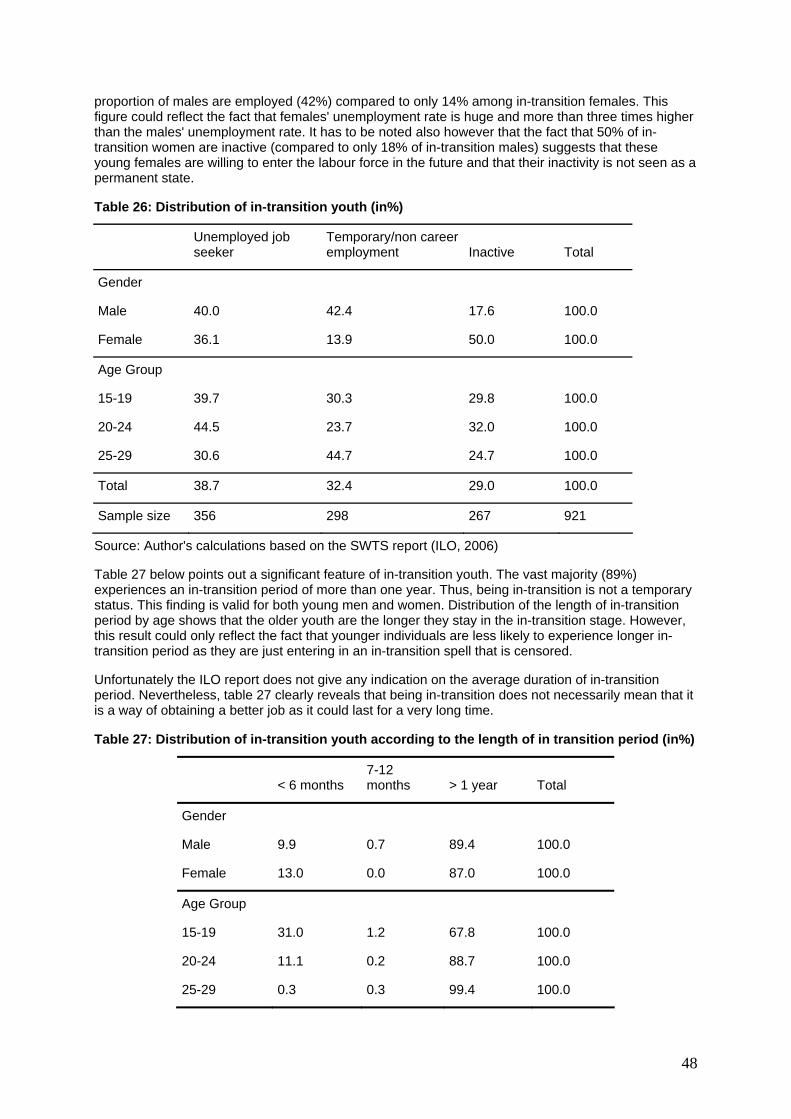
48
proportion of males are employed (42%) compared to only 14% among in-transition females. This figure could reflect the fact that females' unemployment rate is huge and more than three times higher than the males' unemployment rate. It has to be noted also however that the fact that 50% of in-transition women are inactive (compared to only 18% of in-transition males) suggests that these young females are willing to enter the labour force in the future and that their inactivity is not seen as a permanent state.
Table 26: Distribution of in-transition youth (in%)
Unemployed job seeker
Temporary/non career employment Inactive Total
Gender
Male 40.0 42.4 17.6 100.0
Female 36.1 13.9 50.0 100.0
Age Group
15-19 39.7 30.3 29.8 100.0
20-24 44.5 23.7 32.0 100.0
25-29 30.6 44.7 24.7 100.0
Total 38.7 32.4 29.0 100.0
Sample size 356 298 267 921
Source: Author's calculations based on the SWTS report (ILO, 2006)
Table 27 below points out a significant feature of in-transition youth. The vast majority (89%) experiences an in-transition period of more than one year. Thus, being in-transition is not a temporary status. This finding is valid for both young men and women. Distribution of the length of in-transition period by age shows that the older youth are the longer they stay in the in-transition stage. However, this result could only reflect the fact that younger individuals are less likely to experience longer in-transition period as they are just entering in an in-transition spell that is censored.
Unfortunately the ILO report does not give any indication on the average duration of in-transition period. Nevertheless, table 27 clearly reveals that being in-transition does not necessarily mean that it is a way of obtaining a better job as it could last for a very long time.
Table 27: Distribution of in-transition youth according to the length of in transition period (in%)
< 6 months 7-12 months > 1 year Total
Gender
Male 9.9 0.7 89.4 100.0
Female 13.0 0.0 87.0 100.0
Age Group
15-19 31.0 1.2 67.8 100.0
20-24 11.1 0.2 88.7 100.0
25-29 0.3 0.3 99.4 100.0

49
Total 10.9 0.4 88.6 100.0
Source: Author's calculations based on the SWTS report (ILO, 2006)
Transited youth
This section aims at presenting the main characteristics of transited youth (i.e. those who obtained a "career" or "regular" job), how difficult or easy is the access to such jobs and, finally, at identifying the factors that facilitate or impede a "good" transition.
Three degrees of ease of difficulty of transition are defined depending on: the length of transition; the duration and type of employment status (unemployment and/or temporary employment) obtained before the "career" or "regular" job. These three degrees of ease or difficulty are described below:
1. "easy transition" is defined in case the transition from school to a "career" or "regular" job is direct or if the individual experienced short periods or temporary employment (less than one year) or short unemployment spells (less than 3 months) with or without spells of temporary employment before obtaining the "desired" job;
2. "middling transition" when an individual experienced medium spell duration of temporary employment (between one and two years) with no spell of unemployment or medium unemployment spells (between 3 months and a year) with or without temporary employment spells;
3. "difficult transition" if the individual had to experience long temporary employment spells (two year and above) or long unemployment spells (one year and above) with or without temporary employment periods.
Table 28 below shows the distribution of transited youth according to the ease of transition. It clearly shows that the access to a "suitable" job is difficult for youth aged 15-29. Indeed, half of them (49%) declared they experienced difficulty to obtain a "career" or "regular" job; 19% experienced middling transition and less than a third (32%) an easy transition.
Table 28: Distribution of transited youth according to the ease of transition (in%)
Easy Middling Difficult Total
Gender
Male 32.1 17.8 50.1 100.0
Female 30.7 26.7 42.7 100.0
Age Group
15-19 63.2 10.0 26.8 100.0
20-24 41.7 15.4 42.9 100.0
25-29 23.1 21.8 55.2 100.0
Educational attainment
Never been to school 49.4 8.0 42.6 100.0
Primary 34.5 9.0 56.5 100.0
Preparatory 35.3 20.6 44.1 100.0
Technical Secondary 24.0 18.9 57.2 100.0
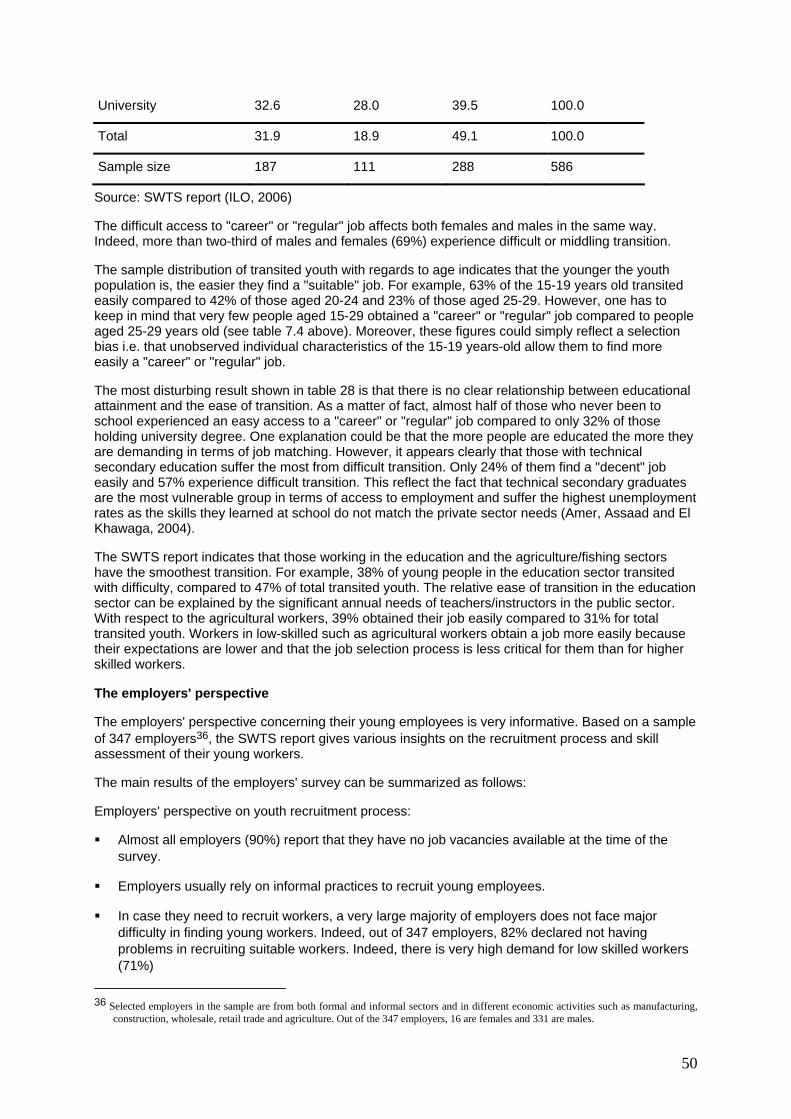
50
University 32.6 28.0 39.5 100.0
Total 31.9 18.9 49.1 100.0
Sample size 187 111 288 586
Source: SWTS report (ILO, 2006)
The difficult access to "career" or "regular" job affects both females and males in the same way. Indeed, more than two-third of males and females (69%) experience difficult or middling transition.
The sample distribution of transited youth with regards to age indicates that the younger the youth population is, the easier they find a "suitable" job. For example, 63% of the 15-19 years old transited easily compared to 42% of those aged 20-24 and 23% of those aged 25-29. However, one has to keep in mind that very few people aged 15-29 obtained a "career" or "regular" job compared to people aged 25-29 years old (see table 7.4 above). Moreover, these figures could simply reflect a selection bias i.e. that unobserved individual characteristics of the 15-19 years-old allow them to find more easily a "career" or "regular" job.
The most disturbing result shown in table 28 is that there is no clear relationship between educational attainment and the ease of transition. As a matter of fact, almost half of those who never been to school experienced an easy access to a "career" or "regular" job compared to only 32% of those holding university degree. One explanation could be that the more people are educated the more they are demanding in terms of job matching. However, it appears clearly that those with technical secondary education suffer the most from difficult transition. Only 24% of them find a "decent" job easily and 57% experience difficult transition. This reflect the fact that technical secondary graduates are the most vulnerable group in terms of access to employment and suffer the highest unemployment rates as the skills they learned at school do not match the private sector needs (Amer, Assaad and El Khawaga, 2004).
The SWTS report indicates that those working in the education and the agriculture/fishing sectors have the smoothest transition. For example, 38% of young people in the education sector transited with difficulty, compared to 47% of total transited youth. The relative ease of transition in the education sector can be explained by the significant annual needs of teachers/instructors in the public sector. With respect to the agricultural workers, 39% obtained their job easily compared to 31% for total transited youth. Workers in low-skilled such as agricultural workers obtain a job more easily because their expectations are lower and that the job selection process is less critical for them than for higher skilled workers.
The employers' perspective
The employers' perspective concerning their young employees is very informative. Based on a sample of 347 employers36, the SWTS report gives various insights on the recruitment process and skill assessment of their young workers.
The main results of the employers' survey can be summarized as follows:
Employers' perspective on youth recruitment process:
Almost all employers (90%) report that they have no job vacancies available at the time of the survey.
Employers usually rely on informal practices to recruit young employees.
In case they need to recruit workers, a very large majority of employers does not face major difficulty in finding young workers. Indeed, out of 347 employers, 82% declared not having problems in recruiting suitable workers. Indeed, there is very high demand for low skilled workers (71%)
36 Selected employers in the sample are from both formal and informal sectors and in different economic activities such as manufacturing,
construction, wholesale, retail trade and agriculture. Out of the 347 employers, 16 are females and 331 are males.

51
Employers consider the lack of practical knowledge as the main problem for recruiting new graduates.
Employers face difficulty to recruit qualified workers as the training system fails to produce skills that are required to perform the job.
Employers' assessment on youth skills:
For 41% of employers interviewed the ability of young candidates to apply knowledge learned at school is poor and for 37% it is only fair;
Practical training at school is considered to be poor by 48% of employers and to be fair by 42% of them;
Job training courses are almost absent: only 14% of employers interviewed reported that some of their workers received training in the last 12 months.
Thus, employers do not face problems when they need to hire low-skilled workers which is mostly the case. As opposed to low-skilled workers, they face difficulty in recruiting high-skilled workers. It seems that from the employers' perspective, the education, vocational and training system in Egypt is inefficient and inadequate. Indeed, the fact that a large proportion of workers are not able to apply at work the knowledge acquired at school stresses their lack of competence/skills and the poor quality of education.
In summary
The SWTS report sheds the light on different aspects of school-to-work transition by defining different transition stages and various degrees of ease of transition.
First of all, and surprisingly, more than half (57%) of the youth aged 15-19 has not yet started their transition. They are either still studying or not willing to enter the labour market (especially among women). Out of the total youth sample, 26% began their transition process but are either unemployed or in temporary employment. Only 17% have achieved their transition by obtaining a "decent" job.
Second, the transition process itself is not smooth and takes time. Being in-transition (unemployed or in temporary employment) is not a temporary stage before obtaining a "career" or "regular" job. Nearly 90% of the in-transition youth are being in this situation for more than a year. Moreover, the majority of the youth who completed the transition from school to work have experienced difficult or middling transition.
Third, and most worrying, the educational attainment does not guarantee a smooth transition or better access to a "decent" job.
Conclusion and Major challenges of the education to work transition
The analysis of the evolution of the insertion of the youth (15 to 29 years old) into the Egyptian labour market has revealed interesting findings. It has emphasized that youth have experienced some improvements and some deteriorations in their insertion path into the Egyptian labour market.
Three major improvements can be underlined:
youth unemployment rates have decreased over time, and in particular from 1998 to 2006. The substantial decline in unemployment rates has translated to a decline in the absolute number of the unemployed.
unemployment rates have sharply decreased among the less educated;
young males tend to obtain their first job more rapidly after finishing school.
Ragui Assaad (2006a) identifies three main explanations to the unemployment rate fall:

52
Demographic reason: the shift of the age distribution away from the peak of unemployment age. The peak has shifted from around age 15 in 1998 to around age 22 in 2006.
Economic reason: the fairly rapid growth of private non-agriculture wage work. Its share in total employment has increased from 26% in 1998 to 29% in 2006. This result could be related to the recovery of the economy between 2003 and 2006.
Institutional reason: the slowdown of government hiring reduces incentives for woman in particular to remain unemployed while queuing for government jobs. Educated women who are no longer waiting for the government are no longer in the labour force. The distortion in the functioning of the labour market caused the introduction of the public employment guarantee is disappearing.
The main deteriorations that came out of the study are the following:
decrease in female labour force participation;
substantial increase in unemployment rates among the post-secondary and university graduates who have become the most vulnerable group towards unemployment;
while male labour force participation has increased, female participation has decreased. The decline is particularly sharp among females aged 20 to 24 and among vocational secondary and university graduates;
increased informalisation of the first job obtained by the youth.
This report identified major challenges37
Improving access to education. Large progresses have been made in terms of access to education at all levels. Enrolment school ratios have substantially increased during the last decades. However, a non negligible number of children never went to school or dropped out from school at early stages. Those who dropped out have no other alternative than joining vocational preparatory schools that have bad reputation or entering directly into the labour market with bad working conditions and low wages. The reason for dropping out of school is related to poor economic conditions of the household. A comprehensive policy should be targeting such children coming from poor households.
Increasing education equality. Even though the gaps in terms of access to education between rural and urban regions, Upper and Lower Egypt and between girls and boys have narrowed, disparities are still persistent.
One of the biggest challenges of the coming years is the improvement of the quality of education. The demographic window of opportunity that opened recently is encouraging to shift from investing in quantity to investing in quality. Indeed, the absolute number and the share of children less than 15 years old have decreased in the last few years. If the efforts of investing in education are remained constant, investment per child should increase as class density and teacher-to-pupil ratios continue to decrease. Education expenditures should focus more on investment rather on current expenditures and should be more directed toward basic education that represents more than the two-thirds of enrolled students in pre-university education. Reforming the curricula and methods of learning are of crucial importance in order to enhance the ability of students in self-learning, to develop their analysis and research skills and thus increase their autonomy.
Improving the quality of training and the coordination between education and training instances. The fragmentation of the training institutions and the variety of quality of training are major concerns. Better co-ordination and co-operation among the different Ministries involved in training should be strengthened in order to organise a coherent, responsive and efficient vocational
37 Some of these challenges have been identified thanks to the participants to the national stakeholders meeting organised by ETF and that took place in Cairo, 6 December, 2006.

53
education and training system. Many positive initiatives at the institutional and legislative levels have been launched such as the SCHRD, the NSSP, the creation of the national training fund and the HEEP. Other donor-funded programs such as the TVET of the EU, the SDP of the World Bank have also been introduced recently. The Mubarak-Kohl initiative had been very successful but its impact is negligible as the number of its graduates is around 10,000 which is very small in comparison to the hundreds of thousands of young people entering into the labour market each year. The positive aspect of all these initiatives is the fact that the institutional framework for reform of the training system is now existent in Egypt. However, overall, these initiatives did not have a perceptible effect on transitions from education to work or on the efficiency of the functioning of the labour market. This is either due to the fact that many projects are very recent or because some of them are not yet fully operational such as the national training fund.
Transitions from education to work
- The system of vocational guidance is weak in Egypt and it needs to be developed in order to give young people well documented and expert assistance on their future careers and labour market needs.
- The vocational education and training system should be closer to the local needs. The geographical disparity of the economic infrastructure also implies different skill needs. More authority to local actors and decentralisation of decision making powers are necessary in order to create a more flexible VET system.
- It is necessary to raise awareness that training is important for the whole life and it should be based on lifelong learning principles
- A vision should be developed with respect to the future development of the vocational education and training system in Egypt. For the moment a number of donor activities and projects and experimentation are developed in parallel without cross-fertilisation and impact at system level. There is need for strategic use and integration of donors activities under one vision/strategy.
- Young people need to be asked about their choices, perspectives and aspirations. What do they think about the education and training provided to them? What do they think about the present state of the labour market and their perspectives in it? Their responses can be valuable for the modernisation of the education and training system and for interventions that facilitate the transition from education to work.
- The issue of transition from school to work is an important one for the youth and further research should be made on it but also more in depth involvement of policy makers in the discussion and the reflection.
Active labour market policies need to be reformulated. The successive governments have insisted that creating jobs for the youth was a top priority in their agenda. However, the evaluation of the YEP show that this program was not successful. The objectives of the government are too ambitious and are determined in terms of quantity rather than on quality.
The segmentation of the labour market along gender lines should be taken into account in the formulation of active labour market policies. The evolution of the labour market has clearly revealed that women and in particular highly educated women have major difficulty to insert into the labour market. They are affected by the suspension of the public employment guarantee scheme. A high proportion of eligible women who can neither join the public sector nor the formal private sector are simply out of the labour market.
The informalisation of the first job obtained by new entrants and the declining share of formal private employment questions the ability of the private formal sector to absorb very large cohorts of new entrants. As per se, an informal job is not a "bad job", further research should be done to identify the characteristics of informal jobs in terms of stability and income.

54
55
References
Ahlburg, D. and Mona Amer. 2003. "Labor Market Mobility among Egyptian Youth". Paper presented at the Research Workshop on Gender, Work and Family in the Middle East and North Africa, Mahdia, Tunisia (June 8-10, 2004).
Ahmed Gheita, Azza. 2005. "The Egyptian Experience in the Mechanisms of Matching the Outcomes of Education and Vocational Training and the Effective Demand of the Labour Market". Paper presented at the Arab Labor Organisation and the Arab Labor Bureau Seminar on "The Coordination between Education, Vocational and Technical Training Policies and Arab Labour Demand", Cairo, June 14-15, 2005 (in Arabic).
Al Mahdy Said, Mohsen. 2005. "Higher Education Enhancement Project". Ministry of Higher Education. Project Management Unit.
Amer, Mona. 2006. "The Egyptian Youth Labor Market - School-to-Work Transition, 1998-2006". Paper presented at the Dissemination Conference on the Egypt Labor Market Panel Survey 2006. Cairo, October 30, 2006.
Amer, M. and A. El-Mahdi. 2005. "Egypt: Growing Informality, 1990-2003". In Tony Avirgan, L. Josh Bivens and Sarah Gammage, eds., Good Jobs, Bad Jobs, No Jobs. Washington D.C: Economic Policy Institute.
Amer, M., Ragui Assaad and Laila El Khawaga. 2004. "Human and Labour Resources Development in Egypt Country Profile. The Road Ahead for Egypt. Cairo: ERF and FEMISE.
Amer, Mona. 2002. "Youth Labor Market Trajectories over Time". In Ragui Assaad (ed.), The Egyptian Labour Market in an Era of Reform. The American University in Cairo Press.
Assaad, Ragui. 2006a. "Unemployment and Youth Insertion in the Labor Market in Egypt". Paper presented at the ECES Conference on the Egypt Economy: Current Challenges and Future Prospects. Cairo, November 21-22, 2006.
Assaad, Ragui. 2006b. "Employment and Unemployment Dynamics". Paper presented at the Dissemination Conference on the Egypt Labour Market Panel Survey 2006. Cairo, October 30, 2006.
Assaad, Ragui. 2002. "The Transformation of the Egyptian Labour Market: 1988-1998". In Ragui Assaad (ed.), The Egyptian Labour Market in an Era of Reform. The American University in Cairo Press.
Assaad, Ragui and Melanie Artnz. 2005. "Constrained Geographical Mobility and Gendered Labour Market Outcomes Under Structural Adjustment: Evidence from Egypt". World Development Vol. 33, No. 3.
Assaad, Ragui (1996). “Structural Adjustment and Labor Market Reform in Egypt” in Hopfinger (ed.) Economic Liberalization and Privatization in Socialist Arab Countries: Algeria, Egypt, Syria and Yemen as Examples. Stuttgart: Justus Perthes Verlag Gotha.
Cairo Demographic Centre. 2006. Youth study (in Arabic).
De Gobbi, Maria Sabrina and Nesporova, Alena. 2005. "Towards a New Balance between Labour Market Flexibility and Employment Security for Egypt". ILO. National Tripartite Symposium on Employment Policy in Egypt (16-17 January 2005, Cairo).
De Gobbi Maria Sabrina. 2005. "Egypt: Evaluation of Two Components of the Youth National Employment Programme". ILO. National Tripartite Symposium on Employment Policy in Egypt (16-17 January 2005, Cairo).
Egyptian Ministry of Education. 2006. "Analysis of the Current Situation". Working paper for the strategic plan in Education 2007-2012 (in Arabic).
56
Egyptian Ministry of Education. 2003. "The National Plan for Education for All" (2002/2003 – 2015/2016).
El Ehwany, Naglaa and Heba El Laithy. 2001. "Poverty, Employment and Policy-Making in Egypt. A Country Profile". Cairo: ILO
El-Mahdi, Alia. 2006. "The Changing Economic Environment and the Development of the Micro and Small Enterprises in Egypt 2006"
Dissemination Conference on the Egypt Labour Market Panel Survey 2006. Cairo, October 30, 2006
El Mahdi, Alia. 2002. "Labor Absorption Capacity of the informal Sector" In Ragui Assaad (ed.) The Egyptian Labor Market in an Era of Reform. Cairo : The American University in Cairo Press in association with ERF.
El Fateh, Mohamed. 2006. "Education Reform Program Egypt. School to Work Component". Education quality Division.
ETF and World Bank. 2005. "Reforming TVET in the Middle East and North Africa: Experiences and Challenges".
ETF. 2003. "Structures and Mechanisms for Information and Needs Forecast on Training, Qualification and Employment. The Observatory Function Egypt".
Farag, Iman. 2000. "Higher Education in Egypt: The Realpolitik of Privatization. Centre for Higher Education". Boston College.
Helmy, Omneya (2004). "Improving the Pension System in Egypt". ECES Working Paper n°94 (in Arabic).
ILO – UNFPA - El Zanaty & Associates. 2006a. "Shool-to-Work Transition, Evidence from Egypt".
ILO. North Africa and Middle East Office. 2006b. "Report on the Impact of Vocational Training Programs on Graduates' Employability in Egypt. A Survey Conducted in Six Governorates Alexandria, Giza, Beheira, Gharbia, Bani Sweif and Fayoum".
ILO. 2004. "Gender Education and Child Labour in Egypt".
Koeltz, Donna. 2005. "Egyptian Labour Market Service Reform" (ELMSR). Working document
Koeltz, Donna. 2005. "Egyptian Labour Market Service Reform (ELMSR). Developing an Electronic Occupational Information Network". Working document.
Said, Mona. 2006. "The Rise and Fall of Earnings and Inequality in Egypt". Paper presented at the Dissemination Conference on the Egypt Labour Market Panel Survey 2006. Cairo, October 30, 2006.
UNDP. Egypt Human Development Report 2005.
USAID. 2006. "Study of Egyptian Vocational Prep Schools. Final Report".
Van Eekelen, W., Loretta de Luca and Nagwa Ismail. 2005. "Youth Empoyment in Egypt. In Focus Programme on Skills, Knowledge and Employability". Skills Working Papers No. 2; ILO.
Van Trier, Walter. 2006. "A Conceptual and Analytical Framework to Describe the Main Characteristics of School-to-Work Transition Systems and Assess their Performance. Towards Guideline for Writing a Country Report". Prepared for the ETF Workshop, Turin, July 10-11, 2006.
World Bank. 2003. "Project Appraisal Document on a Proposed Loan on the Amount of US$ 5.5 million to the Arab Republic of Egypt for a Skill Development Project".
World Bank. 2002a. "Arab Republic of Egypt. Education Sector Review: Progress and Priorities for the Future".

57
World Bank. 2002b. "Project Appraisal Document on a Proposed Loan on the Amount of US$ 50 million to the Arab Republic of Egypt for a Higher Education Enhancement Project".
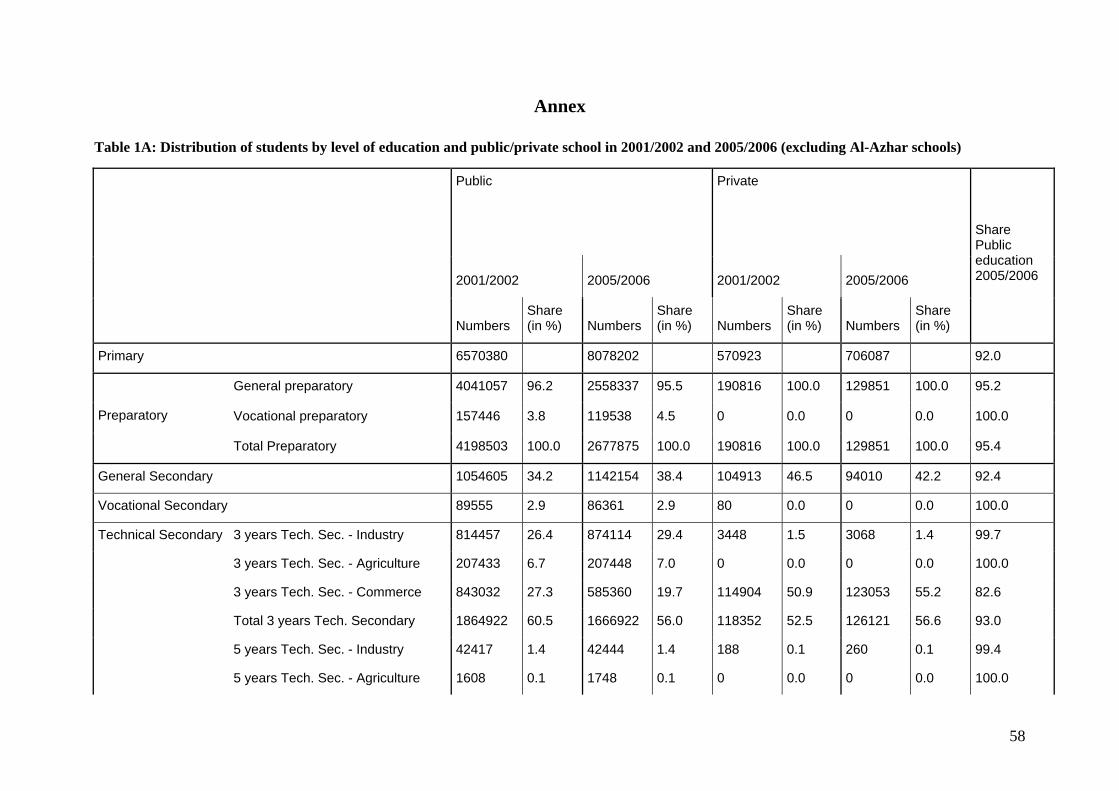
58
Annex
Table 1A: Distribution of students by level of education and public/private school in 2001/2002 and 2005/2006 (excluding Al-Azhar schools)
Public
Private
2001/2002 2005/2006 2001/2002 2005/2006
Numbers Share (in %) Numbers
Share (in %) Numbers
Share (in %) Numbers
Share (in %)
Share Public education 2005/2006
Primary 6570380 8078202 570923 706087 92.0
General preparatory 4041057 96.2 2558337 95.5 190816 100.0 129851 100.0 95.2
Vocational preparatory 157446 3.8 119538 4.5 0 0.0 0 0.0 100.0 Preparatory
Total Preparatory 4198503 100.0 2677875 100.0 190816 100.0 129851 100.0 95.4
General Secondary 1054605 34.2 1142154 38.4 104913 46.5 94010 42.2 92.4
Vocational Secondary 89555 2.9 86361 2.9 80 0.0 0 0.0 100.0
3 years Tech. Sec. - Industry 814457 26.4 874114 29.4 3448 1.5 3068 1.4 99.7
3 years Tech. Sec. - Agriculture 207433 6.7 207448 7.0 0 0.0 0 0.0 100.0
3 years Tech. Sec. - Commerce 843032 27.3 585360 19.7 114904 50.9 123053 55.2 82.6
Total 3 years Tech. Secondary 1864922 60.5 1666922 56.0 118352 52.5 126121 56.6 93.0
5 years Tech. Sec. - Industry 42417 1.4 42444 1.4 188 0.1 260 0.1 99.4
Technical Secondary
5 years Tech. Sec. - Agriculture 1608 0.1 1748 0.1 0 0.0 0 0.0 100.0
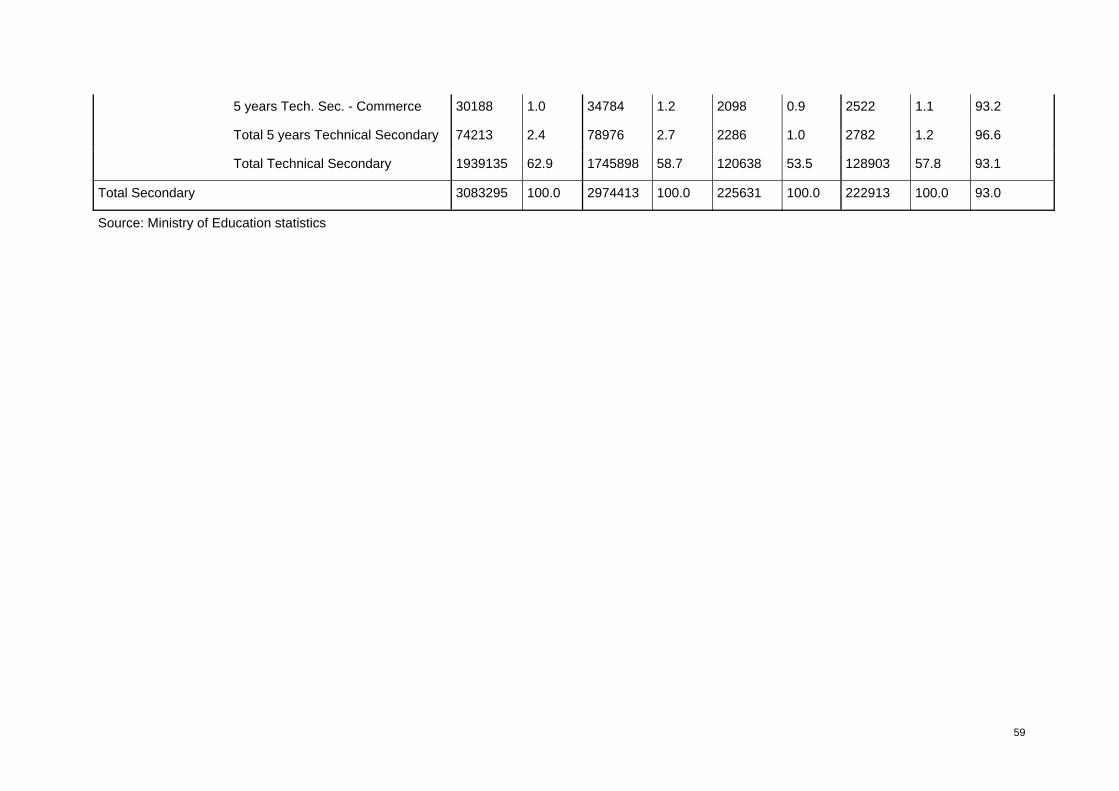
59
5 years Tech. Sec. - Commerce 30188 1.0 34784 1.2 2098 0.9 2522 1.1 93.2
Total 5 years Technical Secondary 74213 2.4 78976 2.7 2286 1.0 2782 1.2 96.6
Total Technical Secondary 1939135 62.9 1745898 58.7 120638 53.5 128903 57.8 93.1
Total Secondary 3083295 100.0 2974413 100.0 225631 100.0 222913 100.0 93.0
Source: Ministry of Education statistics
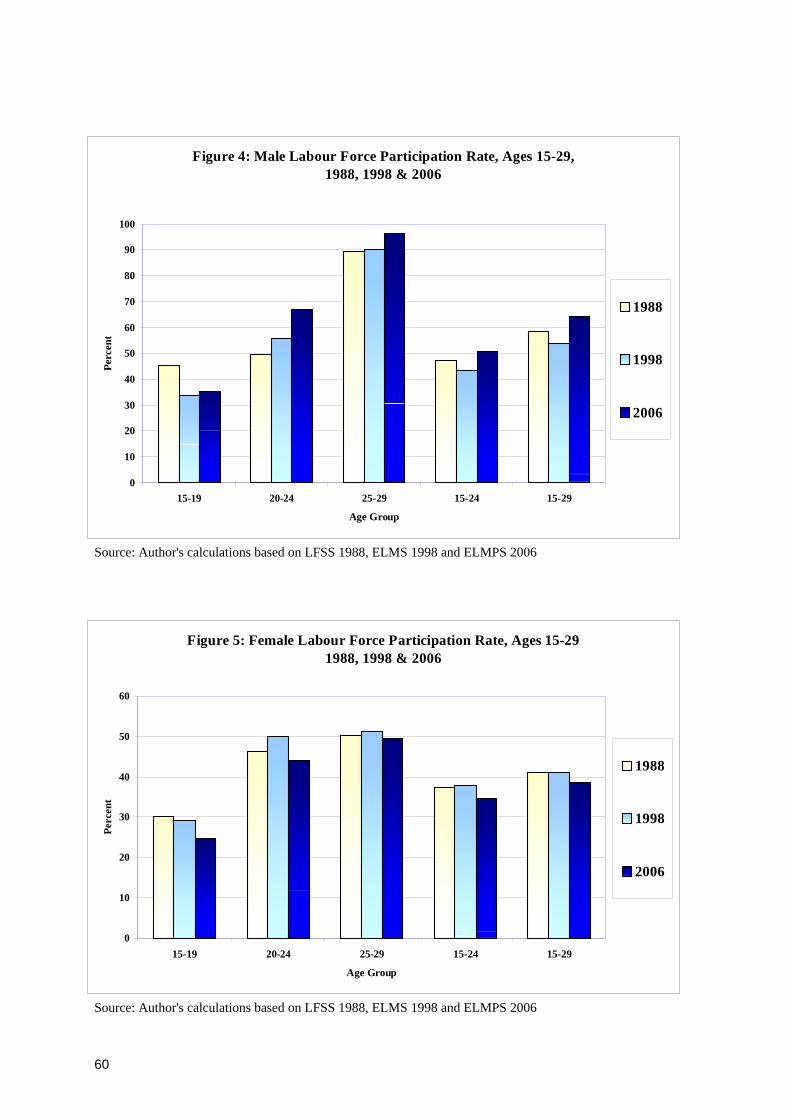
60
Figure 4: Male Labour Force Participation Rate, Ages 15-29,1988, 1998 & 2006
0
10
20
30
40
50
60
70
80
90
100
15-19 20-24 25-29 15-24 15-29
Age Group
Perc
ent
1988
1998
2006
Source: Author's calculations based on LFSS 1988, ELMS 1998 and ELMPS 2006
Figure 5: Female Labour Force Participation Rate, Ages 15-291988, 1998 & 2006
0
10
20
30
40
50
60
15-19 20-24 25-29 15-24 15-29
Age Group
Perc
ent
1988
1998
2006
Source: Author's calculations based on LFSS 1988, ELMS 1998 and ELMPS 2006
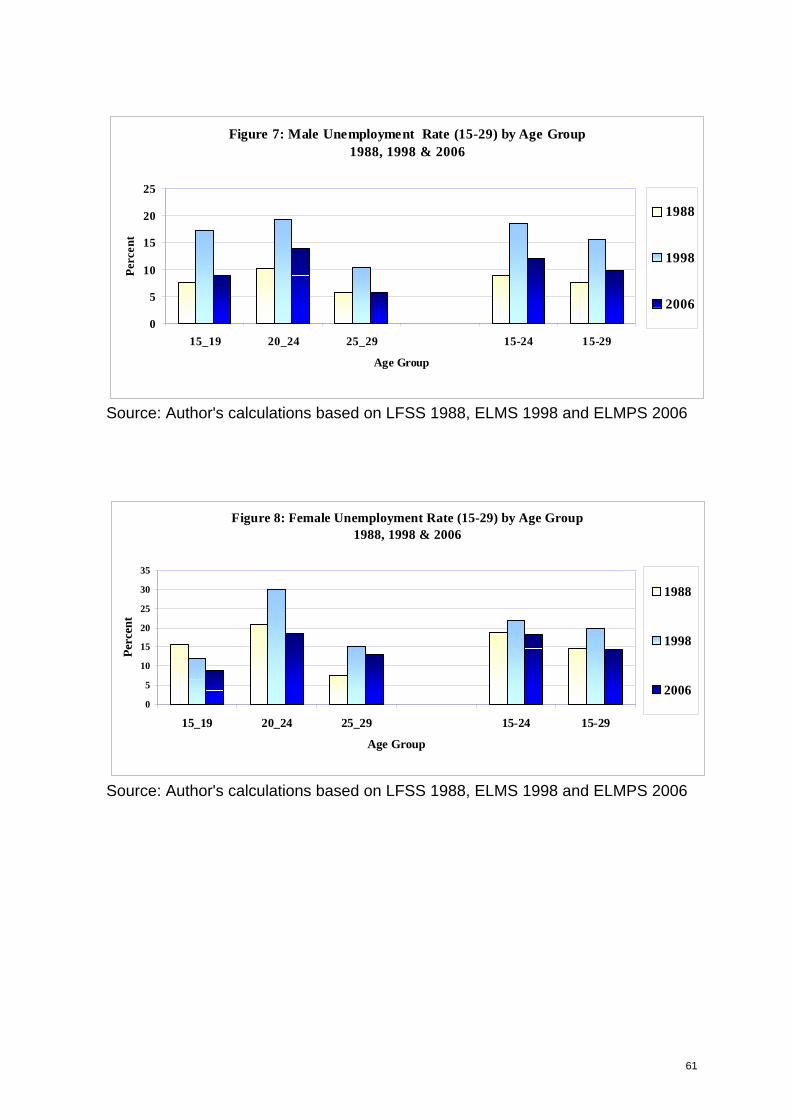
61
Figure 7: Male Unemployment Rate (15-29) by Age Group1988, 1998 & 2006
0
5
10
15
20
25
15_19 20_24 25_29 15-24 15-29
Age Group
Perc
ent
1988
1998
2006
Source: Author's calculations based on LFSS 1988, ELMS 1998 and ELMPS 2006
Figure 8: Female Unemployment Rate (15-29) by Age Group1988, 1998 & 2006
0
5
10
15
20
25
30
35
15_19 20_24 25_29 15-24 15-29
Age Group
Perc
ent
1988
1998
2006
Source: Author's calculations based on LFSS 1988, ELMS 1998 and ELMPS 2006
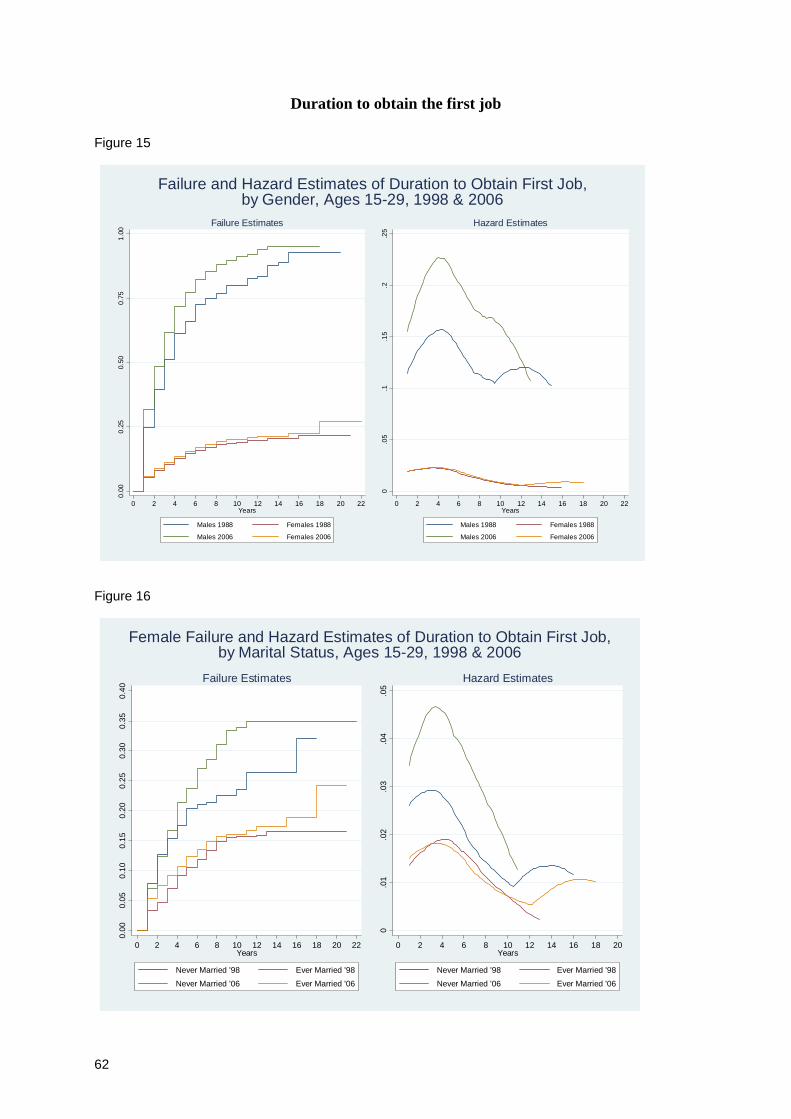
62
Duration to obtain the first job Figure 15
0.00
0.25
0.50
0.75
1.00
0 2 4 6 8 10 12 14 16 18 20 22Years
Males 1988 Females 1988
Males 2006 Females 2006
Failure Estimates
0.0
5.1
.15
.2.2
5
0 2 4 6 8 10 12 14 16 18 20 22Years
Males 1988 Females 1988
Males 2006 Females 2006
Hazard Estimates
Failure and Hazard Estimates of Duration to Obtain First Job,by Gender, Ages 15-29, 1998 & 2006
Figure 16
0.00
0.05
0.10
0.15
0.20
0.25
0.30
0.35
0.40
0 2 4 6 8 10 12 14 16 18 20 22Years
Never Married '98 Ever Married '98
Never Married '06 Ever Married '06
Failure Estimates
0.0
1.0
2.0
3.0
4.0
5
0 2 4 6 8 10 12 14 16 18 20Years
Never Married '98 Ever Married '98
Never Married '06 Ever Married '06
Hazard Estimates
Female Failure and Hazard Estimates of Duration to Obtain First Job,by Marital Status, Ages 15-29, 1998 & 2006
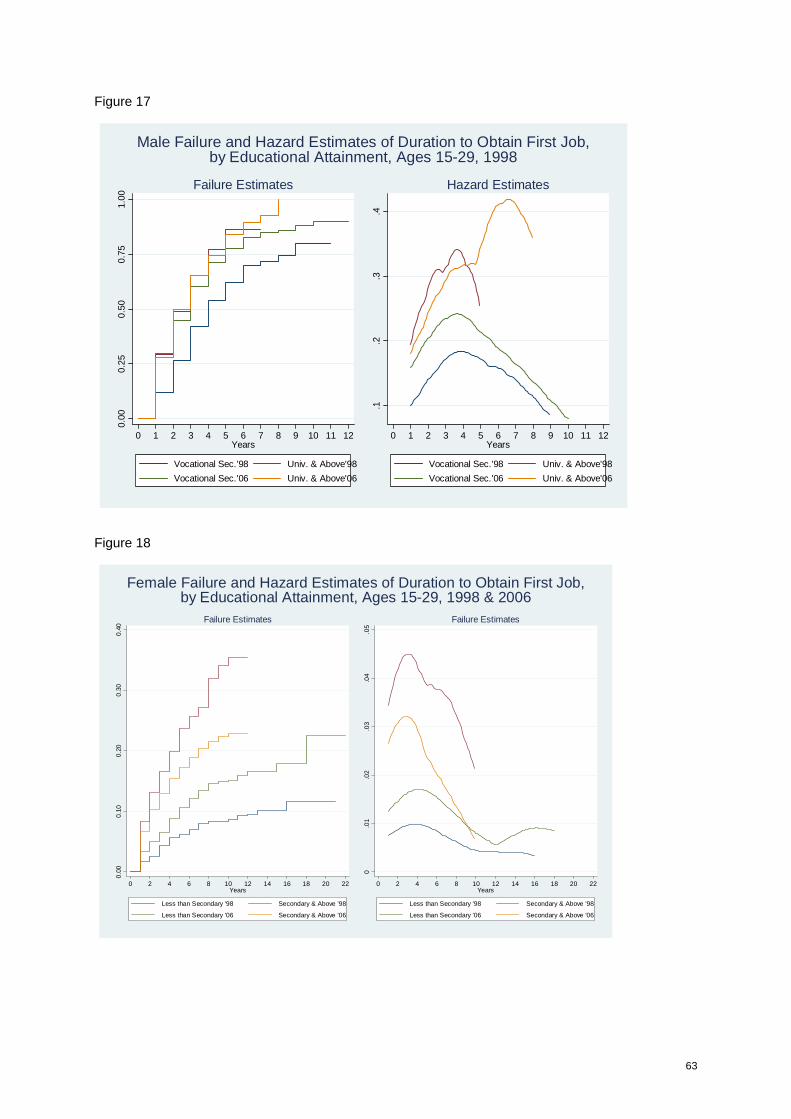
63
Figure 17 0.
000.
250.
500.
751.
00
0 1 2 3 4 5 6 7 8 9 10 11 12Years
Vocational Sec.'98 Univ. & Above'98Vocational Sec.'06 Univ. & Above'06
Failure Estimates
.1.2
.3.4
0 1 2 3 4 5 6 7 8 9 10 11 12Years
Vocational Sec.'98 Univ. & Above'98Vocational Sec.'06 Univ. & Above'06
Hazard Estimates
Male Failure and Hazard Estimates of Duration to Obtain First Job,by Educational Attainment, Ages 15-29, 1998
Figure 18
0.00
0.10
0.20
0.30
0.40
0 2 4 6 8 10 12 14 16 18 20 22Years
Less than Secondary '98 Secondary & Above '98
Less than Secondary '06 Secondary & Above '06
Failure Estimates
0.0
1.0
2.0
3.0
4.0
5
0 2 4 6 8 10 12 14 16 18 20 22Years
Less than Secondary '98 Secondary & Above '98
Less than Secondary '06 Secondary & Above '06
Failure Estimates
Female Failure and Hazard Estimates of Duration to Obtain First Job,by Educational Attainment, Ages 15-29, 1998 & 2006
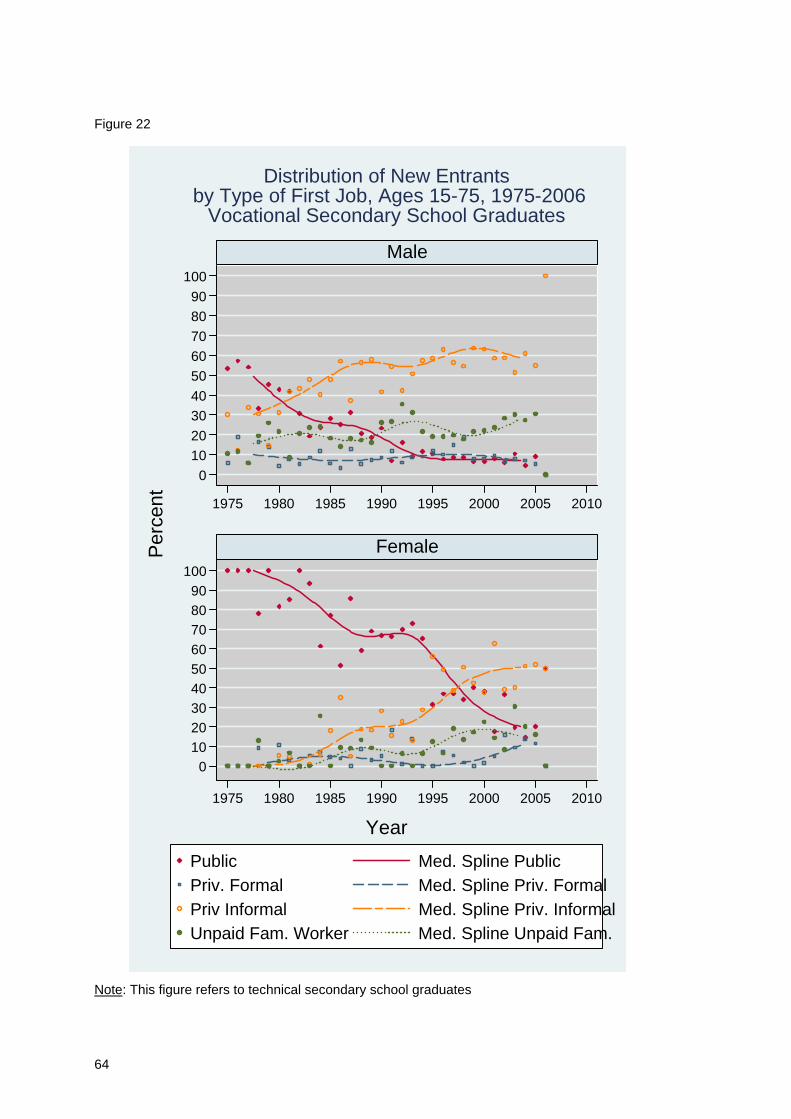
64
Figure 22
0102030405060708090
100
1975 1980 1985 1990 1995 2000 2005 2010
Male
0102030405060708090
100
1975 1980 1985 1990 1995 2000 2005 2010
Female
Public Med. Spline PublicPriv. Formal Med. Spline Priv. FormalPriv Informal Med. Spline Priv. InformalUnpaid Fam. Worker Med. Spline Unpaid Fam.
Per
cent
Year
Distribution of New Entrants by Type of First Job, Ages 15-75, 1975-2006
Vocational Secondary School Graduates
Note: This figure refers to technical secondary school graduates
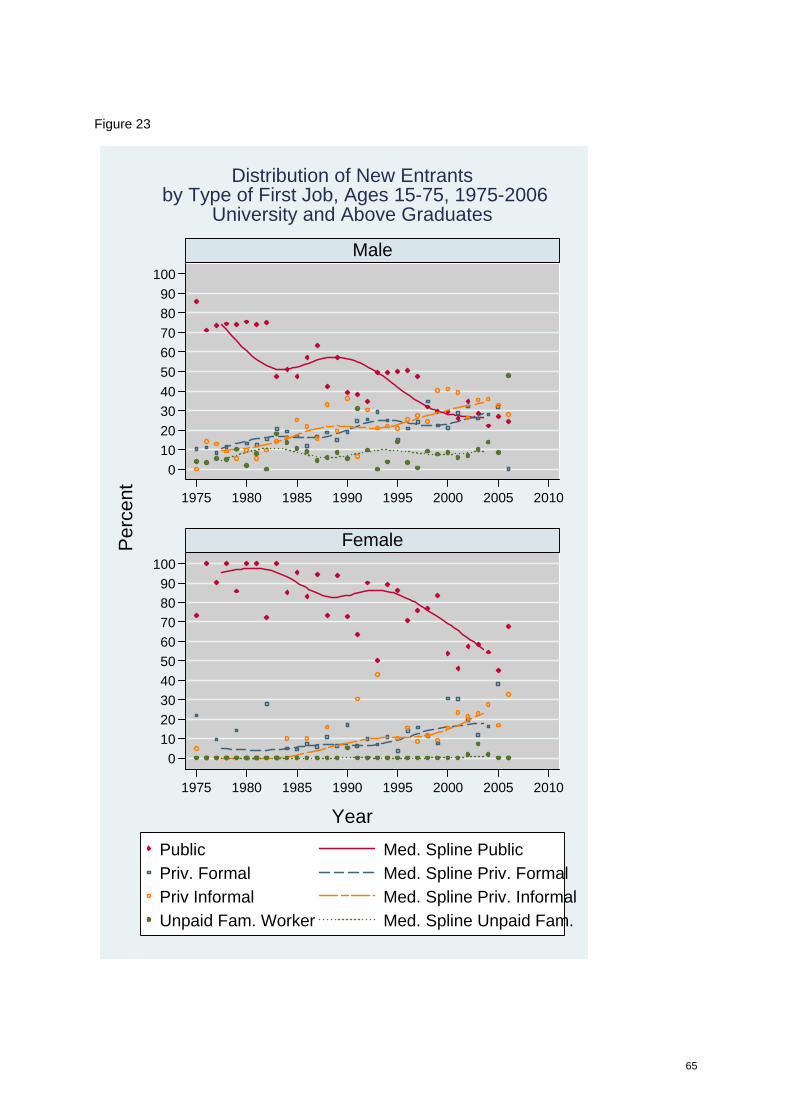
65
Figure 23
0102030405060708090
100
1975 1980 1985 1990 1995 2000 2005 2010
Male
0102030405060708090
100
1975 1980 1985 1990 1995 2000 2005 2010
Female
Public Med. Spline PublicPriv. Formal Med. Spline Priv. FormalPriv Informal Med. Spline Priv. InformalUnpaid Fam. Worker Med. Spline Unpaid Fam.
Per
cent
Year
Distribution of New Entrants by Type of First Job, Ages 15-75, 1975-2006
University and Above Graduates