transportation investment scenarios - dvrpc - delaware valley
TRANSCRIPT

TransportationInvestmentScenarios
1.2.3.
$$$95
CONNECTIONS
October 2012

Connections 2040: Transportation Investment Scenarios compares total regional transportation infrastructure needs for Greater Philadelphia over the next 27 years to available revenue under three scenarios.
The high scenario is a best case for transportation funding in the region. It forecasts some decline in current road and bridge conditions, while the region’s transit infrastructure achieves a state-of-good repair. This scenario invests in a number of road and transit operational improvements, and additional new transit routes. This will allow the region to be more economically competitive and will enhance our quality of life.
The medium scenario is a likely investment level for transportation infrastructure, based on current funding levels. In it, road and bridge conditions worsen considerably. Transit infrastructure remains in the same condition as today, but is still far from a state-of-good repair. This scenario is able to invest in a few road and transit operational and system expansion improvements.
The low scenario is a worst case for regional transportation funding. In it, road and bridge conditions decline substantially between now and 2040, and 100 state-maintained bridges close due to lack of funding. This would cause more congestion, lower travel speeds, and increase vehicle operating cost. The region’s transit infrastructure backlog of state-of-good repair needs worsens to where service is compromised. Poor transportation system condition would negatively impact the region’s economic competitiveness.
None of the scenarios are able to fund all needs. Under each, the region must carefully balance system preservation, operational improvement, and new capacity investments.

The degree to which we fund Greater
Philadelphia’s transportation
infrastructure greatly impacts our
quality of life and our economic
competitiveness. As the basic unit
of competition in the global economy,
regions will be most successful if they: promote
internal cooperation rather than competition;
have a transportation system that can easily and
inexpensively move people and goods; and have
direct access to many other regions.
In the United States, we continue to live off past
investments. Current transportation funding levels
barely allow us to maintain our existing infrastructure,
and are well below what is needed to invest in new
facilities to ensure future prosperity. Meanwhile, many
of the regions we compete with around the world
are becoming better equipped and fi nanced to meet
modern demands.
• China has completed more than half of its goal
to build 10,000 new miles of high-speed rail by
2020 in just a few years. These trains would cover
the distance between New York and Atlanta in
less than fi ve hours. The rapidly changing Chinese
landscape is also being dotted with new highways,
airports, subways, and ports.1
• Brazil is preparing for the 2014 World Cup
and 2016 Olympic Games by building a new
high-speed rail line between Rio de Janeiro and
Sao Paolo, while modernizing roads, transit
systems, and ports.2
• India is spending $200 billion per year to build
new commuter rail lines, highways, airports, water
treatment facilities, and power plants.3
• Europe continues to invest a much higher
percentage of gross national product in
transportation infrastructure compared to the
United States, despite the economic crisis and
fi scal austerity efforts.4
Due to the age of our transportation infrastructure,
Greater Philadelphia is also at a competitive
disadvantage to many other regions in the country.
We have to invest a greater percentage of available
funds in order to maintain and preserve the system,
meaning that there is less for projects that can
improve the operation of the system or expand it.
Additionally, the region is more reliant on federal and
state funding for transportation projects compared to
many of our peers.
1 Urban Land Institute and Ernst & Young, Infrastructure 2011: A Strategic Priority (Washington, DC: Urban Land Institute, 2011).2 Ibid.3 Ibid.4 Ibid.
Regional Transportation in the Global Economy
The Urban Land Institute has found that due to lack of
investment, the United States is falling behind its foreign
competitors in developing the type of transportation
system that maintains a competitive economic advantage.
Source: Urban Land Institute and Ernst & Young, Infrastructure 2009: Pivot Point (Washington, DC: Urban Land Institute, 2009).
01
The Urban Land Institute has found that due to lack of
i t t th U it d St t i f lli b hi d it f i

Greater Philadelphia has a large and
complex transportation network.
The system is mature, largely built
out, and was designed to serve
20th-century
travel patterns.
It is also aging. The region
has numerous 100+-year-
old bridges, obsolete transit
power substations, and other
infrastructure that have
served well beyond their
useful lifespan. Rebuilding
and modernizing our transportation infrastructure is
critical to maintaining economic competitiveness in
the global economy.
Connections 2040: Transportation Investment
Scenarios considers how different future funding
levels will affect transportation infrastructure
conditions between 2014 and 2040:
• The high scenario is a best-case situation
for transportation funding in the region. This
scenario assumes a 35 percent increase in
reasonably anticipated funding over the life of the
Connections 2040 Plan.
• The medium scenario is a likely investment level
for transportation infrastructure. It is based on a
continuation of present funding levels.
• The low scenario is a worst case development
for regional transportation funding; this scenario
assumes a 20 percent decrease compared to
current transportation funding levels.
The high scenario is based
on the highest funding level
proposals put forth during
the federal transportation
reauthorization debate that
led to the passage of Moving
Ahead for Progress in the
21st Century (MAP-21). These
proposals represent the best opportunity for increased
transportation funding in recent years. However, none
of them identifi ed a source of additional funding.
The medium scenario is based on Delaware Valley
Regional Planning Commission (DVRPC) forecasts
of likely transportation funding over the next 27
years, incorporating MAP-21 revenue authorizations.
However, it assumes less funding than in the current
Long-Range Plan. This is because Connections (2035)
anticipated some growth in federal funding from 2009
to 2014, which has not occurred.
The low scenario is based on Congressional Budget
Offi ce forecasts for federal gas tax revenue over the
next 10 years, extended out to 2040. Without some
change in how we pay for transportation projects,
the low scenario detailed in this analysis is as likely
to happen as the medium.
Looking at Alternative Futures
* Formula funding for capital projects only; does not include potential New Starts, Small Starts, or other sources of competitive grant funding. Source: Delaware Valley Regional Planning Commission, 2012.
Total Regional Transportation Funding Assumption 2014-2040by Scenario*
Without some change in how we pay for transportation projects, the low scenario detailed in this analysis is as likely to happen as the medium.
02
Funding for transportation projects
comes from a combination of
federal, state, and local sources,
with federal and state gas taxes
being the largest contributors. Changes
in funding could come from any level of government,
or increased participation from the private sector.
Regardless of the source, any new funds will likely
require either: tolling, increased gas taxes, vehicle
mile traveled fees, vehicle fees, transit fares, or come
from non-transportation-related sources, such as
increased sales tax.
The recently enacted MAP-21 is a two-year
reauthorization, whereas past transportation bills
have been for six years. This legislation funds federal
transportation programs at only a slightly higher level
than its predecessor, the Safe, Accountable, Flexible,
Effi cient Transportation Equity Act: A Legacy for Users
(SAFETEA-LU) did on average from 2004 to 2009.
That is, from 2009 to at least 2014, federal funding
levels will have been fl at. In the meantime, funding
needs have expanded.
Lack of growth in transportation revenue is tied to
lagging gas tax collections at both the federal and
state levels in recent years. These taxes are a fi xed
amount per gallon of gasoline purchased and are thus
not affected by changes in price, and are not indexed
to infl ation. The federal gas tax was last increased in
1993, while state gas taxes were last raised in New
Jersey in 1988, and in Pennsylvania in 1997.
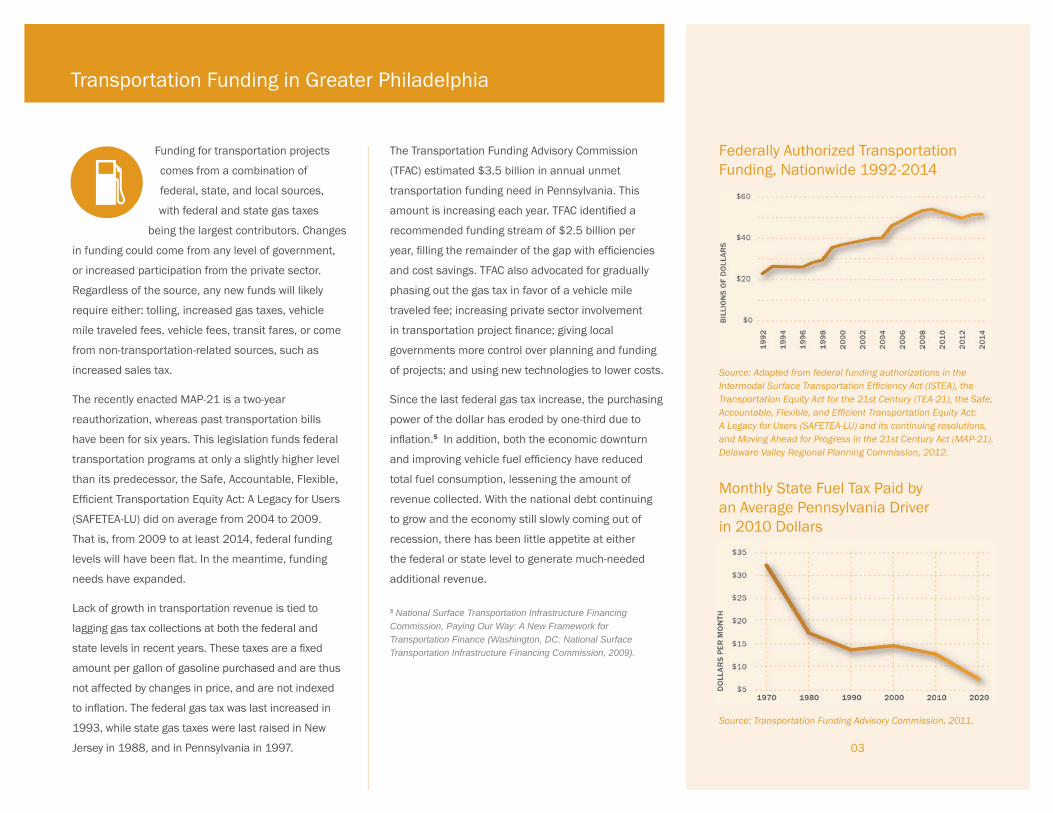
The Transportation Funding Advisory Commission
(TFAC) estimated $3.5 billion in annual unmet
transportation funding need in Pennsylvania. This
amount is increasing each year. TFAC identifi ed a
recommended funding stream of $2.5 billion per
year, fi lling the remainder of the gap with effi ciencies
and cost savings. TFAC also advocated for gradually
phasing out the gas tax in favor of a vehicle mile
traveled fee; increasing private sector involvement
in transportation project fi nance; giving local
governments more control over planning and funding
of projects; and using new technologies to lower costs.
Since the last federal gas tax increase, the purchasing
power of the dollar has eroded by one-third due to
infl ation.5 In addition, both the economic downturn
and improving vehicle fuel effi ciency have reduced
total fuel consumption, lessening the amount of
revenue collected. With the national debt continuing
to grow and the economy still slowly coming out of
recession, there has been little appetite at either
the federal or state level to generate much-needed
additional revenue.
5 National Surface Transportation Infrastructure Financing Commission, Paying Our Way: A New Framework for Transportation Finance (Washington, DC: National SurfaceTransportation Infrastructure Financing Commission, 2009).
Transportation Funding in Greater Philadelphia
03
Source: Adapted from federal funding authorizations in the Intermodal Surface Transportation Effi ciency Act (ISTEA), the Transportation Equity Act for the 21st Century (TEA-21), the Safe, Accountable, Flexible, and Effi cient Transportation Equity Act: A Legacy for Users (SAFETEA-LU) and its continuing resolutions, and Moving Ahead for Progress in the 21st Century Act (MAP-21). Delaware Valley Regional Planning Commission, 2012.
Federally Authorized Transportation Funding, Nationwide 1992-2014
Source: Transportation Funding Advisory Commission, 2011.
Monthly State Fuel Tax Paid byan Average Pennsylvania Driverin 2010 Dollars

As the Metropolitan Planning
Organization (MPO) for Greater
Philadelphia, DVRPC is responsible
for prioritizing and programming
federally funded transportation
projects in the region. Every four years the
Commission must prepare a long-range plan that
prioritizes transportation investments. The fi nancial
portion of this plan must be fi scally constrained. This
means the region cannot propose to expend more
revenue on transportation projects than it reasonably
anticipates receiving over the life of a long-range plan.
In addition, all project cost estimates are required to
be shown in year-of-expenditure dollars. This accounts
for infl ation that is expected to occur between now
and when the project is actually constructed.
The transportation investment scenarios will help
guide the development of the Connections 2040
update of the region’s Long-Range Plan. These
scenarios consider only capital projects. The needs
assessment for pavement and bridges considers
the current condition, full life-cycle needs, and uses
regional project costs from DVRPC’s Transportation
Improvement Program (TIP) for all phases: design,
right-of-way acquisition, utility improvements,
and construction.
This analysis assumes a pay-as-you-go approach
to funding transportation infrastructure. Regional
transportation needs could also be funded through
increased debt obligations. However, Pennsylvania
has largely avoided debt service, due to bad
experiences in the 1970s. Debt levels in New Jersey
mean payments on outstanding liabilities are
approximately equal to the gas tax revenue
collected by the state each year.
DVRPC continues to highlight the region’s funding gap
and seeks approaches to maximize funding. Additional
locally generated funding is one approach by which
we can control our own destiny, ensure that the
projects we build are the best for the region, and gain
a competitive advantage in national and international
markets. With much of our region’s infrastructure
either at, or fast approaching, the end of its useful
life, now is a critical time to continue the dialogue and
build consensus on how to upgrade and modernize
our key transportation facilities.
Planning for a Better Region
The nine-county Delaware Valley Regional Planning
Commission region consists of Bucks, Chester, Delaware,
Montgomery, and Philadelphia counties in Pennsylvania,
and Burlington, Camden, Gloucester, and Mercer counties
in New Jersey.
Deck structure of the Chestnut Street Bridge over
Amtrak’s Northeast Corridor in Philadelphia. This bridge
is currently weight restricted. Due to a lack of funding,
regional agencies such as the Pennsylvania and New
Jersey departments of transportation, the Southeastern
Pennsylvania Transportation Authority, and New Jersey
Transit are frequently applying patchwork fi xes. Over time,
this remedy costs far more than adequately maintaining
infrastructure in the fi rst place, especially as the region’s
infrastructure continues to deteriorate to the point that it
requires extensive reconstruction.
Photo: Pennsylvania Department of Transportation.
04

The current Long-Range Plan sets
funding allocation targets, based
on identifi ed need and policy.
However, the total need for all
kinds of transportation infrastructure
is far greater than available revenue, so
these allocation rates recognize that many needs
will go unfunded. The vast majority of funding is
currently dedicated to preservation, maintenance,
and replacement of outdated infrastructure, with
limited funding for new capacity. The fi gures on this
page detail the percent of total funding available
for different categories of projects. Each scenario
maintains the allocation targets for its reasonably
anticipated funding levels. This determines how
much funding goes toward bridge repair or roadway
resurfacing in the scenario exercise.
These are targets for how the region will spend its
transportation revenue. They do not represent a
guaranteed funding level. Nor do they restrict the
ability to fund specifi c critical-needs projects. This
analysis assumes that funding will be distributed
as identifi ed in the current Long-Range Plan to
estimate how different future funding levels impact
infrastructure condition. These funding allocation
formulas will be revisited as part of the Connections
2040 Plan update.
Prioritizing Transportation Funding
05Source: Delaware Valley Regional Planning Commission, 2012.
Roadway Funding Allocation
1.2.3.
Transit Funding Allocation
05
Transportation projects should support the four key principles of the Connections (2035) Plan:
Creating livable communities;
Managing growth and protecting resources;
Building an energy-effi cient economy; and
Modernizing the transportation system.
Transportation projects identifi ed for funding in the Plan should utilize smart transportation principles; be tailored to the size of the problem; respect the character of the community; take alternative modes into account; and be planned in collaboration with the community. This will help to ensure that we are getting the most out of our transportation investments.

There are nearly 11,000 lane miles
of state-maintained roads in
Greater Philadelphia. The region
has nearly 3,000 state-maintained
bridges, containing more than 32
million square feet of deck area. Due to
age, the region’s weather, and high traffi c volumes,
maintenance and preservation
is the most critical issue for
roads and bridges. Priorities
include:
• Pavement reconstruction and
resurfacing; and
• Bridge rehabilitation and
replacement.
Operational improvements
are the next regional priority.
These projects can lower traffi c
volumes and reduce road
congestion, often at much lower costs than expanding
the system. Projects in this category include:
• Intelligent Transportation Systems (ITS) comprised
of closed-circuit TV (CCTV) cameras to monitor
roadways, linked to variable message signs (VMS)
that send real-time information to drivers along
routes.
• Closed-loop traffi c signal systems that connect
traffi c lights through timing and signal coordination
to manage traffi c fl ow along a stretch of road.
• Incident management to provide quick clearance
of accidents or other roadway impedances in order
to maintain traffi c fl ow and reduce the potential for
associated traffi c crashes.
• Emergency service patrols provide quick response
to crashes and disabled vehicles. They may
serve as the emergency
responders or help other
emergency responders
(such as ambulances).
They also provide minor
services such as battery
charging, supplying gas, and
help to quickly clear the
scene of an accident.
• Access management
strategies improve road
safety and effi ciency by limiting
and controlling access points
to and from a facility.
• Roundabouts improve road operations by
decreasing traffi c delays and speeds at
intersections, and benefi t safety by reducing the
number and severity of accidents.
• New turning lanes and other intersection improvements.
The third option for improving our road network is
to add capacity. This includes new roads, roadway
extensions, additional through lanes, and new
interchanges.
Assessing Our Roads and Bridges
“… [the Commonwealth of Pennsylvania has almost] 6,000 structurally defi cient bridges. You will pass structurally defi cient bridges or drive over structurally defi cient bridges ten times more [often] than you will see a McDonald’s restaurant.”
—Jack WagnerAuditor General, Commonwealth of Pennsylvania
060606
Goods Movement and the Economy
The cost of shipping is passed on to consumers when they pay for goods and services. Nearly all freight movement is completed by truck for some portion of the trip. Therefore, how well we maintain the road network has an impact on how much we pay for the everyday products and services we need or want. Savings generated by good road conditions have a positive impact on our economy.
Congestion also plays a signifi cant role in transportation’s economic impact. There will always be some degree of congestion. This is considered acceptable, because it shows that a region is a desirable and active location. However, reducing congestion in heavily traveled areas, like Greater Philadelphia, correlates with increases in the region’s gross regional product and new job creation.
Employers take the ability of employees to access the worksite and their products to reach markets into consideration when deciding where to expand. Time wasted in traffi c is often lost economic productivity. Consider, for instance, a plumber who spends an extra hour per day stuck in traffi c, which could be spent on job sites.
This is why it is important to invest in Intelligent Transportation Systems (ITS) and other operational improvements, as well as new facilities. The region could also consider revenue generators, such as congestion-based pricing, that can both lower congestion and provide much-needed additional funding to further improve the region’s transportation system.

Most of the region’s roads were
designed for a 40-year life
expectancy, though newer roads are
anticipated to have a longer duration.
Roads can be kept in good condition
with proper maintenance for a much lower
cost than reconstructing a road that has fallen into a
state of disrepair. Lack of funding has meant that this
region has been unable to keep up with pavement
maintenance and repair requirements.
Regular resurfacing and preservation helps to
maintain good pavement condition. This ensures that
our roads are smooth and safe for operation. Typically,
a road is resurfaced every 12 to 15 years, though
a high-traffi c volume interstate may be resurfaced
every seven years, while a lower-volume collector road
may be resurfaced only every 25 years. Pavement in
poor condition causes unnecessary vehicle damage,
increasing the cost of driving, and slows down traffi c,
increasing congestion.
DVRPC estimates that the region needs to resurface
about 19,000 lane miles and reconstruct more than
3,300 lane miles of road between 2014 and 2040.
This accounts for the existing backlog of pavement
projects and anticipates future needs as they arise.
The total cost to achieve and maintain a state-of-good
repair during this period is estimated to be $19.1
billion. The medium scenario anticipates investing
$11.0 billion in pavement maintenance over the life of
the Connections 2040 Plan.
Investment Scenarios
Each scenario funds only a fraction of the
reconstruction projects that are needed. As a result,
the region will likely see an increase in the amount
of pavement in poor condition over the next 27
years. Long-term investment in pavement in the high
scenario will pay off. By 2040, this scenario projects
a 15 percent reduction in lane miles in defi cient
condition compared to the medium scenario, and 28
percent less than in the low scenario. Fewer defi cient
lane miles mean less travel on poor roads, lowering
vehicle operating costs, enhancing safety, and
reducing the cost of goods and services.
Maintaining Our Roads
07
State-Maintained Lane Miles of Reconstruction and Resurfacing 2014 to 2040 by Scenario Compared to Estimated Need
Percentage of State-Maintained Lane Miles in Poor Condition by Scenarioy
Pavement Maintenance
CostsSource: Adapted from
Federal Highway Administration, 2012.
Daily Vehicle Miles Traveled on State-Maintained Pavement in Poor Condition by ScenarioPoor Condition by Scenario
Source: Delaware Valley Regional Planning Commission.

Pennsylvania has the highest number
of defi cient bridges of any state
in the nation. To remedy this,
the Commonwealth has made a
substantial investment in bridges
over the past few years. The number
of bridges in structurally defi cient condition in the
Pennsylvania portion of the region
has declined from 22 percent
in 2009 to 17 percent in 2011.
Additional bridge funds have
come from the American Recovery
and Reinvestment Act (ARRA),
an accelerated bond program,
and by reducing expenditure
on pavement maintenance.6
However, the backlog of bridges to
be repaired during the timespan
outlined in the Connections 2040 Plan is substantial.
A typical bridge’s useful life ranges from 50 to 100
years. Some historic masonry and concrete bridges
can last longer, given low traffi c volumes and regular
maintenance. Unfortunately, over the next 27 years,
a large number of bridges built between 1900 and
1960 will come due for replacement, and many of
the bridges built from 1960 to 1990 will need major
rehabilitation. Bridge rehabilitation involves the
reconstruction of a major component of the bridge to
correct structural defi ciency. Bridges past their useful
design life, or with multiple defi cient components,
are usually replaced. Replacement means a defi cient
bridge is removed entirely, and a new bridge is built in
place of the old one.
Bridges in poor condition are
not unsafe for driving, but they
will need major rehabilitation
or replacement within the
next few years. This may lead
to weight restrictions on a
number of bridges, or increased
risk of closure for emergency
repairs. State departments of
transportation inspect each bridge
on a two-year cycle. Bridges in
defi cient condition are inspected more frequently.
These regular inspections help to ensure that bridges
are safe to use.
Overall, the region needs to replace or rehabilitate
nearly 2,200 bridges in order to achieve and
maintain a state-of-good repair for all bridges from
2014 to 2040. The cost for all these projects, along
with regular preservation, is estimated to be $58.4
billion over this period. Expected funding for bridge
preservation in the medium scenario is just
$15.4 billion.
Preserving Our Bridges
If all of the region’s bridge deck area were recreated as a single, two-lane bridge, it would extend for 253 miles. If this bridge began in Center City Philadelphia, it would stretch all the way to Richmond, Virginia.
08
State-Maintained Bridgesby Decade Built
State-Maintained Bridge Projectsin Each Scenario Comparedto Estimated Need, 2014-2040
Source: Delaware Valley Regional Planning Commission.6 The accelerated bond program in Pennsylvania borrowed $200 million per year from 2008 to 2010 to fund additional bridge improvements. More than 1,100 bridges statewide will be repaired by this effort, but this debt will now be repaid against future transportation revenues.

Investment Scenarios
Only a fraction of necessary bridge projects in the
region can be accommodated over the next 27 years
under any of the investment scenarios. To reduce
the risk of closures under all three scenarios, this
assessment has prioritized replacing bridges before
they will close to traffi c. This uses up much of the
funding reserved for bridge maintenance. With most
funding allocated for replacement, less is available
for more cost-effective projects, such as rehabilitation
and preservation, both of which extend a bridge’s
useful life. This strategy also reduces the amount of
funding that is directed toward other critical projects,
such as reconstructing the Interstate 95 viaducts in
South Philadelphia.
Recent investments in bridges will continue to pay
dividends over the next several years, but this progress
will be short lived without additional expenditures.
The age and poor condition of many of the region’s
bridges mean that early in the 2020s, the system will
fall further into disrepair and will continue to decline
over the life of the Connections 2040 Plan.
In the low scenario, we estimate that more than
100 state-maintained bridges will close due to
lack of funding for proper repair or replacement.
These bridge closures will not necessarily be
permanent. However, whenever and wherever closures
occur, traffi c congestion will increase. In response,
individuals will either: forego trips, change to another
mode of travel, or need to extend trip length in order to
detour around the closed bridge. Currently, more than
700,000 vehicles a day use the bridges that could
close by 2040 in this scenario. Bridge closures on
roads with a larger share of trucks will be particularly
harmful to goods movement and the economy.09
Daily Vehicles Using State-Maintained Bridges in Poor Condition in 2040by Scenario
Number of State-Maintained Bridges Closed to Traffi c in 2040 by Scenario
Source: Delaware Valley Regional Planning Commission.
Percentage of State-Maintained Deck Area in Poor Condition by Scenario
Source: Delaware Valley Regional Planning Commission.
Poor deck condition on the State Road Bridge over
rail tracks (owned by the Southeastern Pennsylvania
Transportation Authority and leased to CSX) in Bucks
County has led to this bridge’s defi cient condition. This is
one of more than 600 structurally defi cient bridges that
currently need signifi cant maintenance in the region.
Photo: Pennsylvania Department of Transportation.

State-maintained roads and bridges
comprise only a portion of the total
regional transportation network.
There are more than 18,800 linear
miles of county and municipally
maintained roads in the region, of
varying numbers of lanes. Local
governments also usually own,
operate, and maintain the traffi c
signals on local streets.
There are more than 750 locally
maintained bridges greater
than 20 feet long, with 2.7
million square feet of deck
area.7 While about 14 percent
of state-maintained bridges are
currently structurally defi cient,
more than 28 percent of locally
maintained bridges over 20 feet
are structurally defi cient.
Both the Pennsylvania and New Jersey state
governments restrict the type of taxes a local
government can collect. This means that most
maintenance and preservation activity on local roads
and bridges is funded by property taxes, for which
these projects must compete with other community
priorities, such as public safety, for limited municipal
general funds. Poor road conditions, and closed or
posted bridges may become more the norm, as lean
municipal, county, and state budgets provide little
available revenue for locally maintained facilities.
Investment Scenarios
There is limited federal and state
transportation funds for these
facilities. The high scenario
represents an increase in state
and federal assistance to locally
and county-maintained roads
and bridges, but will require an
increase in local matching funds
for state projects. The medium
scenario maintains the status
quo. The low scenario means even
less funding overall, though some
local funds that would be applied
to state-maintained facilities could be used on locally
maintained facilities due to reduced local match
requirements.
Regardless of the investment scenario, future local
road and bridge conditions will be largely dependent
on municipal funding decisions. Without political
will at both the state and local levels, future funding
will likely be inadequate to properly maintain locally
owned roads and bridges.
Local Roads and Bridges
“Our entire population depends upon transportation, whether or not a person drives. The transportation system allows food, clothing and materials to be shipped, school buses to carry children, transit to carry riders, emergency vehicles to respond expeditiously…”The Transportation Funding Advisory Commission Final Report
10
The Keim Street Bridge in Pottstown, PA, is one of more
than 30 local bridges currently closed in the region. Other
notable closed local bridges include the 41st Street Bridge
in West Philadelphia and the East Bridge Street Bridge
in Parkesburg, PA. Some of these bridges may never be
rebuilt. Another 280 local bridges are weight restricted.
Photo: Montgomery County Planning Commission.
7 Accounts for local bridges over 20 feet in Pennsylvania only. Local New Jersey bridges over 20 feet are generally funded by the state with a local match. Needs and condition for local New Jersey bridges over 20 feet are refl ected in the Preserving Our Bridges section of this report. Local roads and bridges under 20 feet are largely maintained by counties or municipalities in both states. No condition data is available for local roads or bridges under 20 feet.

Disabled vehicles, traffi c crashes,
maintenance and construction
activity, special events, and adverse
weather conditions are estimated
to cause about 60 percent of the
traffi c delays that occur in major metropolitan areas.
Transportation operations strategies attempt to
mitigate congestion caused by these types of events.
ITS infrastructure in the region includes: VMS, CCTV,
traffi c signals, transportation operation centers,
emergency service patrols, and the Regional Integrated
Multi-Modal Information Sharing (RIMIS) project. RIMIS
is an information exchange network to share and
disseminate real time operational information.
There are considerable ongoing operating costs with
implementation and maintenance of ITS elements,
since this infrastructure can become obsolete over
time due to technological improvements or wear
and tear.
Investment Scenarios
Full implementation of regional ITS is the key goal
of the Transportation Operations Master Plan.
Implementation includes capital funding for CCTV,
VMS, and transportation operations centers, as well
as other expenses associated with transportation
operations. Only the high scenario is able to fully fund
this plan. In the medium scenario, it will be about 85
percent complete by 2040, and in the low scenario,
it will be about 60 percent complete. Segments of
roadway that don’t have recommended ITS equipment
will be subject to more delay and less safe
driving conditions.
Improving Roadway Operations
Active Traffi c Management (ATM) is a new concept to
improve traffi c fl ow on expressways using variable speed
limits and overhead lane-control signs. One component
of ATM is hard-shoulder running: using shoulders as a
travel lane during peak hours or times of congestion.
Above is an example of hard-shoulder running on I-66 in
northern Virginia. The Delaware Valley Regional Planning
Commission is currently conducting a feasibility study for
hard-shoulder running on I-476 in Delaware County.
Photo: Virginia Department of Transportation.
04
IntelligentTransportation
Systems Infrastructure
VisionSource: Delaware Valley
Regional Planning Commission.
The Transportation Operations Master Plan sets the vision for Intelligent Transportation Systems (ITS) in the Greater Philadelphia region. This plan sets regional operating goals and objectives, establishes location and deployment levels for ITS and other operations programs, and identifi es specifi c capital projects and operating budget needs. Substantial progress has been made in implementing the vision set forth in the Plan, thanks largely to the American Reinvestment and Recovery Act (ARRA). ARRA funded closed-circuit television (CCTV) and variable message signs (VMS) to cover the length of I-95 from the Delaware to New Jersey state lines, along US 1, and Woodhaven Road.
MAP: Primary coverage includes full CCTV coverage, VMS on roadway and key interchanges, incident detection, and travel time monitors. Secondary coverage includes limited CCTV coverage on roadways, primarily at interchanges, CCTV coverage on arterials, VMS, travel time detectors, and interconnected signal systems. Tertiary coverage includes CCTV at major intersections, VMS at decision points, travel time detectors, and interconnected signal systems. Emergency routes include limited CCTV coverage and limited VMS.

Beginning with the Destination
2030 Long-Range Plan, the
Greater Philadelphia region has
capped expenditures on new
roadway capacity at 10 percent of
total roadway funding. This refl ects the
region’s transportation infrastructure
philosophy of fi xing-it-fi rst, before
expanding. It also acknowledges that
while new roadway lanes initially
relieve congestion, over the long
term they lead to more auto trips
and encourage sprawl. In order to
maintain fi scal constraint, each
iteration of the Plan has had to
reduce the number of new capacity
projects. Some projects have been
completed, others have been
removed from consideration, while only a limited
number of new projects have been identifi ed.
The Connections (2035) Plan has 41 major new
roadway capacity-adding projects, of which 10 are
nonfederally funded. This is 30 fewer federally funded
projects than were envisioned in the Horizons 2025
Long-Range Plan, and 15 less than in the Destination
2030 Plan. Externally funded major regional projects
have been increasing in number, as the region’s toll
authorities are maximizing their capacity to deal with
rising travel demand. These facilities are able to be
expanded because toll authorities have the dedicated
revenue stream to fund them. However, such funding
streams face future uncertainty, and it is not clear that
these are the most strategic projects for the region to
invest in from an economic competitiveness standpoint.
Though limited in scope, additional transportation
capacity is critical to future economic growth and
quality-of-life issues for the region’s
residents. Failure to improve the
system means that as population
expands, there will be increased
traffi c gridlock, more wasteful
emissions, and negative economic
impacts.
Investment Scenarios
Total funding in the low scenario is
estimated to be enough to complete
all remaining new capacity projects
in the Connections (2035) Plan. The medium and
high scenarios would then have even more revenue
that could be applied to additional projects. Given
the sheer volume of pavement and bridge needs
in the region, a key question becomes whether the
additional revenue under the medium and high
scenarios should be allocated to more new capacity
projects, or put toward system maintenance and
preservation projects, as is done in this assessment.
Providing Limited New Road Capacity
Direct connection of I-95 and the Pennsylvania Turnpike
will reduce traffi c congestion on nearby local roads and
improve the fl ow of people and goods. After this project is
completed, the existing I-95 will be renumbered I-195 to
the north of the interchange, and what is now I-276 to the
east of it will become I-95. This project is being built with
a combination of funds from federal and state sources and
the Pennsylvania Turnpike Commission. As more revenue
is shifted to maintenance, projects to improve or expand
the system are likely to become less frequent.
Image: Pennsylvania Turnpike Commission.
12
Source: Delaware Valley Regional Planning Commission, 2012.
Major Regional New Road Capacity Projects by Funding Source in 2025, 2030, and 2035 Long-Range Plans
Highway access has consistently been the top reason for business location decisions in Local Area Development magazine’s annual survey of company site selection factors.

ID Facility Project Description Status
Marlton Circle new interchange complete
US 202 (Section 700) new road complete
County Line Road widen, reconstruct under construction
I-95 & PA Turnpike new interchange, widen PA Turnpike under construction
US 1 reconstruct, widen, improve interchanges planned
US 202 (Section 100) widen planned
French Creek Parkway new road planned
PA 100 widen planned
US 202 (Section 300) widen, reconstruct under construction
US 30 Business widen planned
US 30 / Coatesville-Downingtown Bypass reconstruct, widen, new interchange/ramps planned
US 322 widen, reconstruct planned
I-76 & Henderson Road new interchange; widen and reconstruct Henderson Rd. complete
Lafayette Street extend roadway, new interchange with PA Turnpike planned
US 202 (Section 600) widen, reconstruct planned
PA 309 Connector Road new road ph. 1 complete, ph. 2 planned
I-95 (Philadelphia North) reconstruct, improve interchanges under construction
North Delaware Avenue road extension planned
Pennrose Avenue / 26th Street new access road to Navy Yard planned
Adams Avenue Connector road extension, new ramps onto I-95 planned
I-295 at NJ 38 new ramps planned
NJ 73 widen, improve intersections under construction
I-295 at I-76 / NJ 42 new ramps planned
NJ 42 at College Drive new interchange planned
I-295 (Direct Connect) direct connection through interchange with I-76/NJ 42 planned
US 1 (Penns Neck) new connector road, interchanges, widening planned
US 322 Mullica Hill Bypass new road complete
US 422 and PA 363 new ramps under construction
US 422 Bridge and PA 23 bridge replacement and widening, improve interchange planned
US 422 widen planned
Mercer County Road 533 new interchange at County Road 638 planned
Federally Funded Major New Road Capacity Projects in Connections (2035)
Source: Delaware Valley Regional Planning Commission, 2012.

The new I-76 and Henderson Road on-ramp. This project also added an off-ramp between these facilities and widened Henderson Road. This major regional project was completed with funding from the American Recovery and Reinvestment Act (ARRA). Symbolic of the lack of revenue for anything beyond system preservation is that many of the recently constructed operational and new capacity projects were funded through ARRA or Transportation Investment Generating Economic Recovery (TIGER) federal grants.
Photo: Greater Valley Forge Transportation Management Association.
The relocated Sumneytown Pike in Montgomery County is a component of the PA 309/Sumneytown Pike Connector Road. This major regional project will link PA 309 and the Pennsylvania Turnpike, benefi ting local residents and businesses by providing more effi cient travel alternatives.This project was right-sized to save on construction costs by reducing lane and shoulder widths and eliminating direct movements at the PA 309 interchange; it was also split into two separate construction projects. This fi rst phase has been completed; but the second phase is delayed due to funding constraints.
Photo: McCormick Taylor
I-95 is primarily a viaduct through much of the City of Philadelphia. This facility contains about 30 percent of the region’s total bridge deck area. Much of I-95 in Philadelphia was constructed in the 1970s and will be well past the end of its useful life by 2040 if it does not undergo major rehabilitation before then. There is currently not enough funding to properly maintain I-95’s viaducts and all the other bridges in the region.
TransportationInvestmentScenarios
Roundabouts improve road operations by decreasing traffi c delays and speeds at intersections, and benefi t safety by reducing the number and severity of crashes.They can also reduce road operating costs, but the ability to convert appropriate intersections depends on capital fund availability.
Photo: Delaware Valley Regional Planning Commission.
14

Interstate 95 represents a signifi cant
challenge for maintenance in the region.
This facility traverses 51-miles through
the region and is critical to the economy,
providing access to Center City, the
Philadelphia International Airport, business parks, ports,
industrial facilities, and sports stadiums; it also serves as
an important megaregional link between Washington, DC,
and points south, and New York City and points north.
This interstate has more than 10 million square feet of
bridge deck area in the region. A large crack found on
one of the viaducts in North Philadelphia closed a portion
of this facility for two days in 2008 while temporary
emergency repairs were made.
Reconstructing I-95 has been ongoing in sections north
of Center City Philadelphia and will continue over the next
several years. The entire portion to the south of Center
City Philadelphia needs to be rebuilt during the life of the
Connections 2040 Plan. To meet modern design and
safety requirements, this facility may need to be widened
in many areas when it is reconstructed. More than eight
million square feet of deck area needs to be rehabilitated
or replaced during the timeframe of the Connections 2040
Plan, at a total estimated cost of $22.0 billion.
Investment Scenarios
Given current funding constraints, a trade-off exists
between I-95’s viaducts and the rest of the region’s bridges.
If we focus on reconstructing I-95’s viaducts over the next
27 years, then numerous other bridges, currently in worse
condition, cannot be repaired. This would potentially
mean several hundred bridges around the region being
weight restricted, or closed to traffi c altogether, between
now and 2040. If the trade-off is to shift more funding
to bridge repair, then less will be available for pavement
preservation, operational improvements, or new facilities.
The investment scenarios focused on keeping bridges
open. But the result is worsening conditions along I-95.
The scenarios are able to perform only a fraction of
the bridge work that should occur over the life of the
Connections 2040 Plan. By 2040, the high scenario
estimates that more than half of the deck area on this
facility will be in poor condition, compared to nearly two-
thirds in the medium, and more than 70 percent in the low.
Without additional funding, I-95’s condition in 2040
could be far worse than it is today. If we have not found the
wherewithal to repair this facility between now and then,
how will we fi nd a way to fund it at that point when the costs
are greater due to infl ation, and the amount of time left to
repair it is much shorter? Maintaining I-95, as currently
confi gured, along with making all the other bridge repair
needs in the region, will take concerted effort and will.
Highlighting Interstate 95
Richmond Street in Philadelphia is being widened
and relocated to help handle additional traffi c during
I-95 viaduct reconstruction. Traffi c management
during major reconstruction projects increases costs,
but is necessary to keep traffi c moving.
Source: Pennsylvania Department of Transportation.
Source: Delaware Valley Regional Planning Commission, 2012.
I-95 Deck Area Replaced or Rehabbed 2014-2040 by Scenario
Percent of I-95 Deck Area in Poor Condition in 2040 by Scenario
15
95

The recent delivery of the Silverliner V rail cars has allowed
the nearly 50-year old Silverliner IIs and IIIs to be retired.
The Silverliner IVs, built between 1972 and 1974, will need
to be replaced in the next decade. Only the medium and
high scenarios are likely to have the funding needed to
accomplish this before 2040.
Photo: Southeastern Pennsylvania Transportation Authority.
A PATCO rail vehicle undergoing reconstruction. Seventy-
fi ve of PATCO’s 121 vehicles date from the opening of
the line in 1969. Each car will be fully rebuilt to modern
standards, while reusing the metal shell.
Photo: Port Authority Transit Corporation.
Greater Philadelphia is fortunate
to have a transit network that is
the envy of most other regions in
the United States. Because the
transit system developed along with
our classic towns and older suburbs,
there is supportive land use that helps to increase
ridership. Our transit system provides a low-cost and
environmentally friendly way to get around to nearly all
corners of the region. Ridership on the Southeastern
Pennsylvania Transportation Authority (SEPTA) system
has grown by about 15 percent over the last decade.
SEPTA is multimodal and has service area covering
the fi ve southeastern Pennsylvania counties, and into
the states of New Jersey and Delaware. New Jersey
Transit (NJ Transit) operates the RiverLINE, the Atlantic
City Rail Line, commuter rail service on the Northeast
Corridor, commuter bus routes, and local bus service
in each of the region’s four New Jersey counties.
The Port Authority Transit Corporation (PATCO)
provides high-speed commuter rail between
Lindenwold, New Jersey, and Center City Philadelphia.
Pottstown Area Rapid Transit provides local bus
service in Pottstown, Pennsylvania. Collectively,
Greater Philadelphia’s transit infrastructure is made
up of the following components:8
8 Transit infrastructure refers to the region’s public transit agencies only, and does not include infrastructure owned and operated by Amtrak, private freight rail carriers, or private bus companies such as Greyhound or Megabus.
• Transit vehicles
(including 470 commuter rail cars, 464 heavy-rail
vehicles, 202 light-rail/trolley vehicles, 38 trackless
trolleys, and 1,678 buses);
• 550 track miles
(including 31 miles of elevated, 61 miles of tunnel
structure, 137 interlockings connecting different
tracks together, 425 bridges and 281 at-grade
crossings, and 88 power substations and switching
stations);
• 383 stations and bus terminals;
• 32 vehicle maintenance and storage shops; and
• Numerous signals and communications equipment.
The region’s substantial backlog of infrastructure
projects must be completed before it can be
considered to be in a state-of-good repair.
Top priorities for infrastructure maintenance and
preservation between now and 2040 include:
• Bridge, substation, and shop roof replacement and
repairs are the current critical infrastructure needs;
• New trolley and regional rail vehicle replacements
will become more of a critical need over the next
10 years; and
• Major transit station renovations.
State of the Transit System
16

The recent procurement of the Silverliner V regional
rail cars allowed the region to retire the Silverliner
II and III trains. The Silverliner IV fl eet is now
approaching the end of its useful life and should be
replaced in the next 10 years. The proposed Silverliner
VI fl eet would allow SEPTA to retire the aging fl eet and
accommodate ridership growth.
SEPTA’s Center City trolley tunnel is at capacity.
The vehicle fl eet, built in 1981, is not compliant
with the ADA and is nearing the end of its useful
life. To address capacity constraints and regulatory
requirements, new fl eet specifi cations will include low-
fl oor, articulated trolleys.
The Broad Street Line heavy-rail vehicles began
service in 1982. These cars will need to be
rehabilitated or replaced in the 2030s.
Preservation projects are imperative to maintaining
transit service. It is also important to invest in
operational improvements that maximize the capacity
of the existing transit network. These projects will
benefi t existing riders, while making transit more
appealing to potential riders. Track improvements
on the regional rail system may allow for more
frequent regional rail service. Increased parking
and development at targeted stations can serve
more riders on the existing network. Increasing
the frequency of bus service and rider amenities
at existing bus loops, stops, and transportation
centers can also encourage new users. Examples of
operational improvement projects include:
• Double tracking portions of the Warminster Line;
• Adding a crossover on the regional rail trunk
line near Wayne Junction to allow trains in the
prevailing direction to use two of the three tracks;
• Station improvements and expanded parking;
• Bus and trolley loop revitalization program; and
• Comprehensive “transit fi rst” signal
synchronization/preemption program to speed up
transit service.
Achieving regional sustainability will demand that
state-of-good repair and operational projects be
complemented by system expansion to support
economic growth and development. New capacity
should help to focus growth in existing centers in
the region.
17
Philadelphia’s City Hall Station has not undergone a major
renovation since it began service in 1928. The station
suffers from water damage, corrosion, and concrete
spalling. The station platforms and stairways are too
narrow to deal with the crush of peak-hour use, and the
station lacks elevators and other important Americans
with Disabilities Act accessibility features.
Photo: Southeastern Pennsylvania Transportation Authority.

SEPTA’s 2013 Capital Budget shows
more than $5 billion of unmet
needs. The components of the
region’s transit system currently in
most need of critical repairs are the
bridges, substations, and shop roofs. The
longer these projects are delayed, the larger in scope
and more expensive they become. Substations are
critical because they provide the power necessary
to operate the regional rail system, subway, trolley,
and Norristown High Speed and Media-Sharon Hill
lines. Storage and maintenance shops are critical for
regular vehicle servicing and to ensure that vehicles
and maintenance equipment are protected against
weather.
Investment Scenarios Key transit maintenance and preservation initiatives
that will likely happen in all scenarios include:
• Doylestown Line catenary replacement;
• Chestnut Hill West Line (7) bridge replacements;
• Chestnut Hill East Line (5) bridge replacements;
• Station renovations at Exton, Race-Vine,
and 5th Street;
• Norristown High Speed Line tie and signal
replacements;
• 30th Street rail yard catenary and structure
replacement;
• New rail shop at Midvale;
• Purchase of new commuter rail vehicles for NJ
Transit on the Northeast Corridor;
• Atlantic City Rail Line: purchase of new passenger
rail cars, locomotives, and rehabilitation of all
stations; and
• Purchase of (2,432) 40-foot buses, (288) 45-foot
buses, (155) 60-foot buses, and (38) trackless
trolleys.
Low Scenario
In the low scenario, the region largely spends the
next 27 years working through the existing backlog of
needs. Lack of funding means many repairs happen
much later than they should. Several essential bridge
and substation repairs will be delayed until the late
2020s. These delays could lead to speed restrictions
and/or service truncations in the meantime. Critical
projects that are delayed in this scenario include:
• The Crum Creek Viaduct on the Media-Elwyn Line
was constructed in 1895 and carries more than
320 freight and passenger trains per week.
Failure to replace this structure in a timely manner
could lead to long-term service disruptions for
1,600 daily passengers who use the Elwyn, Media,
Moylan-Rose Valley, and Wallingford stations, as
well as bring an end to all freight movement that
occurs on this line.
Maintaining Our Transit System
18
The 1930s-era Wayne Junction Substation supplies power
to operate the Norristown, Chestnut Hill East, Lansdale-
Doylestown, Warminster, West Trenton, and Fox Chase
regional rail lines. This aging facility will be replaced in part
with a competitive Transportation Investment Generating
Economic Recovery (TIGER) grant from the Federal Transit
Administration.
The Crum Creek Viaduct was built in 1895 and needs to
be replaced in the next 10 years. Only the high funding
scenario is likely to afford this project in that timeframe.
Delaying the replacement until 2025, in the medium and
low scenarios, increases the possibility that this bridge will
need to be closed to passenger and freight rail movements
before it is replaced.
Photos: Southeastern Pennsylvania Transportation Authority.

• The Norristown High Speed Line Bridge over the
Schuylkill River. Originally constructed in 1911, it
is now badly corroded. Delaying replacement could
slow or disrupt service on this line.
• City Hall Station was constructed in 1928. Narrow
platforms and lack of ADA accessibility make
the station diffi cult to use. Safety improvements,
including ADA improvements such as elevators,
ramps, and high-level platforms, at this and other
stations are delayed.
• Delays occur on critical substation replacements,
including those at Jenkintown, Lenni, Morton,
Bethayres, Chestnut Hill East, Ambler, Doylestown,
Hatboro, Clifton, and along the Market-Frankford Line.
Shop roofs are not replaced until the late 2020s,
potentially leading to worsening fl eet conditions and
temporary emergency situations due to water damage.
Utility vehicle purchases are also delayed, making
maintenance of track and vehicle fl eets diffi cult
and more time consuming. This could lead to lower
operating speeds and reduced service reliability.
The region is not able to procure all needed 3,199
replacement buses and trackless trolleys. Nor is it able
to replace any rail vehicles (Silverliner VIs, trolleys,
articulated trolleys, and Broad Street Line cars). As fl eet
age increases, passenger comfort is reduced, and the
system will be less reliable as breakdowns become
more common. New buses are more likely to be diesel
rather than hybrid or another more fuel-effi cient
option. Diesel buses cost less at initial purchase, but
as energy prices increase, reduced fuel effi ciency
could result in higher operating expenses over time. In
addition, they emit higher levels of
air and noise pollution. Meanwhile,
congestion may increase on the
roads, particularly due to bridge
closures. This affects the speed of
buses, which travel on the same
roads as trucks and vehicles. A
number of bus routes will have to be
rerouted if bridges are closed, further
inconveniencing transit patrons.
Medium Scenario
The medium scenario completes
the existing backlog of repair
needs in a more timely fashion
than the low scenario. It keeps the
overall backlog in 2040 at about
the same level as exists now. The
region is still limited in its ability to fund operational
and new capacity improvements. There are delays,
due to funding constraint, in the procurement of new
Silverliner VI regional rail cars. This does not happen
until the late 2020s, about a decade after it should.
Broad Street Line vehicles are not rehabbed or
replaced prior to 2040.
Bridge and substation repairs are completed within a
reasonable timeframe so as not to worsen their
Transit System Perception
The region’s transit system is a valuable regional asset. It is critical to achieving a more sustainable and economically competitive transportation system. Ridership can be increased by improving the condition of the system. A rundown, poorly maintained system will more frequently breakdown and will have a hard time attracting new riders. A well-maintained system is safe, clean, comfortable, and reliable, and is more likely to attract new riders and retain the ones it has.
condition and increase the scope of the repair work for
the projects. This reduces the possibility of rail service
disruptions in the late 2020s.
Additional funding means the
region is able to procure about 200
more new buses and maintain the
current fl eet age. This will lower
operating and maintenance costs,
enhance service reliability, and
improve passenger comfort. Vehicle
maintenance and storage shop roofs
are repaired consistently, reducing
the risk of vehicle and maintenance
equipment damage.
City Hall Station is updated sooner
than in the low scenario. Major
station renovations also occur at
Paoli, Ardmore, and Levittown, in
addition to the 69th Street garage.
High Scenario
At this investment level, the region is able to fund
all critical infrastructure needs to achieve a state-of-
good repair. Procurement of all replacement vehicles
(Silverliner VIs, articulated trolleys, buses, and Broad
Street Line cars) occur when needed. Villanova Station
also receives a major renovation. Achieving a
state-of-good repair allows the region to make
additional needed operational and new capacity
improvements.

When SEPTA took over the remnants
of the Pennsylvania and Reading
Railroads, the Philadelphia
Transportation Company,
the Philadelphia Suburban
Transportation Company, and the Schuylkill Valley lines,
much of the system was already in poor condition due to
long-term disinvestment.
A number of events worked against privately run mass
transit in both Greater Philadelphia and the United States
during the time leading up to SEPTA’s formation in 1964.
First, the Great Depression led to reduced business and
travel activity. Then World War II focused U.S. industrial
activity on wartime needs. Finally, after the war, both
consumer preference and government policy steered
development to new suburban areas accessed almost
exclusively by private vehicles. In the 1950s and 1960s,
much of the region’s transit infrastructure dating from the
early part of the 20th century was reaching the end of its
useful life. With ridership declining at the time, private
operators chose not to reinvest in their transit operations.
Rather than let the region’s transit infrastructure disappear,
SEPTA was created as a public management agency.
Though it has never received the funding needed to achieve
a state-of-good repair, the history of SEPTA is largely based
on asset management and improved operations:
• In the 1960s and 1970s, new regional rail cars were
purchased;
• In the 1980s, the commuter rail tunnel in Center City
Philadelphia opened, allowing the former Reading and
Pennsylvania rail lines to be joined into a single rail
network; and new Broad Street Line vehicles and trolley
cars were procured;
• In the 1990s, Norristown High Speed Line and Market-
Frankford Line vehicles were replaced;
• The 2000s saw the restoration of the Frankford and
Norristown Transportation Centers, reconstruction of
the Market-Frankford Line’s elevated structure; and
• The recent procurement of the Silverliner V regional
rail vehicles.
Additional investments in the transit system are critical
to sustaining the ridership growth the region has seen in
recent years.
Why is Greater Philadelphia’s Transit System in a
The Norristown High Speed Line Bridge over the Schuylkill
River is more than 100 years old and is substantially
corroded. While the high and medium scenarios envision
replacing this bridge in the next fi ve years, the low would
defer its replacement to somewhere in the 2020s, risking
the chance of service disruption on this line.
20
The Jenkintown Substation was constructed in 1930. It
supplies power to the Lansdale-Doylestown, Warminster,
and West Trenton regional rail lines. This is one of 15
regional substations that are past their useful life.
Photos: Southeastern Pennsylvania Transportation Authority.
State of Disrepair?
Investments that improve the
performance and better integrate
regional transit system facilities
provide benefi ts for residents,
businesses, and visitors.
Investment Scenarios
Improvements that will likely happen in all scenarios:
• Positive train control (PTC);9
• Norristown High Speed Line retaining walls and
embankment improvements;
• Cynwyd Line connection, signals, retaining walls,
and embankment improvements;
• Route 101 and 102 signals and interlocking
improvements;
• Broad Street Line and Market-Frankford Line
communications systems;
• Paoli Line signal and switch improvements for safety
and increased service frequency; and
• Broad Street Spur signal replacement.
The low scenario is not able to invest in needed
regional rail and trolley vehicles. This leads to
overcrowding on these routes starting in the early
2020s and continuing through 2040.
9 PTC is a technology that automatically stops a train if it detects possible train-to-train collisions, a train has shifted onto the wrong track, entered a work-zone area, or is moving too fast. This is an unfunded federal mandate on all passenger and Class I freight railroad operators in the United States, with a completion date of December, 2015.
The medium scenario impacts include:
• Siding and station improvements for increased
service frequency on the Atlantic City Rail Line.
• Silverliner VI and trolley procurements are delayed
and no articulated trolleys are purchased. This
means reduced service reliability and no increase
in vehicle capacity, leading to overcrowding on the
trolley lines through 2040, and on regional rail lines
throughout the 2020s.
In the high scenario, operational improvements
allow for both capacity and service frequency
enhancements, including:
• Additional tracks on the Norristown, West Trenton,
Warminster, and Trenton lines, creating increased
reliability and additional service possibilities;
• ADA improvements to stations throughout the
network, including high-level platforms on the
regional rail system, and expanded transportation
centers at Ardmore, Paoli, 69th Street, and Fern
Rock;
• Expanded parking at key stations; and
• Restoration of the Route 23 light-rail service in
Philadelphia.
Timely and additional vehicle procurements, along
with the purchase of articulated trolley vehicles, helps
to reduce passenger overcrowding on the trolley and
regional rail lines.
21
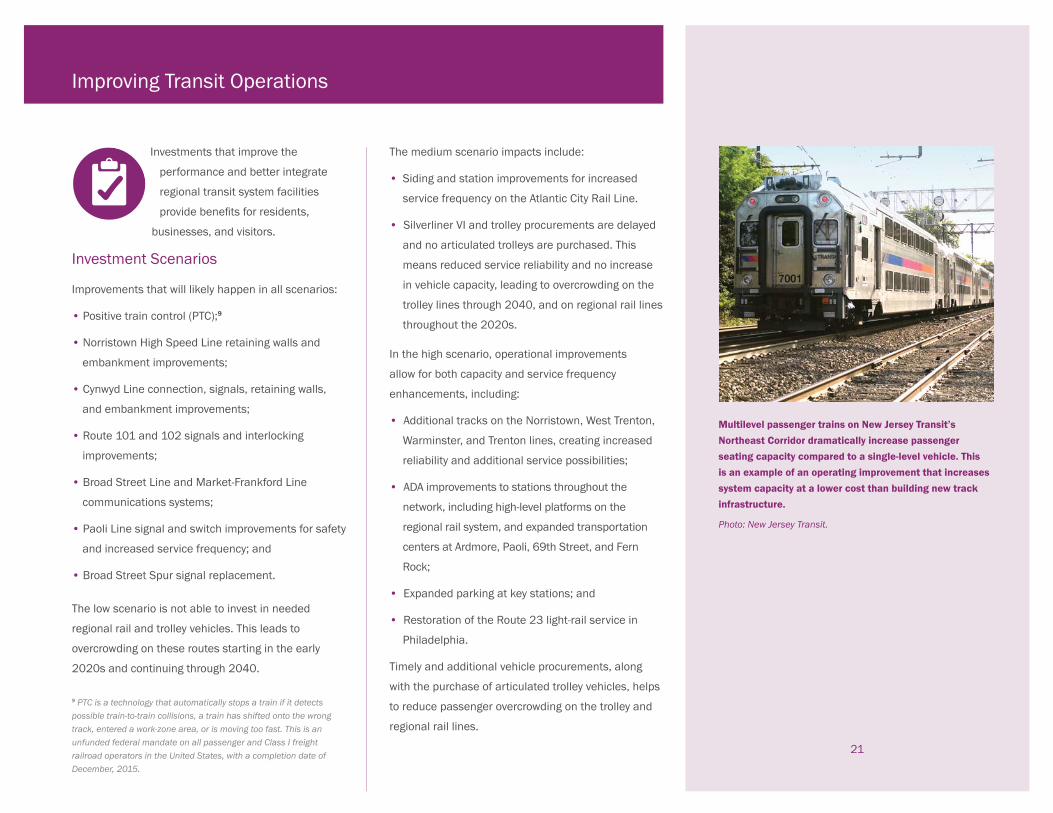
Multilevel passenger trains on New Jersey Transit’s
Northeast Corridor dramatically increase passenger
seating capacity compared to a single-level vehicle. This
is an example of an operating improvement that increases
system capacity at a lower cost than building new track
infrastructure.
Photo: New Jersey Transit.
Improving Transit Operations
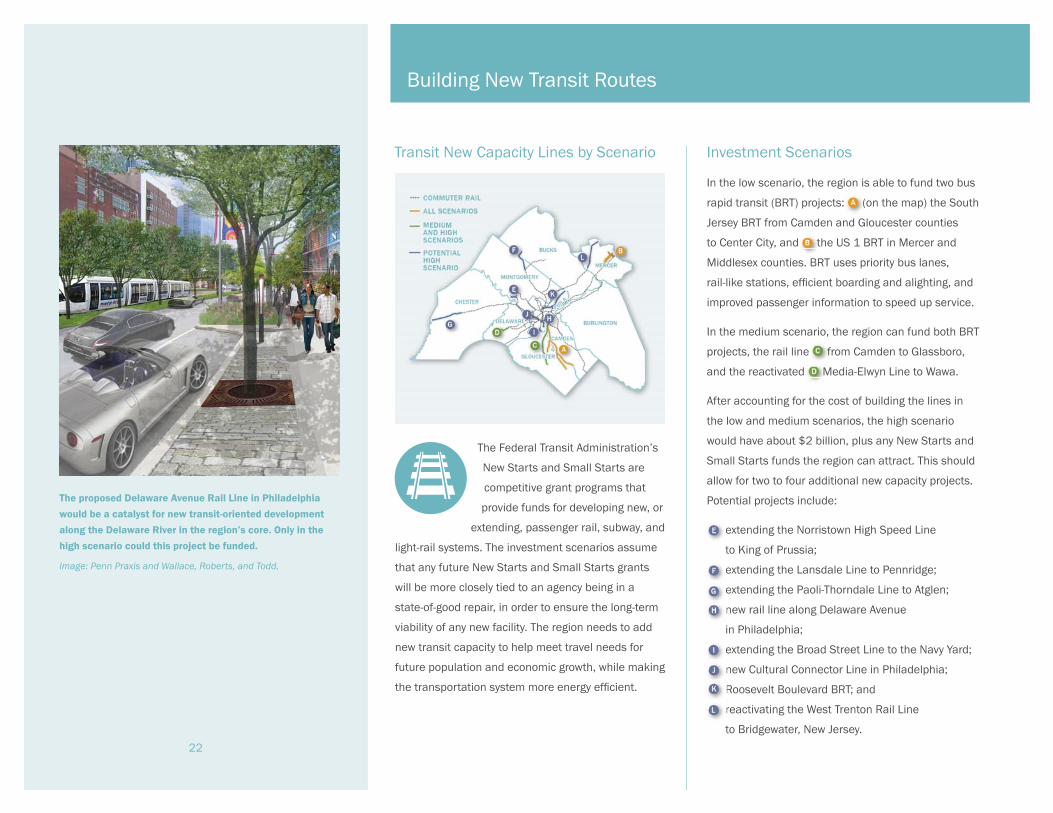
The proposed Delaware Avenue Rail Line in Philadelphia
would be a catalyst for new transit-oriented development
along the Delaware River in the region’s core. Only in the
high scenario could this project be funded.
Image: Penn Praxis and Wallace, Roberts, and Todd.
The Federal Transit Administration’s
New Starts and Small Starts are
competitive grant programs that
provide funds for developing new, or
extending, passenger rail, subway, and
light-rail systems. The investment scenarios assume
that any future New Starts and Small Starts grants
will be more closely tied to an agency being in a
state-of-good repair, in order to ensure the long-term
viability of any new facility. The region needs to add
new transit capacity to help meet travel needs for
future population and economic growth, while making
the transportation system more energy effi cient.
Investment Scenarios
In the low scenario, the region is able to fund two bus
rapid transit (BRT) projects: (on the map) the South
Jersey BRT from Camden and Gloucester counties
to Center City, and the US 1 BRT in Mercer and
Middlesex counties. BRT uses priority bus lanes,
rail-like stations, effi cient boarding and alighting, and
improved passenger information to speed up service.
In the medium scenario, the region can fund both BRT
projects, the rail line from Camden to Glassboro,
and the reactivated Media-Elwyn Line to Wawa.
After accounting for the cost of building the lines in
the low and medium scenarios, the high scenario
would have about $2 billion, plus any New Starts and
Small Starts funds the region can attract. This should
allow for two to four additional new capacity projects.
Potential projects include:
extending the Norristown High Speed Line
to King of Prussia;
extending the Lansdale Line to Pennridge;
extending the Paoli-Thorndale Line to Atglen;
new rail line along Delaware Avenue
in Philadelphia;
extending the Broad Street Line to the Navy Yard;
new Cultural Connector Line in Philadelphia;
Roosevelt Boulevard BRT; and
reactivating the West Trenton Rail Line
to Bridgewater, New Jersey.
Building New Transit Routes
22
Transit New Capacity Lines by Scenario
e
e
e
n
e
n
R
((
tt
ffr
MM
r

Multimodal improvements, such as new
bike and pedestrian facilities, provide
mobility choices. Each individual who
walks or bikes instead of driving takes
a vehicle off the road. This benefi ts
drivers and other transportation system users.
The Circuit, a 750-mile interconnected multiuse trail
network, comprises a component of the regional bike
and pedestrian infrastructure. Currently, 250 miles of
this network exist, while another 50 miles are nearing
completion. These are the priority segments of the
larger 1,700-mile regional trail network identifi ed in
the Connections (2035) Plan.
In addition, the Connections (2035) Plan includes
funding for new bike lanes, sidewalks, streetscaping,
pedestrian countdown timers on traffi c signals, and
other bike and pedestrian infrastructure.
Investment Scenarios
At current funding allocations, only the high scenario
fully constructs the Circuit regional trail network by
2040. In addition, this scenario could complete about
80 miles of the larger regional trail network. Under
the medium scenario, the Circuit would be 92 percent
complete in 2040, while the low scenario would
realize about 82 percent of the network.
Expanding Our Bike and Pedestrian Facilities
Bike and pedestrian facilities benefi t health, increase
property values, provide recreational and commuting
opportunities, and help to preserve critical open
space areas.
Photo: Bicycle Coalition of Greater Philadelphia.
04
The Circuit: Greater
Philadelphia’s Regional Trail
NetworkSource: Delaware Valley
Regional Planning Commission.
The Circuit is a planned, interconnected 750-mile mixed-use regional trail network. Only about a third of the network, as envisioned, exists currently. About 50 miles are soon to be completed, but more than 400 miles remain unfunded at this time. Completion of this network will create new opportunities for commuting, recreation, and tourism in the region. More information about The Circuit can be found at www.connectthecircuit.org.
Miles of Mixed-Use Trail Built 2014-2040 by Scenario
Source: Delaware Valley Regional Planning Commission.
23

As future population and employment
increases, the region needs to make
existing facilities more effi cient
and develop new roads and transit
routes to meet growing demand. This
is necessary both to ensure quality of life
and economic competitiveness. Even in the best-
case transportation investment scenario, Greater
Philadelphia is still falling behind more competitive
regions throughout the nation and world.
The age of the system and growing system
preservation needs mean that we will have less
funding for operational improvements and new
facilities. The estimated cost to achieve and maintain
a state-of-good repair for all roads and bridges in
the region is $27 billion more than the anticipated
available revenue in the high scenario. In the medium
and low scenarios, road and bridge preservation
needs are more than twice the anticipated revenue,
before considering any operational improvement or
new capacity projects.
The high scenario helps the region keep up with
population and employment growth by funding new
facilities and operational improvements. This scenario
forecasts the best road and bridge conditions, though
they will worsen relative to today as the system ages.
Higher investment in the transportation system
allows the region to attain other Plan goals, such
as improving safety, reducing congestion, lessening
our reliance on energy, lowering greenhouse gas
emissions, and adapting to climate change. While
there are still many worthwhile transportation projects
that will go unfunded in the high scenario, the region
will be more competitive in the global economy.
The medium scenario focuses on system preservation.
The backlog of road and bridge needs will grow and
maintenance will becomes less reliable and more
costly as the system ages. The transit system remains
at about the same condition as it currently is in, and
limited investments in operating and new capacity
enhancements are made. The age of the system
increases operating expenses for both motor vehicles
and transit and leads to a more reactive maintenance
approach, limiting the region’s ability to make strategic
capital improvements in a timely manner.
In the low scenario, decreased funding levels
will likely mean more congestion and higher
transportation costs due to deteriorated pavement
condition. With more than 100 bridge closures
throughout the region, this scenario actually reduces
road capacity. The region also faces potential long-
term service disruptions of existing transit routes.
Taken together, this will lead to a congested and
overcrowded transportation system, along with
substantial negative economic impacts, particularly
as poor road conditions and travel delays increase the
cost to ship goods to, from, and through the region. In
the end, commerce will be slowed and the region will
become less attractive to existing and new businesses.
Investment Scenario Implications
24
$$$
Identify your vision for future development in the region and show us how you would invest in transportation infrastructure by taking the Connections 2040: Choices & Voices challenge at www.dvrpc.org/ChoicesandVoices

This report
is intended
to facilitate
regional
dialogue of
a collective vision
for the future of Greater
Philadelphia’s transportation
system, and how we will pay
for it. This analysis will also
guide the development of
the Connections 2040 Plan,
particularly the fi nancial
portion in which the region
will reconsider its investment
priorities over the next 27
years.
More than 70 percent of
the region’s road funding is
currently dedicated to road
and bridge maintenance,
but far more is needed.
Reallocating additional funds
to system preservation would
come at the expense of operational improvements
or new capacity. These two project categories have
already been reduced, but are critical to serve future
population and economic growth. Reallocating existing
funding does not close the region’s transportation
funding gap. Shrinking the gap will take some
combination of more effi cient
project delivery, reducing the size
of the system, and fi nding new
funding sources.
Increased effi ciency means
adopting innovations that reduce
the amount of time it takes to
complete projects, or develop
new design and construction
methods to lower costs or
extend a facility’s useful life.
For instance, new pavement
design software can more
accurately determine needed
pavement depth for given traffi c
and weather conditions than
was previously possible. This
helps to minimize overdesign
and reduces the use of raw
materials. The region needs to
continue to apply research and
new technologies to maximize its
limited transportation funding.
In rethinking the size of the system, the region should
also begin to identify potentially redundant bridges
that could be removed from the network rather than
replaced. Other facilities, such as roads, may need to
be “right-sized” into fewer lanes if the region is going
to live within its current means.
Our Recommendations
DVRPC explored different funding options in the
Connections (2035) Plan. Options include user
fees, bonds, public-private partnerships, and
other nontransportation taxes and fees. Based on
household surveys, the public believes the fairest
manner by which to generate new revenue, without
burdening future generations with debt or forcing
nonusers to pay, is through direct user fees or
increased public-private partnerships. Such fees could
include increased tolling, fuel taxes, vehicle-mile-
traveled fees, parking taxes, transit fares, or title and
registration fees.
Federal and state funding levels have been relatively
stagnant, and any additional revenues will most
likely have to come from local or regional sources.
Greater Philadelphia currently rates very low in terms
of regionally generated funding for its transportation
system compared to peer regions in the United
States. Many regions across the country are investing
in transportation through voter referendums on
additional sales tax or other funding measures,
or instituting tolls. The region should work to build
consensus on a way to fund regional transportation
priorities, and work with the state and local
governments on various options.
A Call to Action
MAP-21 sets federal funding through 2014. After that, declining fuel tax revenue and dwindling federal and state transportation trust fund balances lead to an uncertain future.
Without some new way of funding transportation, the region could be looking at the low investment scenario. In this scenario, the region’s roads severely deteriorate, a number of bridges close, and transit service is reduced. This will increase congestion and personal transportation costs, while reducing safety. Even maintaining status quo funding is an unattractive option, as it delays or lacks funding for many critical projects.
Increased transportation funding provides new jobs and a high return on investment for the entire region. Residents, workers, businesses, and visitors can all benefi t from enhanced economic competitiveness and improved quality of life. Greater Philadelphia will need to invest in its transportation system to secure our region’s future.
25

190 North Independence Mall West, 8th Floor
Philadelphia, PA 19106
Telephone 215.592.1800
Fax 215.592.9125
www.dvrpc.org
October 2012 l Publication Number: 13004
The Delaware Valley Regional Planning Commission is dedicated to
uniting the region’s elected officials, planning professionals, and the
public with a common vision of making a great region even greater.
Shaping the way we live, work, and play, DVRPC builds consensus
on improving transportation, promoting smart growth, protecting the
environment, and enhancing the economy. We serve a diverse region
of nine counties: Bucks, Chester, Delaware, Montgomery, and
Philadelphia in Pennsylvania; and Burlington, Camden, Gloucester,
and Mercer in New Jersey. DVRPC is the federally designated
Metropolitan Planning Organization for the Greater Philadelphia
Region — leading the way to a better future.
DVRPC fully complies with Title VI of the Civil Rights Act of 1964
and related statutes and regulations in all programs and activities.
DVRPC’s website (www.dvrpc.org) may be translated into multiple
languages. Publications and other public documents can be made
available in alternative languages and formats, if requested.
For more information, please call (215) 238-2871.