trends in chronic bronchitis and …research.vuse.vanderbilt.edu/srdesign/2003/group11/copd...
TRANSCRIPT
TRENDS IN CHRONIC BRONCHITIS AND EMPHYSEMA:MORBIDITY AND MORTALITY
AMERICAN LUNG ASSOCIATIONEPIDEMIOLOGY & STATISTICS UNIT
RESEARCH AND SCIENTIFIC AFFAIRSMARCH 2003
TABLE OF CONTENTS
Trends in Chronic Bronchitis and Emphysema Morbidity and MortalityIntroductionCOPD Mortality, 1979-1998, 1999-2000COPD Prevalence, 1982-1996 and 1997-2001COPD Hospital Discharges, 1979-2000Economic Cost of COPDGlossary and References
List of TablesTable 1: Number of Deaths by Race and Sex, 1979-1998, 1999-2000Table 2: Age Adjusted Mortality Rate by Race and Sex per 100,000 Population, 1979-1998, 1999-
2000Table 3: COPD - Number of Deaths and Age-Adjusted Death Rate per 100,000 Population by
Ethnicity and Sex, 1999-2000Table 4: Chronic Bronchitis - Number of Conditions and Age-Specific Prevalence Rates per 1,000
Persons, 1982-1996, 1997-2001Table 5: Chronic Bronchitis - Number of Conditions and Rate per 1,000 Persons by Race and Age,
1982-1996, 1997-2001Table 6: Chronic Bronchitis - Number of Conditions and Rate per 1,000 Persons by Sex, 1982-1996,
1997-2001Table 7: Emphysema - Number of Conditions and Age-Specific Prevalence Rates per 1,000 Persons,
1982-1996, 1997-2001Table 8: Emphysema - Number of Conditions and Rate per 1,000 Persons by Race and Age, 1982-
1996, 1997-2001Table 9: Emphysema – Number of Conditions and Rate per 1,000 Persons by Sex, 1982-1996, 1997-
2001Table10: Chronic Bronchitis and Emphysema - Number of Conditions and Prevalence Rate per
1,000 Persons by Ethnicity, 1997-2001Table11: Number of First-Listed Hospital Discharges and Rate per 10,000 Population by Age, 1979-
2000Table12: Number of First-Listed Hospital Discharges and Rate per 10,000 Population by Race,
1988-2000Table13: Number of First-Listed Hospital Discharges and Rate per 10,000 Population by Sex, 1988-
2000
List of FiguresFigure 1: Age-Adjusted Death Rates Based on 1940 and 2000 Standard Populations, 1979-2000Figure 2: Number of Conditions in Adults Aged 18 Years and Older, 1997-2001Figure 3: Percentage Distribution of Chronic Bronchitis by Sex, Age, Ethnicity and Geographic
Region, 2001Figure 4: Percentage Distribution of Emphysema by Sex, Age, Ethnicity & Geographic Region, 2001Figure 5: Trend in Hospitalizations, 1979-2000Figure 6: Trend in Hospitalizations by Age, 1979-2000Figure 7: COPD - Trend in Hospitalizations by Race, 1988-1999Figure 8: COPD - Trend in Hospitalizations by Sex, 1988-2000
Introduction
The following tables delineate information available from national surveys and statistics on trends inmorbidity and mortality attributed to chronic obstructive pulmonary disease (COPD). COPD is usedas an umbrella term for chronic bronchitis and emphysema. As an overview of the COPD problemin the United States, data are examined on hospitalization, prevalence, mortality and economic costs.Please note that the following tables and narrative refer exclusively to data on chronic bronchitis,emphysema and other chronic lower respiratory diseases; data on asthma are not included.
COPD Mortality
Beginning with 1999 mortality data, the population standard used for calculating age-adjusting deathrates was changed from the 1940 population to the 2000 population. This change had three importantoutcomes: (i) provided age-adjusted rates that are less divergent from crude rates (ii) ensured that allgovernment agencies use the same standard and (iii) corrected the public perception that age adjust-ment to the 1940 population provides out-of-date statistics. Use of the 2000 standard has placedmore weight on death rates at older ages and less weight on death rates at younger ages. Becausemost lung disease rates increase with age, death rates using the new standard are higher than thoseusing the old standard. Figure 1 compares the COPD age-adjusted death rates based on the 1940 and2000 standard populations from 1979-2000. Age-adjusted deaths rates for COPD are approximately2 times greater using the 2000 standard population than those based on the 1940 standard population.
In addition, starting with 1999 data, the tenth revision of International Classification of Diseases(ICD-10) has replaced ICD-9 in coding and classifying mortality data from death certificates. TheICD is periodically revised to incorporate changes in the medical field. This change has severalconsequences: (i) new cause-of death titles and corresponding cause-of-death codes, i.e. ICD-10 hasalphanumeric categories rather than numeric categories, (ii) breaks in comparability of cause-of-death statistics, and (iii) restructuring of the leading causes of deaths. In order to assess the net effectof the new revision on death statistics, a comparability ratio is derived. The comparability ratio iscalculated by dividing the number of deaths for a selected cause of death classified by the newrevision by the number of deaths classified to the most nearly comparable cause of death by theprevious revision. A comparability ratio of 1 denotes no change between revisions; a ratio of lessthan 1 signifies a decrease and a ratio of greater than 1 symbolizes an increase in deaths. The com-parability ratio for COPD is 1.056, indicating a 6% increase in assignments of deaths due to COPDwhen using ICD-10.
Sex and Race Specific Mortality Rates
Due to decennial revisions of the International Classification of Diseases (ICD) coding system andthe change in age-adjusted standard population, the number and rate of COPD deaths for 1999-2000are not directly comparable to those reported from 1979-1998.
Table 1 documents the number of deaths by race and sex between 1979 and 2000. In 2000, 117,522people died of COPD. Specifically, 16,700 died of emphysema, 1,167 people died from chronicbronchitis and 99,655 people died from chronic obstructive pulmonary disease not classified else-where. For the first time the number of deaths due to COPD in 2000 was higher among women thanin men.
Table 2 displays the age-adjusted death rate per 100,000 population by race and sex. COPD is thefourth-ranked cause of death in the United States with an age-adjusted death rate of 42.7 per 100,000population. The age adjusted death rate in males was 1.5 times greater than the rate seen in females.The age-adjusted death rate in whites (44.8 per 100,000) was 1.6 times greater than the rate in blacks(27.8 per 100,000). COPD is, as of now, the only lung disease in which the white population hashigher age-adjusted death rates than blacks. Black women had the lowest age-adjusted death rates in2000 with 18.9 per 100,000.
Table 3 delineates the number of deaths and mortality rate per 100,000 population by Hispanicorigin. In 2000, 2,397 Hispanics died of COPD – a mortality rate of 7.6 per 100,000 population.Rates in Hispanics were significantly lower than other ethnic groups.
Unlike morbidity estimates, which are drawn from sample populations and extrapolated to theoverall population, mortality data is obtained from the general population by death certificates.Therefore, the sex- and race-specific numbers and rates denote true differences, not estimates.
Prevalence Trends, 1982-1996, 1997-2001
The National Health Interview Survey (NHIS) is a multi-purpose health survey conducted by theNational Center for Health Statistics (NCHS), Centers for Disease Control and Prevention (CDC). Itis the principal source of information on the health of the civilian, noninstitutionalized, householdpopulation of the U.S.
Despite the periodic revision of the NHIS Core questionnaire, Supplements began to play an increas-ingly important role in the survey as a means of enhancing topic coverage in the Core section. Theunintended result was an increasingly unwieldy survey instrument and longer interviewing sessions:recent questionnaires (Core and Supplements combined) ran almost 300 pages, while the interviewsaveraged two hours. This imposed an unacceptable burden on NCHS staff, US Bureau of Censusinterviewers, the data collection budget, and on the NHIS respondents. Furthermore, the excessivelength of NHIS interviews contributed to declines in both response rate and data quality. For allthese reasons, NCHS implemented a redesigned NHIS questionnaire in 1997.
The new questionnaire design has made it impossible to compare current chronic bronchitis andemphysema estimates with those prior to 1997 and to each other. Survey respondents were formerlyasked if any family member had chronic bronchitis and/or emphysema in the past 12 months (pointprevalence). After the 1997 revision, respondents are asked if they had been diagnosed with chronicbronchitis in the past 12 months (point prevalence) and if they had ever been told by a health profes-sional that they had emphysema (period prevalence). In contrast with the prior questionnaire, theredesigned survey measures physician-diagnosed chronic bronchitis and emphysema and produces amore specific estimate than self-report. In addition, the change to the emphysema question willincrease estimates but will reflect the true prevalence of the disease since it is incurable. Moreover,since children historically do not suffer from COPD, these questions have been removed from thechild questionnaire.
Data between 1982 and 1996 should not be compared to 1997-2001 estimates.
COPD
Figure 2 displays the number of COPD conditions in adults 18 years of age and older from 1997 to2001. In 2001, 13.3 million U.S. adults aged 18 years and older were estimated to have COPD.
Chronic Bronchitis
Table 4 displays age-specific prevalence estimates for chronic bronchitis. After seeing a 10 percentdecline in chronic bronchitis prevalence rates between 1997 and 1999, the prevalence rate increased24 percent from 1999 to 2001. In 2001, it was estimated that 11.2 million Americans reported aphysician diagnosis of chronic bronchitis: 5 million 18-44 year olds, 4 million 45-64 year olds and2.0 million people over 65. Those over 65 had the highest prevalence rate at 67.3 per 1,000 personswhile those 18-44 had the lowest rate estimated at 45.7 per 1,000 persons. Between 1997 and 2001,the prevalence rate among those in the 45-64 age group increased 17 percent compared to a 9 and 10percent increase in the 18-44 and over 65 age groups, respectively. However, only the rate in the 18-44 age group was significantly different than the others.
Race specific trends are displayed in Table 5. Between 1997 and 2001, the prevalence rate in whitesincreased 14 percent, from 50.9 to 57.1 per 1,000 persons, while the rate in blacks increased 7percent, from 48.9 to 52.5 per 1,000 persons. In 2001, 9.5 million whites and 1.2 million blackswere diagnosed with chronic bronchitis. The difference between races was not significant. Thehighest prevalence rate was in the over 65 population (68.9 per 1,000 persons) for whites and in the45-64 age group (75.0 per 1,000) for blacks.
Table 10 displays the number of conditions and prevalence rates by Hispanic origin. Close to700,000 Hispanic Americans (31.0 per 1,000 persons) were diagnosed with chronic bronchitis in2001. The prevalence rate seen in Hispanics was significantly lower than that of Non-Hispanicwhites and blacks.
Sex specific prevalence trends are shown in Table 6. After a 16 percent decline in males in recentyears, the prevalence rate increased 15 percent between 1999 and 2001. Females experienced a 9percent increase between 1999 and 2001, after an 8 percent decrease between 1997 and 1999. In2001, 3.7 million males and 7.5 million females were diagnosed with chronic bronchitis. The differ-ence between the prevalence rates for males (38.0 per 1,000) and females (70.5 per 1,000) wasstatistically significant.
Percentage Distribution of Conditions, 2001
The percentage distribution of chronic bronchitis is displayed in Figure 3. Four pie charts describethe distribution of chronic bronchitis by sex, age, ethnicity and geographic region.
Emphysema
Age specific prevalence trends are displayed in Table 7. The emphysema prevalence rate is very lowin those under age 45. Of the estimated 3 million Americans ever diagnosed with emphysema, 93percent were 45 or older. In 2001, the reported emphysema lifetime prevalence rate was 14.6 per
1,000, a 12 percent decrease from 1997. Rates in all age specific groups were statistically significantdifferent from each other.
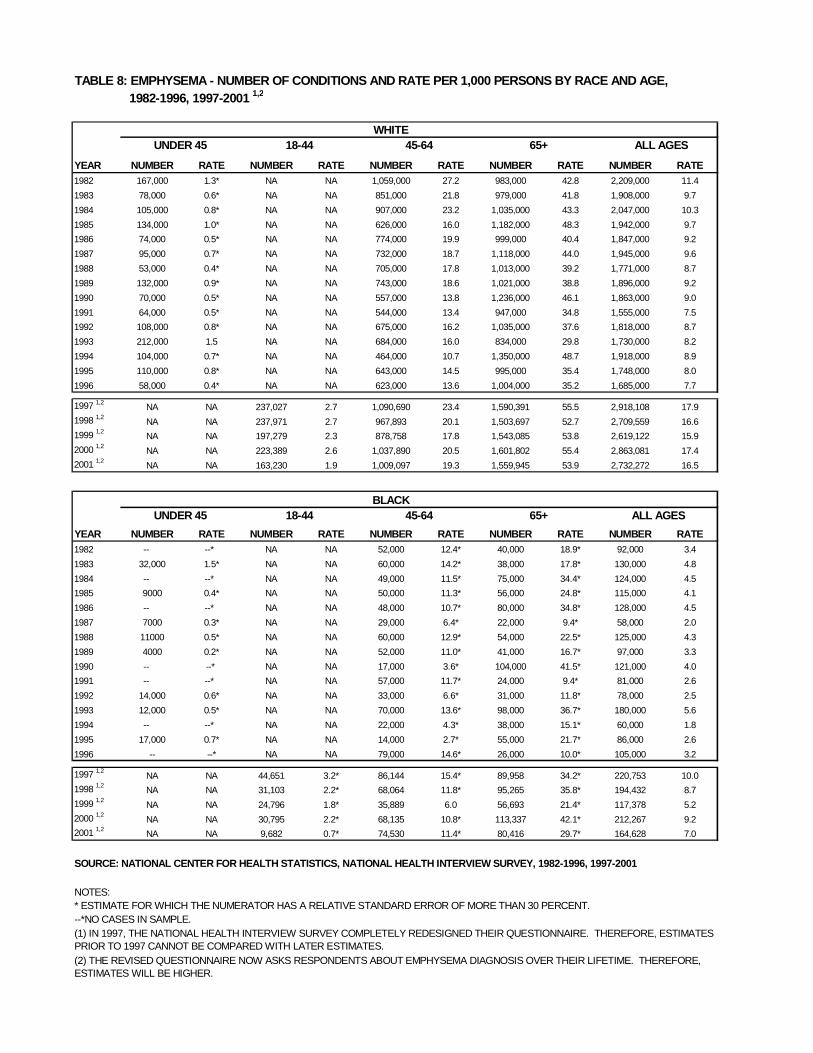
Race specific prevalence trends are displayed in Table 8. The lifetime prevalence rate of emphysemaincreases with age in the white population. In 2001, the rate in whites over age 65 (53.9 per 1,000persons) was almost 3 times greater than that in the population between 45 and 64 (19.0 per 1,000).The age specific prevalence rate in blacks is based on the reporting of much smaller numbers, whichproduces less reliable estimates and is therefore difficult to definitively characterize a clear trend.Between 1997 and 2001, the prevalence rate decreased by 8 percent in whites and decreased by 30percent in blacks. The difference in the overall rate reported between whites (16.5 per 1,000) andblacks (7.0 per 1,000) was significant.
Table 10 displays the number of conditions and prevalence rates by Hispanic origin. Over 130,000Hispanic Americans (6.0 per 1,000 persons) have been diagnosed with emphysema. The prevalencerate seen in Hispanics was significantly lower than Non-Hispanic whites.
Sex specific prevalence trends are delineated in Table 9. Between 1997 and 2001 the prevalence ratefor emphysema decreased 15 percent in males and close to 6 percent in females. Men had a higherprevalence rate than females – 17.2 per 1,000 persons vs. 12.3 per 1,000 persons. The differencebetween these rates was significant. Close to 1.7 million males and 1.3 million females have beendiagnosed with emphysema in their lifetime.
Percentage Distribution of Conditions, 2001
The percentage distribution of emphysema is displayed in Figure 4. Four pie charts describe thedistribution of emphysema by sex, age, ethnicity and geographic region.
COPD Hospital Discharges
The trend in the overall hospital discharge rate for COPD is depicted in Figure 5. The first listeddiagnosis is identified as the principal diagnosis on the medical record. An estimated 661,000discharges were reported in 2000, a discharge rate of 23.8 per 10,000 population.
Differences may exist between data reported for 1988-2000 and earlier years because of the redesignof the survey in 1988. Also in 1992, a jump in hospital discharges occurred due to a change in theICD code for chronic bronchitis. A new sub-classification (chronic bronchitis with acute exacerba-tions, ICD code 491.21) was introduced. It appears that many discharges previously coded as acutebronchitis (ICD code 466) were coded as 491.21 beginning in 1992. Thus the growth seen in 1992probably does not reflect an increase in COPD morbidity but rather indicates an underestimation inprevious years.
Between 1992 and 2000 the overall discharge rate increased by 41 percent from 16.9 per 10,000population to 23.8 per 10,000 population. This difference in rate was significant.
Table 11 delineates the number of first-listed hospital discharges and hospital discharge rate by agebetween 1979-2000. COPD is an important cause of hospitalization in our aged population. Morethan 65 percent of discharges were in the 65 years and older population in 2000. The discharge rate
for the population over age 65 (125.3 per 10,000) was significantly different than the rate for anyother group. For instance, the rate in the over age 65 group was over four times higher than that inthe 45-64 age group (30.8 per 10,000). This trend is shown in Figure 6.
The trend in hospital discharges by race is shown in Table 12 and Figure 7. The 2000 discharge ratefor COPD was highest in whites (19.7 per 10,000). In blacks the rate was 13.9 per 10,000. Thedischarge rate in all other races was reported at 6.6 per 10,000. These rates however, should be usedwith caution due to the large percentage of discharges (23% in 2000) for which race was not re-ported. It appears that the number of hospital discharges in whites may be disproportionately under-estimated, making it difficult to draw comparisons between races using these data.
Table 13 displays the trend in COPD hospital discharges by sex. Between 1988 and 1992, males hadslightly higher rates than females. Since 1993, the rate in females has surpassed the rate for males.In 2000 the rates among males and females were 22.1 per 10,000 and 25.1 per 10,000, respectively.The difference between sexes was not significant. This trend is also shown in Figure 8.
Economic Costs
Chronic bronchitis and emphysema take a heavy toll on our economy. According to estimates madeby the National Heart Lung and Blood Institute, in 2002 the annual cost to the nation for COPD was$32.1 billion. This included $18.0 billion in direct health care expenditures, $6.8 billion in indirectmorbidity costs and $7.3 billion in indirect mortality costs.
Summary
COPD is a major cause of morbidity and mortality in the United States. An estimated 13.3 millionadults aged 18 and over have reported a physician diagnosis of COPD. However, a recent surveyfound that 24 million U.S. adults have some evidence of impaired lung function, indicating an underdiagnosis of the disease.1 COPD is the fourth leading cause of death and for the first time the numberof women dying from the disease has surpassed the number seen in men.
1 National Center for Health Statistics. National Health & Nutrition Examination Survey, 1988-1994.
GLOSSARY
Prevalence: The number of existing cases of a particular condition, disease, or otheroccurrence (e.g.., persons smoking) at a given time.
Period Prevalence: The proportion of cases that exist within a population at any point during aspecified period of time.
Point Prevalence: The proportion of cases that exist within a population at a single point in time.
Crude Rate: Cases in a particular population quantity- e.g., per hundred.
Age-Adjusted Rate: A figure that is statistically corrected to remove the distorting effect of agewhen comparing populations of different age structures.
REFERENCES
1. National Center for Health Statistics, Raw Data from the National Health Interview Survey,United States, 1997-2001. (Analysis by the American Lung Association Research andScientific Affairs Division, Using SPSS and SUDDAN software)
2. National Center for Health Statistics, Current Estimates of the National Health InterviewSurvey, United States, selected years, 1982-1996.
3. National Center for Health Statistics, Report of Final Mortality Statistics, 1979-2000.
4. National Center for Health Statistics, Summary: National Hospital Discharge Survey,1980-2000 and data provided upon special request to the NCHS.
5. National Center for Health Statistics, Underreporting of Race in the National HospitalDischarge Survey, July 1996.
6. National Heart Lung and Blood Institute, Morbidity and Mortality Chartbook onCardiovascular, Lung and Blood Diseases, 2002.
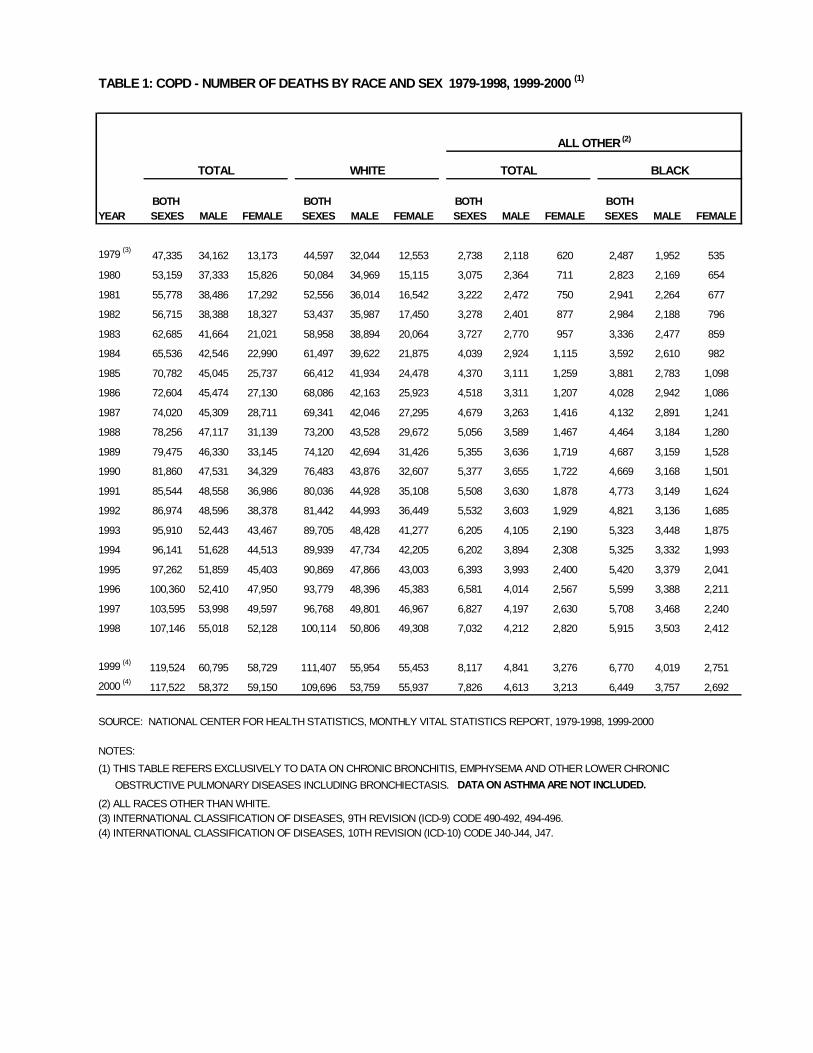
TABLE 1: COPD - NUMBER OF DEATHS BY RACE AND SEX 1979-1998, 1999-2000 (1)
TOTAL WHITE TOTAL BLACK
BOTH BOTH BOTH BOTHYEAR SEXES MALE FEMALE SEXES MALE FEMALE SEXES MALE FEMALE SEXES MALE FEMALE
1979 (3)47,335 34,162 13,173 44,597 32,044 12,553 2,738 2,118 620 2,487 1,952 535
1980 53,159 37,333 15,826 50,084 34,969 15,115 3,075 2,364 711 2,823 2,169 654
1981 55,778 38,486 17,292 52,556 36,014 16,542 3,222 2,472 750 2,941 2,264 677
1982 56,715 38,388 18,327 53,437 35,987 17,450 3,278 2,401 877 2,984 2,188 796
1983 62,685 41,664 21,021 58,958 38,894 20,064 3,727 2,770 957 3,336 2,477 859
1984 65,536 42,546 22,990 61,497 39,622 21,875 4,039 2,924 1,115 3,592 2,610 982
1985 70,782 45,045 25,737 66,412 41,934 24,478 4,370 3,111 1,259 3,881 2,783 1,098
1986 72,604 45,474 27,130 68,086 42,163 25,923 4,518 3,311 1,207 4,028 2,942 1,086
1987 74,020 45,309 28,711 69,341 42,046 27,295 4,679 3,263 1,416 4,132 2,891 1,241
1988 78,256 47,117 31,139 73,200 43,528 29,672 5,056 3,589 1,467 4,464 3,184 1,280
1989 79,475 46,330 33,145 74,120 42,694 31,426 5,355 3,636 1,719 4,687 3,159 1,528
1990 81,860 47,531 34,329 76,483 43,876 32,607 5,377 3,655 1,722 4,669 3,168 1,501
1991 85,544 48,558 36,986 80,036 44,928 35,108 5,508 3,630 1,878 4,773 3,149 1,624
1992 86,974 48,596 38,378 81,442 44,993 36,449 5,532 3,603 1,929 4,821 3,136 1,685
1993 95,910 52,443 43,467 89,705 48,428 41,277 6,205 4,105 2,190 5,323 3,448 1,875
1994 96,141 51,628 44,513 89,939 47,734 42,205 6,202 3,894 2,308 5,325 3,332 1,993
1995 97,262 51,859 45,403 90,869 47,866 43,003 6,393 3,993 2,400 5,420 3,379 2,041
1996 100,360 52,410 47,950 93,779 48,396 45,383 6,581 4,014 2,567 5,599 3,388 2,211
1997 103,595 53,998 49,597 96,768 49,801 46,967 6,827 4,197 2,630 5,708 3,468 2,240
1998 107,146 55,018 52,128 100,114 50,806 49,308 7,032 4,212 2,820 5,915 3,503 2,412
1999 (4)119,524 60,795 58,729 111,407 55,954 55,453 8,117 4,841 3,276 6,770 4,019 2,751
2000 (4)117,522 58,372 59,150 109,696 53,759 55,937 7,826 4,613 3,213 6,449 3,757 2,692
SOURCE: NATIONAL CENTER FOR HEALTH STATISTICS, MONTHLY VITAL STATISTICS REPORT, 1979-1998, 1999-2000
NOTES:
(1) THIS TABLE REFERS EXCLUSIVELY TO DATA ON CHRONIC BRONCHITIS, EMPHYSEMA AND OTHER LOWER CHRONIC
OBSTRUCTIVE PULMONARY DISEASES INCLUDING BRONCHIECTASIS. DATA ON ASTHMA ARE NOT INCLUDED.
(2) ALL RACES OTHER THAN WHITE.(3) INTERNATIONAL CLASSIFICATION OF DISEASES, 9TH REVISION (ICD-9) CODE 490-492, 494-496.(4) INTERNATIONAL CLASSIFICATION OF DISEASES, 10TH REVISION (ICD-10) CODE J40-J44, J47.
ALL OTHER(2)
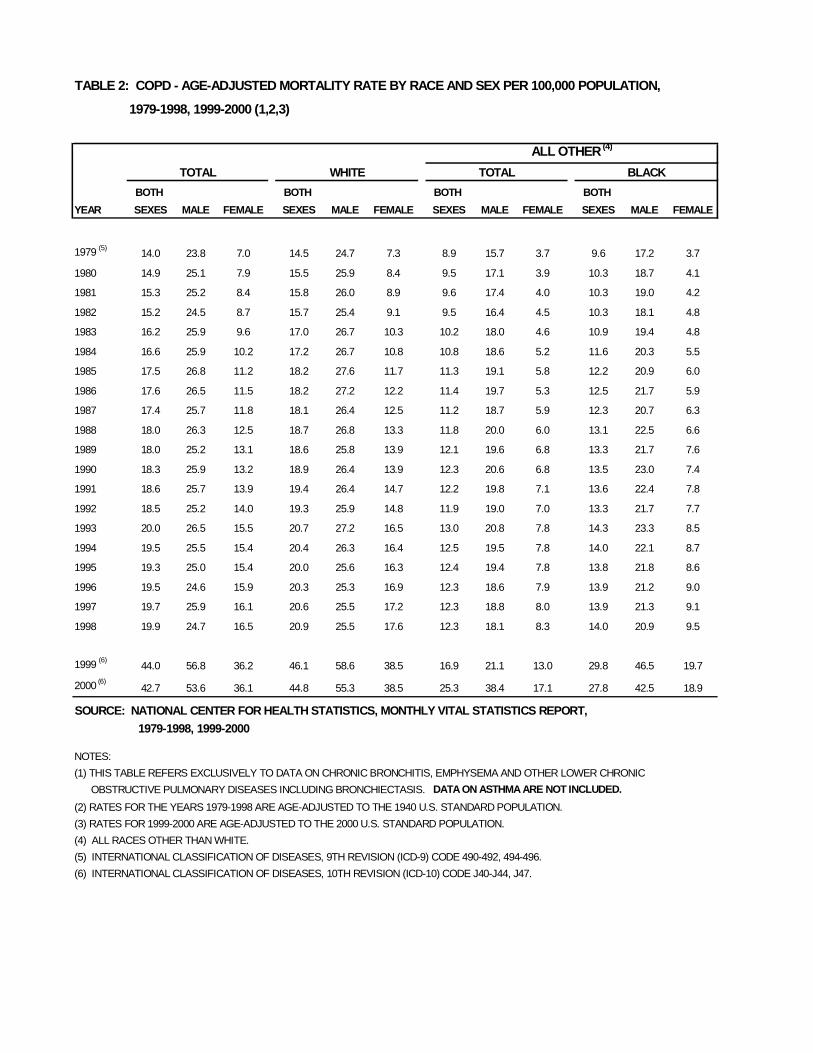
TABLE 2: COPD - AGE-ADJUSTED MORTALITY RATE BY RACE AND SEX PER 100,000 POPULATION,
1979-1998, 1999-2000 (1,2,3)
ALL OTHER(4)
TOTAL WHITE TOTAL BLACK
BOTH BOTH BOTH BOTH
YEAR SEXES MALE FEMALE SEXES MALE FEMALE SEXES MALE FEMALE SEXES MALE FEMALE
1979 (5)14.0 23.8 7.0 14.5 24.7 7.3 8.9 15.7 3.7 9.6 17.2 3.7
1980 14.9 25.1 7.9 15.5 25.9 8.4 9.5 17.1 3.9 10.3 18.7 4.1
1981 15.3 25.2 8.4 15.8 26.0 8.9 9.6 17.4 4.0 10.3 19.0 4.2
1982 15.2 24.5 8.7 15.7 25.4 9.1 9.5 16.4 4.5 10.3 18.1 4.8
1983 16.2 25.9 9.6 17.0 26.7 10.3 10.2 18.0 4.6 10.9 19.4 4.8
1984 16.6 25.9 10.2 17.2 26.7 10.8 10.8 18.6 5.2 11.6 20.3 5.5
1985 17.5 26.8 11.2 18.2 27.6 11.7 11.3 19.1 5.8 12.2 20.9 6.0
1986 17.6 26.5 11.5 18.2 27.2 12.2 11.4 19.7 5.3 12.5 21.7 5.9
1987 17.4 25.7 11.8 18.1 26.4 12.5 11.2 18.7 5.9 12.3 20.7 6.3
1988 18.0 26.3 12.5 18.7 26.8 13.3 11.8 20.0 6.0 13.1 22.5 6.6
1989 18.0 25.2 13.1 18.6 25.8 13.9 12.1 19.6 6.8 13.3 21.7 7.6
1990 18.3 25.9 13.2 18.9 26.4 13.9 12.3 20.6 6.8 13.5 23.0 7.4
1991 18.6 25.7 13.9 19.4 26.4 14.7 12.2 19.8 7.1 13.6 22.4 7.8
1992 18.5 25.2 14.0 19.3 25.9 14.8 11.9 19.0 7.0 13.3 21.7 7.7
1993 20.0 26.5 15.5 20.7 27.2 16.5 13.0 20.8 7.8 14.3 23.3 8.5
1994 19.5 25.5 15.4 20.4 26.3 16.4 12.5 19.5 7.8 14.0 22.1 8.7
1995 19.3 25.0 15.4 20.0 25.6 16.3 12.4 19.4 7.8 13.8 21.8 8.6
1996 19.5 24.6 15.9 20.3 25.3 16.9 12.3 18.6 7.9 13.9 21.2 9.0
1997 19.7 25.9 16.1 20.6 25.5 17.2 12.3 18.8 8.0 13.9 21.3 9.1
1998 19.9 24.7 16.5 20.9 25.5 17.6 12.3 18.1 8.3 14.0 20.9 9.5
1999 (6)44.0 56.8 36.2 46.1 58.6 38.5 16.9 21.1 13.0 29.8 46.5 19.7
2000 (6)42.7 53.6 36.1 44.8 55.3 38.5 25.3 38.4 17.1 27.8 42.5 18.9
SOURCE: NATIONAL CENTER FOR HEALTH STATISTICS, MONTHLY VITAL STATISTICS REPORT,
1979-1998, 1999-2000
NOTES:
(1) THIS TABLE REFERS EXCLUSIVELY TO DATA ON CHRONIC BRONCHITIS, EMPHYSEMA AND OTHER LOWER CHRONIC
OBSTRUCTIVE PULMONARY DISEASES INCLUDING BRONCHIECTASIS. DATA ON ASTHMA ARE NOT INCLUDED.
(2) RATES FOR THE YEARS 1979-1998 ARE AGE-ADJUSTED TO THE 1940 U.S. STANDARD POPULATION.
(3) RATES FOR 1999-2000 ARE AGE-ADJUSTED TO THE 2000 U.S. STANDARD POPULATION.
(4) ALL RACES OTHER THAN WHITE.
(5) INTERNATIONAL CLASSIFICATION OF DISEASES, 9TH REVISION (ICD-9) CODE 490-492, 494-496.
(6) INTERNATIONAL CLASSIFICATION OF DISEASES, 10TH REVISION (ICD-10) CODE J40-J44, J47.
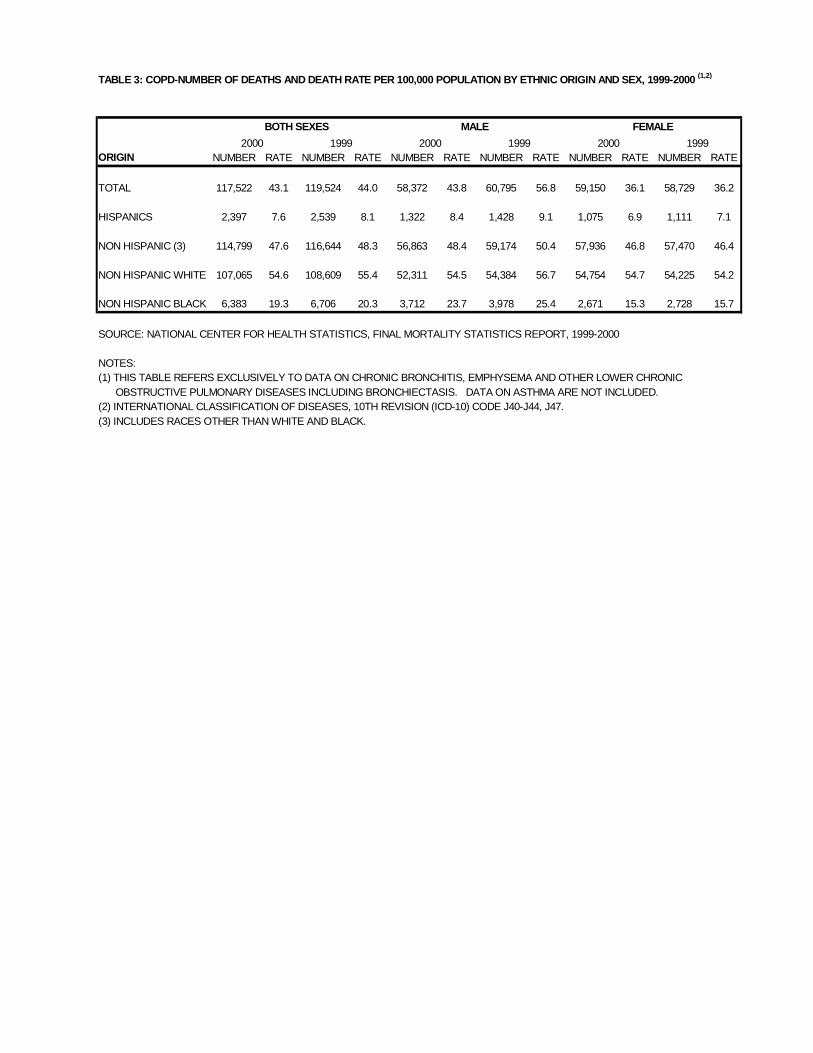
TABLE 3: COPD-NUMBER OF DEATHS AND DEATH RATE PER 100,000 POPULATION BY ETHNIC ORIGIN AND SEX, 1999-2000 (1,2)
ORIGIN NUMBER RATE NUMBER RATE NUMBER RATE NUMBER RATE NUMBER RATE NUMBER RATE
TOTAL 117,522 43.1 119,524 44.0 58,372 43.8 60,795 56.8 59,150 36.1 58,729 36.2
HISPANICS 2,397 7.6 2,539 8.1 1,322 8.4 1,428 9.1 1,075 6.9 1,111 7.1
NON HISPANIC (3) 114,799 47.6 116,644 48.3 56,863 48.4 59,174 50.4 57,936 46.8 57,470 46.4
NON HISPANIC WHITE 107,065 54.6 108,609 55.4 52,311 54.5 54,384 56.7 54,754 54.7 54,225 54.2
NON HISPANIC BLACK 6,383 19.3 6,706 20.3 3,712 23.7 3,978 25.4 2,671 15.3 2,728 15.7
SOURCE: NATIONAL CENTER FOR HEALTH STATISTICS, FINAL MORTALITY STATISTICS REPORT, 1999-2000
NOTES:(1) THIS TABLE REFERS EXCLUSIVELY TO DATA ON CHRONIC BRONCHITIS, EMPHYSEMA AND OTHER LOWER CHRONIC
OBSTRUCTIVE PULMONARY DISEASES INCLUDING BRONCHIECTASIS. DATA ON ASTHMA ARE NOT INCLUDED.(2) INTERNATIONAL CLASSIFICATION OF DISEASES, 10TH REVISION (ICD-10) CODE J40-J44, J47.(3) INCLUDES RACES OTHER THAN WHITE AND BLACK.
BOTH SEXES
2000 1999
FEMALEMALE
2000 1999 2000 1999
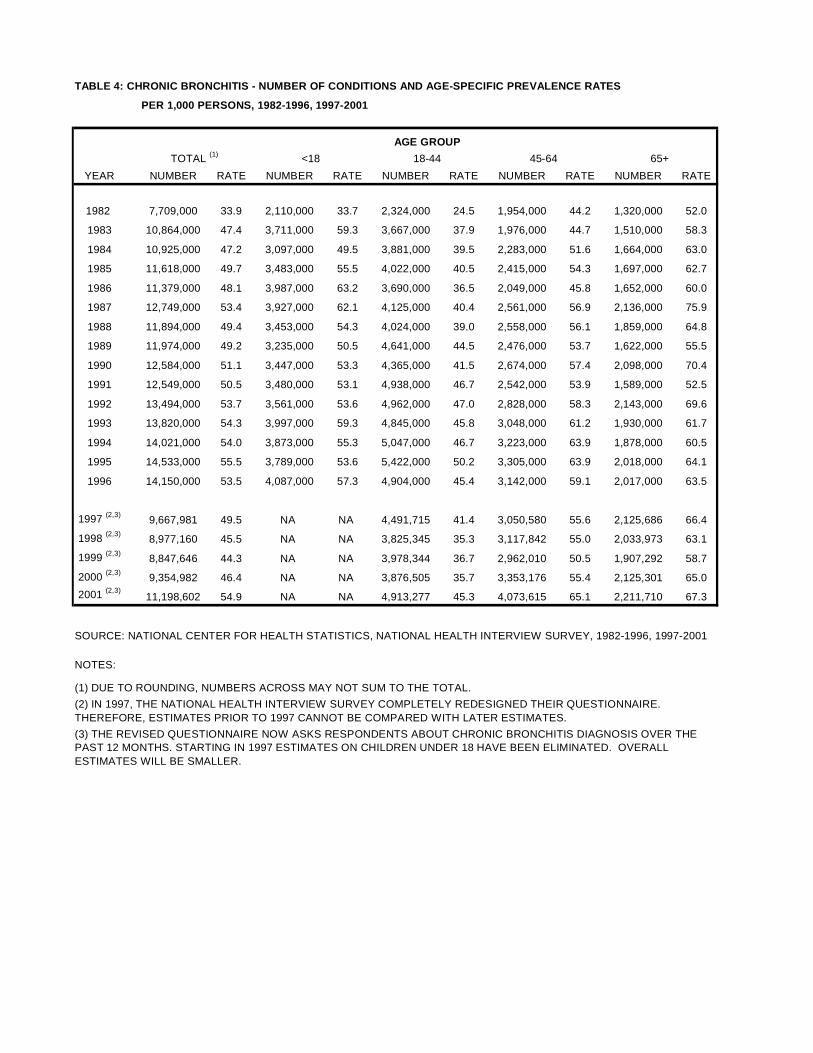
TABLE 4: CHRONIC BRONCHITIS - NUMBER OF CONDITIONS AND AGE-SPECIFIC PREVALENCE RATES
PER 1,000 PERSONS, 1982-1996, 1997-2001
YEAR NUMBER RATE NUMBER RATE NUMBER RATE NUMBER RATE NUMBER RATE
1982 7,709,000 33.9 2,110,000 33.7 2,324,000 24.5 1,954,000 44.2 1,320,000 52.0
1983 10,864,000 47.4 3,711,000 59.3 3,667,000 37.9 1,976,000 44.7 1,510,000 58.3
1984 10,925,000 47.2 3,097,000 49.5 3,881,000 39.5 2,283,000 51.6 1,664,000 63.0
1985 11,618,000 49.7 3,483,000 55.5 4,022,000 40.5 2,415,000 54.3 1,697,000 62.7
1986 11,379,000 48.1 3,987,000 63.2 3,690,000 36.5 2,049,000 45.8 1,652,000 60.0
1987 12,749,000 53.4 3,927,000 62.1 4,125,000 40.4 2,561,000 56.9 2,136,000 75.9
1988 11,894,000 49.4 3,453,000 54.3 4,024,000 39.0 2,558,000 56.1 1,859,000 64.8
1989 11,974,000 49.2 3,235,000 50.5 4,641,000 44.5 2,476,000 53.7 1,622,000 55.5
1990 12,584,000 51.1 3,447,000 53.3 4,365,000 41.5 2,674,000 57.4 2,098,000 70.4
1991 12,549,000 50.5 3,480,000 53.1 4,938,000 46.7 2,542,000 53.9 1,589,000 52.5
1992 13,494,000 53.7 3,561,000 53.6 4,962,000 47.0 2,828,000 58.3 2,143,000 69.6
1993 13,820,000 54.3 3,997,000 59.3 4,845,000 45.8 3,048,000 61.2 1,930,000 61.7
1994 14,021,000 54.0 3,873,000 55.3 5,047,000 46.7 3,223,000 63.9 1,878,000 60.5
1995 14,533,000 55.5 3,789,000 53.6 5,422,000 50.2 3,305,000 63.9 2,018,000 64.1
1996 14,150,000 53.5 4,087,000 57.3 4,904,000 45.4 3,142,000 59.1 2,017,000 63.5
1997 (2,3)9,667,981 49.5 NA NA 4,491,715 41.4 3,050,580 55.6 2,125,686 66.4
1998 (2,3)8,977,160 45.5 NA NA 3,825,345 35.3 3,117,842 55.0 2,033,973 63.1
1999 (2,3)8,847,646 44.3 NA NA 3,978,344 36.7 2,962,010 50.5 1,907,292 58.7
2000 (2,3)9,354,982 46.4 NA NA 3,876,505 35.7 3,353,176 55.4 2,125,301 65.0
2001 (2,3)11,198,602 54.9 NA NA 4,913,277 45.3 4,073,615 65.1 2,211,710 67.3
SOURCE: NATIONAL CENTER FOR HEALTH STATISTICS, NATIONAL HEALTH INTERVIEW SURVEY, 1982-1996, 1997-2001
NOTES:
(1) DUE TO ROUNDING, NUMBERS ACROSS MAY NOT SUM TO THE TOTAL.
(2) IN 1997, THE NATIONAL HEALTH INTERVIEW SURVEY COMPLETELY REDESIGNED THEIR QUESTIONNAIRE.THEREFORE, ESTIMATES PRIOR TO 1997 CANNOT BE COMPARED WITH LATER ESTIMATES.
TOTAL (1) <18 18-44 45-64 65+
(3) THE REVISED QUESTIONNAIRE NOW ASKS RESPONDENTS ABOUT CHRONIC BRONCHITIS DIAGNOSIS OVER THEPAST 12 MONTHS. STARTING IN 1997 ESTIMATES ON CHILDREN UNDER 18 HAVE BEEN ELIMINATED. OVERALLESTIMATES WILL BE SMALLER.
AGE GROUP
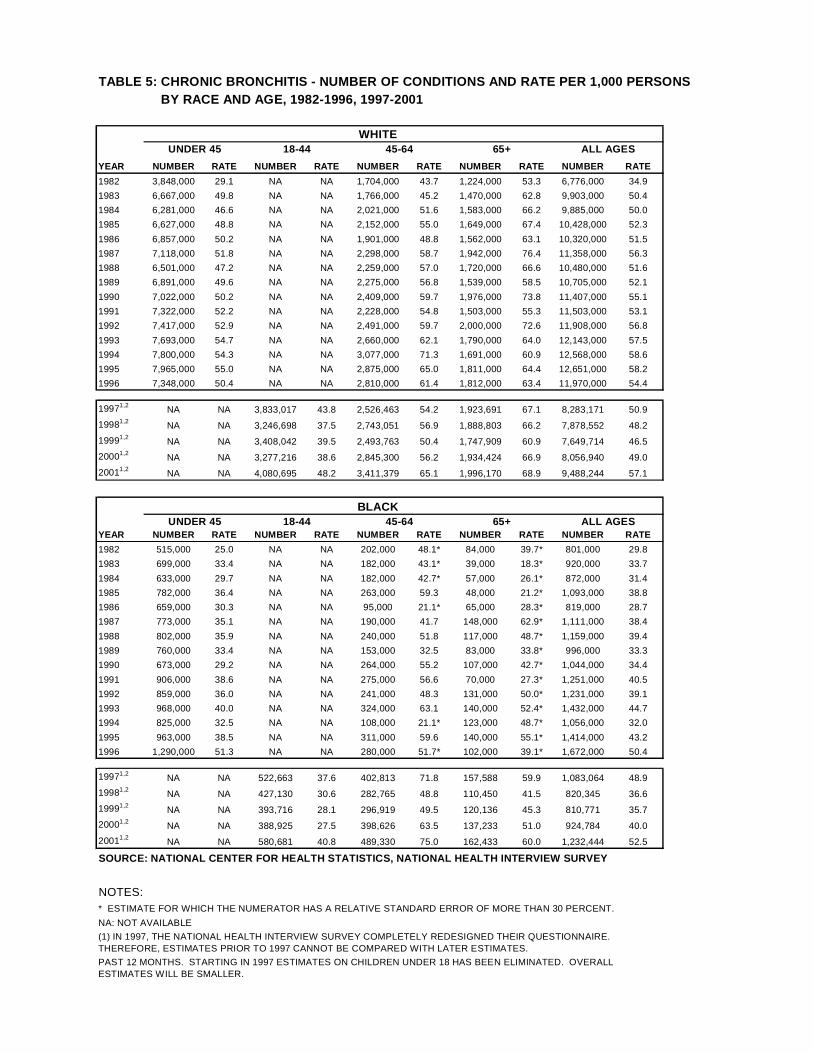
TABLE 5: CHRONIC BRONCHITIS - NUMBER OF CONDITIONS AND RATE PER 1,000 PERSONSBY RACE AND AGE, 1982-1996, 1997-2001
WHITE
YEAR NUMBER RATE NUMBER RATE NUMBER RATE NUMBER RATE NUMBER RATE
1982 3,848,000 29.1 NA NA 1,704,000 43.7 1,224,000 53.3 6,776,000 34.9
1983 6,667,000 49.8 NA NA 1,766,000 45.2 1,470,000 62.8 9,903,000 50.4
1984 6,281,000 46.6 NA NA 2,021,000 51.6 1,583,000 66.2 9,885,000 50.0
1985 6,627,000 48.8 NA NA 2,152,000 55.0 1,649,000 67.4 10,428,000 52.3
1986 6,857,000 50.2 NA NA 1,901,000 48.8 1,562,000 63.1 10,320,000 51.5
1987 7,118,000 51.8 NA NA 2,298,000 58.7 1,942,000 76.4 11,358,000 56.3
1988 6,501,000 47.2 NA NA 2,259,000 57.0 1,720,000 66.6 10,480,000 51.6
1989 6,891,000 49.6 NA NA 2,275,000 56.8 1,539,000 58.5 10,705,000 52.1
1990 7,022,000 50.2 NA NA 2,409,000 59.7 1,976,000 73.8 11,407,000 55.1
1991 7,322,000 52.2 NA NA 2,228,000 54.8 1,503,000 55.3 11,503,000 53.1
1992 7,417,000 52.9 NA NA 2,491,000 59.7 2,000,000 72.6 11,908,000 56.8
1993 7,693,000 54.7 NA NA 2,660,000 62.1 1,790,000 64.0 12,143,000 57.5
1994 7,800,000 54.3 NA NA 3,077,000 71.3 1,691,000 60.9 12,568,000 58.6
1995 7,965,000 55.0 NA NA 2,875,000 65.0 1,811,000 64.4 12,651,000 58.2
1996 7,348,000 50.4 NA NA 2,810,000 61.4 1,812,000 63.4 11,970,000 54.4
19971,2NA NA 3,833,017 43.8 2,526,463 54.2 1,923,691 67.1 8,283,171 50.9
19981,2NA NA 3,246,698 37.5 2,743,051 56.9 1,888,803 66.2 7,878,552 48.2
19991,2NA NA 3,408,042 39.5 2,493,763 50.4 1,747,909 60.9 7,649,714 46.5
20001,2NA NA 3,277,216 38.6 2,845,300 56.2 1,934,424 66.9 8,056,940 49.0
20011,2NA NA 4,080,695 48.2 3,411,379 65.1 1,996,170 68.9 9,488,244 57.1
BLACK
YEAR NUMBER RATE NUMBER RATE NUMBER RATE NUMBER RATE NUMBER RATE
1982 515,000 25.0 NA NA 202,000 48.1* 84,000 39.7* 801,000 29.8
1983 699,000 33.4 NA NA 182,000 43.1* 39,000 18.3* 920,000 33.7
1984 633,000 29.7 NA NA 182,000 42.7* 57,000 26.1* 872,000 31.4
1985 782,000 36.4 NA NA 263,000 59.3 48,000 21.2* 1,093,000 38.8
1986 659,000 30.3 NA NA 95,000 21.1* 65,000 28.3* 819,000 28.7
1987 773,000 35.1 NA NA 190,000 41.7 148,000 62.9* 1,111,000 38.4
1988 802,000 35.9 NA NA 240,000 51.8 117,000 48.7* 1,159,000 39.4
1989 760,000 33.4 NA NA 153,000 32.5 83,000 33.8* 996,000 33.3
1990 673,000 29.2 NA NA 264,000 55.2 107,000 42.7* 1,044,000 34.4
1991 906,000 38.6 NA NA 275,000 56.6 70,000 27.3* 1,251,000 40.5
1992 859,000 36.0 NA NA 241,000 48.3 131,000 50.0* 1,231,000 39.1
1993 968,000 40.0 NA NA 324,000 63.1 140,000 52.4* 1,432,000 44.7
1994 825,000 32.5 NA NA 108,000 21.1* 123,000 48.7* 1,056,000 32.0
1995 963,000 38.5 NA NA 311,000 59.6 140,000 55.1* 1,414,000 43.2
1996 1,290,000 51.3 NA NA 280,000 51.7* 102,000 39.1* 1,672,000 50.4
19971,2NA NA 522,663 37.6 402,813 71.8 157,588 59.9 1,083,064 48.9
19981,2NA NA 427,130 30.6 282,765 48.8 110,450 41.5 820,345 36.6
19991,2NA NA 393,716 28.1 296,919 49.5 120,136 45.3 810,771 35.7
20001,2NA NA 388,925 27.5 398,626 63.5 137,233 51.0 924,784 40.0
20011,2NA NA 580,681 40.8 489,330 75.0 162,433 60.0 1,232,444 52.5
SOURCE: NATIONAL CENTER FOR HEALTH STATISTICS, NATIONAL HEALTH INTERVIEW SURVEY
NOTES:* ESTIMATE FOR WHICH THE NUMERATOR HAS A RELATIVE STANDARD ERROR OF MORE THAN 30 PERCENT.
NA: NOT AVAILABLE
ALL AGES65+45-64UNDER 45 18-44
(1) IN 1997, THE NATIONAL HEALTH INTERVIEW SURVEY COMPLETELY REDESIGNED THEIR QUESTIONNAIRE.THEREFORE, ESTIMATES PRIOR TO 1997 CANNOT BE COMPARED WITH LATER ESTIMATES.( )PAST 12 MONTHS. STARTING IN 1997 ESTIMATES ON CHILDREN UNDER 18 HAS BEEN ELIMINATED. OVERALLESTIMATES WILL BE SMALLER.
18-44UNDER 45 45-64 65+ ALL AGES
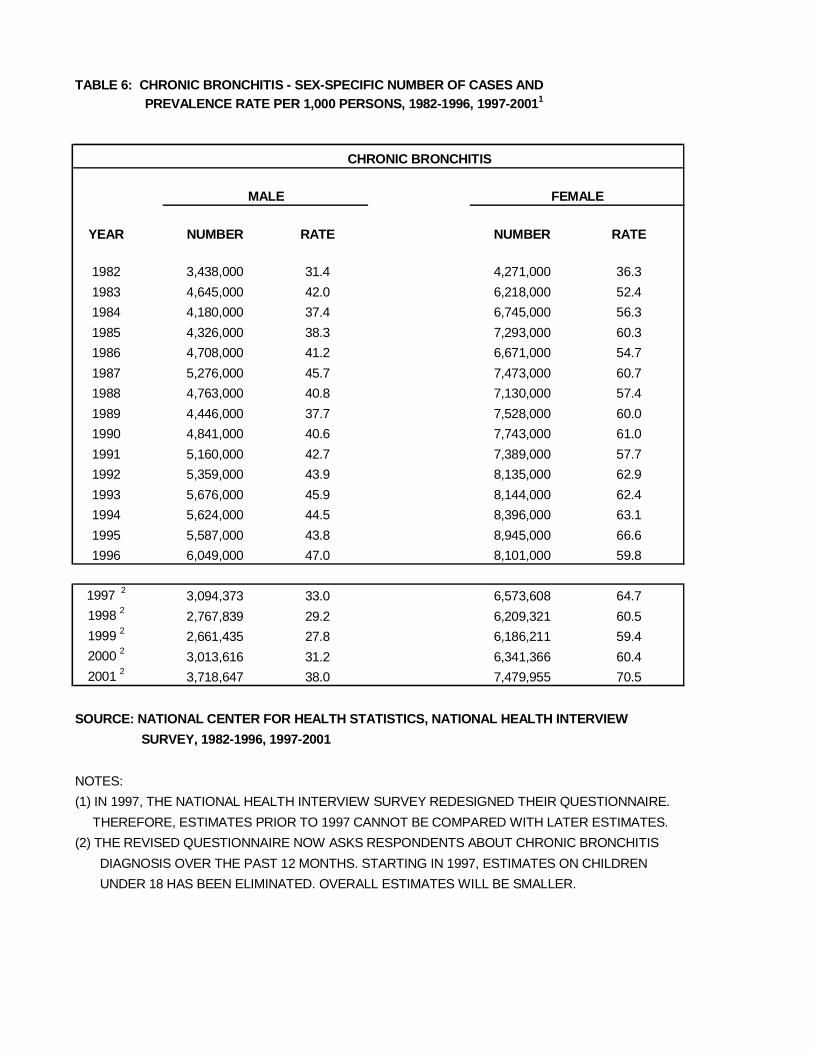
TABLE 6: CHRONIC BRONCHITIS - SEX-SPECIFIC NUMBER OF CASES ANDPREVALENCE RATE PER 1,000 PERSONS, 1982-1996, 1997-20011
CHRONIC BRONCHITIS
YEAR NUMBER RATE NUMBER RATE
1982 3,438,000 31.4 4,271,000 36.3
1983 4,645,000 42.0 6,218,000 52.4
1984 4,180,000 37.4 6,745,000 56.3
1985 4,326,000 38.3 7,293,000 60.3
1986 4,708,000 41.2 6,671,000 54.7
1987 5,276,000 45.7 7,473,000 60.7
1988 4,763,000 40.8 7,130,000 57.4
1989 4,446,000 37.7 7,528,000 60.0
1990 4,841,000 40.6 7,743,000 61.0
1991 5,160,000 42.7 7,389,000 57.7
1992 5,359,000 43.9 8,135,000 62.9
1993 5,676,000 45.9 8,144,000 62.4
1994 5,624,000 44.5 8,396,000 63.1
1995 5,587,000 43.8 8,945,000 66.6
1996 6,049,000 47.0 8,101,000 59.8
1997 2 3,094,373 33.0 6,573,608 64.7
1998 22,767,839 29.2 6,209,321 60.5
1999 2 2,661,435 27.8 6,186,211 59.4
2000 23,013,616 31.2 6,341,366 60.4
2001 2 3,718,647 38.0 7,479,955 70.5
SOURCE: NATIONAL CENTER FOR HEALTH STATISTICS, NATIONAL HEALTH INTERVIEW
SURVEY, 1982-1996, 1997-2001
NOTES:
(1) IN 1997, THE NATIONAL HEALTH INTERVIEW SURVEY REDESIGNED THEIR QUESTIONNAIRE.
THEREFORE, ESTIMATES PRIOR TO 1997 CANNOT BE COMPARED WITH LATER ESTIMATES.
(2) THE REVISED QUESTIONNAIRE NOW ASKS RESPONDENTS ABOUT CHRONIC BRONCHITIS
DIAGNOSIS OVER THE PAST 12 MONTHS. STARTING IN 1997, ESTIMATES ON CHILDREN
UNDER 18 HAS BEEN ELIMINATED. OVERALL ESTIMATES WILL BE SMALLER.
MALE FEMALE
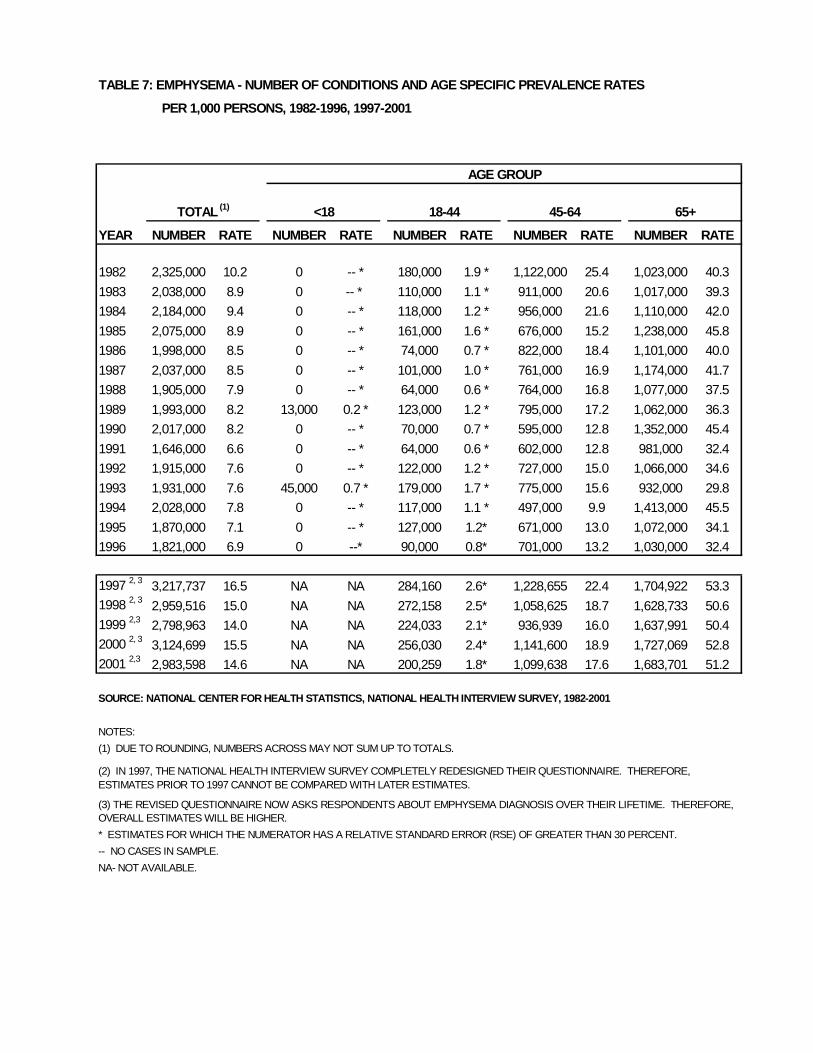
TABLE 7: EMPHYSEMA - NUMBER OF CONDITIONS AND AGE SPECIFIC PREVALENCE RATES
PER 1,000 PERSONS, 1982-1996, 1997-2001
AGE GROUP
YEAR NUMBER RATE NUMBER RATE NUMBER RATE NUMBER RATE NUMBER RATE
1982 2,325,000 10.2 0 -- * 180,000 1.9 * 1,122,000 25.4 1,023,000 40.3
1983 2,038,000 8.9 0 -- * 110,000 1.1 * 911,000 20.6 1,017,000 39.3
1984 2,184,000 9.4 0 -- * 118,000 1.2 * 956,000 21.6 1,110,000 42.0
1985 2,075,000 8.9 0 -- * 161,000 1.6 * 676,000 15.2 1,238,000 45.8
1986 1,998,000 8.5 0 -- * 74,000 0.7 * 822,000 18.4 1,101,000 40.0
1987 2,037,000 8.5 0 -- * 101,000 1.0 * 761,000 16.9 1,174,000 41.7
1988 1,905,000 7.9 0 -- * 64,000 0.6 * 764,000 16.8 1,077,000 37.5
1989 1,993,000 8.2 13,000 0.2 * 123,000 1.2 * 795,000 17.2 1,062,000 36.3
1990 2,017,000 8.2 0 -- * 70,000 0.7 * 595,000 12.8 1,352,000 45.4
1991 1,646,000 6.6 0 -- * 64,000 0.6 * 602,000 12.8 981,000 32.4
1992 1,915,000 7.6 0 -- * 122,000 1.2 * 727,000 15.0 1,066,000 34.6
1993 1,931,000 7.6 45,000 0.7 * 179,000 1.7 * 775,000 15.6 932,000 29.8
1994 2,028,000 7.8 0 -- * 117,000 1.1 * 497,000 9.9 1,413,000 45.5
1995 1,870,000 7.1 0 -- * 127,000 1.2* 671,000 13.0 1,072,000 34.1
1996 1,821,000 6.9 0 --* 90,000 0.8* 701,000 13.2 1,030,000 32.4
1997 2, 3 3,217,737 16.5 NA NA 284,160 2.6* 1,228,655 22.4 1,704,922 53.31998 2, 3
2,959,516 15.0 NA NA 272,158 2.5* 1,058,625 18.7 1,628,733 50.61999 2,3 2,798,963 14.0 NA NA 224,033 2.1* 936,939 16.0 1,637,991 50.42000 2, 3
3,124,699 15.5 NA NA 256,030 2.4* 1,141,600 18.9 1,727,069 52.82001 2,3 2,983,598 14.6 NA NA 200,259 1.8* 1,099,638 17.6 1,683,701 51.2
SOURCE: NATIONAL CENTER FOR HEALTH STATISTICS, NATIONAL HEALTH INTERVIEW SURVEY, 1982-2001
NOTES:
(1) DUE TO ROUNDING, NUMBERS ACROSS MAY NOT SUM UP TO TOTALS.
* ESTIMATES FOR WHICH THE NUMERATOR HAS A RELATIVE STANDARD ERROR (RSE) OF GREATER THAN 30 PERCENT.
-- NO CASES IN SAMPLE.
NA- NOT AVAILABLE.
(2) IN 1997, THE NATIONAL HEALTH INTERVIEW SURVEY COMPLETELY REDESIGNED THEIR QUESTIONNAIRE. THEREFORE,ESTIMATES PRIOR TO 1997 CANNOT BE COMPARED WITH LATER ESTIMATES.
(3) THE REVISED QUESTIONNAIRE NOW ASKS RESPONDENTS ABOUT EMPHYSEMA DIAGNOSIS OVER THEIR LIFETIME. THEREFORE,OVERALL ESTIMATES WILL BE HIGHER.
65+<18TOTAL(1) 18-44 45-64
1982-1996, 1997-2001 1,2
WHITE
YEAR NUMBER RATE NUMBER RATE NUMBER RATE NUMBER RATE NUMBER RATE1982 167,000 1.3* NA NA 1,059,000 27.2 983,000 42.8 2,209,000 11.4
1983 78,000 0.6* NA NA 851,000 21.8 979,000 41.8 1,908,000 9.7
1984 105,000 0.8* NA NA 907,000 23.2 1,035,000 43.3 2,047,000 10.3
1985 134,000 1.0* NA NA 626,000 16.0 1,182,000 48.3 1,942,000 9.7
1986 74,000 0.5* NA NA 774,000 19.9 999,000 40.4 1,847,000 9.2
1987 95,000 0.7* NA NA 732,000 18.7 1,118,000 44.0 1,945,000 9.6
1988 53,000 0.4* NA NA 705,000 17.8 1,013,000 39.2 1,771,000 8.7
1989 132,000 0.9* NA NA 743,000 18.6 1,021,000 38.8 1,896,000 9.2
1990 70,000 0.5* NA NA 557,000 13.8 1,236,000 46.1 1,863,000 9.0
1991 64,000 0.5* NA NA 544,000 13.4 947,000 34.8 1,555,000 7.5
1992 108,000 0.8* NA NA 675,000 16.2 1,035,000 37.6 1,818,000 8.7
1993 212,000 1.5 NA NA 684,000 16.0 834,000 29.8 1,730,000 8.2
1994 104,000 0.7* NA NA 464,000 10.7 1,350,000 48.7 1,918,000 8.9
1995 110,000 0.8* NA NA 643,000 14.5 995,000 35.4 1,748,000 8.0
1996 58,000 0.4* NA NA 623,000 13.6 1,004,000 35.2 1,685,000 7.7
1997 1,2NA NA 237,027 2.7 1,090,690 23.4 1,590,391 55.5 2,918,108 17.9
1998 1,2NA NA 237,971 2.7 967,893 20.1 1,503,697 52.7 2,709,559 16.6
1999 1,2NA NA 197,279 2.3 878,758 17.8 1,543,085 53.8 2,619,122 15.9
2000 1,2NA NA 223,389 2.6 1,037,890 20.5 1,601,802 55.4 2,863,081 17.4
2001 1,2NA NA 163,230 1.9 1,009,097 19.3 1,559,945 53.9 2,732,272 16.5
BLACK
YEAR NUMBER RATE NUMBER RATE NUMBER RATE NUMBER RATE NUMBER RATE1982 -- --* NA NA 52,000 12.4* 40,000 18.9* 92,000 3.4
1983 32,000 1.5* NA NA 60,000 14.2* 38,000 17.8* 130,000 4.8
1984 -- --* NA NA 49,000 11.5* 75,000 34.4* 124,000 4.5
1985 9000 0.4* NA NA 50,000 11.3* 56,000 24.8* 115,000 4.1
1986 -- --* NA NA 48,000 10.7* 80,000 34.8* 128,000 4.5
1987 7000 0.3* NA NA 29,000 6.4* 22,000 9.4* 58,000 2.0
1988 11000 0.5* NA NA 60,000 12.9* 54,000 22.5* 125,000 4.3
1989 4000 0.2* NA NA 52,000 11.0* 41,000 16.7* 97,000 3.3
1990 -- --* NA NA 17,000 3.6* 104,000 41.5* 121,000 4.0
1991 -- --* NA NA 57,000 11.7* 24,000 9.4* 81,000 2.6
1992 14,000 0.6* NA NA 33,000 6.6* 31,000 11.8* 78,000 2.5
1993 12,000 0.5* NA NA 70,000 13.6* 98,000 36.7* 180,000 5.6
1994 -- --* NA NA 22,000 4.3* 38,000 15.1* 60,000 1.8
1995 17,000 0.7* NA NA 14,000 2.7* 55,000 21.7* 86,000 2.6
1996 -- --* NA NA 79,000 14.6* 26,000 10.0* 105,000 3.2
1997 1,2NA NA 44,651 3.2* 86,144 15.4* 89,958 34.2* 220,753 10.0
1998 1,2NA NA 31,103 2.2* 68,064 11.8* 95,265 35.8* 194,432 8.7
1999 1,2NA NA 24,796 1.8* 35,889 6.0 56,693 21.4* 117,378 5.2
2000 1,2NA NA 30,795 2.2* 68,135 10.8* 113,337 42.1* 212,267 9.2
2001 1,2NA NA 9,682 0.7* 74,530 11.4* 80,416 29.7* 164,628 7.0
SOURCE: NATIONAL CENTER FOR HEALTH STATISTICS, NATIONAL HEALTH INTERVIEW SURVEY, 1982-1996, 1997-2001
NOTES:* ESTIMATE FOR WHICH THE NUMERATOR HAS A RELATIVE STANDARD ERROR OF MORE THAN 30 PERCENT.--*NO CASES IN SAMPLE.
TABLE 8: EMPHYSEMA - NUMBER OF CONDITIONS AND RATE PER 1,000 PERSONS BY RACE AND AGE,
UNDER 45 45-64 65+ ALL AGES18-44
UNDER 45 45-64
(1) IN 1997, THE NATIONAL HEALTH INTERVIEW SURVEY COMPLETELY REDESIGNED THEIR QUESTIONNAIRE. THEREFORE, ESTIMATESPRIOR TO 1997 CANNOT BE COMPARED WITH LATER ESTIMATES.(2) THE REVISED QUESTIONNAIRE NOW ASKS RESPONDENTS ABOUT EMPHYSEMA DIAGNOSIS OVER THEIR LIFETIME. THEREFORE,ESTIMATES WILL BE HIGHER.
65+ ALL AGES18-44
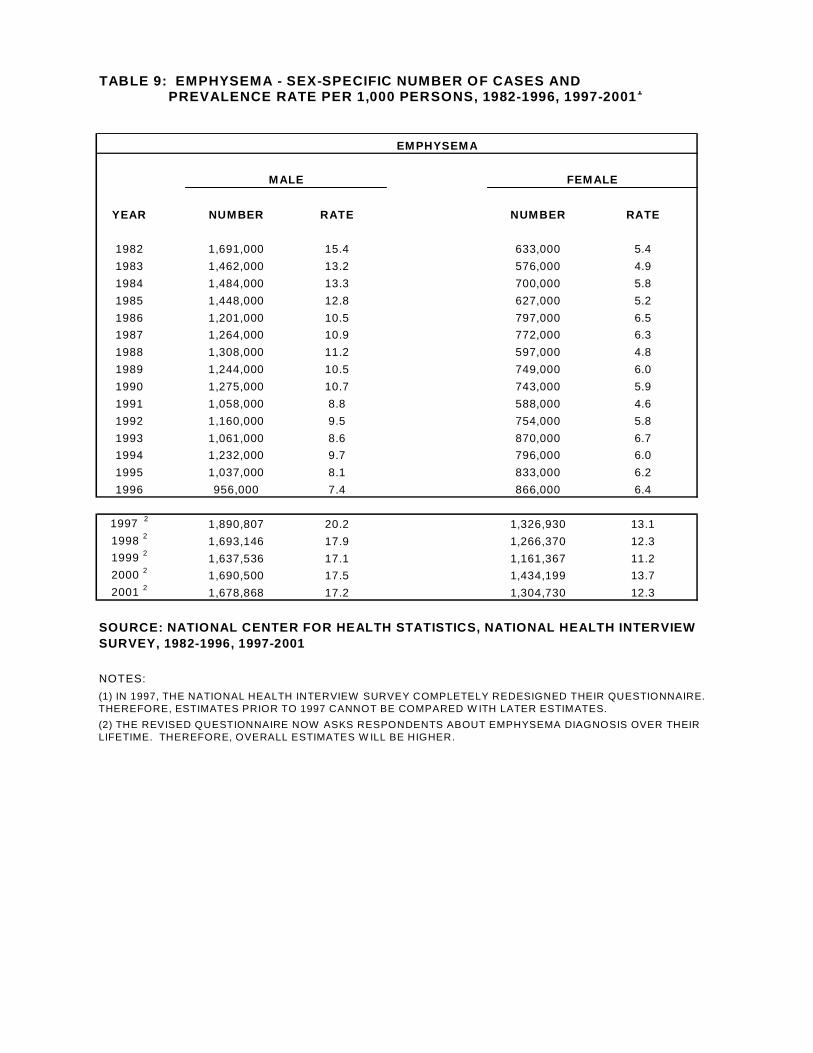
TABLE 9: EMPHYSEMA - SEX-SPECIFIC NUMBER OF CASES ANDPREVALENCE RATE PER 1,000 PERSONS, 1982-1996, 1997-20011
EMPHYSEMA
YEAR NUMBER RATE NUMBER RATE
1982 1,691,000 15.4 633,000 5.4
1983 1,462,000 13.2 576,000 4.9
1984 1,484,000 13.3 700,000 5.8
1985 1,448,000 12.8 627,000 5.2
1986 1,201,000 10.5 797,000 6.5
1987 1,264,000 10.9 772,000 6.3
1988 1,308,000 11.2 597,000 4.8
1989 1,244,000 10.5 749,000 6.0
1990 1,275,000 10.7 743,000 5.9
1991 1,058,000 8.8 588,000 4.6
1992 1,160,000 9.5 754,000 5.8
1993 1,061,000 8.6 870,000 6.7
1994 1,232,000 9.7 796,000 6.0
1995 1,037,000 8.1 833,000 6.2
1996 956,000 7.4 866,000 6.4
1997 21,890,807 20.2 1,326,930 13.1
1998 21,693,146 17.9 1,266,370 12.3
1999 21,637,536 17.1 1,161,367 11.2
2000 2 1,690,500 17.5 1,434,199 13.7
2001 2 1,678,868 17.2 1,304,730 12.3
NOTES:
(2) THE REVISED QUESTIONNAIRE NOW ASKS RESPONDENTS ABOUT EMPHYSEMA DIAGNOSIS OVER THEIRLIFETIME. THEREFORE, OVERALL ESTIMATES W ILL BE HIGHER.
MALE FEMALE
SOURCE: NATIONAL CENTER FOR HEALTH STATISTICS, NATIONAL HEALTH INTERVIEWSURVEY, 1982-1996, 1997-2001
(1) IN 1997, THE NATIONAL HEALTH INTERVIEW SURVEY COMPLETELY REDESIGNED THEIR QUESTIONNAIRE.THEREFORE, ESTIMATES PRIOR TO 1997 CANNOT BE COMPARED W ITH LATER ESTIMATES.
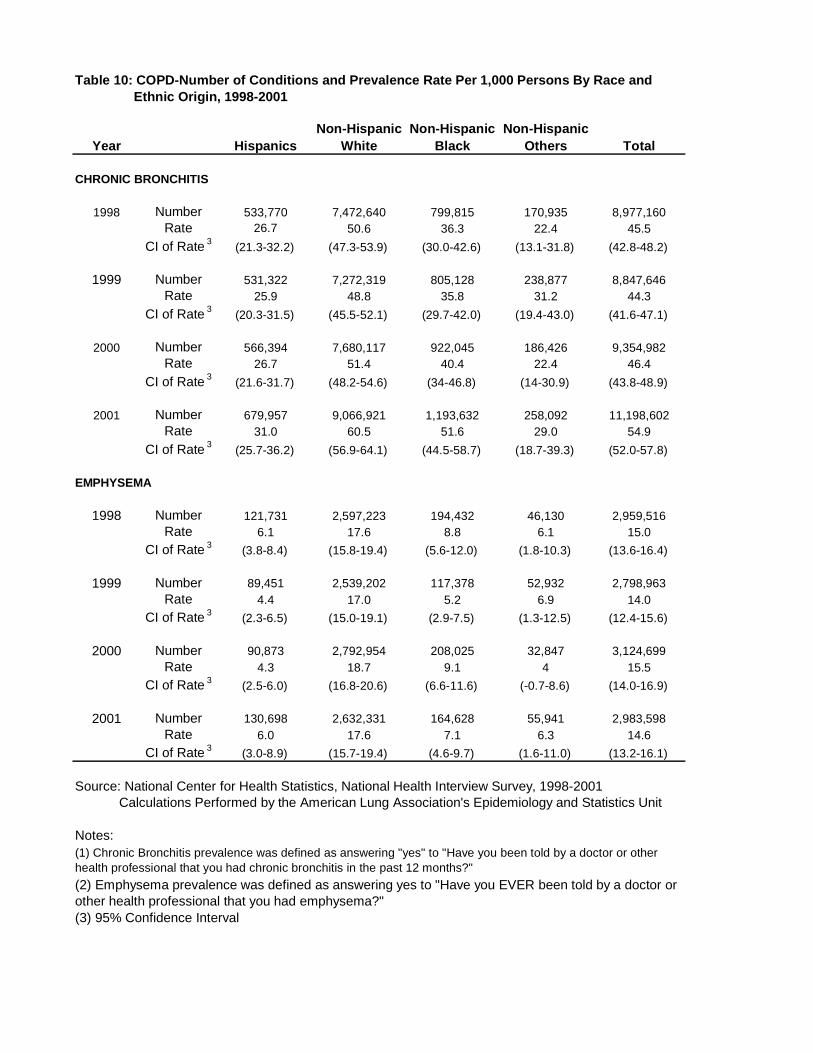
Table 10: COPD-Number of Conditions and Prevalence Rate Per 1,000 Persons By Race andEthnic Origin, 1998-2001
Year Hispanics Total
CHRONIC BRONCHITIS
1998 Number 533,770 7,472,640 799,815 170,935 8,977,160Rate 26.7 50.6 36.3 22.4 45.5
CI of Rate 3(21.3-32.2) (47.3-53.9) (30.0-42.6) (13.1-31.8) (42.8-48.2)
1999 Number 531,322 7,272,319 805,128 238,877 8,847,646Rate 25.9 48.8 35.8 31.2 44.3
CI of Rate 3(20.3-31.5) (45.5-52.1) (29.7-42.0) (19.4-43.0) (41.6-47.1)
2000 Number 566,394 7,680,117 922,045 186,426 9,354,982Rate 26.7 51.4 40.4 22.4 46.4
CI of Rate 3(21.6-31.7) (48.2-54.6) (34-46.8) (14-30.9) (43.8-48.9)
2001 Number 679,957 9,066,921 1,193,632 258,092 11,198,602Rate 31.0 60.5 51.6 29.0 54.9
CI of Rate 3(25.7-36.2) (56.9-64.1) (44.5-58.7) (18.7-39.3) (52.0-57.8)
EMPHYSEMA
1998 Number 121,731 2,597,223 194,432 46,130 2,959,516Rate 6.1 17.6 8.8 6.1 15.0
CI of Rate 3 (3.8-8.4) (15.8-19.4) (5.6-12.0) (1.8-10.3) (13.6-16.4)
1999 Number 89,451 2,539,202 117,378 52,932 2,798,963Rate 4.4 17.0 5.2 6.9 14.0
CI of Rate 3 (2.3-6.5) (15.0-19.1) (2.9-7.5) (1.3-12.5) (12.4-15.6)
2000 Number 90,873 2,792,954 208,025 32,847 3,124,699Rate 4.3 18.7 9.1 4 15.5
CI of Rate 3 (2.5-6.0) (16.8-20.6) (6.6-11.6) (-0.7-8.6) (14.0-16.9)
2001 Number 130,698 2,632,331 164,628 55,941 2,983,598Rate 6.0 17.6 7.1 6.3 14.6
CI of Rate 3 (3.0-8.9) (15.7-19.4) (4.6-9.7) (1.6-11.0) (13.2-16.1)
Source: National Center for Health Statistics, National Health Interview Survey, 1998-2001Calculations Performed by the American Lung Association's Epidemiology and Statistics Unit
Notes:
(3) 95% Confidence Interval
(1) Chronic Bronchitis prevalence was defined as answering "yes" to "Have you been told by a doctor or otherhealth professional that you had chronic bronchitis in the past 12 months?"
(2) Emphysema prevalence was defined as answering yes to "Have you EVER been told by a doctor orother health professional that you had emphysema?"
Non-HispanicWhite
Non-HispanicBlack
Non-HispanicOthers
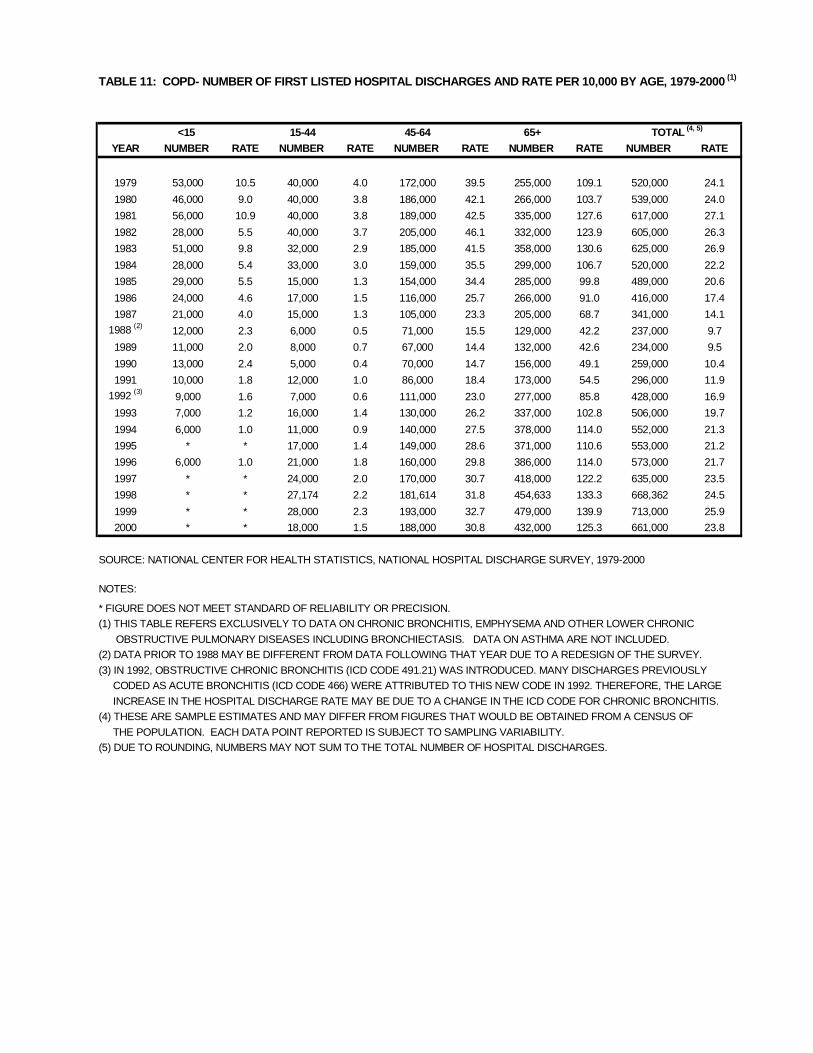
TABLE 11: COPD- NUMBER OF FIRST LISTED HOSPITAL DISCHARGES AND RATE PER 10,000 BY AGE, 1979-2000 (1)
<15 15-44 45-64 65+
YEAR NUMBER RATE NUMBER RATE NUMBER RATE NUMBER RATE NUMBER RATE
1979 53,000 10.5 40,000 4.0 172,000 39.5 255,000 109.1 520,000 24.1
1980 46,000 9.0 40,000 3.8 186,000 42.1 266,000 103.7 539,000 24.0
1981 56,000 10.9 40,000 3.8 189,000 42.5 335,000 127.6 617,000 27.1
1982 28,000 5.5 40,000 3.7 205,000 46.1 332,000 123.9 605,000 26.3
1983 51,000 9.8 32,000 2.9 185,000 41.5 358,000 130.6 625,000 26.9
1984 28,000 5.4 33,000 3.0 159,000 35.5 299,000 106.7 520,000 22.2
1985 29,000 5.5 15,000 1.3 154,000 34.4 285,000 99.8 489,000 20.6
1986 24,000 4.6 17,000 1.5 116,000 25.7 266,000 91.0 416,000 17.4
1987 21,000 4.0 15,000 1.3 105,000 23.3 205,000 68.7 341,000 14.1
1988 (2)12,000 2.3 6,000 0.5 71,000 15.5 129,000 42.2 237,000 9.7
1989 11,000 2.0 8,000 0.7 67,000 14.4 132,000 42.6 234,000 9.5
1990 13,000 2.4 5,000 0.4 70,000 14.7 156,000 49.1 259,000 10.4
1991 10,000 1.8 12,000 1.0 86,000 18.4 173,000 54.5 296,000 11.9
1992 (3)9,000 1.6 7,000 0.6 111,000 23.0 277,000 85.8 428,000 16.9
1993 7,000 1.2 16,000 1.4 130,000 26.2 337,000 102.8 506,000 19.7
1994 6,000 1.0 11,000 0.9 140,000 27.5 378,000 114.0 552,000 21.3
1995 * * 17,000 1.4 149,000 28.6 371,000 110.6 553,000 21.2
1996 6,000 1.0 21,000 1.8 160,000 29.8 386,000 114.0 573,000 21.7
1997 * * 24,000 2.0 170,000 30.7 418,000 122.2 635,000 23.5
1998 * * 27,174 2.2 181,614 31.8 454,633 133.3 668,362 24.5
1999 * * 28,000 2.3 193,000 32.7 479,000 139.9 713,000 25.9
2000 * * 18,000 1.5 188,000 30.8 432,000 125.3 661,000 23.8
SOURCE: NATIONAL CENTER FOR HEALTH STATISTICS, NATIONAL HOSPITAL DISCHARGE SURVEY, 1979-2000
NOTES:
* FIGURE DOES NOT MEET STANDARD OF RELIABILITY OR PRECISION.(1) THIS TABLE REFERS EXCLUSIVELY TO DATA ON CHRONIC BRONCHITIS, EMPHYSEMA AND OTHER LOWER CHRONIC
OBSTRUCTIVE PULMONARY DISEASES INCLUDING BRONCHIECTASIS. DATA ON ASTHMA ARE NOT INCLUDED.(2) DATA PRIOR TO 1988 MAY BE DIFFERENT FROM DATA FOLLOWING THAT YEAR DUE TO A REDESIGN OF THE SURVEY.
(3) IN 1992, OBSTRUCTIVE CHRONIC BRONCHITIS (ICD CODE 491.21) WAS INTRODUCED. MANY DISCHARGES PREVIOUSLYCODED AS ACUTE BRONCHITIS (ICD CODE 466) WERE ATTRIBUTED TO THIS NEW CODE IN 1992. THEREFORE, THE LARGE
INCREASE IN THE HOSPITAL DISCHARGE RATE MAY BE DUE TO A CHANGE IN THE ICD CODE FOR CHRONIC BRONCHITIS.(4) THESE ARE SAMPLE ESTIMATES AND MAY DIFFER FROM FIGURES THAT WOULD BE OBTAINED FROM A CENSUS OF
THE POPULATION. EACH DATA POINT REPORTED IS SUBJECT TO SAMPLING VARIABILITY.(5) DUE TO ROUNDING, NUMBERS MAY NOT SUM TO THE TOTAL NUMBER OF HOSPITAL DISCHARGES.
TOTAL (4, 5)
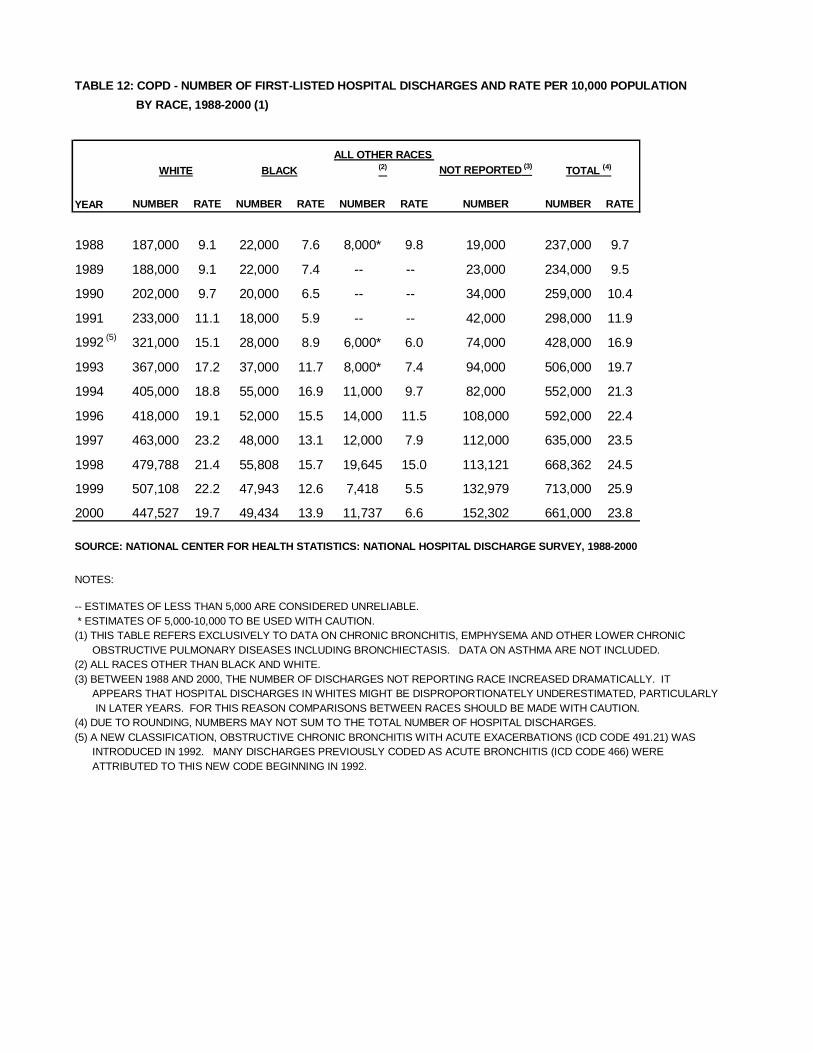
TABLE 12: COPD - NUMBER OF FIRST-LISTED HOSPITAL DISCHARGES AND RATE PER 10,000 POPULATION
BY RACE, 1988-2000 (1)
NOT REPORTED (3)
YEAR NUMBER RATE NUMBER RATE NUMBER RATE NUMBER NUMBER RATE
1988 187,000 9.1 22,000 7.6 8,000* 9.8 19,000 237,000 9.7
1989 188,000 9.1 22,000 7.4 -- -- 23,000 234,000 9.5
1990 202,000 9.7 20,000 6.5 -- -- 34,000 259,000 10.4
1991 233,000 11.1 18,000 5.9 -- -- 42,000 298,000 11.9
1992 (5) 321,000 15.1 28,000 8.9 6,000* 6.0 74,000 428,000 16.9
1993 367,000 17.2 37,000 11.7 8,000* 7.4 94,000 506,000 19.7
1994 405,000 18.8 55,000 16.9 11,000 9.7 82,000 552,000 21.3
1996 418,000 19.1 52,000 15.5 14,000 11.5 108,000 592,000 22.4
1997 463,000 23.2 48,000 13.1 12,000 7.9 112,000 635,000 23.5
1998 479,788 21.4 55,808 15.7 19,645 15.0 113,121 668,362 24.5
1999 507,108 22.2 47,943 12.6 7,418 5.5 132,979 713,000 25.9
2000 447,527 19.7 49,434 13.9 11,737 6.6 152,302 661,000 23.8
SOURCE: NATIONAL CENTER FOR HEALTH STATISTICS: NATIONAL HOSPITAL DISCHARGE SURVEY, 1988-2000
NOTES:
-- ESTIMATES OF LESS THAN 5,000 ARE CONSIDERED UNRELIABLE.* ESTIMATES OF 5,000-10,000 TO BE USED WITH CAUTION.(1) THIS TABLE REFERS EXCLUSIVELY TO DATA ON CHRONIC BRONCHITIS, EMPHYSEMA AND OTHER LOWER CHRONIC
OBSTRUCTIVE PULMONARY DISEASES INCLUDING BRONCHIECTASIS. DATA ON ASTHMA ARE NOT INCLUDED.(2) ALL RACES OTHER THAN BLACK AND WHITE.(3) BETWEEN 1988 AND 2000, THE NUMBER OF DISCHARGES NOT REPORTING RACE INCREASED DRAMATICALLY. IT
APPEARS THAT HOSPITAL DISCHARGES IN WHITES MIGHT BE DISPROPORTIONATELY UNDERESTIMATED, PARTICULARLYIN LATER YEARS. FOR THIS REASON COMPARISONS BETWEEN RACES SHOULD BE MADE WITH CAUTION.
(4) DUE TO ROUNDING, NUMBERS MAY NOT SUM TO THE TOTAL NUMBER OF HOSPITAL DISCHARGES.(5) A NEW CLASSIFICATION, OBSTRUCTIVE CHRONIC BRONCHITIS WITH ACUTE EXACERBATIONS (ICD CODE 491.21) WAS
INTRODUCED IN 1992. MANY DISCHARGES PREVIOUSLY CODED AS ACUTE BRONCHITIS (ICD CODE 466) WEREATTRIBUTED TO THIS NEW CODE BEGINNING IN 1992.
WHITE BLACK
ALL OTHER RACES(2) TOTAL (4)
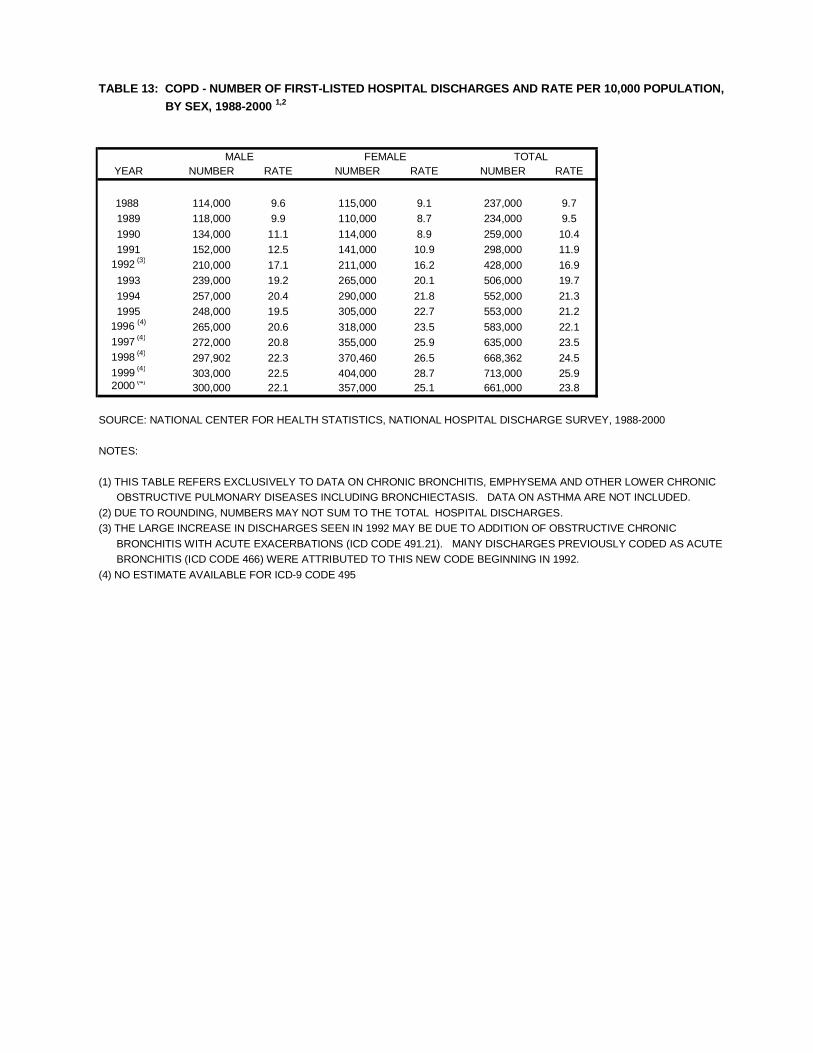
TABLE 13: COPD - NUMBER OF FIRST-LISTED HOSPITAL DISCHARGES AND RATE PER 10,000 POPULATION,
BY SEX, 1988-2000 1,2
YEAR NUMBER RATE NUMBER RATE NUMBER RATE
1988 114,000 9.6 115,000 9.1 237,000 9.71989 118,000 9.9 110,000 8.7 234,000 9.5
1990 134,000 11.1 114,000 8.9 259,000 10.41991 152,000 12.5 141,000 10.9 298,000 11.9
1992 (3)210,000 17.1 211,000 16.2 428,000 16.9
1993 239,000 19.2 265,000 20.1 506,000 19.7
1994 257,000 20.4 290,000 21.8 552,000 21.31995 248,000 19.5 305,000 22.7 553,000 21.2
1996 (4)265,000 20.6 318,000 23.5 583,000 22.1
1997 (4)272,000 20.8 355,000 25.9 635,000 23.5
1998 (4)297,902 22.3 370,460 26.5 668,362 24.5
1999 (4)303,000 22.5 404,000 28.7 713,000 25.9
2000 (4)300,000 22.1 357,000 25.1 661,000 23.8
SOURCE: NATIONAL CENTER FOR HEALTH STATISTICS, NATIONAL HOSPITAL DISCHARGE SURVEY, 1988-2000
NOTES:
(1) THIS TABLE REFERS EXCLUSIVELY TO DATA ON CHRONIC BRONCHITIS, EMPHYSEMA AND OTHER LOWER CHRONICOBSTRUCTIVE PULMONARY DISEASES INCLUDING BRONCHIECTASIS. DATA ON ASTHMA ARE NOT INCLUDED.
(2) DUE TO ROUNDING, NUMBERS MAY NOT SUM TO THE TOTAL HOSPITAL DISCHARGES.(3) THE LARGE INCREASE IN DISCHARGES SEEN IN 1992 MAY BE DUE TO ADDITION OF OBSTRUCTIVE CHRONIC
BRONCHITIS WITH ACUTE EXACERBATIONS (ICD CODE 491.21). MANY DISCHARGES PREVIOUSLY CODED AS ACUTEBRONCHITIS (ICD CODE 466) WERE ATTRIBUTED TO THIS NEW CODE BEGINNING IN 1992.
(4) NO ESTIMATE AVAILABLE FOR ICD-9 CODE 495
MALE FEMALE TOTAL