trends in income-related health inequalities in canada
TRANSCRIPT
Trends in Income-Related Health Inequalities in Canada
Technical Report Revised July 2016
Factors Influencing Health

Our vision Better data. Better decisions. Healthier Canadians.
Our mandate To lead the development and maintenance of comprehensive and integrated health information that enables sound policy and effective health system management that improve health and health care.
Our values Respect, Integrity, Collaboration, Excellence, Innovation
Men Women
| Correction Notice July 7, 2016
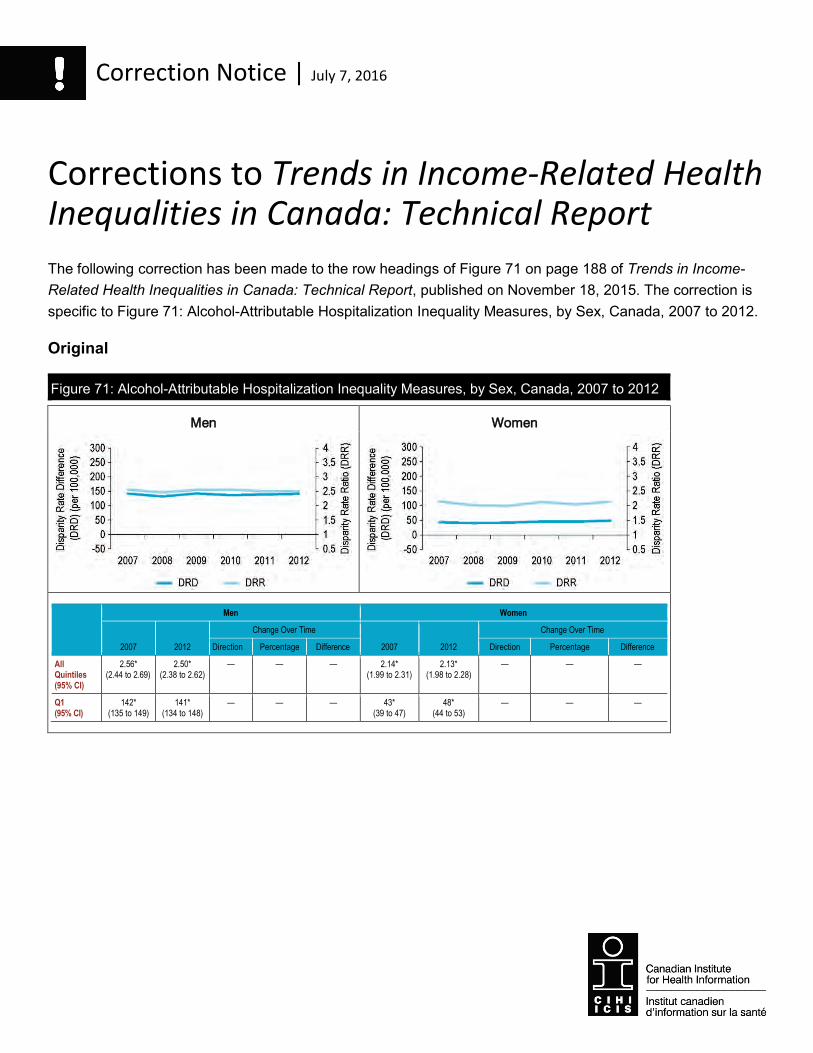
Corrections to Trends in Income-Related Health Inequalities in Canada: Technical Report The following correction has been made to the row headings of Figure 71 on page 188 of Trends in Income-Related Health Inequalities in Canada: Technical Report, published on November 18, 2015. The correction is specific to Figure 71: Alcohol-Attributable Hospitalization Inequality Measures, by Sex, Canada, 2007 to 2012.
Original
Figure 71: Alcohol-Attributable Hospitalization Inequality Measures, by Sex, Canada, 2007 to 2012
Men Women
2007 2012
Change Over Time
2007 2012
Change Over Time
Direction Percentage Difference Direction Percentage Difference
All Quintiles (95% CI)
2.56* (2.44 to 2.69)
2.50* (2.38 to 2.62)
— — — 2.14* (1.99 to 2.31)
2.13* (1.98 to 2.28)
— — —
Q1 (95% CI)
142* (135 to 149)
141* (134 to 148)
— — — 43* (39 to 47)
48* (44 to 53)
— — —
Correction Notice
Men Women
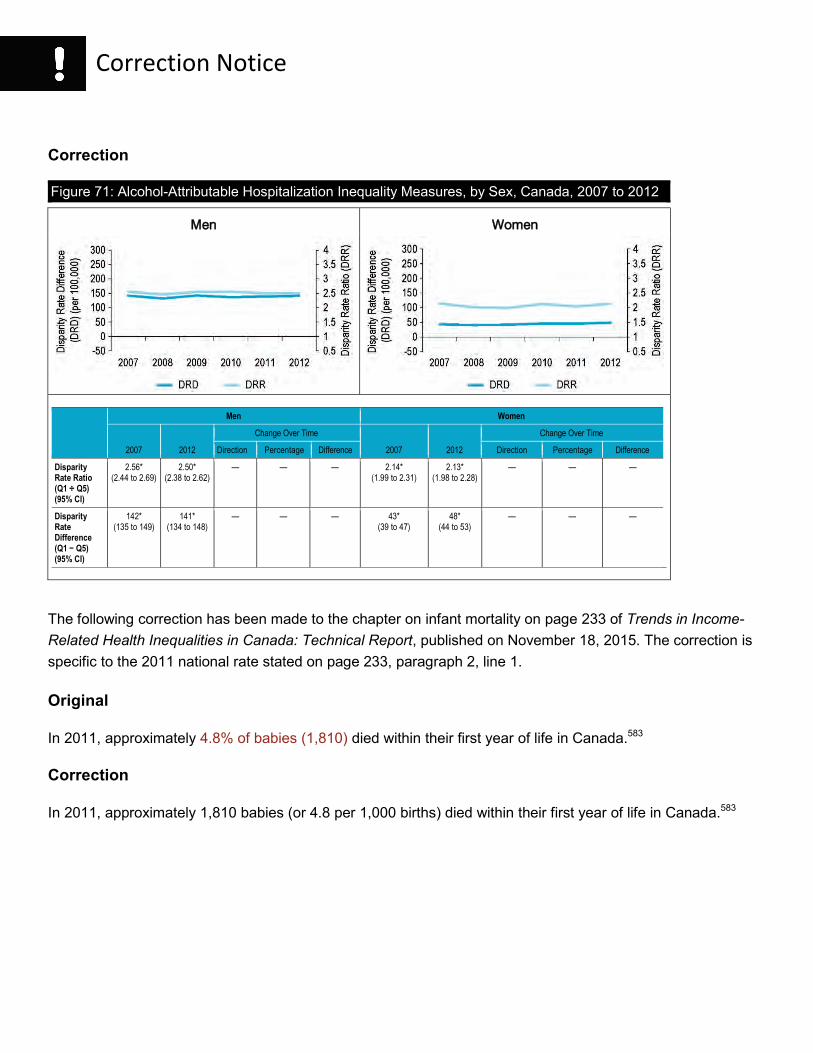
Correction
Figure 71: Alcohol-Attributable Hospitalization Inequality Measures, by Sex, Canada, 2007 to 2012
Men Women
2007 2012
Change Over Time
2007 2012
Change Over Time
Direction Percentage Difference Direction Percentage Difference
Disparity Rate Ratio (Q1 ÷ Q5) (95% CI)
2.56* (2.44 to 2.69)
2.50* (2.38 to 2.62)
— — — 2.14* (1.99 to 2.31)
2.13* (1.98 to 2.28)
— — —
Disparity Rate Difference (Q1 − Q5) (95% CI)
142* (135 to 149)
141* (134 to 148)
— — — 43* (39 to 47)
48* (44 to 53)
— — —
The following correction has been made to the chapter on infant mortality on page 233 of Trends in Income-Related Health Inequalities in Canada: Technical Report, published on November 18, 2015. The correction is specific to the 2011 national rate stated on page 233, paragraph 2, line 1.
Original
In 2011, approximately 4.8% of babies (1,810) died within their first year of life in Canada.583
Correction
In 2011, approximately 1,810 babies (or 4.8 per 1,000 births) died within their first year of life in Canada.583
Table of Contents Executive Summary ....................................................................................................................5
The Canadian Institute for Health Information ...........................................................................11
The Canadian Population Health Initiative .................................................................................13
Acknowledgements ...................................................................................................................15
Introduction ...............................................................................................................................17Organization of the Report ..................................................................................................18Approach for Analyzing and Reporting Income-Related Inequality Over Time ..................... 20Approach for Identifying Examples of Interventions .............................................................28
Section 1: Structural Factors Influencing Health — A Focus on Income .................................... 31Income Inequality Over Time ...............................................................................................33Interactions Between Income, Education and Employment ................................................. 43Interaction Between Education and Employment ................................................................46Role of Gender, Sex and Ethnicity .......................................................................................49Aboriginal Income and Unemployment Trends Over Time .................................................. 50
Section 2: Intermediary Factors Influencing Health ................................................................... 53Material Circumstances Indicators .......................................................................................53
Core Housing Need .......................................................................................................53Household Food Insecurity ............................................................................................ 59
Early Life Indicators .............................................................................................................66Small for Gestational Age .............................................................................................. 66Children Vulnerable in Areas of Early Development ...................................................... 78
Behavioural and Biological Indicators ..................................................................................92Smoking ........................................................................................................................ 92Obesity ........................................................................................................................105
Health System Indicators ..................................................................................................121Influenza Immunization for Seniors .............................................................................. 121Chronic Obstructive Pulmonary Disease (COPD) Hospitalization for Canadians Younger Than Age 75 .............................................................................................. 132
Section 3: Health and Well-Being Outcomes ........................................................................... 146Injury Indicators .................................................................................................................146
Fall Injury Hospitalization for Seniors ........................................................................... 146Motor Vehicle Traffic Injury Hospitalization .................................................................. 159
Chronic Disease Indicators ................................................................................................170Mental Illness Hospitalization ...................................................................................... 170
4
Trends in Income-Related Health Inequalities in Canada
Alcohol-Attributable Hospitalization ............................................................................. 183Hospitalized Heart Attacks ........................................................................................... 196Diabetes ......................................................................................................................209
Well-Being Indicator ..........................................................................................................222Self-Rated Mental Health............................................................................................. 222
Mortality Indicator ..............................................................................................................233Infant Mortality .............................................................................................................233
References .............................................................................................................................243
5
Executive Summary
Executive Summary Over the past decade, there has been a growing call for action to reduce health inequalities in Canada.2–9 Despite this widespread attention, recent evidence reveals that health inequalities remain pervasive throughout Canadian society.10 This may surprise some, given the objective of Canada’s health care policy to facilitate reasonable access to health services without financial or other barriers.11 In 2011, Canada joined a number of nations in a commitment to implement the Rio Political Declaration on Social Determinants of Health.12 In adopting the Rio Declaration, Canada committed to reducing health inequities in the country.
Health inequalities refer to observed differences in health by population groups, whereas health inequities describe differences that are unfair or unjust.1 Measuring the extent of health inequality is therefore an important step toward identifying and reducing health inequities in Canada.
Approach In this report, we set out to examine whether Canada and the provinces have made progress in reducing socio-economic inequalities in health and well-being over the past decade. To achieve this aim, we examined a range of health indicators over time and across 5 income levels to identify the distribution of health across the income gradient. This analysis highlights how the gap between the highest and lowest income levels (i.e., inequality) has changed over time. Inequality is measured on both absolute (difference-based) and relative (ratio-based) scales to ensure a comprehensive understanding of inequality. The disparity rate ratio (DRR) captures the relative difference and is calculated by dividing the highest rate (usually from the lowest income level) by the lowest rate (usually from the highest income level). The disparity rate difference (DRD) captures the absolute difference and is calculated by subtracting the highest rate from the lowest rate.
To examine the impact of income-related inequalities across the income gradient (i.e., all income quintiles), we calculated inequality impact measures. The potential rate reduction (PRR) measures the potential percentage reduction in a health indicator rate that would occur in the hypothetical scenario where all income levels experience the same rate as the highest income level. The population impact number (PIN) converts the PRR into the approximate number of cases that could be avoided in the hypothetical scenario where all income levels experience the same rate as the highest income level.
In addition, we aimed to identify programs and interventions that could reduce health inequalities. The objective of our analysis was to identify interventions across a range of dimensions, including the implementation level (e.g., federal, provincial), the setting (e.g., hospital, community) and the target population (e.g., low-income people, seniors).
6
Trends in Income-Related Health Inequalities in Canada
Summary of Key Findings Table 1 shows the summary of inequality results at the national level for each of the 16 indicators examined. The DRRs and DRDs are compared over time to indicate whether inequality has increased, decreased or persisted. The inequality impact is reported for the most recent time period based on the hypothetical scenario in which everyone experiences the same rates as those in the highest income level.
Notably, this report identified increased inequality over time for the following 3 indicators: Smoking, Chronic Obstructive Pulmonary Disease (COPD) Hospitalization for Canadians Younger Than Age 75 and Self-Rated Mental Health. For the Smoking indicator, inequalities increased over time due to decreases in the highest income level and no significant changes in the lowest income level. For COPD hospitalizations, increased inequality resulted from increasing rates in the lowest income level and decreases in the highest income level. Increased inequality was shown for Self-Rated Mental Health due to an increase in the rate of poor/fair health in the lowest income level.
Our analysis identified that for the majority of indicators, inequality persisted over time. For some indicators, inequalities persisted while the rates generally remained the same and/or increased: Core Housing Need (urban areas), Household Food Insecurity, Children Vulnerable in Areas of Early Development, Obesity (among women), Fall Injury Hospitalization for Seniors, Alcohol-Attributable Hospitalization and Diabetes. Persistent inequality was also noted for indicators where rates generally declined: Motor Vehicle Traffic Injury Hospitalization, Hospitalized Heart Attacks and Infant Mortality.
While this report highlighted either increased or persistent inequalities for the majority of indicators, 2 indicators had decreased inequality over time: Small for Gestational Age and Mental Illness Hospitalization. Decreased inequality for these indicators was due to rates increasing in the highest income level (rather than decreasing in the lowest income levels).
The patterns of inequality for men and women were the same over time for most of the indicators examined. A notable exception is Obesity, for which no inequality was observed for men, while inequality persisted over time for women. In addition, the inequality in Alcohol-Attributable Hospitalization was slightly higher for men than women. This overall consistency in inequality patterns was observed despite indicator rates across income levels being higher for males than females for Children Vulnerable in Areas of Early Development, Smoking, Motor Vehicle Traffic Injury Hospitalization, Mental Illness Hospitalization, Alcohol-Attributable Hospitalization and Hospitalized Heart Attacks. The rates were higher for women than men for Fall Injury Hospitalization for Seniors.
Trends in inequality were largely similar across provinces, with a few notable exceptions. For example, while income-related inequality did not change over time at the national level for Diabetes, it increased substantially in Saskatchewan. In 2003, the diabetes rate was not significantly higher in the lowest income level compared with the highest in Saskatchewan, whereas in 2013, the rate of diabetes was more than 4 times or 13.7 percentage points higher in the lowest income level compared with the highest.
7
Executive Summary
Health inequalities have a substantial impact on society, particularly on the health system. Our analysis revealed that reducing income-related health inequalities could represent considerable health system savings. For example, there could be a 45% overall reduction in the rate of COPD hospitalizations for those younger than 75 if Canadians in all income levels experienced the same rate as those in the highest income level. This potential rate reduction represents 18,700 fewer hospitalizations in Canada per year and approximately $149 million in health system savings (Canadian MIS Database, unpublished data, 2012).
Our analysis identified a number of established and/or promising interventions for reducing income-related health inequalities, which are featured in the report. Relatively few of the interventions addressing low-income populations in Canada have been evaluated. It is important to note that, given the breadth of this issue, a systematic review of the literature concerning the reduction of income-related health inequalities was beyond the scope of this report. The interventions selected for presentation were implemented from the late 1980s to recent years and include approaches that were implemented at the local, provincial and national levels, both within and outside of the health sector, and targeted at various populations. For many of these interventions, even where evaluation evidence is available, there is limited information on the effectiveness of reducing income-related inequalities. Targeted interventions designed to minimize health inequalities, with an evaluation component, are warranted given the persisting and growing inequalities identified.
Moving Forward In moving forward, it is important to continue to monitor trends and to evaluate the impact of interventions targeted toward low-income populations. Monitoring the health of populations over time can serve several purposes. For example, monitoring helps identify persistent and long-term issues in population health and the health system, and it can aid in identifying emerging population health needs, particularly for priority groups. Moreover, examining the trajectory of the health of a population assists with planning for current and future health needs. Finally, longer-term monitoring provides evidence of the effectiveness of policies and programs that aim to improve the health of a population.
Underpinning this type of analysis is the availability of reliable socio-economic and demographic data, including data on income, education, occupation, ethnicity and disability. Access to this data (including linkage across data sources) is critical to better understanding and monitoring the many complex factors related to the health and well-being of vulnerable populations. Moreover, analyses based on this data, as well as on the implementation and evaluation of interventions targeting these complex interactions, are needed for evidence-informed policy.
Summary Our analysis identified that there has been minimal progress in reducing the health gap between lower- and higher-income Canadians over the past decade. For the majority of indicators, this gap has persisted or widened over time. At the provincial level, trends in inequality and the extent of inequality varied considerably, making conclusions difficult. This work also highlighted a paucity in evidence from evaluations that assess the effectiveness of approaches to reducing health inequalities. In order to help policy- and decision-makers reduce these
8
Trends in Income-Related Health Inequalities in Canada
(cont’d on next page)
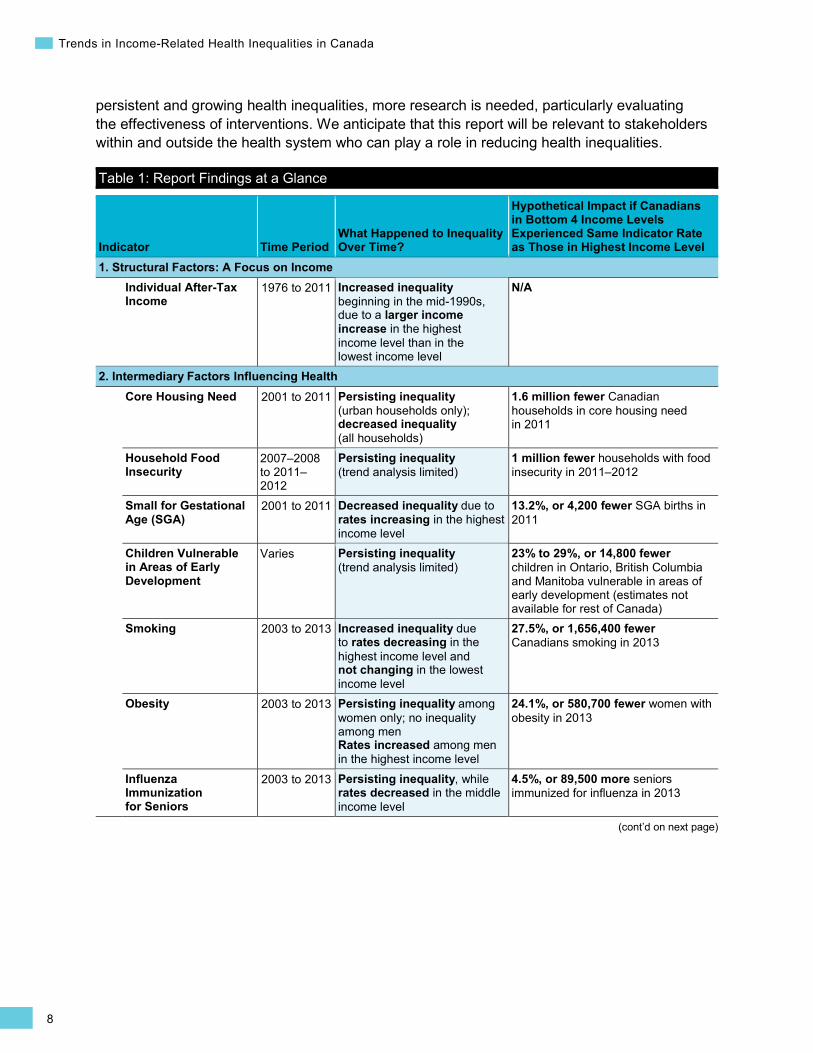
persistent and growing health inequalities, more research is needed, particularly evaluating the effectiveness of interventions. We anticipate that this report will be relevant to stakeholders within and outside the health system who can play a role in reducing health inequalities.
Table 1: Report Findings at a Glance
Indicator Time Period What Happened to Inequality Over Time?
Hypothetical Impact if Canadians in Bottom 4 Income Levels Experienced Same Indicator Rate as Those in Highest Income Level
1. Structural Factors: A Focus on Income Individual After-Tax Income
1976 to 2011 Increased inequality beginning in the mid-1990s, due to a larger income increase in the highest income level than in the lowest income level
N/A
2. Intermediary Factors Influencing Health Core Housing Need 2001 to 2011 Persisting inequality
(urban households only); decreased inequality (all households)
1.6 million fewer Canadian households in core housing need in 2011
Household Food Insecurity
2007–2008 to 2011– 2012
Persisting inequality (trend analysis limited)
1 million fewer households with food insecurity in 2011–2012
Small for Gestational Age (SGA)
2001 to 2011 Decreased inequality due to rates increasing in the highest income level
13.2%, or 4,200 fewer SGA births in 2011
Children Vulnerable in Areas of Early Development
Varies Persisting inequality (trend analysis limited)
23% to 29%, or 14,800 fewer children in Ontario, British Columbia and Manitoba vulnerable in areas of early development (estimates not available for rest of Canada)
Smoking 2003 to 2013 Increased inequality due to rates decreasing in the highest income level and not changing in the lowest income level
27.5%, or 1,656,400 fewer Canadians smoking in 2013
Obesity 2003 to 2013 Persisting inequality among women only; no inequality among men Rates increased among men in the highest income level
24.1%, or 580,700 fewer women with obesity in 2013
Influenza Immunization for Seniors
2003 to 2013 Persisting inequality, while rates decreased in the middle income level
4.5%, or 89,500 more seniors immunized for influenza in 2013

9
Executive Summary
Table 1: Report Findings at a Glance (cont’d)
Indicator Time Period What Happened to Inequality Over Time?
Hypothetical Impact if Canadians in Bottom 4 Income Levels Experienced Same Indicator Rate as Those in Highest Income Level
Chronic Obstructive Pulmonary Disease (COPD) Hospitalizations for Canadians Younger Than Age 75
2001 to 2012 Increased inequality, due to rates decreasing in the highest income level and increasing in the lowest income level
45.3%, or 18,700 fewer COPD hospitalizations among Canadians younger than 75 in 2012
3. Health and Well-Being Outcomes Fall Injury Hospitalization for Seniors
2001 to 2012 Persisting inequality, while rates increased in all income levels
3.2%, or 1,000 fewer fall injury hospitalizations among men age 65 and older in 2012
Motor Vehicle Traffic Injury Hospitalization
2001 to 2012 Persisting inequality, while rates decreased in all income levels
13.5%, or 2,200 fewer motor vehicle traffic injury hospitalizations in 2012
Mental Illness Hospitalization
2006 to 2012 Decreased inequality, due to rates increasing in the highest income level
26.8%, or 40,300 fewer mental illness hospitalizations in 2012
Alcohol-Attributable Hospitalization
2007 to 2012 Persisting inequality, while rates increased in all income levels
31.6%, or 9,000 fewer alcohol-attributable hospitalizations in 2012
Hospitalized Heart Attacks
2008 to 2012 Persisting inequality, while rates decreased in the lowest income level
14.6%, or 11,000 fewer hospitalized heart attacks in 2012
Diabetes 2003 to 2013 Persisting inequality, while rates increased in all except the highest income level
32.1%, or 673,700 fewer Canadians living with diabetes in 2013
Self-Rated Mental Health
2003 to 2013 Increased inequality, due to rates increasing in all except the highest income level
58.2%, or 1,042,900 fewer Canadians with fair/poor self-rated mental health in 2013
Infant Mortality 2001 to 2011 Persisting inequality, while rates decreased in the middle income level
15.1%, or 300 fewer infant deaths in 2011
Note Inequality results that are shaded highlight worsening trends in the health of Canadians (i.e., increasing health gap and/or worsening rates among specific income levels).

This page has been intentionally left blank

11
The Canadian Institute for Health Information
The Canadian Institute for Health Information Our Vision Better data. Better decisions. Healthier Canadians.
Our Mandate To lead the development and maintenance of comprehensive and integrated health information that enables sound policy and effective health system management that improve health and health care.
Our Values Respect, Integrity, Collaboration, Excellence, Innovation

This page has been intentionally left blank

13
The Canadian Population Health Initiative
The Canadian Population Health Initiative The Canadian Population Health Initiative (CPHI), a part of the Canadian Institute for Health Information (CIHI), was created in 1999. CPHI’s mission is to support policy-makers and health system managers in Canada in their efforts to improve population health and reduce health inequalities through research and analysis, evidence synthesis and performance measurement.
As a key actor in population health, CPHI
• Builds knowledge and understanding of factors that influence population health, health system outcomes and health inequalities; and
• Stimulates policy responses and enhances the capacity of decision-makers and health system managers to act on population health and health system outcomes.

This page has been intentionally left blank

15
Introduction
Acknowledgements The Canadian Institute for Health Information (CIHI) acknowledges with appreciation the contributions of many individuals and organizations to the development of Trends in Income-Related Health Inequalities in Canada. In particular, we would like to express our appreciation to the members of the expert advisory group, who provided invaluable advice throughout the planning and development of this report:
• Arlene Bierman Scientist, St. Michael’s Hospital
• Marni Brownell Senior Researcher, Manitoba Centre for Health Policy
• Connie Clement Scientific Director, National Collaborating Centre for Determinants of Health
• Bob Gardner Director, Healthcare Reform and Policy, Wellesley Institute
• Trevor Hancock Professor, School of Public Health and Social Policy, University of Victoria
• Beth Jackson Manager, Research and Knowledge Development, Public Health Agency of Canada
• Cory Neudorf Chief Medical Health Officer, Saskatoon Health Region
• Mike Pennock Epidemiologist, Ministry of Health, British Columbia
CPHI would also like to thank the CIHI Advisory Council on Population Health for its ongoing guidance and support, and to gratefully acknowledge Yukiko Asada, Elizabeth Dyke, Sam Harper, Nathan Nickel, Rob Raos and Claudia Sanmartin for lending their expertise and providing such generous insight during the peer-review process.
Please note that the analyses and conclusions presented in this document do not necessarily reflect those of the individual members of the expert advisory group, the peer reviewers or their affiliated organizations.
This report was developed with the support, cooperation and valuable contributions of current and former CPHI team members as well as other CIHI program areas.
For more information, please contact
Canadian Population Health Initiative Canadian Institute for Health Information (CIHI) 495 Richmond Road, Suite 600 Ottawa, Ontario K2A 4H6 [email protected]

This page has been intentionally left blank
17
Introduction
Introduction Canadians with lower incomes live shorter lives and experience poorer overall health than higher-income Canadians.13, 14 These income-related health inequalities have persisted despite Canada’s publicly financed universal health care systems and levels of net social spending that are consistent with the average across member countries of the Organisation for Economic Co-operation and Development (OECD).15 The variation in health by income level is well-known and consistent with patterns observed in other developed countries.16–21 In recent years, the Canadian Institute for Health Information (CIHI), along with other national, provincial and regional organizations, has expanded the reporting of health indicators by income and other measures of socio-economic status.10, 22–25 These efforts have improved our understanding of patterns of inequalities in health and factors affecting health at various points in time. However, less is known about the extent to which these health inequalities have changed over the past decade.
Monitoring health inequalities in a systematic and comparable manner over time is important when it comes to identifying priority populations for health improvement efforts and examining the impact of policies and interventions on health inequalities among Canadians.5, 12, 26 In other words, monitoring health inequalities over time can inform where action is needed and where improvements have occurred. Moreover, conducting evaluations and sharing information about programs and interventions that have been shown to reduce health inequalities contribute to the evidence base for other jurisdictions seeking to adopt similar strategies.
The goals of this report are to describe
• The extent to which income-related inequalities in health and factors affecting health have changed over time in Canada and in the provinces;i and
• Examples of promising interventions for reducing income-related inequalities in health and factors affecting health.
i. Trends in income-related health inequalities were not examined for the Canadian territories due to a lack of available data.
Health inequalities (or health disparities) refer to observed differences in health by population groups.1 These health inequalities can occur for a variety of reasons, including biological differences, individual choices, random variation and the unequal distribution of socio-economic factors that influence health, like income, education, employment and social supports.13 In contrast, health inequities describe differences that are considered to be unfair or unjust.1, 27, 28 For example, health inequities may include differences attributable to socially modifiable factors, such as poverty or cultural barriers to accessing health care. Measuring the extent of health inequality is an important step toward identifying and reducing health inequities in Canada.
18
Trends in Income-Related Health Inequalities in Canada
This report is one of a number of current national initiatives aimed at strengthening the evidence on health inequalities in Canada. The Public Health Agency of Canada, Statistics Canada and CIHI, in collaboration with the Pan-Canadian Public Health Network, are also developing health inequalities indicators for reporting in Canada. This initiative will produce a comprehensive and current statistical portrait of the state of health inequalities in the country, making data available on more than 50 health indicators disaggregated by a broad range of socio-economic and demographic factors (expected release date: 2016).
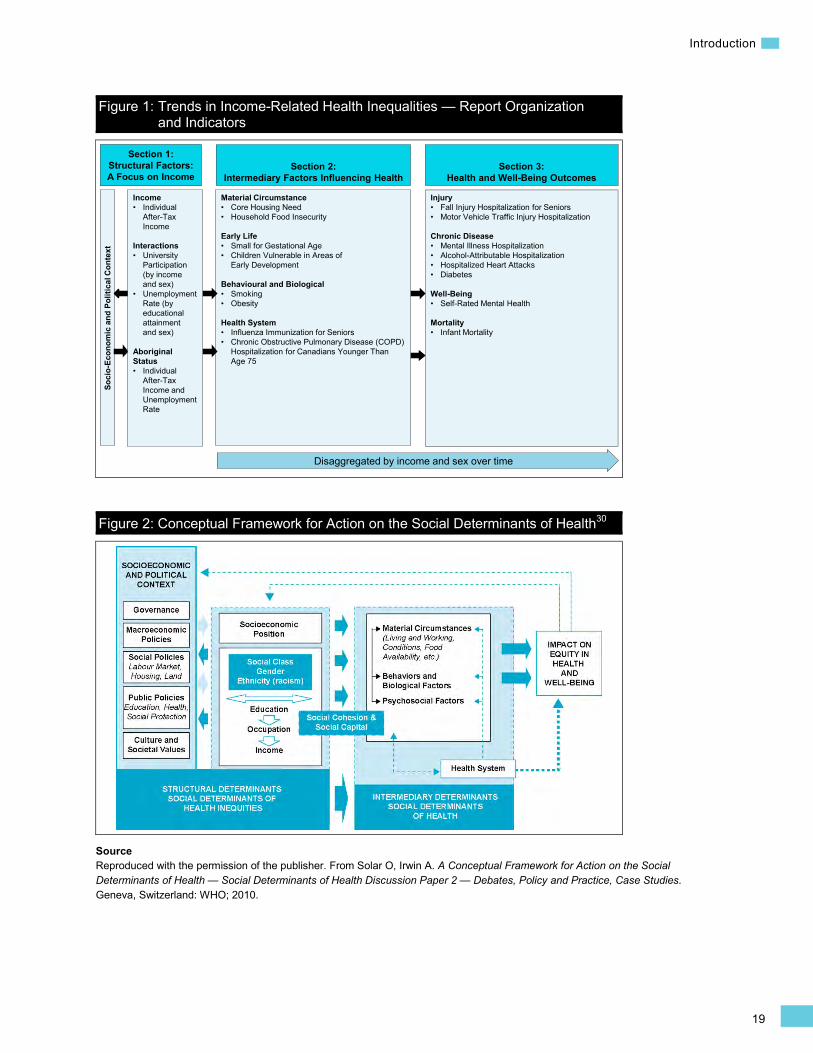
Organization of the Report As shown in Figure 1, a range of indicators was selected to examine trends in income-related health inequality. These indicators are intended to reflect the complexity and continuum of factors that affect income-related health inequality. As such, this report and the presentation of indicators is organized into 3 sections; this organization was largely informed by the Conceptual Framework for Action on the Social Determinants of Health (CSDH) published by the World Health Organization (WHO) (see Figure 2).29 The WHO CSDH describes the pathways through which structural factors (like income) act through intermediary factors (like food insecurity and smoking) and ultimately result in income-related inequalities in health and well-being outcomes. The indicators included in this report provide a starting point for assessing the extent to which health inequalities are changing in Canada. Similarly, the organization of the report facilitates a discussion of the range of approaches that may be taken to reduce health inequality in Canada.
Section 1 of this report provides an overview of income inequality trends over time, as well as trends in other socio-economic indicators, such as rates of university participation and unemployment. The discussion focuses on approaches for reducing income inequality, such as poverty reduction strategies. Section 2 provides an overview of trends in income-related inequalities for selected indicators reflecting intermediary factors influencing health. A variety of approaches for reducing inequality in these indicators, ranging from programs addressing core housing need to integrated primary care programs located in lower-income neighbourhoods, is presented in the discussion. Section 3 provides an overview of trends in income-related inequalities in selected health and well-being outcome indicators. The complexity of the factors that lead to health and well-being outcomes, such as infant mortality, is discussed, which highlights the importance of addressing multiple determinants of health in order to reduce health inequalities and improve population health.29
For each section of the report, indicators were selected following a review of the health inequality literature and in consultation with experts in the field, including the recommendations for pan-Canadian indicators of health inequalities prepared by the Population Health Promotion Expert Group of the Pan-Canadian Public Health Network.4 The goal of this process was to identify relevant and actionable health indicators that have been previously reported to vary by income. Importantly, the final criterion for selecting indicators was the availability of consistent and reliable data by income level over time. The report focuses on income-related health inequality because of the significant direct and indirect influences of income and socio-economic status in determining health. Moreover, information on income is more readily available across data sources than information on other socio-economic variables (e.g., occupation, education) that can be used to categorize populations to study health inequality.
19
Introduction
Figure 1: Trends in Income-Related Health Inequalities — Report Organization and Indicators
Figure 2: Conceptual Framework for Action on the Social Determinants of Health30
Source Reproduced with the permission of the publisher. From Solar O, Irwin A. A Conceptual Framework for Action on the Social Determinants of Health — Social Determinants of Health Discussion Paper 2 — Debates, Policy and Practice, Case Studies. Geneva, Switzerland: WHO; 2010.
Section 1: Structural Factors: A Focus on Income
Section 2: Intermediary Factors Influencing Health
Section 3: Health and Well-Being Outcomes
Injury• Fall Injury Hospitalization for Seniors• Motor Vehicle Traffic Injury Hospitalization
Chronic Disease• Mental Illness Hospitalization• Alcohol-Attributable Hospitalization• Hospitalized Heart Attacks• Diabetes
Well-Being • Self-Rated Mental Health
Mortality• Infant Mortality
Material Circumstance• Core Housing Need• Household Food Insecurity
Early Life• Small for Gestational Age• Children Vulnerable in Areas of
Early Development
Behavioural and Biological • Smoking• Obesity
Health System• Influenza Immunization for Seniors• Chronic Obstructive Pulmonary Disease (COPD)
Hospitalization for Canadians Younger Than Age 75
Soci
o-Ec
onom
ic a
nd P
oliti
cal C
onte
xt
Disaggregated by income and sex over time
Income• Individual
After-Tax Income
Interactions• University
Participation (by income and sex)
• UnemploymentRate (by educational attainment and sex)
Aboriginal Status• Individual
After-Tax Income and UnemploymentRate
20
Trends in Income-Related Health Inequalities in Canada
Approach for Analyzing and Reporting Income-Related Inequality Over Time A main objective of this report is to determine the extent to which income-related inequalities in health and factors affecting health have changed over time in Canada and the provinces. To answer this question, the following steps were taken:
• Step 1: Categorize the population into income levels and calculate indicator rates by income level for each time point.
• Step 2: Quantify the difference between the rates for the highest and lowest income levels (i.e., income-related inequality) for each available time point using 2 inequality measures: disparity rate ratio (DRR) and disparity rate difference (DRD).
• Step 3: Assess whether inequality has changed over time by comparing the inequality measures between the first and last time points.
• Step 4: Examine the indicator rate trends by income level to identify which income levels are influencing changes in income-related inequality.
• Step 5: Quantify the extent of inequality across all income levels by calculating inequality impact measures that benchmark to the highest income level: potential rate reduction (PRR) and population impact number (PIN).
Following is an overview of each of these steps in more detail. It is intended to provide a frame of reference for reading this report and for understanding the interpretation of the results. For a more comprehensive account of the technical methodology for this project, please refer to the Methodology Notes.
Step 1: Categorize the population into income levels and calculate indicator rates by income level for each time point Income-related inequality can be examined in various ways.31–37 For example, it can be analyzed by dividing the population into equal-sized levels according to income and comparing the health indicator rate across each level. For this report, indicator trends are examined by 5 levels (quintiles), which were primarily determined based on adjusted self-reported household income or average neighbourhood-level income (see Box 1 below). This approach is consistent with a large proportion of income-related health inequality analyses previously carried out in Canada14, 38–45 and allows rates by income level to be easily visualized over time. Other approaches for analyzing income-related inequality include using more granular categorizations of the population by income, such as by deciles or by analyzing income as a continuous variable.
21
Introduction
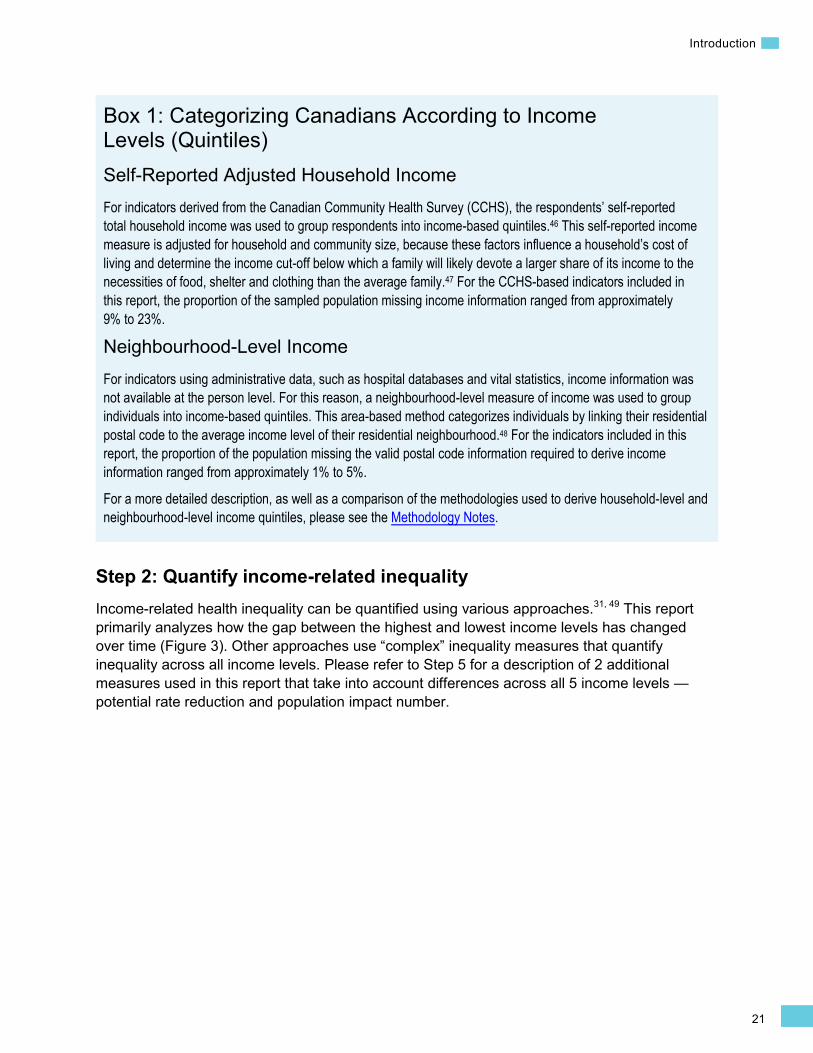
Box 1: Categorizing Canadians According to Income Levels (Quintiles) Self-Reported Adjusted Household Income For indicators derived from the Canadian Community Health Survey (CCHS), the respondents’ self-reported total household income was used to group respondents into income-based quintiles.46 This self-reported income measure is adjusted for household and community size, because these factors influence a household’s cost of living and determine the income cut-off below which a family will likely devote a larger share of its income to the necessities of food, shelter and clothing than the average family.47 For the CCHS-based indicators included in this report, the proportion of the sampled population missing income information ranged from approximately 9% to 23%.
Neighbourhood-Level Income For indicators using administrative data, such as hospital databases and vital statistics, income information was not available at the person level. For this reason, a neighbourhood-level measure of income was used to group individuals into income-based quintiles. This area-based method categorizes individuals by linking their residential postal code to the average income level of their residential neighbourhood.48 For the indicators included in this report, the proportion of the population missing the valid postal code information required to derive income information ranged from approximately 1% to 5%.
For a more detailed description, as well as a comparison of the methodologies used to derive household-level and neighbourhood-level income quintiles, please see the Methodology Notes.
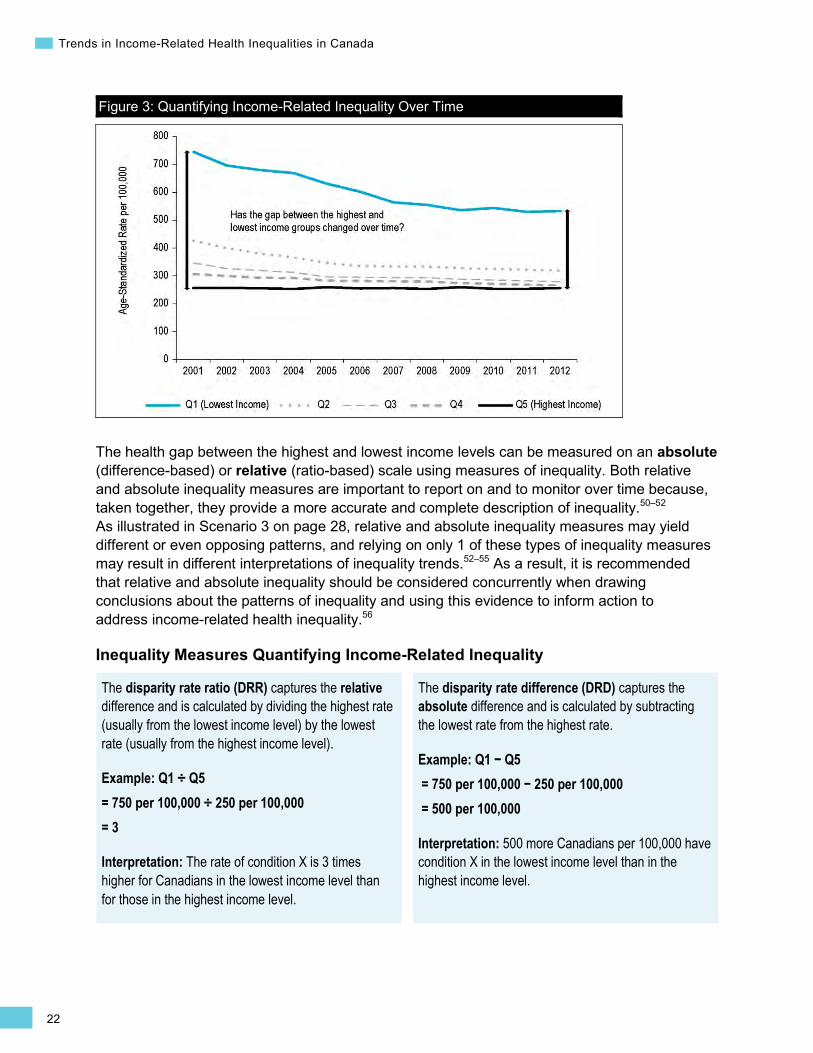
Step 2: Quantify income-related inequality Income-related health inequality can be quantified using various approaches.31, 49 This report primarily analyzes how the gap between the highest and lowest income levels has changed over time (Figure 3). Other approaches use “complex” inequality measures that quantify inequality across all income levels. Please refer to Step 5 for a description of 2 additional measures used in this report that take into account differences across all 5 income levels — potential rate reduction and population impact number.
22
Trends in Income-Related Health Inequalities in Canada
Figure 3: Quantifying Income-Related Inequality Over Time
The health gap between the highest and lowest income levels can be measured on an absolute (difference-based) or relative (ratio-based) scale using measures of inequality. Both relative and absolute inequality measures are important to report on and to monitor over time because, taken together, they provide a more accurate and complete description of inequality.50–52 As illustrated in Scenario 3 on page 28, relative and absolute inequality measures may yield different or even opposing patterns, and relying on only 1 of these types of inequality measures may result in different interpretations of inequality trends.52–55 As a result, it is recommended that relative and absolute inequality should be considered concurrently when drawing conclusions about the patterns of inequality and using this evidence to inform action to address income-related health inequality.56
Inequality Measures Quantifying Income-Related Inequality
The disparity rate ratio (DRR) captures the relative difference and is calculated by dividing the highest rate (usually from the lowest income level) by the lowest rate (usually from the highest income level).
Example: Q1 ÷ Q5 = 750 per 100,000 ÷ 250 per 100,000 = 3
Interpretation: The rate of condition X is 3 times higher for Canadians in the lowest income level than for those in the highest income level.
The disparity rate difference (DRD) captures the absolute difference and is calculated by subtracting the lowest rate from the highest rate.
Example: Q1 − Q5 = 750 per 100,000 − 250 per 100,000 = 500 per 100,000
Interpretation: 500 more Canadians per 100,000 have condition X in the lowest income level than in the highest income level.

23
Introduction
Step 3: Assess whether inequality changed over time To determine whether income-related inequality has changed over time, this analysis examines whether the inequality measures — DRR and DRD — increased, decreased or remained unchanged between the first and last time points. When reporting changes over time, only statistically significant differences are highlighted; this significance is based on whether the 95% confidence intervals (CIs) for the first time point do not overlap those from the last time point. The percentage change and the difference change in the inequality measures are also provided to indicate the degree of change over time. Notably, this approach of highlighting only statistically significant changes over time was taken to overcome the practical challenges of deriving key messages for a comprehensive report in a consistent fashion. As a result of using this approach, the findings that are discussed may yield a conservative summary of inequalities that have changed over time.
Table 2: Sample Results Displaying Inequality Changes Over Time
Inequality Measure 2001 2012
Change Over Time Direction Percentage Difference
DRR (95% CI)
1.99* (1.78 to 2.23)
1.56* (1.38 to 1.77)
↓ -21.5* (-29.2 to -13.8)
-0.43* (-0.60 to -0.26)
DRD (95% CI)
313* (263 to 363)
177* (129 to 225)
↓ -43.5* (-61.2 to -25.7)
-136* (-205 to -67)
In this scenario, both the DRR and DRD are significantly lower in 2012 compared with 2001. This means that inequality decreased on both the relative and absolute scales.
Moreover, recognizing that this approach takes into account the degree of inequality present at only the first and last time points, the DRDs and DRRs are also presented as graphs over the full time series (Figure 4). These figures are intended to provide complementary information about the patterns of inequality throughout the entire time period. Additionally, complete analytical results are available for the entire time series on CIHI’s website.
Figure 4: Trend in Disparity Rate Ratio and Disparity Rate Difference Over Time
A DRD value of 0 indicates that no difference exists in the indicator rates between income quintiles Q1 and Q5 on the absolute scale. A value that is less than 0 indicates that rates are higher for Q5 (inverse association).
A DRR value of 1 indicates that no difference exists in the indicator rates between income quintiles Q1 and Q5 on the relative scale. A value between 0 and 1 indicates that rates are higher for Q5 (inverse association).
24
Trends in Income-Related Health Inequalities in Canada
Step 4: Examine the indicator rate trends by income level to identify which income levels are influencing changes in income-related inequality To further identify how and why inequality may have changed over time, it is necessary to review the indicator rates by income level.49, 57 This is because income-related inequality can increase, decrease or stay the same for a number of reasons. For example, as illustrated in Scenario 1 below, a reduction in income-related health inequality can be the result of improving rates among lower income levels. This concept of bringing the health of those with worse health up to the levels of the healthiest individuals in a society is referred to as “levelling up” and indicates a positive improvement. Conversely, a reduction in income-related inequality can also occur due to a worsening of rates in the higher income levels (Scenario 2). Because it is not desirable to narrow the gap by reducing health for healthier people (i.e., “levelling down”), this signals a worsening trend.52
Understanding how inequality may have changed over time is a key step for identifying what type of action may be needed to improve the health of Canadians and, where needed, to specifically address health inequality.
25
Introduction
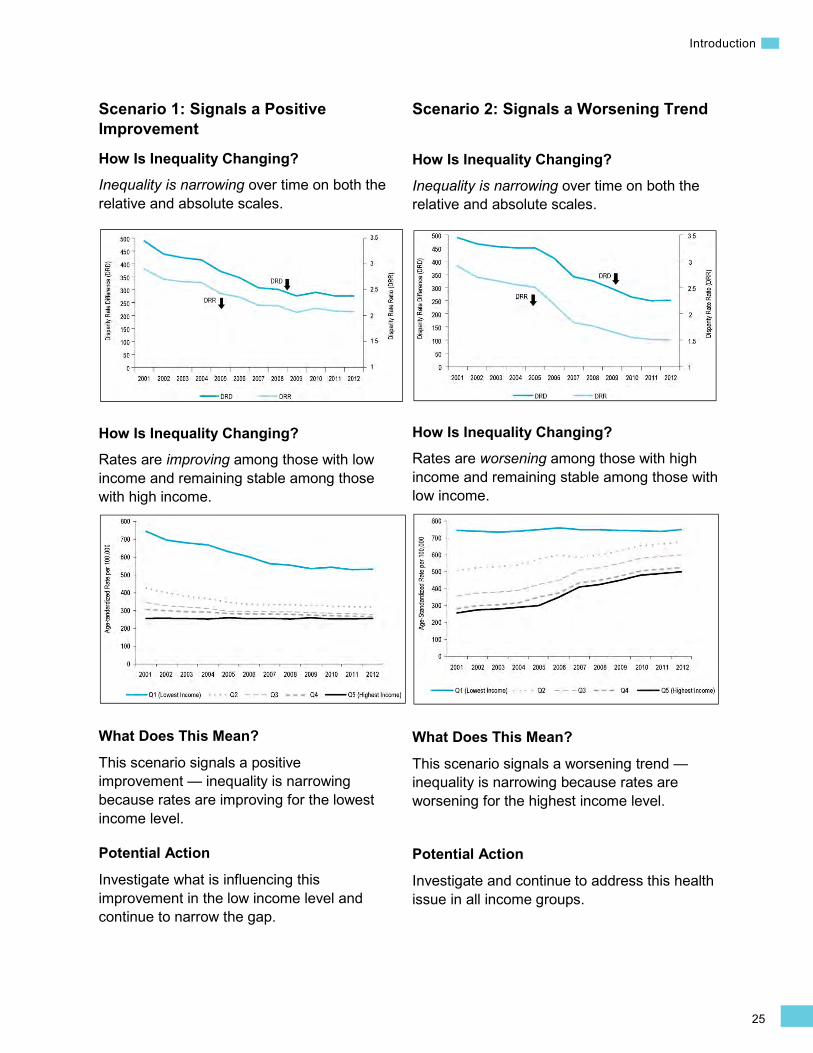
Scenario 1: Signals a Positive Improvement
How Is Inequality Changing? Inequality is narrowing over time on both the relative and absolute scales.
How Is Inequality Changing? Rates are improving among those with low income and remaining stable among those with high income.
What Does This Mean?
This scenario signals a positive improvement — inequality is narrowing because rates are improving for the lowest income level.
Potential Action
Investigate what is influencing this improvement in the low income level and continue to narrow the gap.
Scenario 2: Signals a Worsening Trend
How Is Inequality Changing?
Inequality is narrowing over time on both the relative and absolute scales.
How Is Inequality Changing? Rates are worsening among those with high income and remaining stable among those with low income.
What Does This Mean?
This scenario signals a worsening trend — inequality is narrowing because rates are worsening for the highest income level.
Potential Action
Investigate and continue to address this health issue in all income groups.
26
Trends in Income-Related Health Inequalities in Canada
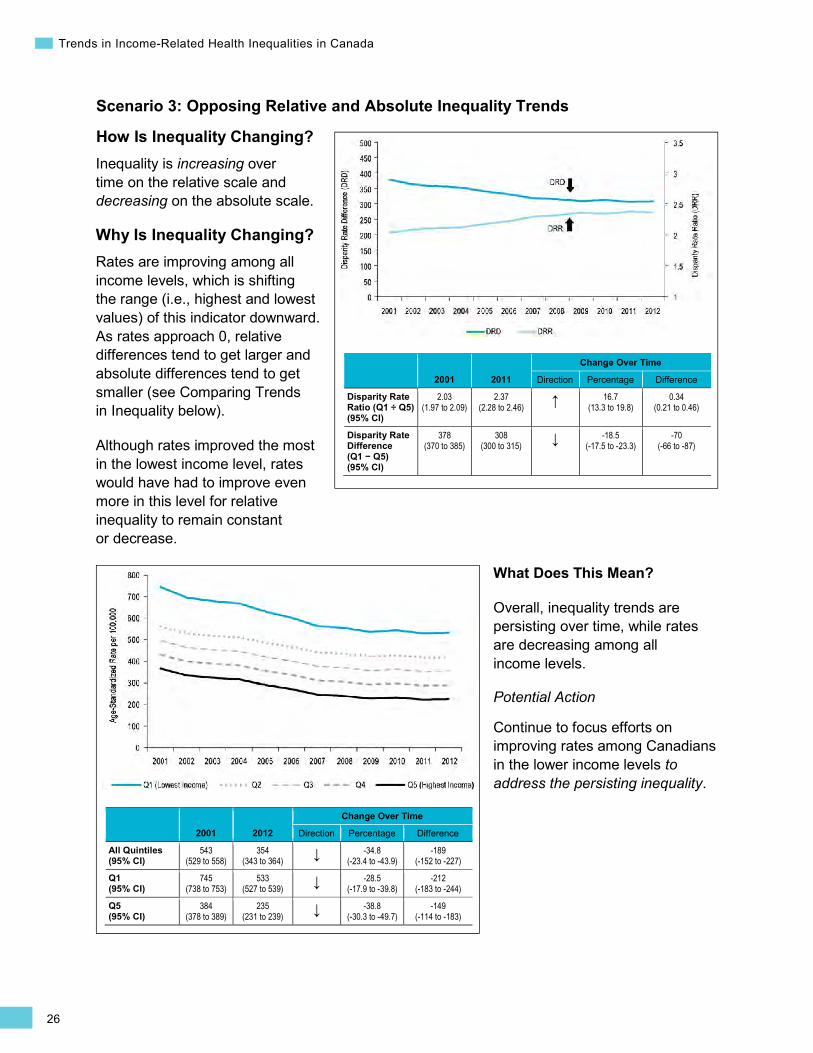
Scenario 3: Opposing Relative and Absolute Inequality Trends
How Is Inequality Changing? Inequality is increasing over time on the relative scale and decreasing on the absolute scale.
2001 2011
Change Over Time
Direction Percentage Difference
Disparity Rate Ratio (Q1 ÷ Q5) (95% CI)
2.03 (1.97 to 2.09)
2.37 (2.28 to 2.46) ↑ 16.7
(13.3 to 19.8) 0.34
(0.21 to 0.46)
Disparity Rate Difference (Q1 − Q5) (95% CI)
378 (370 to 385)
308 (300 to 315) ↓ -18.5
(-17.5 to -23.3) -70
(-66 to -87)
Why Is Inequality Changing? Rates are improving among all income levels, which is shifting the range (i.e., highest and lowest values) of this indicator downward. As rates approach 0, relative differences tend to get larger and absolute differences tend to get smaller (see Comparing Trends in Inequality below).
Although rates improved the most in the lowest income level, rates would have had to improve even more in this level for relative inequality to remain constant or decrease.
2001 2012
Change Over Time
Direction Percentage Difference
All Quintiles (95% CI)
543 (529 to 558)
354 (343 to 364) ↓ -34.8
(-23.4 to -43.9) -189
(-152 to -227)
Q1 (95% CI)
745 (738 to 753)
533 (527 to 539) ↓ -28.5
(-17.9 to -39.8) -212
(-183 to -244)
Q5 (95% CI)
384 (378 to 389)
235 (231 to 239) ↓ -38.8
(-30.3 to -49.7) -149
(-114 to -183)
What Does This Mean?
Overall, inequality trends are persisting over time, while rates are decreasing among all income levels.
Potential Action
Continue to focus efforts on improving rates among Canadians in the lower income levels to address the persisting inequality.
27
Introduction
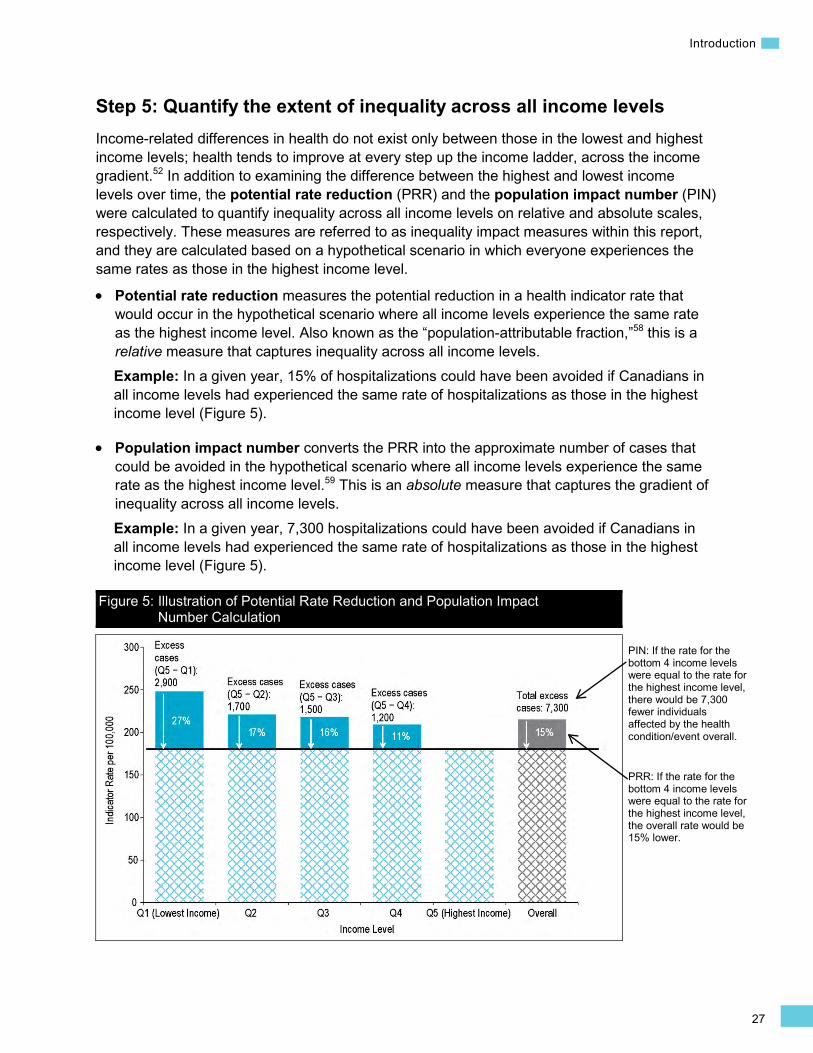
Step 5: Quantify the extent of inequality across all income levels Income-related differences in health do not exist only between those in the lowest and highest income levels; health tends to improve at every step up the income ladder, across the income gradient.52 In addition to examining the difference between the highest and lowest income levels over time, the potential rate reduction (PRR) and the population impact number (PIN) were calculated to quantify inequality across all income levels on relative and absolute scales, respectively. These measures are referred to as inequality impact measures within this report, and they are calculated based on a hypothetical scenario in which everyone experiences the same rates as those in the highest income level.
• Potential rate reduction measures the potential reduction in a health indicator rate that would occur in the hypothetical scenario where all income levels experience the same rate as the highest income level. Also known as the “population-attributable fraction,”58 this is a relative measure that captures inequality across all income levels. Example: In a given year, 15% of hospitalizations could have been avoided if Canadians in all income levels had experienced the same rate of hospitalizations as those in the highest income level (Figure 5).
• Population impact number converts the PRR into the approximate number of cases that could be avoided in the hypothetical scenario where all income levels experience the same rate as the highest income level.59 This is an absolute measure that captures the gradient of inequality across all income levels. Example: In a given year, 7,300 hospitalizations could have been avoided if Canadians in all income levels had experienced the same rate of hospitalizations as those in the highest income level (Figure 5).
Figure 5: Illustration of Potential Rate Reduction and Population Impact Number Calculation
PIN: If the rate for the bottom 4 income levels were equal to the rate for the highest income level, there would be 7,300 fewer individuals affected by the health condition/event overall.
PRR: If the rate for the bottom 4 income levels were equal to the rate for the highest income level, the overall rate would be 15% lower.
28
Trends in Income-Related Health Inequalities in Canada
Comparing Trends in Inequality This project focuses on comparing inequality trends over time within jurisdictions and within specific indicators. It should be noted that it is difficult to make valid comparisons of inequality trends across populations or between indicators, particularly when using disparity rate ratios and disparity rate differences alone.
Comparing inequality trends across populations or indicators can be problematic because inequality is a relational concept, and the potential for changes to the size of relative and absolute inequality depends on the range of the indicator. Indicators that have high rates can potentially have much higher absolute differences between income levels than indicators with lower rates. This is illustrated in the following example:
An indicator in the range of 500 per 100,000 can hypothetically have an absolute difference of 500 per 100,000 if the condition does not occur at all in the highest income level, whereas the maximum absolute difference would be much lower for an indicator in the range of 50 per 100,000.
Similarly, for indicators that capture rare events, small changes can yield large relative differences. This is illustrated in the following example:
A difference of 1 additional case per 100,000 in the lowest income level can make up a relative difference of 25% or 2%, depending on the range of the indicator:
• DRR1: Q1 ÷ Q5 = 5 per 100,000 ÷ 4 per 100,000 = 1.25 • DRR2: Q1 ÷ Q5 = 50 per 100,000 ÷ 49 per 100,000 = 1.02
Approach for Identifying Examples of Interventions An additional objective of this report is to describe promising interventions for reducing income-related health inequalities in Canada. When assessing interventions to reduce income-related health inequalities, 2 main challenges include the paucity of data specifically linking interventions to improvements in health inequalities and the inherent difficulty associated with reaching the most vulnerable segments of the population. Despite these limitations, examples of interventions to reduce (or with the potential to reduce) income-related health inequalities were identified for most indicators in this report. When assessing these approaches, several factors were considered, including whether the approach is universal or targeted, whether it is intersectoral, the level of implementation, the implementation setting (i.e., within or outside of the health care system) and the target population. It is well-understood that comprehensive strategies that include a variety of approaches, such as those highlighted in this report, are needed to address income-related health inequalities.
Interventions can be universally applied to the population or targeted at specific populations, such as Canadians with low income. Universal programs that apply to all Canadians are important for establishing a safety net and providing universal access to essential services, such as income protection programs for anyone unable to work. Universal interventions, however, have the potential to increase inequalities (e.g., those with greater socio-economic resources may have more opportunities to access available programs).60, 61 Despite this

29
Introduction
potential disadvantage, universal interventions to promote health are a key component of health promotion strategies. See Box 2 for further discussion of a commonly used type of universal intervention — fiscal measures.
Targeted interventions are an important component of approaches to reduce health inequalities, as they have the potential to reduce inequalities by specifically improving the health of vulnerable groups.62 They can, however, further stigmatize vulnerable groups by singling them out as people who need additional help.63 Moreover, targeted interventions do not address inequalities across the income gradient. Generally, it is agreed that a combination of universal and targeted approaches is necessary to comprehensively address inequalities in health.64, 65
The importance of highlighting interventions within and outside of the health system was also taken into account when selecting approaches described in this report. Intersectoral collaboration, for example, is particularly relevant to addressing inequalities influenced by multiple risk factors.66 For example, successful strategies to reduce inequalities in obesity require attention be paid to not only health behaviours but also to living and working conditions, including features of the physical environment, such as walkability and access to healthy foods and green space.67, 68 The featured interventions aim to showcase work under way in different Canadian jurisdictions at different policy levels that take multiple approaches to improving the health of various population groups at various stages throughout the life course.
This document is not a comprehensive, systematic review. This work identifies examples of established interventions along with promising interventions that have the potential to reduce income-related health inequalities. The primary criterion for including an intervention was its relevance to income-related health inequalities. A balance was struck between showcasing established interventions with a history of rigorous evaluation and more recent, innovative approaches that are still undergoing evaluation or where evaluation data has not been shared. Because attempts were made to balance different goals when selecting interventions, the one selected for any particular indicator may not be the intervention with the most rigorous evaluation; it may instead aim to speak to an approach not highlighted elsewhere in the report. For further details on the methodology for scanning and selecting interventions, please refer to the Methodology Notes.
30
Trends in Income-Related Health Inequalities in Canada
Box 2: Universal Interventions to Reduce Inequalities — The Example of Fiscal Measures Fiscal measures, such as taxation and price increases, are among a number of universal interventions implemented by governments to promote health in the overall population. Specifically, fiscal measures serve as financial incentives that promote healthy behaviours (or deter unhealthy behaviours). For example, the WHO identified increased cigarette prices as the most effective approach among a number of tobacco control policies to reduce population rates of smoking and associated health consequences.69 Recently, fiscal approaches have also been implemented in other key areas of public health, such as increases to minimum unit pricing of alcohol in several Canadian provinces, including British Columbia and Saskatchewan.70, 71 A number of international72, 73 and Canadian scientific organizations74–77 and jurisdictions (e.g., British Columbia,78 Alberta,79 Quebec80) have recently called for the implementation of a tax on sugar-sweetened beverages as part of a comprehensive approach to reduce demand for unhealthy foods and beverages and to decrease population levels of obesity.
An important consideration when implementing universal interventions is their potential for differential impact on various socio-economic groups.81, 82 For example, if a fiscal policy such as increased cigarette pricing imposes a disproportionate financial burden on low-income Canadians, it can be considered regressive. However, if such a policy results in greater health benefits for low-income groups compared with the general population (e.g., greater rates of quitting or lowering consumption of cigarettes), then the associated health benefits can be viewed as having a progressive public health impact.83–86 While increased tobacco prices have been identified as holding strong potential to reduce socio-economic inequalities in smoking84, 87, 88 and have been introduced across Canada in recent decades,89, 90 significant socio-economic inequalities related to smoking persist.91–94
These trends highlight the challenges faced by universal interventions in addressing issues of health equity and underscore the need to explicitly factor equity into all stages of the policy planning, implementation and evaluation process.81, 86, 95, 96 Equity-focused impact assessments are tools that can be built into the decision-making process to evaluate the possible unintended effects of interventions on various population groups, and to identify the possibility for exacerbating existing health inequalities.97, 98 Additionally, in contrast to the ample evidence on effective approaches to address unhealthy behaviours, such as smoking and its associated health outcomes in the overall population,69 the evidence base on what works best to reduce socio-economic inequalities remains limited.87, 95 As a result, calls have been made for future research to explore which types of interventions widen or reduce inequalities.82, 96 There is general agreement that a combination of universal and targeted approaches, such as earmarking tax revenues from increased cigarette prices for smoking cessation supports targeted at low-income groups, is likely to be most effective at positively affecting the health profile in the overall population and at reducing health inequalities.65, 81, 84, 96
31
Section 1: Structural Factors Influencing Health—A Focus on Income
Section 1: Structural Factors Influencing Health — A Focus on Income Structural factors influencing health encompass a wide range of factors that influence an individual’s position in the social and economic hierarchy, which in turn has a substantial influence on opportunities for health.29 As the name implies, structural factors include the broader socio-economic and political contexts in which people live. Income, a central determinant of socio-economic status, affects health in multiple and complex ways.99–101 In this report, trends in income-related health inequalities are analyzed by examining differences by income level across a variety of indicators, including those related to early life, health behaviours, health system use and health and well-being outcomes. Using a variety of morbidity and mortality outcome measures, research on health inequalities has consistently shown that individuals with higher income tend to have better health outcomes; this is the socio-economic gradient in health.14, 21, 102, 103 For example, the Canadian mortality follow-up study, which linked census data to mortality outcomes for a large cohort, showed that lower income was associated with higher age-standardized mortality rates.102 Income inequality (i.e., the distribution of income across the population) must also be considered: people living in places with higher degrees of income inequality tend to experience worse health outcomes.100, 104–106
Income is a key determinant of socio-economic status (SES). SES plays a critical role in determining the resources and supports available to promote health and helps to explain the pathways that ultimately lead to inequalities in health outcomes.29, 99, 107 Furthermore, both absolute and relative income levels impact health; absolute income refers to an individual’s ability to purchase goods necessary to maintain health, while relative income refers to an individual’s income in comparison with that of others, which reflects the degree of inequality in the population.100, 106
As outlined in the WHO CSDH, the relationship between income and health can be explained in the following ways:
• Individual income: Income inequality means that individuals with lower incomes have less money to invest in health-promoting resources (e.g., less money available to purchase healthy food or acquire acceptable housing).
• Social status: Social hierarchies within a society are reinforced by income inequality, which leads to chronic stress and poorer health for people at the bottom.
• Reverse association (i.e., impact of health on income): Poor health interferes with an individual’s ability to secure and maintain employment, thus limiting his or her income-earning potential.
• Social cohesion: Income inequality leads to a decrease in the social bonds that exist between people in a society, leading to an increase in unhealthy conditions (e.g., an increase in crime).
• Social disinvestment: In lower-income neighbourhoods, fewer resources are invested in the social and physical environment to create health-promoting conditions (e.g., less money is spent on maintaining and updating schools).29
32
Trends in Income-Related Health Inequalities in Canada
Using a variety of measures, recent reports have illustrated growing income inequality in Canada.108–110 The negative impacts of income inequality extend beyond health and are not limited to just those at the bottom of the income distribution. Higher income inequality can contribute to lower economic growth.111, 112 Income inequality can lead to decreased investment in education by lower-income individuals, thus limiting their ability to contribute to the economy and decreasing their social mobility or hindering merit-based economic mobility.108, 111 Income inequality also has consequences for the social environment. For example, high income inequality is associated with reduced trust and civic participation and higher crime rates.113–117 Thus the impact of income inequality has consequences for all of society, including individuals, communities, organizations, structures and systems.114
Indicator Notes Data Source Survey of Labour and Income Dynamics, Income Statistics Division, Statistics Canada
Inequality Disaggregator Quintiles (based on the distribution of individual after-tax income)
Time Period 1976 to 2011
Please refer to Trends in Income-Related Health Inequalities in Canada: Indicator Definitions for detailed technical notes.
Additional Data National and provincial data for the complete time period and for the middle income quintiles (Quintile 2 to Quintile 4) is not presented in this report. This data is available on CIHI’s website in the form of downloadable tables.
Symbols and Abbreviations
* Estimate is statistically significant (i.e., statistically different from 1 for Income Ratio (IR) or different from 0 for Income Difference (ID), Change Over Time Percentage and Change Over Time Difference, based on the 95% CI)
Q1 Quintile 1 (lowest income quintile)
Q5 Quintile 5 (highest income quintile)
95% CI 95% confidence interval
↑ Statistically significant increase between 1993 estimate and 2011 estimate
↓ Statistically significant decrease between 1993 estimate and 2011 estimate
— No statistically significant change between 1993 estimate and 2011 estimate
Additional Note Income ratio is also known as income quintile share ratio (S80 ÷ S20).a, b
a. European Commission. Quality of life indicators — material living conditions. Eurostat. http://ec.europa.eu/eurostat/statistics-explained/index.php/Quality_of_life_indicators_-_material_living_conditions. Accessed March 2, 2015.
b. Organisation for Economic Co-operation and Development. Growing Unequal? Income Distribution and Poverty in OECD Countries. Paris, France: OECD; 2008.
33
Section 1: Structural Factors Influencing Health—A Focus on Income
Income Inequality Over Time Examining how the income gap between the highest and lowest income levels has changed over time and varies by province provides some contextual basis for interpreting the income-related health indicator trends presented later in this report. To accomplish this, the following analysis examines Individual After-Tax Income trends by income quintile over time in 2011 constant dollars. For consistency and comparability with income-related health inequality analyses shown elsewhere in the report, the gap between the highest and lowest income quintiles is quantified using relative (ratio-based) and absolute (difference-based) measures. For more information regarding the methods used in this report, please refer to the Introduction or the Methodology Notes.
How Did Income Inequality Change Between 1976 and 2011?
Since the mid-1990s, income inequality has been increasing in Canada, primarily due to greater income gains among Canadians in the highest income level compared with those in the lower income levels.
Trends by Income Level
• Between 1976 and the mid-1990s, after-tax income remained relatively constant within income levels.
• Between 1993 and 2011, after-tax income increased by 43.5% or $26,400 for Canadians in the highest income level.
• In comparison, after-tax income increased by 27% or $3,400 for Canadians in the lowest income level during this same period.

34
Trends in Income-Related Health Inequalities in Canada
Figure 6: Individual After-Tax Income (2011 Constant Canadian Dollars), by Quintile, Canada, 1976 to 2011
1976 1993 2011 Change Over Time
Direction Percentage Difference All Quintiles (95% CI)
33,200 32,800 (32,600 to 33,000)
44,500 (44,100 to 44,900)
↑ 35.7* (34.2 to 37.2)
11,700* (11,200 to 12,200)
Q1 (95% CI)
12,000 12,600 (12,400 to 12,800)
16,000 (15,700 to 16,300)
↑ 27.0* (23.9 to 30.0)
3,400* (3,000 to 3,800)
Q5 (95% CI)
62,400 60,700 (60,000 to 61,500)
87,100 (85,600 to 88,500)
↑ 43.5* (40.6 to 46.4)
26,400* (24,800 to 28,000)
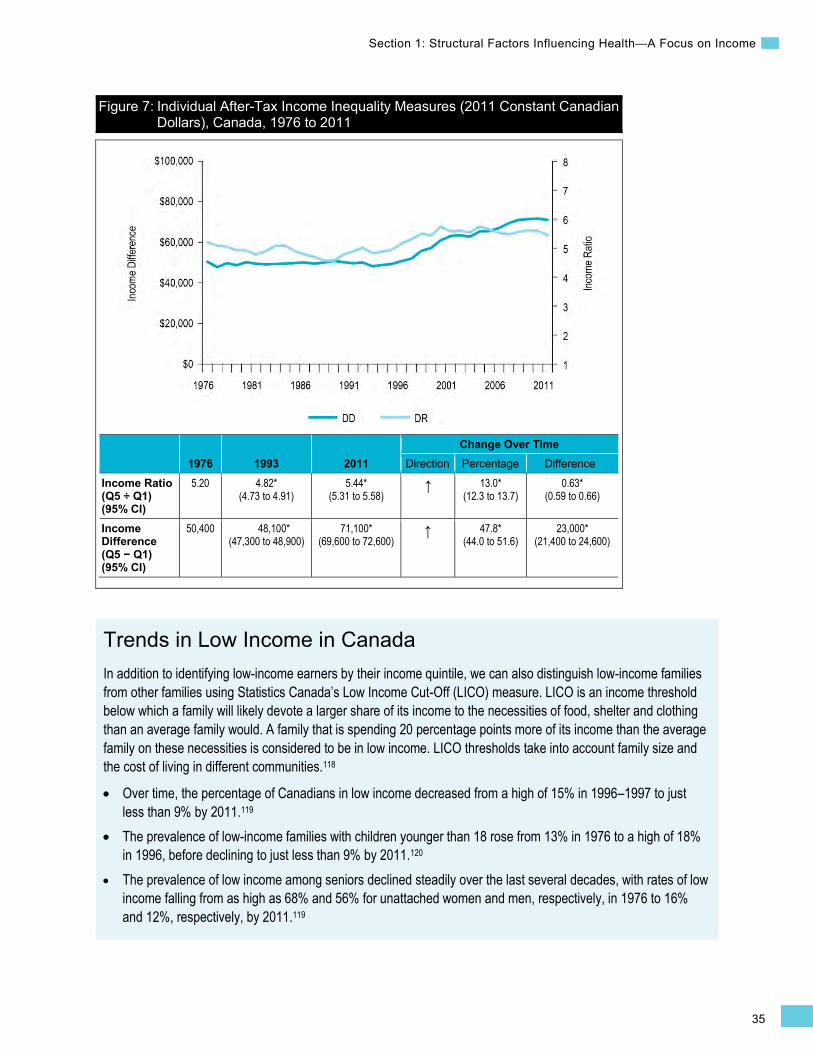
Trends in Income Inequality
• Between 1976 and the mid-1990s, income inequality remained constant on the absolute scale; there were some fluctuations on the relative scale (95% confidence limits are not available prior to 1993).
• Between 1993 and 2011, income inequality increased on both the relative and absolute scales. • In 1993, Canadians in the highest income level earned approximately 4.82 times or $48,100
more than those in the lowest income level. • In 2011, Canadians in the highest income level earned approximately 5.44 times or $71,100
more than those in the lowest income level.
35
Section 1: Structural Factors Influencing Health—A Focus on Income
Figure 7: Individual After-Tax Income Inequality Measures (2011 Constant Canadian Dollars), Canada, 1976 to 2011
1976 1993 2011 Change Over Time
Direction Percentage Difference
Income Ratio (Q5 ÷ Q1) (95% CI)
5.20 4.82* (4.73 to 4.91)
5.44* (5.31 to 5.58)
↑ 13.0* (12.3 to 13.7)
0.63* (0.59 to 0.66)
Income Difference (Q5 − Q1) (95% CI)
50,400 48,100* (47,300 to 48,900)
71,100* (69,600 to 72,600)
↑ 47.8* (44.0 to 51.6)
23,000* (21,400 to 24,600)
Trends in Low Income in Canada In addition to identifying low-income earners by their income quintile, we can also distinguish low-income families from other families using Statistics Canada’s Low Income Cut-Off (LICO) measure. LICO is an income threshold below which a family will likely devote a larger share of its income to the necessities of food, shelter and clothing than an average family would. A family that is spending 20 percentage points more of its income than the average family on these necessities is considered to be in low income. LICO thresholds take into account family size and the cost of living in different communities.118
• Over time, the percentage of Canadians in low income decreased from a high of 15% in 1996–1997 to just less than 9% by 2011.119
• The prevalence of low-income families with children younger than 18 rose from 13% in 1976 to a high of 18% in 1996, before declining to just less than 9% by 2011.120
• The prevalence of low income among seniors declined steadily over the last several decades, with rates of low income falling from as high as 68% and 56% for unattached women and men, respectively, in 1976 to 16% and 12%, respectively, by 2011.119
36
Trends in Income-Related Health Inequalities in Canada
Addressing Income Inequality
Income inequality has risen substantially in Canada since the mid-1990s, due to a rise in earnings in the highest income level. Rising income inequality in Canada and globally is driven primarily by growth in employment earnings at the top of the income distribution outpacing that at the bottom of the income distribution.121, 122 Between 2008 and 2012, the median income of the top 1% of Canadian tax filers increased from $291,000 to $299,000.123 Between 1982 and 2004, the average income of the top 1% of Canadian income tax filers increased by 59%, and the income of the top 0.01% increased by 104%.110
Other potential drivers of income inequality include the increasing prevalence of high-income dual-earner families, changes to policies that lowered tax rates for the highest-income Canadians, cuts to social assistance and reductions of benefits associated with employment insurance.7, 109, 121, 124–126
A variety of approaches for mitigating income inequality exist, including the following:
Income redistribution through taxes and transfers refers to transferring income using social mechanisms such as taxation, monetary policies and social assistance. Redistribution is the most direct policy tool to reduce income inequality without negatively affecting economic growth.112, 127, 128
Examples of transfer programs that help to reduce income inequality through targeted tax credits include
• The National Child Benefit Supplement, which provides extra support to low-income families with children by topping up the monthly payments they receive under the Canada Child Tax Benefit system; and
• The Working Income Tax Benefit, which is a refundable tax credit intended to provide tax relief to eligible working low-income individuals and families who are already in the workforce and to encourage other Canadians to enter the workforce.
These particular transfers are funded through progressive taxation and redistribute billions of dollars annually, which can have a large impact on income inequality.129, 130
In addition, a number of other government programs supplement the income of individuals, including Old Age Security (OAS), Guaranteed Income Supplement (GIS), the Canada Pension Plan (CPP) and the Quebec Pension Plan (QPP). These programs have been shown to reduce poverty among seniors and income inequality.131, 132
A guaranteed annual income provides an individual or family with a minimum cash benefit regardless of employment status; this cash benefit decreases as earned income increases. A pilot study of a guaranteed annual income was implemented in a Manitoba town in the 1970s; this research found that providing a guaranteed annual income improved high school completion rates and reduced hospitalization rates.133, 134
•
37
Section 1: Structural Factors Influencing Health—A Focus on Income
Labour market policies are government interventions to help people find and secure employment. For example, minimum wage policies can increase the income of those with the lowest earnings. The population groups most likely to earn the minimum wage include youth, women, individuals with lower levels of education and part-time workers.135
Investment in education and training programs could help reduce income inequality by increasing employment opportunities and earnings mobility, particularly among low-skilled workers.136–138
Poverty reduction measures, including reducing expenses that put financial pressure on low-income families such as transportation costs and the costs associated with child care, can also address income inequality.139 Reducing poverty addresses income inequality by increasing the income of those at the bottom of the income distribution and is also identified as an important approach to improving health and reducing inequalities in health outcomes.140–142
Most provinces and territories in Canada have poverty reduction plans in place.143, 144 Early results from Newfoundland and Labrador’s poverty reduction plan indicate success at reducing both the prevalence and the depth of low income. In particular, the percentage of people with low income as measured by the LICO (a rate that varies based on year and location) fell from 12.2% in 2003 to 5.3% by 2011.145
Low income is tied to many different conditions that threaten health. Poverty reduction therefore has the potential to address a number of income-related inequalities in health indicators presented throughout this report. For an example, refer to Box 8 in the Food Insecurity chapter for a more detailed description linking Newfoundland and Labrador’s poverty reduction plan to food insecurity outcomes.
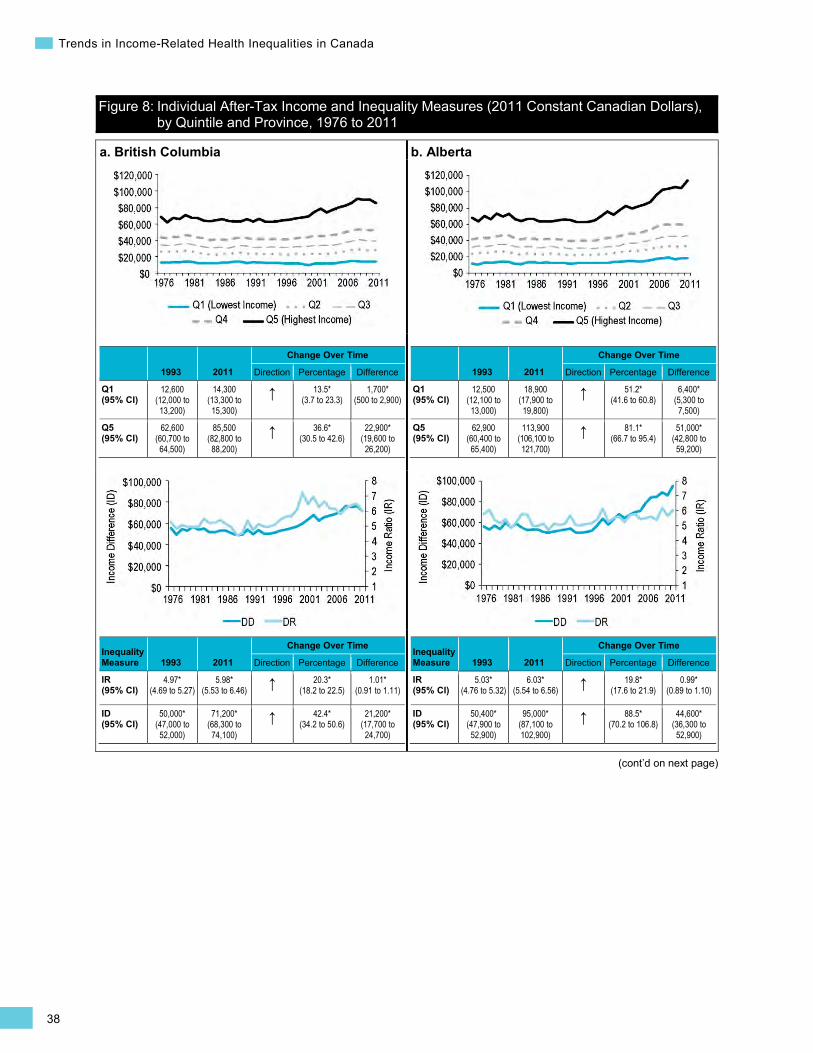
How Did Income Inequality Change Between 1976 and 2011 in the Provinces?
• Income inequality remained relatively stable in all provinces between 1976 and the mid-1990s. • Between 1993 and 2011, income inequality increased in all provinces, primarily due to higher
gains in income among Canadians in the highest income level. • On the absolute scale, increases in inequality were the largest in Alberta and Newfoundland and
Labrador, where the income gap increased by approximately $44,600 and $29,700, respectively.
38
Trends in Income-Related Health Inequalities in Canada
(cont’d on next page)
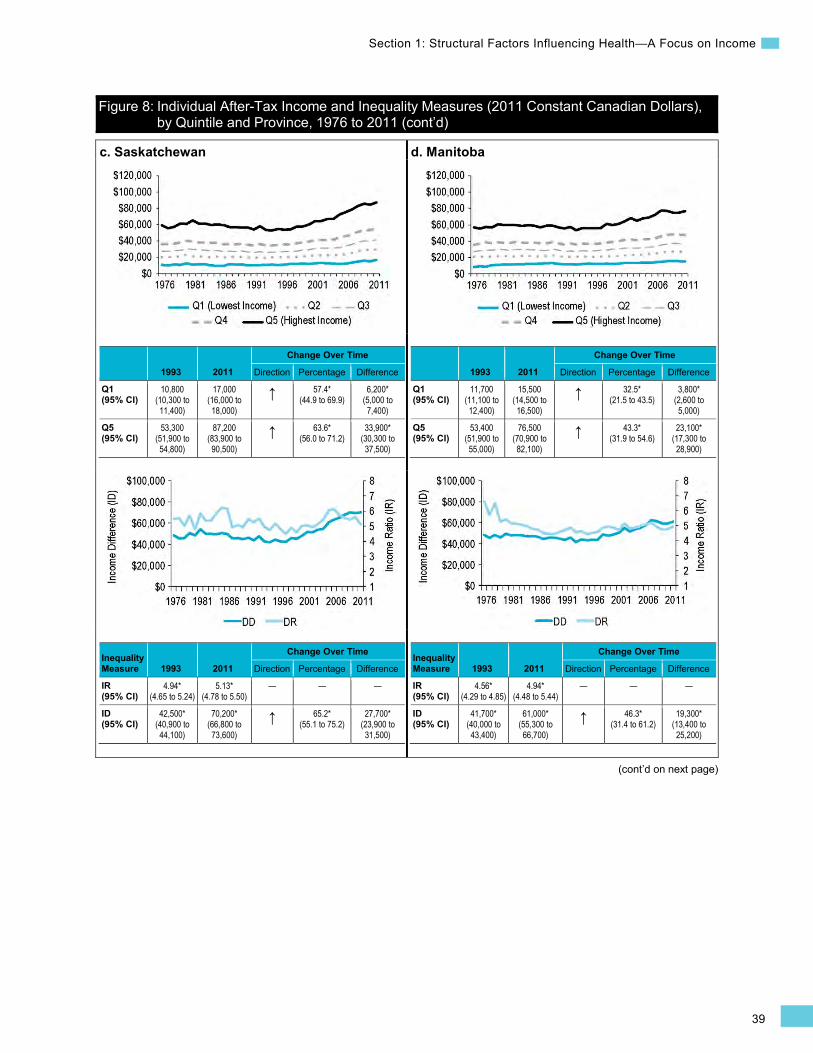
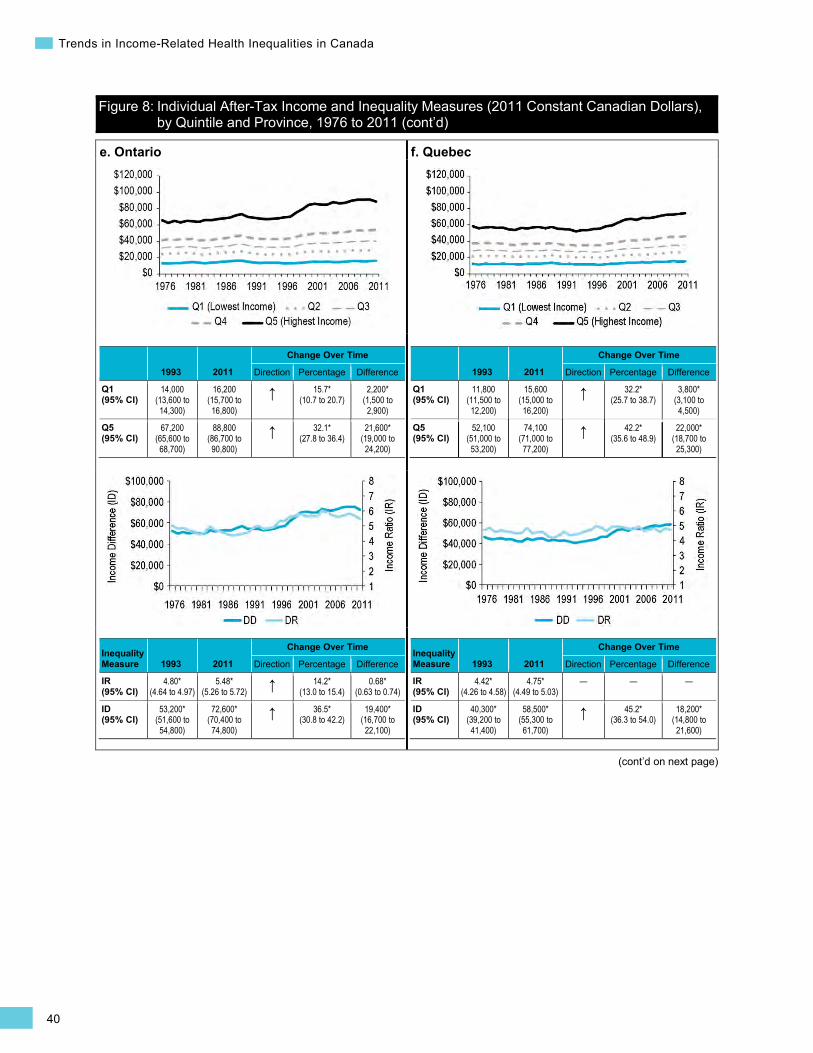
Figure 8: Individual After-Tax Income and Inequality Measures (2011 Constant Canadian Dollars), by Quintile and Province, 1976 to 2011
a. British Columbia
1993 2011
Change Over Time
Direction Percentage Difference
Q1 (95% CI)
12,600 (12,000 to 13,200)
14,300 (13,300 to 15,300)
↑ 13.5* (3.7 to 23.3)
1,700* (500 to 2,900)
Q5 (95% CI)
62,600 (60,700 to 64,500)
85,500 (82,800 to 88,200)
↑ 36.6* (30.5 to 42.6)
22,900* (19,600 to 26,200)
Inequality Measure 1993 2011
Change Over Time
Direction Percentage Difference
IR (95% CI)
4.97* (4.69 to 5.27)
5.98* (5.53 to 6.46) ↑ 20.3*
(18.2 to 22.5) 1.01*
(0.91 to 1.11)
ID (95% CI)
50,000* (47,000 to 52,000)
71,200* (68,300 to 74,100)
↑ 42.4* (34.2 to 50.6)
21,200* (17,700 to 24,700)
b. Alberta
1993 2011
Change Over Time
Direction Percentage Difference
Q1 (95% CI)
12,500 (12,100 to 13,000)
18,900 (17,900 to 19,800)
↑ 51.2* (41.6 to 60.8)
6,400* (5,300 to 7,500)
Q5 (95% CI)
62,900 (60,400 to 65,400)
113,900 (106,100 to 121,700)
↑ 81.1* (66.7 to 95.4)
51,000* (42,800 to 59,200)
Inequality Measure 1993 2011
Change Over Time
Direction Percentage Difference
IR (95% CI)
5.03* (4.76 to 5.32)
6.03* (5.54 to 6.56) ↑ 19.8*
(17.6 to 21.9) 0.99*
(0.89 to 1.10)
ID (95% CI)
50,400* (47,900 to 52,900)
95,000* (87,100 to 102,900)
↑ 88.5* (70.2 to 106.8)
44,600* (36,300 to 52,900)
39
Section 1: Structural Factors Influencing Health—A Focus on Income
(cont’d on next page)
c. Saskatchewan
1993 2011
Change Over Time
Direction Percentage Difference
Q1 (95% CI)
10,800 (10,300 to 11,400)
17,000 (16,000 to 18,000)
↑ 57.4* (44.9 to 69.9)
6,200* (5,000 to 7,400)
Q5 (95% CI)
53,300 (51,900 to 54,800)
87,200 (83,900 to 90,500)
↑ 63.6* (56.0 to 71.2)
33,900* (30,300 to 37,500)
Inequality Measure 1993 2011
Change Over Time
Direction Percentage Difference
IR (95% CI)
4.94* (4.65 to 5.24)
5.13* (4.78 to 5.50)
— — —
ID (95% CI)
42,500* (40,900 to 44,100)
70,200* (66,800 to 73,600)
↑ 65.2* (55.1 to 75.2)
27,700* (23,900 to 31,500)
d. Manitoba
1993 2011
Change Over Time
Direction Percentage Difference
Q1 (95% CI)
11,700 (11,100 to 12,400)
15,500 (14,500 to 16,500)
↑ 32.5* (21.5 to 43.5)
3,800* (2,600 to 5,000)
Q5 (95% CI)
53,400 (51,900 to 55,000)
76,500 (70,900 to 82,100)
↑ 43.3* (31.9 to 54.6)
23,100* (17,300 to 28,900)
Inequality Measure 1993 2011
Change Over Time
Direction Percentage Difference
IR (95% CI)
4.56* (4.29 to 4.85)
4.94* (4.48 to 5.44)
— — —
ID (95% CI)
41,700* (40,000 to 43,400)
61,000* (55,300 to 66,700)
↑ 46.3* (31.4 to 61.2)
19,300* (13,400 to 25,200)
Figure 8: Individual After-Tax Income and Inequality Measures (2011 Constant Canadian Dollars), by Quintile and Province, 1976 to 2011 (cont’d)
40
Trends in Income-Related Health Inequalities in Canada
Figure 8: Individual After-Tax Income and Inequality Measures (2011 Constant Canadian Dollars), by Quintile and Province, 1976 to 2011 (cont’d)
(cont’d on next page)
e. Ontario
1993 2011
Change Over Time
Direction Percentage Difference
Q1 (95% CI)
14,000 (13,600 to 14,300)
16,200 (15,700 to 16,800)
↑ 15.7* (10.7 to 20.7)
2,200* (1,500 to 2,900)
Q5 (95% CI)
67,200 (65,600 to 68,700)
88,800 (86,700 to 90,800)
↑ 32.1* (27.8 to 36.4)
21,600* (19,000 to 24,200)
Inequality Measure 1993 2011
Change Over Time
Direction Percentage Difference
IR (95% CI)
4.80* (4.64 to 4.97)
5.48* (5.26 to 5.72) ↑ 14.2*
(13.0 to 15.4) 0.68*
(0.63 to 0.74)
ID (95% CI)
53,200* (51,600 to 54,800)
72,600* (70,400 to 74,800)
↑ 36.5* (30.8 to 42.2)
19,400* (16,700 to 22,100)
f. Quebec
1993 2011
Change Over Time
Direction Percentage Difference
Q1 (95% CI)
11,800 (11,500 to 12,200)
15,600 (15,000 to 16,200)
↑ 32.2* (25.7 to 38.7)
3,800* (3,100 to 4,500)
Q5 (95% CI)
52,100 (51,000 to 53,200)
74,100 (71,000 to 77,200)
↑ 42.2* (35.6 to 48.9)
22,000* (18,700 to 25,300)
Inequality Measure 1993 2011
Change Over Time
Direction Percentage Difference
IR (95% CI)
4.42* (4.26 to 4.58)
4.75* (4.49 to 5.03)
— — —
ID (95% CI)
40,300* (39,200 to 41,400)
58,500* (55,300 to 61,700)
↑ 45.2* (36.3 to 54.0)
18,200* (14,800 to 21,600)
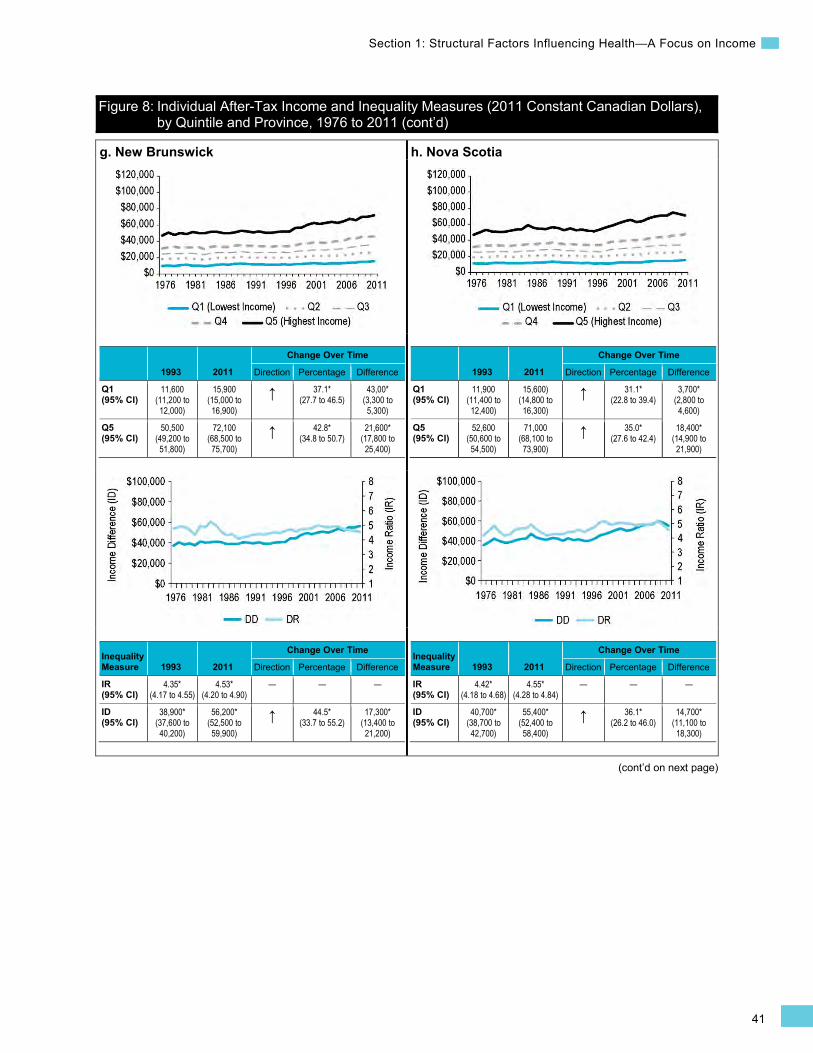
41
Section 1: Structural Factors Influencing Health—A Focus on Income
Figure 8: Individual After-Tax Income and Inequality Measures (2011 Constant Canadian Dollars), by Quintile and Province, 1976 to 2011 (cont’d)
(cont’d on next page)
g. New Brunswick
1993 2011
Change Over Time
Direction Percentage Difference
Q1 (95% CI)
11,600 (11,200 to 12,000)
15,900 (15,000 to 16,900)
↑ 37.1* (27.7 to 46.5)
43,00* (3,300 to 5,300)
Q5 (95% CI)
50,500 (49,200 to 51,800)
72,100 (68,500 to 75,700)
↑ 42.8* (34.8 to 50.7)
21,600* (17,800 to 25,400)
Inequality Measure 1993 2011
Change Over Time
Direction Percentage Difference
IR (95% CI)
4.35* (4.17 to 4.55)
4.53* (4.20 to 4.90)
— — —
ID (95% CI)
38,900* (37,600 to 40,200)
56,200* (52,500 to 59,900)
↑ 44.5* (33.7 to 55.2)
17,300* (13,400 to 21,200)
h. Nova Scotia
1993 2011
Change Over Time
Direction Percentage Difference
Q1 (95% CI)
11,900 (11,400 to 12,400)
15,600) (14,800 to 16,300)
↑ 31.1* (22.8 to 39.4)
3,700* (2,800 to 4,600)
Q5 (95% CI)
52,600 (50,600 to 54,500)
71,000 (68,100 to 73,900)
↑ 35.0* (27.6 to 42.4)
18,400* (14,900 to 21,900)
Inequality Measure 1993 2011
Change Over Time
Direction Percentage Difference
IR (95% CI)
4.42* (4.18 to 4.68)
4.55* (4.28 to 4.84)
— — —
ID (95% CI)
40,700* (38,700 to 42,700)
55,400* (52,400 to 58,400)
↑ 36.1* (26.2 to 46.0)
14,700* (11,100 to 18,300)
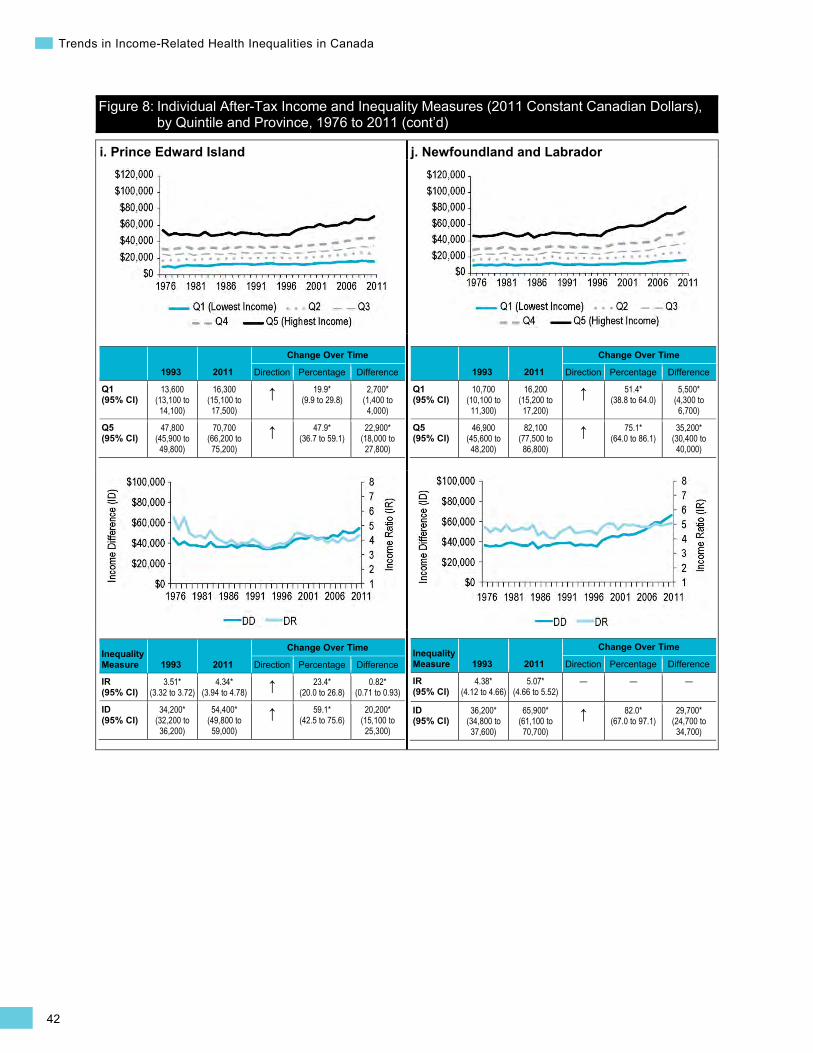
42
Trends in Income-Related Health Inequalities in Canada
Figure 8: Individual After-Tax Income and Inequality Measures (2011 Constant Canadian Dollars), by Quintile and Province, 1976 to 2011 (cont’d)
i. Prince Edward Island
1993 2011
Change Over Time
Direction Percentage Difference
Q1 (95% CI)
13,600 (13,100 to 14,100)
16,300 (15,100 to 17,500)
↑ 19.9* (9.9 to 29.8)
2,700* (1,400 to 4,000)
Q5 (95% CI)
47,800 (45,900 to 49,800)
70,700 (66,200 to 75,200)
↑ 47.9* (36.7 to 59.1)
22,900* (18,000 to 27,800)
Inequality Measure 1993 2011
Change Over Time
Direction Percentage Difference
IR (95% CI)
3.51* (3.32 to 3.72)
4.34* (3.94 to 4.78) ↑ 23.4*
(20.0 to 26.8) 0.82*
(0.71 to 0.93)
ID (95% CI)
34,200* (32,200 to 36,200)
54,400* (49,800 to 59,000)
↑ 59.1* (42.5 to 75.6)
20,200* (15,100 to 25,300)
j. Newfoundland and Labrador
1993 2011
Change Over Time
Direction Percentage Difference
Q1 (95% CI)
10,700 (10,100 to 11,300)
16,200 (15,200 to 17,200)
↑ 51.4* (38.8 to 64.0)
5,500* (4,300 to 6,700)
Q5 (95% CI)
46,900 (45,600 to 48,200)
82,100 (77,500 to 86,800)
↑ 75.1* (64.0 to 86.1)
35,200* (30,400 to 40,000)
Inequality Measure 1993 2011
Change Over Time
Direction Percentage Difference
IR (95% CI)
4.38* (4.12 to 4.66)
5.07* (4.66 to 5.52)
— — —
ID (95% CI)
36,200* (34,800 to 37,600)
65,900* (61,100 to 70,700)
↑ 82.0* (67.0 to 97.1)
29,700* (24,700 to 34,700)

43
Section 1: Structural Factors Influencing Health—A Focus on Income
Interactions Between Income, Education and Employment Socio-economic status (SES) is largely determined by income, education and employment.146 These determinants of SES interact in complex ways and also vary based on other factors, such as gender, sex, race and ethnicity.147 In addition to having independent effects on health, many SES indicators interact and have a combined impact on health.148 This subsection outlines trends over time for some of the interactions between indicators of SES, including income, education and occupation. Understanding the complexity of these inequality trends and the associations among SES indicators sheds light on the complexity of income-related inequalities in other factors influencing health and health outcomes presented later in the report.
University Participation Indicator Notes Data Source Survey of Labour and Income Dynamics, Income Statistics Division, Statistics Canada
Inequality Disaggregator Parental income quintiles (before-tax income for the year preceding the survey year or self-reported income from survey)
Time Period 1993 to 2011
Please refer to Trends in Income-Related Health Inequalities in Canada: Indicator Definitions for detailed technical notes.
Unemployment Rate Indicator Notes Data Source Labour Force Survey, Statistics Canada (CANSIM Database Table 282-0004)
Inequality Disaggregator Educational attainment
Time Period 1990 to 2013
Please refer to Trends in Income-Related Health Inequalities in Canada: Indicator Definitions for detailed technical notes.
Additional Data National data for the complete time period and for the middle income quintiles (Quintile 2 to Quintile 4) is not presented in this report. This data is available on CIHI’s website in the form of downloadable tables.
Additional Note Statistical significance based on non-overlapping 95% confidence intervals was not assessed because variance estimates were not available in the source data.
Interaction Between Income and Education
Education has an impact on income and SES by increasing labour market opportunities and the likelihood of upward social mobility;149 for example, Canadians who do not complete high school can expect to make only about 80% of the earnings of a high school graduate and less than half of the earnings of a university graduate.150, 151 Education may also have a more direct impact on health through its influences on health practices, including smoking, nutrition and exercise.149 Compared with those with higher education levels, individuals with lower education levels are less likely to report being in excellent or very good health.13 Parental education is also closely tied to health, as more highly educated parents typically have more resources to provide a healthy environment and pass the value of education on to their children.153
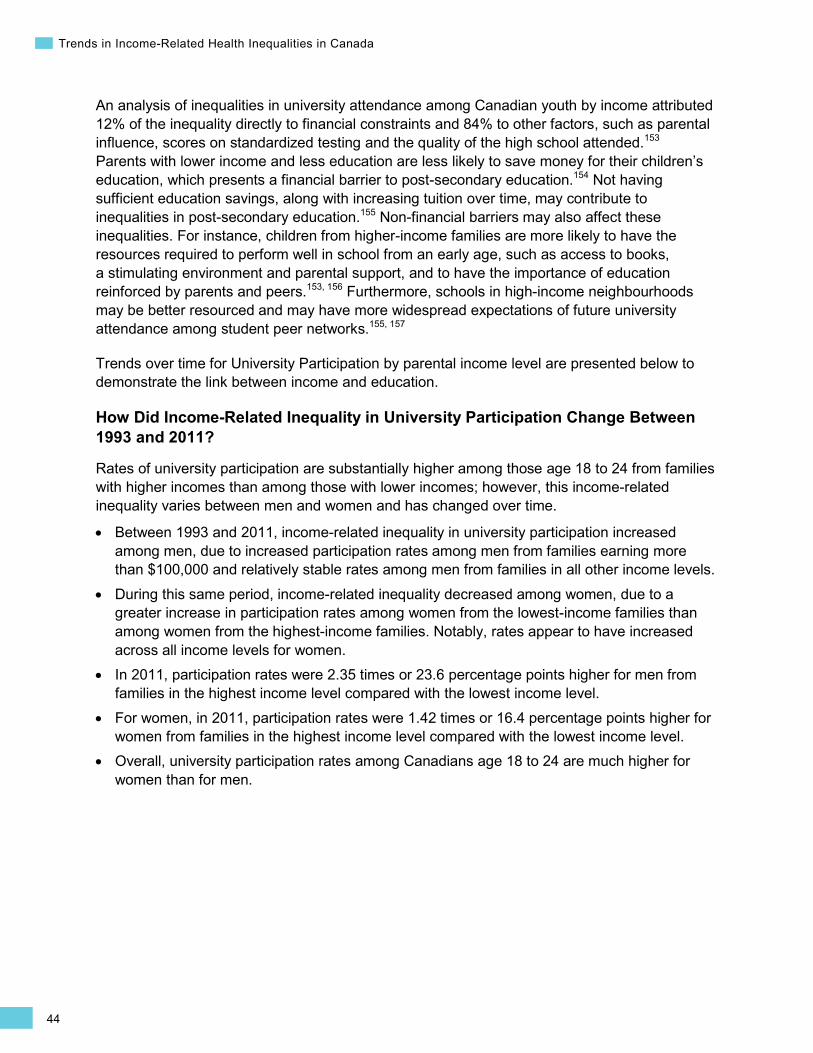
44
Trends in Income-Related Health Inequalities in Canada
An analysis of inequalities in university attendance among Canadian youth by income attributed 12% of the inequality directly to financial constraints and 84% to other factors, such as parental influence, scores on standardized testing and the quality of the high school attended.153 Parents with lower income and less education are less likely to save money for their children’s education, which presents a financial barrier to post-secondary education.154 Not having sufficient education savings, along with increasing tuition over time, may contribute to inequalities in post-secondary education.155 Non-financial barriers may also affect these inequalities. For instance, children from higher-income families are more likely to have the resources required to perform well in school from an early age, such as access to books, a stimulating environment and parental support, and to have the importance of education reinforced by parents and peers.153, 156 Furthermore, schools in high-income neighbourhoods may be better resourced and may have more widespread expectations of future university attendance among student peer networks.155, 157
Trends over time for University Participation by parental income level are presented below to demonstrate the link between income and education.
How Did Income-Related Inequality in University Participation Change Between 1993 and 2011?
Rates of university participation are substantially higher among those age 18 to 24 from families with higher incomes than among those with lower incomes; however, this income-related inequality varies between men and women and has changed over time.
• Between 1993 and 2011, income-related inequality in university participation increased among men, due to increased participation rates among men from families earning more than $100,000 and relatively stable rates among men from families in all other income levels.
• During this same period, income-related inequality decreased among women, due to a greater increase in participation rates among women from the lowest-income families than among women from the highest-income families. Notably, rates appear to have increased across all income levels for women.
• In 2011, participation rates were 2.35 times or 23.6 percentage points higher for men from families in the highest income level compared with the lowest income level.
• For women, in 2011, participation rates were 1.42 times or 16.4 percentage points higher for women from families in the highest income level compared with the lowest income level.
• Overall, university participation rates among Canadians age 18 to 24 are much higher for women than for men.
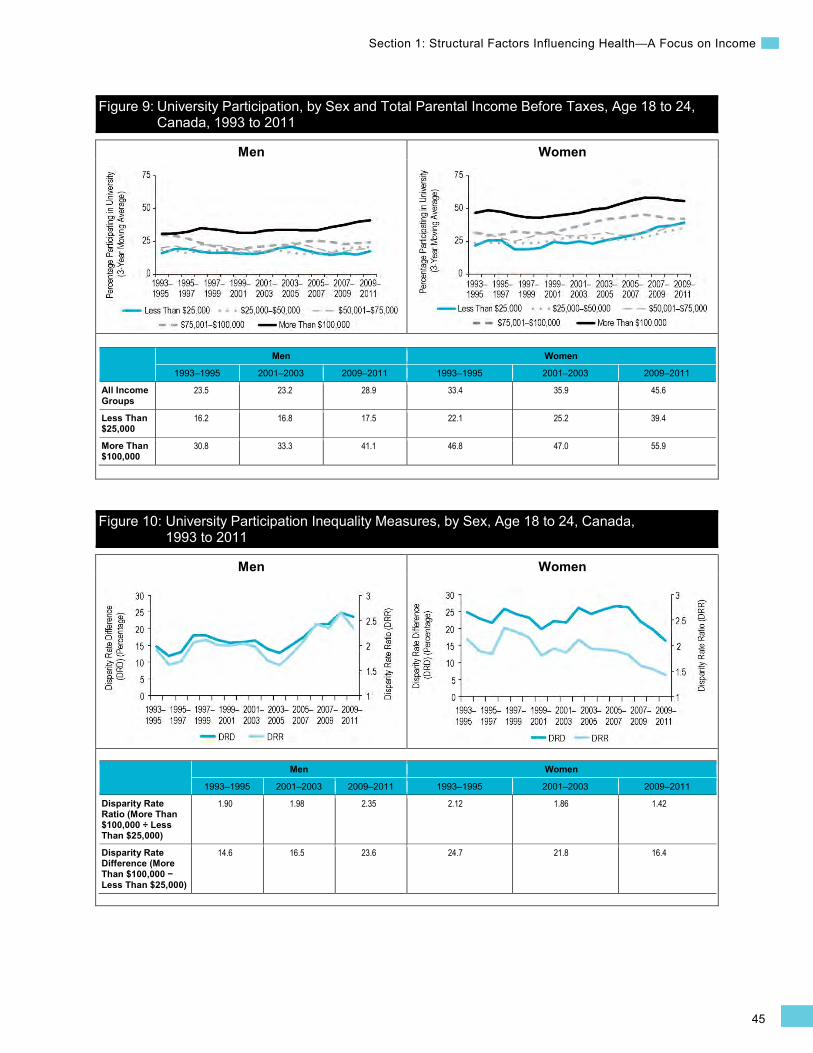
45
Section 1: Structural Factors Influencing Health—A Focus on Income
Men Women
Men Women
Figure 9: University Participation, by Sex and Total Parental Income Before Taxes, Age 18 to 24, Canada, 1993 to 2011
Men Women
1993–1995 2001–2003 2009–2011 1993–1995 2001–2003 2009–2011
All Income Groups
23.5 23.2 28.9 33.4 35.9 45.6
Less Than $25,000
16.2 16.8 17.5 22.1 25.2 39.4
More Than $100,000
30.8 33.3 41.1 46.8 47.0 55.9
Figure 10: University Participation Inequality Measures, by Sex, Age 18 to 24, Canada, 1993 to 2011
Men Women
1993–1995 2001–2003 2009–2011 1993–1995 2001–2003 2009–2011
Disparity Rate Ratio (More Than $100,000 ÷ Less Than $25,000)
1.90 1.98 2.35 2.12 1.86 1.42
Disparity Rate Difference (More Than $100,000 − Less Than $25,000)
14.6 16.5 23.6 24.7 21.8 16.4

46
Trends in Income-Related Health Inequalities in Canada
Addressing Income-Related Inequality in University Participation
Income-related inequalities in post-secondary education, including university participation, can potentially be reduced by government interventions to address financial barriers, such as those that target student financial assistance to low-income, low-education students or that provide additional incentives and mechanisms to save for post-secondary education for lower-income families.153, 155 Government bodies can also address the non-financial barriers to accessing post-secondary education among low-income individuals. For example, interventions that are targeted at low-income youth and focused on communicating the benefits of post-secondary education may help increase the participation of low-income students in post-secondary education, as seen in Box 3 below.158
Box 3: Future to Discover, New Brunswick and Manitoba, 2004 to 2008 Issue: Low-income students whose parents did not attain post-secondary education are significantly less likely to attend post-secondary education themselves.153
Intervention: This pilot project had 2 components: Explore Your Horizons and Learning Accounts. Explore Your Horizons was a universal intervention implemented in classrooms that aimed to illustrate the value of post-secondary education by demonstrating its connection to future career choices. Learning Accounts provided a bursary of up to $8,000 for low-income students to attend post-secondary education.
Rationale/Evidence: An evaluation of the program noted that Learning Accounts were the most effective component and also the most economically efficient. The intervention was effective at increasing high school completion rates among the study group by 7% to 11% and post-secondary enrollment by 9% to 14% while delivering a social benefit of $2 to $3.40 for every $1 invested in the program.158 The program was most successful at increasing high school completion and post-secondary enrollment in French areas of New Brunswick.
Interaction Between Education and Employment Employment has an impact on resources available to support health and well-being.225 The social gradient between employment and health outcomes, including health behaviours and mortality, was clearly demonstrated in the Whitehall and Whitehall II studies of British civil servants, which showed improved health outcomes with increasing employment grade.159, 160 At the bottom of the social gradient, unemployment has been associated with specific health outcomes such as higher risks of premature mortality, poorer self-reported health and lower life expectancy.161, 162
For Canadians with lower levels of education, sharp increases in unemployment rates were observed during periods of economic recession, such as the early 1990s and 2008, whereas employment rates remained relatively stable among those with a university-level education during these periods.163 A contributing factor may be that Canadians, especially men, with lower levels of education are more likely to be employed in the primary resource extraction, processing, manufacturing and transport industries.164 These industries can be more vulnerable to changes in international markets (e.g., companies may implement layoffs during periods of financial constraint when demand decreases). In response to external markets and Canada’s changing economy, there is an increasing prevalence of precarious work (i.e., non-standard employment that is poorly paid, insecure, unprotected or cannot support a household).165, 166
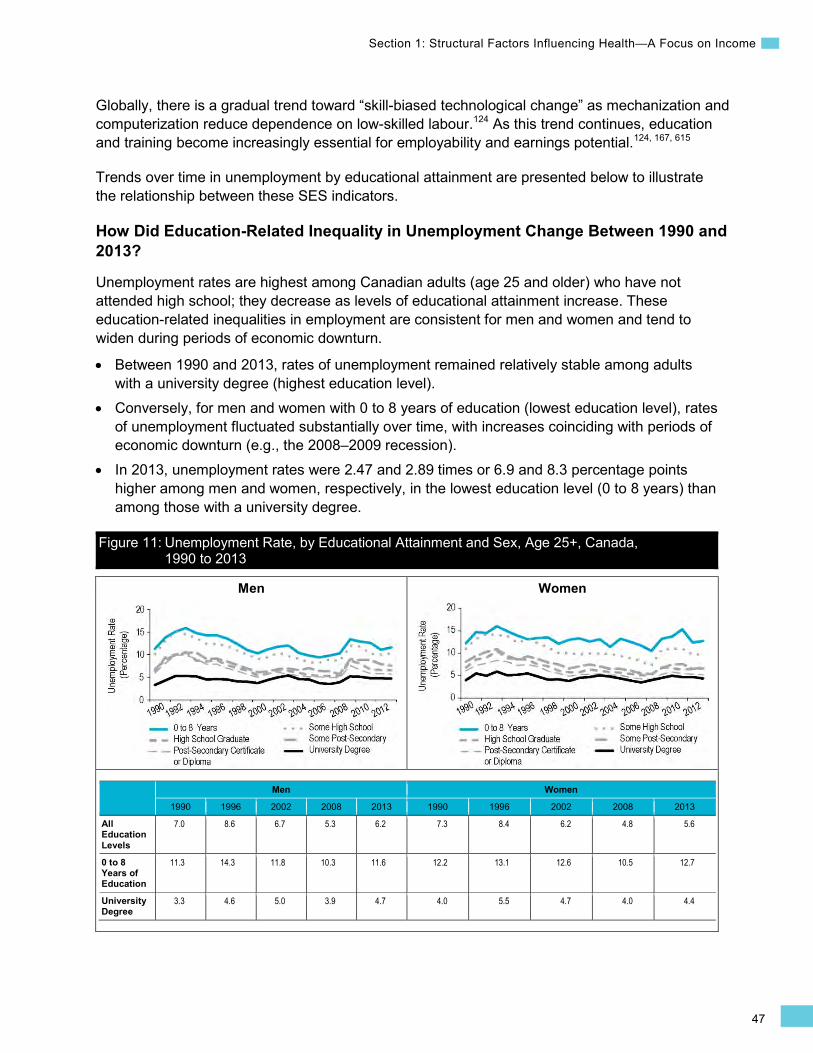
47
Section 1: Structural Factors Influencing Health—A Focus on Income
Men Women
Globally, there is a gradual trend toward “skill-biased technological change” as mechanization and computerization reduce dependence on low-skilled labour.124 As this trend continues, education and training become increasingly essential for employability and earnings potential.124, 167, 615
Trends over time in unemployment by educational attainment are presented below to illustrate the relationship between these SES indicators.
How Did Education-Related Inequality in Unemployment Change Between 1990 and 2013?
Unemployment rates are highest among Canadian adults (age 25 and older) who have not attended high school; they decrease as levels of educational attainment increase. These education-related inequalities in employment are consistent for men and women and tend to widen during periods of economic downturn.
• Between 1990 and 2013, rates of unemployment remained relatively stable among adults with a university degree (highest education level).
• Conversely, for men and women with 0 to 8 years of education (lowest education level), rates of unemployment fluctuated substantially over time, with increases coinciding with periods of economic downturn (e.g., the 2008–2009 recession).
• In 2013, unemployment rates were 2.47 and 2.89 times or 6.9 and 8.3 percentage points higher among men and women, respectively, in the lowest education level (0 to 8 years) than among those with a university degree.
Figure 11: Unemployment Rate, by Educational Attainment and Sex, Age 25+, Canada, 1990 to 2013
Men Women
1990 1996 2002 2008 2013 1990 1996 2002 2008 2013
All Education Levels
7.0 8.6 6.7 5.3 6.2 7.3 8.4 6.2 4.8 5.6
0 to 8 Years of Education
11.3 14.3 11.8 10.3 11.6 12.2 13.1 12.6 10.5 12.7
University Degree
3.3 4.6 5.0 3.9 4.7 4.0 5.5 4.7 4.0 4.4

48
Trends in Income-Related Health Inequalities in Canada
Men Women
Figure 12: Unemployment Rate Inequality Measures, by Sex, Age 25+, Canada, 1990 to 2013
Men Women
1990 1996 2002 2008 2013 1990 1996 2002 2008 2013
Disparity Rate Ratio (0 to 8 Years of Education ÷ University Degree)
3.42 3.11 2.36 2.64 2.47 3.05 2.38 2.68 2.63 2.89
Disparity Rate Difference (0 to 8 Years of Education − University Degree)
8.0 9.7 6.8 6.4 6.9 8.2 7.6 7.9 6.5 8.3
Addressing Education-Related Inequality in Employment
As shown in this analysis, Canadians with lower educational attainment are more likely to be unemployed than those with higher levels of education, particularly in periods of economic downturn. Inequalities in employment or precarious work can be addressed in several ways:
Training programs can help low-skilled workers find a niche in the labour market and fill skill shortages. Programs to help train or retrain workers to build essential skills, including literacy and problem-solving skills, can help some unemployed Canadians find a place in the labour market or qualify for educational opportunities to improve their qualifications.168 An example of a training program to reduce income inequality is provided in Box 4.
High-quality child care provided at a reasonable cost can also address a barrier to labour force participation among low-income groups, particularly among women.169
Wage subsidies can incentivize working and reduce dependence on social assistance.64
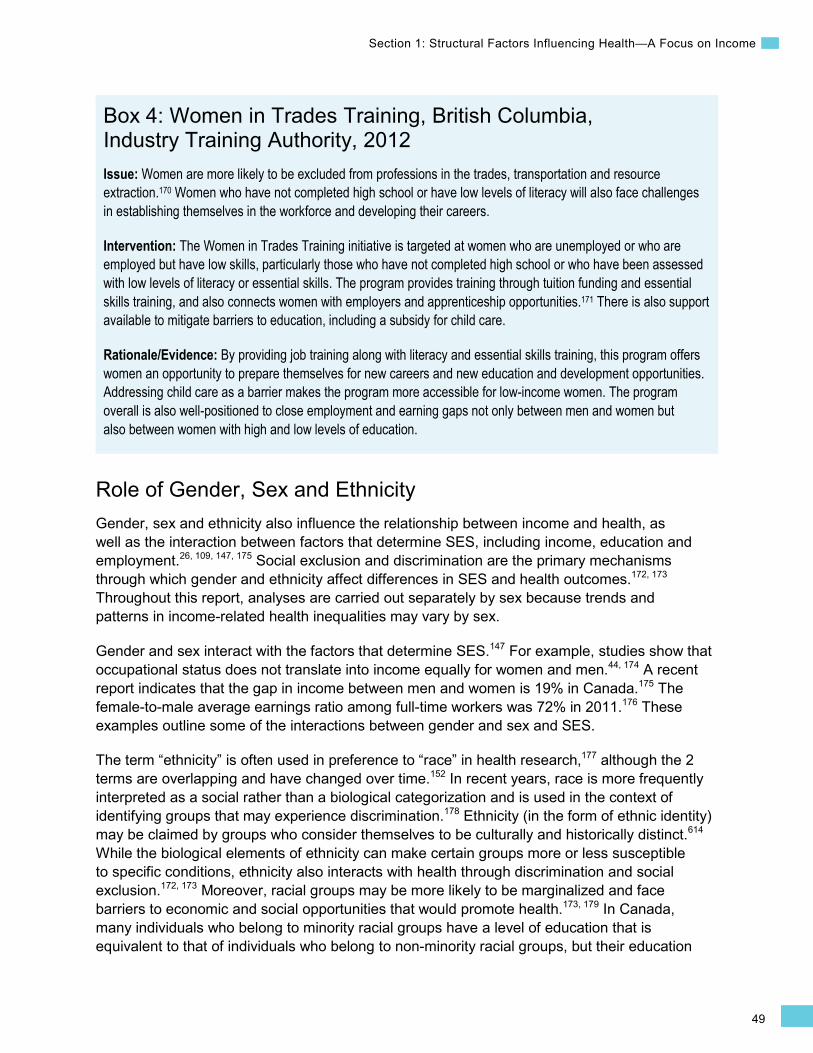
49
Section 1: Structural Factors Influencing Health—A Focus on Income
Box 4: Women in Trades Training, British Columbia, Industry Training Authority, 2012 Issue: Women are more likely to be excluded from professions in the trades, transportation and resource extraction.170 Women who have not completed high school or have low levels of literacy will also face challenges in establishing themselves in the workforce and developing their careers.
Intervention: The Women in Trades Training initiative is targeted at women who are unemployed or who are employed but have low skills, particularly those who have not completed high school or who have been assessed with low levels of literacy or essential skills. The program provides training through tuition funding and essential skills training, and also connects women with employers and apprenticeship opportunities.171 There is also support available to mitigate barriers to education, including a subsidy for child care.
Rationale/Evidence: By providing job training along with literacy and essential skills training, this program offers women an opportunity to prepare themselves for new careers and new education and development opportunities. Addressing child care as a barrier makes the program more accessible for low-income women. The program overall is also well-positioned to close employment and earning gaps not only between men and women but also between women with high and low levels of education.
Role of Gender, Sex and Ethnicity Gender, sex and ethnicity also influence the relationship between income and health, as well as the interaction between factors that determine SES, including income, education and employment.26, 109, 147, 175 Social exclusion and discrimination are the primary mechanisms through which gender and ethnicity affect differences in SES and health outcomes.172, 173 Throughout this report, analyses are carried out separately by sex because trends and patterns in income-related health inequalities may vary by sex.
Gender and sex interact with the factors that determine SES.147 For example, studies show that occupational status does not translate into income equally for women and men.44, 174 A recent report indicates that the gap in income between men and women is 19% in Canada.175 The female-to-male average earnings ratio among full-time workers was 72% in 2011.176 These examples outline some of the interactions between gender and sex and SES.
The term “ethnicity” is often used in preference to “race” in health research,177 although the 2 terms are overlapping and have changed over time.152 In recent years, race is more frequently interpreted as a social rather than a biological categorization and is used in the context of identifying groups that may experience discrimination.178 Ethnicity (in the form of ethnic identity) may be claimed by groups who consider themselves to be culturally and historically distinct.614 While the biological elements of ethnicity can make certain groups more or less susceptible to specific conditions, ethnicity also interacts with health through discrimination and social exclusion.172, 173 Moreover, racial groups may be more likely to be marginalized and face barriers to economic and social opportunities that would promote health.173, 179 In Canada, many individuals who belong to minority racial groups have a level of education that is equivalent to that of individuals who belong to non-minority racial groups, but their education
50
Trends in Income-Related Health Inequalities in Canada
may not translate into comparable levels of income.172 Experiencing racial discrimination is linked to lower self-reported health and an increased incidence of a number of specific health conditions, including depression and anxiety.172
Furthermore, education does not translate into occupation as easily for immigrant as non-immigrant populations.179 Many immigrants also face barriers to employment despite high educational attainment levels.180 There is also a higher proportion of low income among immigrants.181, 182
This section has provided a brief overview of some of the ways that gender, sex, race and ethnicity impact income-related health inequalities; however, there is a need for additional research in this area to fully articulate how income-related inequalities differ between these subgroups of the population so that targeted interventions may be implemented where needed. Please see the next subsection for further discussion of inequalities in income and unemployment for First Nations, Inuit and Métis Canadians.
Aboriginal Income and Unemployment Trends Over Time On average, Canadians experience some of the world’s best health and quality of life.183 However, Aboriginal peoples in Canada, including First Nations, Inuit and Métis, generally have poorer health than the non-Aboriginal population.184 The differences in health between Aboriginal and non-Aboriginal peoples can largely be attributed to adverse socio-economic conditions and historical circumstances, including experiences of colonialism, the residential school system and racism.6 For example, racism and discrimination have negative impacts on health and may reduce the likelihood that Aboriginal peoples will seek primary health care and complete treatment programs.6, 185–187
Moreover, health issues and risk factors facing Aboriginal peoples and the barriers encountered in addressing them are experienced differently across First Nations, Inuit and Métis peoples.6
Income and Unemployment Trends, by Aboriginal Identity
Due to data limitations, it is challenging to analyze trends over time for First Nations, Inuit and Métis populations. Individual After-Tax Income (Median) and Unemployment Rate are 2 indicators for which comparisons can be made between 2000 and 2005 and between 2001 and 2006, respectively. As shown in figures 13 and 14, after-tax income increased and the unemployed rate decreased for First Nations, Inuit, Métis and non-Aboriginal populations during these 5-year periods; however, substantial inequalities persist between non-Aboriginal Canadians and First Nations, Inuit and Métis peoples. Collecting information by First Nations, Inuit and Métis identity would make comparisons between Aboriginal and non-Aboriginal Canadians over time more reliable.188
Median Income
Between 2000 and 2005, the median income for all 3 Aboriginal groups increased. In that time frame, the income gap between First Nations, Inuit and Métis and non-Aboriginal peoples narrowed slightly. Despite these increases among the 3 Aboriginal groups, median annual employment earnings in 2005 were substantially lower ($5,000 to $11,400 less) than they were for non-Aboriginal Canadians, which is consistent with findings reported elsewhere.6

51
Section 1: Structural Factors Influencing Health—A Focus on Income
Unemployment
Unemployment rates among those age 25 to 54 declined from 2001 to 2006 for all 3 Aboriginal groups but remained higher than the non-Aboriginal unemployment rates. In 2006, First Nations and Inuit had the highest unemployment rates at 16.3% and 19%, respectively, followed by Métis at 8.4% and non-Aboriginal people at 5.2%.
Individual After-Tax Income (Median) Indicator Notes Data Sources Statistics Canada. 2006 Census topic-based tabulations. Catalogue number 97-563-XCB2006008.
Census of Population, Statistics Canada
Inequality Disaggregator Aboriginal identity
Time Period 2000, 2005
Please refer to Trends in Income-Related Health Inequalities in Canada: Indicator Definitions for detailed technical notes.
Unemployment Rate Indicator Notes Data Source Census of Population, Statistics Canada
Inequality Disaggregator Aboriginal identity
Time Period 2001, 2006
Please refer to Trends in Income-Related Health Inequalities in Canada: Indicator Definitions for detailed technical notes.
Additional Notes • Data includes First Nations on and off reserve.
• Statistical significance based on non-overlapping 95% confidence intervals was not assessed because variance estimates were not available in the source data.
• Income estimates provided by the census are for the previous year (i.e., the income estimates from the 2001 and 2006 censuses are for the years 2000 and 2005, respectively.)
Figure 13: Individual After-Tax Income (Median) (2005 Constant Canadian Dollars, Thousands), by Aboriginal Identity, Canada, 2000 and 2005
Figure 14: Unemployment Rate, by Aboriginal Identity, Age 25 to 54, Canada, 2001 and 2006
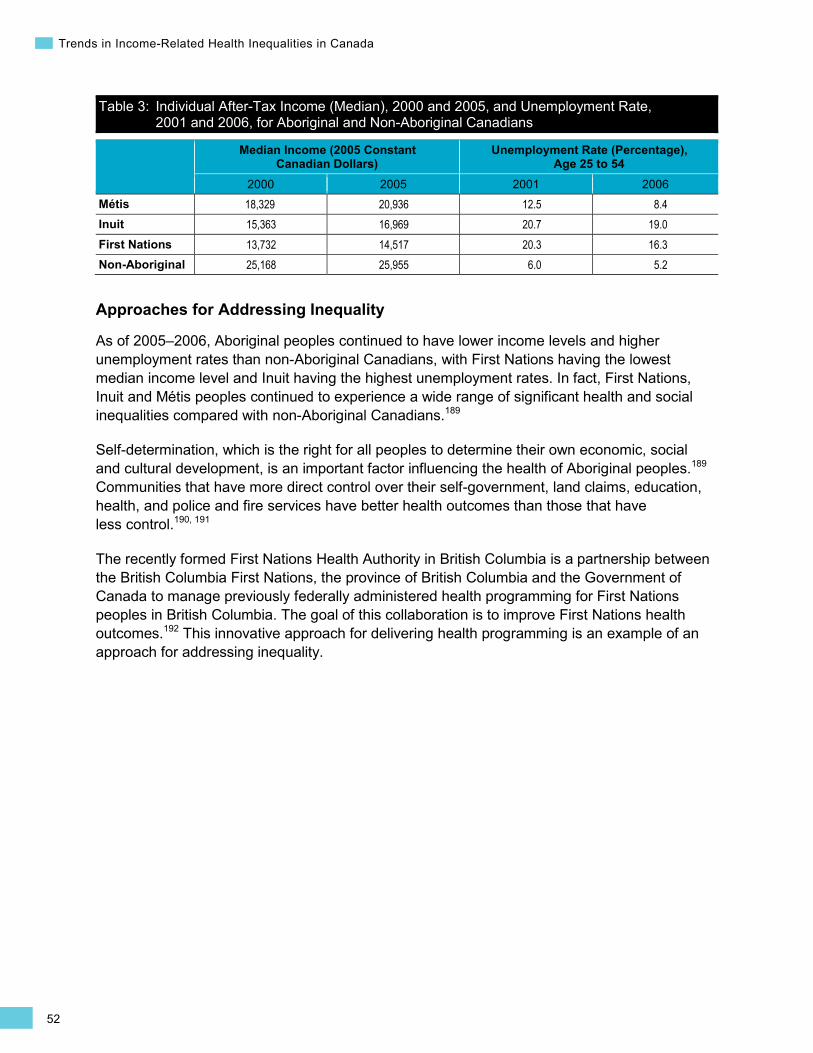
52
Trends in Income-Related Health Inequalities in Canada
Table 3: Individual After-Tax Income (Median), 2000 and 2005, and Unemployment Rate, 2001 and 2006, for Aboriginal and Non-Aboriginal Canadians
Median Income (2005 Constant Canadian Dollars)
Unemployment Rate (Percentage), Age 25 to 54
2000 2005 2001 2006 Métis 18,329 20,936 12.5 8.4 Inuit 15,363 16,969 20.7 19.0 First Nations 13,732 14,517 20.3 16.3 Non-Aboriginal 25,168 25,955 6.0 5.2
Approaches for Addressing Inequality As of 2005–2006, Aboriginal peoples continued to have lower income levels and higher unemployment rates than non-Aboriginal Canadians, with First Nations having the lowest median income level and Inuit having the highest unemployment rates. In fact, First Nations, Inuit and Métis peoples continued to experience a wide range of significant health and social inequalities compared with non-Aboriginal Canadians.189
Self-determination, which is the right for all peoples to determine their own economic, social and cultural development, is an important factor influencing the health of Aboriginal peoples.189 Communities that have more direct control over their self-government, land claims, education, health, and police and fire services have better health outcomes than those that have less control.190, 191
The recently formed First Nations Health Authority in British Columbia is a partnership between the British Columbia First Nations, the province of British Columbia and the Government of Canada to manage previously federally administered health programming for First Nations peoples in British Columbia. The goal of this collaboration is to improve First Nations health outcomes.192 This innovative approach for delivering health programming is an example of an approach for addressing inequality.
53
Section 2: Intermediary Factors Influencing Health
Section 2: Intermediary Factors Influencing Health Intermediary factors include the material, psychosocial, biological, behavioural and health system factors that influence health.29 Some factors, such as housing, affect health through multiple pathways, including both the material relevance of a home (e.g., indoor air quality, protection from elements) and psychosocial impacts (e.g., homeownership as a measure of control over one’s life).100 It is important to recognize that these factors interact over the life course to influence health and that experiences in early life are particularly important.29 Moreover, many of these factors, such as unhealthy behaviours affecting obesity, can be addressed by interventions targeted at multiple levels and/or settings, including individuals, family or home settings, schools, communities and public policy.193
This section presents trends in income-related inequality for the following indicators:
• Material circumstances indicators: Core Housing Need, Household Food Insecurity • Early life indicators: Small for Gestational Age, Children Vulnerable in Areas of
Early Development • Behavioural and biological indicators: Smoking, Obesity • Health system indicators: Influenza Immunization for Seniors, Chronic Obstructive
Pulmonary Disease (COPD) Hospitalizations Among Canadians Younger Than Age 75
Material Circumstances Indicators Core Housing Need Background
The Core Housing Need indicator captures the proportion of Canadian households living in unacceptable housing and who also do not have access to acceptable housing in their local housing market.194 Housing is considered to be acceptable when it is adequate (is not in need of major repairs), suitable (has enough space for the inhabitants) and affordable (costs less than 30% of before-tax household income).194 In Canada, core housing need estimates are available every 5 years for all households through the Census of Population/National Household Survey (NHS), as well as annually for urban households only (approximately 80% of all Canadian households) through the Survey of Labour and Income Dynamics (SLID).194, 195 Taken together, these 2 data sources provide complementary information on the prevalence of core housing need in Canada over the past decade.
Living in unacceptable housing (i.e., inadequate, unsuitable/overcrowded or unaffordable housing) can have a range of negative health impacts.196–199 Not having access to affordable housing is the most common reason Canadians report core housing need200 and is associated with having less disposable income to purchase other health-supporting necessities, such as healthy food, and to save for education and retirement.197

54
Trends in Income-Related Health Inequalities in Canada
Inadequate housing is a contributing factor for at least 15% of Canadians who report being in core housing need.194 Living in housing that is in need of major repair may expose residents to hazards such as dampness and mould, which increase the risk of bronchitis in children.196, 198, 201, 202 Additional health risks may result from poorly designed stairs, poor lighting, dangerous electrical or heating systems, and other hazards (such as previous use of lead paint or asbestos in older homes).196 A review of studies examining the impact of housing improvements on health found improvements in physical and mental health following interventions to increase the warmth and energy efficiency of homes.199
Living in unsuitable or overcrowded housing affects more than 10% of Canadians who report being in core housing need.194 Unsuitable and overcrowded living conditions have been shown to increase one’s risk of respiratory illness and psychological distress.198, 202–204
Indicator Notes Core Housing Need: Urban Households
Data Sources Survey of Labour and Income Dynamics, Statistics Canada, and Canada Mortgage and Housing Corporation
Income Disaggregator Income quintiles (based on self-reported income or income from tax files)
Time Period 2002 to 2011
Core Housing Need: All Households
Data Sources Census of Population (2001, 2006) and National Household Survey (2011), Statistics Canada
Income Disaggregator Income quintiles (based on self-reported income or income from tax files)
Time Period 2001, 2006, 2011
Please refer to Trends in Income-Related Health Inequalities in Canada: Indicator Definitions for detailed technical notes.
Additional Data SLID data for the complete time period is not presented in this report. This data is available on CIHI’s website in the form of downloadable tables.
Symbols and Abbreviations †† Too unreliable to be published
Additional Notes • SLID income estimates are for the reference year, while census/NHS income estimates are for the previous year. Therefore,
the 2005 and 2010 estimates for urban households align best with the 2006 and 2011 estimates for all households.
• Statistical significance based on non-overlapping 95% confidence intervals was not assessed because variance estimates were not available in the source data.
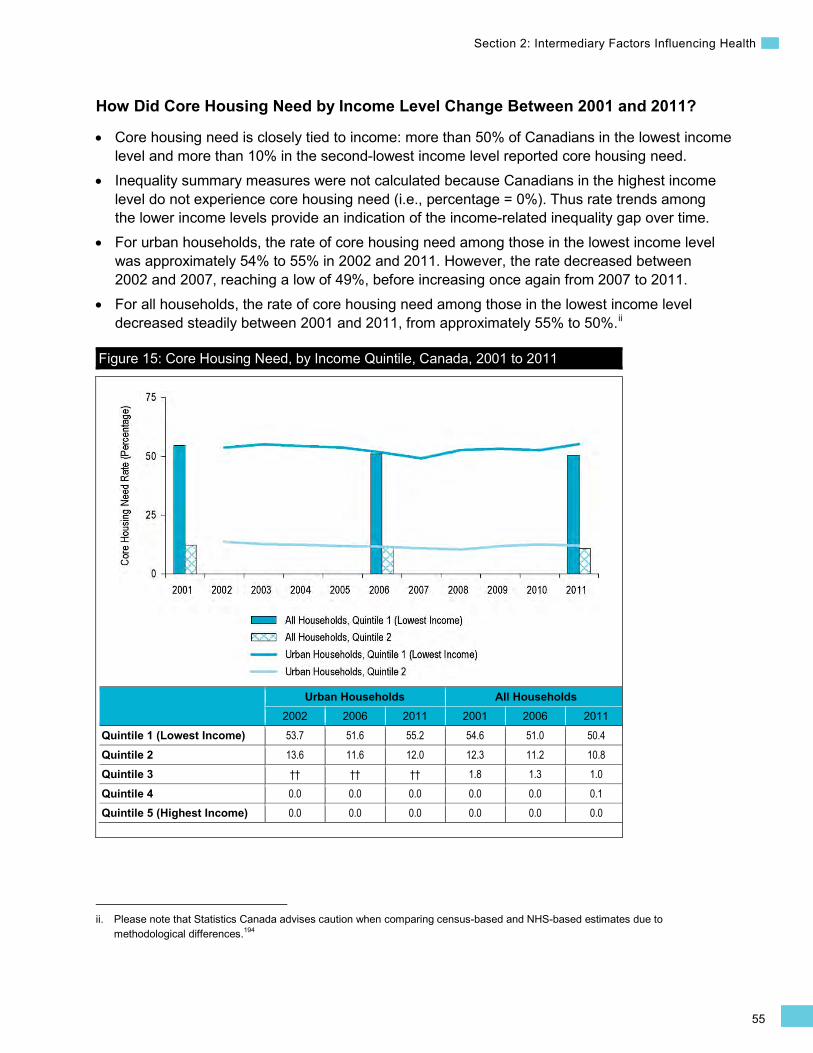
55
Section 2: Intermediary Factors Influencing Health
How Did Core Housing Need by Income Level Change Between 2001 and 2011? • Core housing need is closely tied to income: more than 50% of Canadians in the lowest income
level and more than 10% in the second-lowest income level reported core housing need. • Inequality summary measures were not calculated because Canadians in the highest income
level do not experience core housing need (i.e., percentage = 0%). Thus rate trends among the lower income levels provide an indication of the income-related inequality gap over time.
• For urban households, the rate of core housing need among those in the lowest income level was approximately 54% to 55% in 2002 and 2011. However, the rate decreased between 2002 and 2007, reaching a low of 49%, before increasing once again from 2007 to 2011.
• For all households, the rate of core housing need among those in the lowest income level decreased steadily between 2001 and 2011, from approximately 55% to 50%.ii
ii. Please note that Statistics Canada advises caution when comparing census-based and NHS-based estimates due to methodological differences.194
Figure 15: Core Housing Need, by Income Quintile, Canada, 2001 to 2011
Urban Households All Households 2002 2006 2011 2001 2006 2011
Quintile 1 (Lowest Income) 53.7 51.6 55.2 54.6 51.0 50.4 Quintile 2 13.6 11.6 12.0 12.3 11.2 10.8 Quintile 3 †† †† †† 1.8 1.3 1.0 Quintile 4 0.0 0.0 0.0 0.0 0.0 0.1 Quintile 5 (Highest Income) 0.0 0.0 0.0 0.0 0.0 0.0
56
Trends in Income-Related Health Inequalities in Canada
Addressing Core Housing Need
These analyses suggest that core housing need decreased over the past decade at the national level among all households but remained unchanged among urban households. When examined at the provincial level for urban households (using SLID data), between 2002 and 2011, core housing need declined in the Atlantic provinces but remained unchanged in all other provinces.194 Alternatively, when examined at the provincial/territorial level for all households (using census/NHS data), core housing need declined in all provinces and territories except Saskatchewan, Alberta and Nunavut.194 Due to unreliable estimates, trends in core housing need by income quintile are not presented in this report at the provincial level.
Inequality Impact
Based on data from the NHS, approximately 1,552,100 fewer Canadian households would have experienced core housing need in 2011 if all Canadian households had experienced the same low rate of core housing need as those in the highest income level.
Approaches for Addressing Inequality
More than 13% of all Canadians report living in core housing need, and the most common reason for reporting core housing need is a lack of access to affordable housing.205 Not surprisingly, the proportion of Canadians in core housing need is substantially higher at the lower end of the income distribution, with more than 50% of Canadians in the bottom income level reporting core housing need.
To address the issue of affordable housing, the Government of Canada and provincial and territorial governments have implemented a range of programs. The Government of Canada, with the leadership of the Canada Mortgage and Housing Corporation, has partnered with the provinces and territories through Investment in Affordable Housing (IAH) agreements.206 Under the IAH agreements, provinces and territories match federal investments to design and deliver the funding to address local housing needs and priorities.207 Provinces and territories also implement their own housing affordability programs outside of the IAH agreements. Despite these investments, a lack of affordable housing is still commonly identified across Canada, particularly in the rental market and in large, more expensive metropolitan areas.208–211 As an example, the Ontario Non-Profit Housing Association conducts an annual survey of rent-geared-to-income housing wait lists and has reported an increase from 129,253 households in 2008 to 165,069 households in 2013.212
Approaches for addressing affordable housing can target the supply side through funding of new affordable housing units or incentivizing their construction by private enterprises. Alternatively, governments can close the gap between the market cost of rent for available properties and the capacity of tenants to afford living there. Some of the measures include rent supplements, typically targeted at landlords to reduce the rent they charge, and subsidies or other income supports targeted at tenants to supplement the amount of income they have available to pay rent.211, 213–215
•
57
Section 2: Intermediary Factors Influencing Health
Rent supplements are available in all provinces and are typically provided to landlords and tied to a particular location, whereas portable subsidies can be provided directly to tenants. Portable subsidies are particularly beneficial for certain populations, including those with a disability, because it has the advantage of allowing families to select from a broader range of housing that might better suit their needs, independent of the limited available supply of affordable housing.211, 213, 216 See Box 5 below for an example of an approach for providing financial support for homeownership.
Poverty reduction measures, including income supports such as targeted tax credits, can increase the incomes of the vulnerably housed. Increasing social assistance is commonly identified as a mechanism to address affordable housing.211 This is particularly important for families, as couples with children are almost twice as likely as those without children to be living in core housing need, and lone-parent households are nearly 4 times as likely to be in core housing need as couples with children.207
Box 5: Housing Choices, Northwest Territories, 2007 Issue: Transitioning into home ownership can be difficult, especially for those with low incomes and low levels of financial literacy.217 Owning a home provides more than protection from the elements and a safe environment. Homeownership is also a life goal for many people that represents a measure of control over their own lives.218, 219
Intervention: The Housing Choices programs offer a suite of interventions aimed at addressing a number of barriers to stable housing and challenges associated with home ownership:220
• Solutions to Educate People (STEP) offers education and training to program applicants and covers topics such as financing, banking and credit, purchasing a home and maintaining a home.
• Homeownership Entry Level Program (HELP) provides financial support to help participants accumulate a sufficient down payment. After completing STEP training, the HELP program provides participants with the chance to lease a home for the cost of 20% of their gross income for 2 years. Participants who complete the program successfully and look to purchase a home after the 2-year lease can be eligible to receive up to $10,000 toward a down payment to lower the price of a home.
• Providing Assistance for Territorial Homeownership (PATH) provides funding based on family size, income and area of residence to help with the costs of homeownership in the Northwest Territories.
• Contributing Assistance for Repairs and Enhancements (CARE) provides funding assistance to repair and maintain homes, prioritizing health and safety repairs.
• Securing Assistance for Emergencies (SAFE) provides emergency support for low- and modest-income home owners in the event of furnace failures or similar problems.
Rationale/Evidence: Building financial literacy skills and providing subsidized housing costs and assistance in preparing for home ownership has the potential to increase the capacity of low-income earners to plan for financing stable housing. A series of 16 interviews, 8 focus groups and 357 surveys to evaluate the effectiveness of the Housing Choices programs found them to be in general effective at addressing core need with an increasing focus on affordability. Interviewees noted that including a training program and providing a learning curve as well as a safety net strengthened the HELP program.221
58
Trends in Income-Related Health Inequalities in Canada
Homelessness
Homelessness is very difficult to measure and reliable trend data is sparse.210 Due to difficulties tracking individuals who do not have a fixed address or consistent contact information, reliable data is not yet available over time, but recent initiatives are making progress toward measuring homelessness in Canada. Based on data from 2013 and 2014, it is estimated that 30,000 to 35,000 Canadians experience homelessness on a given night.222, 223 In addition to this, estimates suggest that more than 700,000 Canadians are in extreme core housing need, meaning that they are paying more than 50% of their income for housing and are thus at risk of slipping into homelessness.223
In 2014, approximately 180,000 Canadians used emergency shelters, whereas between 2005 and 2009 it was estimated that approximately 150,000 Canadians used shelters annually.223, 224 However, the composition of shelter users has changed over time — women and families are the fastest-growing subset of shelter users.224 The number of children younger than 16 using emergency shelters grew from approximately 6,200 in 2005 to almost 9,500 by 2009.224 There is also a trend of emergency shelters being used more intensely over time, with the average length of stay increasing from 13.6 nights in 2005 to 16 nights by 2009.224
Homelessness is directly linked to income, and the health risks associated with homelessness affect disproportionately, if not exclusively, those with very low incomes. Those experiencing homelessness have life expectancies that are 7 to 10 years shorter than securely housed Canadians.225, 226 A study conducted among homeless youth age 14 to 25 in Montréal found a mortality rate 9 times higher for males and 31 times higher for females compared with youth in the general population.227 Homelessness is also associated with an increased risk of exposure to physical violence, sexual assault and difficulties in accessing care and managing mental illness and chronic conditions.226, 228–230
To reduce the prevalence of homelessness, policy approaches can target those who are vulnerably housed and work to prevent people from slipping into homelessness. For those who are homeless, a housing first approach is an effective way of improving housing outcomes and the health status of individuals.211, 231–233 See Box 6 below for an example of a housing first initiative.
59
Section 2: Intermediary Factors Influencing Health
Box 6: At Home / Chez Soi, Canada, 2009 to 2013 Issue: Homeless individuals have poorer mental health outcomes than the general population, including higher rates of mental illness, substance abuse and suicide.229, 234 Homelessness takes years off the life expectancy of those living on the streets. In addition to the individual burden, homelessness has significant costs to Canadians related to emergency department visits, hospitalizations and incarcerations that could be avoided by providing adequate shelter.233
Intervention: At Home / Chez Soi was a 4-year demonstration project launched by the Mental Health Commission of Canada to address the housing needs of people with mental illness who were experiencing homelessness in 5 cities: Vancouver, Winnipeg, Toronto, Montréal and Moncton.235 At Home / Chez Soi took a housing first approach, which provides persons who are homeless with access to subsidized housing and connects individuals with health and social service supports with an aim to facilitate treatment of mental or physical illness.235
Rationale/Evidence: Evaluations of the project found that, compared with those who received regular support services, those receiving the housing first intervention spent twice as much time in stable housing, with the final evaluation finding 62% of the housing first group in stable housing compared with 31% of participants who received regular support services.233 Compared with those receiving regular support services, homeless individuals who received services in the housing first model had better quality of life and community functioning.233 Moreover, At Home / Chez Soi was shown to be a cost-effective investment, particularly for those homeless individuals who were frequent users of emergency health services and other public services. When housing first approaches targeted the 10% of homeless patients who had the highest service use on program entry, $2.17 was saved through reduced health, social and justice service expenditures for every $1 invested in the housing first approach.233 For high-needs patients, $0.96 of every $1 invested in the program was returned through reduced use of health, justice and social services within 2 years of follow-up.233
Household Food Insecurity Background
Food insecurity refers to inadequate or uncertain access to food due to financial constraints and is recognized as an important public health challenge in Canada.3 The Household Food Security Survey Module of the Canadian Community Health Survey (CCHS) defines 2 levels of food insecurity: moderate food insecurity indicates a compromise in the quality and/or quantity of food consumed by adults and/or children for financial reasons, and severe food insecurity indicates more severe compromises, including reduced food intake and disrupted eating patterns due to lack of money.236
Persons living in food-insecure households are at increased risk of inadequate nutrient intake and compromised dietary quality.237–241 Adults living in food-insecure households are also more likely to report poorer self-rated health (physical and mental health), higher levels of stress and a greater number of multiple chronic conditions, including diabetes, cardiovascular disease and depression.242–245 Children growing up in food-insecure households, particularly those with severe food insecurity involving hunger, are at a heightened risk of serious long-term physical and mental health problems.246, 247
60
Trends in Income-Related Health Inequalities in Canada
In 2011–2012, more than 8% or 1 million Canadian households reported an experience of moderate or severe food insecurity in the previous year. In the same time period, lone-parent households and households with young children were especially vulnerable, with 22% of lone-parent-led households and 10.7% of households with children younger than 6 reporting an experience of food insecurity.248 Additional risk factors include not owning one’s dwelling, relying on social assistance or employment insurance as the main source of household income, and living in Aboriginal or recent immigrant households.244, 249, 250 Rates of food insecurity also vary substantially across Canada, with residents of Northern regions and remote Aboriginal communities particularly susceptible to high levels of food insecurity.249, 251, 252 Factors contributing to the high levels of food insecurity in remote Aboriginal communities include the high cost of market food, the high cost of living and limited access to healthy market and traditional foods.251, 252
Indicator Notes Data Source Household Food Security Survey Module, Canadian Community Health Survey, Statistics Canada
Income Disaggregator Self-reported adjusted household income from the CCHS
Time Period National: 2007–2008 to 2011–2012 Provincial: 2005 to 2011–2012
Please refer to Trends in Income-Related Health Inequalities in Canada: Indicator Definitions for detailed technical notes.
Additional Data National and provincial data for the complete time period is not presented in this report. This data is available on CIHI’s website in the form of downloadable tables.
Symbols and Abbreviations
* Estimate is statistically significant (i.e., statistically different from 0 for Change Over Time Percentage and Change Over Time Difference, based on the 95% CI)
Q1 Quintile 1 (lowest income quintile)
Q5 Quintile 5 (highest income quintile)
95% CI 95% confidence interval
† Interpret with caution (coefficient of variance from 16.6% to 33.3%)
↑ Statistically significant increase between first time point and 2011–2012 estimate
↓ Statistically significant decrease between first time point and 2011–2012 estimate
— No statistically significant change between first time point and 2011–2012 estimate
Additional Notes • Unless otherwise specified, rates of food insecurity are those of moderate and severe food insecurity combined.
• Provincial results are available for Nova Scotia, Ontario, Alberta, British Columbia and Quebec, as these are the 5 provinces that opted to participate in all 4 cycles of the Household Food Security Survey Module of the CCHS between 2005 and 2011–2012.
61
Section 2: Intermediary Factors Influencing Health
How Did Food Insecurity by Income Level Change Between 2007–2008 and 2011–2012?
• Among all income levels combined, at least 8% of Canadian households experienced food insecurity. This rate remained stable between 2007–2008 and 2011–2012.
• Food insecurity rates were closely tied to income, with nearly 25% of Canadian households in the lowest income level affected by food insecurity.
• Inequality measures were not calculated because households in the highest income level rarely experience food insecurity (i.e., percentage <1%). Trends in rates among the lowest income levels therefore provide an indication of the income-related inequality over time.
• In recent years, overall food insecurity did not change in the lowest income level, but it increased in the second-lowest and middle income levels (from 7.9% to 9.7% and from 3.5% to 4.9%, respectively).
• Severe food insecurity was reported by more than 9% of households in the lowest income level and more than 2% of households in the second-lowest income level. These rates did not change over time.
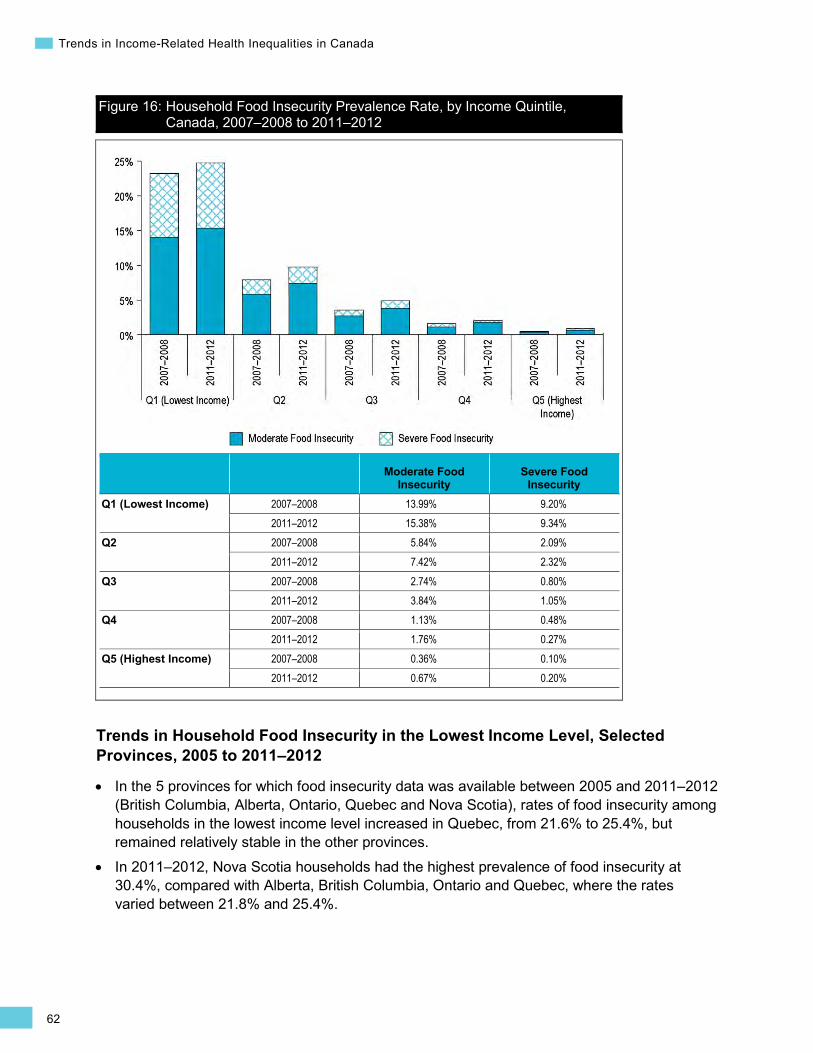
62
Trends in Income-Related Health Inequalities in Canada
Figure 16: Household Food Insecurity Prevalence Rate, by Income Quintile, Canada, 2007–2008 to 2011–2012
Moderate Food Insecurity
Severe Food Insecurity
Q1 (Lowest Income) 2007–2008 13.99% 9.20% 2011–2012 15.38% 9.34%
Q2 2007–2008 5.84% 2.09% 2011–2012 7.42% 2.32%
Q3 2007–2008 2.74% 0.80% 2011–2012 3.84% 1.05%
Q4 2007–2008 1.13% 0.48% 2011–2012 1.76% 0.27%
Q5 (Highest Income) 2007–2008 0.36% 0.10% 2011–2012 0.67% 0.20%
Trends in Household Food Insecurity in the Lowest Income Level, Selected Provinces, 2005 to 2011–2012
• In the 5 provinces for which food insecurity data was available between 2005 and 2011–2012 (British Columbia, Alberta, Ontario, Quebec and Nova Scotia), rates of food insecurity among households in the lowest income level increased in Quebec, from 21.6% to 25.4%, but remained relatively stable in the other provinces.
• In 2011–2012, Nova Scotia households had the highest prevalence of food insecurity at 30.4%, compared with Alberta, British Columbia, Ontario and Quebec, where the rates varied between 21.8% and 25.4%.
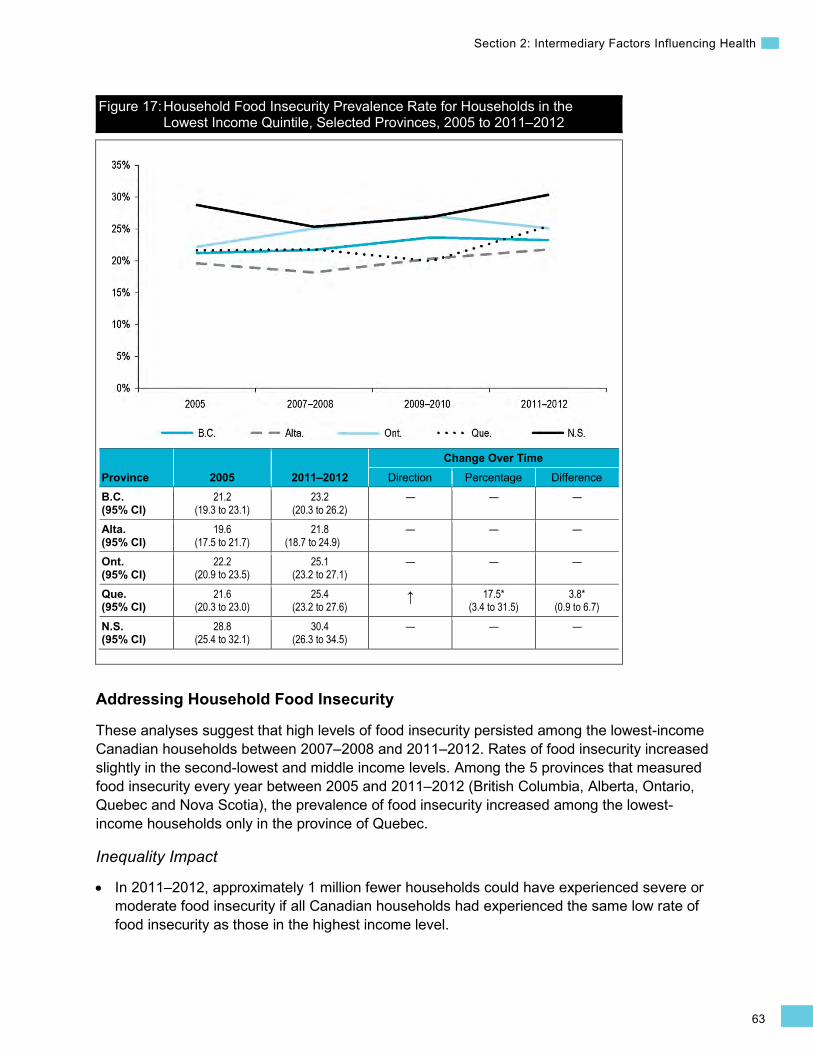
63
Section 2: Intermediary Factors Influencing Health
Figure 17: Household Food Insecurity Prevalence Rate for Households in the Lowest Income Quintile, Selected Provinces, 2005 to 2011–2012
Province 2005 2011–2012 Change Over Time
Direction Percentage Difference B.C. (95% CI)
21.2 (19.3 to 23.1)
23.2 (20.3 to 26.2)
— — —
Alta. (95% CI)
19.6 (17.5 to 21.7)
21.8 (18.7 to 24.9)
— — —
Ont. (95% CI)
22.2 (20.9 to 23.5)
25.1 (23.2 to 27.1)
— — —
Que. (95% CI)
21.6 (20.3 to 23.0)
25.4 (23.2 to 27.6)
↑ 17.5* (3.4 to 31.5)
3.8* (0.9 to 6.7)
N.S. (95% CI)
28.8 (25.4 to 32.1)
30.4 (26.3 to 34.5)
— — —
Addressing Household Food Insecurity
These analyses suggest that high levels of food insecurity persisted among the lowest-income Canadian households between 2007–2008 and 2011–2012. Rates of food insecurity increased slightly in the second-lowest and middle income levels. Among the 5 provinces that measured food insecurity every year between 2005 and 2011–2012 (British Columbia, Alberta, Ontario, Quebec and Nova Scotia), the prevalence of food insecurity increased among the lowest-income households only in the province of Quebec.
Inequality Impact
In 2011–2012, approximately 1 million fewer households could have experienced severe or moderate food insecurity if all Canadian households had experienced the same low rate of food insecurity as those in the highest income level.
•
64
Trends in Income-Related Health Inequalities in Canada
(cont’d on next page)
Approaches for Addressing Inequality
In Canada, responses to food insecurity have taken 4 main forms:253
1. Charitable food distribution; 2. Community-based food programs (e.g., community kitchens, community gardens,
Good Food Box programs); 3. School-based nutrition programs; and 4. Government-administered programs (e.g., National Child Benefit, Nutrition North Program).
Of these responses, food charity (predominantly in the form of food banks) continues to serve as the primary direct response to household food insecurity in Canada.3, 254 In recent decades, many of the community-based food initiatives across the country have been supported and integrated by food councils, whose role also commonly includes the development of policies to support ready access to affordable, nutritious foods for local residents.255 Despite these efforts, lower-income Canadians remain highly vulnerable to food insecurity, with nearly 1 in 4 low-income households reporting the experience of food insecurity in 2011–2012.
Charitable and community-level food programs are limited in scope and capacity but serve important functions that may include providing emergency access to food, building nutrition knowledge and food skills, and fostering social support and community development (see Box 7). These smaller-scale programs can complement broader social policies, such as comprehensive income supplementation programs or poverty reduction strategies, which hold the potential to meaningfully reduce levels of food insecurity in the most vulnerable groups, given the close link between adequate income and the ability to access sufficient and nutritious food (see Box 8).256–259
Box 7: Community Food Centres, Canada, 2012 Issue: In 2011–2012, more than 1 million Canadian households experienced moderate or severe food insecurity. Community-level food programs continue to serve as an important civil societal response to food insecurity across Canada, despite their commonly limited funding and inability to reach large numbers of vulnerable individuals.
Intervention: Since 2012, Community Food Centres Canada has been expanding Toronto’s The Stop, a successful and innovative model of a community food centre (CFC), to other Canadian communities, including Dartmouth, Nova Scotia, and North Winnipeg, Manitoba.260
In addition to providing emergency food relief such as meals and a food bank, CFCs provide training in cooking and education related to healthy eating. As part of the CFC model, community gardens or greenhouses provide both a fresh, local source of healthy produce and an opportunity for physical activity, social engagement and learning about gardening practices that can be implemented in smaller gardens at home. The CFC model also recognizes the importance of poverty in shaping the landscape of food insecurity and thus provides training for food centre users to become effective anti-poverty advocates for their communities.260
65
Section 2: Intermediary Factors Influencing Health
Rationale/Evidence: Client surveys of Toronto’s The Stop CFC indicate a positive impact of CFC participation on physical health, fruit and vegetable intake, coping with hunger and food insecurity, and community engagement.260 In 2013, trained peer advocates provided more than 2,000 community members with general advice and, in some instances, referrals to income supports, social services, housing and legal supports, and settlement services.261, 262 However, systematic evaluations of the impact of CFCs and similar programs on alleviating food insecurity remain to be conducted.
Box 8: Newfoundland and Labrador Poverty Reduction Strategy, 2006 Issue: Food insecurity is deeply rooted in poverty.251 Currently, 11 out of 13 provinces and territories in Canada have poverty reduction plans in place.143
Intervention: In 2006, Newfoundland and Labrador launched a comprehensive Poverty Reduction Strategy, with a substantial focus on improving the financial well-being of social assistance recipients — the population subgroup most vulnerable to food insecurity.145 Key areas of investment under Newfoundland and Labrador’s Poverty Reduction Strategy included enhancing the social safety net and earned incomes of lower-income individuals and families through a comprehensive suite of measures. Initiatives included increases to low-income tax reduction thresholds and the child tax benefit levels, the expansion of health coverage to adults working for low wages and increased availability of affordable housing. Another important goal of the strategy was to improve the financial well-being of individuals receiving social assistance through direct and indirect measures (e.g., increased social assistance rates, indexed basic support income rates, increased liquid asset exemptions, elimination of claw-backs from income tax returns). Additionally, several measures were introduced to support more employment among social assistance clients and to allow clients to retain a greater share of their earnings.145
Rationale/Evidence: In the 5 years following its implementation, rates of food insecurity in Newfoundland and Labrador showed a steady decline to the lowest overall rate in the country (from 9.6% in 2007–2008 to 7.7% in 2011–2012) and the lowest rate among Canadian households receiving social assistance.248, 249 While no data is available to assess the impact on food insecurity of specific policy interventions under the Poverty Reduction Strategy, an exploratory analysis using data from the CCHS revealed that the significant decline in Newfoundland and Labrador’s rates of food insecurity since 2007 was due in part to increased household incomes and fewer households receiving social assistance. However, a major component of the decline was the decreased vulnerability of social assistance recipients to food insecurity, likely resulting from the cumulative impact of multiple measures taken under the province’s Poverty Reduction Strategy.263 These findings suggest that provincial policies can play an important role in reducing population levels of food insecurity.
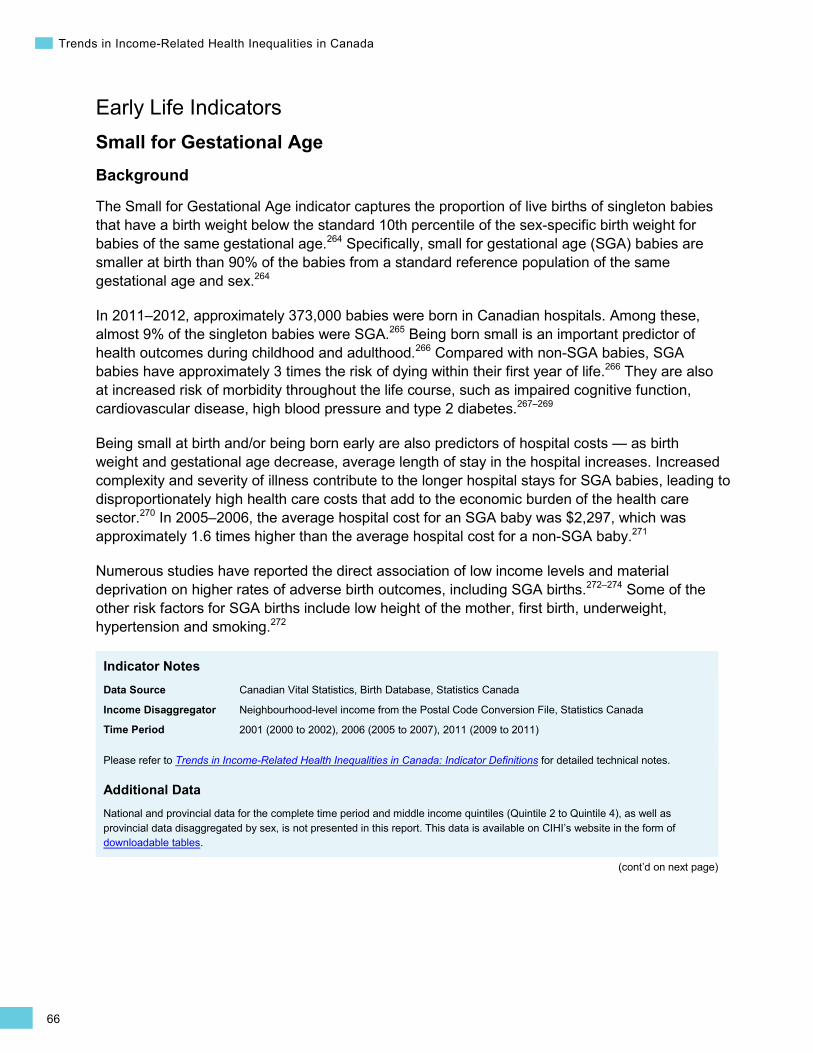
66
Trends in Income-Related Health Inequalities in Canada
(cont’d on next page)
Early Life Indicators Small for Gestational Age Background
The Small for Gestational Age indicator captures the proportion of live births of singleton babies that have a birth weight below the standard 10th percentile of the sex-specific birth weight for babies of the same gestational age.264 Specifically, small for gestational age (SGA) babies are smaller at birth than 90% of the babies from a standard reference population of the same gestational age and sex.264
In 2011–2012, approximately 373,000 babies were born in Canadian hospitals. Among these, almost 9% of the singleton babies were SGA.265 Being born small is an important predictor of health outcomes during childhood and adulthood.266 Compared with non-SGA babies, SGA babies have approximately 3 times the risk of dying within their first year of life.266 They are also at increased risk of morbidity throughout the life course, such as impaired cognitive function, cardiovascular disease, high blood pressure and type 2 diabetes.267–269
Being small at birth and/or being born early are also predictors of hospital costs — as birth weight and gestational age decrease, average length of stay in the hospital increases. Increased complexity and severity of illness contribute to the longer hospital stays for SGA babies, leading to disproportionately high health care costs that add to the economic burden of the health care sector.270 In 2005–2006, the average hospital cost for an SGA baby was $2,297, which was approximately 1.6 times higher than the average hospital cost for a non-SGA baby.271
Numerous studies have reported the direct association of low income levels and material deprivation on higher rates of adverse birth outcomes, including SGA births.272–274 Some of the other risk factors for SGA births include low height of the mother, first birth, underweight, hypertension and smoking.272
Indicator Notes Data Source Canadian Vital Statistics, Birth Database, Statistics Canada
Income Disaggregator Neighbourhood-level income from the Postal Code Conversion File, Statistics Canada
Time Period 2001 (2000 to 2002), 2006 (2005 to 2007), 2011 (2009 to 2011)
Please refer to Trends in Income-Related Health Inequalities in Canada: Indicator Definitions for detailed technical notes.
Additional Data National and provincial data for the complete time period and middle income quintiles (Quintile 2 to Quintile 4), as well as provincial data disaggregated by sex, is not presented in this report. This data is available on CIHI’s website in the form of downloadable tables.
67
Section 2: Intermediary Factors Influencing Health
Symbols and Abbreviations
* Estimate is statistically significant (i.e., statistically different from 1 for DRR or different from 0 for DRD, PRR, Change Over Time Percentage and Change Over Time Difference, based on the 95% CI)
Q1 Quintile 1 (lowest income quintile)
Q5 Quintile 5 (highest income quintile)
95% CI 95% confidence interval
↑ Statistically significant increase between 2001 estimate and 2011 estimate
↓ Statistically significant decrease between 2001 estimate and 2011 estimate
— No statistically significant change between 2001 estimate and 2011 estimate
How Did Income-Related Inequality for SGA Change Between 2001 and 2011?
Income-related inequality for SGA births decreased over time, primarily due to increased rates in the highest income level and unchanged rates in the lowest income level.
Trends in Rates, by Income
• From 2001 to 2011, SGA rates increased across all income levels combined. This increase was primarily due to an increase in SGA birth rates in the highest income level.
• SGA rates increased by 7.3% or 0.5 percentage points in the highest income level. There was no change over time in the SGA rates in the lowest income level.
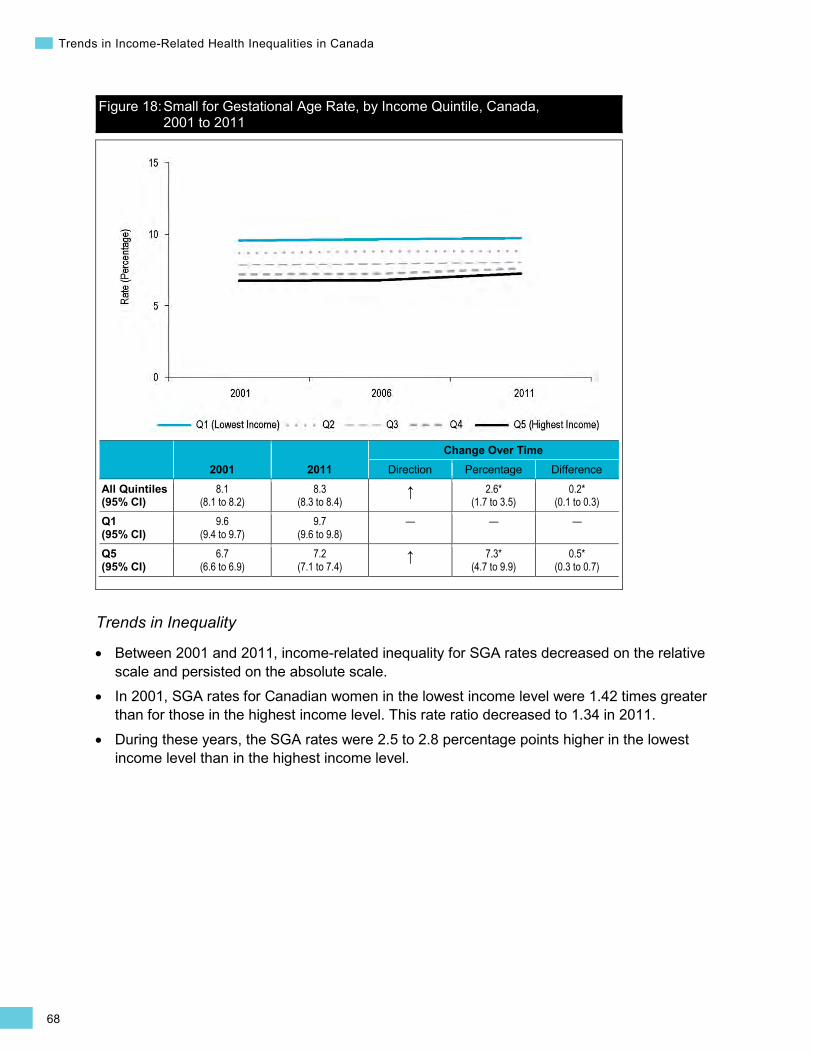
68
Trends in Income-Related Health Inequalities in Canada
Figure 18: Small for Gestational Age Rate, by Income Quintile, Canada, 2001 to 2011
2001 2011 Change Over Time
Direction Percentage Difference
All Quintiles (95% CI)
8.1 (8.1 to 8.2)
8.3 (8.3 to 8.4)
↑ 2.6* (1.7 to 3.5)
0.2* (0.1 to 0.3)
Q1 (95% CI)
9.6 (9.4 to 9.7)
9.7 (9.6 to 9.8)
— — —
Q5 (95% CI)
6.7 (6.6 to 6.9)
7.2 (7.1 to 7.4)
↑ 7.3* (4.7 to 9.9)
0.5* (0.3 to 0.7)
Trends in Inequality
• Between 2001 and 2011, income-related inequality for SGA rates decreased on the relative scale and persisted on the absolute scale.
• In 2001, SGA rates for Canadian women in the lowest income level were 1.42 times greater than for those in the highest income level. This rate ratio decreased to 1.34 in 2011.
• During these years, the SGA rates were 2.5 to 2.8 percentage points higher in the lowest income level than in the highest income level.

69
Section 2: Intermediary Factors Influencing Health
Figure 19: Small for Gestational Age Inequality Measures, Canada, 2001 to 2011
2001 2011 Change Over Time
Direction Percentage Difference Disparity Rate Ratio (Q1 ÷ Q5) (95% CI)
1.42* (1.39 to 1.45)
1.34* (1.32 to 1.37)
↓ -5.2* (-7.2 to -3.2)
-0.07* (-0.10 to -0.04)
Disparity Rate Difference (Q1 − Q5) (95% CI)
2.8* (2.6 to 3.0)
2.5* (2.3 to 2.6)
— — —
How Did Income-Related Inequality Change Between 2001 and 2011 for Male and Female Babies?
For both male and female babies, SGA rates increased in the highest income level over time, while income-related inequality persisted for male babies and decreased on the relative scale for female babies.
Trends in Rates, by Income and Sex
For babies of both sexes, from 2001 to 2011, there was an increase in SGA rates in the highest income level, while there was no change in the SGA rates in the lowest income level.
•
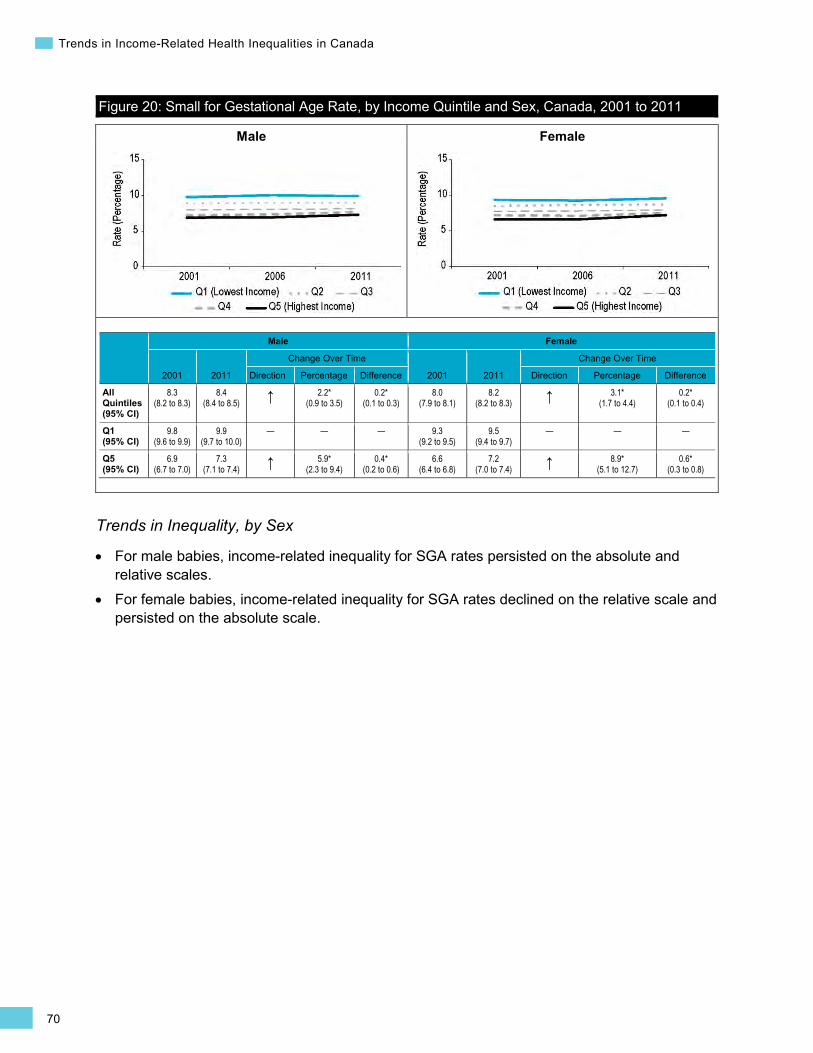
70
Trends in Income-Related Health Inequalities in Canada
Male Female
Figure 20: Small for Gestational Age Rate, by Income Quintile and Sex, Canada, 2001 to 2011
Male Female
2001 2011
Change Over Time
2001 2011
Change Over Time
Direction Percentage Difference Direction Percentage Difference
All Quintiles (95% CI)
8.3 (8.2 to 8.3)
8.4 (8.4 to 8.5) ↑ 2.2*
(0.9 to 3.5) 0.2*
(0.1 to 0.3) 8.0
(7.9 to 8.1) 8.2
(8.2 to 8.3) ↑ 3.1* (1.7 to 4.4)
0.2* (0.1 to 0.4)
Q1 (95% CI)
9.8 (9.6 to 9.9)
9.9 (9.7 to 10.0)
— — — 9.3 (9.2 to 9.5)
9.5 (9.4 to 9.7)
— — —
Q5 (95% CI)
6.9 (6.7 to 7.0)
7.3 (7.1 to 7.4) ↑ 5.9*
(2.3 to 9.4) 0.4*
(0.2 to 0.6) 6.6
(6.4 to 6.8) 7.2
(7.0 to 7.4) ↑ 8.9* (5.1 to 12.7)
0.6* (0.3 to 0.8)
Trends in Inequality, by Sex
• For male babies, income-related inequality for SGA rates persisted on the absolute and relative scales.
• For female babies, income-related inequality for SGA rates declined on the relative scale and persisted on the absolute scale.
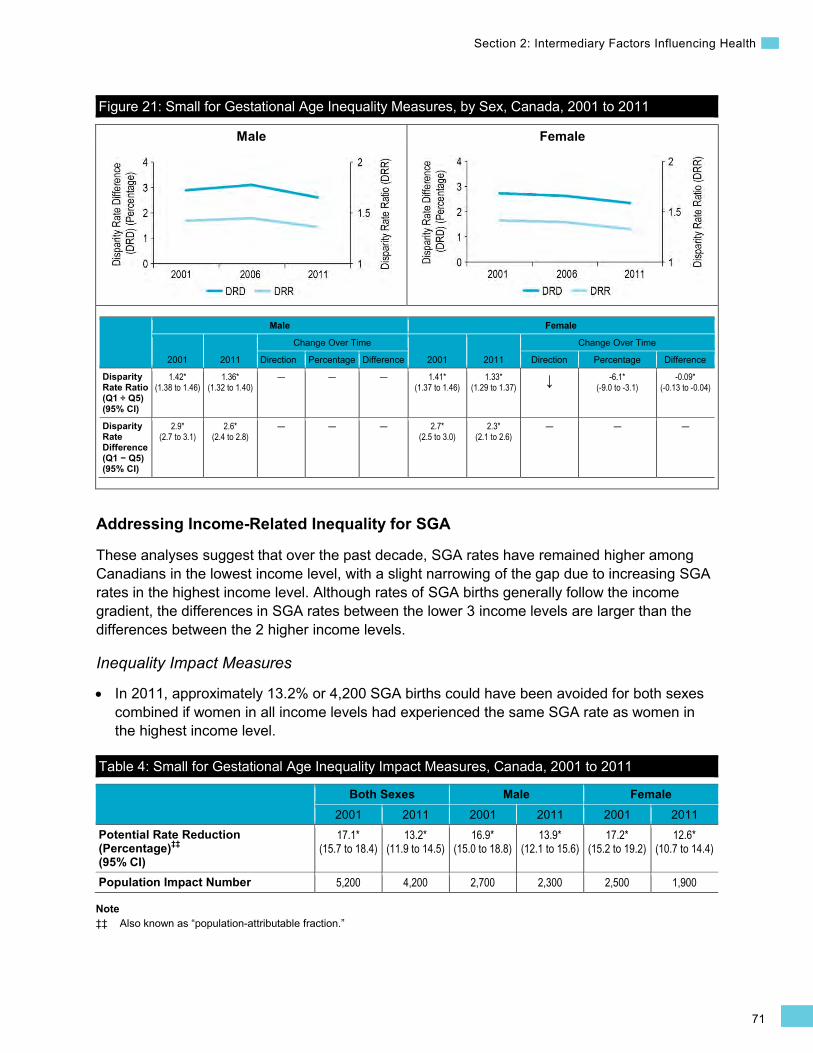
71
Section 2: Intermediary Factors Influencing Health
•
Male Female
Figure 21: Small for Gestational Age Inequality Measures, by Sex, Canada, 2001 to 2011
Male Female
2001 2011
Change Over Time
2001 2011
Change Over Time
Direction Percentage Difference Direction Percentage Difference
Disparity Rate Ratio (Q1 ÷ Q5) (95% CI)
1.42* (1.38 to 1.46)
1.36* (1.32 to 1.40)
— — — 1.41* (1.37 to 1.46)
1.33* (1.29 to 1.37) ↓ -6.1*
(-9.0 to -3.1) -0.09*
(-0.13 to -0.04)
Disparity Rate Difference (Q1 − Q5) (95% CI)
2.9* (2.7 to 3.1)
2.6* (2.4 to 2.8)
— — — 2.7* (2.5 to 3.0)
2.3* (2.1 to 2.6)
— — —
Addressing Income-Related Inequality for SGA
These analyses suggest that over the past decade, SGA rates have remained higher among Canadians in the lowest income level, with a slight narrowing of the gap due to increasing SGA rates in the highest income level. Although rates of SGA births generally follow the income gradient, the differences in SGA rates between the lower 3 income levels are larger than the differences between the 2 higher income levels.
Inequality Impact Measures
In 2011, approximately 13.2% or 4,200 SGA births could have been avoided for both sexes combined if women in all income levels had experienced the same SGA rate as women in the highest income level.
Table 4: Small for Gestational Age Inequality Impact Measures, Canada, 2001 to 2011
Both Sexes Male Female 2001 2011 2001 2011 2001 2011
Potential Rate Reduction (Percentage)‡‡ (95% CI)
17.1* (15.7 to 18.4)
13.2* (11.9 to 14.5)
16.9* (15.0 to 18.8)
13.9* (12.1 to 15.6)
17.2* (15.2 to 19.2)
12.6* (10.7 to 14.4)
Population Impact Number 5,200 4,200 2,700 2,300 2,500 1,900
Note ‡‡ Also known as “population-attributable fraction.”
72
Trends in Income-Related Health Inequalities in Canada
Approaches for Addressing Inequality
Increasing SGA rates among women living in higher-income neighbourhoods and higher overall rates among women living in lower-income neighbourhoods suggest that a combination of both universal and targeted approaches should be considered for reducing the incidence of SGA babies. Moreover, targeted programs that focus on specific risk factors may be needed for both higher- and lower-income women, as risk factors tend to vary according to income level. The risk of SGA births is higher among pregnant women who are in their teens, are underweight and under-nourished, smoke, experience hypertension during pregnancy and use assisted reproductive technologies (ARTs).272, 275, 276 These risk factors, with the exception of ART use, are more prevalent in lower-income populations.272
Maternal under-nutrition is a modifiable risk factor that can be integrated into efforts to prevent adverse birth outcomes in low-income populations.277 Prenatal programs that provide nutrition counselling in combination with food and/or vitamin/mineral supplements are effective approaches for improving the nutritional status of poorly nourished pregnant women, particularly among low-income populations.277, 278 An example of such a program, the Canada Prenatal Nutrition Program, is provided in Box 9.
Over the past decade, fertility rates in Canada have increased in women age 30 and older and declined in those younger than 30.279 The proportion of first-time mothers age 35 and older has tripled to 11% since 1984.280 The trend of having children later in life has resulted in the increased use of fertility assistance, including ARTs, to conceive.280 Studies have shown that ART contributes to rising rates of multiple births and increasing risks for adverse birth outcomes, including SGA births.276 The increased use of ART over the past several years might also have contributed to rising SGA rates in Canada.
Box 9: Prenatal Nutrition Support for Healthy Birth Outcomes, National, 1995 Issue: Income, maternal nutrition, morbidity and environmental exposures are some of the factors leading to adverse birth outcomes such as SGA births among women in lower-income neighbourhoods.281, 282 Interventions that influence positive healthy behaviours and overall maternal health have the potential to modify some these risk factors that lead to adverse birth outcomes.283
Intervention: The Canada Prenatal Nutrition Program (CPNP) provides services that address the needs of at-risk pregnant women with conditions such as poverty, teenage pregnancy or substance abuse that are known to increase the likelihood of unfavourable outcomes for themselves and their infants.283 Services provided by CPNP include nutrition counselling, prenatal vitamins, food and food coupons, and prenatal health and lifestyle counselling.
Rationale/Evidence: Maternal nutrition interventions are efficacious in improving birth outcomes. Initiating contact with the program earlier in pregnancy and remaining enrolled longer are associated with a lower likelihood of SGA births and other adverse birth outcomes.283 An evaluation study found that high exposure to CPNP was associated with 11% lower odds of having an SGA infant.283 A considerable decline in the risk of SGA births was found in high-risk population groups exposed to CPNP. Women with a monthly income of less than $1,000 reduced their risk for SGA births by 18%.283 Such programs have been shown to be among the most cost-effective public health interventions, as they lead to a wide range of beneficial health and social outcomes.284
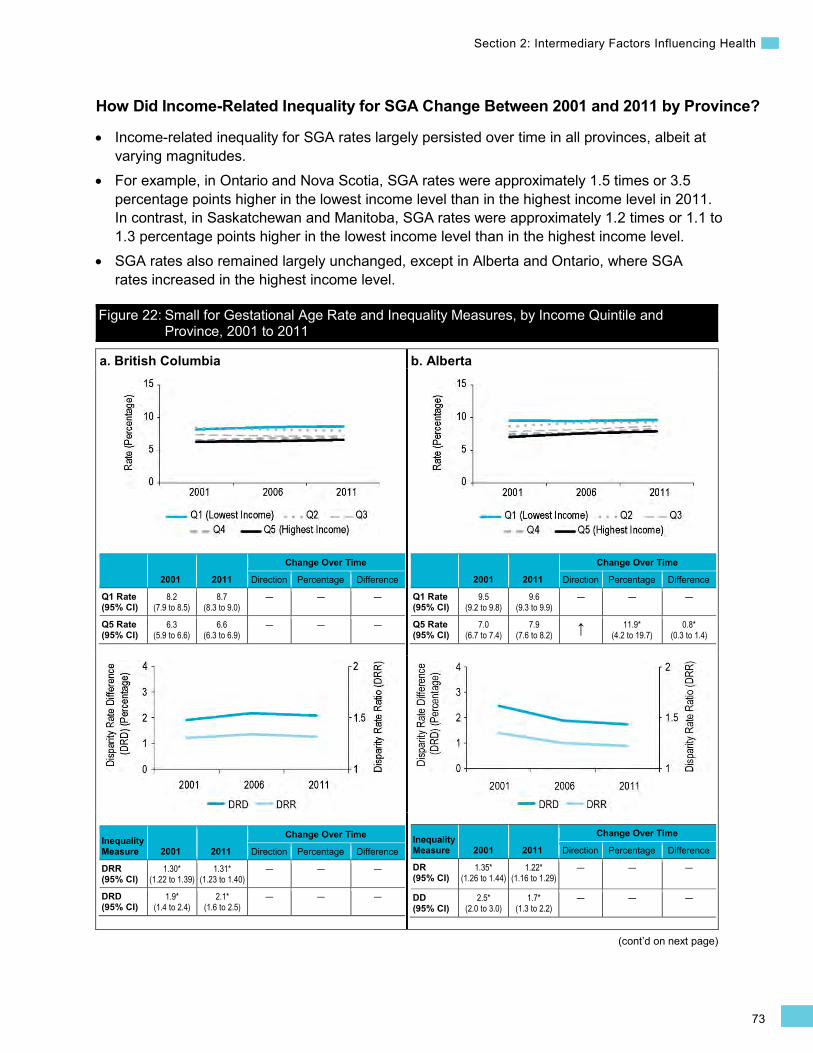
73
Section 2: Intermediary Factors Influencing Health
(cont’d on next page)
How Did Income-Related Inequality for SGA Change Between 2001 and 2011 by Province?
• Income-related inequality for SGA rates largely persisted over time in all provinces, albeit at varying magnitudes.
• For example, in Ontario and Nova Scotia, SGA rates were approximately 1.5 times or 3.5 percentage points higher in the lowest income level than in the highest income level in 2011. In contrast, in Saskatchewan and Manitoba, SGA rates were approximately 1.2 times or 1.1 to 1.3 percentage points higher in the lowest income level than in the highest income level.
• SGA rates also remained largely unchanged, except in Alberta and Ontario, where SGA rates increased in the highest income level.
Figure 22: Small for Gestational Age Rate and Inequality Measures, by Income Quintile and Province, 2001 to 2011
a. British Columbia
2001 2011
Change Over Time
Direction Percentage Difference
Q1 Rate (95% CI)
8.2 (7.9 to 8.5)
8.7 (8.3 to 9.0)
— — —
Q5 Rate (95% CI)
6.3 (5.9 to 6.6)
6.6 (6.3 to 6.9)
— — —
Inequality Measure 2001 2011
Change Over Time
Direction Percentage Difference
DRR (95% CI)
1.30* (1.22 to 1.39)
1.31* (1.23 to 1.40)
— — —
DRD (95% CI)
1.9* (1.4 to 2.4)
2.1* (1.6 to 2.5)
— — —
b. Alberta
2001 2011
Change Over Time
Direction Percentage Difference
Q1 Rate (95% CI)
9.5 (9.2 to 9.8)
9.6 (9.3 to 9.9)
— — —
Q5 Rate (95% CI)
7.0 (6.7 to 7.4)
7.9 (7.6 to 8.2) ↑ 11.9*
(4.2 to 19.7) 0.8*
(0.3 to 1.4)
Inequality Measure 2001 2011
Change Over Time
Direction Percentage Difference
DR (95% CI)
1.35* (1.26 to 1.44)
1.22* (1.16 to 1.29)
— — —
DD (95% CI)
2.5* (2.0 to 3.0)
1.7* (1.3 to 2.2)
— — —
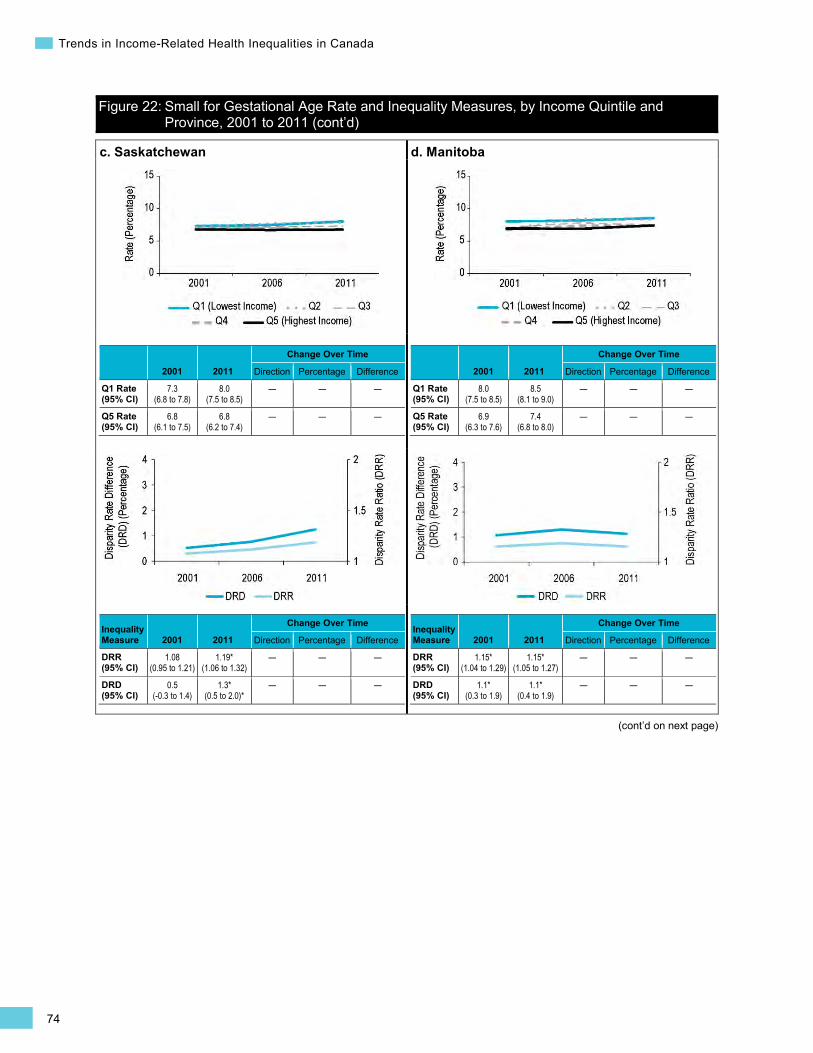
74
Trends in Income-Related Health Inequalities in Canada
(cont’d on next page)
c. Saskatchewan
2001 2011
Change Over Time
Direction Percentage Difference
Q1 Rate (95% CI)
7.3 (6.8 to 7.8)
8.0 (7.5 to 8.5)
— — —
Q5 Rate (95% CI)
6.8 (6.1 to 7.5)
6.8 (6.2 to 7.4)
— — —
Inequality Measure 2001 2011
Change Over Time
Direction Percentage Difference
DRR (95% CI)
1.08 (0.95 to 1.21)
1.19* (1.06 to 1.32)
— — —
DRD (95% CI)
0.5 (-0.3 to 1.4)
1.3* (0.5 to 2.0)*
— — —
d. Manitoba
2001 2011
Change Over Time
Direction Percentage Difference
Q1 Rate (95% CI)
8.0 (7.5 to 8.5)
8.5 (8.1 to 9.0)
— — —
Q5 Rate (95% CI)
6.9 (6.3 to 7.6)
7.4 (6.8 to 8.0)
— — —
Inequality Measure 2001 2011
Change Over Time
Direction Percentage Difference
DRR (95% CI)
1.15* (1.04 to 1.29)
1.15* (1.05 to 1.27)
— — —
DRD (95% CI)
1.1* (0.3 to 1.9)
1.1* (0.4 to 1.9)
— — —
Figure 22: Small for Gestational Age Rate and Inequality Measures, by Income Quintile and Province, 2001 to 2011 (cont’d)

75
Section 2: Intermediary Factors Influencing Health
(cont’d on next page)
e. Ontario
2001 2011
Change Over Time
Direction Percentage Difference
Q1 Rate (95% CI)
10.4 (10.2 to 10.6)
10.6 (10.4 to 10.8)
— — —
Q5 Rate (95% CI)
6.5 (6.3 to 6.7)
7.1 (6.9 to 7.3) ↑ 9.3*
(4.9 to 13.7) 0.6*
(0.3 to 0.9)
Inequality Measure 2001 2011
Change Over Time
Direction Percentage Difference
DRR (95% CI)
1.60* (1.55 to 1.66)
1.50* (1.45 to 1.55)
— — —
DRD (95% CI)
3.9* (3.6 to 4.2)
3.5* (3.3 to 3.8)
— — —
f. Quebec
2001 2011
Change Over Time
Direction Percentage Difference
Q1 Rate (95% CI)
9.9 (9.6 to 10.1)
9.6 (9.3 to 9.8)
— — —
Q5 Rate (95% CI)
7.3 (7.0 to 7.5)
7.6 (7.3 to 7.8)
— — —
Inequality Measure 2001 2011
Change Over Time
Direction Percentage Difference
DRR (95% CI)
1.36* (1.30 to 1.42)
1.26* (1.21 to 1.32)
— — —
DRD (95% CI)
2.6* (2.2 to 3.0)
2.0* (1.7 to 2.3)
— — —
Figure 22: Small for Gestational Age Rate and Inequality Measures, by Income Quintile and Province, 2001 to 2011 (cont’d)
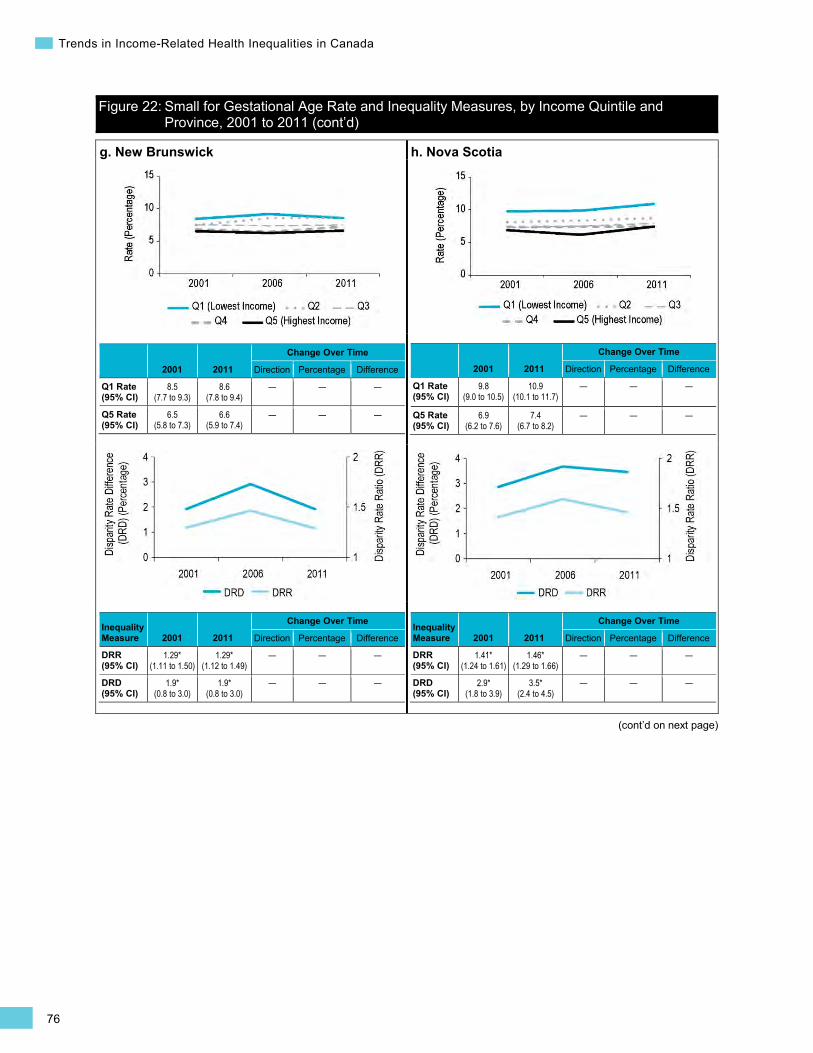
76
Trends in Income-Related Health Inequalities in Canada
(cont’d on next page)
g. New Brunswick
2001 2011
Change Over Time
Direction Percentage Difference
Q1 Rate (95% CI)
8.5 (7.7 to 9.3)
8.6 (7.8 to 9.4)
— — —
Q5 Rate (95% CI)
6.5 (5.8 to 7.3)
6.6 (5.9 to 7.4)
— — —
Inequality Measure 2001 2011
Change Over Time
Direction Percentage Difference
DRR (95% CI)
1.29* (1.11 to 1.50)
1.29* (1.12 to 1.49)
— — —
DRD (95% CI)
1.9* (0.8 to 3.0)
1.9* (0.8 to 3.0)
— — —
h. Nova Scotia
2001 2011
Change Over Time
Direction Percentage Difference
Q1 Rate (95% CI)
9.8 (9.0 to 10.5)
10.9 (10.1 to 11.7)
— — —
Q5 Rate (95% CI)
6.9 (6.2 to 7.6)
7.4 (6.7 to 8.2)
— — —
Inequality Measure 2001 2011
Change Over Time
Direction Percentage Difference
DRR (95% CI)
1.41* (1.24 to 1.61)
1.46* (1.29 to 1.66)
— — —
DRD (95% CI)
2.9* (1.8 to 3.9)
3.5* (2.4 to 4.5)
— — —
Figure 22: Small for Gestational Age Rate and Inequality Measures, by Income Quintile and Province, 2001 to 2011 (cont’d)
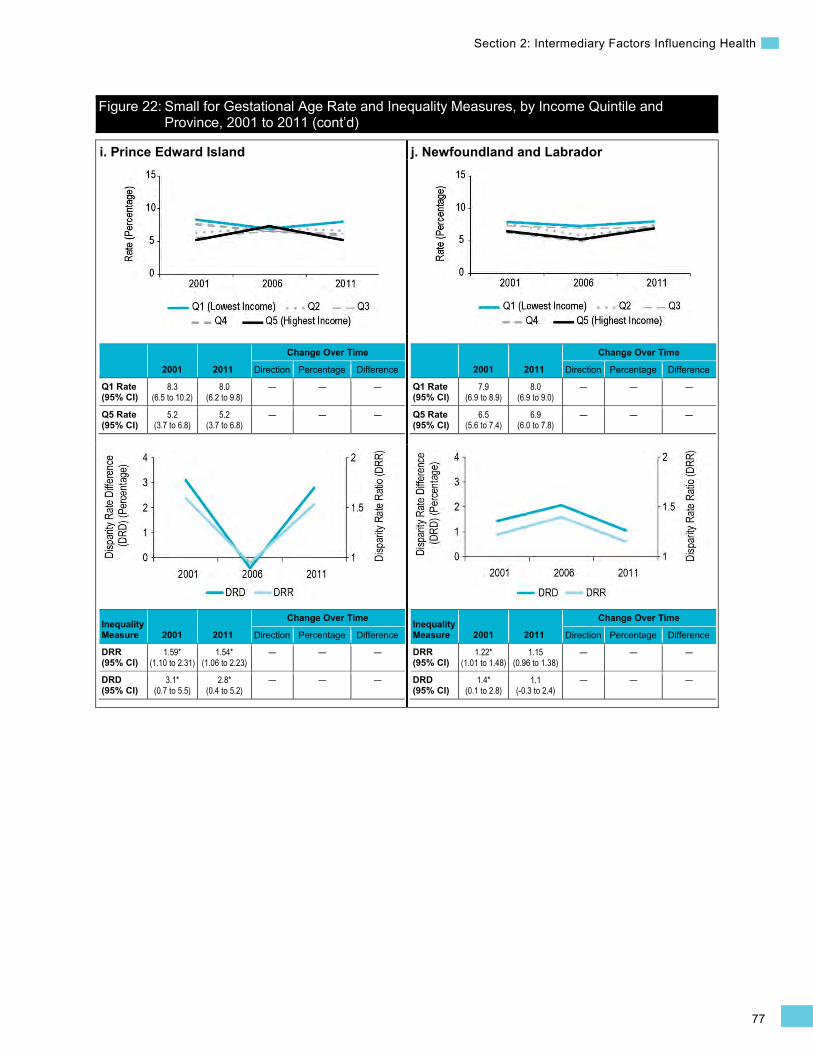
77
Section 2: Intermediary Factors Influencing Health
i. Prince Edward Island
2001 2011
Change Over Time
Direction Percentage Difference
Q1 Rate (95% CI)
8.3 (6.5 to 10.2)
8.0 (6.2 to 9.8)
— — —
Q5 Rate (95% CI)
5.2 (3.7 to 6.8)
5.2 (3.7 to 6.8)
— — —
Inequality Measure 2001 2011
Change Over Time
Direction Percentage Difference
DRR (95% CI)
1.59* (1.10 to 2.31)
1.54* (1.06 to 2.23)
— — —
DRD (95% CI)
3.1* (0.7 to 5.5)
2.8* (0.4 to 5.2)
— — —
j. Newfoundland and Labrador
2001 2011
Change Over Time
Direction Percentage Difference
Q1 Rate (95% CI)
7.9 (6.9 to 8.9)
8.0 (6.9 to 9.0)
— — —
Q5 Rate (95% CI)
6.5 (5.6 to 7.4)
6.9 (6.0 to 7.8)
— — —
Inequality Measure 2001 2011
Change Over Time
Direction Percentage Difference
DRR (95% CI)
1.22* (1.01 to 1.48)
1.15 (0.96 to 1.38)
— — —
DRD (95% CI)
1.4* (0.1 to 2.8)
1.1 (-0.3 to 2.4)
— — —
Figure 22: Small for Gestational Age Rate and Inequality Measures, by Income Quintile and Province, 2001 to 2011 (cont’d)
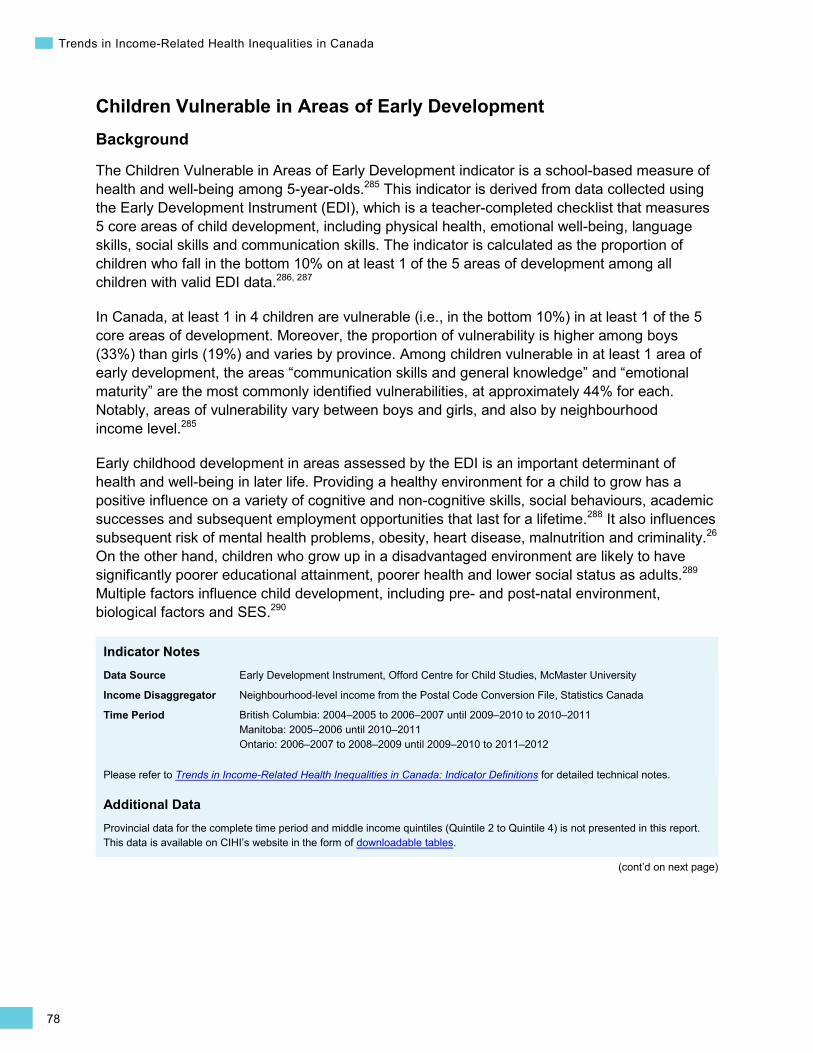
78
Trends in Income-Related Health Inequalities in Canada
(cont’d on next page)
Children Vulnerable in Areas of Early Development Background
The Children Vulnerable in Areas of Early Development indicator is a school-based measure of health and well-being among 5-year-olds.285 This indicator is derived from data collected using the Early Development Instrument (EDI), which is a teacher-completed checklist that measures 5 core areas of child development, including physical health, emotional well-being, language skills, social skills and communication skills. The indicator is calculated as the proportion of children who fall in the bottom 10% on at least 1 of the 5 areas of development among all children with valid EDI data.286, 287
In Canada, at least 1 in 4 children are vulnerable (i.e., in the bottom 10%) in at least 1 of the 5 core areas of development. Moreover, the proportion of vulnerability is higher among boys (33%) than girls (19%) and varies by province. Among children vulnerable in at least 1 area of early development, the areas “communication skills and general knowledge” and “emotional maturity” are the most commonly identified vulnerabilities, at approximately 44% for each. Notably, areas of vulnerability vary between boys and girls, and also by neighbourhood income level.285
Early childhood development in areas assessed by the EDI is an important determinant of health and well-being in later life. Providing a healthy environment for a child to grow has a positive influence on a variety of cognitive and non-cognitive skills, social behaviours, academic successes and subsequent employment opportunities that last for a lifetime.288 It also influences subsequent risk of mental health problems, obesity, heart disease, malnutrition and criminality.26 On the other hand, children who grow up in a disadvantaged environment are likely to have significantly poorer educational attainment, poorer health and lower social status as adults.289 Multiple factors influence child development, including pre- and post-natal environment, biological factors and SES.290
Indicator Notes Data Source Early Development Instrument, Offord Centre for Child Studies, McMaster University
Income Disaggregator Neighbourhood-level income from the Postal Code Conversion File, Statistics Canada
Time Period British Columbia: 2004–2005 to 2006–2007 until 2009–2010 to 2010–2011 Manitoba: 2005–2006 until 2010–2011 Ontario: 2006–2007 to 2008–2009 until 2009–2010 to 2011–2012
Please refer to Trends in Income-Related Health Inequalities in Canada: Indicator Definitions for detailed technical notes.
Additional Data Provincial data for the complete time period and middle income quintiles (Quintile 2 to Quintile 4) is not presented in this report. This data is available on CIHI’s website in the form of downloadable tables.

79
Section 2: Intermediary Factors Influencing Health
Symbols and Abbreviations
* Estimate is statistically significant (i.e., statistically different from 1 for DRR or different from 0 for DRD, PRR, Change Over Time Percentage and Change Over Time Difference, based on the 95% CI)
Q1 Quintile 1 (lowest income quintile)
Q5 Quintile 5 (highest income quintile)
95% CI 95% confidence interval
↑ Statistically significant increase between first and last available estimates
↓ Statistically significant decrease between first and last available estimates
— No statistically significant change between first and last available estimates
Additional Note Data collection for the EDI is relatively new in Canada, with variation in collection among provinces and territories. Given this variation, short-term trend analyses are available for only British Columbia, Manitoba and Ontario.
How Has Income-Related Inequality for Children Vulnerable in Areas of Early Development Changed Over Time?
Income-related inequality for vulnerability rates (or rates of Children Vulnerable in Areas of Early Development) persisted over time in all 3 provinces (British Columbia, Manitoba and Ontario) for which data over time was available, while trends in vulnerability rates varied among the 3 provinces.
Trends in Rates, by Income
• In British Columbia, vulnerability rates increased by 5.4% or 1.7 percentage points across all income levels combined from 2004–2005 to 2006–2007 until 2009–2010 to 2010–2011. However, there was no change in vulnerability rates among children in the lowest and highest income levels.
• In Manitoba, vulnerability rates remained stable across all income levels between the 2005–2006 and 2010–2011 data cycles.
• In Ontario, vulnerability rates decreased by 4.0% or 1.0 percentage points across all income levels combined between the 2006–2007 to 2008–2009 and 2009–2010 to 2011–2012 data cycles. During these years, vulnerability rates for children in the lowest income level decreased by 4.4% or 1.5 percentage points, while there was no change in rates for children in the highest income level.
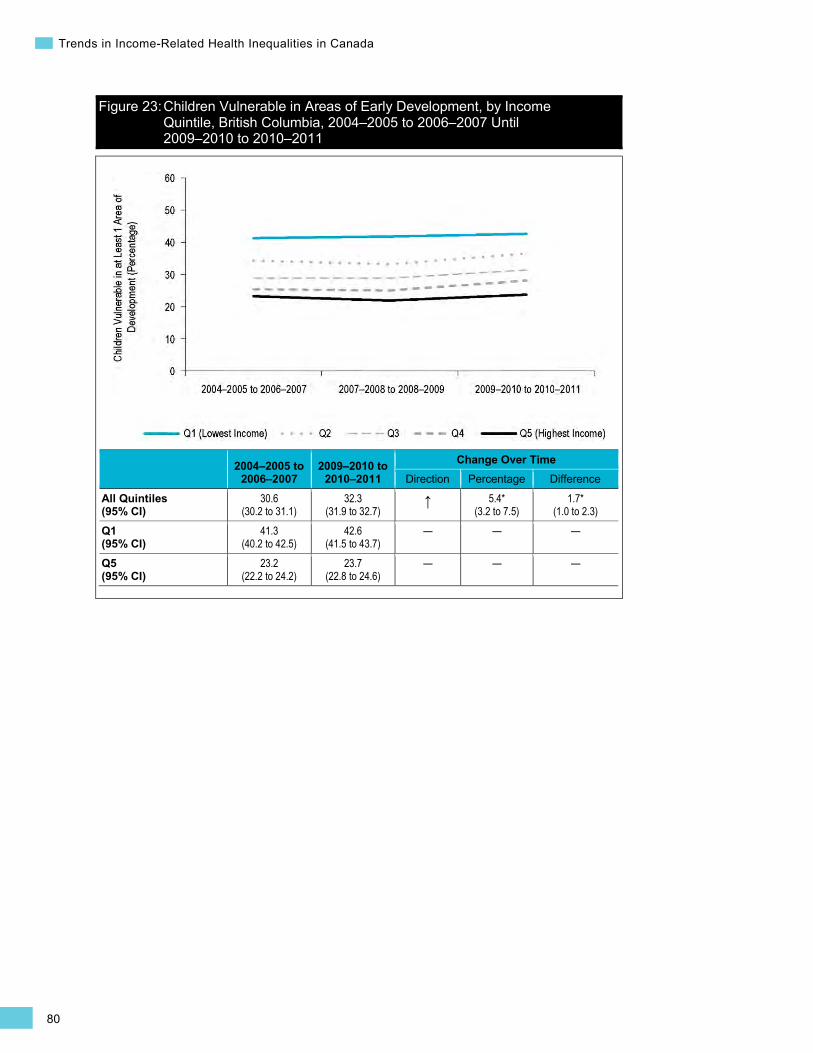
80
Trends in Income-Related Health Inequalities in Canada
Figure 23: Children Vulnerable in Areas of Early Development, by Income Quintile, British Columbia, 2004–2005 to 2006–2007 Until 2009–2010 to 2010–2011
2004–2005 to 2006–2007
2009–2010 to 2010–2011
Change Over Time Direction Percentage Difference
All Quintiles (95% CI)
30.6 (30.2 to 31.1)
32.3 (31.9 to 32.7)
↑ 5.4* (3.2 to 7.5)
1.7* (1.0 to 2.3)
Q1 (95% CI)
41.3 (40.2 to 42.5)
42.6 (41.5 to 43.7)
— — —
Q5 (95% CI)
23.2 (22.2 to 24.2)
23.7 (22.8 to 24.6)
— — —
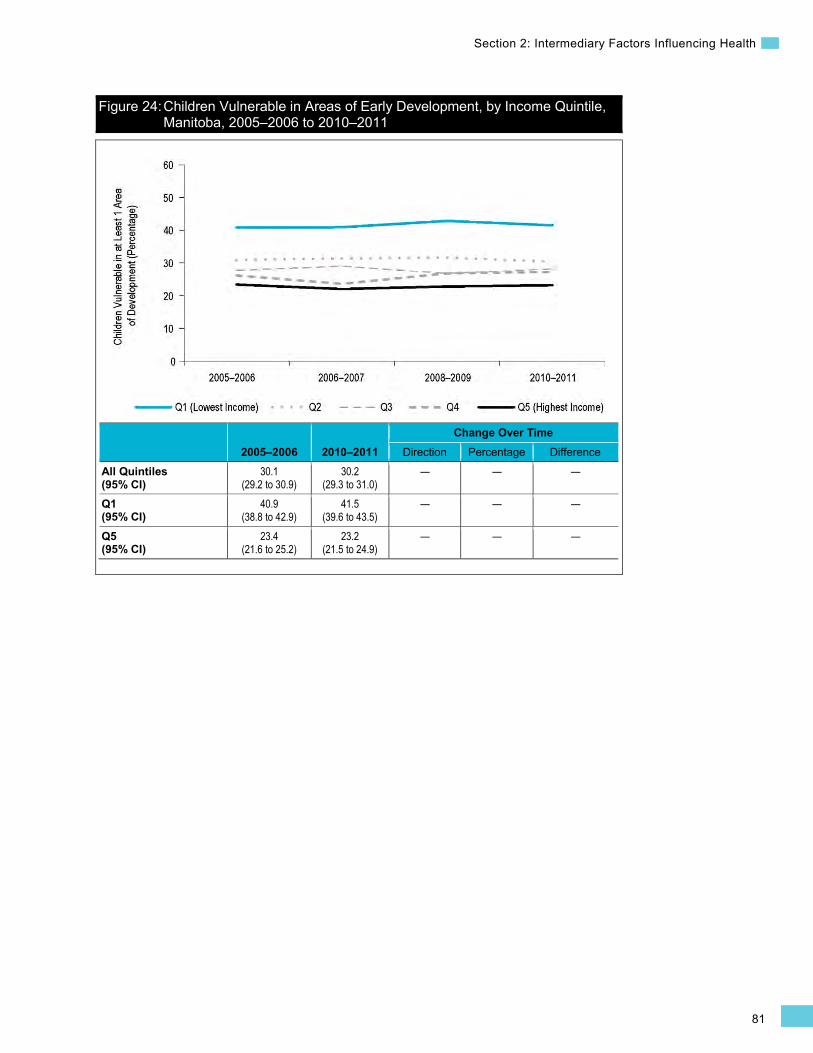
81
Section 2: Intermediary Factors Influencing Health
Figure 24: Children Vulnerable in Areas of Early Development, by Income Quintile, Manitoba, 2005–2006 to 2010–2011
2005–2006 2010–2011 Change Over Time
Direction Percentage Difference All Quintiles (95% CI)
30.1 (29.2 to 30.9)
30.2 (29.3 to 31.0)
— — —
Q1 (95% CI)
40.9 (38.8 to 42.9)
41.5 (39.6 to 43.5)
— — —
Q5 (95% CI)
23.4 (21.6 to 25.2)
23.2 (21.5 to 24.9)
— — —

82
Trends in Income-Related Health Inequalities in Canada
Figure 25: Children Vulnerable in Areas of Early Development, by Income Quintile, Ontario, 2006–2007 to 2008–2009 Until 2009–2010 to 2011–2012
2006–2007 to 2008–2009
2009–2010 to 2011–2012
Change Over Time Direction Percentage Difference
All Quintiles (95% CI)
25.3 (25.1 to 25.6)
24.3 (24.1 to 24.6)
↓ -4.0* (-5.3 to -2.6)
-1.0* (-1.4 to -0.7)
Q1 (95% CI)
35.2 (34.6 to 35.8)
33.7 (33.0 to 34.3)
↓ -4.4* (-6.8 to -2.0)
-1.5* (-2.4 to -0.7)
Q5 (95% CI)
17.9 (17.4 to 18.4)
17.4 (16.9 to 17.9)
— — —
Trends in Inequality
• Income-related inequality for vulnerability rates persisted on both the relative and absolute scales in all 3 provinces (British Columbia, Manitoba and Ontario).
• In the most recently reported time period, vulnerability rates were 1.79 to 1.93 times or approximately 16 to 19 percentage points higher in the lowest income level than in the highest income level.
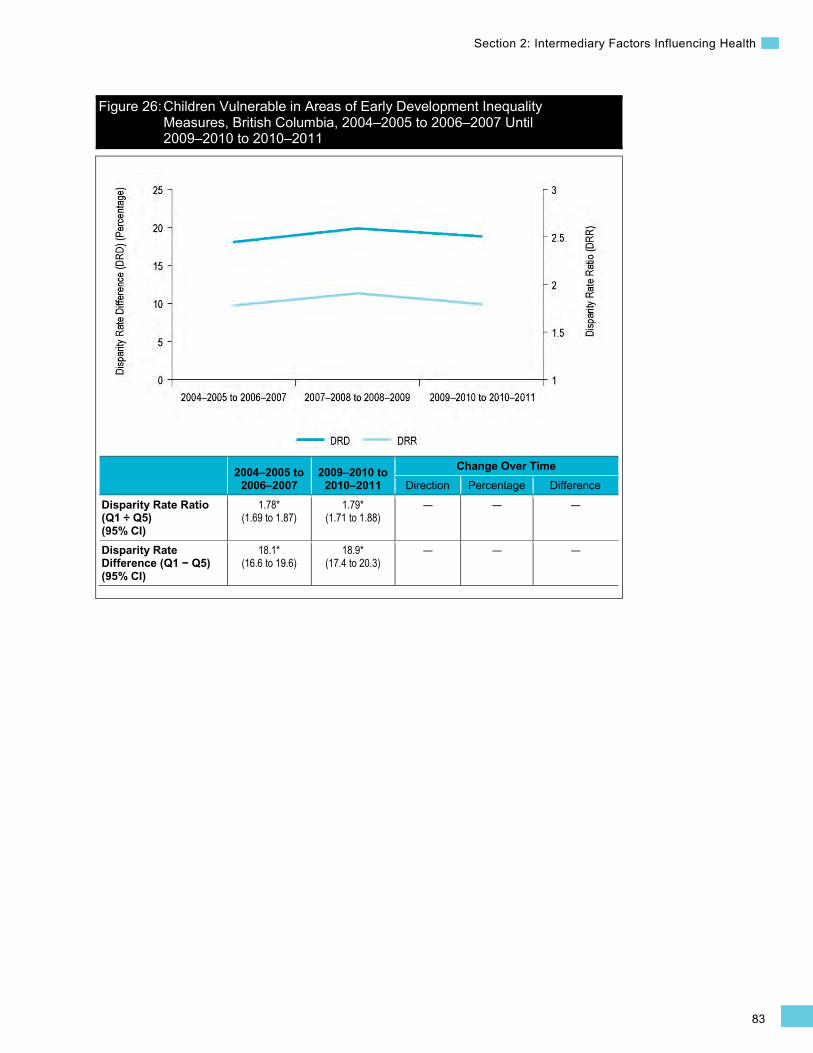
83
Section 2: Intermediary Factors Influencing Health
Figure 26: Children Vulnerable in Areas of Early Development Inequality Measures, British Columbia, 2004–2005 to 2006–2007 Until 2009–2010 to 2010–2011
2004–2005 to 2006–2007
2009–2010 to 2010–2011
Change Over Time Direction Percentage Difference
Disparity Rate Ratio (Q1 ÷ Q5) (95% CI)
1.78* (1.69 to 1.87)
1.79* (1.71 to 1.88)
— — —
Disparity Rate Difference (Q1 − Q5) (95% CI)
18.1* (16.6 to 19.6)
18.9* (17.4 to 20.3)
— — —
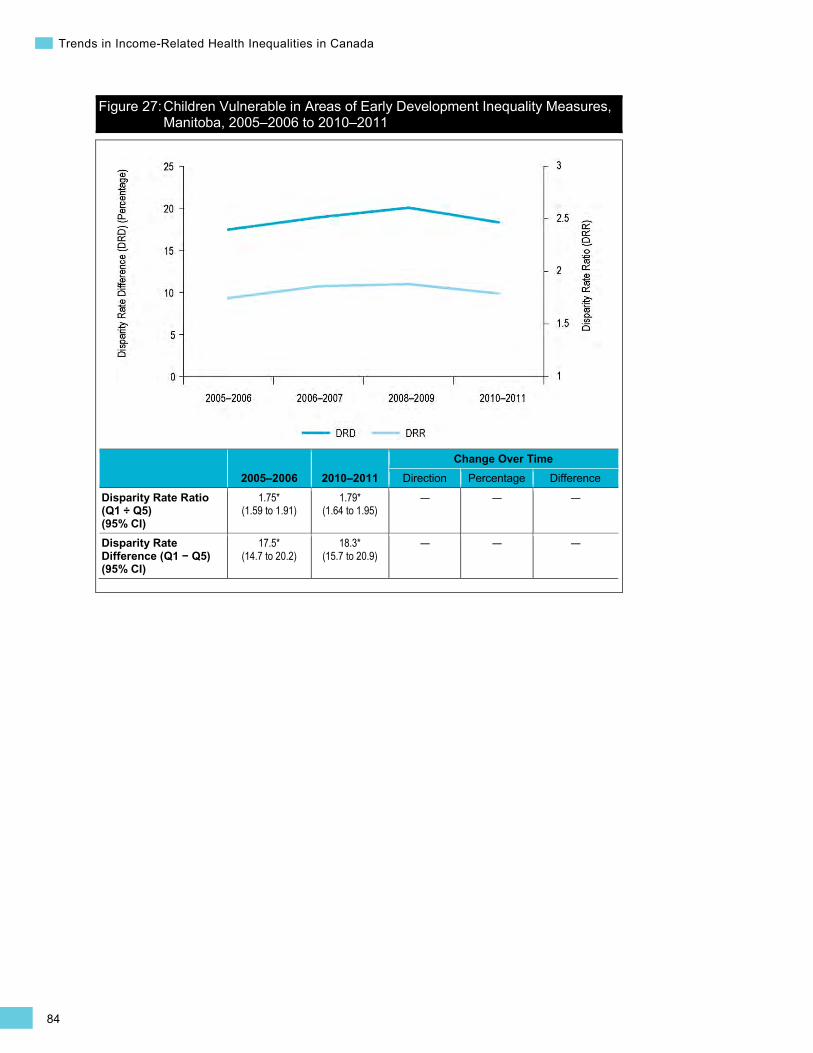
84
Trends in Income-Related Health Inequalities in Canada
Figure 27: Children Vulnerable in Areas of Early Development Inequality Measures, Manitoba, 2005–2006 to 2010–2011
2005–2006 2010–2011 Change Over Time
Direction Percentage Difference
Disparity Rate Ratio (Q1 ÷ Q5) (95% CI)
1.75* (1.59 to 1.91)
1.79* (1.64 to 1.95)
— — —
Disparity Rate Difference (Q1 − Q5) (95% CI)
17.5* (14.7 to 20.2)
18.3* (15.7 to 20.9)
— — —
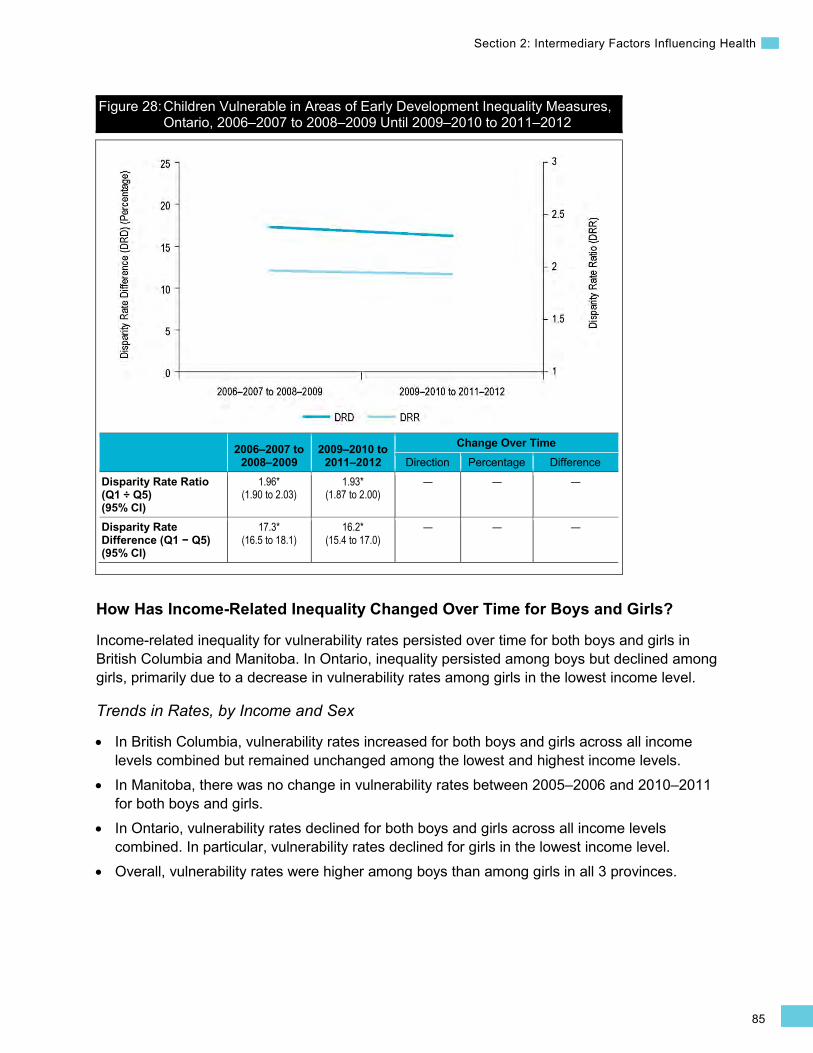
85
Section 2: Intermediary Factors Influencing Health
Figure 28: Children Vulnerable in Areas of Early Development Inequality Measures, Ontario, 2006–2007 to 2008–2009 Until 2009–2010 to 2011–2012
2006–2007 to 2008–2009
2009–2010 to 2011–2012
Change Over Time Direction Percentage Difference
Disparity Rate Ratio (Q1 ÷ Q5) (95% CI)
1.96* (1.90 to 2.03)
1.93* (1.87 to 2.00)
— — —
Disparity Rate Difference (Q1 − Q5) (95% CI)
17.3* (16.5 to 18.1)
16.2* (15.4 to 17.0)
— — —
How Has Income-Related Inequality Changed Over Time for Boys and Girls?
Income-related inequality for vulnerability rates persisted over time for both boys and girls in British Columbia and Manitoba. In Ontario, inequality persisted among boys but declined among girls, primarily due to a decrease in vulnerability rates among girls in the lowest income level.
Trends in Rates, by Income and Sex
• In British Columbia, vulnerability rates increased for both boys and girls across all income levels combined but remained unchanged among the lowest and highest income levels.
• In Manitoba, there was no change in vulnerability rates between 2005–2006 and 2010–2011 for both boys and girls.
• In Ontario, vulnerability rates declined for both boys and girls across all income levels combined. In particular, vulnerability rates declined for girls in the lowest income level.
• Overall, vulnerability rates were higher among boys than among girls in all 3 provinces.
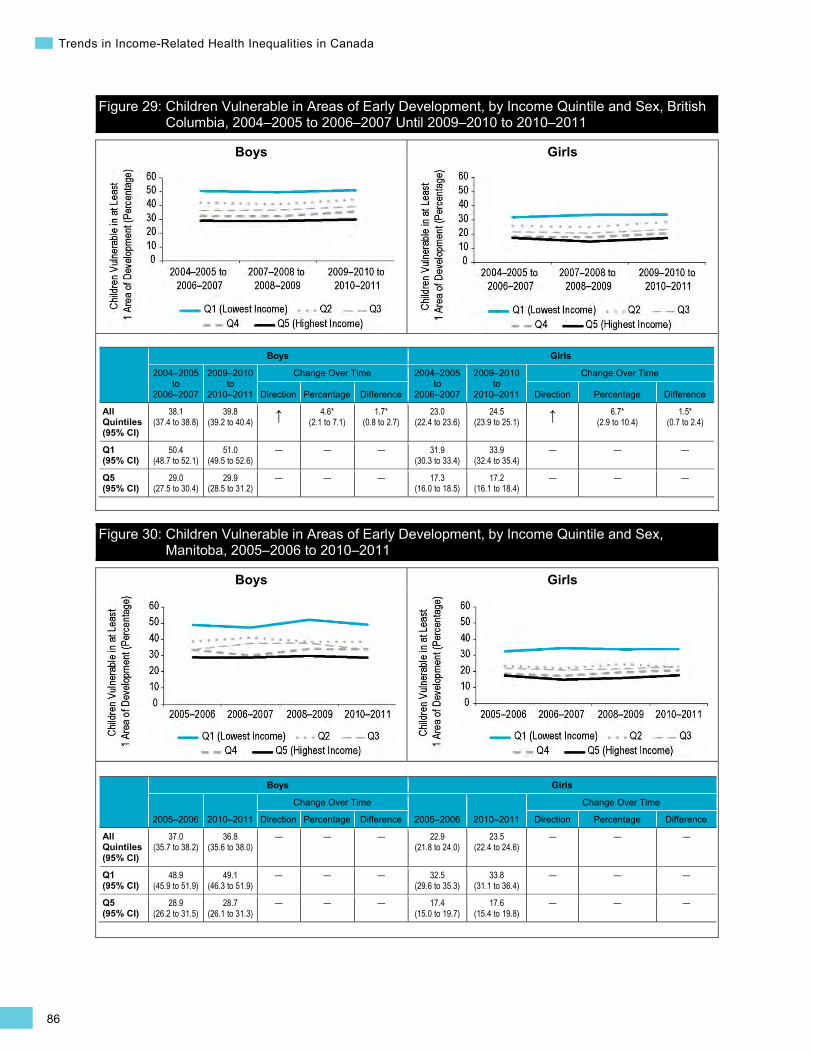
86
Trends in Income-Related Health Inequalities in Canada
Boys Girls
Boys Girls
Figure 29: Children Vulnerable in Areas of Early Development, by Income Quintile and Sex, British Columbia, 2004–2005 to 2006–2007 Until 2009–2010 to 2010–2011
Boys Girls
2004–2005 to
2006–2007
2009–2010 to
2010–2011
Change Over Time 2004–2005 to
2006–2007
2009–2010 to
2010–2011
Change Over Time
Direction Percentage Difference Direction Percentage Difference
All Quintiles (95% CI)
38.1 (37.4 to 38.8)
39.8 (39.2 to 40.4) ↑ 4.6*
(2.1 to 7.1) 1.7*
(0.8 to 2.7) 23.0
(22.4 to 23.6) 24.5
(23.9 to 25.1) ↑ 6.7* (2.9 to 10.4)
1.5* (0.7 to 2.4)
Q1 (95% CI)
50.4 (48.7 to 52.1)
51.0 (49.5 to 52.6)
— — — 31.9 (30.3 to 33.4)
33.9 (32.4 to 35.4)
— — —
Q5 (95% CI)
29.0 (27.5 to 30.4)
29.9 (28.5 to 31.2)
— — — 17.3 (16.0 to 18.5)
17.2 (16.1 to 18.4)
— — —
Figure 30: Children Vulnerable in Areas of Early Development, by Income Quintile and Sex, Manitoba, 2005–2006 to 2010–2011
Boys Girls
2005–2006 2010–2011
Change Over Time
2005–2006 2010–2011
Change Over Time
Direction Percentage Difference Direction Percentage Difference
All Quintiles (95% CI)
37.0 (35.7 to 38.2)
36.8 (35.6 to 38.0)
— — — 22.9 (21.8 to 24.0)
23.5 (22.4 to 24.6)
— — —
Q1 (95% CI)
48.9 (45.9 to 51.9)
49.1 (46.3 to 51.9)
— — — 32.5 (29.6 to 35.3)
33.8 (31.1 to 36.4)
— — —
Q5 (95% CI)
28.9 (26.2 to 31.5)
28.7 (26.1 to 31.3)
— — — 17.4 (15.0 to 19.7)
17.6 (15.4 to 19.8)
— — —
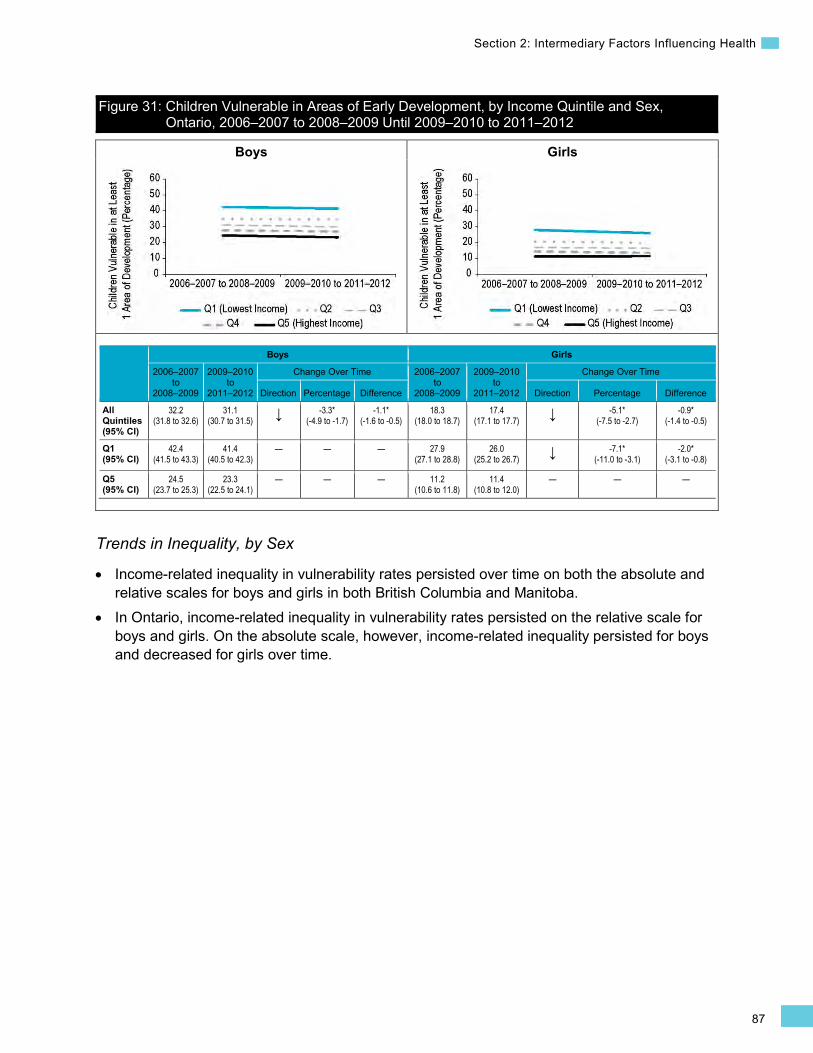
87
Section 2: Intermediary Factors Influencing Health
Boys Girls
Figure 31: Children Vulnerable in Areas of Early Development, by Income Quintile and Sex, Ontario, 2006–2007 to 2008–2009 Until 2009–2010 to 2011–2012
Boys Girls
2006–2007 to
2008–2009
2009–2010 to
2011–2012
Change Over Time 2006–2007 to
2008–2009
2009–2010 to
2011–2012
Change Over Time
Direction Percentage Difference Direction Percentage Difference
All Quintiles (95% CI)
32.2 (31.8 to 32.6)
31.1 (30.7 to 31.5) ↓ -3.3*
(-4.9 to -1.7) -1.1*
(-1.6 to -0.5) 18.3
(18.0 to 18.7) 17.4
(17.1 to 17.7) ↓ -5.1* (-7.5 to -2.7)
-0.9* (-1.4 to -0.5)
Q1 (95% CI)
42.4 (41.5 to 43.3)
41.4 (40.5 to 42.3)
— — — 27.9 (27.1 to 28.8)
26.0 (25.2 to 26.7) ↓ -7.1*
(-11.0 to -3.1) -2.0*
(-3.1 to -0.8)
Q5 (95% CI)
24.5 (23.7 to 25.3)
23.3 (22.5 to 24.1)
— — — 11.2 (10.6 to 11.8)
11.4 (10.8 to 12.0)
— — —
Trends in Inequality, by Sex
• Income-related inequality in vulnerability rates persisted over time on both the absolute and relative scales for boys and girls in both British Columbia and Manitoba.
• In Ontario, income-related inequality in vulnerability rates persisted on the relative scale for boys and girls. On the absolute scale, however, income-related inequality persisted for boys and decreased for girls over time.
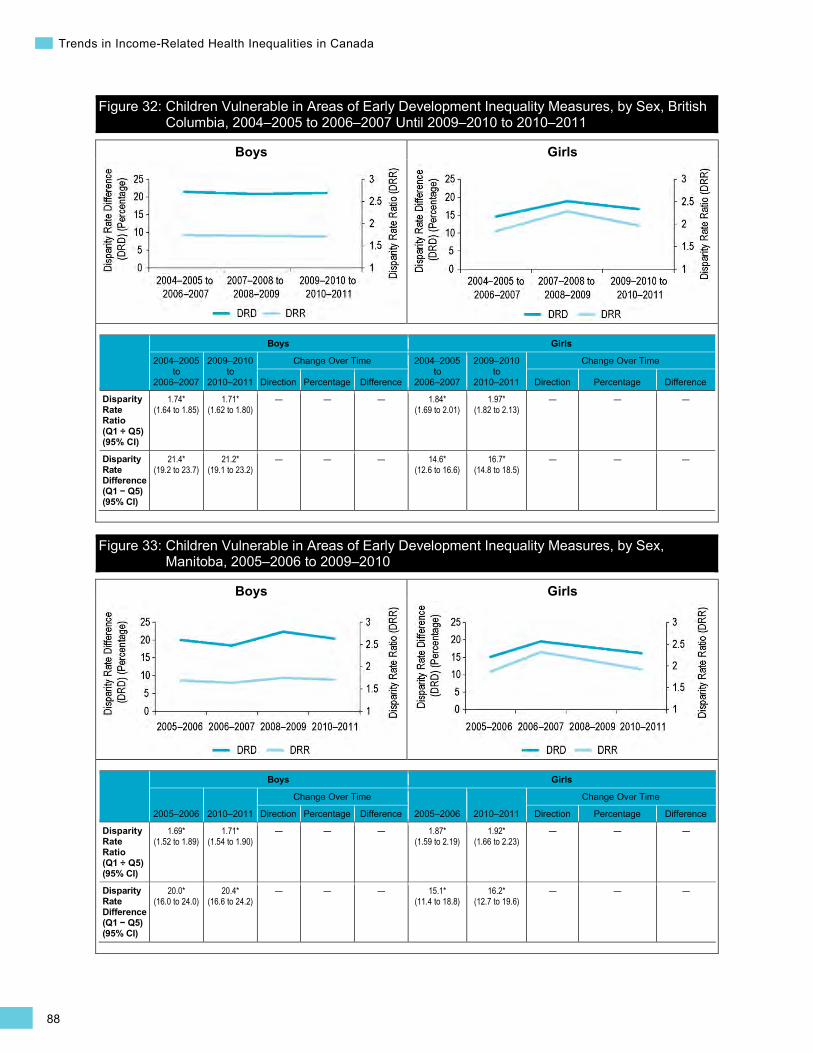
88
Trends in Income-Related Health Inequalities in Canada
Boys Girls
Boys Girls
Figure 32: Children Vulnerable in Areas of Early Development Inequality Measures, by Sex, British Columbia, 2004–2005 to 2006–2007 Until 2009–2010 to 2010–2011
Boys Girls
2004–2005 to
2006–2007
2009–2010 to
2010–2011
Change Over Time 2004–2005 to
2006–2007
2009–2010 to
2010–2011
Change Over Time
Direction Percentage Difference Direction Percentage Difference
Disparity Rate Ratio (Q1 ÷ Q5) (95% CI)
1.74* (1.64 to 1.85)
1.71* (1.62 to 1.80)
— — — 1.84* (1.69 to 2.01)
1.97* (1.82 to 2.13)
— — —
Disparity Rate Difference (Q1 − Q5) (95% CI)
21.4* (19.2 to 23.7)
21.2* (19.1 to 23.2)
— — — 14.6* (12.6 to 16.6)
16.7* (14.8 to 18.5)
— — —
Figure 33: Children Vulnerable in Areas of Early Development Inequality Measures, by Sex, Manitoba, 2005–2006 to 2009–2010
Boys Girls
2005–2006 2010–2011
Change Over Time
2005–2006 2010–2011
Change Over Time
Direction Percentage Difference Direction Percentage Difference
Disparity Rate Ratio (Q1 ÷ Q5) (95% CI)
1.69* (1.52 to 1.89)
1.71* (1.54 to 1.90)
— — — 1.87* (1.59 to 2.19)
1.92* (1.66 to 2.23)
— — —
Disparity Rate Difference (Q1 − Q5) (95% CI)
20.0* (16.0 to 24.0)
20.4* (16.6 to 24.2)
— — — 15.1* (11.4 to 18.8)
16.2* (12.7 to 19.6)
— — —

89
Section 2: Intermediary Factors Influencing Health
Boys Girls
Figure 34: Children Vulnerable in Areas of Early Development Inequality Measures, by Sex, Ontario, 2006–2007 to 2008–2009 Until 2009–2010 to 2011–2012
Boys Girls
2006–2007 to
2008–2009
2009–2010 to
2011–2012
Change Over Time 2006–2007 to
2008–2009
2009–2010 to
2011–2012
Change Over Time
Direction Percentage Difference Direction Percentage Difference
Disparity Rate Ratio (Q1 ÷ Q5) (95% CI)
1.73* (1.66 to 1.80)
1.78* (1.71 to 1.85)
— — — 2.50* (2.35 to 2.66)
2.28* (2.14 to 2.42)
— — —
Disparity Rate Difference (Q1 − Q5) (95% CI)
17.9* (16.7 to 19.1)
18.1* (16.9 to 19.3)
— — — 16.7* (15.7 to 17.8)
14.6* (13.6 to 15.5) ↓ -13.0*
(-21.0 to -5.0) -2.2*
(-3.6 to -0.7)
Addressing Income-Related Inequality for Children Vulnerable in Areas of Early Development
In recent years, income-related inequality persisted in all 3 provinces, while vulnerability rates increased in British Columbia, remained stable in Manitoba and decreased in Ontario. In British Columbia and Ontario, vulnerability rates generally increased along the income gradient, whereas in Manitoba, the difference was largest between the lowest and second-lowest income levels.
Inequality Impact Measures
In the most recent time point, approximately 23% to 29% or 14,800 fewer children living in British Columbia, Manitoba and Ontario would have had vulnerabilities in areas of early development if children in all income levels had experienced the same rate of vulnerability as those in the highest income level in their respective provinces.
•
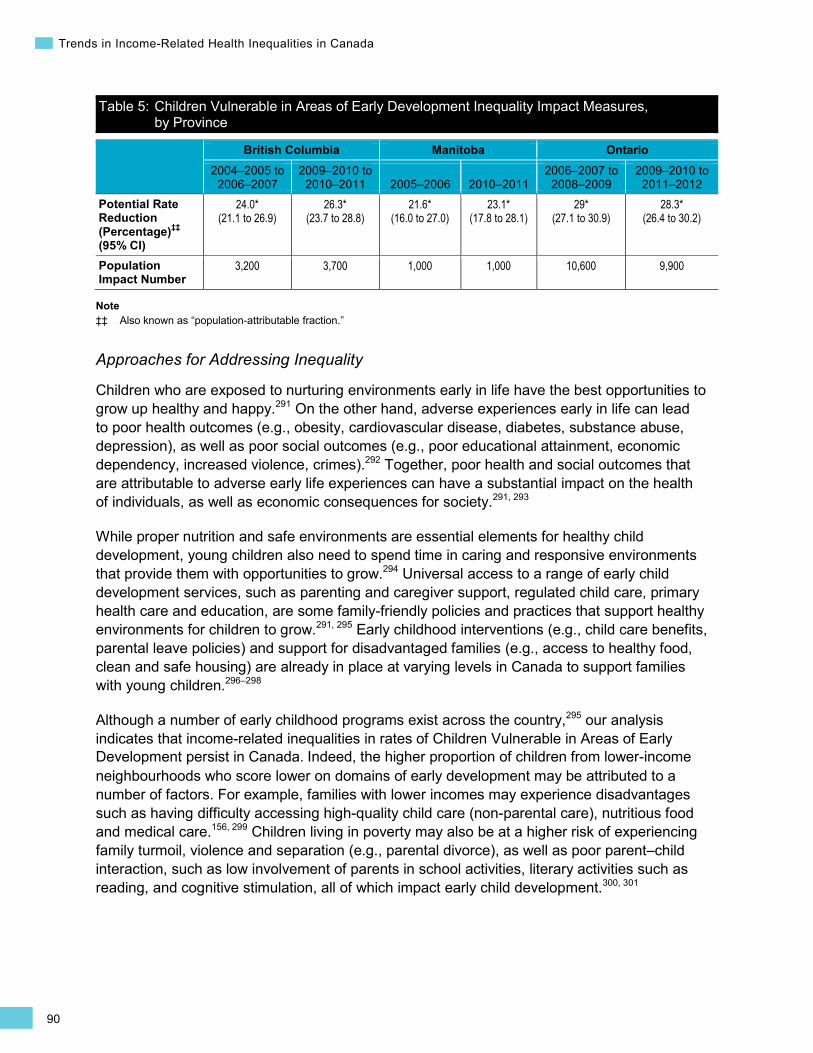
90
Trends in Income-Related Health Inequalities in Canada
Table 5: Children Vulnerable in Areas of Early Development Inequality Impact Measures, by Province
British Columbia Manitoba Ontario 2004–2005 to
2006–2007 2009–2010 to
2010–2011 2005–2006 2010–2011 2006–2007 to
2008–2009 2009–2010 to
2011–2012 Potential Rate Reduction (Percentage)‡‡ (95% CI)
24.0* (21.1 to 26.9)
26.3* (23.7 to 28.8)
21.6* (16.0 to 27.0)
23.1* (17.8 to 28.1)
29* (27.1 to 30.9)
28.3* (26.4 to 30.2)
Population Impact Number
3,200 3,700 1,000 1,000 10,600 9,900
Note ‡‡ Also known as “population-attributable fraction.”
Approaches for Addressing Inequality
Children who are exposed to nurturing environments early in life have the best opportunities to grow up healthy and happy.291 On the other hand, adverse experiences early in life can lead to poor health outcomes (e.g., obesity, cardiovascular disease, diabetes, substance abuse, depression), as well as poor social outcomes (e.g., poor educational attainment, economic dependency, increased violence, crimes).292 Together, poor health and social outcomes that are attributable to adverse early life experiences can have a substantial impact on the health of individuals, as well as economic consequences for society.291, 293
While proper nutrition and safe environments are essential elements for healthy child development, young children also need to spend time in caring and responsive environments that provide them with opportunities to grow.294 Universal access to a range of early child development services, such as parenting and caregiver support, regulated child care, primary health care and education, are some family-friendly policies and practices that support healthy environments for children to grow.291, 295 Early childhood interventions (e.g., child care benefits, parental leave policies) and support for disadvantaged families (e.g., access to healthy food, clean and safe housing) are already in place at varying levels in Canada to support families with young children.296–298
Although a number of early childhood programs exist across the country,295 our analysis indicates that income-related inequalities in rates of Children Vulnerable in Areas of Early Development persist in Canada. Indeed, the higher proportion of children from lower-income neighbourhoods who score lower on domains of early development may be attributed to a number of factors. For example, families with lower incomes may experience disadvantages such as having difficulty accessing high-quality child care (non-parental care), nutritious food and medical care.156, 299 Children living in poverty may also be at a higher risk of experiencing family turmoil, violence and separation (e.g., parental divorce), as well as poor parent–child interaction, such as low involvement of parents in school activities, literary activities such as reading, and cognitive stimulation, all of which impact early child development.300, 301
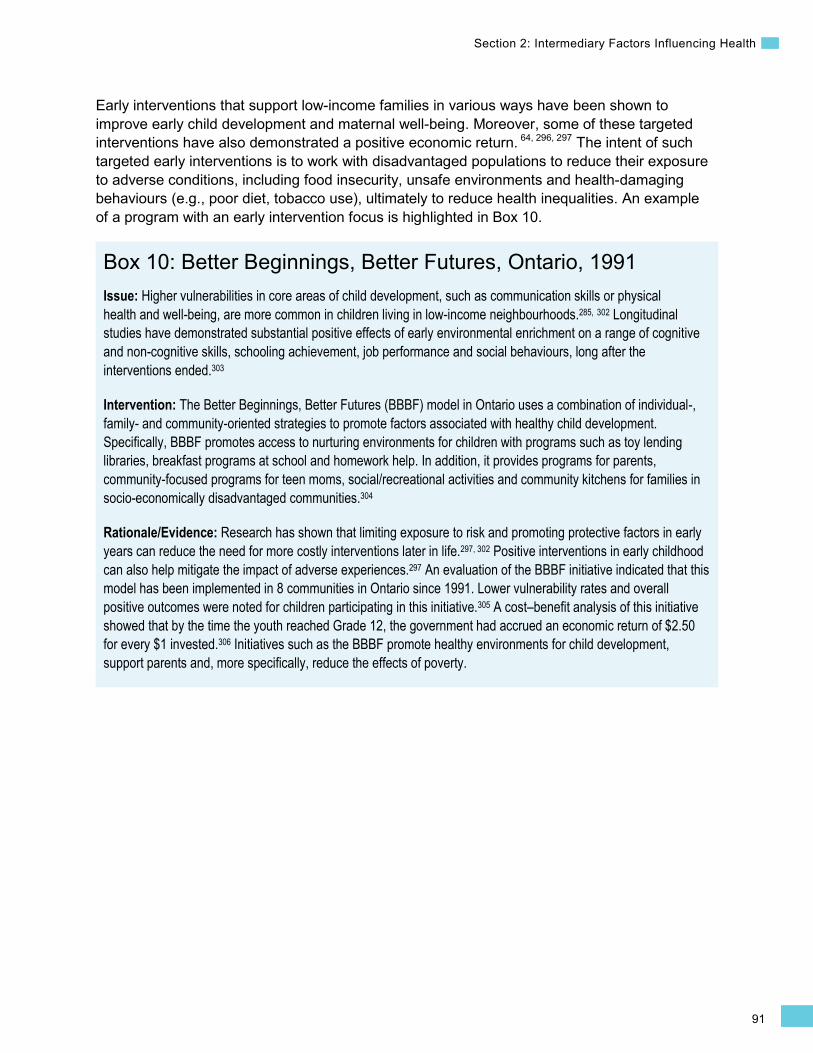
91
Section 2: Intermediary Factors Influencing Health
Early interventions that support low-income families in various ways have been shown to improve early child development and maternal well-being. Moreover, some of these targeted interventions have also demonstrated a positive economic return. 64, 296, 297 The intent of such targeted early interventions is to work with disadvantaged populations to reduce their exposure to adverse conditions, including food insecurity, unsafe environments and health-damaging behaviours (e.g., poor diet, tobacco use), ultimately to reduce health inequalities. An example of a program with an early intervention focus is highlighted in Box 10.
Box 10: Better Beginnings, Better Futures, Ontario, 1991 Issue: Higher vulnerabilities in core areas of child development, such as communication skills or physical health and well-being, are more common in children living in low-income neighbourhoods.285, 302 Longitudinal studies have demonstrated substantial positive effects of early environmental enrichment on a range of cognitive and non-cognitive skills, schooling achievement, job performance and social behaviours, long after the interventions ended.303
Intervention: The Better Beginnings, Better Futures (BBBF) model in Ontario uses a combination of individual-, family- and community-oriented strategies to promote factors associated with healthy child development. Specifically, BBBF promotes access to nurturing environments for children with programs such as toy lending libraries, breakfast programs at school and homework help. In addition, it provides programs for parents, community-focused programs for teen moms, social/recreational activities and community kitchens for families in socio-economically disadvantaged communities.304
Rationale/Evidence: Research has shown that limiting exposure to risk and promoting protective factors in early years can reduce the need for more costly interventions later in life.297, 302 Positive interventions in early childhood can also help mitigate the impact of adverse experiences.297 An evaluation of the BBBF initiative indicated that this model has been implemented in 8 communities in Ontario since 1991. Lower vulnerability rates and overall positive outcomes were noted for children participating in this initiative.305 A cost–benefit analysis of this initiative showed that by the time the youth reached Grade 12, the government had accrued an economic return of $2.50 for every $1 invested.306 Initiatives such as the BBBF promote healthy environments for child development, support parents and, more specifically, reduce the effects of poverty.
92
Trends in Income-Related Health Inequalities in Canada
Behavioural and Biological Indicators Smoking Background
The Smoking indicator captures the prevalence of Canadians age 18 and older who currently smoke cigarettes daily or occasionally.
The health and economic impacts of smoking are numerous and well-documented. Tobacco is 1 of the top 5 risk factors for mortality worldwide.307 The World Health Organization estimates that tobacco causes 5.4 million deaths every year worldwide.308 In Canada, smoking is the leading preventable cause of premature death.309, 312 In 2002, it was estimated that more than 16% of all deaths in Canada were attributable to smoking, with cancer, cardiovascular disease and respiratory illness being the leading contributors to smoking-attributable morbidity and mortality.310, 311 In the same year, 2,210,155 acute care hospital days — 10.3% of all such days — in Canada were attributable to smoking, with an associated cost of more than $2.5 billion.311, 312 In 2002, the total direct and indirect costs of tobacco use in Canada were estimated at $17 billion annually.311
The prevalence of smoking in the overall Canadian population has been declining over the past several decades, with some variation by sex. Rates of smoking have been declining among Canadian men since the mid-1960s, whereas among Canadian women smoking rates started to decline in the late 1970s.313 Between 1980 and the early 2000s, there was an overall steady decline in smoking rates in both sexes; however, the decline has been less dramatic in recent years.313
In 2013, approximately 1 in 5 Canadians (5.7 million) age 18 and older reported daily or occasional smoking according to the Canadian Community Health Survey, with higher rates consistently reported over time for men compared to women.314, 616
Rates of smoking are substantially higher among Aboriginal peoples in Canada. Currently, the smoking rates among First Nations (off reserve), Inuit and Métis populations are at least twice as high as the rate among non-Aboriginal Canadians.315 While many Aboriginal communities continue to use tobacco for spiritual, ceremonial and medicinal purposes,316 it is the non-traditional use of tobacco (such as smoking cigarettes) that continues to be an important public health concern in many First Nations, Inuit and Métis communities across Canada.316
The prevalence of smoking also varies widely by socio-economic status (SES).317–321 For example, Canadians who did not complete high school are at least 3 times more likely to smoke than university graduates, and they are also less likely to quit smoking.317–319 Compared with those working in professional specialties, Canadians working in manual occupations or in sales and service occupations are approximately 2 times more likely to be current smokers.317
93
Section 2: Intermediary Factors Influencing Health
Indicator Notes Data Source Canadian Community Health Survey (CCHS), Statistics Canada
Income Disaggregator Self-reported adjusted household income from the CCHS
Age Standardization 2011 Canadian standard population
Time Period 2003 to 2013
Please refer to Trends in Income-Related Health Inequalities in Canada: Indicator Definitions for detailed technical notes.
Additional Data National and provincial data for the complete time period and middle income quintiles (Quintile 2 to Quintile 4), as well as provincial data disaggregated by sex, is not presented in this report. This data is available on CIHI’s website in the form of downloadable tables.
Symbols and Abbreviations
* Estimate is statistically significant (i.e., statistically different from 1 for DRR or different from 0 for DRD, PRR, Change Over Time Percentage and Change Over Time Difference, based on the 95% CI)
† Interpret with caution (coefficient of variance from 16.6% to 33.3%)
Q1 Quintile 1 (lowest income quintile)
Q5 Quintile 5 (highest income quintile)
95% CI 95% confidence interval
↑ Statistically significant increase between 2003 estimate and 2013 estimate
↓ Statistically significant decrease between 2003 estimate and 2013 estimate
— No statistically significant change between 2003 estimate and 2013 estimate
How Did Income-Related Inequality for Smoking Change Between 2003 and 2013?
Income-related inequality for smoking increased due to decreased smoking rates in the highest income level and unchanged smoking rates in the lowest income level.
Trends in Rates, by Income
• From 2003 to 2013, smoking rates decreased across all income levels combined from 23.6% to 20.6%. However, this trend was due to a decrease in the smoking rates in the highest income levels.
• Smoking rates decreased by 20.5% or 3.9 percentage points in the highest income level. There was no change over time in the smoking rates in the lowest income level.
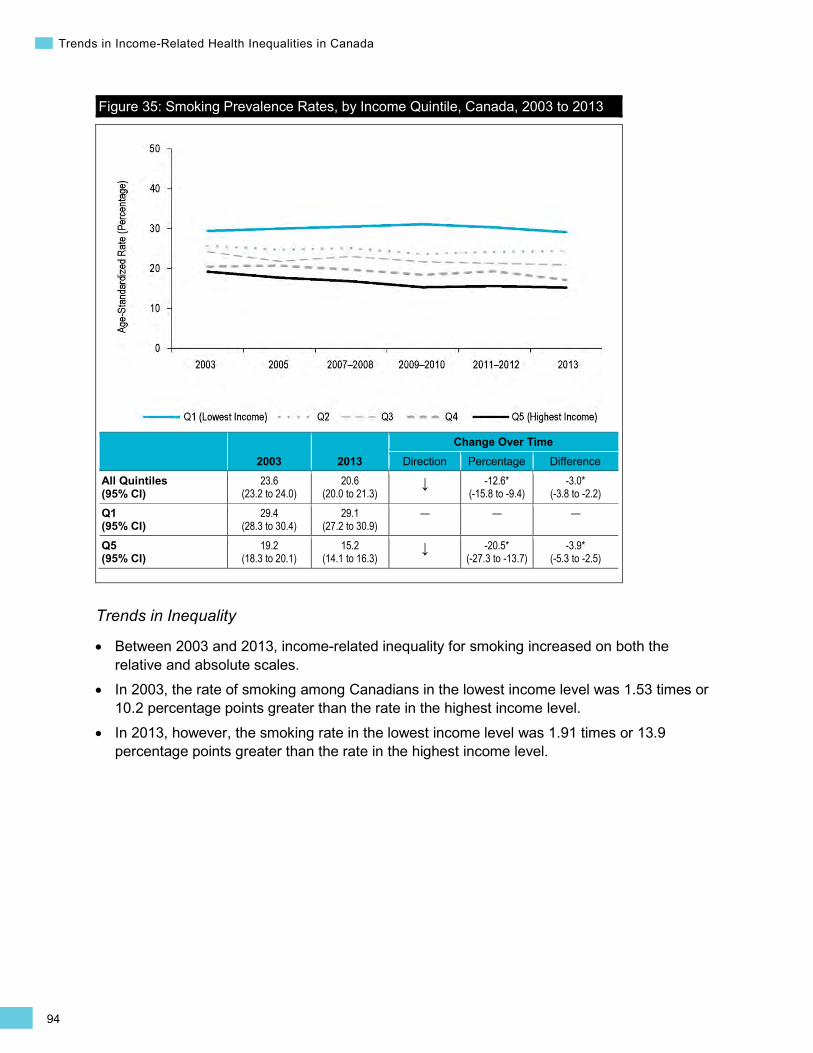
94
Trends in Income-Related Health Inequalities in Canada
Figure 35: Smoking Prevalence Rates, by Income Quintile, Canada, 2003 to 2013
2003 2013 Change Over Time
Direction Percentage Difference All Quintiles (95% CI)
23.6 (23.2 to 24.0)
20.6 (20.0 to 21.3)
↓ -12.6* (-15.8 to -9.4)
-3.0* (-3.8 to -2.2)
Q1 (95% CI)
29.4 (28.3 to 30.4)
29.1 (27.2 to 30.9)
— — —
Q5 (95% CI)
19.2 (18.3 to 20.1)
15.2 (14.1 to 16.3)
↓ -20.5* (-27.3 to -13.7)
-3.9* (-5.3 to -2.5)
Trends in Inequality
• Between 2003 and 2013, income-related inequality for smoking increased on both the relative and absolute scales.
• In 2003, the rate of smoking among Canadians in the lowest income level was 1.53 times or 10.2 percentage points greater than the rate in the highest income level.
• In 2013, however, the smoking rate in the lowest income level was 1.91 times or 13.9 percentage points greater than the rate in the highest income level.
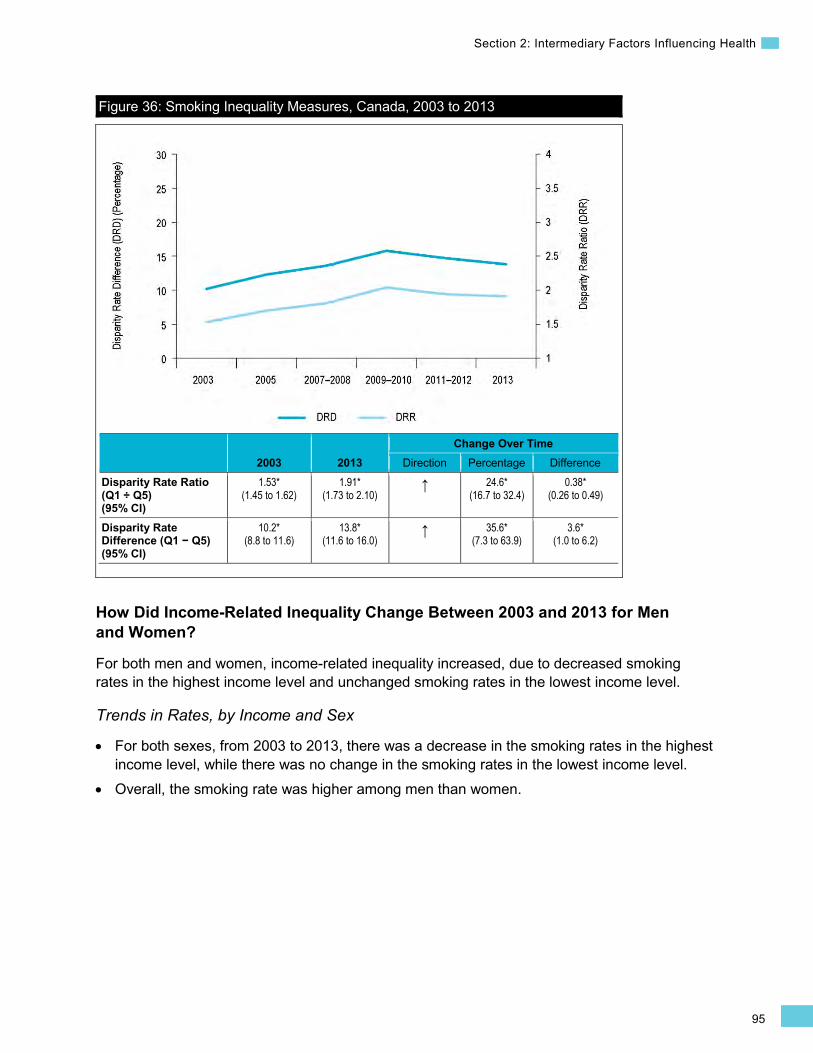
95
Section 2: Intermediary Factors Influencing Health
Figure 36: Smoking Inequality Measures, Canada, 2003 to 2013
2003 2013 Change Over Time
Direction Percentage Difference Disparity Rate Ratio (Q1 ÷ Q5) (95% CI)
1.53* (1.45 to 1.62)
1.91* (1.73 to 2.10)
↑ 24.6* (16.7 to 32.4)
0.38* (0.26 to 0.49)
Disparity Rate Difference (Q1 − Q5) (95% CI)
10.2* (8.8 to 11.6)
13.8* (11.6 to 16.0)
↑ 35.6* (7.3 to 63.9)
3.6* (1.0 to 6.2)
How Did Income-Related Inequality Change Between 2003 and 2013 for Men and Women?
For both men and women, income-related inequality increased, due to decreased smoking rates in the highest income level and unchanged smoking rates in the lowest income level.
Trends in Rates, by Income and Sex
• For both sexes, from 2003 to 2013, there was a decrease in the smoking rates in the highest income level, while there was no change in the smoking rates in the lowest income level.
• Overall, the smoking rate was higher among men than women.
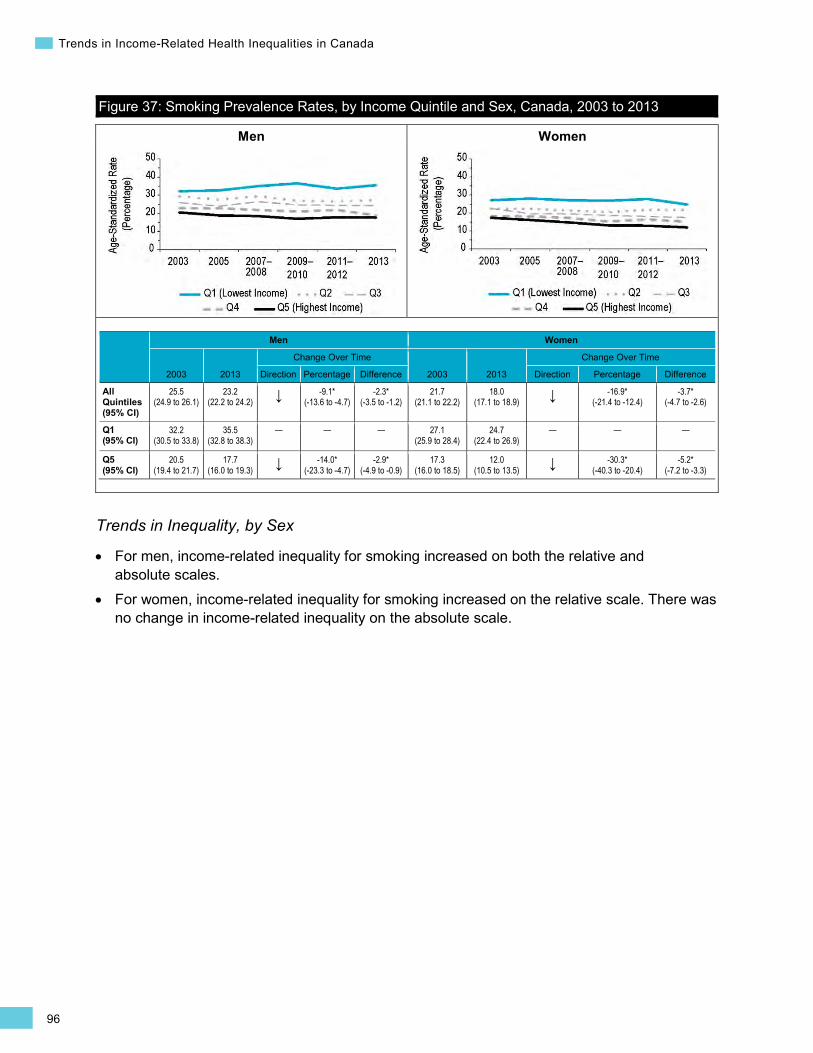
96
Trends in Income-Related Health Inequalities in Canada
Men Women
Figure 37: Smoking Prevalence Rates, by Income Quintile and Sex, Canada, 2003 to 2013
Men Women
2003 2013
Change Over Time
2003 2013
Change Over Time
Direction Percentage Difference Direction Percentage Difference
All Quintiles (95% CI)
25.5 (24.9 to 26.1)
23.2 (22.2 to 24.2) ↓ -9.1*
(-13.6 to -4.7) -2.3*
(-3.5 to -1.2) 21.7
(21.1 to 22.2) 18.0
(17.1 to 18.9) ↓ -16.9* (-21.4 to -12.4)
-3.7* (-4.7 to -2.6)
Q1 (95% CI)
32.2 (30.5 to 33.8)
35.5 (32.8 to 38.3)
— — — 27.1 (25.9 to 28.4)
24.7 (22.4 to 26.9)
— — —
Q5 (95% CI)
20.5 (19.4 to 21.7)
17.7 (16.0 to 19.3) ↓ -14.0*
(-23.3 to -4.7) -2.9*
(-4.9 to -0.9) 17.3
(16.0 to 18.5) 12.0
(10.5 to 13.5) ↓ -30.3* (-40.3 to -20.4)
-5.2* (-7.2 to -3.3)
Trends in Inequality, by Sex
• For men, income-related inequality for smoking increased on both the relative and absolute scales.
• For women, income-related inequality for smoking increased on the relative scale. There was no change in income-related inequality on the absolute scale.

97
Section 2: Intermediary Factors Influencing Health
Men Women
Figure 38: Smoking Inequality Measures, by Sex, Canada, 2003 to 2013
Men Women
2003 2013
Change Over Time
2003 2013
Change Over Time
Direction Percentage Difference Direction Percentage Difference
Disparity Rate Ratio (Q1 ÷ Q5) (95% CI)
1.57* (1.45 to 1.69)
2.01* (1.78 to 2.27) ↑ 28.4*
(18.5 to 38.3) 0.44*
(0.30 to 0.59) 1.57*
(1.44 to 1.72) 2.05*
(1.76 to 2.39) ↑ 30.4* (18.3 to 42.4)
0.48* (0.30 to 0.65)
Disparity Rate Difference (Q1 − Q5) (95% CI)
11.6* (9.6 to 13.7)
17.9* (14.7 to 21.1) ↑ 53.4*
(15.3 to 91.5) 6.2*
(2.4 to 10.0) 9.9*
(8.1 to 11.7) 12.6*
(10.0 to 15.3) — — —
Addressing Income-Related Inequality for Smoking
These analyses suggest that the proportion of Canadians who smoke decreased over the past decade. However, this decrease occurred primarily in the highest income levels, while the rate of smoking among Canadians in the lowest income level persisted. Smoking rates generally follow the income gradient, increasing across decreasing income levels.
Inequality Impact Measures
In 2013, there could have been 27.5% or approximately 1,656,400 fewer smokers among both sexes combined if Canadians in all income levels had experienced the same smoking rate as those in the highest income level.
Table 6: Smoking Inequality Impact Measures, Canada, 2003 to 2013
Both Sexes Men Women 2003 2013 2003 2013 2003 2013
Potential Rate Reduction (Percentage)‡‡ (95% CI)
19.4* (15.9 to 22.7)
27.5* (22.5 to 32.2)
20.0* (15.9 to 24.0)
25.2* (18.7 to 31.2)
20.9* (15.4 to 26.0)
34.7* (26.6 to 41.9)
Population Impact Number 1,318,000 1,656,400 687,100 785,600 630,900 870,800
Note ‡‡ Also known as “population-attributable fraction.”
•
98
Trends in Income-Related Health Inequalities in Canada
Approaches for Addressing Inequality
Since the introduction of the Tobacco Act in 1997, a number of smoking prevention and cessation interventions have been implemented at the municipal, provincial/territorial and federal levels in Canada. These include interventions and regulations such as taxation and price increases, labelling (e.g., health warning labels), creating smoke-free spaces, education and awareness campaigns, and marketing and advertising limitations and bans.313, 323, 324 For example, in 2001, Canada became the first country to implement pictorial health warnings on cigarette packages.322 Moreover, since 2010, restrictions on point-of-sale marketing of tobacco products in retail locations have been implemented in every province and territory across Canada.325 Such interventions and regulations aim to address the many factors that influence the likelihood of smoking, including social norms, awareness of the dangers of smoking, and the availability, marketing and cost of cigarettes. Interventions designed to address smoking cessation include counselling and pharmacotherapy (e.g., subsidizing the cost of smoking cessation medications).325 However, despite extensive multi-level action, results of this and other analyses show that socio-economic inequality in smoking rates has persisted or widened over time.318–320 As highlighted in this report, the increase in income-related inequality is due to decreasing rates of smoking in the highest income level while rates in the lowest income level remained stable.
A combination of universal and targeted approaches has the potential to reduce health inequalities.52, 326, 327 Universal smoking prevention and cessation policies on their own may not reduce smoking evenly across all socio-economic groups. Individuals in lower socio-economic groups face a number of vulnerabilities and exposures that make them more likely to start smoking and less likely to quit. These include a higher likelihood of taking up smoking in adolescence (e.g., due to a lower ability to resist peer pressure) and difficulty in quitting smoking as an adult (e.g., due to stressful living and working environments, limited ability to afford smoking cessation drugs or services).328 Smoking prevention and cessation policies targeted at groups who are at high risk of smoking (such as low-income and Aboriginal populations), alongside universal policies, may help to reduce inequalities in smoking.91, 94, 328
Other factors may also need to be considered when designing targeted smoking policies for high-risk groups. Recent evidence from the United States has provided insight into factors that may contribute to higher smoking rates in lower-income and minority communities. First, tobacco products are often marketed more heavily in these communities. Second, these communities provide greater access to tobacco products through a higher density of tobacco retailers or convenience stores.329–332 2 recent studies from Ontario similarly found a greater prevalence of point-of-sale tobacco promotions (prior to their partial ban in 2006) within retail stores located in low-income neighbourhoods and near schools, as well as a greater density of tobacco retailers near schools and in more deprived neighbourhoods.333, 334 U.S. studies suggest that tobacco companies target advertising and price promotions toward youth.329, 332 Higher exposure to tobacco-related advertising and promotions has been shown to increase the likelihood of adolescents taking up smoking.335
Individuals who start smoking at a younger age are more likely to smoke for a longer period and have more difficulty quitting than those who initiate smoking as an adult.336, 337 Therefore, interventions developed to limit the uptake of smoking among adolescents should be considered as part of a policy approach aimed at reducing the prevalence of smoking. An example of a promising smoking prevention intervention targeting high-risk adolescents is described in Box 11.
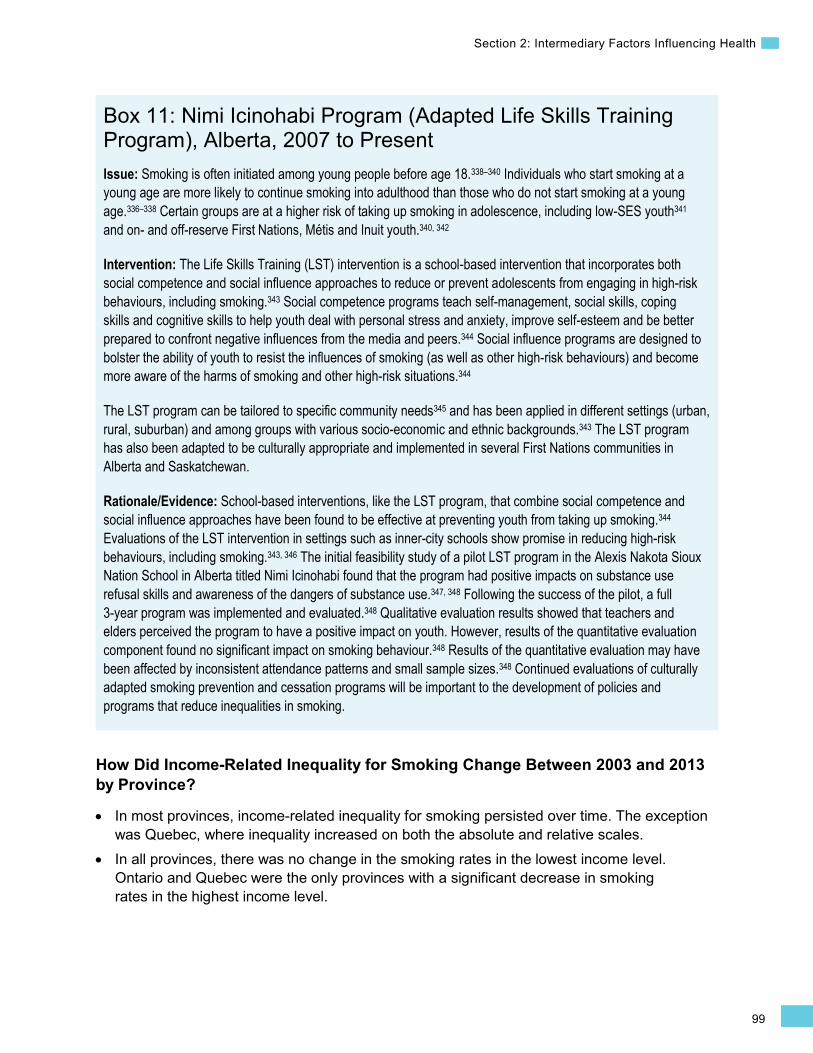
99
Section 2: Intermediary Factors Influencing Health
Box 11: Nimi Icinohabi Program (Adapted Life Skills Training Program), Alberta, 2007 to Present Issue: Smoking is often initiated among young people before age 18.338–340 Individuals who start smoking at a young age are more likely to continue smoking into adulthood than those who do not start smoking at a young age.336–338 Certain groups are at a higher risk of taking up smoking in adolescence, including low-SES youth341 and on- and off-reserve First Nations, Métis and Inuit youth.340, 342
Intervention: The Life Skills Training (LST) intervention is a school-based intervention that incorporates both social competence and social influence approaches to reduce or prevent adolescents from engaging in high-risk behaviours, including smoking.343 Social competence programs teach self-management, social skills, coping skills and cognitive skills to help youth deal with personal stress and anxiety, improve self-esteem and be better prepared to confront negative influences from the media and peers.344 Social influence programs are designed to bolster the ability of youth to resist the influences of smoking (as well as other high-risk behaviours) and become more aware of the harms of smoking and other high-risk situations.344
The LST program can be tailored to specific community needs345 and has been applied in different settings (urban, rural, suburban) and among groups with various socio-economic and ethnic backgrounds.343 The LST program has also been adapted to be culturally appropriate and implemented in several First Nations communities in Alberta and Saskatchewan.
Rationale/Evidence: School-based interventions, like the LST program, that combine social competence and social influence approaches have been found to be effective at preventing youth from taking up smoking.344 Evaluations of the LST intervention in settings such as inner-city schools show promise in reducing high-risk behaviours, including smoking.343, 346 The initial feasibility study of a pilot LST program in the Alexis Nakota Sioux Nation School in Alberta titled Nimi Icinohabi found that the program had positive impacts on substance use refusal skills and awareness of the dangers of substance use.347, 348 Following the success of the pilot, a full 3-year program was implemented and evaluated.348 Qualitative evaluation results showed that teachers and elders perceived the program to have a positive impact on youth. However, results of the quantitative evaluation component found no significant impact on smoking behaviour.348 Results of the quantitative evaluation may have been affected by inconsistent attendance patterns and small sample sizes.348 Continued evaluations of culturally adapted smoking prevention and cessation programs will be important to the development of policies and programs that reduce inequalities in smoking.
How Did Income-Related Inequality for Smoking Change Between 2003 and 2013 by Province?
• In most provinces, income-related inequality for smoking persisted over time. The exception was Quebec, where inequality increased on both the absolute and relative scales.
• In all provinces, there was no change in the smoking rates in the lowest income level. Ontario and Quebec were the only provinces with a significant decrease in smoking rates in the highest income level.
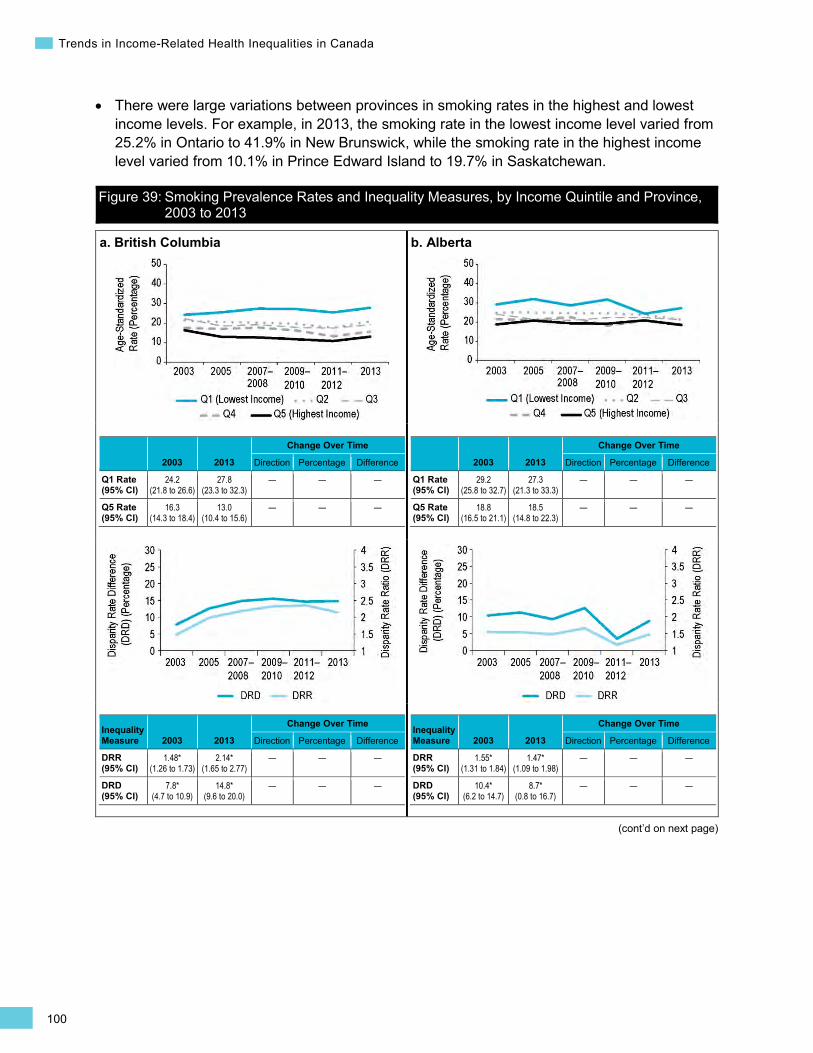
100
Trends in Income-Related Health Inequalities in Canada
(cont’d on next page)
• There were large variations between provinces in smoking rates in the highest and lowest income levels. For example, in 2013, the smoking rate in the lowest income level varied from 25.2% in Ontario to 41.9% in New Brunswick, while the smoking rate in the highest income level varied from 10.1% in Prince Edward Island to 19.7% in Saskatchewan.
Figure 39: Smoking Prevalence Rates and Inequality Measures, by Income Quintile and Province, 2003 to 2013
a. British Columbia
2003 2013
Change Over Time
Direction Percentage Difference
Q1 Rate (95% CI)
24.2 (21.8 to 26.6)
27.8 (23.3 to 32.3)
— — —
Q5 Rate (95% CI)
16.3 (14.3 to 18.4)
13.0 (10.4 to 15.6)
— — —
Inequality Measure 2003 2013
Change Over Time
Direction Percentage Difference
DRR (95% CI)
1.48* (1.26 to 1.73)
2.14* (1.65 to 2.77)
— — —
DRD (95% CI)
7.8* (4.7 to 10.9)
14.8* (9.6 to 20.0)
— — —
b. Alberta
2003 2013
Change Over Time
Direction Percentage Difference
Q1 Rate (95% CI)
29.2 (25.8 to 32.7)
27.3 (21.3 to 33.3)
— — —
Q5 Rate (95% CI)
18.8 (16.5 to 21.1)
18.5 (14.8 to 22.3)
— — —
Inequality Measure 2003 2013
Change Over Time
Direction Percentage Difference
DRR (95% CI)
1.55* (1.31 to 1.84)
1.47* (1.09 to 1.98)
— — —
DRD (95% CI)
10.4* (6.2 to 14.7)
8.7* (0.8 to 16.7)
— — —
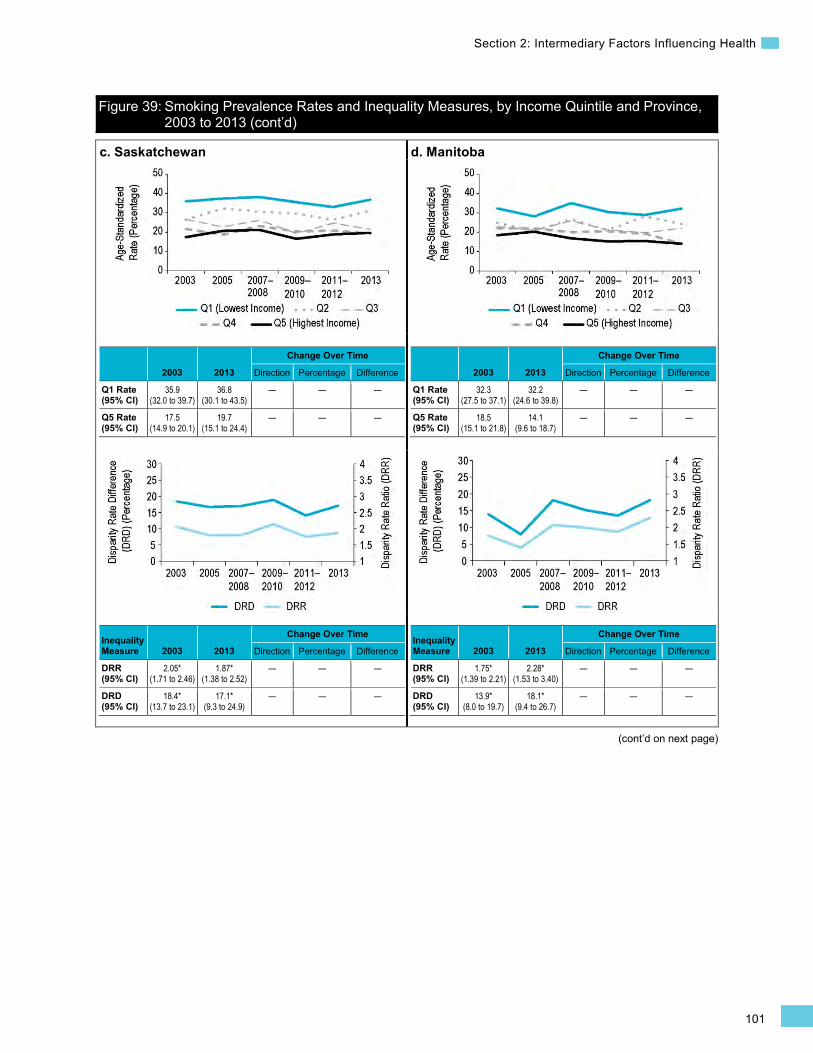
101
Section 2: Intermediary Factors Influencing Health
Figure 39: Smoking Prevalence Rates and Inequality Measures, by Income Quintile and Province, 2003 to 2013 (cont’d)
(cont’d on next page)
c. Saskatchewan
2003 2013
Change Over Time
Direction Percentage Difference
Q1 Rate (95% CI)
35.9 (32.0 to 39.7)
36.8 (30.1 to 43.5)
— — —
Q5 Rate (95% CI)
17.5 (14.9 to 20.1)
19.7 (15.1 to 24.4)
— — —
Inequality Measure 2003 2013
Change Over Time
Direction Percentage Difference
DRR (95% CI)
2.05* (1.71 to 2.46)
1.87* (1.38 to 2.52)
— — —
DRD (95% CI)
18.4* (13.7 to 23.1)
17.1* (9.3 to 24.9)
— — —
d. Manitoba
2003 2013
Change Over Time
Direction Percentage Difference
Q1 Rate (95% CI)
32.3 (27.5 to 37.1)
32.2 (24.6 to 39.8)
— — —
Q5 Rate (95% CI)
18.5 (15.1 to 21.8)
14.1 (9.6 to 18.7)
— — —
Inequality Measure 2003 2013
Change Over Time
Direction Percentage Difference
DRR (95% CI)
1.75* (1.39 to 2.21)
2.28* (1.53 to 3.40)
— — —
DRD (95% CI)
13.9* (8.0 to 19.7)
18.1* (9.4 to 26.7)
— — —
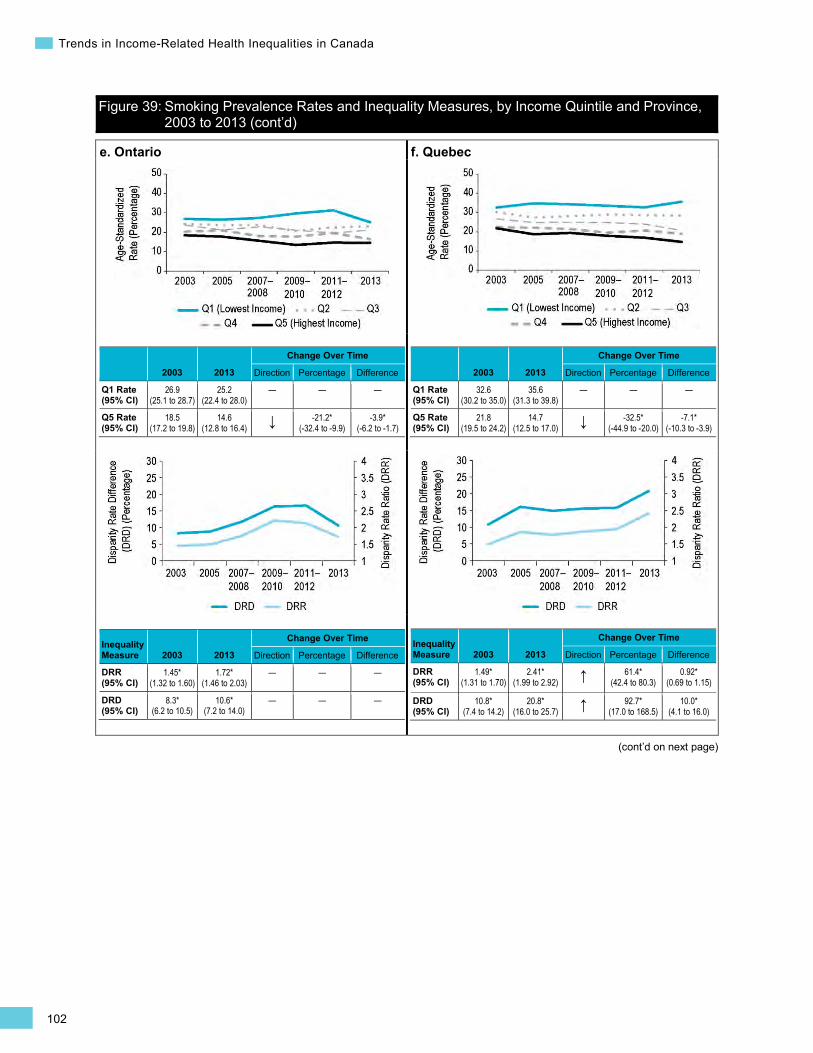
102
Trends in Income-Related Health Inequalities in Canada
Figure 39: Smoking Prevalence Rates and Inequality Measures, by Income Quintile and Province, 2003 to 2013 (cont’d)
(cont’d on next page)
e. Ontario
2003 2013
Change Over Time
Direction Percentage Difference
Q1 Rate (95% CI)
26.9 (25.1 to 28.7)
25.2 (22.4 to 28.0)
— — —
Q5 Rate (95% CI)
18.5 (17.2 to 19.8)
14.6 (12.8 to 16.4) ↓ -21.2*
(-32.4 to -9.9) -3.9*
(-6.2 to -1.7)
Inequality Measure 2003 2013
Change Over Time
Direction Percentage Difference
DRR (95% CI)
1.45* (1.32 to 1.60)
1.72* (1.46 to 2.03)
— — —
DRD (95% CI)
8.3* (6.2 to 10.5)
10.6* (7.2 to 14.0)
— — —
f. Quebec
2003 2013
Change Over Time
Direction Percentage Difference
Q1 Rate (95% CI)
32.6 (30.2 to 35.0)
35.6 (31.3 to 39.8)
— — —
Q5 Rate (95% CI)
21.8 (19.5 to 24.2)
14.7 (12.5 to 17.0) ↓ -32.5*
(-44.9 to -20.0) -7.1*
(-10.3 to -3.9)
Inequality Measure 2003 2013
Change Over Time
Direction Percentage Difference
DRR (95% CI)
1.49* (1.31 to 1.70)
2.41* (1.99 to 2.92) ↑ 61.4*
(42.4 to 80.3) 0.92*
(0.69 to 1.15)
DRD (95% CI)
10.8* (7.4 to 14.2)
20.8* (16.0 to 25.7) ↑ 92.7*
(17.0 to 168.5) 10.0*
(4.1 to 16.0)
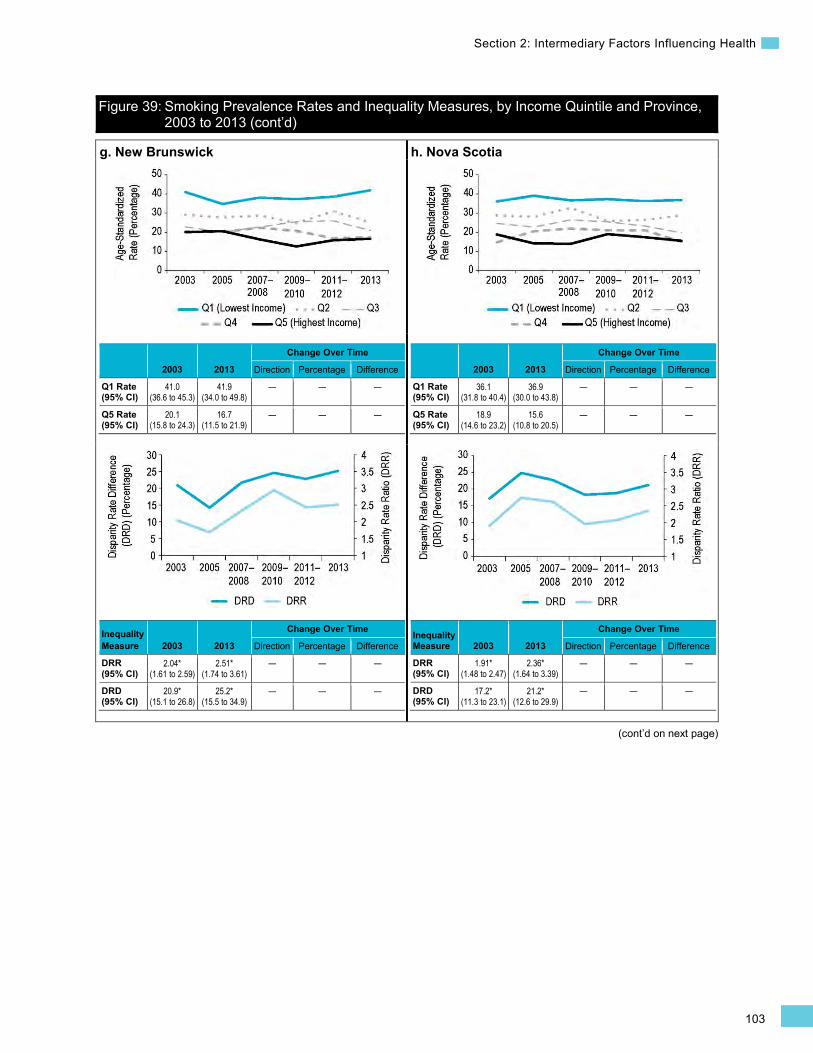
103
Section 2: Intermediary Factors Influencing Health
Figure 39: Smoking Prevalence Rates and Inequality Measures, by Income Quintile and Province, 2003 to 2013 (cont’d)
(cont’d on next page)
g. New Brunswick
2003 2013
Change Over Time
Direction Percentage Difference
Q1 Rate (95% CI)
41.0 (36.6 to 45.3)
41.9 (34.0 to 49.8)
— — —
Q5 Rate (95% CI)
20.1 (15.8 to 24.3)
16.7 (11.5 to 21.9)
— — —
Inequality Measure 2003 2013
Change Over Time
Direction Percentage Difference
DRR (95% CI)
2.04* (1.61 to 2.59)
2.51* (1.74 to 3.61)
— — —
DRD (95% CI)
20.9* (15.1 to 26.8)
25.2* (15.5 to 34.9)
— — —
h. Nova Scotia
2003 2013
Change Over Time
Direction Percentage Difference
Q1 Rate (95% CI)
36.1 (31.8 to 40.4)
36.9 (30.0 to 43.8)
— — —
Q5 Rate (95% CI)
18.9 (14.6 to 23.2)
15.6 (10.8 to 20.5)
— — —
Inequality Measure 2003 2013
Change Over Time
Direction Percentage Difference
DRR (95% CI)
1.91* (1.48 to 2.47)
2.36* (1.64 to 3.39)
— — —
DRD (95% CI)
17.2* (11.3 to 23.1)
21.2* (12.6 to 29.9)
— — —
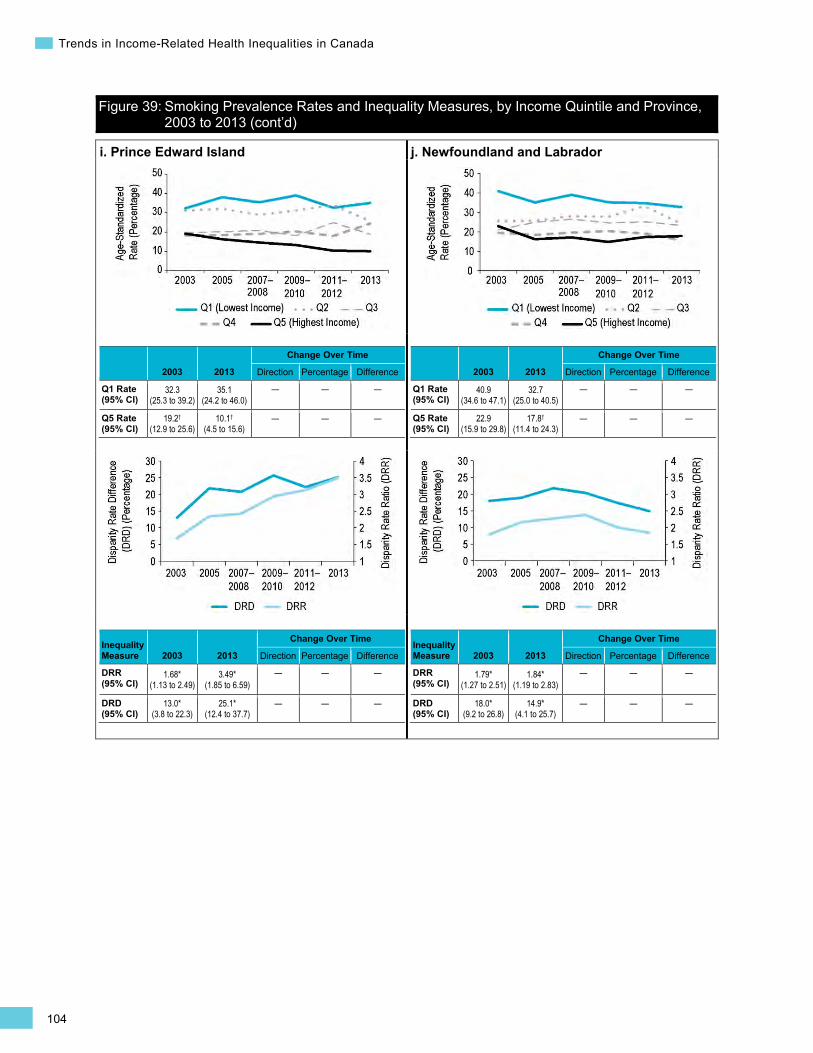
104
Trends in Income-Related Health Inequalities in Canada
Figure 39: Smoking Prevalence Rates and Inequality Measures, by Income Quintile and Province, 2003 to 2013 (cont’d)
i. Prince Edward Island
2003 2013
Change Over Time
Direction Percentage Difference
Q1 Rate (95% CI)
32.3 (25.3 to 39.2)
35.1 (24.2 to 46.0)
— — —
Q5 Rate (95% CI)
19.2† (12.9 to 25.6)
10.1† (4.5 to 15.6)
— — —
Inequality Measure 2003 2013
Change Over Time
Direction Percentage Difference
DRR (95% CI)
1.68* (1.13 to 2.49)
3.49* (1.85 to 6.59)
— — —
DRD (95% CI)
13.0* (3.8 to 22.3)
25.1* (12.4 to 37.7)
— — —
j. Newfoundland and Labrador
2003 2013
Change Over Time
Direction Percentage Difference
Q1 Rate (95% CI)
40.9 (34.6 to 47.1)
32.7 (25.0 to 40.5)
— — —
Q5 Rate (95% CI)
22.9 (15.9 to 29.8)
17.8† (11.4 to 24.3)
— — —
Inequality Measure 2003 2013
Change Over Time
Direction Percentage Difference
DRR (95% CI)
1.79* (1.27 to 2.51)
1.84* (1.19 to 2.83)
— — —
DRD (95% CI)
18.0* (9.2 to 26.8)
14.9* (4.1 to 25.7)
— — —
105
Section 2: Intermediary Factors Influencing Health
(cont’d on next page)
Obesity Background
This indicator measures the prevalence of obesity among Canadians age 18 and older, excluding pregnant women. Being obese is defined as having a body mass index (BMI) iii of 30 or greater, based on self-reported height and weight.349
iii. Measured as weight in kilograms divided by height in metres squared.
Obesity ranks among the most pressing public health challenges in Canada350 and is associated with increased risk of serious health conditions, including type 2 diabetes, hypertension and some forms of cancer.351 In 2008, the economic costs associated with obesity in Canada were conservatively estimated at $4.6 billion.352
In 2011, the proportion of Canadian adults with obesity based on a self-reported BMI of 30 or greater was 18.3%, which was 3 times higher than in 1985 (6.1%).353 However, because people tend to underestimate their weight and overestimate their height,354 BMI based on self-reported information underestimates the true prevalence of obesity in the population (26.1%) by about 8%.355
The determinants of obesity are multi-faceted and complex. They involve factors at both the individual level (e.g., age, lifestyle habits) and also within the social, physical and economic environments that shape the quality of individuals’ diets, caloric intakes and levels of daily physical activity at home, at work and during leisure time.67, 356–358 Additionally, unlike most health outcomes, obesity does not have a straightforward association with socio-economic status (SES). In previous studies, obesity was shown to be more prevalent among Canadian women with lower levels of education and household income. In contrast, obesity was either unrelated to SES or more prevalent among higher-SES men.359, 360 Among children and youth, a higher likelihood of overweight/obesity has been documented in middle-income households.361
Indicator Notes Data Source Canadian Community Health Survey (CCHS), Statistics Canada
Income Disaggregator Self-reported adjusted household income from the CCHS
Age Standardization 2011 Canadian standard population
Time Period 2003 to 2013
Please refer to Trends in Income-Related Health Inequalities in Canada: Indicator Definitions for detailed technical notes.
Additional Data National and provincial data for the complete time period and middle income quintiles (Quintile 2 to Quintile 4) is not presented in this report. This data is available on CIHI’s website in the form of downloadable tables.
106
Trends in Income-Related Health Inequalities in Canada
Symbols and Abbreviations
* Estimate is statistically significant (i.e., statistically different from 1 for DRR or different from 0 for DRD, PRR, Change Over Time Percentage and Change Over Time Difference, based on the 95% CI)
† Interpret with caution (coefficient of variance from 16.6% to 33.3%)
Q1 Quintile 1 (lowest income quintile)
Q5 Quintile 5 (highest income quintile)
95% CI 95% confidence interval
↑ Statistically significant increase between 2003 estimate and 2013 estimate
↓ Statistically significant decrease between 2003 estimate and 2013 estimate
— No statistically significant change between 2003 estimate and 2013 estimate
How Did Income-Related Inequality for Obesity Change Between 2003 and 2013?
From 2003 to 2013, there was substantial variation between men and women in trends in income-related inequality in obesity. National trends for both sexes combined are not presented because they mask these important differences — all results are shown separately for men and women.
How Did Income-Related Inequality Change Between 2003 and 2013 for Men and Women?
Between 2003 and 2013, income-related inequality in obesity persisted among women. Among men, there was no income-related inequality in obesity, and obesity rates increased among higher-income men.
Trends in Rates, by Income and Sex
• For both men and women, there was an increase in rates of obesity in all income levels combined between 2003 and 2013.
• Among women, there was no change in obesity rates among those in the lowest and highest income levels. However, rates increased among women in the second-lowest income level (from 16.3% to 19.9%) and the second-highest income level (from 12.2% to 16.5%).
• Among men, rates of obesity increased among those in the highest income level by nearly 33% or 5 percentage points from 14.9% to 19.8%, while rates did not change among those in the lowest income level.
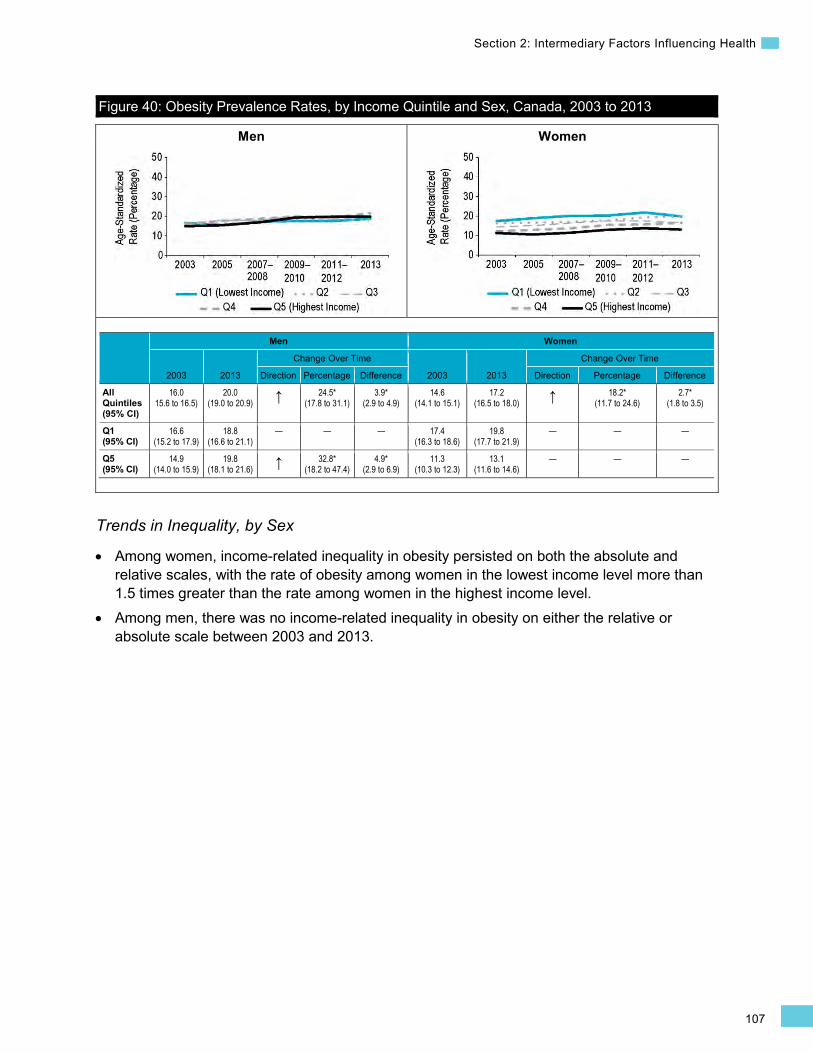
107
Section 2: Intermediary Factors Influencing Health
Men Women
Figure 40: Obesity Prevalence Rates, by Income Quintile and Sex, Canada, 2003 to 2013
Men Women
2003 2013
Change Over Time
2003 2013
Change Over Time
Direction Percentage Difference Direction Percentage Difference
All Quintiles (95% CI)
16.0 15.6 to 16.5)
20.0 (19.0 to 20.9) ↑ 24.5*
(17.8 to 31.1) 3.9*
(2.9 to 4.9) 14.6
(14.1 to 15.1) 17.2
(16.5 to 18.0) ↑ 18.2* (11.7 to 24.6)
2.7* (1.8 to 3.5)
Q1 (95% CI)
16.6 (15.2 to 17.9)
18.8 (16.6 to 21.1)
— — — 17.4 (16.3 to 18.6)
19.8 (17.7 to 21.9)
— — —
Q5 (95% CI)
14.9 (14.0 to 15.9)
19.8 (18.1 to 21.6) ↑ 32.8*
(18.2 to 47.4) 4.9*
(2.9 to 6.9) 11.3
(10.3 to 12.3) 13.1
(11.6 to 14.6) — — —
Trends in Inequality, by Sex
• Among women, income-related inequality in obesity persisted on both the absolute and relative scales, with the rate of obesity among women in the lowest income level more than 1.5 times greater than the rate among women in the highest income level.
• Among men, there was no income-related inequality in obesity on either the relative or absolute scale between 2003 and 2013.
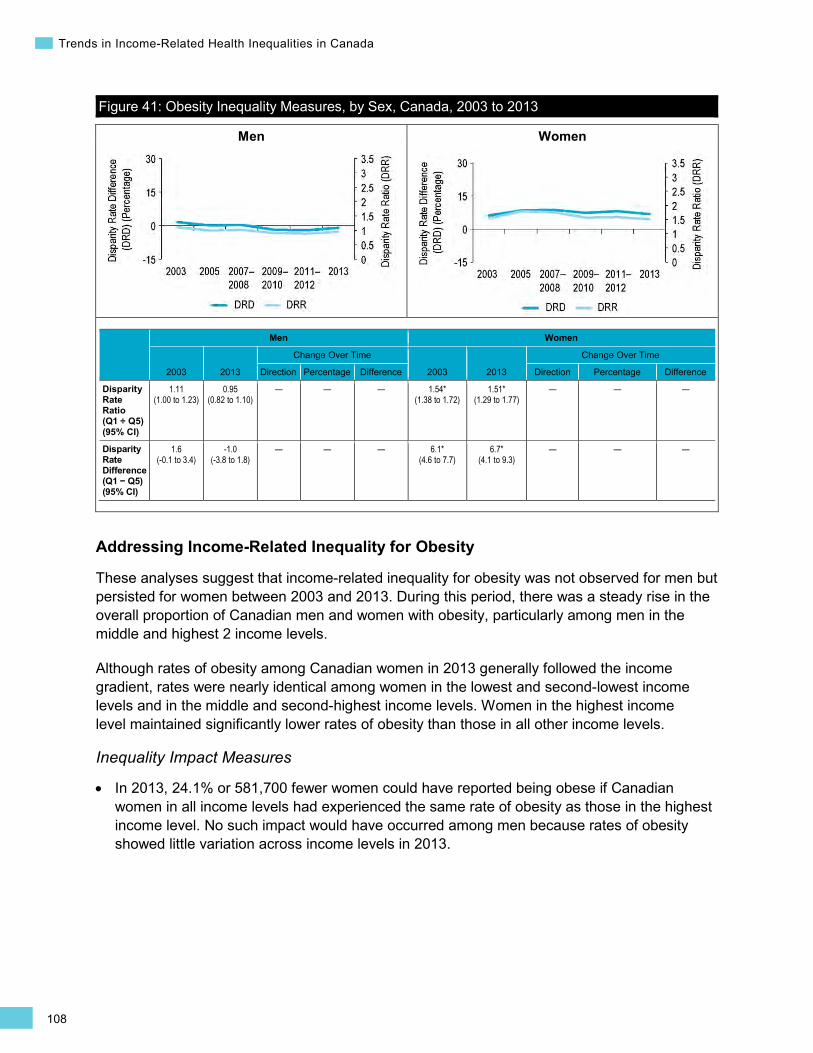
108
Trends in Income-Related Health Inequalities in Canada
Men Women
Figure 41: Obesity Inequality Measures, by Sex, Canada, 2003 to 2013
Men Women
2003 2013
Change Over Time
2003 2013
Change Over Time
Direction Percentage Difference Direction Percentage Difference
Disparity Rate Ratio (Q1 ÷ Q5) (95% CI)
1.11 (1.00 to 1.23)
0.95 (0.82 to 1.10)
— — — 1.54* (1.38 to 1.72)
1.51* (1.29 to 1.77)
— — —
Disparity Rate Difference (Q1 − Q5) (95% CI)
1.6 (-0.1 to 3.4)
-1.0 (-3.8 to 1.8)
— — — 6.1* (4.6 to 7.7)
6.7* (4.1 to 9.3)
— — —
Addressing Income-Related Inequality for Obesity
These analyses suggest that income-related inequality for obesity was not observed for men but persisted for women between 2003 and 2013. During this period, there was a steady rise in the overall proportion of Canadian men and women with obesity, particularly among men in the middle and highest 2 income levels.
Although rates of obesity among Canadian women in 2013 generally followed the income gradient, rates were nearly identical among women in the lowest and second-lowest income levels and in the middle and second-highest income levels. Women in the highest income level maintained significantly lower rates of obesity than those in all other income levels.
Inequality Impact Measures
In 2013, 24.1% or 581,700 fewer women could have reported being obese if Canadian women in all income levels had experienced the same rate of obesity as those in the highest income level. No such impact would have occurred among men because rates of obesity showed little variation across income levels in 2013.
•
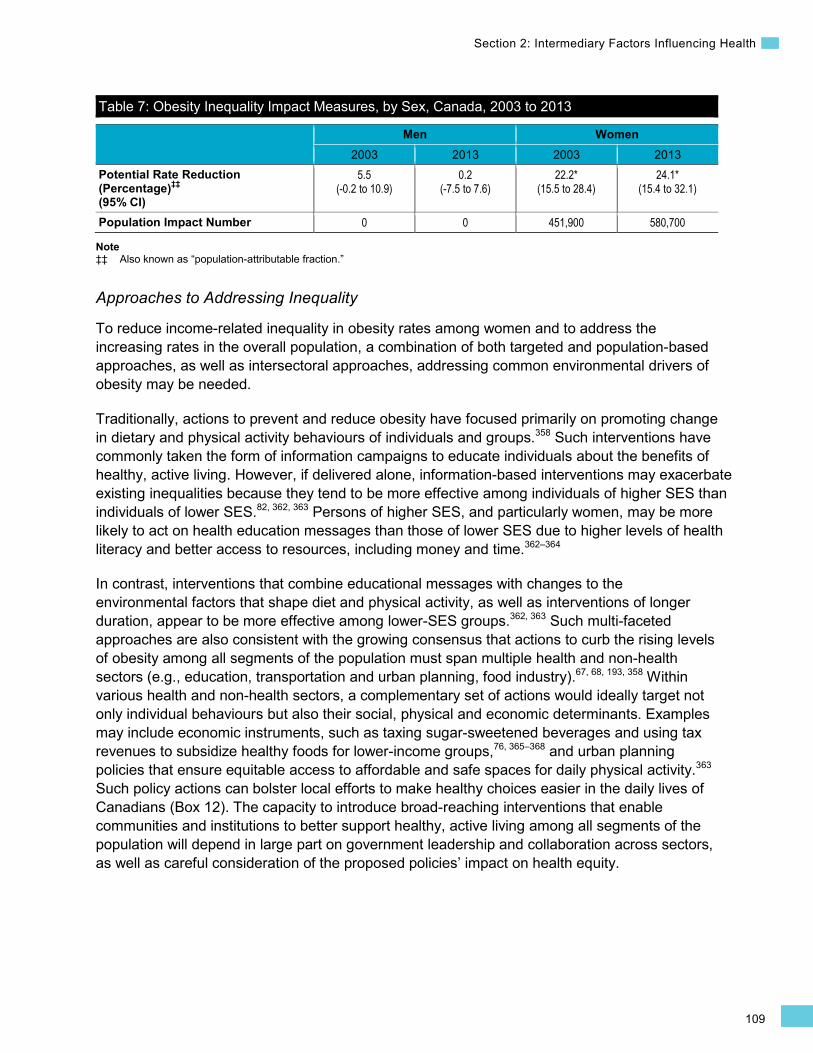
109
Section 2: Intermediary Factors Influencing Health
Table 7: Obesity Inequality Impact Measures, by Sex, Canada, 2003 to 2013
Men Women 2003 2013 2003 2013
Potential Rate Reduction (Percentage)‡‡ (95% CI)
5.5 (-0.2 to 10.9)
0.2 (-7.5 to 7.6)
22.2* (15.5 to 28.4)
24.1* (15.4 to 32.1)
Population Impact Number 0 0 451,900 580,700
Note ‡‡ Also known as “population-attributable fraction.”
Approaches to Addressing Inequality
To reduce income-related inequality in obesity rates among women and to address the increasing rates in the overall population, a combination of both targeted and population-based approaches, as well as intersectoral approaches, addressing common environmental drivers of obesity may be needed.
Traditionally, actions to prevent and reduce obesity have focused primarily on promoting change in dietary and physical activity behaviours of individuals and groups.358 Such interventions have commonly taken the form of information campaigns to educate individuals about the benefits of healthy, active living. However, if delivered alone, information-based interventions may exacerbate existing inequalities because they tend to be more effective among individuals of higher SES than individuals of lower SES.82, 362, 363 Persons of higher SES, and particularly women, may be more likely to act on health education messages than those of lower SES due to higher levels of health literacy and better access to resources, including money and time.362–364
In contrast, interventions that combine educational messages with changes to the environmental factors that shape diet and physical activity, as well as interventions of longer duration, appear to be more effective among lower-SES groups.362, 363 Such multi-faceted approaches are also consistent with the growing consensus that actions to curb the rising levels of obesity among all segments of the population must span multiple health and non-health sectors (e.g., education, transportation and urban planning, food industry).67, 68, 193, 358 Within various health and non-health sectors, a complementary set of actions would ideally target not only individual behaviours but also their social, physical and economic determinants. Examples may include economic instruments, such as taxing sugar-sweetened beverages and using tax revenues to subsidize healthy foods for lower-income groups,76, 365–368 and urban planning policies that ensure equitable access to affordable and safe spaces for daily physical activity.363 Such policy actions can bolster local efforts to make healthy choices easier in the daily lives of Canadians (Box 12). The capacity to introduce broad-reaching interventions that enable communities and institutions to better support healthy, active living among all segments of the population will depend in large part on government leadership and collaboration across sectors, as well as careful consideration of the proposed policies’ impact on health equity.
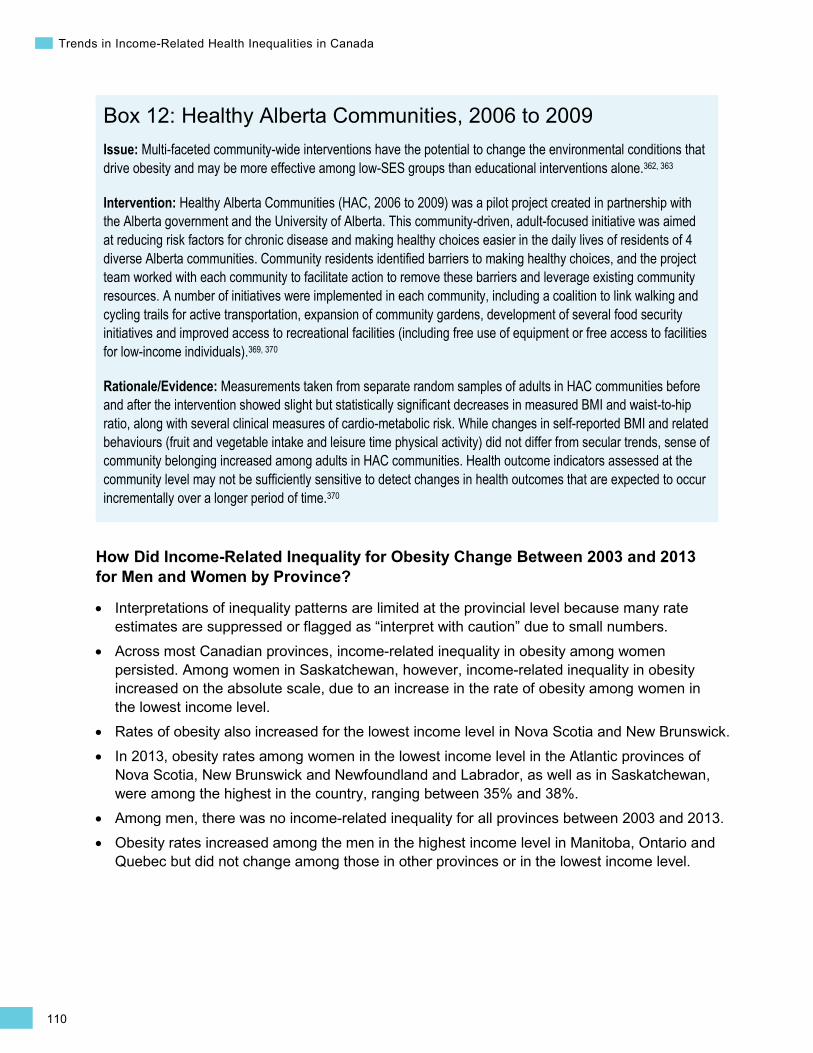
110
Trends in Income-Related Health Inequalities in Canada
Box 12: Healthy Alberta Communities, 2006 to 2009 Issue: Multi-faceted community-wide interventions have the potential to change the environmental conditions that drive obesity and may be more effective among low-SES groups than educational interventions alone.362, 363
Intervention: Healthy Alberta Communities (HAC, 2006 to 2009) was a pilot project created in partnership with the Alberta government and the University of Alberta. This community-driven, adult-focused initiative was aimed at reducing risk factors for chronic disease and making healthy choices easier in the daily lives of residents of 4 diverse Alberta communities. Community residents identified barriers to making healthy choices, and the project team worked with each community to facilitate action to remove these barriers and leverage existing community resources. A number of initiatives were implemented in each community, including a coalition to link walking and cycling trails for active transportation, expansion of community gardens, development of several food security initiatives and improved access to recreational facilities (including free use of equipment or free access to facilities for low-income individuals).369, 370
Rationale/Evidence: Measurements taken from separate random samples of adults in HAC communities before and after the intervention showed slight but statistically significant decreases in measured BMI and waist-to-hip ratio, along with several clinical measures of cardio-metabolic risk. While changes in self-reported BMI and related behaviours (fruit and vegetable intake and leisure time physical activity) did not differ from secular trends, sense of community belonging increased among adults in HAC communities. Health outcome indicators assessed at the community level may not be sufficiently sensitive to detect changes in health outcomes that are expected to occur incrementally over a longer period of time.370
How Did Income-Related Inequality for Obesity Change Between 2003 and 2013 for Men and Women by Province?
• Interpretations of inequality patterns are limited at the provincial level because many rate estimates are suppressed or flagged as “interpret with caution” due to small numbers.
• Across most Canadian provinces, income-related inequality in obesity among women persisted. Among women in Saskatchewan, however, income-related inequality in obesity increased on the absolute scale, due to an increase in the rate of obesity among women in the lowest income level.
• Rates of obesity also increased for the lowest income level in Nova Scotia and New Brunswick. • In 2013, obesity rates among women in the lowest income level in the Atlantic provinces of
Nova Scotia, New Brunswick and Newfoundland and Labrador, as well as in Saskatchewan, were among the highest in the country, ranging between 35% and 38%.
• Among men, there was no income-related inequality for all provinces between 2003 and 2013. • Obesity rates increased among the men in the highest income level in Manitoba, Ontario and
Quebec but did not change among those in other provinces or in the lowest income level.

111
Section 2: Intermediary Factors Influencing Health
(cont’d on next page)
Figure 42: Obesity Prevalence Rates and Inequality Measures, by Sex, Income Quintile and Province, 2003 to 2013
a. British Columbia Men
2003 2013
Change Over Time
Direction Percentage Difference
Q1 Rate (95% CI)
15.3 (12.3 to 18.3)
18.8†
(12.5 to 25.0) — — —
Q5 Rate (95% CI)
13.5 (11.1 to 16.0)
15.9 (12.0 to 19.8)
— — —
Inequality Measure 2003 2013
Change Over Time
Direction Percentage Difference
DRR (95% CI)
1.13 (0.87 to 1.48)
1.18 (0.78 to 1.78)
— — —
DRD (95% CI)
1.8 (-2.3 to 5.8)
2.9 (-4.1 to 9.9)
— — —
British Columbia Women
2003 2013
Change Over Time
Direction Percentage Difference
Q1 Rate (95% CI)
13.9 (11.6 to 16.1)
14.3 (10.4 to 18.2)
— — —
Q5 Rate (95% CI)
8.9 (6.6 to 11.2)
10.6†
(7.0 to 14.2) — — —
Inequality Measure 2003 2013
Change Over Time
Direction Percentage Difference
DRR (95% CI)
1.56* (1.15 to 2.12)
1.36 (0.88 to 2.10)
— — —
DRD (95% CI)
5.0* (1.8 to 8.2)
3.8 (-1.4 to 8.9)
— — —
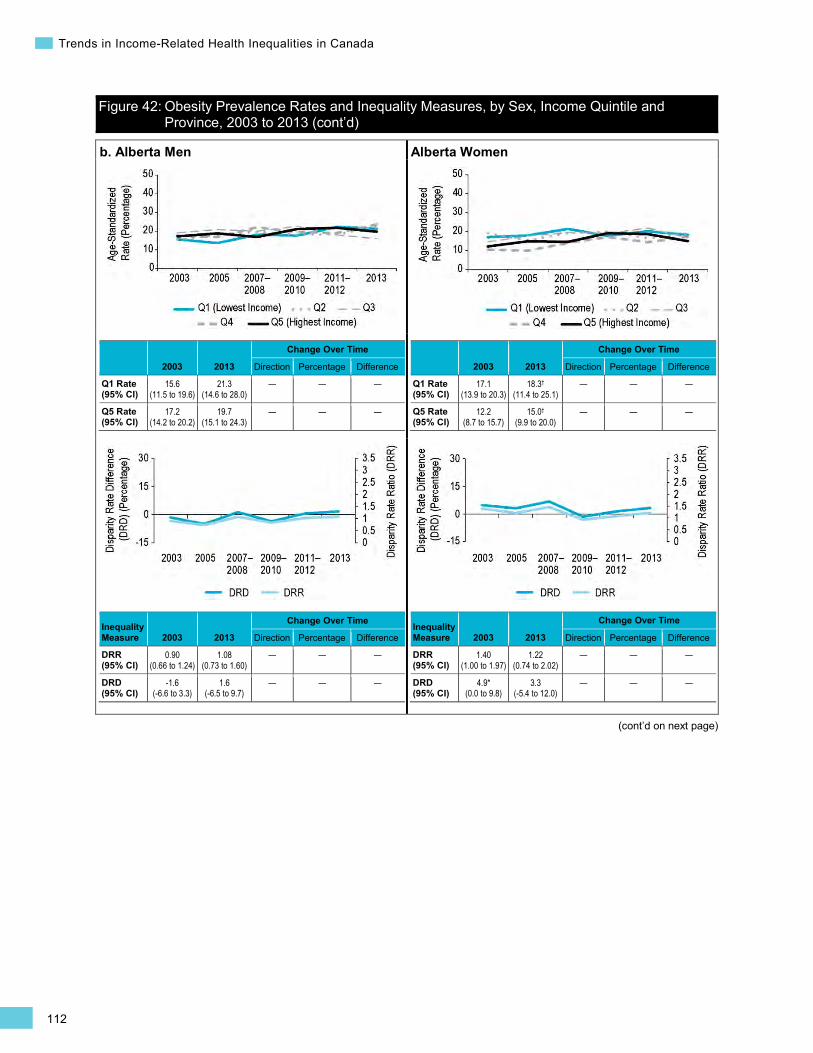
112
Trends in Income-Related Health Inequalities in Canada
(cont’d on next page)
b. Alberta Men
2003 2013
Change Over Time
Direction Percentage Difference
Q1 Rate (95% CI)
15.6 (11.5 to 19.6)
21.3 (14.6 to 28.0)
— — —
Q5 Rate (95% CI)
17.2 (14.2 to 20.2)
19.7 (15.1 to 24.3)
— — —
Inequality Measure 2003 2013
Change Over Time
Direction Percentage Difference
DRR (95% CI)
0.90 (0.66 to 1.24)
1.08 (0.73 to 1.60)
— — —
DRD (95% CI)
-1.6 (-6.6 to 3.3)
1.6 (-6.5 to 9.7)
— — —
Alberta Women
2003 2013
Change Over Time
Direction Percentage Difference
Q1 Rate (95% CI)
17.1 (13.9 to 20.3)
18.3†
(11.4 to 25.1) — — —
Q5 Rate (95% CI)
12.2 (8.7 to 15.7)
15.0†
(9.9 to 20.0) — — —
Inequality Measure 2003 2013
Change Over Time
Direction Percentage Difference
DRR (95% CI)
1.40 (1.00 to 1.97)
1.22 (0.74 to 2.02)
— — —
DRD (95% CI)
4.9* (0.0 to 9.8)
3.3 (-5.4 to 12.0)
— — —
Figure 42: Obesity Prevalence Rates and Inequality Measures, by Sex, Income Quintile and Province, 2003 to 2013 (cont’d)
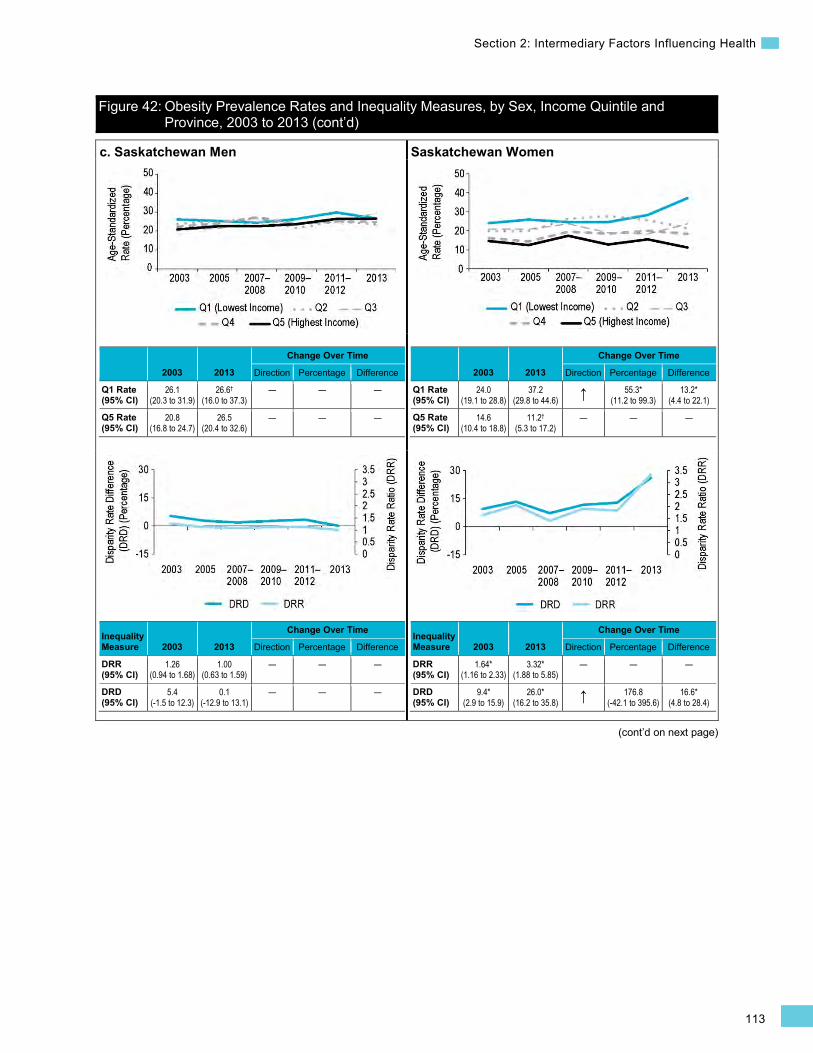
113
Section 2: Intermediary Factors Influencing Health
(cont’d on next page)
c. Saskatchewan Men
2003 2013
Change Over Time
Direction Percentage Difference
Q1 Rate (95% CI)
26.1 (20.3 to 31.9)
26.6†
(16.0 to 37.3) — — —
Q5 Rate (95% CI)
20.8 (16.8 to 24.7)
26.5 (20.4 to 32.6)
— — —
Inequality Measure 2003 2013
Change Over Time
Direction Percentage Difference
DRR (95% CI)
1.26 (0.94 to 1.68)
1.00 (0.63 to 1.59)
— — —
DRD (95% CI)
5.4 (-1.5 to 12.3)
0.1 (-12.9 to 13.1)
— — —
Saskatchewan Women
2003 2013
Change Over Time
Direction Percentage Difference
Q1 Rate (95% CI)
24.0 (19.1 to 28.8)
37.2 (29.8 to 44.6) ↑ 55.3*
(11.2 to 99.3) 13.2*
(4.4 to 22.1)
Q5 Rate (95% CI)
14.6 (10.4 to 18.8)
11.2†
(5.3 to 17.2) — — —
Inequality Measure 2003 2013
Change Over Time
Direction Percentage Difference
DRR (95% CI)
1.64* (1.16 to 2.33)
3.32* (1.88 to 5.85)
— — —
DRD (95% CI)
9.4* (2.9 to 15.9)
26.0* (16.2 to 35.8) ↑ 176.8
(-42.1 to 395.6) 16.6*
(4.8 to 28.4)
Figure 42: Obesity Prevalence Rates and Inequality Measures, by Sex, Income Quintile and Province, 2003 to 2013 (cont’d)
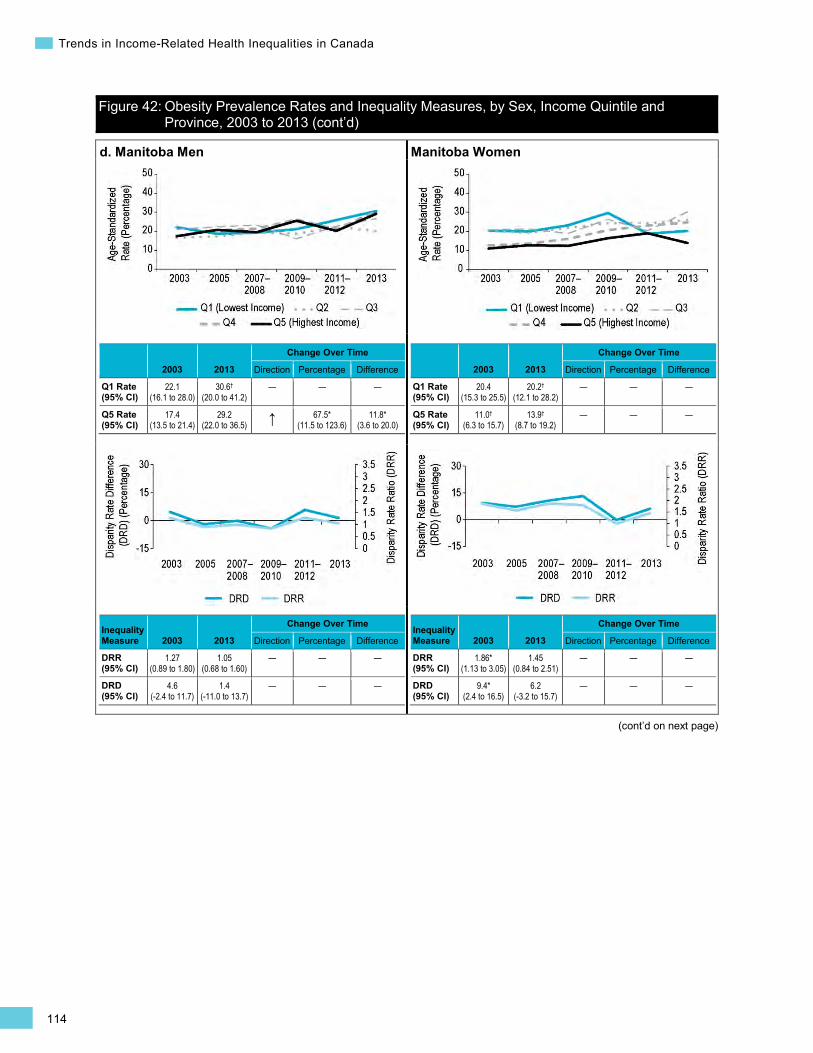
114
Trends in Income-Related Health Inequalities in Canada
Figure 42: Obesity Prevalence Rates and Inequality Measures, by Sex, Income Quintile and Province, 2003 to 2013 (cont’d)
(cont’d on next page)
d. Manitoba Men
2003 2013
Change Over Time
Direction Percentage Difference
Q1 Rate (95% CI)
22.1 (16.1 to 28.0)
30.6†
(20.0 to 41.2) — — —
Q5 Rate (95% CI)
17.4 (13.5 to 21.4)
29.2 (22.0 to 36.5) ↑ 67.5*
(11.5 to 123.6) 11.8*
(3.6 to 20.0)
Inequality Measure 2003 2013
Change Over Time
Direction Percentage Difference
DRR (95% CI)
1.27 (0.89 to 1.80)
1.05 (0.68 to 1.60)
— — —
DRD (95% CI)
4.6 (-2.4 to 11.7)
1.4 (-11.0 to 13.7)
— — —
Manitoba Women
2003 2013
Change Over Time
Direction Percentage Difference
Q1 Rate (95% CI)
20.4 (15.3 to 25.5)
20.2†
(12.1 to 28.2) — — —
Q5 Rate (95% CI)
11.0†
(6.3 to 15.7) 13.9†
(8.7 to 19.2) — — —
Inequality Measure 2003 2013
Change Over Time
Direction Percentage Difference
DRR (95% CI)
1.86* (1.13 to 3.05)
1.45 (0.84 to 2.51)
— — —
DRD (95% CI)
9.4* (2.4 to 16.5)
6.2 (-3.2 to 15.7)
— — —

115
Section 2: Intermediary Factors Influencing Health
Figure 42: Obesity Prevalence Rates and Inequality Measures, by Sex, Income Quintile and Province, 2003 to 2013 (cont’d)
(cont’d on next page)
e. Ontario Men
2003 2013
Change Over Time
Direction Percentage Difference
Q1 Rate (95% CI)
15.8 (13.5 to 18.0)
17.8 (14.4 to 21.3)
— — —
Q5 Rate (95% CI)
15.4 (13.8 to 17.0)
20.1 (17.2 to 22.9) ↑ 30.6*
(7.8 to 53.5) 4.7*
(1.5 to 8.0)
Inequality Measure 2003 2013
Change Over Time
Direction Percentage Difference
DRR (95% CI)
1.03 (0.86 to 1.22)
0.89 (0.70 to 1.13)
— — —
DRD (95% CI)
0.4 (-2.3 to 3.1)
-2.2 (-6.8 to 2.3)
— — —
Ontario Women
2003 2013
Change Over Time
Direction Percentage Difference
Q1 Rate (95% CI)
16.7 (14.9 to 18.5)
19.8 (16.3 to 23.3)
— — —
Q5 Rate (95% CI)
11.3 (9.7 to 12.9)
14.4 (11.8 to 17.1)
— — —
Inequality Measure 2003 2013
Change Over Time
Direction Percentage Difference
DRR (95% CI)
1.48* (1.24 to 1.76)
1.37* (1.06 to 1.77)
— — —
DRD (95% CI)
5.4* (3.0 to 7.8)
5.4* (0.9 to 9.8)
— — —
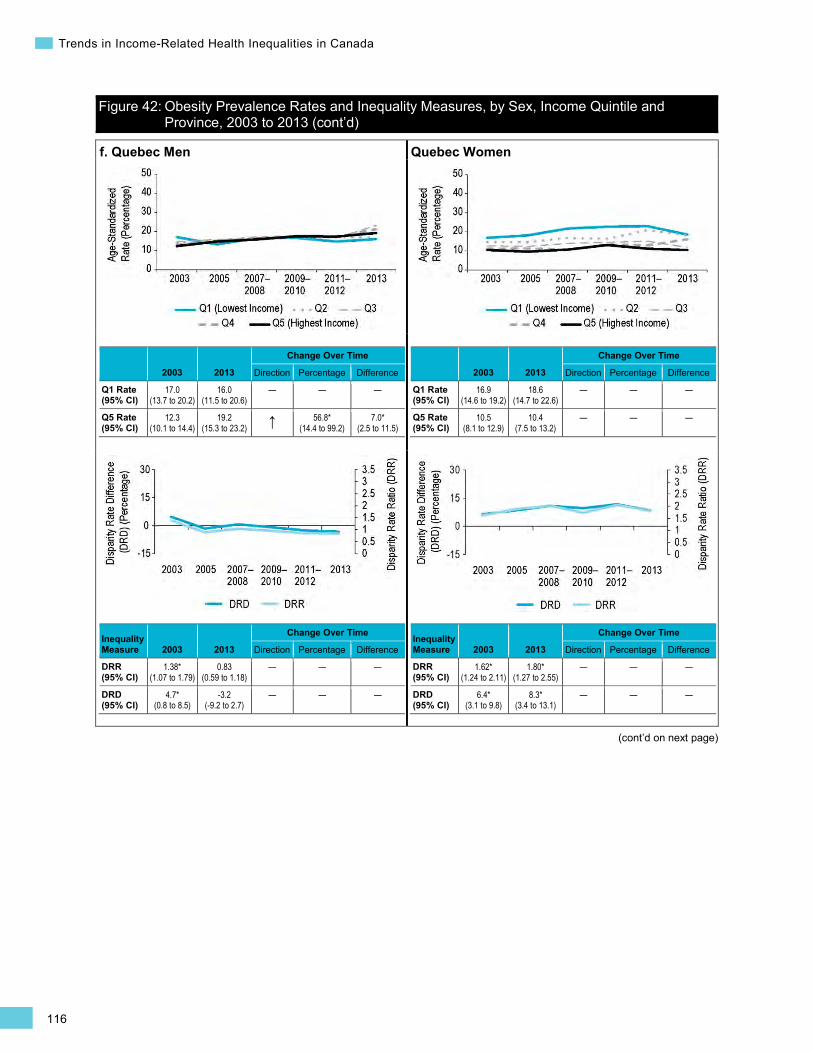
116
Trends in Income-Related Health Inequalities in Canada
Figure 42: Obesity Prevalence Rates and Inequality Measures, by Sex, Income Quintile and Province, 2003 to 2013 (cont’d)
(cont’d on next page)
f. Quebec Men
2003 2013
Change Over Time
Direction Percentage Difference
Q1 Rate (95% CI)
17.0 (13.7 to 20.2)
16.0 (11.5 to 20.6)
— — —
Q5 Rate (95% CI)
12.3 (10.1 to 14.4)
19.2 (15.3 to 23.2) ↑ 56.8*
(14.4 to 99.2) 7.0*
(2.5 to 11.5)
Inequality Measure 2003 2013
Change Over Time
Direction Percentage Difference
DRR (95% CI)
1.38* (1.07 to 1.79)
0.83 (0.59 to 1.18)
— — —
DRD (95% CI)
4.7* (0.8 to 8.5)
-3.2 (-9.2 to 2.7)
— — —
Quebec Women
2003 2013
Change Over Time
Direction Percentage Difference
Q1 Rate (95% CI)
16.9 (14.6 to 19.2)
18.6 (14.7 to 22.6)
— — —
Q5 Rate (95% CI)
10.5 (8.1 to 12.9)
10.4 (7.5 to 13.2)
— — —
Inequality Measure 2003 2013
Change Over Time
Direction Percentage Difference
DRR (95% CI)
1.62* (1.24 to 2.11)
1.80* (1.27 to 2.55)
— — —
DRD (95% CI)
6.4* (3.1 to 9.8)
8.3* (3.4 to 13.1)
— — —
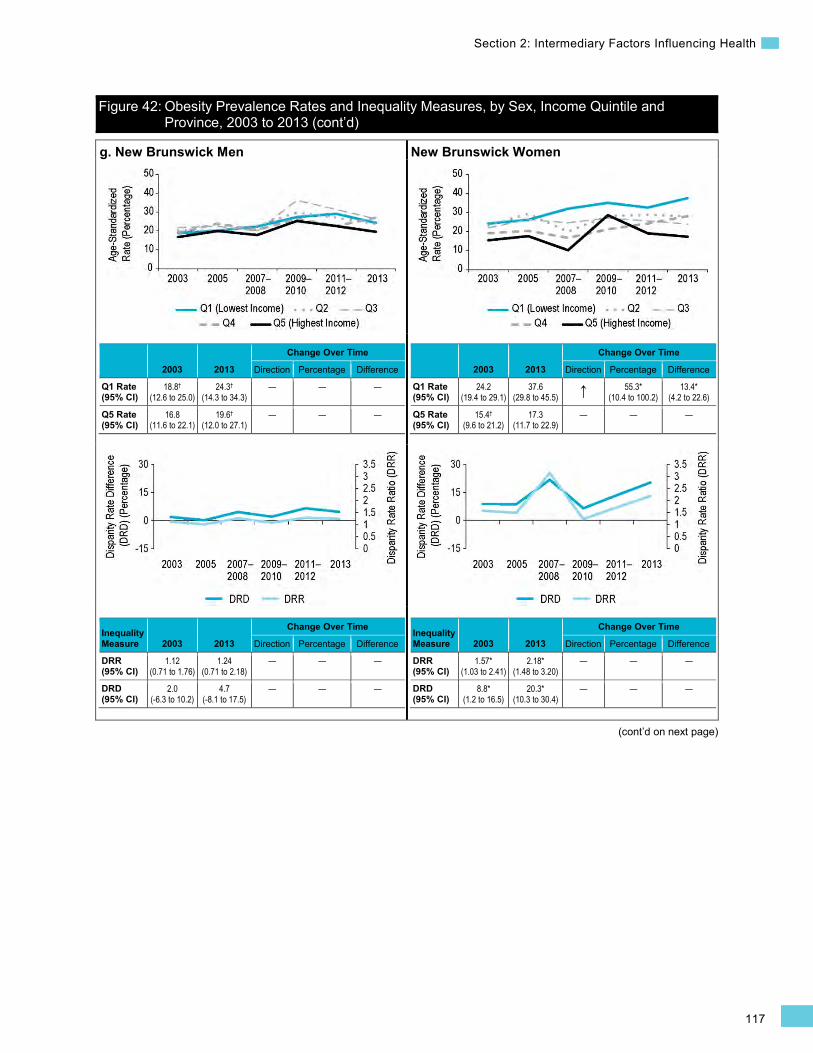
117
Section 2: Intermediary Factors Influencing Health
Figure 42: Obesity Prevalence Rates and Inequality Measures, by Sex, Income Quintile and Province, 2003 to 2013 (cont’d)
(cont’d on next page)
g. New Brunswick Men
2003 2013
Change Over Time
Direction Percentage Difference
Q1 Rate (95% CI)
18.8†
(12.6 to 25.0) 24.3†
(14.3 to 34.3) — — —
Q5 Rate (95% CI)
16.8 (11.6 to 22.1)
19.6†
(12.0 to 27.1) — — —
Inequality Measure 2003 2013
Change Over Time
Direction Percentage Difference
DRR (95% CI)
1.12 (0.71 to 1.76)
1.24 (0.71 to 2.18)
— — —
DRD (95% CI)
2.0 (-6.3 to 10.2)
4.7 (-8.1 to 17.5)
— — —
New Brunswick Women
2003 2013
Change Over Time
Direction Percentage Difference
Q1 Rate (95% CI)
24.2 (19.4 to 29.1)
37.6 (29.8 to 45.5) ↑ 55.3*
(10.4 to 100.2) 13.4*
(4.2 to 22.6)
Q5 Rate (95% CI)
15.4†
(9.6 to 21.2) 17.3
(11.7 to 22.9) — — —
Inequality Measure 2003 2013
Change Over Time
Direction Percentage Difference
DRR (95% CI)
1.57* (1.03 to 2.41)
2.18* (1.48 to 3.20)
— — —
DRD (95% CI)
8.8* (1.2 to 16.5)
20.3* (10.3 to 30.4)
— — —
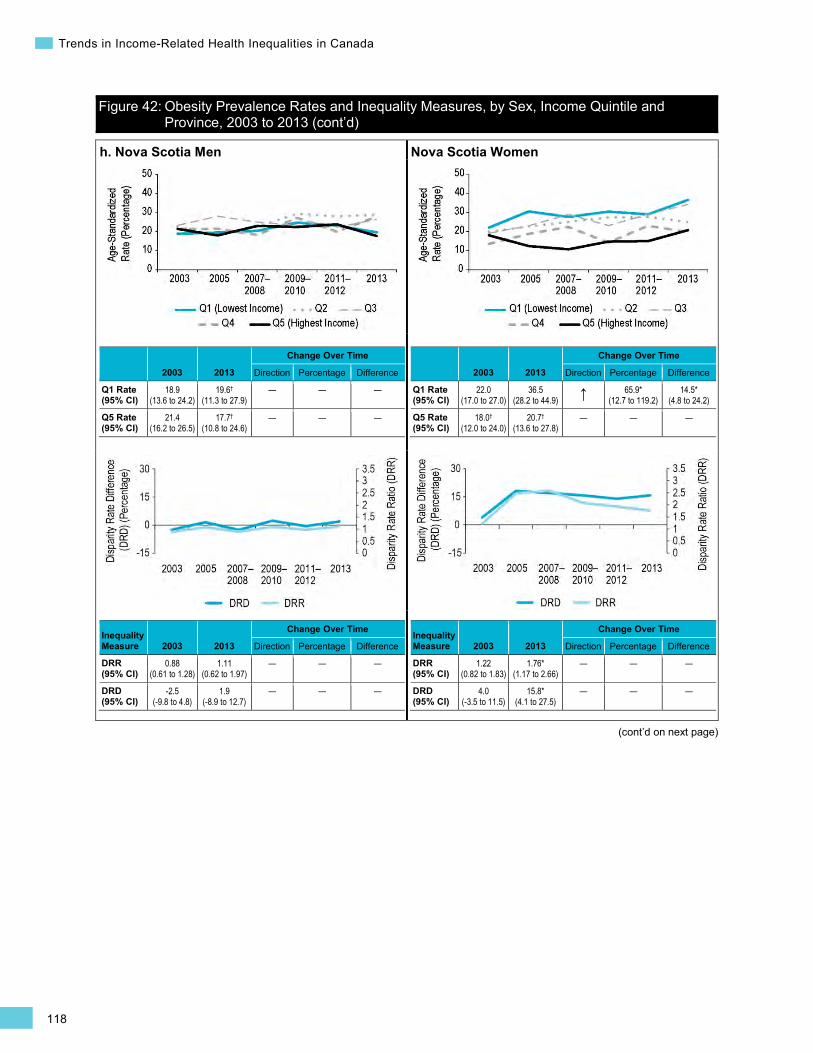
118
Trends in Income-Related Health Inequalities in Canada
Figure 42: Obesity Prevalence Rates and Inequality Measures, by Sex, Income Quintile and Province, 2003 to 2013 (cont’d)
(cont’d on next page)
h. Nova Scotia Men
2003 2013
Change Over Time
Direction Percentage Difference
Q1 Rate (95% CI)
18.9 (13.6 to 24.2)
19.6†
(11.3 to 27.9) — — —
Q5 Rate (95% CI)
21.4 (16.2 to 26.5)
17.7†
(10.8 to 24.6) — — —
Inequality Measure 2003 2013
Change Over Time
Direction Percentage Difference
DRR (95% CI)
0.88 (0.61 to 1.28)
1.11 (0.62 to 1.97)
— — —
DRD (95% CI)
-2.5 (-9.8 to 4.8)
1.9 (-8.9 to 12.7)
— — —
Nova Scotia Women
2003 2013
Change Over Time
Direction Percentage Difference
Q1 Rate (95% CI)
22.0 (17.0 to 27.0)
36.5 (28.2 to 44.9) ↑ 65.9*
(12.7 to 119.2) 14.5*
(4.8 to 24.2)
Q5 Rate (95% CI)
18.0†
(12.0 to 24.0) 20.7†
(13.6 to 27.8) — — —
Inequality Measure 2003 2013
Change Over Time
Direction Percentage Difference
DRR (95% CI)
1.22 (0.82 to 1.83)
1.76* (1.17 to 2.66)
— — —
DRD (95% CI)
4.0 (-3.5 to 11.5)
15.8* (4.1 to 27.5)
— — —
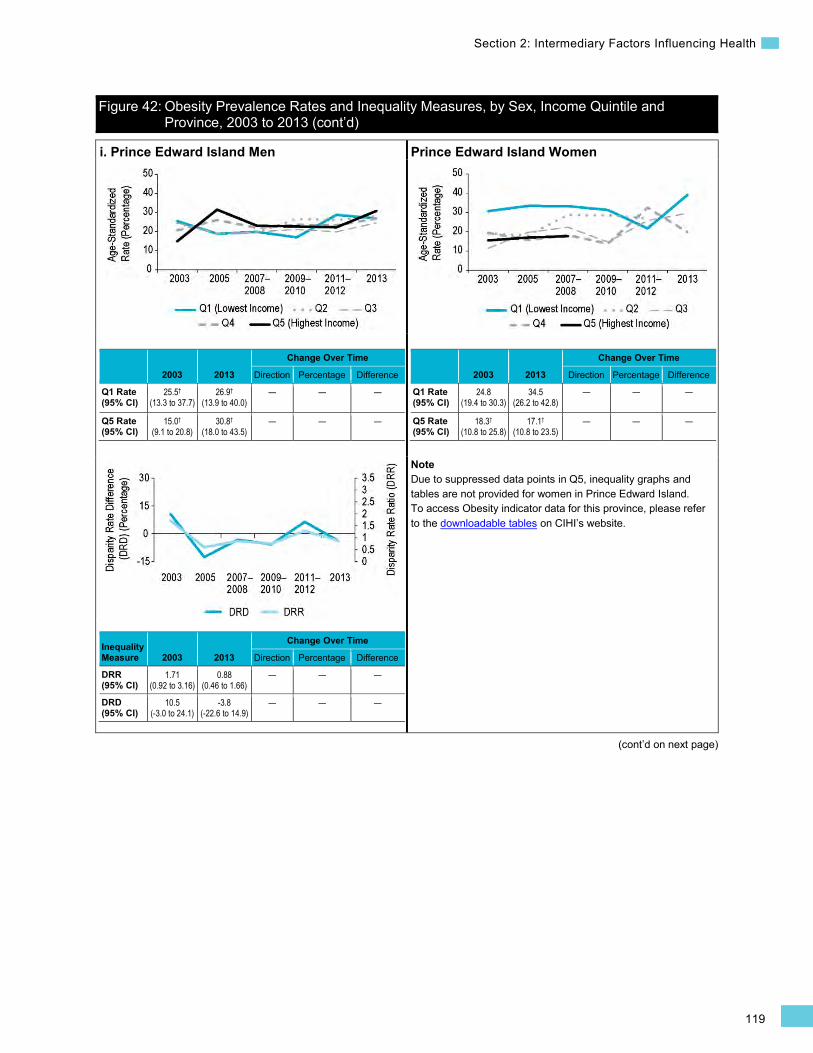
119
Section 2: Intermediary Factors Influencing Health
Figure 42: Obesity Prevalence Rates and Inequality Measures, by Sex, Income Quintile and Province, 2003 to 2013 (cont’d)
(cont’d on next page)
i. Prince Edward Island Men
2003 2013
Change Over Time
Direction Percentage Difference
Q1 Rate (95% CI)
25.5†
(13.3 to 37.7) 26.9†
(13.9 to 40.0) — — —
Q5 Rate (95% CI)
15.0†
(9.1 to 20.8) 30.8†
(18.0 to 43.5) — — —
Inequality Measure 2003 2013
Change Over Time
Direction Percentage Difference
DRR (95% CI)
1.71 (0.92 to 3.16)
0.88 (0.46 to 1.66)
— — —
DRD (95% CI)
10.5 (-3.0 to 24.1)
-3.8 (-22.6 to 14.9)
— — —
Prince Edward Island Women
2003 2013
Change Over Time
Direction Percentage Difference
Q1 Rate (95% CI)
24.8 (19.4 to 30.3)
34.5 (26.2 to 42.8)
— — —
Q5 Rate (95% CI)
18.3†
(10.8 to 25.8) 17.1†
(10.8 to 23.5) — — —
Note Due to suppressed data points in Q5, inequality graphs and tables are not provided for women in Prince Edward Island. To access Obesity indicator data for this province, please refer to the downloadable tables on CIHI’s website.
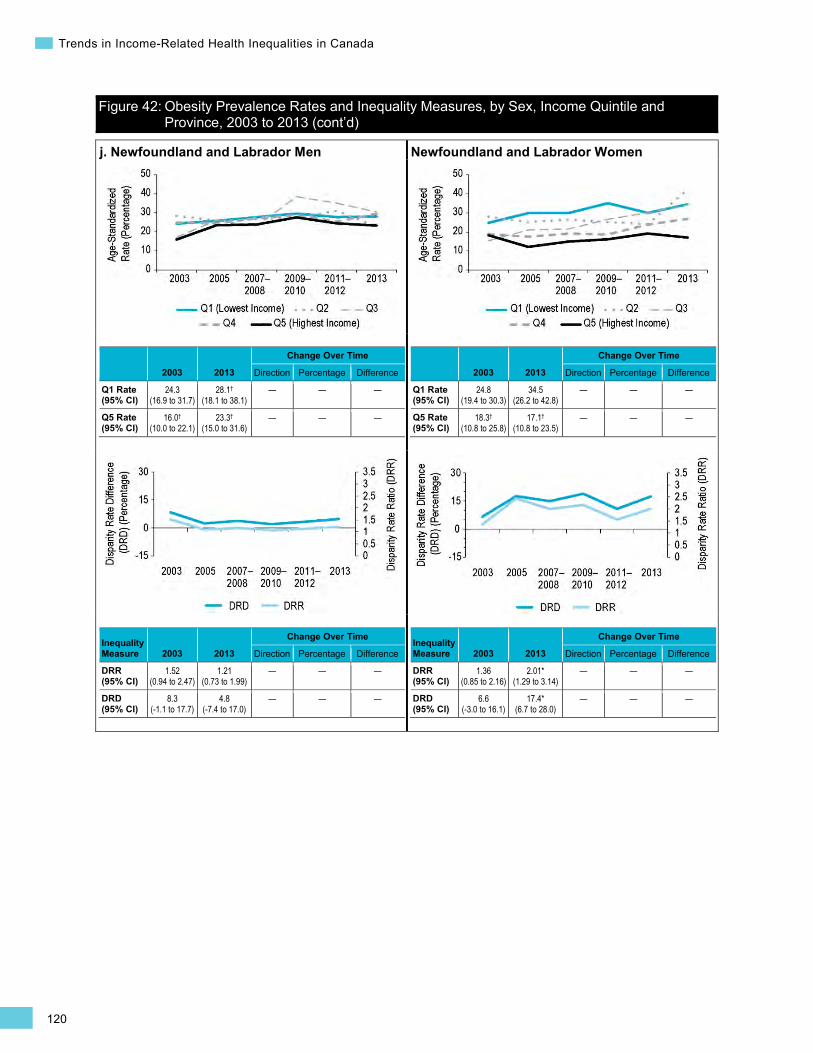
120
Trends in Income-Related Health Inequalities in Canada
Figure 42: Obesity Prevalence Rates and Inequality Measures, by Sex, Income Quintile and Province, 2003 to 2013 (cont’d)
j. Newfoundland and Labrador Men
2003 2013
Change Over Time
Direction Percentage Difference
Q1 Rate (95% CI)
24.3 (16.9 to 31.7)
28.1†
(18.1 to 38.1) — — —
Q5 Rate (95% CI)
16.0†
(10.0 to 22.1) 23.3†
(15.0 to 31.6) — — —
Inequality Measure 2003 2013
Change Over Time
Direction Percentage Difference
DRR (95% CI)
1.52 (0.94 to 2.47)
1.21 (0.73 to 1.99)
— — —
DRD (95% CI)
8.3 (-1.1 to 17.7)
4.8 (-7.4 to 17.0)
— — —
Newfoundland and Labrador Women
2003 2013
Change Over Time
Direction Percentage Difference
Q1 Rate (95% CI)
24.8 (19.4 to 30.3)
34.5 (26.2 to 42.8)
— — —
Q5 Rate (95% CI)
18.3†
(10.8 to 25.8) 17.1†
(10.8 to 23.5) — — —
Inequality Measure 2003 2013
Change Over Time
Direction Percentage Difference
DRR (95% CI)
1.36 (0.85 to 2.16)
2.01* (1.29 to 3.14)
— — —
DRD (95% CI)
6.6 (-3.0 to 16.1)
17.4* (6.7 to 28.0)
— — —
121
Section 2: Intermediary Factors Influencing Health
(cont’d on next page)
Health System Indicators Influenza Immunization for Seniors Background
The Influenza Immunization for Seniors indicator captures the percentage of Canadians age 65 and older who were immunized against influenza during the last 12 months. Influenza virus (A and B) has the potential to cause significant morbidity and mortality among high-risk groups, such as children younger than age 2, adults age 65 and older, pregnant women and persons of any age with weakened immune systems or underlying chronic conditions.371–373 Chronic conditions are more common among those with lower income and among seniors,374 thus increasing the risk that seniors of lower income will develop influenza-related complications.375, 376
Influenza-related complications can result in acute hospitalizations377 and/or death.378 In 2013, seniors accounted for approximately 69% of influenza-related hospitalizations and 85% of influenza-attributed mortality.377
The influenza vaccine has been shown to be effective at reducing the incidence of pneumonia, health service use and related mortality.379 The National Advisory Committee on Immunization recommends that at least 80% of eligible Canadian seniors receive the annual influenza vaccine.380 Despite this target, only 64.1% of seniors in 2013 reported receiving the influenza vaccine in the past year.616
Indicator Notes Data Source Canadian Community Health Survey (CCHS), Statistics Canada
Income Disaggregator Self-reported adjusted household income from the CCHS
Age Standardization 2011 Canadian standard population
Time Period 2003 to 2013
Please refer to Trends in Income-Related Health Inequalities in Canada: Indicator Definitions for detailed technical notes.
Additional Data National and provincial data for the complete time period and middle income quintiles (Quintile 2 to Quintile 4), as well as provincial data disaggregated by sex, is not presented in this report. This data is available on CIHI’s website in the form of downloadable tables.
Symbols and Abbreviations
* Estimate is statistically significant (i.e., statistically different from 1 for DRR or different from 0 for DRD, PRR, Change Over Time Percentage and Change Over Time Difference, based on the 95% CI)
† Interpret with caution (coefficient of variance from 16.6% to 33.3%)
Q1 Quintile 1 (lowest income quintile)
Q5 Quintile 5 (highest income quintile)
95% CI 95% confidence interval
↑ Statistically significant increase between 2003 estimate and 2013 estimate
↓ Statistically significant decrease between 2003 estimate and 2013 estimate
— No statistically significant change between 2003 estimate and 2013 estimate
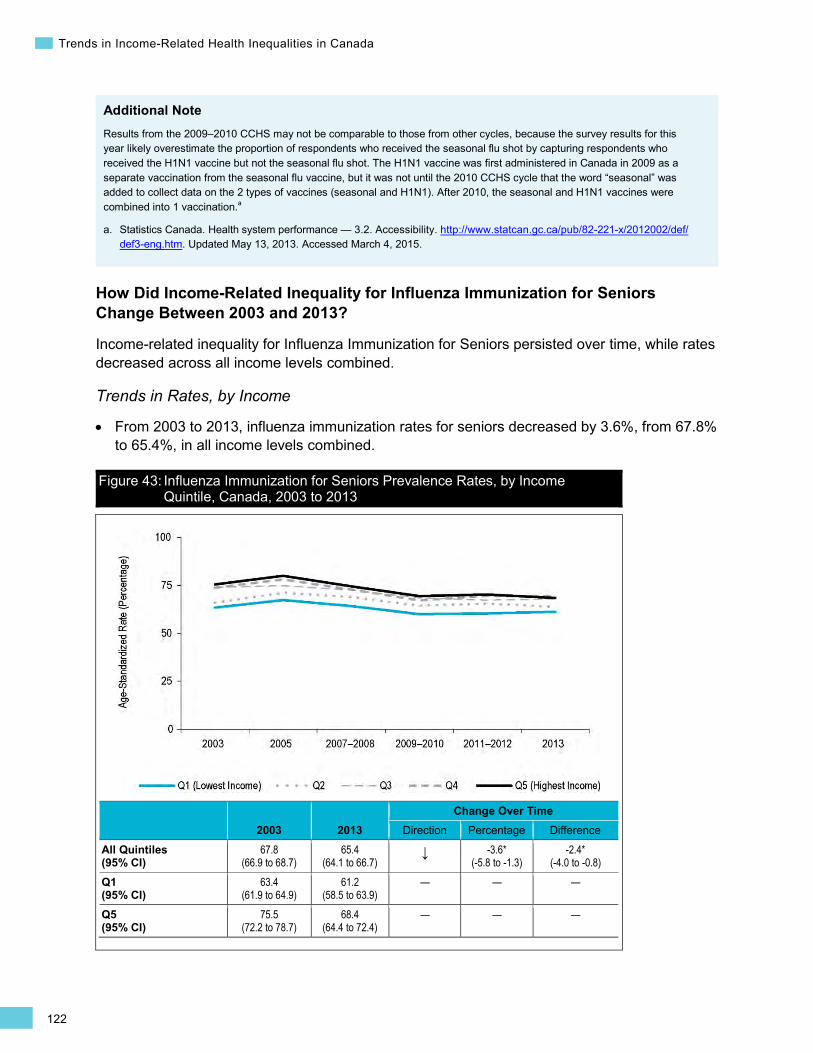
122
Trends in Income-Related Health Inequalities in Canada
•
Additional Note Results from the 2009–2010 CCHS may not be comparable to those from other cycles, because the survey results for this year likely overestimate the proportion of respondents who received the seasonal flu shot by capturing respondents who received the H1N1 vaccine but not the seasonal flu shot. The H1N1 vaccine was first administered in Canada in 2009 as a separate vaccination from the seasonal flu vaccine, but it was not until the 2010 CCHS cycle that the word “seasonal” was added to collect data on the 2 types of vaccines (seasonal and H1N1). After 2010, the seasonal and H1N1 vaccines were combined into 1 vaccination.a
a. Statistics Canada. Health system performance — 3.2. Accessibility. http://www.statcan.gc.ca/pub/82-221-x/2012002/def/def3-eng.htm. Updated May 13, 2013. Accessed March 4, 2015.
How Did Income-Related Inequality for Influenza Immunization for Seniors Change Between 2003 and 2013?
Income-related inequality for Influenza Immunization for Seniors persisted over time, while rates decreased across all income levels combined.
Trends in Rates, by Income
From 2003 to 2013, influenza immunization rates for seniors decreased by 3.6%, from 67.8% to 65.4%, in all income levels combined.
Figure 43: Influenza Immunization for Seniors Prevalence Rates, by Income Quintile, Canada, 2003 to 2013
2003 2013 Change Over Time
Direction Percentage Difference
All Quintiles (95% CI)
67.8 (66.9 to 68.7)
65.4 (64.1 to 66.7)
↓ -3.6* (-5.8 to -1.3)
-2.4* (-4.0 to -0.8)
Q1 (95% CI)
63.4 (61.9 to 64.9)
61.2 (58.5 to 63.9)
— — —
Q5 (95% CI)
75.5 (72.2 to 78.7)
68.4 (64.4 to 72.4)
— — —
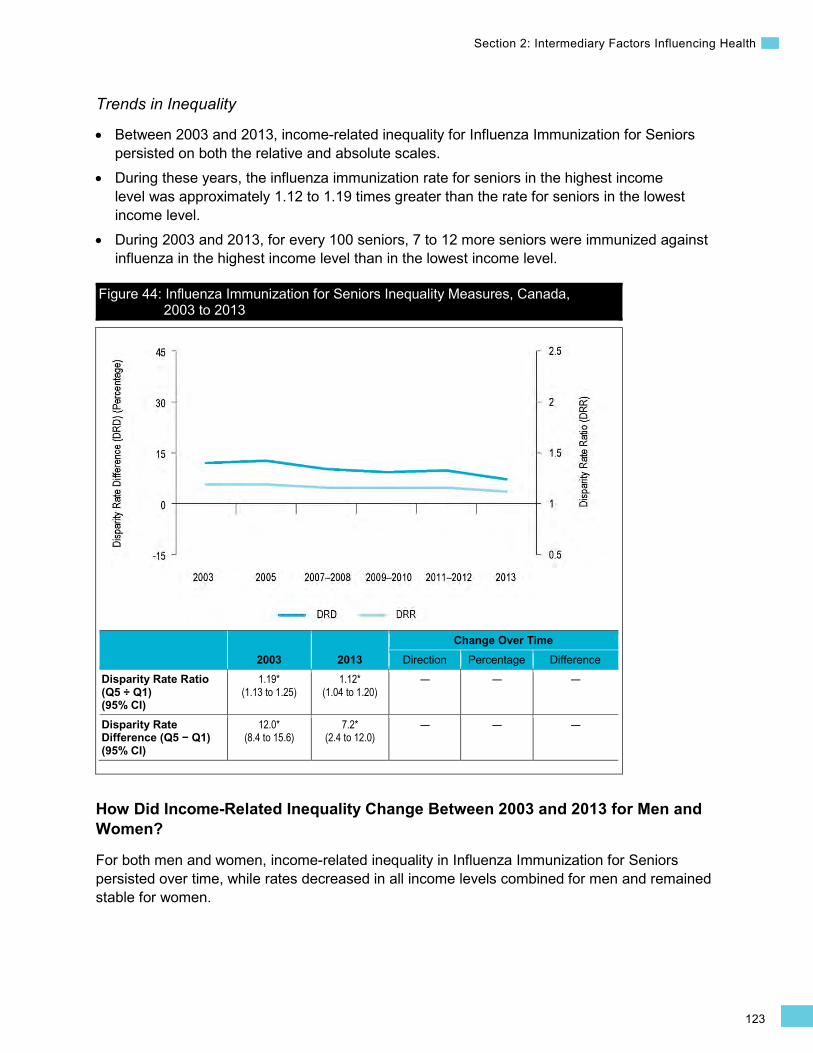
123
Section 2: Intermediary Factors Influencing Health
Trends in Inequality
• Between 2003 and 2013, income-related inequality for Influenza Immunization for Seniors persisted on both the relative and absolute scales.
• During these years, the influenza immunization rate for seniors in the highest income level was approximately 1.12 to 1.19 times greater than the rate for seniors in the lowest income level.
• During 2003 and 2013, for every 100 seniors, 7 to 12 more seniors were immunized against influenza in the highest income level than in the lowest income level.
Figure 44: Influenza Immunization for Seniors Inequality Measures, Canada, 2003 to 2013
2003 2013 Change Over Time
Direction Percentage Difference Disparity Rate Ratio (Q5 ÷ Q1) (95% CI)
1.19* (1.13 to 1.25)
1.12* (1.04 to 1.20)
— — —
Disparity Rate Difference (Q5 − Q1) (95% CI)
12.0* (8.4 to 15.6)
7.2* (2.4 to 12.0)
— — —
How Did Income-Related Inequality Change Between 2003 and 2013 for Men and Women?
For both men and women, income-related inequality in Influenza Immunization for Seniors persisted over time, while rates decreased in all income levels combined for men and remained stable for women.

124
Trends in Income-Related Health Inequalities in Canada
Men Women
Trends in Rates, by Income and Sex
• For men, between 2003 and 2013, rates of Influenza Immunization for Seniors decreased in all income levels combined.
• For women, between 2003 and 2013, rates of Influenza Immunization for Seniors did not change in any income level.
Figure 45: Influenza Immunization for Seniors Prevalence Rates, by Income Quintile and Sex, Canada, 2003 to 2013
Men Women
2003 2013
Change Over Time
2003 2013
Change Over Time
Direction Percentage Difference Direction Percentage Difference
All Quintiles (95% CI)
68.6 (67.3 to 69.9)
65.4 (63.5 to 67.2) ↓ -4.7*
(-8.0 to -1.5) -3.2*
(-5.5 to -1.0) 67.5
(66.3 to 68.6) 65.3
(63.5 to 67.1) — — —
Q1 (95% CI)
63.1 (60.4 to 65.9)
61.3 (57.2 to 65.5)
— — — 63.9 (62.1 to 65.7)
61.1 (57.6 to 64.7)
— — —
Q5 (95% CI)
73.7 (69.7 to 77.7)
69.1 (64.4 to 73.8)
— — — 76.7 (71.6 to 81.7)
65.5 (58.6 to 72.5)
— — —
Trends in Inequality, by Sex
For both men and women,iv income-related inequality persisted on both the relative and absolute scales between 2003 and 2013.
iv. For women, a decrease in relative and absolute inequality is suggested because the DRR and DRD were statistically significant in 2003 but not in 2013. However, the confidence limits overlap between the estimates for 2003 and 2013, and therefore there is technically no significant change over time based on the methodology employed in this report.
•

125
Section 2: Intermediary Factors Influencing Health
Men Women
Figure 46: Influenza Immunization for Seniors Inequality Measures, by Sex, Canada, 2003 to 2013
Men Women
2003 2013
Change Over Time
2003 2013
Change Over Time
Direction Percentage Difference Direction Percentage Difference
Disparity Rate Ratio (Q5 ÷ Q1) (95% CI)
1.17* (1.09 to 1.25)
1.13* (1.02 to 1.24)
— — — 1.20* (1.12 to 1.29)
1.07 (0.95 to 1.21)
— — —
Disparity Rate Difference (Q5 − Q1) (95% CI)
10.5* (5.7 to 15.4)
7.8* (1.5 to 14.0)
— — — 12.8* (7.4 to 18.1)
4.4 (-3.4 to 12.2)
— — —
Addressing Income-Related Inequality for Influenza Immunization for Seniors
These analyses suggest that income-related inequality persisted for Influenza Immunization for Seniors over the past decade. Furthermore, fewer seniors in all income levels combined reported influenza immunization over time; this decrease was driven primarily by a decrease among men.
Inequality Impact Measures
In 2013, 4.5% or approximately 89,500 more seniors in Canada could have been immunized for influenza if seniors in all income levels had experienced the same rate of influenza immunization as seniors in the highest income level.
Table 8: Influenza Immunization for Seniors Inequality Impact Measures, Canada, 2003 to 2013
Both Sexes Men Women 2003 2013 2003 2013 2003 2013
Potential Rate Improvement (Percentage)‡‡ (95% CI)
9.8* (9.3 to 10.2)
4.5* (4.2 to 4.8)
6.6* (6.2 to 7.0)
5.4* (5.0 to 5.8)
11.9* (11.1 to 12.7)
0.6* (0.6 to 0.7)
Population Impact Number 319,900 89,500 99,400 78,000 220,500 11,500
Note ‡‡ Also known as “prevented fraction.”
•
126
Trends in Income-Related Health Inequalities in Canada
Approaches for Addressing Inequality
In 2000, 11 provinces and territories had publicly funded influenza programs for seniors (age 65 and older); Prince Edward Island and New Brunswick did not.381 As of early 2014, all 13 provinces and territories had publicly funded influenza immunization programs for seniors.382 Universal publicly funded influenza programs have been shown to be cost-effective in reducing influenza-related complications, morbidity and mortality.379 However, despite flu shots being publicly funded, the current analysis identified that income-related inequality persisted for Influenza Immunization for Seniors. The rate of Influenza Immunization for Seniors decreased across this time period for all income levels combined, particularly among men.
A few strategies have been identified to increase influenza immunization rates among seniors, such as increasing access in the community (e.g., home visits, community clinics) and providing reminders (e.g., personalized phone calls or post cards).383 With respect to increasing access, several provinces have expanded pharmacists’ scope of practice, which allows them to administer influenza vaccinations (see Box 13 below).384–386
Box 13: Pharmacy-Based Influenza Vaccination Clinics, 2009 and 2010 Issue: Across Canada, influenza immunization rates for seniors remain below the 80% target goal,380 particularly among Canadians in the lowest income level as identified in this report. In particular, between 2003 and 2013, British Columbia had a decrease in influenza immunization rates for seniors in the lowest income level.
Intervention: Increasing access in the community is a potential strategy to increase uptake of influenza vaccinations, particularly in rural and lower-income areas in Canada. Several provinces have expanded pharmacists’ scope of practice to include administration of influenza vaccinations, which improves accessibility.385 Marra and colleagues recently conducted a 2-year cluster-randomized control trial evaluating the effectiveness of using a pharmacy-based immunization intervention targeting seniors and vulnerable groups.384 Using pharmacy-based influenza vaccination clinics in rural British Columbia, personalized invitations were sent and community-based media advertisements were employed.384
Rationale/Evidence: This pharmacy-based influenza immunization strategy demonstrated improvements in influenza vaccine uptake among seniors living in rural British Columbia.384 A larger percentage of individuals who were vaccinated in the pharmacy-based vaccination clinics had lower-to-middle-range total household incomes, ranging from less than $14,000 to between $45,000 and $59,999.384 Individuals who fell within the household income range of $15,000 to $29,000 had the highest vaccination percentage in the pharmacy-based influenza vaccination clinic.384
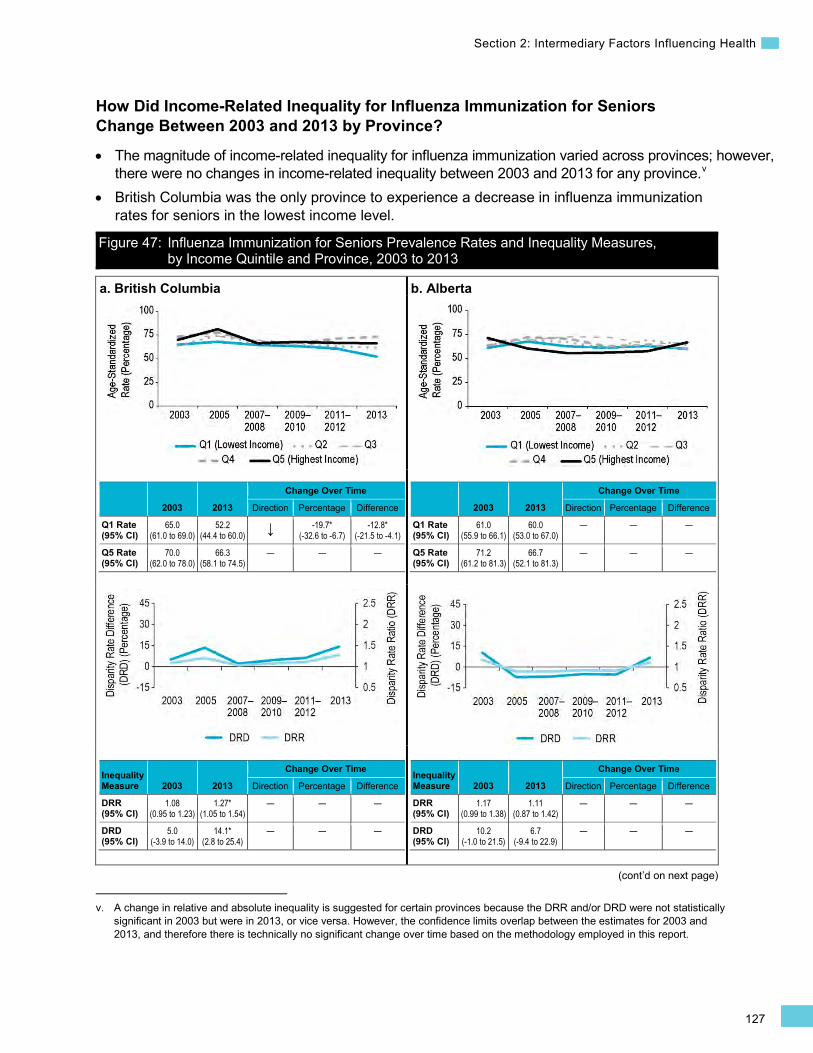
127
Section 2: Intermediary Factors Influencing Health
(cont’d on next page)
How Did Income-Related Inequality for Influenza Immunization for Seniors Change Between 2003 and 2013 by Province?
• The magnitude of income-related inequality for influenza immunization varied across provinces; however, there were no changes in income-related inequality between 2003 and 2013 for any province.v
• British Columbia was the only province to experience a decrease in influenza immunization rates for seniors in the lowest income level.
v. A change in relative and absolute inequality is suggested for certain provinces because the DRR and/or DRD were not statistically significant in 2003 but were in 2013, or vice versa. However, the confidence limits overlap between the estimates for 2003 and 2013, and therefore there is technically no significant change over time based on the methodology employed in this report.
Figure 47: Influenza Immunization for Seniors Prevalence Rates and Inequality Measures, by Income Quintile and Province, 2003 to 2013
a. British Columbia
2003 2013
Change Over Time
Direction Percentage Difference
Q1 Rate (95% CI)
65.0 (61.0 to 69.0)
52.2 (44.4 to 60.0) ↓ -19.7*
(-32.6 to -6.7) -12.8*
(-21.5 to -4.1)
Q5 Rate (95% CI)
70.0 (62.0 to 78.0)
66.3 (58.1 to 74.5)
— — —
Inequality Measure 2003 2013
Change Over Time
Direction Percentage Difference
DRR (95% CI)
1.08 (0.95 to 1.23)
1.27* (1.05 to 1.54)
— — —
DRD (95% CI)
5.0 (-3.9 to 14.0)
14.1* (2.8 to 25.4)
— — —
b. Alberta
2003 2013
Change Over Time
Direction Percentage Difference
Q1 Rate (95% CI)
61.0 (55.9 to 66.1)
60.0 (53.0 to 67.0)
— — —
Q5 Rate (95% CI)
71.2 (61.2 to 81.3)
66.7 (52.1 to 81.3)
— — —
Inequality Measure 2003 2013
Change Over Time
Direction Percentage Difference
DRR (95% CI)
1.17 (0.99 to 1.38)
1.11 (0.87 to 1.42)
— — —
DRD (95% CI)
10.2 (-1.0 to 21.5)
6.7 (-9.4 to 22.9)
— — —
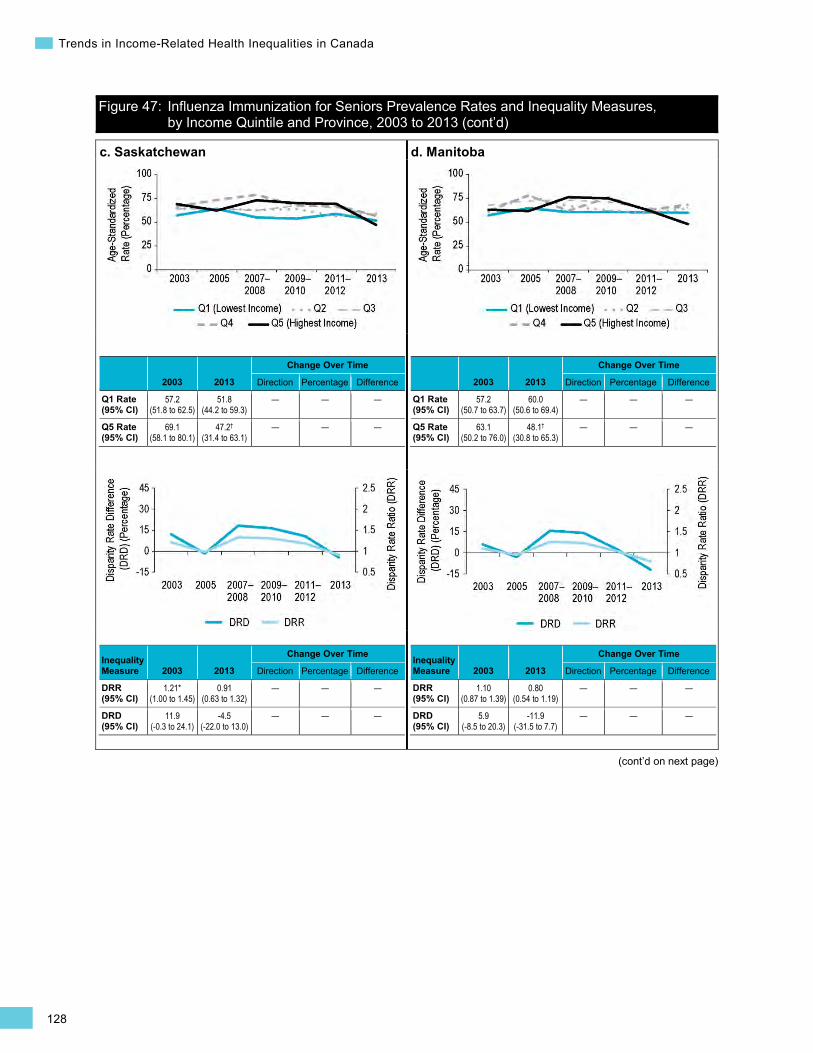
128
Trends in Income-Related Health Inequalities in Canada
Figure 47: Influenza Immunization for Seniors Prevalence Rates and Inequality Measures, by Income Quintile and Province, 2003 to 2013 (cont’d)
(cont’d on next page)
c. Saskatchewan
2003 2013
Change Over Time
Direction Percentage Difference
Q1 Rate (95% CI)
57.2 (51.8 to 62.5)
51.8 (44.2 to 59.3)
— — —
Q5 Rate (95% CI)
69.1 (58.1 to 80.1)
47.2†
(31.4 to 63.1) — — —
Inequality Measure 2003 2013
Change Over Time
Direction Percentage Difference
DRR (95% CI)
1.21* (1.00 to 1.45)
0.91 (0.63 to 1.32)
— — —
DRD (95% CI)
11.9 (-0.3 to 24.1)
-4.5 (-22.0 to 13.0)
— — —
d. Manitoba
2003 2013
Change Over Time
Direction Percentage Difference
Q1 Rate (95% CI)
57.2 (50.7 to 63.7)
60.0 (50.6 to 69.4)
— — —
Q5 Rate (95% CI)
63.1 (50.2 to 76.0)
48.1†
(30.8 to 65.3) — — —
Inequality Measure 2003 2013
Change Over Time
Direction Percentage Difference
DRR (95% CI)
1.10 (0.87 to 1.39)
0.80 (0.54 to 1.19)
— — —
DRD (95% CI)
5.9 (-8.5 to 20.3)
-11.9 (-31.5 to 7.7)
— — —

129
Section 2: Intermediary Factors Influencing Health
Figure 47: Influenza Immunization for Seniors Prevalence Rates and Inequality Measures, by Income Quintile and Province, 2003 to 2013 (cont’d)
(cont’d on next page)
e. Ontario
2003 2013
Change Over Time
Direction Percentage Difference
Q1 Rate (95% CI)
71.5 (69.0 to 74.0)
65.5 (60.3 to 70.7)
— — —
Q5 Rate (95% CI)
77.9 (73.0 to 82.7)
73.0 (67.3 to 78.6)
— — —
Inequality Measure 2003 2013
Change Over Time
Direction Percentage Difference
DRR (95% CI)
1.09* (1.01 to 1.17)
1.11 (1.00 to 1.25)
— — —
DRD (95% CI)
6.4* (0.9 to 11.8)
7.5 (-0.2 to 15.2)
— — —
f. Quebec
2003 2013
Change Over Time
Direction Percentage Difference
Q1 Rate (95% CI)
54.5 (50.8 to 58.1)
61.5 (56.4 to 66.7)
— — —
Q5 Rate (95% CI)
70.3 (59.7 to 80.9)
59.9 (49.0 to 70.8)
— — —
Inequality Measure 2003 2013
Change Over Time
Direction Percentage Difference
DRR (95% CI)
1.29* (1.10 to 1.52)
0.97 (0.80 to 1.19)
— — —
DRD (95% CI)
15.9* (4.7 to 27.1)
-1.6 (-13.7 to 10.5)
— — —

130
Trends in Income-Related Health Inequalities in Canada
Figure 47: Influenza Immunization for Seniors Prevalence Rates and Inequality Measures, by Income Quintile and Province, 2003 to 2013 (cont’d)
(cont’d on next page)
g. New Brunswick
2003 2013
Change Over Time
Direction Percentage Difference
Q1 Rate (95% CI)
51.5 (44.0 to 59.0)
63.1 (55.1 to 71.1)
— — —
Q5 Rate (95% CI)
76.4 (60.7 to 92.2)
64.4 (50.0 to 78.7)
— — —
Inequality Measure 2003 2013
Change Over Time
Direction Percentage Difference
DRR (95% CI)
1.48* (1.15 to 1.91)
1.02 (0.79 to 1.32)
— — —
DRD (95% CI)
24.9* (7.5 to 42.4)
1.3 (-15.2 to 17.7)
— — —
h. Nova Scotia
2003 2013
Change Over Time
Direction Percentage Difference
Q1 Rate (95% CI)
71.1 (65.7 to 76.5)
71.4 (63.5 to 79.3)
— — —
Q5 Rate (95% CI)
74.4 (59.1 to 89.7)
77.8 (66.4 to 89.2)
— — —
Inequality Measure 2003 2013
Change Over Time
Direction Percentage Difference
DRR (95% CI)
1.05 (0.84 to 1.30)
1.09 (0.91 to 1.31)
— — —
DRD (95% CI)
3.3 (-13.0 to 19.5)
6.4 (-7.5 to 20.2)
— — —
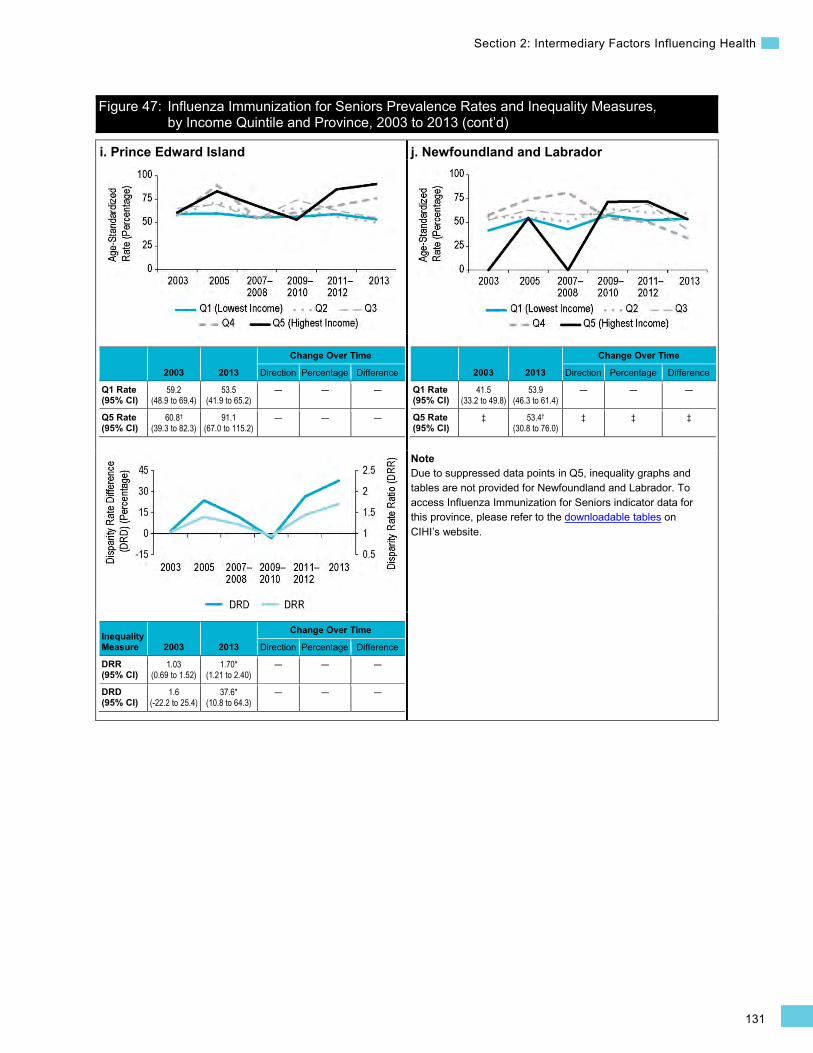
131
Section 2: Intermediary Factors Influencing Health
Figure 47: Influenza Immunization for Seniors Prevalence Rates and Inequality Measures, by Income Quintile and Province, 2003 to 2013 (cont’d)
i. Prince Edward Island
2003 2013
Change Over Time
Direction Percentage Difference
Q1 Rate (95% CI)
59.2 (48.9 to 69.4)
53.5 (41.9 to 65.2)
— — —
Q5 Rate (95% CI)
60.8†
(39.3 to 82.3) 91.1
(67.0 to 115.2) — — —
Inequality Measure 2003 2013
Change Over Time
Direction Percentage Difference
DRR (95% CI)
1.03 (0.69 to 1.52)
1.70* (1.21 to 2.40)
— — —
DRD (95% CI)
1.6 (-22.2 to 25.4)
37.6* (10.8 to 64.3)
— — —
j. Newfoundland and Labrador
2003 2013
Change Over Time
Direction Percentage Difference
Q1 Rate (95% CI)
41.5 (33.2 to 49.8)
53.9 (46.3 to 61.4)
— — —
Q5 Rate (95% CI)
‡ 53.4†
(30.8 to 76.0) ‡ ‡ ‡
Note Due to suppressed data points in Q5, inequality graphs and tables are not provided for Newfoundland and Labrador. To access Influenza Immunization for Seniors indicator data for this province, please refer to the downloadable tables on CIHI’s website.
132
Trends in Income-Related Health Inequalities in Canada
Chronic Obstructive Pulmonary Disease (COPD) Hospitalization for Canadians Younger Than Age 75 Background
The COPD Hospitalization for Canadians Younger than Age 75 indicator captures inpatient treatment at general hospitals for COPD. This indicator is calculated for individuals age 74 and younger and is expressed as a separation rate (including discharges, sign-outs and transfers) per 100,000 Canadians.
COPD is a chronic lung disease that progresses over time; most people who develop the condition are diagnosed later in life.387 The condition includes chronic bronchitis and emphysema and is characterized by breathlessness, excess mucus production, coughing and airflow limitation.387 For persons with COPD age 74 and younger, the disease may be considered an ambulatory care sensitive condition (ACSC) because timely and effective primary health care can usually prevent the onset of health complications and related hospitalizations.388 Higher rates of ACSC hospitalizations, including those related to COPD, may reflect barriers in accessing timely, appropriate and effective primary health care.389, 390
COPD is a leading cause of morbidity and mortality in Canada.391, 392 In addition, persons with COPD often have other comorbidities,393 which can increase the complexity of disease management and health care utilization.394 It has been estimated that approximately 80% of COPD deaths are related to smoking.395
Severe COPD exacerbations that require hospitalization represent a large burden on the Canadian health system and have an impact on health-related quality of life for persons with COPD.396 In 2012, there were approximately 40,300vi hospitalizations for COPD for persons age 74 and younger. The average cost per COPD hospitalization for persons age 74 and younger is estimated to be approximately $8,000, for a total cost of approximately $314,629,000 in 2012 (Canadian MIS Database, unpublished data). In Canada, persons with COPD had the highest number of readmissions compared with people with other medical conditions, such as arrhythmia, pneumonia and digestive-related conditions.397 In 2010–2011, approximately 1 in 5 persons of all ages with COPD (18.8%) were readmitted to an acute care facility within 30 days of the initial hospitalization.397
vi. Excludes hospitalization records missing postal code information (approximately 1.6% of all records).
In addition to significant health care utilization and related direct costs, severe COPD exacerbations have negative impacts on patient health outcomes, such as a further decline in lung function,398 decreased health-related quality of life399 and increased risk of morbidity and mortality.400
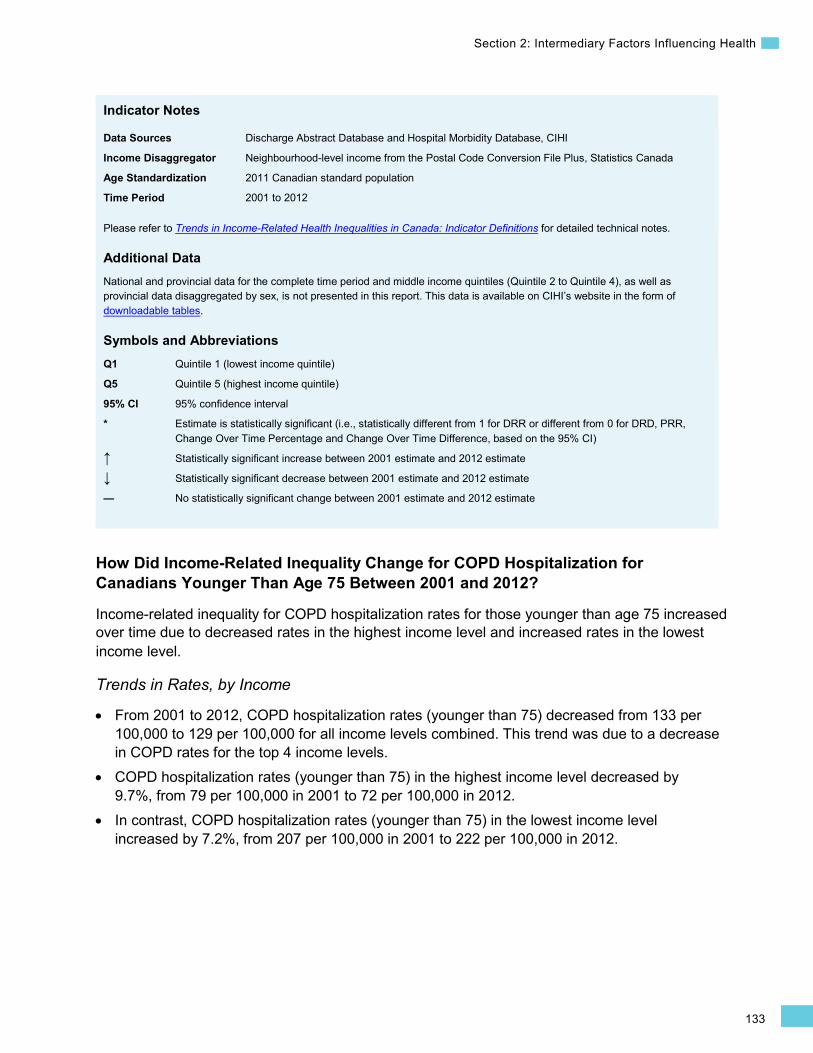
133
Section 2: Intermediary Factors Influencing Health
Indicator Notes
Data Sources Discharge Abstract Database and Hospital Morbidity Database, CIHI
Income Disaggregator Neighbourhood-level income from the Postal Code Conversion File Plus, Statistics Canada
Age Standardization 2011 Canadian standard population
Time Period 2001 to 2012
Please refer to Trends in Income-Related Health Inequalities in Canada: Indicator Definitions for detailed technical notes.
Additional Data National and provincial data for the complete time period and middle income quintiles (Quintile 2 to Quintile 4), as well as provincial data disaggregated by sex, is not presented in this report. This data is available on CIHI’s website in the form of downloadable tables.
Symbols and Abbreviations
* Estimate is statistically significant (i.e., statistically different from 1 for DRR or different from 0 for DRD, PRR, Change Over Time Percentage and Change Over Time Difference, based on the 95% CI)
Q1 Quintile 1 (lowest income quintile)
Q5 Quintile 5 (highest income quintile)
95% CI 95% confidence interval
↑ Statistically significant increase between 2001 estimate and 2012 estimate
↓ Statistically significant decrease between 2001 estimate and 2012 estimate
— No statistically significant change between 2001 estimate and 2012 estimate
How Did Income-Related Inequality Change for COPD Hospitalization for Canadians Younger Than Age 75 Between 2001 and 2012?
Income-related inequality for COPD hospitalization rates for those younger than age 75 increased over time due to decreased rates in the highest income level and increased rates in the lowest income level.
Trends in Rates, by Income
• From 2001 to 2012, COPD hospitalization rates (younger than 75) decreased from 133 per 100,000 to 129 per 100,000 for all income levels combined. This trend was due to a decrease in COPD rates for the top 4 income levels.
• COPD hospitalization rates (younger than 75) in the highest income level decreased by 9.7%, from 79 per 100,000 in 2001 to 72 per 100,000 in 2012.
• In contrast, COPD hospitalization rates (younger than 75) in the lowest income level increased by 7.2%, from 207 per 100,000 in 2001 to 222 per 100,000 in 2012.
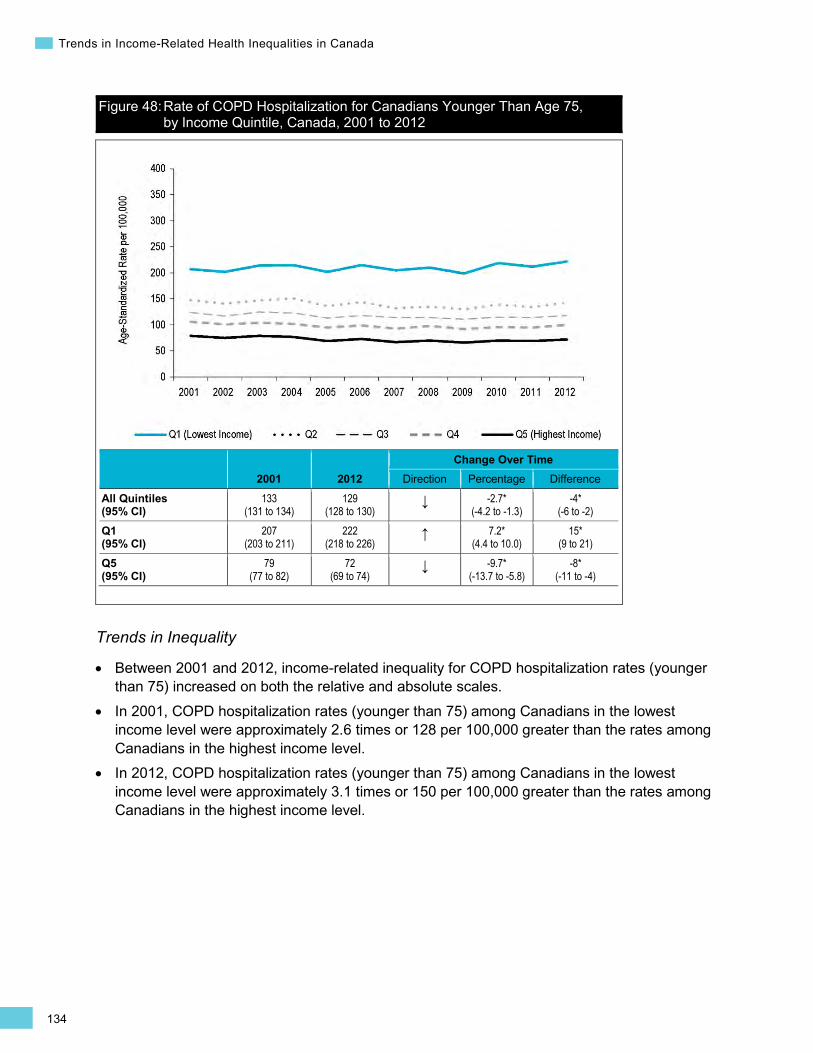
134
Trends in Income-Related Health Inequalities in Canada
Figure 48: Rate of COPD Hospitalization for Canadians Younger Than Age 75, by Income Quintile, Canada, 2001 to 2012
2001 2012 Change Over Time
Direction Percentage Difference
All Quintiles (95% CI)
133 (131 to 134)
129 (128 to 130)
↓ -2.7* (-4.2 to -1.3)
-4* (-6 to -2)
Q1 (95% CI)
207 (203 to 211)
222 (218 to 226)
↑ 7.2* (4.4 to 10.0)
15* (9 to 21)
Q5 (95% CI)
79 (77 to 82)
72 (69 to 74)
↓ -9.7* (-13.7 to -5.8)
-8* (-11 to -4)
Trends in Inequality
• Between 2001 and 2012, income-related inequality for COPD hospitalization rates (younger than 75) increased on both the relative and absolute scales.
• In 2001, COPD hospitalization rates (younger than 75) among Canadians in the lowest income level were approximately 2.6 times or 128 per 100,000 greater than the rates among Canadians in the highest income level.
• In 2012, COPD hospitalization rates (younger than 75) among Canadians in the lowest income level were approximately 3.1 times or 150 per 100,000 greater than the rates among Canadians in the highest income level.
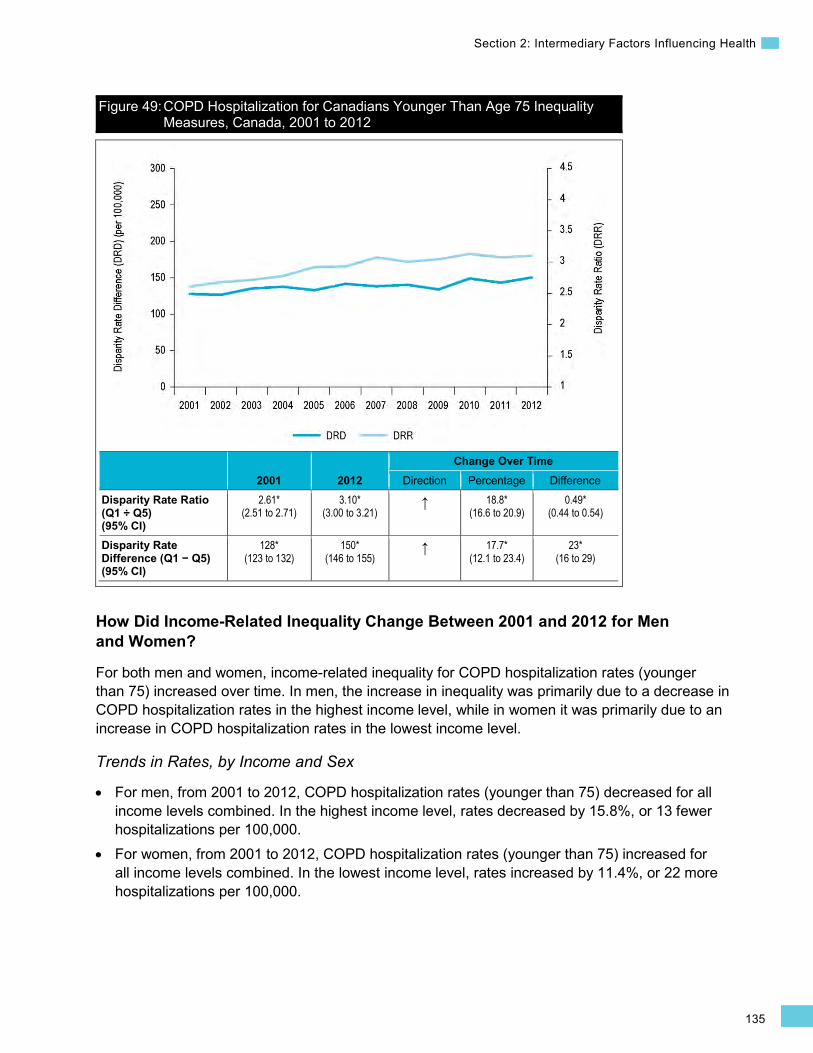
135
Section 2: Intermediary Factors Influencing Health
Figure 49: COPD Hospitalization for Canadians Younger Than Age 75 Inequality Measures, Canada, 2001 to 2012
2001 2012 Change Over Time
Direction Percentage Difference Disparity Rate Ratio (Q1 ÷ Q5) (95% CI)
2.61* (2.51 to 2.71)
3.10* (3.00 to 3.21)
↑ 18.8* (16.6 to 20.9)
0.49* (0.44 to 0.54)
Disparity Rate Difference (Q1 − Q5) (95% CI)
128* (123 to 132)
150* (146 to 155)
↑ 17.7* (12.1 to 23.4)
23* (16 to 29)
How Did Income-Related Inequality Change Between 2001 and 2012 for Men and Women?
For both men and women, income-related inequality for COPD hospitalization rates (younger than 75) increased over time. In men, the increase in inequality was primarily due to a decrease in COPD hospitalization rates in the highest income level, while in women it was primarily due to an increase in COPD hospitalization rates in the lowest income level.
Trends in Rates, by Income and Sex
• For men, from 2001 to 2012, COPD hospitalization rates (younger than 75) decreased for all income levels combined. In the highest income level, rates decreased by 15.8%, or 13 fewer hospitalizations per 100,000.
• For women, from 2001 to 2012, COPD hospitalization rates (younger than 75) increased for all income levels combined. In the lowest income level, rates increased by 11.4%, or 22 more hospitalizations per 100,000.
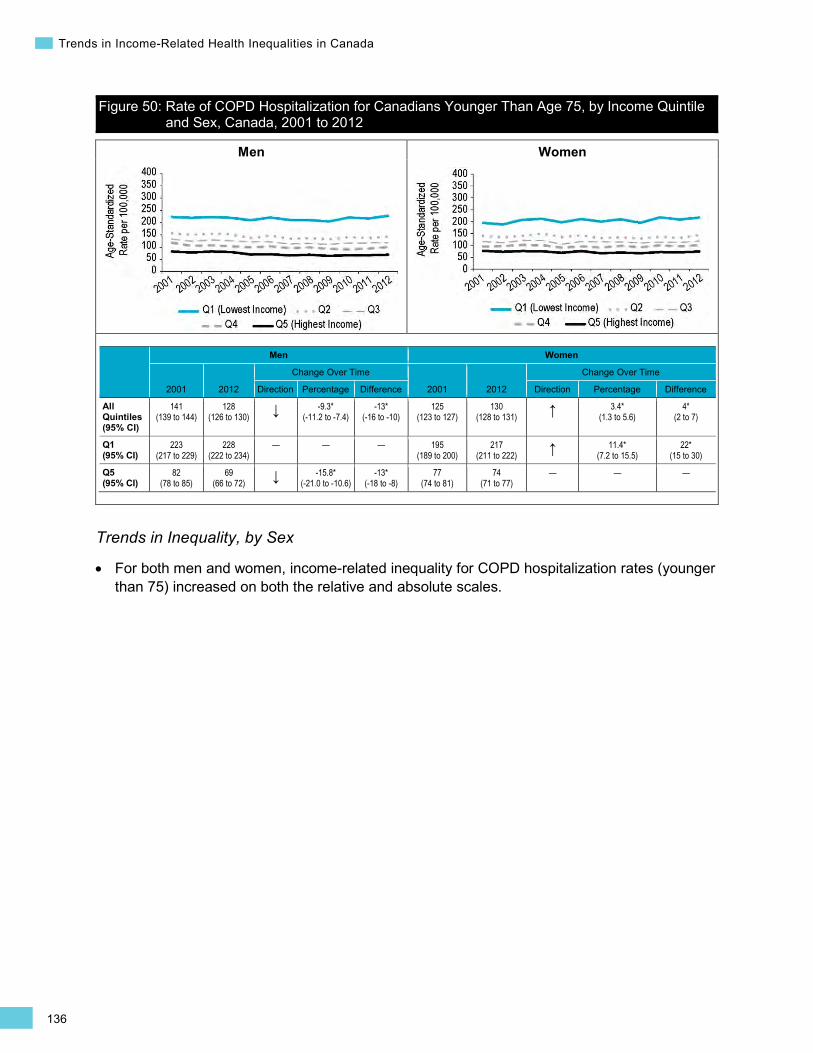
136
Trends in Income-Related Health Inequalities in Canada
Men Women
Figure 50: Rate of COPD Hospitalization for Canadians Younger Than Age 75, by Income Quintile and Sex, Canada, 2001 to 2012
Men Women
2001 2012
Change Over Time
2001 2012
Change Over Time
Direction Percentage Difference Direction Percentage Difference
All Quintiles (95% CI)
141 (139 to 144)
128 (126 to 130) ↓ -9.3*
(-11.2 to -7.4) -13*
(-16 to -10) 125
(123 to 127) 130
(128 to 131) ↑ 3.4* (1.3 to 5.6)
4* (2 to 7)
Q1 (95% CI)
223 (217 to 229)
228 (222 to 234)
— — — 195 (189 to 200)
217 (211 to 222) ↑ 11.4*
(7.2 to 15.5) 22*
(15 to 30)
Q5 (95% CI)
82 (78 to 85)
69 (66 to 72) ↓ -15.8*
(-21.0 to -10.6) -13*
(-18 to -8) 77
(74 to 81) 74
(71 to 77) — — —
Trends in Inequality, by Sex
For both men and women, income-related inequality for COPD hospitalization rates (younger than 75) increased on both the relative and absolute scales.
•

137
Section 2: Intermediary Factors Influencing Health
Men Women
Figure 51: COPD Hospitalization for Canadians Younger Than Age 75 Inequality Measures, by Sex, Canada, 2001 to 2012
Men Women
2001 2012
Change Over Time
2001 2012
Change Over Time
Direction Percentage Difference Direction Percentage Difference
Disparity Rate Ratio (Q1 ÷ Q5) (95% CI)
2.73* (2.59 to 2.88)
3.32* (3.16 to 3.48) ↑ 21.3*
(18.4 to 24.3) 0.58*
(0.51 to 0.66) 2.51*
(2.38 to 2.65) 2.91*
(2.78 to 3.06) ↑ 16.0* (12.9 to 19.2)
0.40* (0.33 to 0.47)
Disparity Rate Difference (Q1 − Q5) (95% CI)
142* (134 to 149)
159* (153 to 166) ↑ 12.6*
(5.2 to 19.9) 18*
(8 to 27) 117*
(111 to 124) 142*
(136 to 148) ↑ 21.6* (13.0 to 30.1)
25* (16 to 34)
Addressing Income-Related Inequality for COPD Hospitalization for Canadians Younger Than Age 75
These analyses suggest that there was an increase in income-related inequality for COPD Hospitalization for Canadians Younger Than Age 75 from 2001 to 2012. Rates of COPD hospitalizations were lowest among Canadians in the highest income level and increased along the income gradient; however, the difference between the lowest and second-lowest income levels was considerably larger than the differences between the higher income levels.
Inequality Impact Measures
In 2012, 45.3% or approximately 18,700 COPD hospitalizations could have been avoided among Canadians younger than 75 if Canadians in all income levels had experienced the same COPD hospitalization rate as Canadians in the highest income level.
•
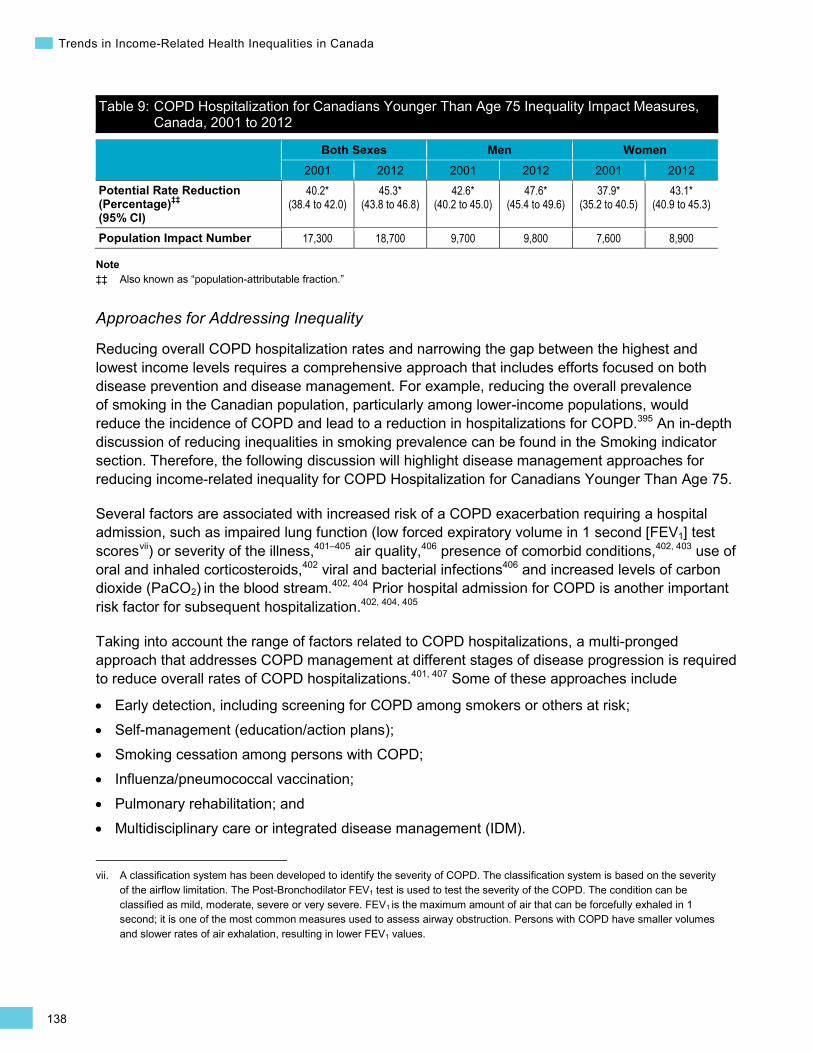
138
Trends in Income-Related Health Inequalities in Canada
Table 9: COPD Hospitalization for Canadians Younger Than Age 75 Inequality Impact Measures, Canada, 2001 to 2012
Both Sexes Men Women 2001 2012 2001 2012 2001 2012
Potential Rate Reduction (Percentage)‡‡ (95% CI)
40.2* (38.4 to 42.0)
45.3* (43.8 to 46.8)
42.6* (40.2 to 45.0)
47.6* (45.4 to 49.6)
37.9* (35.2 to 40.5)
43.1* (40.9 to 45.3)
Population Impact Number 17,300 18,700 9,700 9,800 7,600 8,900
Note ‡‡ Also known as “population-attributable fraction.”
Approaches for Addressing Inequality
Reducing overall COPD hospitalization rates and narrowing the gap between the highest and lowest income levels requires a comprehensive approach that includes efforts focused on both disease prevention and disease management. For example, reducing the overall prevalence of smoking in the Canadian population, particularly among lower-income populations, would reduce the incidence of COPD and lead to a reduction in hospitalizations for COPD.395 An in-depth discussion of reducing inequalities in smoking prevalence can be found in the Smoking indicator section. Therefore, the following discussion will highlight disease management approaches for reducing income-related inequality for COPD Hospitalization for Canadians Younger Than Age 75.
Several factors are associated with increased risk of a COPD exacerbation requiring a hospital admission, such as impaired lung function (low forced expiratory volume in 1 second [FEV1] test scoresvii ) or severity of the illness,401–405 air quality,406 presence of comorbid conditions,402, 403 use of oral and inhaled corticosteroids,402 viral and bacterial infections406 and increased levels of carbon dioxide (PaCO2) in the blood stream.402, 404 Prior hospital admission for COPD is another important risk factor for subsequent hospitalization.402, 404, 405
vii. A classification system has been developed to identify the severity of COPD. The classification system is based on the severity of the airflow limitation. The Post-Bronchodilator FEV1 test is used to test the severity of the COPD. The condition can be classified as mild, moderate, severe or very severe. FEV1 is the maximum amount of air that can be forcefully exhaled in 1 second; it is one of the most common measures used to assess airway obstruction. Persons with COPD have smaller volumes and slower rates of air exhalation, resulting in lower FEV1 values.
Taking into account the range of factors related to COPD hospitalizations, a multi-pronged approach that addresses COPD management at different stages of disease progression is required to reduce overall rates of COPD hospitalizations.401, 407 Some of these approaches include
• Early detection, including screening for COPD among smokers or others at risk; • Self-management (education/action plans); • Smoking cessation among persons with COPD; • Influenza/pneumococcal vaccination; • Pulmonary rehabilitation; and • Multidisciplinary care or integrated disease management (IDM).
139
Section 2: Intermediary Factors Influencing Health
(cont’d on next page)
In particular, IDM has been identified as an effective approach for treating individuals with COPD.408 A systematic review on IDM for COPD highlighted that IDM interventions can reduce both respiratory-related hospital admissions and the length of stay in hospital among COPD patients.408 The aim of IDM is to improve the quality of care for individuals with COPD. This is achieved by combining different components of care, such as self-management, and increased collaboration between different health care providers (nurse practitioners, general practitioners, respirologists, etc.).408 Implementing integrated care approaches that are accessible to COPD patients in lower-income neighbourhoods may be a way to address income-related inequalities for COPD hospitalizations (see Box 14 below).
In addition to adapting approaches such as IDM to improve access to care for all Canadians, other approaches might be considered for reducing the disproportionate COPD hospitalization rate among Canadians in lower income levels. In Canada, lower annual household income has been associated with cost-related non-adherence to prescription medications.409 A number of Canadian jurisdictions have attempted to address financial barriers to medication adherence by subsidizing medication costs or supplies required to manage chronic conditions, such as COPD, or smoking cessation drugs.389, 410–413
Box 14: COPD Integrated Pathway Project, Winnipeg Regional Health Authority, 2011 Issue: As shown in these analyses, income-related inequality increased for COPD hospitalizations from 2001 to 2012. Rates were consistently higher among individuals in the lower income level.
Intervention: In 2011, the COPD Integrated Care Pathway (ICP) project was piloted by the Seven Oaks–Inkster Community and Seven Oaks General Hospital to improve access and continuity of care for COPD patients in the northwest areas of Winnipeg, Manitoba.414–416 The focus of the COPD ICP project was primarily in the North End, where the average income level is generally lower than in other Winnipeg neighbourhoods.415, 417–423 The COPD ICP project represented a partnership between multiple organizations providing different levels of care, such as the Seven Oaks Health and Social Services Centre, a number of Winnipeg Regional Health Authority (WRHA) clinical programs and community programs in the northwest area of Winnipeg.414, 415 The goal of the project was to improve patient quality of life and reduce acute COPD-related exacerbations and hospital admissions.414 The project consisted of multiple interventions, such as smoking cessation, use of spirometry for diagnosis, influenza and pneumonia vaccines, education and self-management (how to manage the condition, action plans, proper medication use), referrals to specialist services (pulmonary rehabilitation, respirologist, WRHA home care oxygen program) and access to community supports.414 The collaborative approach was based on integrated care models that had been implemented in the United Kingdom and British Columbia.414
140
Trends in Income-Related Health Inequalities in Canada
Rationale/Evidence: The 6-month pilot program initially enrolled 157 patients, 124 of whom completed the program.414 The following outcomes (among others) were observed:414
• 20% of the smokers in the pilot program quit smoking by the end of the 6-month pilot. • There were improvements in disease management, including
– Increased recognition of exacerbation symptoms among patients; – Fewer flare-ups (from 41 to 5); – Fewer emergency department visits (from 9 to 5); – Fewer hospital admissions (from 3 to 0); and – Improved COPD function scores.
• Referrals to the pulmonary rehabilitation program increased 44.4%. • There was improved patient and primary care provider satisfaction.
An evaluation of cost savings for the COPD ICP project found that the hospital length of stay for 55 patients who were recruited for the program from emergency departments decreased by 7 days per admission.414 This translated to 385 patient days saved at approximately $1,000 per day. The estimated cost benefit from the reduced length of stay was $385,000.
How Did Income-Related Inequality for COPD Hospitalization for Canadians Younger Than Age 75 Change Between 2001 and 2012 by Province?
• Income-related inequality for COPD hospitalizations increased on both the relative and absolute scales in British Columbia, Alberta and Quebec; in Saskatchewan and Ontario, inequality persisted on the relative scale and increased on the absolute scale.
• Income-related inequality for COPD hospitalizations persisted on both the relative and absolute scales in all other provinces.
• From 2001 to 2012, COPD hospitalization rates increased in the lowest income level in British Columbia, Alberta, Saskatchewan, Manitoba, Ontario and Newfoundland and Labrador.
• The magnitude of inequality varied across provinces for COPD hospitalizations (younger than 75).
• In 2012, Nova Scotia and Newfoundland and Labrador had the lowest levels of relative inequality in COPD hospitalizations (younger than 75), with rate ratios of less than 2 and rate differences in the range of 100 more hospitalizations per 100,000.
• Manitoba, Saskatchewan and Alberta had high relative inequality, with rate ratios of 3.73, 3.07 and 3.15, respectively, and high absolute inequality, with rate differences of 211, 239 and 171 more hospitalizations per 100,000, respectively. Notably, British Columbia and Ontario also had high relative inequality, with rate ratios of 3.67 and 3.30, respectively, but much lower absolute inequality, with a rate difference ranging from 132 to 135 more hospitalizations per 100,000.
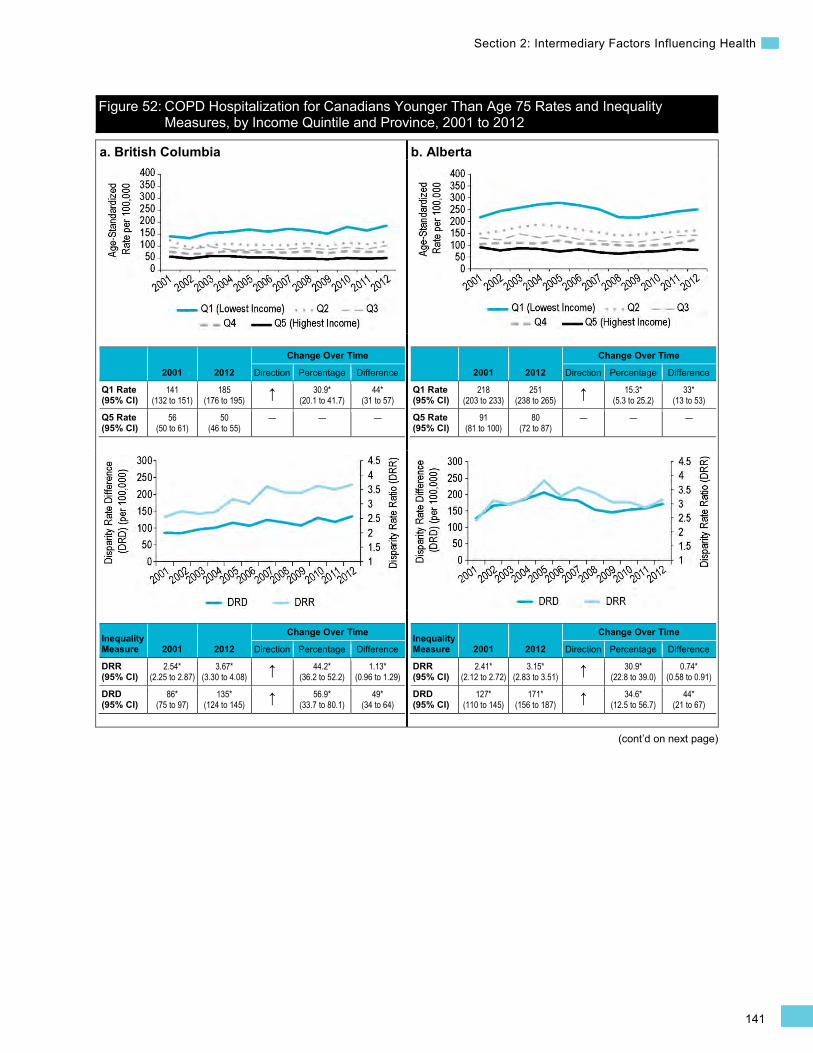
141
Section 2: Intermediary Factors Influencing Health
(cont’d on next page)
Figure 52: COPD Hospitalization for Canadians Younger Than Age 75 Rates and Inequality Measures, by Income Quintile and Province, 2001 to 2012
a. British Columbia
2001 2012
Change Over Time
Direction Percentage Difference
Q1 Rate (95% CI)
141 (132 to 151)
185 (176 to 195) ↑ 30.9*
(20.1 to 41.7) 44*
(31 to 57)
Q5 Rate (95% CI)
56 (50 to 61)
50 (46 to 55)
— — —
Inequality Measure 2001 2012
Change Over Time
Direction Percentage Difference
DRR (95% CI)
2.54* (2.25 to 2.87)
3.67* (3.30 to 4.08) ↑ 44.2*
(36.2 to 52.2) 1.13*
(0.96 to 1.29)
DRD (95% CI)
86* (75 to 97)
135* (124 to 145) ↑ 56.9*
(33.7 to 80.1) 49*
(34 to 64)
b. Alberta
2001 2012
Change Over Time
Direction Percentage Difference
Q1 Rate (95% CI)
218 (203 to 233)
251 (238 to 265) ↑ 15.3*
(5.3 to 25.2) 33*
(13 to 53)
Q5 Rate (95% CI)
91 (81 to 100)
80 (72 to 87)
— — —
Inequality Measure 2001 2012
Change Over Time
Direction Percentage Difference
DRR (95% CI)
2.41* (2.12 to 2.72)
3.15* (2.83 to 3.51) ↑ 30.9*
(22.8 to 39.0) 0.74*
(0.58 to 0.91)
DRD (95% CI)
127* (110 to 145)
171* (156 to 187) ↑ 34.6*
(12.5 to 56.7) 44*
(21 to 67)
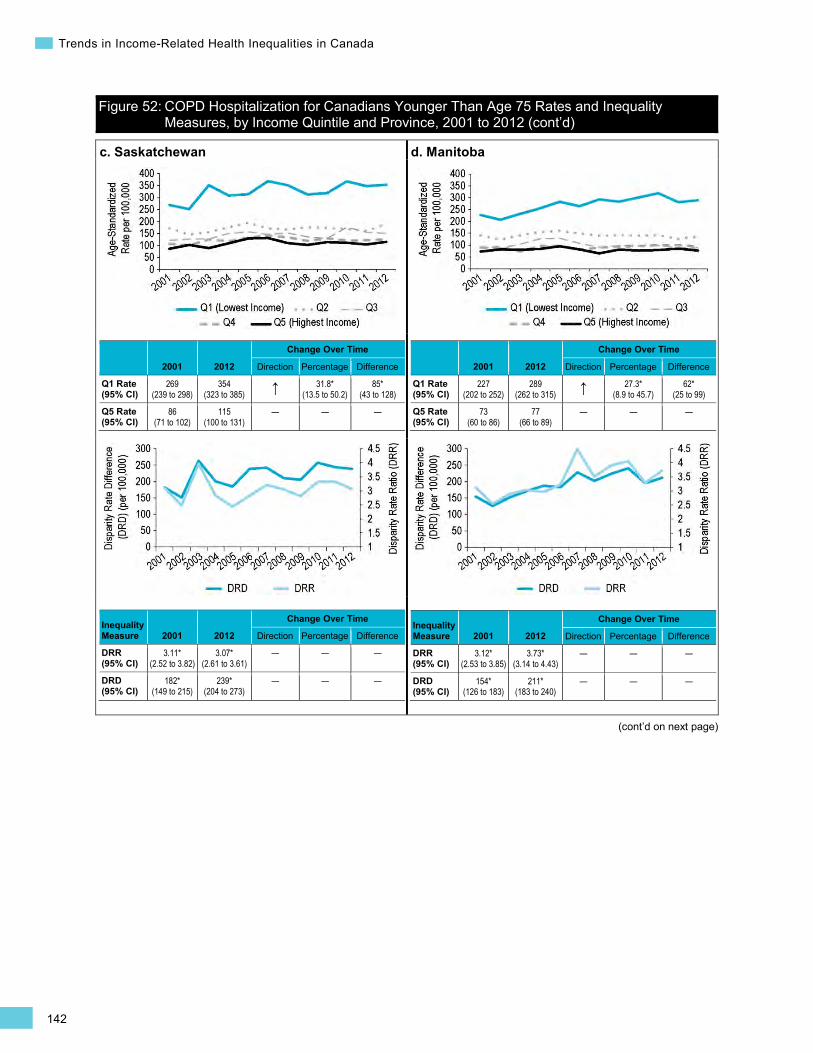
142
Trends in Income-Related Health Inequalities in Canada
Figure 52: COPD Hospitalization for Canadians Younger Than Age 75 Rates and Inequality Measures, by Income Quintile and Province, 2001 to 2012 (cont’d)
(cont’d on next page)
c. Saskatchewan
2001 2012
Change Over Time
Direction Percentage Difference
Q1 Rate (95% CI)
269 (239 to 298)
354 (323 to 385) ↑ 31.8*
(13.5 to 50.2) 85*
(43 to 128)
Q5 Rate (95% CI)
86 (71 to 102)
115 (100 to 131)
— — —
Inequality Measure 2001 2012
Change Over Time
Direction Percentage Difference
DRR (95% CI)
3.11* (2.52 to 3.82)
3.07* (2.61 to 3.61)
— — —
DRD (95% CI)
182* (149 to 215)
239* (204 to 273)
— — —
d. Manitoba
2001 2012
Change Over Time
Direction Percentage Difference
Q1 Rate (95% CI)
227 (202 to 252)
289 (262 to 315) ↑ 27.3*
(8.9 to 45.7) 62*
(25 to 99)
Q5 Rate (95% CI)
73 (60 to 86)
77 (66 to 89)
— — —
Inequality Measure 2001 2012
Change Over Time
Direction Percentage Difference
DRR (95% CI)
3.12* (2.53 to 3.85)
3.73* (3.14 to 4.43)
— — —
DRD (95% CI)
154* (126 to 183)
211* (183 to 240)
— — —
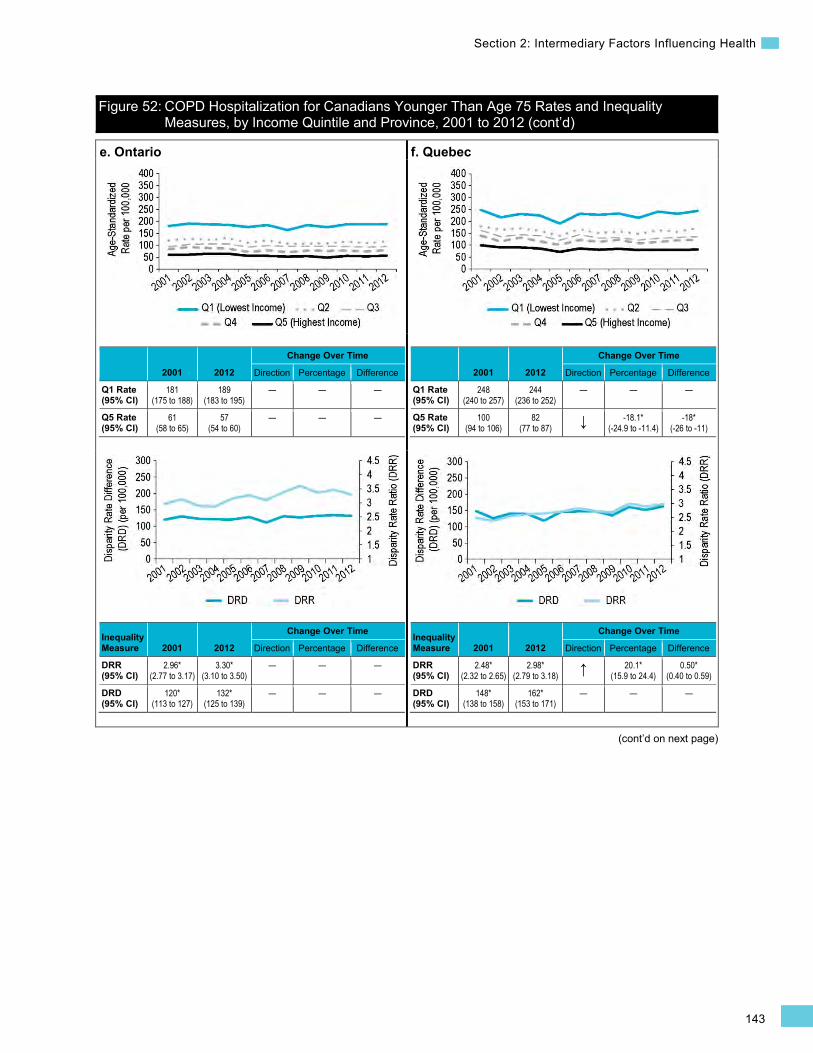
143
Section 2: Intermediary Factors Influencing Health
Figure 52: COPD Hospitalization for Canadians Younger Than Age 75 Rates and Inequality Measures, by Income Quintile and Province, 2001 to 2012 (cont’d)
(cont’d on next page)
e. Ontario
2001 2012
Change Over Time
Direction Percentage Difference
Q1 Rate (95% CI)
181 (175 to 188)
189 (183 to 195)
— — —
Q5 Rate (95% CI)
61 (58 to 65)
57 (54 to 60)
— — —
Inequality Measure 2001 2012
Change Over Time
Direction Percentage Difference
DRR (95% CI)
2.96* (2.77 to 3.17)
3.30* (3.10 to 3.50)
— — —
DRD (95% CI)
120* (113 to 127)
132* (125 to 139)
— — —
f. Quebec
2001 2012
Change Over Time
Direction Percentage Difference
Q1 Rate (95% CI)
248 (240 to 257)
244 (236 to 252)
— — —
Q5 Rate (95% CI)
100 (94 to 106)
82 (77 to 87) ↓ -18.1*
(-24.9 to -11.4) -18*
(-26 to -11)
Inequality Measure 2001 2012
Change Over Time
Direction Percentage Difference
DRR (95% CI)
2.48* (2.32 to 2.65)
2.98* (2.79 to 3.18) ↑ 20.1*
(15.9 to 24.4) 0.50*
(0.40 to 0.59)
DRD (95% CI)
148* (138 to 158)
162* (153 to 171)
— — —
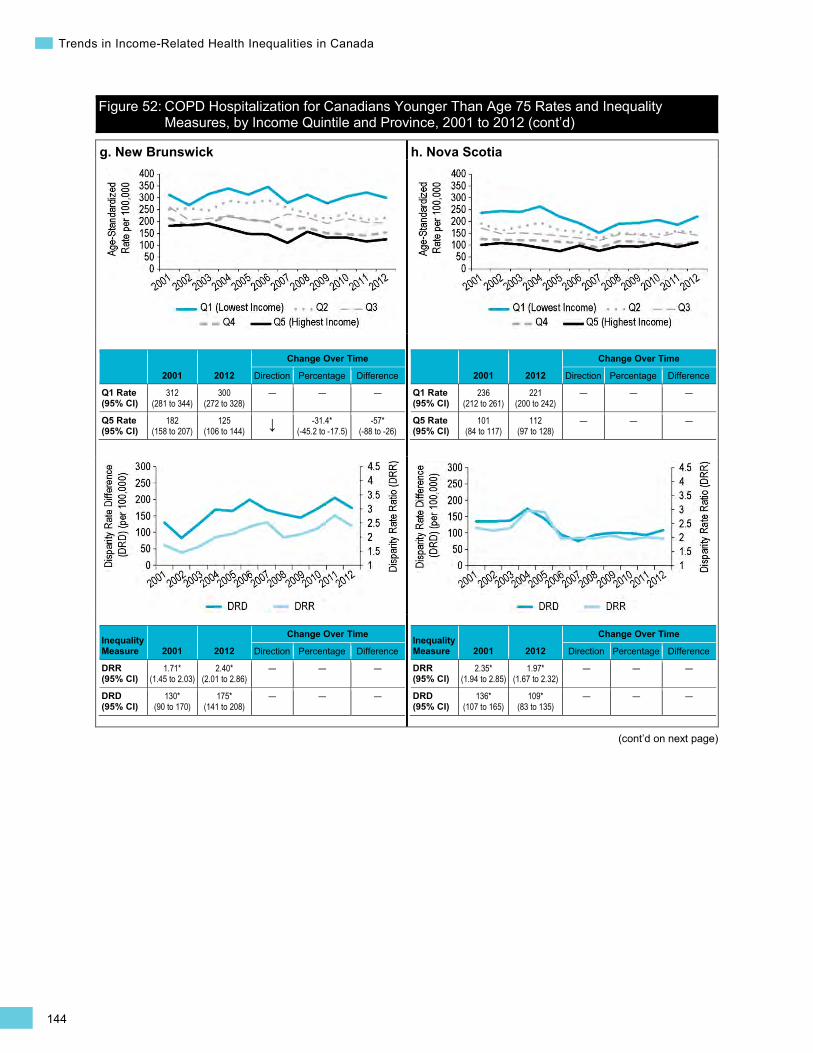
144
Trends in Income-Related Health Inequalities in Canada
Figure 52: COPD Hospitalization for Canadians Younger Than Age 75 Rates and Inequality Measures, by Income Quintile and Province, 2001 to 2012 (cont’d)
(cont’d on next page)
g. New Brunswick
2001 2012
Change Over Time
Direction Percentage Difference
Q1 Rate (95% CI)
312 (281 to 344)
300 (272 to 328)
— — —
Q5 Rate (95% CI)
182 (158 to 207)
125 (106 to 144) ↓ -31.4*
(-45.2 to -17.5) -57*
(-88 to -26)
Inequality Measure 2001 2012
Change Over Time
Direction Percentage Difference
DRR (95% CI)
1.71* (1.45 to 2.03)
2.40* (2.01 to 2.86)
— — —
DRD (95% CI)
130* (90 to 170)
175* (141 to 208)
— — —
h. Nova Scotia
2001 2012
Change Over Time
Direction Percentage Difference
Q1 Rate (95% CI)
236 (212 to 261)
221 (200 to 242)
— — —
Q5 Rate (95% CI)
101 (84 to 117)
112 (97 to 128)
— — —
Inequality Measure 2001 2012
Change Over Time
Direction Percentage Difference
DRR (95% CI)
2.35* (1.94 to 2.85)
1.97* (1.67 to 2.32)
— — —
DRD (95% CI)
136* (107 to 165)
109* (83 to 135)
— — —
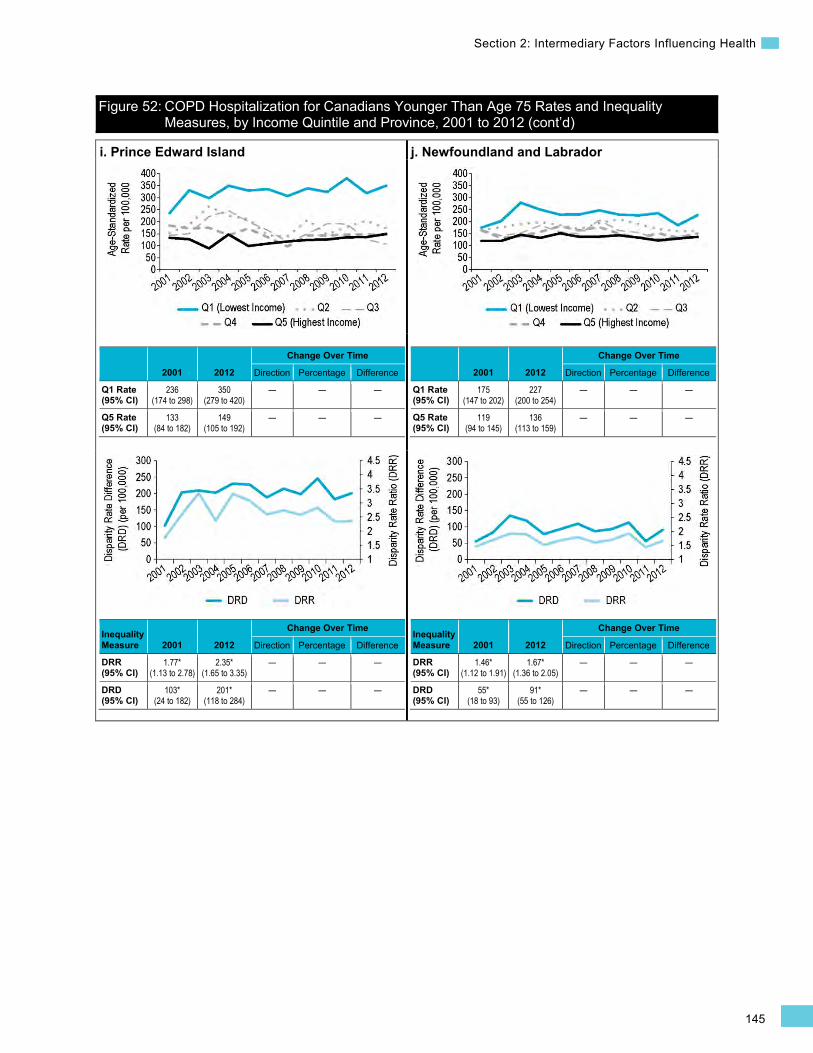
145
Section 2: Intermediary Factors Influencing Health
Figure 52: COPD Hospitalization for Canadians Younger Than Age 75 Rates and Inequality Measures, by Income Quintile and Province, 2001 to 2012 (cont’d)
i. Prince Edward Island
2001 2012
Change Over Time
Direction Percentage Difference
Q1 Rate (95% CI)
236 (174 to 298)
350 (279 to 420)
— — —
Q5 Rate (95% CI)
133 (84 to 182)
149 (105 to 192)
— — —
Inequality Measure 2001 2012
Change Over Time
Direction Percentage Difference
DRR (95% CI)
1.77* (1.13 to 2.78)
2.35* (1.65 to 3.35)
— — —
DRD (95% CI)
103* (24 to 182)
201* (118 to 284)
— — —
j. Newfoundland and Labrador
2001 2012
Change Over Time
Direction Percentage Difference
Q1 Rate (95% CI)
175 (147 to 202)
227 (200 to 254)
— — —
Q5 Rate (95% CI)
119 (94 to 145)
136 (113 to 159)
— — —
Inequality Measure 2001 2012
Change Over Time
Direction Percentage Difference
DRR (95% CI)
1.46* (1.12 to 1.91)
1.67* (1.36 to 2.05)
— — —
DRD (95% CI)
55* (18 to 93)
91* (55 to 126)
— — —
146
Trends in Income-Related Health Inequalities in Canada
Section 3: Health and Well-Being Outcomes As a result of their socio-economic position, Canadians may vary in their exposure to intermediary factors influencing health, as well as in their ability to adapt to or cope with these exposures.29 In the previous section, income-related inequality trends were examined for a selection of intermediary factors influencing health, including material, early life, behavioural and health system factors. These trends are important to monitor because they ultimately contribute to inequalities in health and well-being outcomes.
This section of the report examines a variety of health and well-being outcome indicators by income level over time. These indicators are organized into 4 broad categories:
• Injury indicators: Fall Injury Hospitalization for Seniors, Motor Vehicle Traffic Injury Hospitalization • Chronic disease indicators: Mental Illness Hospitalization, Alcohol-Attributable
Hospitalization, Hospitalized Heart Attacks, Diabetes • Well-being indicator: Self-Rated Mental Health • Mortality indicator: Infant Mortality
Injury Indicators Fall Injury Hospitalization for Seniors Background
The Fall Injury Hospitalization for Seniors indicator captures inpatient treatment at general hospitals for fall-related injuries. This indicator is calculated for individuals age 65 and older and is expressed as a separation rate (including discharges, deaths, sign-outs and transfers) per 100,000 Canadians per year.
Falls are a leading cause of injury hospitalization among seniors in Canada424 and are a major risk factor for seniors transitioning to a continuing care facility.424–426 Approximately 15% of seniors who experience fall injury hospitalizations are subsequently transferred to a continuing care facility, and another 8% die while in hospital.426 Among seniors, fall-related injuries also lead to longer hospital stays than the average length of stay for any cause, contributing a higher burden of health care costs.427 In 2010–2011, the most recent fiscal year for which data is available, seniors spent an average of 12 days in hospital for any cause, but an average of 21 days for fall-related injuries in particular.427
In 2012, there were approximately 92,000viii hospitalizations for a fall injury among seniors. The average cost per hospitalization for a fall injury among seniors is estimated to be approximately $14,800, for a total cost of approximately $1,360,976,000 in 2012 (Canadian MIS Database, unpublished data). However, the direct costs associated with fall injuries among seniors extend beyond the costs of hospitalization only and include, among others, the costs of rehabilitation, pharmaceuticals, nursing or home care, and terminal care. In 2004, the direct cost of treating falls among seniors in Canada was estimated to be more than $2 billion per year.428
viii. Excludes hospitalization records missing postal code information (approximately 1.4% of all records).
147
Section 3: Health and Well-Being Outcomes
A number of factors contribute to an increased risk for falls for seniors, such as balance or visual impairment, poor housing conditions (e.g., home hazards) and nutrition, medications and a history of falls.426, 429–432 In addition, in 2008–2009, individuals with lower income levels were found to be at increased risk for fall injury hospitalizations than those at the highest income level.433 Income can influence various factors such as availability of social supports, quality of housing and nutrition, and access to services and assistive devices.434, 435
Indicator Notes Data Sources Discharge Abstract Database and Hospital Morbidity Database, CIHI
Income Disaggregator Neighbourhood-level income from the Postal Code Conversion File Plus, Statistics Canada
Age Standardization 2011 Canadian standard population
Time Period 2001 to 2012
Please refer to Trends in Income-Related Health Inequalities in Canada: Indicator Definitions for detailed technical notes.
Additional Data National and provincial data for the complete time period and middle income quintiles (Quintile 2 to Quintile 4), as well as provincial data disaggregated by sex, is not presented in this report. This data is available on CIHI’s website in the form of downloadable tables.
Symbols and Abbreviations
* Estimate is statistically significant (i.e., statistically different from 1 for DRR or different from 0 for DRD, PRR, Change Over Time Percentage and Change Over Time Difference, based on the 95% CI)
Q1 Quintile 1 (lowest income quintile)
Q5 Quintile 5 (highest income quintile)
95% CI 95% confidence interval
§ Percentage change not calculated since DRD estimate approached 0 in 2001
** Direction of inequality reversed between 2001 and 2012 and income-related inequality changed such that rates decreased among those in the highest income level compared with those in the lowest income level
↑ Statistically significant increase between 2001 estimate and 2012 estimate
↓ Statistically significant decrease between 2001 estimate and 2012 estimate
— No statistically significant change between 2001 estimate and 2012 estimate
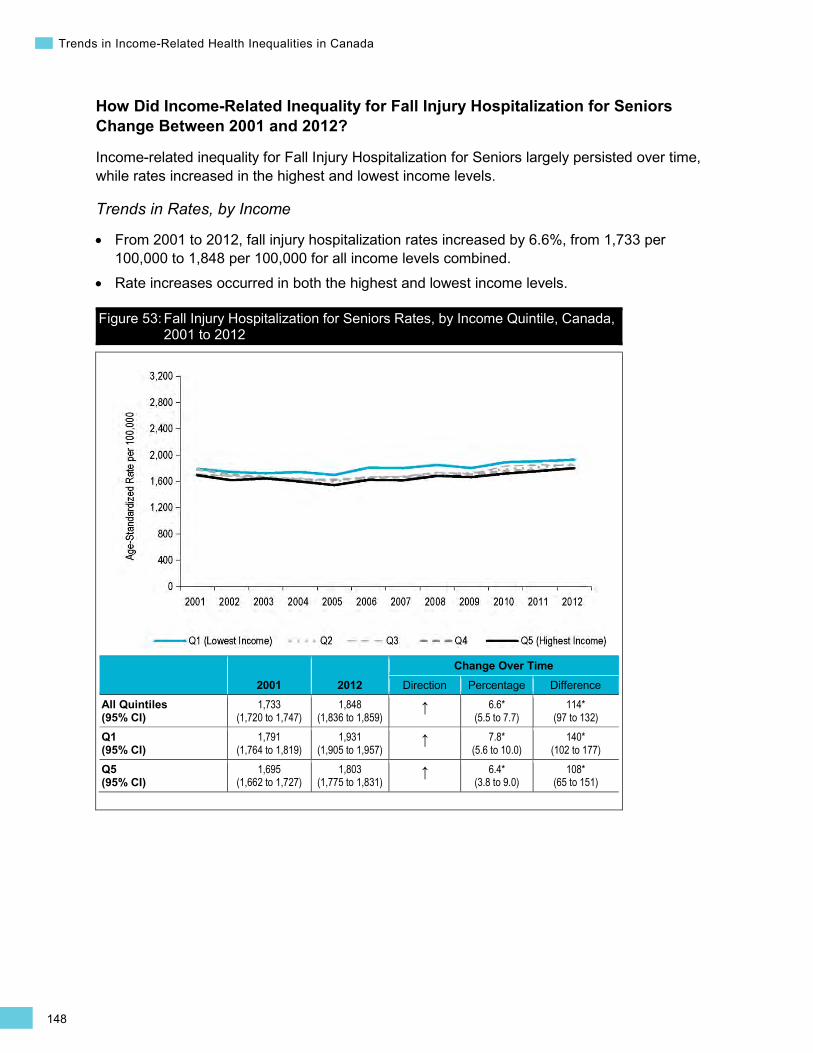
148
Trends in Income-Related Health Inequalities in Canada
How Did Income-Related Inequality for Fall Injury Hospitalization for Seniors Change Between 2001 and 2012?
Income-related inequality for Fall Injury Hospitalization for Seniors largely persisted over time, while rates increased in the highest and lowest income levels.
Trends in Rates, by Income
• From 2001 to 2012, fall injury hospitalization rates increased by 6.6%, from 1,733 per 100,000 to 1,848 per 100,000 for all income levels combined.
• Rate increases occurred in both the highest and lowest income levels.
Figure 53: Fall Injury Hospitalization for Seniors Rates, by Income Quintile, Canada, 2001 to 2012
2001 2012 Change Over Time
Direction Percentage Difference All Quintiles (95% CI)
1,733 (1,720 to 1,747)
1,848 (1,836 to 1,859)
↑ 6.6* (5.5 to 7.7)
114* (97 to 132)
Q1 (95% CI)
1,791 (1,764 to 1,819)
1,931 (1,905 to 1,957)
↑ 7.8* (5.6 to 10.0)
140* (102 to 177)
Q5 (95% CI)
1,695 (1,662 to 1,727)
1,803 (1,775 to 1,831)
↑ 6.4* (3.8 to 9.0)
108* (65 to 151)
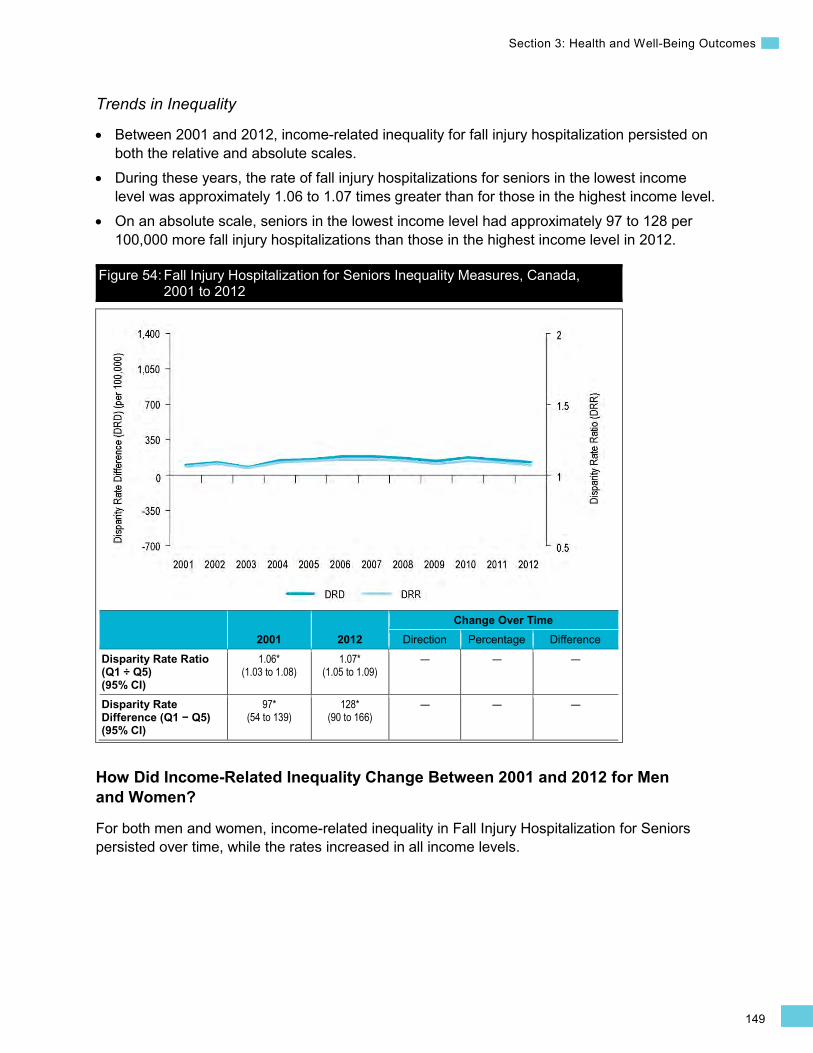
149
Section 3: Health and Well-Being Outcomes
Trends in Inequality
• Between 2001 and 2012, income-related inequality for fall injury hospitalization persisted on both the relative and absolute scales.
• During these years, the rate of fall injury hospitalizations for seniors in the lowest income level was approximately 1.06 to 1.07 times greater than for those in the highest income level.
• On an absolute scale, seniors in the lowest income level had approximately 97 to 128 per 100,000 more fall injury hospitalizations than those in the highest income level in 2012.
Figure 54: Fall Injury Hospitalization for Seniors Inequality Measures, Canada, 2001 to 2012
2001 2012 Change Over Time
Direction Percentage Difference
Disparity Rate Ratio (Q1 ÷ Q5) (95% CI)
1.06* (1.03 to 1.08)
1.07* (1.05 to 1.09)
— — —
Disparity Rate Difference (Q1 − Q5) (95% CI)
97* (54 to 139)
128* (90 to 166)
— — —
How Did Income-Related Inequality Change Between 2001 and 2012 for Men and Women?
For both men and women, income-related inequality in Fall Injury Hospitalization for Seniors persisted over time, while the rates increased in all income levels.
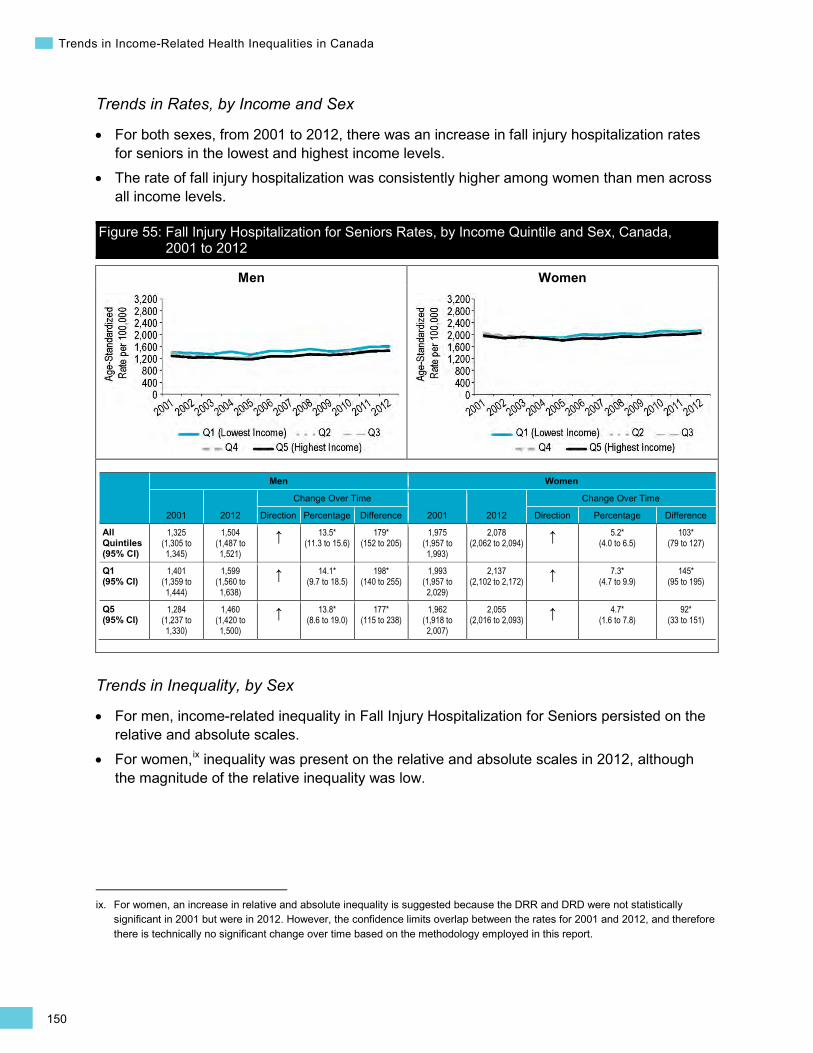
150
Trends in Income-Related Health Inequalities in Canada
Men Women
Trends in Rates, by Income and Sex
• For both sexes, from 2001 to 2012, there was an increase in fall injury hospitalization rates for seniors in the lowest and highest income levels.
• The rate of fall injury hospitalization was consistently higher among women than men across all income levels.
Figure 55: Fall Injury Hospitalization for Seniors Rates, by Income Quintile and Sex, Canada, 2001 to 2012
Men Women
2001 2012
Change Over Time
2001 2012
Change Over Time
Direction Percentage Difference Direction Percentage Difference
All Quintiles (95% CI)
1,325 (1,305 to 1,345)
1,504 (1,487 to 1,521)
↑ 13.5* (11.3 to 15.6)
179* (152 to 205)
1,975 (1,957 to 1,993)
2,078 (2,062 to 2,094) ↑ 5.2*
(4.0 to 6.5) 103*
(79 to 127)
Q1 (95% CI)
1,401 (1,359 to 1,444)
1,599 (1,560 to 1,638)
↑ 14.1* (9.7 to 18.5)
198* (140 to 255)
1,993 (1,957 to 2,029)
2,137 (2,102 to 2,172) ↑ 7.3*
(4.7 to 9.9) 145*
(95 to 195)
Q5 (95% CI)
1,284 (1,237 to 1,330)
1,460 (1,420 to 1,500)
↑ 13.8* (8.6 to 19.0)
177* (115 to 238)
1,962 (1,918 to 2,007)
2,055 (2,016 to 2,093) ↑ 4.7*
(1.6 to 7.8) 92*
(33 to 151)
Trends in Inequality, by Sex
• For men, income-related inequality in Fall Injury Hospitalization for Seniors persisted on the relative and absolute scales.
• For women,ix inequality was present on the relative and absolute scales in 2012, although the magnitude of the relative inequality was low.
ix. For women, an increase in relative and absolute inequality is suggested because the DRR and DRD were not statistically significant in 2001 but were in 2012. However, the confidence limits overlap between the rates for 2001 and 2012, and therefore there is technically no significant change over time based on the methodology employed in this report.
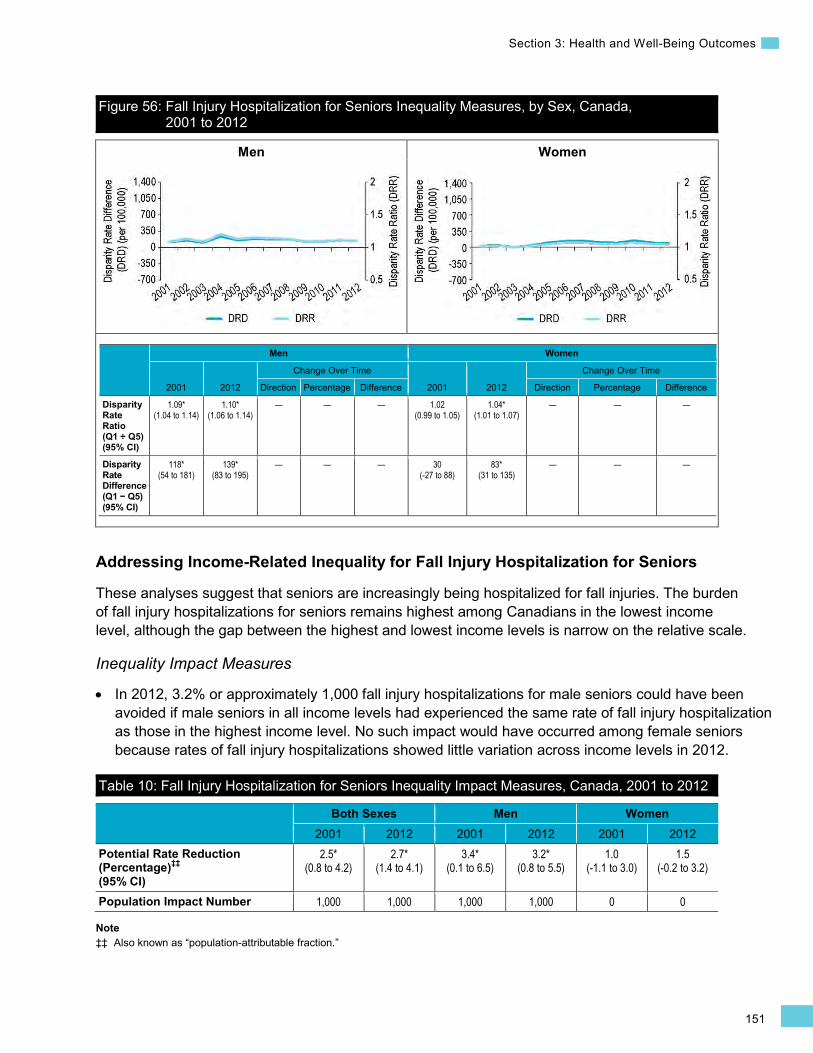
151
Section 3: Health and Well-Being Outcomes
•
Men Women
Figure 56: Fall Injury Hospitalization for Seniors Inequality Measures, by Sex, Canada, 2001 to 2012
Men Women
2001 2012
Change Over Time
2001 2012
Change Over Time
Direction Percentage Difference Direction Percentage Difference
Disparity Rate Ratio (Q1 ÷ Q5) (95% CI)
1.09* (1.04 to 1.14)
1.10* (1.06 to 1.14)
— — — 1.02 (0.99 to 1.05)
1.04* (1.01 to 1.07)
— — —
Disparity Rate Difference (Q1 − Q5) (95% CI)
118* (54 to 181)
139* (83 to 195)
— — — 30 (-27 to 88)
83* (31 to 135)
— — —
Addressing Income-Related Inequality for Fall Injury Hospitalization for Seniors
These analyses suggest that seniors are increasingly being hospitalized for fall injuries. The burden of fall injury hospitalizations for seniors remains highest among Canadians in the lowest income level, although the gap between the highest and lowest income levels is narrow on the relative scale.
Inequality Impact Measures
In 2012, 3.2% or approximately 1,000 fall injury hospitalizations for male seniors could have been avoided if male seniors in all income levels had experienced the same rate of fall injury hospitalization as those in the highest income level. No such impact would have occurred among female seniors because rates of fall injury hospitalizations showed little variation across income levels in 2012.
Table 10: Fall Injury Hospitalization for Seniors Inequality Impact Measures, Canada, 2001 to 2012
Both Sexes Men Women 2001 2012 2001 2012 2001 2012
Potential Rate Reduction (Percentage)‡‡ (95% CI)
2.5* (0.8 to 4.2)
2.7* (1.4 to 4.1)
3.4* (0.1 to 6.5)
3.2* (0.8 to 5.5)
1.0 (-1.1 to 3.0)
1.5 (-0.2 to 3.2)
Population Impact Number 1,000 1,000 1,000 1,000 0 0
Note ‡‡ Also known as “population-attributable fraction.”
152
Trends in Income-Related Health Inequalities in Canada
Approaches for Addressing Inequality
Overall, there was minimal relative inequality over time across Canada in the Fall Injury Hospitalization for Seniors indicator. This may reflect the declining prevalence of low income among seniors over the past 20 years.436 Direct income supplements through Old Age Security (OAS), Guaranteed Income Supplement (GIS), the Canada Pension Plan (CPP) and the Quebec Pension Plan (QPP) have had significant success in reducing poverty among seniors and income inequality.131, 132 Compared with other countries in the Organisation for Economic Co-operation and Development, Canada has one of the lowest rates of senior poverty. From the 1970s to the mid-1990s, poverty levels among seniors declined; however, in the mid-1990s, poverty rates among Canadian seniors began to increase. It has been argued that this increase may stem from fiscal restraints related to sustaining public pension systems for a growing aging population.437, 438
The Canadian Best Practices Guide for Prevention of Falls Among Seniors Living in the Community439 identifies 6 intervention types as effective approaches for reducing falls among seniors: exercise, environmental modification, education, medication, and clinical and health promotion interventions. However, there is limited evidence of interventions that are known to address socio-economic disparities in falls and, more generally, the social determinants of injury.440, 441
Given that the home is the most frequently reported place for the occurrence of falls,424, 426 providing low- or no-cost safety equipment in the home setting, such as handrails and grab bars, is a key approach for preventing injuries.440 Several programs have been implemented in jurisdictions across Canada that can help reduce the likelihood of seniors suffering fall-related injuries in their homes, such as the Home Adaptations for Seniors’ Independence (HASI) program offered across Canada by the Canada Mortgage and Housing Corporation (CMHC)442 and Strategies and Actions for Independent Living (SAIL)443 offered by the British Columbia Ministry of Health. The HASI program is highlighted in Box 15.

153
Section 3: Health and Well-Being Outcomes
Box 15: Home Adaptations for Seniors’ Independence, 1992 to Present Issue: Risk factor such as poor vision or balance, inadequate nutrition, home hazards, medications and a history of falls can contribute to the likelihood of experiencing a fall.426, 429–432 Seniors with an annual household income of less than $15,000 are more likely to be injured from a fall than the senior population as a whole.434
Intervention: The CMHC’s HASI program provides forgivable loans to low-income seniors (65 and older) to support their ability to remain in their home and out of institutionalized care. Through these provincially or territorially run programs, HASI provides up to $3,500 for minor falls-preventing home renovations (e.g., handrails, grab bars in the bathroom, lever handles on doors).442 Between 2003 and 2008, the latest years for which data is available, approximately $35 million worth of funding went into the HASI program and more than 12,000 households benefitted from the program.442
Rationale/Evidence: Research has indicated that reducing household environmental risk factors is effective in reducing falls among an older population with a history of falls and mobility difficulties.444 CMHC evaluated HASI in 2009 and found that the program is well-targeted toward low-income seniors with mobility issues.442 As part of the evaluation, professional occupational therapists also assessed the homes of HASI recipients, and more than 95% agreed that the home modifications had improved the ability of clients to conduct daily activities.442 Approximately 60% of HASI clients made modifications to their bathrooms, while approximately 24% made changes to living areas, such as installing railings and grab bars.442 Beyond the practical benefits of installing falls-preventing equipment in the homes of seniors, these home adaptations support seniors’ independence445 and self-confidence446 and may help to decrease the likelihood of seniors restricting activities out of a fear of falling.447, 448
How Did Income-Related Inequality for Fall Injury Hospitalization for Seniors Change Between 2001 and 2012 by Province?
• From 2001 to 2012, income-related inequality for Fall Injury Hospitalization for Seniors varied across the provinces.
• In British Columbia and Saskatchewan, income-related inequality increased on both the relative and absolute scales. In contrast, income-related inequality decreased in Ontario on both the relative and absolute scales.
• In Newfoundland and Labrador, there was a reversal in the inequality gap on both the relative and absolute scales between 2001 and 2012, with those in the highest income level experiencing more fall injury hospitalizations than those in the lowest income level.
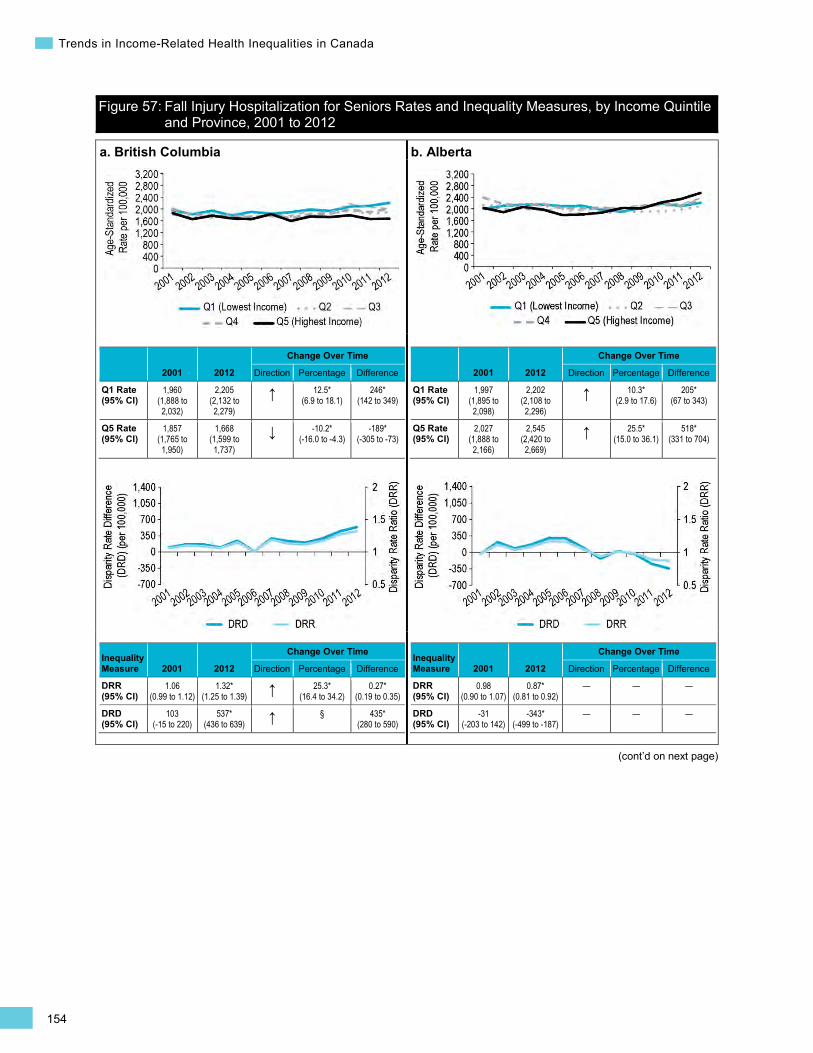
154
Trends in Income-Related Health Inequalities in Canada
(cont’d on next page)
Figure 57: Fall Injury Hospitalization for Seniors Rates and Inequality Measures, by Income Quintile and Province, 2001 to 2012
a. British Columbia
2001 2012
Change Over Time
Direction Percentage Difference
Q1 Rate (95% CI)
1,960 (1,888 to 2,032)
2,205 (2,132 to 2,279)
↑ 12.5* (6.9 to 18.1)
246* (142 to 349)
Q5 Rate (95% CI)
1,857 (1,765 to 1,950)
1,668 (1,599 to 1,737)
↓ -10.2* (-16.0 to -4.3)
-189* (-305 to -73)
Inequality Measure 2001 2012
Change Over Time
Direction Percentage Difference
DRR (95% CI)
1.06 (0.99 to 1.12)
1.32* (1.25 to 1.39) ↑ 25.3*
(16.4 to 34.2) 0.27*
(0.19 to 0.35)
DRD (95% CI)
103 (-15 to 220)
537* (436 to 639) ↑ § 435*
(280 to 590)
b. Alberta
2001 2012
Change Over Time
Direction Percentage Difference
Q1 Rate (95% CI)
1,997 (1,895 to 2,098)
2,202 (2,108 to 2,296)
↑ 10.3* (2.9 to 17.6)
205* (67 to 343)
Q5 Rate (95% CI)
2,027 (1,888 to 2,166)
2,545 (2,420 to 2,669)
↑ 25.5* (15.0 to 36.1)
518* (331 to 704)
Inequality Measure 2001 2012
Change Over Time
Direction Percentage Difference
DRR (95% CI)
0.98 (0.90 to 1.07)
0.87* (0.81 to 0.92)
— — —
DRD (95% CI)
-31 (-203 to 142)
-343* (-499 to -187)
— — —
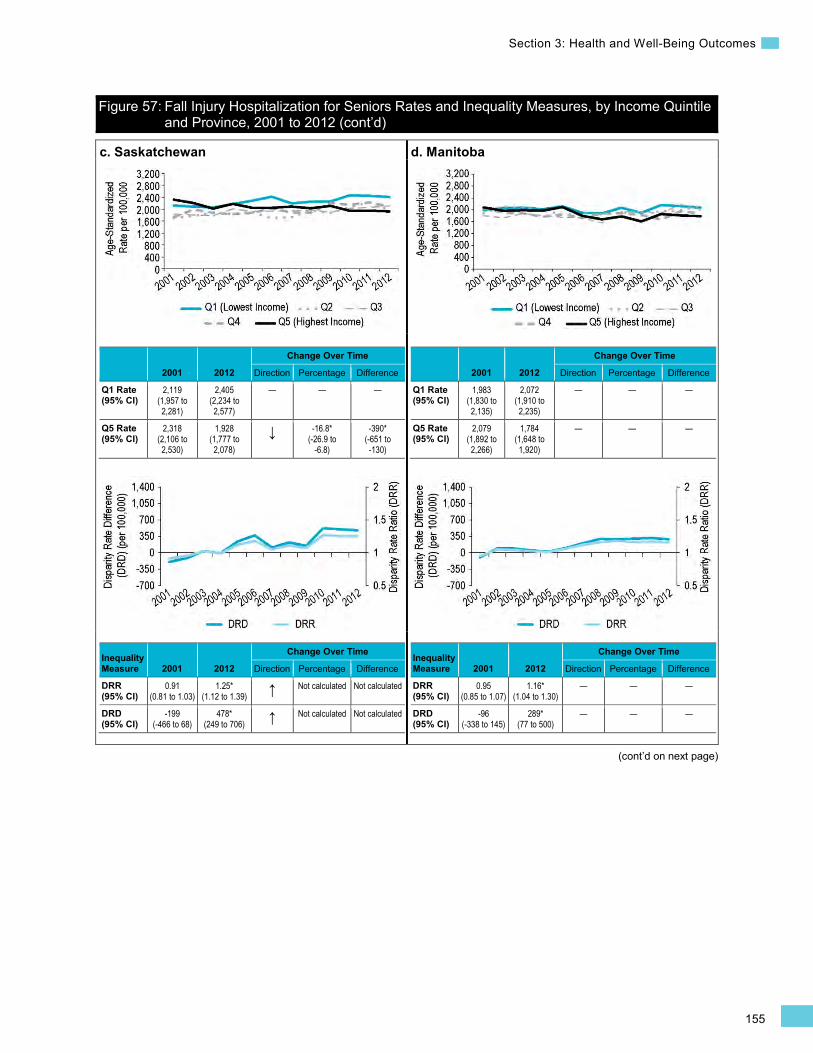
155
Section 3: Health and Well-Being Outcomes
Figure 57: Fall Injury Hospitalization for Seniors Rates and Inequality Measures, by Income Quintile and Province, 2001 to 2012 (cont’d)
(cont’d on next page)
c. Saskatchewan
2001 2012
Change Over Time
Direction Percentage Difference
Q1 Rate (95% CI)
2,119 (1,957 to 2,281)
2,405 (2,234 to 2,577)
— — —
Q5 Rate (95% CI)
2,318 (2,106 to 2,530)
1,928 (1,777 to 2,078)
↓ -16.8* (-26.9 to
-6.8)
-390* (-651 to -130)
Inequality Measure 2001 2012
Change Over Time
Direction Percentage Difference
DRR (95% CI)
0.91 (0.81 to 1.03)
1.25* (1.12 to 1.39) ↑ Not calculated Not calculated
DRD (95% CI)
-199 (-466 to 68)
478* (249 to 706) ↑ Not calculated Not calculated
d. Manitoba
2001 2012
Change Over Time
Direction Percentage Difference
Q1 Rate (95% CI)
1,983 (1,830 to 2,135)
2,072 (1,910 to 2,235)
— — —
Q5 Rate (95% CI)
2,079 (1,892 to 2,266)
1,784 (1,648 to 1,920)
— — —
Inequality Measure 2001 2012
Change Over Time
Direction Percentage Difference
DRR (95% CI)
0.95 (0.85 to 1.07)
1.16* (1.04 to 1.30)
— — —
DRD (95% CI)
-96 (-338 to 145)
289* (77 to 500)
— — —
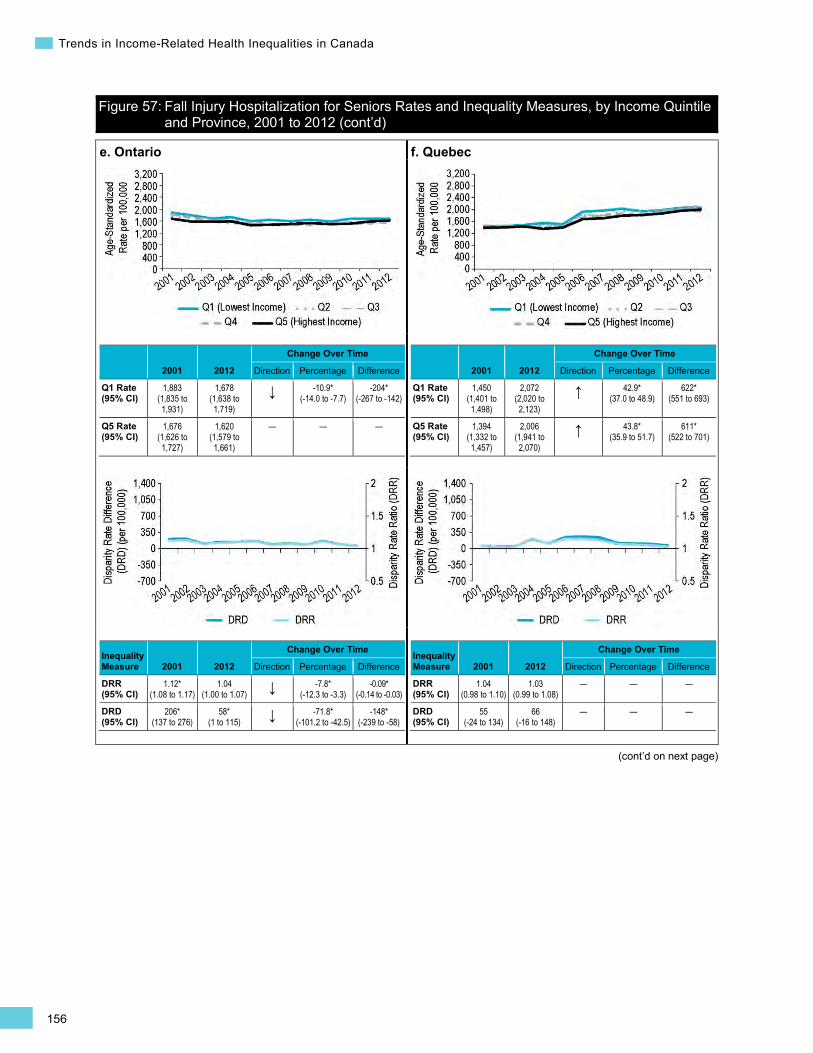
156
Trends in Income-Related Health Inequalities in Canada
Figure 57: Fall Injury Hospitalization for Seniors Rates and Inequality Measures, by Income Quintile and Province, 2001 to 2012 (cont’d)
(cont’d on next page)
e. Ontario
2001 2012
Change Over Time
Direction Percentage Difference
Q1 Rate (95% CI)
1,883 (1,835 to 1,931)
1,678 (1,638 to 1,719)
↓ -10.9* (-14.0 to -7.7)
-204* (-267 to -142)
Q5 Rate (95% CI)
1,676 (1,626 to 1,727)
1,620 (1,579 to 1,661)
— — —
Inequality Measure 2001 2012
Change Over Time
Direction Percentage Difference
DRR (95% CI)
1.12* (1.08 to 1.17)
1.04 (1.00 to 1.07) ↓ -7.8*
(-12.3 to -3.3) -0.09*
(-0.14 to -0.03)
DRD (95% CI)
206* (137 to 276)
58* (1 to 115) ↓ -71.8*
(-101.2 to -42.5) -148*
(-239 to -58)
f. Quebec
2001 2012
Change Over Time
Direction Percentage Difference
Q1 Rate (95% CI)
1,450 (1,401 to 1,498)
2,072 (2,020 to 2,123)
↑ 42.9* (37.0 to 48.9)
622* (551 to 693)
Q5 Rate (95% CI)
1,394 (1,332 to 1,457)
2,006 (1,941 to 2,070)
↑ 43.8* (35.9 to 51.7)
611* (522 to 701)
Inequality Measure 2001 2012
Change Over Time
Direction Percentage Difference
DRR (95% CI)
1.04 (0.98 to 1.10)
1.03 (0.99 to 1.08)
— — —
DRD (95% CI)
55 (-24 to 134)
66 (-16 to 148)
— — —
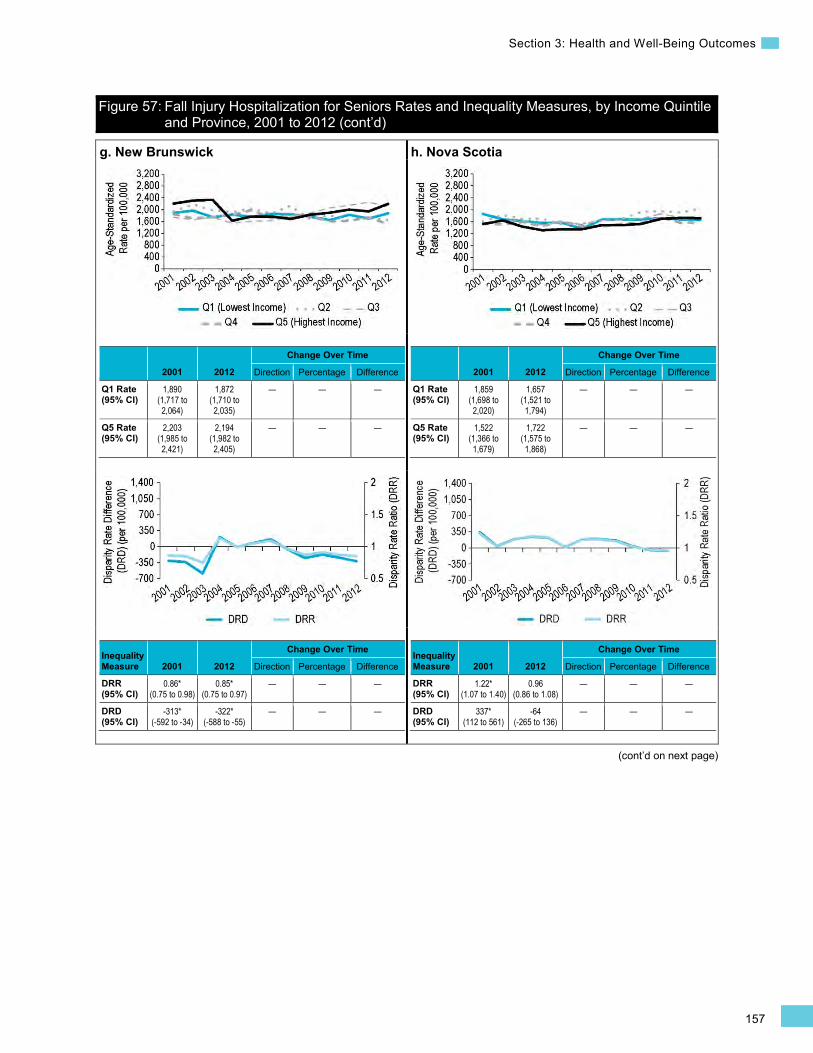
157
Section 3: Health and Well-Being Outcomes
Figure 57: Fall Injury Hospitalization for Seniors Rates and Inequality Measures, by Income Quintile and Province, 2001 to 2012 (cont’d)
(cont’d on next page)
g. New Brunswick
2001 2012
Change Over Time
Direction Percentage Difference
Q1 Rate (95% CI)
1,890 (1,717 to 2,064)
1,872 (1,710 to 2,035)
— — —
Q5 Rate (95% CI)
2,203 (1,985 to 2,421)
2,194 (1,982 to 2,405)
— — —
Inequality Measure 2001 2012
Change Over Time
Direction Percentage Difference
DRR (95% CI)
0.86* (0.75 to 0.98)
0.85* (0.75 to 0.97)
— — —
DRD (95% CI)
-313* (-592 to -34)
-322* (-588 to -55)
— — —
h. Nova Scotia
2001 2012
Change Over Time
Direction Percentage Difference
Q1 Rate (95% CI)
1,859 (1,698 to 2,020)
1,657 (1,521 to 1,794)
— — —
Q5 Rate (95% CI)
1,522 (1,366 to 1,679)
1,722 (1,575 to 1,868)
— — —
Inequality Measure 2001 2012
Change Over Time
Direction Percentage Difference
DRR (95% CI)
1.22* (1.07 to 1.40)
0.96 (0.86 to 1.08)
— — —
DRD (95% CI)
337* (112 to 561)
-64 (-265 to 136)
— — —
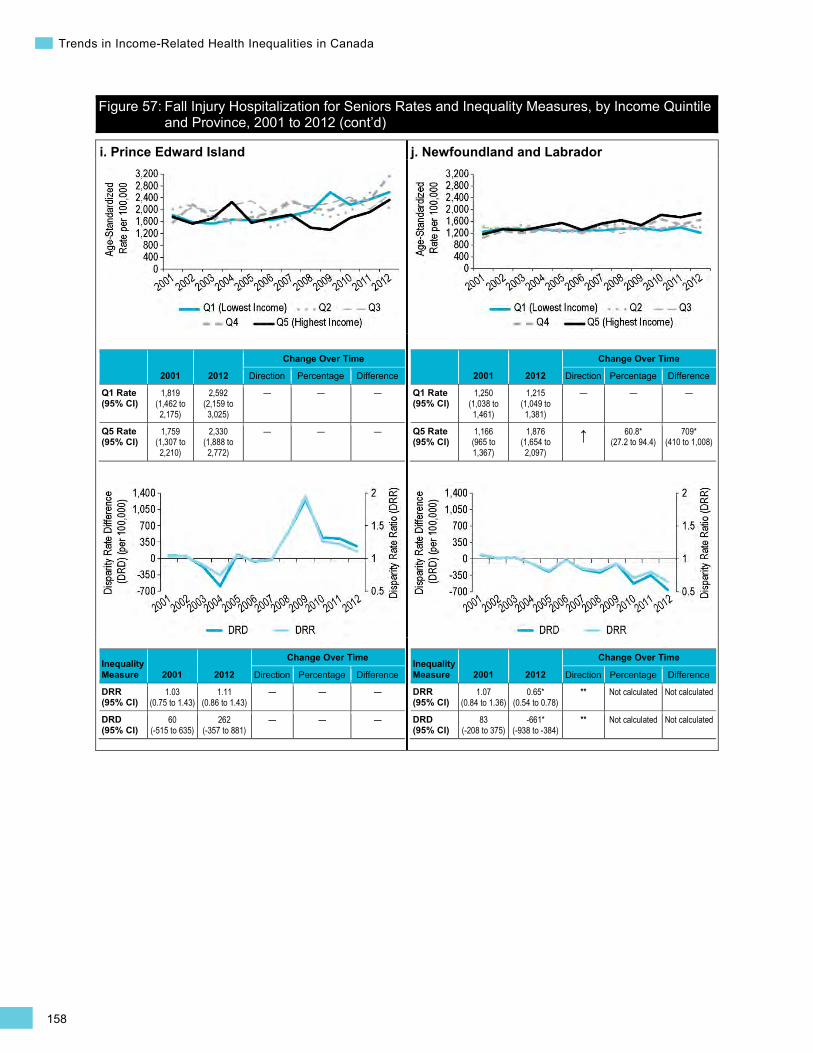
158
Trends in Income-Related Health Inequalities in Canada
Figure 57: Fall Injury Hospitalization for Seniors Rates and Inequality Measures, by Income Quintile and Province, 2001 to 2012 (cont’d)
i. Prince Edward Island
2001 2012
Change Over Time
Direction Percentage Difference
Q1 Rate (95% CI)
1,819 (1,462 to 2,175)
2,592 (2,159 to 3,025)
— — —
Q5 Rate (95% CI)
1,759 (1,307 to 2,210)
2,330 (1,888 to 2,772)
— — —
Inequality Measure 2001 2012
Change Over Time
Direction Percentage Difference
DRR (95% CI)
1.03 (0.75 to 1.43)
1.11 (0.86 to 1.43)
— — —
DRD (95% CI)
60 (-515 to 635)
262 (-357 to 881)
— — —
j. Newfoundland and Labrador
2001 2012
Change Over Time
Direction Percentage Difference
Q1 Rate (95% CI)
1,250 (1,038 to 1,461)
1,215 (1,049 to 1,381)
— — —
Q5 Rate (95% CI)
1,166 (965 to 1,367)
1,876 (1,654 to 2,097)
↑ 60.8* (27.2 to 94.4)
709* (410 to 1,008)
Inequality Measure 2001 2012
Change Over Time
Direction Percentage Difference
DRR (95% CI)
1.07 (0.84 to 1.36)
0.65* (0.54 to 0.78)
** Not calculated Not calculated
DRD (95% CI)
83 (-208 to 375)
-661* (-938 to -384)
** Not calculated Not calculated

159
Section 3: Health and Well-Being Outcomes
Motor Vehicle Traffic Injury Hospitalization Background
The Motor Vehicle Traffic Injury Hospitalization indicator captures inpatient treatment at general hospitals for injuries to drivers and passengers of motor vehicles, as well as to pedestrians and cyclists hit by motor vehicles. This indicator is calculated for individuals of all ages and is expressed as a separation rate (including discharges, deaths, sign-outs and transfers) per 100,000 Canadians per year.
Motor vehicle collisions can lead to injuries, long-term disability and death. Motor vehicle traffic injuries are a leading cause of unintentional injury hospitalization, particularly among younger Canadians.449 In 2012, there were over 15,000 hospitalizations in Canada for a motor vehicle traffic injury, making up 7% of all unintentional injury hospitalizations.450 The estimated average cost of hospitalization for a motor vehicle traffic injury is $16,400, for a total cost of approximately $250,589,000 in 2012 (Canadian MIS Database, unpublished data). Injuries resulting from traffic collisions can also lead to long-term disability and declines in health-related quality of life.451–453
In 2012, motor vehicle collisions caused approximately 2,100 fatalities in Canada.454 Motor vehicle traffic collisions are the primary cause of death among Canadians age 15 to 24.449
Previous analysis has suggested that motor vehicle traffic injury hospitalizations, especially those resulting from pedestrian injuries, are more common among lower-income populations.39
Indicator Notes Data Sources Discharge Abstract Database and Hospital Morbidity Database, CIHI
Income Disaggregator Neighbourhood-level income from the Postal Code Conversion File Plus, Statistics Canada
Age Standardization 2011 Canadian standard population
Time Period 2001 to 2012
Please refer to Trends in Income-Related Health Inequalities in Canada: Indicator Definitions for detailed technical notes.
Additional Data National and provincial data for the complete time period and middle income quintiles (Quintile 2 to Quintile 4), as well as provincial data disaggregated by sex, is not presented in this report. This data is available on CIHI’s website in the form of downloadable tables.
Symbols and Abbreviations
* Estimate is statistically significant (i.e., statistically different from 1 for DRR or different from 0 for DRD, PRR, Change Over Time Percentage and Change Over Time Difference, based on the 95% CI)
Q1 Quintile 1 (lowest income quintile)
Q5 Quintile 5 (highest income quintile)
95% CI 95% confidence interval
↑ Statistically significant increase between 2001 estimate and 2012 estimate
↓ Statistically significant decrease between 2001 estimate and 2012 estimate
— No statistically significant change between 2001 estimate and 2012 estimate
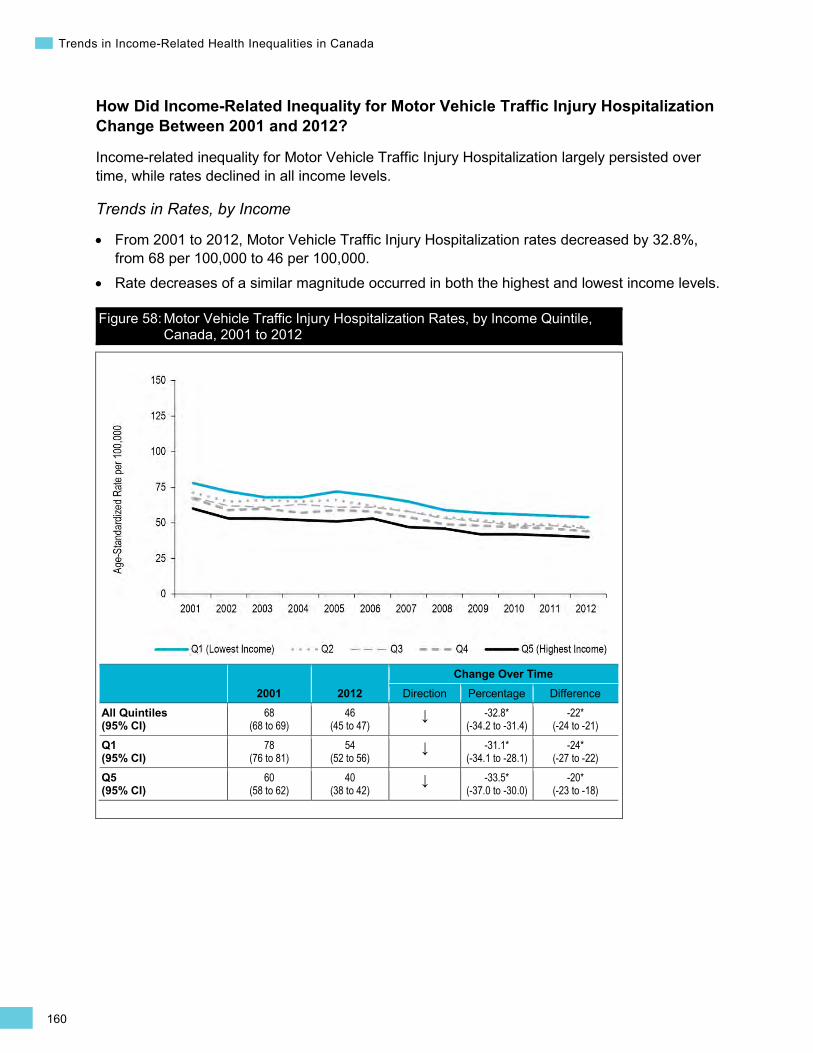
160
Trends in Income-Related Health Inequalities in Canada
How Did Income-Related Inequality for Motor Vehicle Traffic Injury Hospitalization Change Between 2001 and 2012?
Income-related inequality for Motor Vehicle Traffic Injury Hospitalization largely persisted over time, while rates declined in all income levels.
Trends in Rates, by Income
• From 2001 to 2012, Motor Vehicle Traffic Injury Hospitalization rates decreased by 32.8%, from 68 per 100,000 to 46 per 100,000.
• Rate decreases of a similar magnitude occurred in both the highest and lowest income levels.
Figure 58: Motor Vehicle Traffic Injury Hospitalization Rates, by Income Quintile, Canada, 2001 to 2012
2001 2012 Change Over Time
Direction Percentage Difference All Quintiles (95% CI)
68 (68 to 69)
46 (45 to 47)
↓ -32.8* (-34.2 to -31.4)
-22* (-24 to -21)
Q1 (95% CI)
78 (76 to 81)
54 (52 to 56)
↓ -31.1* (-34.1 to -28.1)
-24* (-27 to -22)
Q5 (95% CI)
60 (58 to 62)
40 (38 to 42)
↓ -33.5* (-37.0 to -30.0)
-20* (-23 to -18)
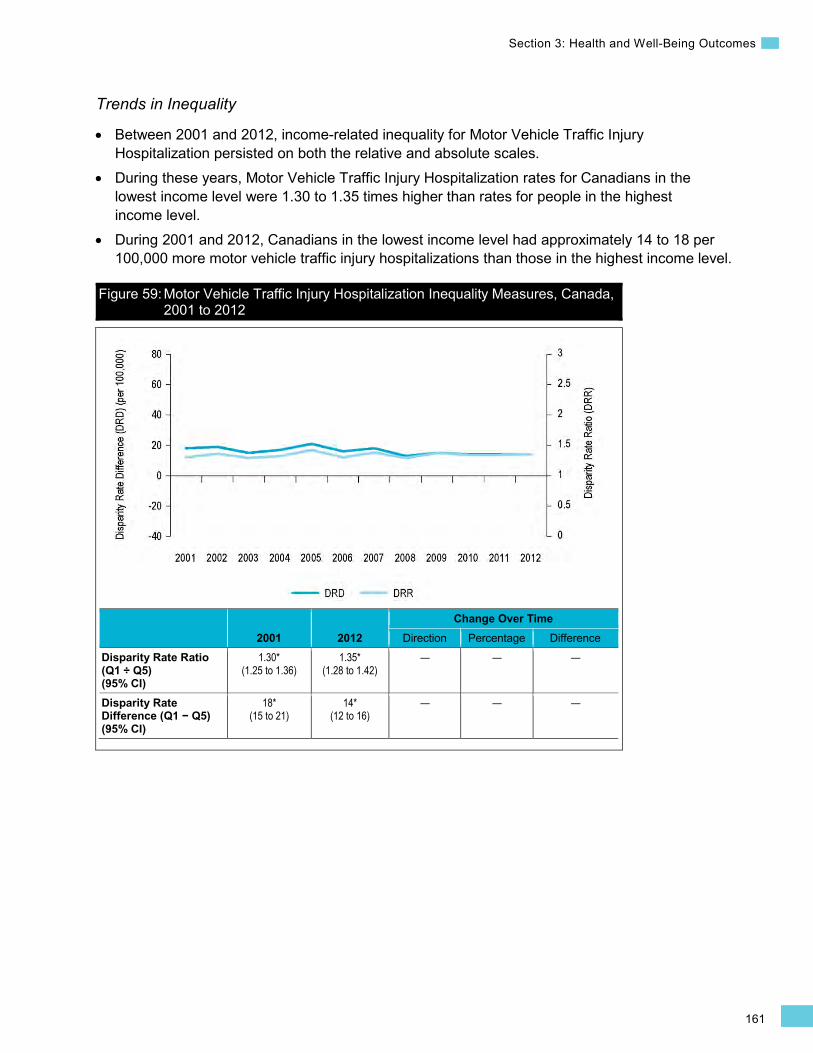
161
Section 3: Health and Well-Being Outcomes
Trends in Inequality
• Between 2001 and 2012, income-related inequality for Motor Vehicle Traffic Injury Hospitalization persisted on both the relative and absolute scales.
• During these years, Motor Vehicle Traffic Injury Hospitalization rates for Canadians in the lowest income level were 1.30 to 1.35 times higher than rates for people in the highest income level.
• During 2001 and 2012, Canadians in the lowest income level had approximately 14 to 18 per 100,000 more motor vehicle traffic injury hospitalizations than those in the highest income level.
Figure 59: Motor Vehicle Traffic Injury Hospitalization Inequality Measures, Canada, 2001 to 2012
2001 2012 Change Over Time
Direction Percentage Difference Disparity Rate Ratio (Q1 ÷ Q5) (95% CI)
1.30* (1.25 to 1.36)
1.35* (1.28 to 1.42)
— — —
Disparity Rate Difference (Q1 − Q5) (95% CI)
18* (15 to 21)
14* (12 to 16)
— — —

162
Trends in Income-Related Health Inequalities in Canada
Men Women
How Did Income-Related Inequality Change Between 2001 and 2012 for Men and Women?
For both men and women, income-related inequality for Motor Vehicle Traffic Injury Hospitalization persisted over time, while rates decreased across all income levels.
Trends in Rates, by Income and Sex
• For both sexes, from 2001 to 2012, there was a decrease in Motor Vehicle Traffic Injury Hospitalization rates across all income levels combined. This trend was due to decreases in both the highest and lowest income levels.
• Overall, rates of Motor Vehicle Traffic Injury Hospitalization were higher among men than among women.
Figure 60: Motor Vehicle Traffic Injury Hospitalization Rates, by Income Quintile and Sex, Canada, 2001 to 2012
Men Women
2001 2012
Change Over Time
2001 2012
Change Over Time
Direction Percentage Difference Direction Percentage Difference
All Quintiles (95% CI)
84 (82 to 85)
59 (58 to 60) ↓ -29.7*
(-31.6 to -27.7) -25*
(-27 to -23) 54
(53 to 55) 34
(33 to 35) ↓ -37.1* (-39.2 to -35.0)
-20* (-21 to -19)
Q1 (95% CI)
94 (91 to 98)
69 (66 to 72) ↓ -27.0*
(-31.1 to -22.8) -25*
(-30 to -21) 64
(61 to 67) 40
(38 to 42) ↓ -36.7* (-41.0 to -32.3)
-23* (-27 to -20)
Q1 (95% CI)
74 (71 to 78)
51 (49 to 54) ↓ -31.1*
(-35.8 to -26.5) -23*
(-27 to -19) 46
(44 to 49) 29
(28 to 31) ↓ -36.6* (-41.9 to -31.2)
-17* (-20 to -14)
Trends in Inequality, by Sex
For both men and women, income-related inequality for Motor Vehicle Traffic Injury Hospitalization persisted on both the relative and absolute scales.
•
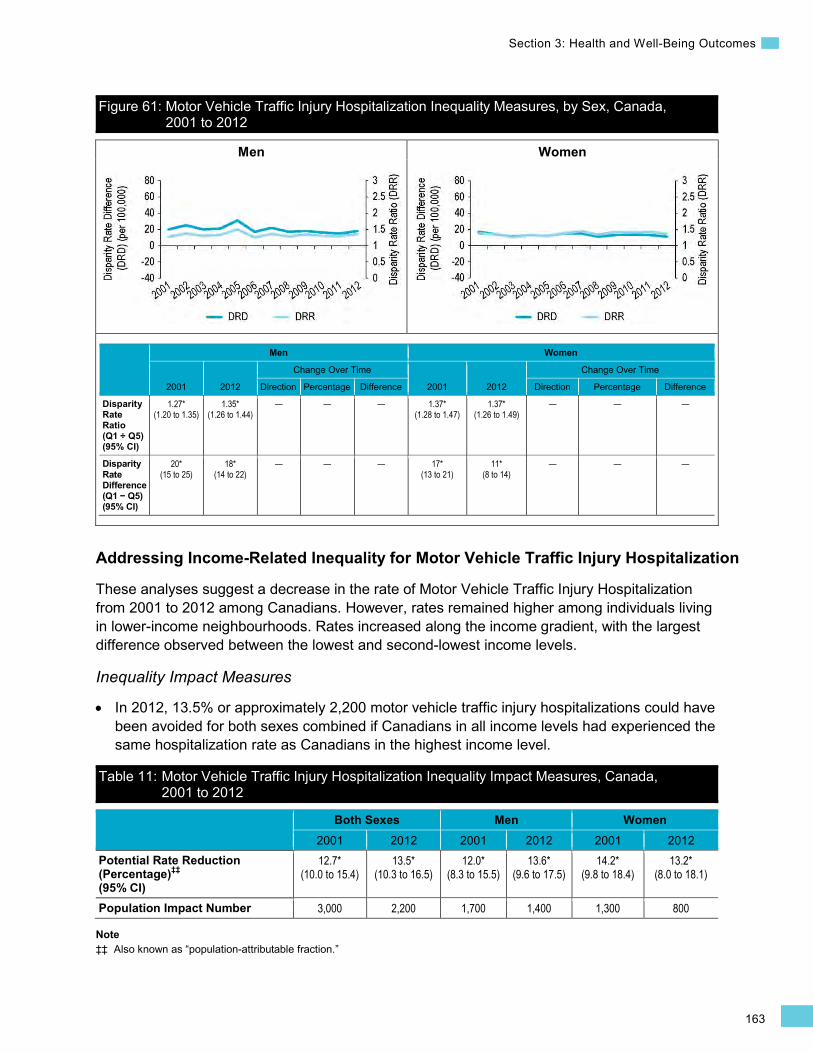
163
Section 3: Health and Well-Being Outcomes
Men Women
Figure 61: Motor Vehicle Traffic Injury Hospitalization Inequality Measures, by Sex, Canada, 2001 to 2012
Men Women
2001 2012
Change Over Time
2001 2012
Change Over Time
Direction Percentage Difference Direction Percentage Difference
Disparity Rate Ratio (Q1 ÷ Q5) (95% CI)
1.27* (1.20 to 1.35)
1.35* (1.26 to 1.44)
— — — 1.37* (1.28 to 1.47)
1.37* (1.26 to 1.49)
— — —
Disparity Rate Difference (Q1 − Q5) (95% CI)
20* (15 to 25)
18* (14 to 22)
— — — 17* (13 to 21)
11* (8 to 14)
— — —
Addressing Income-Related Inequality for Motor Vehicle Traffic Injury Hospitalization
These analyses suggest a decrease in the rate of Motor Vehicle Traffic Injury Hospitalization from 2001 to 2012 among Canadians. However, rates remained higher among individuals living in lower-income neighbourhoods. Rates increased along the income gradient, with the largest difference observed between the lowest and second-lowest income levels.
Inequality Impact Measures
In 2012, 13.5% or approximately 2,200 motor vehicle traffic injury hospitalizations could have been avoided for both sexes combined if Canadians in all income levels had experienced the same hospitalization rate as Canadians in the highest income level.
Table 11: Motor Vehicle Traffic Injury Hospitalization Inequality Impact Measures, Canada, 2001 to 2012
Both Sexes Men Women 2001 2012 2001 2012 2001 2012
Potential Rate Reduction (Percentage)‡‡ (95% CI)
12.7* (10.0 to 15.4)
13.5* (10.3 to 16.5)
12.0* (8.3 to 15.5)
13.6* (9.6 to 17.5)
14.2* (9.8 to 18.4)
13.2* (8.0 to 18.1)
Population Impact Number 3,000 2,200 1,700 1,400 1,300 800
Note ‡‡ Also known as “population-attributable fraction.”
•
164
Trends in Income-Related Health Inequalities in Canada
Approaches for Addressing Inequality
Over the past decade, a range of interventions aimed at reducing motor vehicle accidents has been introduced or proposed across Canada,449, 455, 456 and some of these approaches have the potential to specifically reduce motor vehicle accidents in lower-income neighbourhoods.
Interventions to reduce motor vehicle accidents target a broad range of risk factors, such as impaired driving due to alcohol, drugs or distraction; speeding and aggressive driving; occupant protection such as seatbelt and car seat use; and environmental factors such as road infrastructure and road conditions.455 Evidence indicates that initiatives targeting road infrastructure, such as speed bumps and roundabouts, are among the most effective at reducing motor vehicle accidents.457
Traffic-calming measures such as speed bumps can reduce pedestrian injuries among children in school zones,458 lower collision rates,459–461 increase the survival rate when crashes do occur462, 463 and reduce traffic speeds in general.464, 465 Traffic calming can also facilitate active transit such as biking, walking and use of public transit.460
When it comes to implementing traffic-calming measures, however, research has found that their application is often not appropriately targeted to areas with the highest pedestrian casualty rates, such as lower-income neighbourhoods.466 This may be due in part to higher-income neighbourhoods being more effective at mobilizing community demand for traffic-calming interventions.467 Compared with higher-income neighbourhoods, lower-income neighbourhoods in some cases may have been designed to prioritize traffic flow over walkability or pedestrian safety.468 While engineering modifications are costly,469 lower-cost measures, such as speed limit reductions, may be easier to implement rapidly across Canadian jurisdictions (see Box 16 below).
Box 16: Reducing Speed Limits in Residential Neighbourhoods Issue: Pedestrian collisions and related hospitalizations occur more frequently in lower-income neighbourhoods, where residents may be more reliant on walking for transportation.470 Evidence suggests, however, that traffic-calming initiatives tend to be seen more frequently in affluent neighbourhoods due to citizen demand and community action.467, 468, 471
Intervention: The widespread implementation of cost-effective speed reduction strategies has been proposed as an intervention by health inequality experts in the United Kingdom, where jurisdictions such as the City of London and the surrounding boroughs (except Westminster) have adopted maximum speed limits of 20 miles per hour (about 32 kilometres per hour).472 The National Collaborating Centre for Healthy Public Policy and the Institut nationale de santé publique du Québec recommended a reduction of the speed limit to 30 kilometres per hour in residential areas.460 In Canada, 30 kilometre per hour limits have been put in place in some municipalities, including Westmount, Quebec, and Duncan, British Columbia.460
Rationale/Evidence: In Canada, residential speed limits range from 30 to 50 kilometres per hour, with 50 kilometres per hour being the most widespread. Speed reduction has been shown to lower both the incidence and severity of pedestrian injuries,460, 462–464, 473 and it is less costly to implement than other traffic-calming measures.469 In a study conducted in Edmonton, Alberta, it was found that lowering posted speed limits (without infrastructure changes) significantly reduced the mean speeds in the intervention communities that participated in the study.474
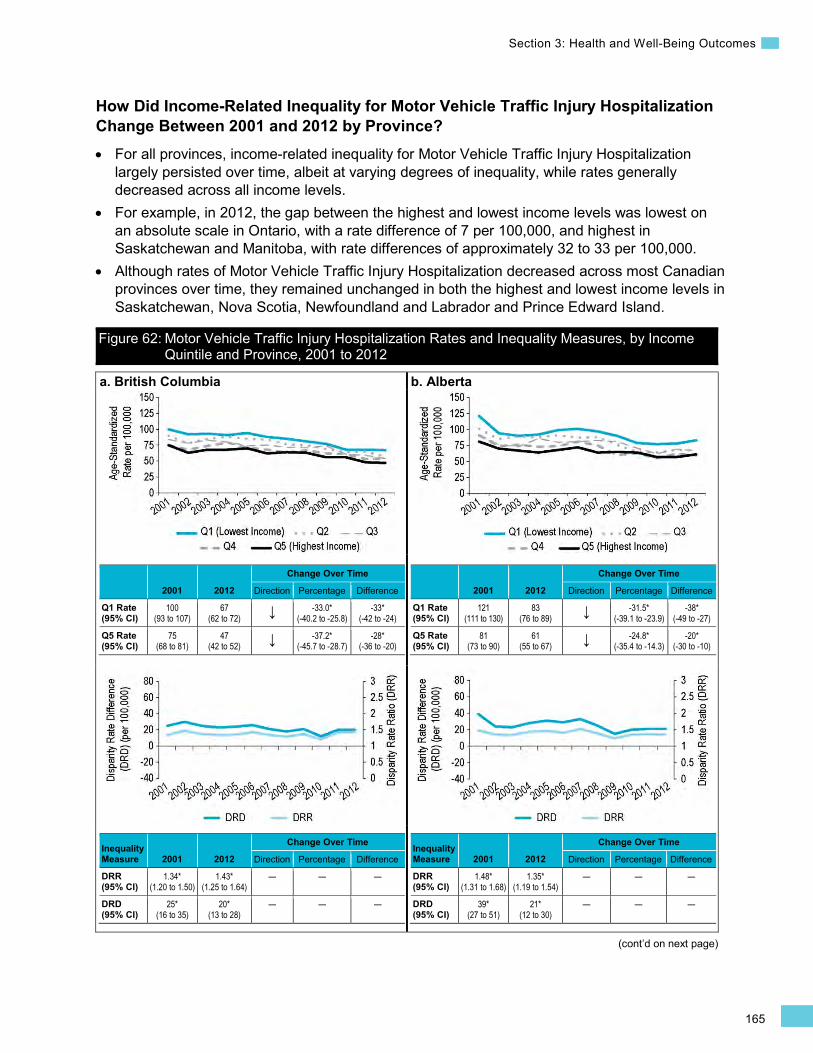
165
Section 3: Health and Well-Being Outcomes
(cont’d on next page)
How Did Income-Related Inequality for Motor Vehicle Traffic Injury Hospitalization Change Between 2001 and 2012 by Province? • For all provinces, income-related inequality for Motor Vehicle Traffic Injury Hospitalization
largely persisted over time, albeit at varying degrees of inequality, while rates generally decreased across all income levels.
• For example, in 2012, the gap between the highest and lowest income levels was lowest on an absolute scale in Ontario, with a rate difference of 7 per 100,000, and highest in Saskatchewan and Manitoba, with rate differences of approximately 32 to 33 per 100,000.
• Although rates of Motor Vehicle Traffic Injury Hospitalization decreased across most Canadian provinces over time, they remained unchanged in both the highest and lowest income levels in Saskatchewan, Nova Scotia, Newfoundland and Labrador and Prince Edward Island.
Figure 62: Motor Vehicle Traffic Injury Hospitalization Rates and Inequality Measures, by Income Quintile and Province, 2001 to 2012
a. British Columbia
2001 2012
Change Over Time
Direction Percentage Difference
Q1 Rate (95% CI)
100 (93 to 107)
67 (62 to 72) ↓ -33.0*
(-40.2 to -25.8) -33*
(-42 to -24)
Q5 Rate (95% CI)
75 (68 to 81)
47 (42 to 52) ↓ -37.2*
(-45.7 to -28.7) -28*
(-36 to -20)
Inequality Measure 2001 2012
Change Over Time
Direction Percentage Difference
DRR (95% CI)
1.34* (1.20 to 1.50)
1.43* (1.25 to 1.64)
— — —
DRD (95% CI)
25* (16 to 35)
20* (13 to 28)
— — —
b. Alberta
2001 2012
Change Over Time
Direction Percentage Difference
Q1 Rate (95% CI)
121 (111 to 130)
83 (76 to 89) ↓ -31.5*
(-39.1 to -23.9)-38*
(-49 to -27)
Q5 Rate (95% CI)
81 (73 to 90)
61 (55 to 67) ↓ -24.8*
(-35.4 to -14.3) -20*
(-30 to -10)
Inequality Measure 2001 2012
Change Over Time
Direction Percentage Difference
DRR (95% CI)
1.48* (1.31 to 1.68)
1.35* (1.19 to 1.54)
— — —
DRD (95% CI)
39* (27 to 51)
21* (12 to 30)
— — —
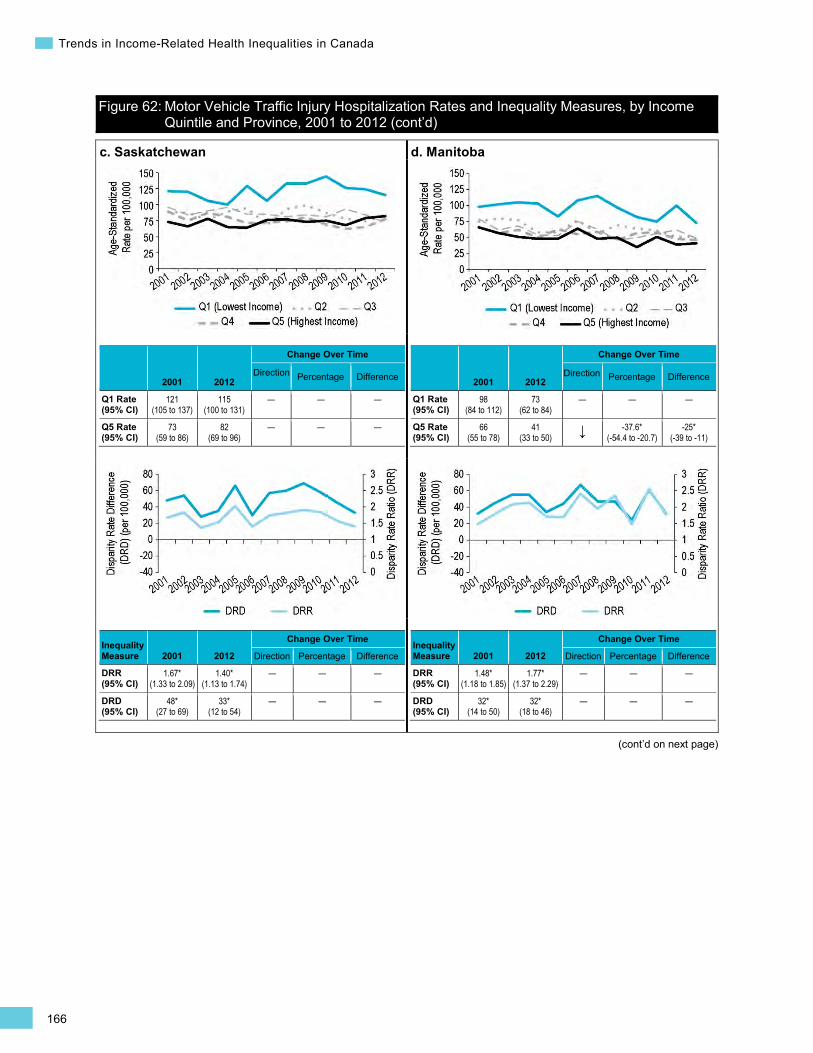
166
Trends in Income-Related Health Inequalities in Canada
Figure 62: Motor Vehicle Traffic Injury Hospitalization Rates and Inequality Measures, by Income Quintile and Province, 2001 to 2012 (cont’d)
(cont’d on next page)
c. Saskatchewan
2001 2012
Change Over Time
Direction Percentage Difference
Q1 Rate (95% CI)
121 (105 to 137)
115 (100 to 131)
— — —
Q5 Rate (95% CI)
73 (59 to 86)
82 (69 to 96)
— — —
Inequality Measure 2001 2012
Change Over Time
Direction Percentage Difference
DRR (95% CI)
1.67* (1.33 to 2.09)
1.40* (1.13 to 1.74)
— — —
DRD (95% CI)
48* (27 to 69)
33* (12 to 54)
— — —
d. Manitoba
2001 2012
Change Over Time
Direction Percentage Difference
Q1 Rate (95% CI)
98 (84 to 112)
73 (62 to 84)
— — —
Q5 Rate (95% CI)
66 (55 to 78)
41 (33 to 50) ↓ -37.6*
(-54.4 to -20.7) -25*
(-39 to -11)
Inequality Measure 2001 2012
Change Over Time
Direction Percentage Difference
DRR (95% CI)
1.48* (1.18 to 1.85)
1.77* (1.37 to 2.29)
— — —
DRD (95% CI)
32* (14 to 50)
32* (18 to 46)
— — —
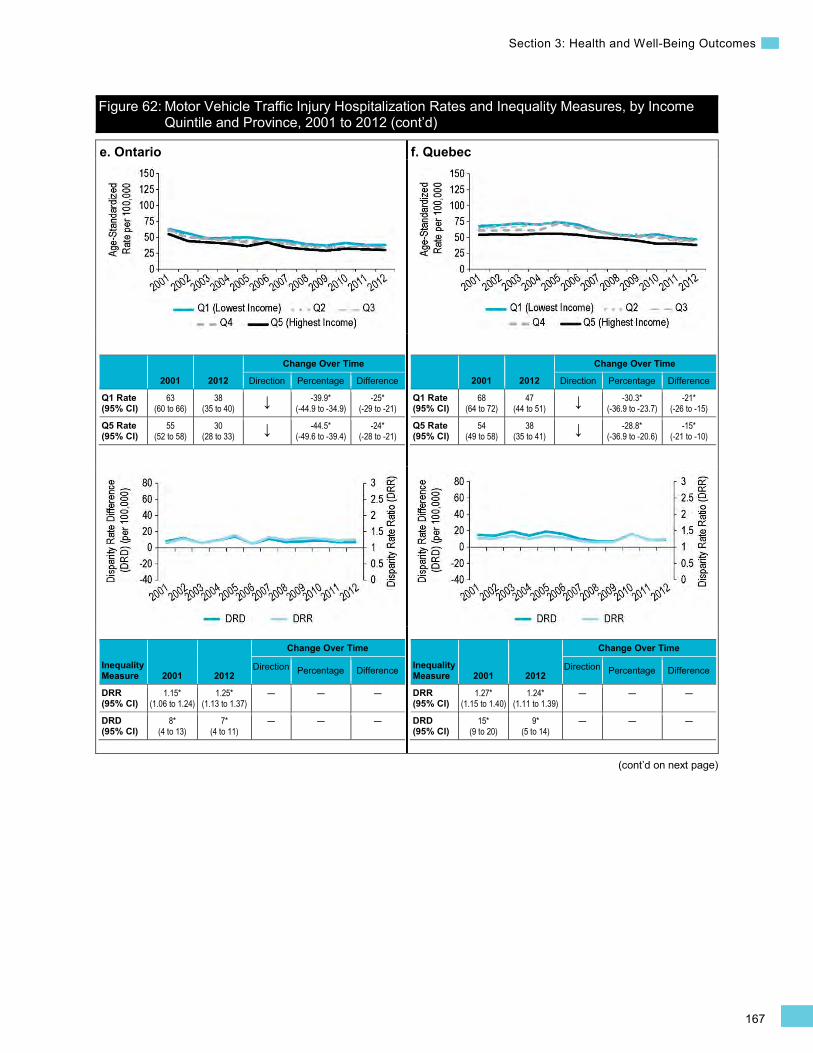
167
Section 3: Health and Well-Being Outcomes
Figure 62: Motor Vehicle Traffic Injury Hospitalization Rates and Inequality Measures, by Income Quintile and Province, 2001 to 2012 (cont’d)
(cont’d on next page)
e. Ontario
2001 2012
Change Over Time
Direction Percentage Difference
Q1 Rate (95% CI)
63 (60 to 66)
38 (35 to 40) ↓ -39.9*
(-44.9 to -34.9) -25*
(-29 to -21)
Q5 Rate (95% CI)
55 (52 to 58)
30 (28 to 33) ↓ -44.5*
(-49.6 to -39.4) -24*
(-28 to -21)
Inequality Measure 2001 2012
Change Over Time
Direction Percentage Difference
DRR (95% CI)
1.15* (1.06 to 1.24)
1.25* (1.13 to 1.37)
— — —
DRD (95% CI)
8* (4 to 13)
7* (4 to 11)
— — —
f. Quebec
2001 2012
Change Over Time
Direction Percentage Difference
Q1 Rate (95% CI)
68 (64 to 72)
47 (44 to 51) ↓ -30.3*
(-36.9 to -23.7) -21*
(-26 to -15)
Q5 Rate (95% CI)
54 (49 to 58)
38 (35 to 41) ↓ -28.8*
(-36.9 to -20.6) -15*
(-21 to -10)
Inequality Measure 2001 2012
Change Over Time
Direction Percentage Difference
DRR (95% CI)
1.27* (1.15 to 1.40)
1.24* (1.11 to 1.39)
— — —
DRD (95% CI)
15* (9 to 20)
9* (5 to 14)
— — —
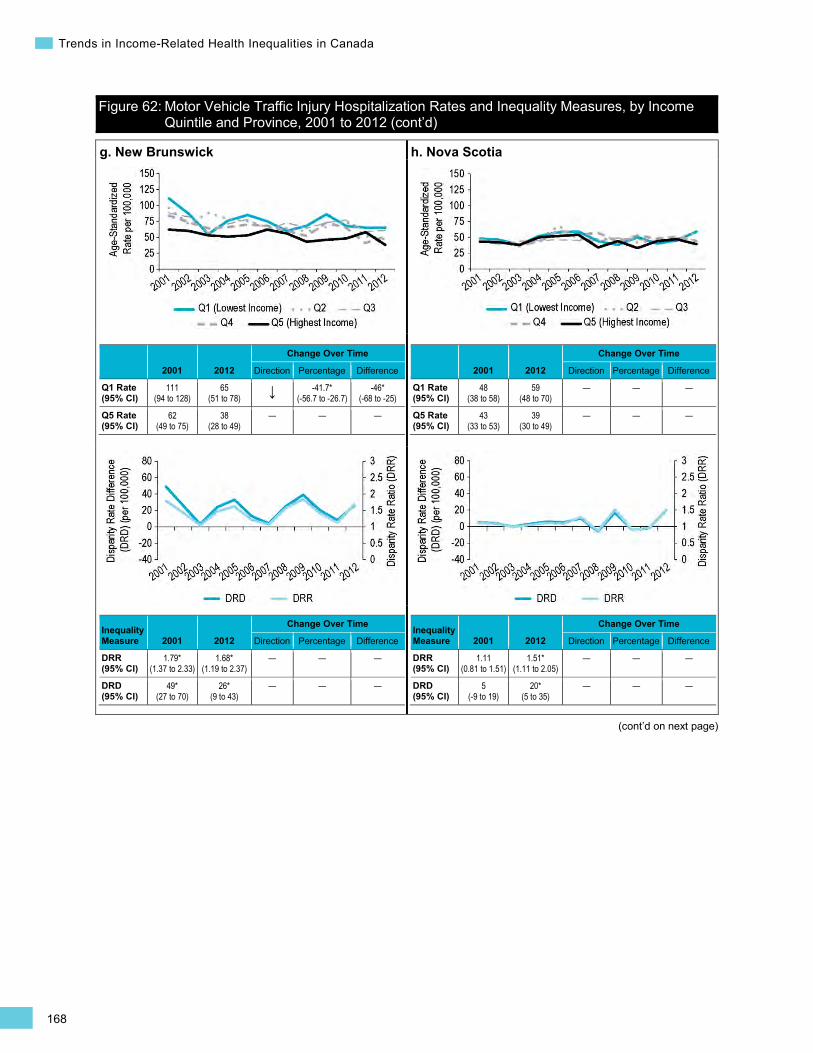
168
Trends in Income-Related Health Inequalities in Canada
Figure 62: Motor Vehicle Traffic Injury Hospitalization Rates and Inequality Measures, by Income Quintile and Province, 2001 to 2012 (cont’d)
(cont’d on next page)
g. New Brunswick
2001 2012
Change Over Time
Direction Percentage Difference
Q1 Rate (95% CI)
111 (94 to 128)
65 (51 to 78) ↓ -41.7*
(-56.7 to -26.7) -46*
(-68 to -25)
Q5 Rate (95% CI)
62 (49 to 75)
38 (28 to 49)
— — —
Inequality Measure 2001 2012
Change Over Time
Direction Percentage Difference
DRR (95% CI)
1.79* (1.37 to 2.33)
1.68* (1.19 to 2.37)
— — —
DRD (95% CI)
49* (27 to 70)
26* (9 to 43)
— — —
h. Nova Scotia
2001 2012
Change Over Time
Direction Percentage Difference
Q1 Rate (95% CI)
48 (38 to 58)
59 (48 to 70)
— — —
Q5 Rate (95% CI)
43 (33 to 53)
39 (30 to 49)
— — —
Inequality Measure 2001 2012
Change Over Time
Direction Percentage Difference
DRR (95% CI)
1.11 (0.81 to 1.51)
1.51* (1.11 to 2.05)
— — —
DRD (95% CI)
5 (-9 to 19)
20* (5 to 35)
— — —
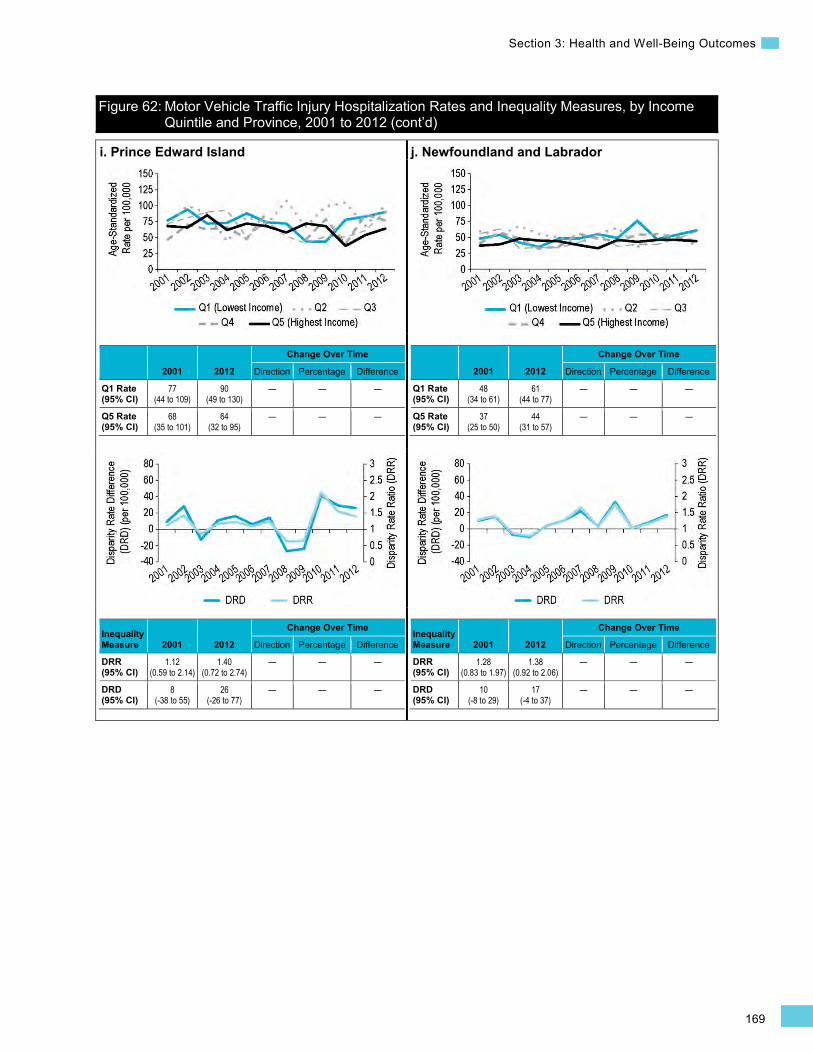
169
Section 3: Health and Well-Being Outcomes
Figure 62: Motor Vehicle Traffic Injury Hospitalization Rates and Inequality Measures, by Income Quintile and Province, 2001 to 2012 (cont’d)
i. Prince Edward Island
2001 2012
Change Over Time
Direction Percentage Difference
Q1 Rate (95% CI)
77 (44 to 109)
90 (49 to 130)
— — —
Q5 Rate (95% CI)
68 (35 to 101)
64 (32 to 95)
— — —
Inequality Measure 2001 2012
Change Over Time
Direction Percentage Difference
DRR (95% CI)
1.12 (0.59 to 2.14)
1.40 (0.72 to 2.74)
— — —
DRD (95% CI)
8 (-38 to 55)
26 (-26 to 77)
— — —
j. Newfoundland and Labrador
2001 2012
Change Over Time
Direction Percentage Difference
Q1 Rate (95% CI)
48 (34 to 61)
61 (44 to 77)
— — —
Q5 Rate (95% CI)
37 (25 to 50)
44 (31 to 57)
— — —
Inequality Measure 2001 2012
Change Over Time
Direction Percentage Difference
DRR (95% CI)
1.28 (0.83 to 1.97)
1.38 (0.92 to 2.06)
— — —
DRD (95% CI)
10 (-8 to 29)
17 (-4 to 37)
— — —
170
Trends in Income-Related Health Inequalities in Canada
(cont’d on next page)
Chronic Disease Indicators Mental Illness Hospitalization Background
The Mental Illness Hospitalization indicator captures inpatient treatment at general hospitals and psychiatric facilities for selected mental illnesses. This indicator is calculated for individuals age 15 and older and is expressed as a separation rate (including discharges, deaths, sign-outs and transfers) per 100,000 Canadians for the following mental illnesses: substance-related disorders (23%), schizophrenic, delusional and non-organic psychotic disorders (29%), mood/affective disorders (38%), anxiety disorders (6%) and personality disorders (5%). Note that data capture from psychiatric facilities varies by province and may have changed over time. This variation limits comparisons for this indicator across provinces and may affect trend analysis over time.
In 2012, there were approximately 144,000x separations from general and psychiatric hospitals for a mental illness. The current best practice for the appropriate and effective treatment of mental illness is to receive care in the community, thus minimizing the need for hospitalization.475, 476 Variations in the rate of Mental Illness Hospitalization may reflect differences in the health of the population and mental health service delivery models, as well as the availability and accessibility of specialized, residential and/or ambulatory and community-based health services.477
x. Excludes hospitalization records missing postal code information (approximately 4.5% of all records).
In Canada, the average cost per mental illness hospitalization is estimated to be approximately $11,700 (Canadian MIS Database, unpublished data, 2012). The costs associated with mental illness, however, extend beyond the direct costs to the health care system. It is estimated that between 20% and 30% of the working population has a mental illness.478, 479 In 2011, the cost of mental illness to productivity in the Canadian workplace was estimated at more than $6.3 billion.480 Unemployment, underemployment and dependence on social assistance are more likely to be experienced by those with mental illness.481, 482
Indicator Notes Data Sources Hospital Mental Health Database (HMHDB) (contains data from the Hospital Mental Health
Survey [HMHS], Discharge Abstract Database [DAD], Hospital Morbidity Database [HMDB] and Ontario Mental Health Reporting System [OMHRS])
Income Disaggregator Neighbourhood-level income from the Postal Code Conversion File Plus, Statistics Canada
Age Standardization 2011 Canadian standard population
Time Period 2006 to 2012
Please refer to Trends in Income-Related Health Inequalities in Canada: Indicator Definitions for detailed technical notes.
Additional Data National and provincial data for the complete time period and middle income quintiles (Quintile 2 to Quintile 4), as well as provincial data disaggregated by sex, is not presented in this report. This data is available on CIHI’s website in the form of downloadable tables.
171
Section 3: Health and Well-Being Outcomes
Symbols and Abbreviations
* Estimate is statistically significant (i.e., statistically different from 1 for DRR or different from 0 for DRD, PRR, Change Over Time Percentage and Change Over Time Difference, based on the 95% CI)
Q1 Quintile 1 (lowest income quintile)
Q5 Quintile 5 (highest income quintile)
95% CI 95% confidence interval
↑ Statistically significant increase between 2006 estimate and 2012 estimate
↓ Statistically significant decrease between 2006 estimate and 2012 estimate
— No statistically significant change between 2006 estimate and 2012 estimate
How Did Income-Related Inequality for Mental Illness Hospitalization Change Between 2006 and 2012?
Income-related inequality for Mental Illness Hospitalization decreased over time, primarily due to increased hospitalization rates in the highest income level.
Trends in Rates, by Income
• Between 2006 and 2012, the Mental Illness Hospitalization rate increased from 499 per 100,000 to 523 per 100,000 for all income levels combined.
• There was no change in the Mental Illness Hospitalization rates in the lowest income level; however, rates increased by 9.9% or 35 additional hospitalizations per 100,000 in the highest income level, from 350 per 100,000 in 2006 to 385 per 100,000 in 2012.
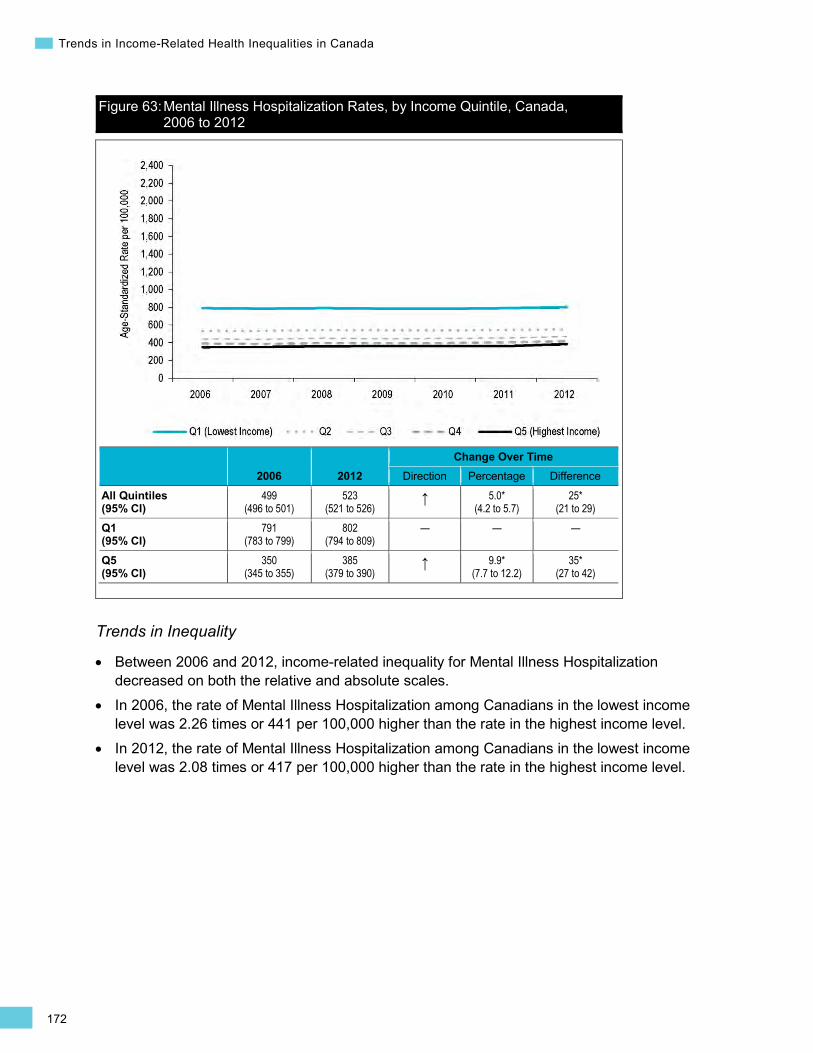
172
Trends in Income-Related Health Inequalities in Canada
Figure 63: Mental Illness Hospitalization Rates, by Income Quintile, Canada, 2006 to 2012
2006 2012 Change Over Time
Direction Percentage Difference
All Quintiles (95% CI)
499 (496 to 501)
523 (521 to 526)
↑ 5.0* (4.2 to 5.7)
25* (21 to 29)
Q1 (95% CI)
791 (783 to 799)
802 (794 to 809)
— — —
Q5 (95% CI)
350 (345 to 355)
385 (379 to 390)
↑ 9.9* (7.7 to 12.2)
35* (27 to 42)
Trends in Inequality
• Between 2006 and 2012, income-related inequality for Mental Illness Hospitalization decreased on both the relative and absolute scales.
• In 2006, the rate of Mental Illness Hospitalization among Canadians in the lowest income level was 2.26 times or 441 per 100,000 higher than the rate in the highest income level.
• In 2012, the rate of Mental Illness Hospitalization among Canadians in the lowest income level was 2.08 times or 417 per 100,000 higher than the rate in the highest income level.

173
Section 3: Health and Well-Being Outcomes
Figure 64: Mental Illness Hospitalization Inequality Measures, Canada, 2006 to 2012
2006 2012 Change Over Time
Direction Percentage Difference Disparity Rate Ratio (Q1 ÷ Q5) (95% CI)
2.26* (2.22 to 2.30)
2.08* (2.05 to 2.12)
↓ -7.8* (-8.8 to -6.8)
-0.18* (-0.20 to -0.15)
Disparity Rate Difference (Q1 − Q5) (95% CI)
441* (432 to 450)
417* (408 to 426)
↓ -5.4* (-8.3 to -2.5)
-24* (-37 to -11)
How Did Income-Related Inequality Change Between 2006 and 2012 for Men and Women?
For both men and women, income-related inequality for Mental Illness Hospitalization decreased over time. For men, hospitalization rates increased across all income levels, while for women, the hospitalization rate increased in the highest income level only.
Trends in Rates, by Income and Sex
• For men, between 2006 and 2012, the rate of Mental Illness Hospitalization increased in both the lowest and highest income levels.
• For women, between 2006 and 2012, the rate of Mental Illness Hospitalization did not change in the lowest income level but increased in the highest income level.
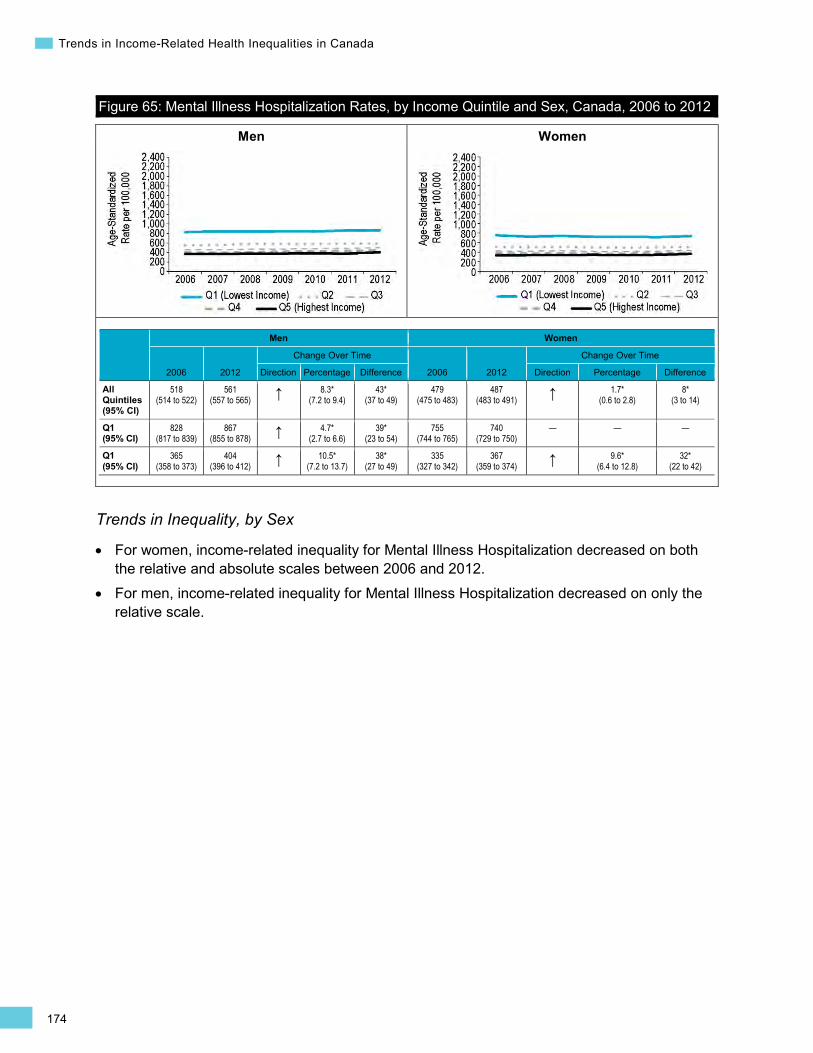
174
Trends in Income-Related Health Inequalities in Canada
Men Women
Figure 65: Mental Illness Hospitalization Rates, by Income Quintile and Sex, Canada, 2006 to 2012
Men Women
2006 2012
Change Over Time
2006 2012
Change Over Time
Direction Percentage Difference Direction Percentage Difference
All Quintiles (95% CI)
518 (514 to 522)
561 (557 to 565) ↑ 8.3*
(7.2 to 9.4) 43*
(37 to 49) 479
(475 to 483) 487
(483 to 491) ↑ 1.7* (0.6 to 2.8)
8* (3 to 14)
Q1 (95% CI)
828 (817 to 839)
867 (855 to 878) ↑ 4.7*
(2.7 to 6.6) 39*
(23 to 54) 755
(744 to 765) 740
(729 to 750) — — —
Q1 (95% CI)
365 (358 to 373)
404 (396 to 412) ↑ 10.5*
(7.2 to 13.7) 38*
(27 to 49) 335
(327 to 342) 367
(359 to 374) ↑ 9.6* (6.4 to 12.8)
32* (22 to 42)
Trends in Inequality, by Sex
• For women, income-related inequality for Mental Illness Hospitalization decreased on both the relative and absolute scales between 2006 and 2012.
• For men, income-related inequality for Mental Illness Hospitalization decreased on only the relative scale.
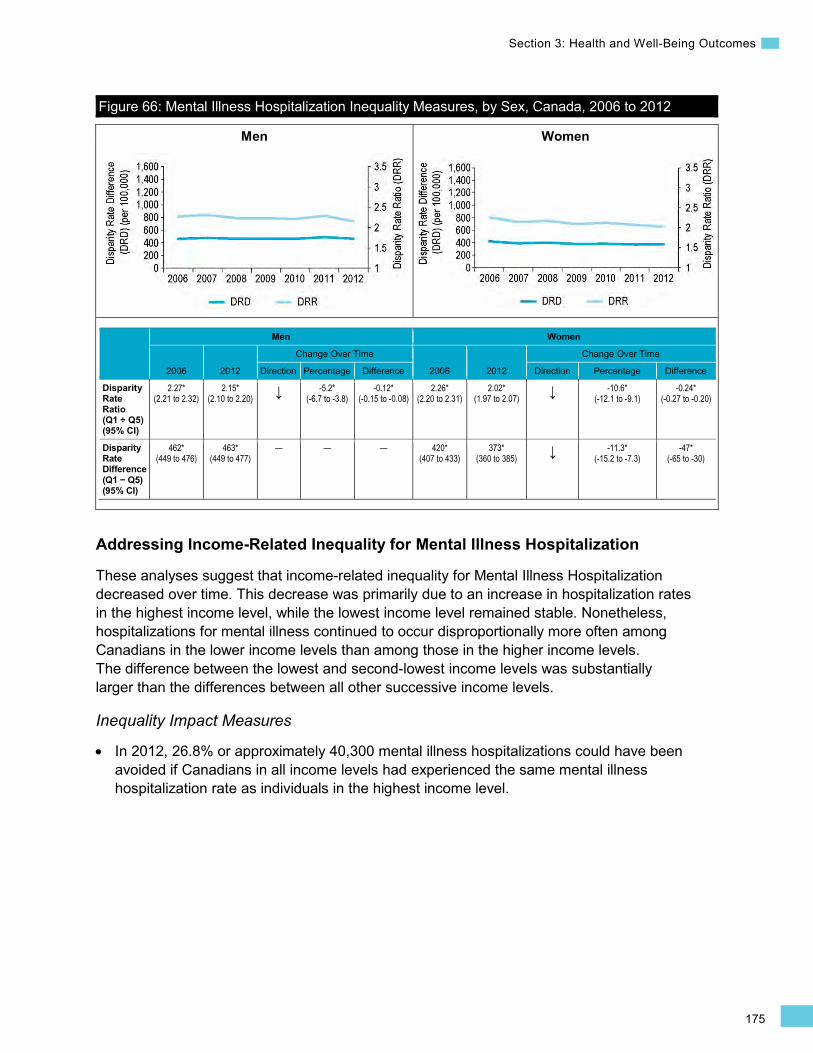
175
Section 3: Health and Well-Being Outcomes
Men Women
Figure 66: Mental Illness Hospitalization Inequality Measures, by Sex, Canada, 2006 to 2012
Men Women
2006 2012
Change Over Time
2006 2012
Change Over Time
Direction Percentage Difference Direction Percentage Difference
Disparity Rate Ratio (Q1 ÷ Q5) (95% CI)
2.27* (2.21 to 2.32)
2.15* (2.10 to 2.20) ↓ -5.2*
(-6.7 to -3.8) -0.12*
(-0.15 to -0.08) 2.26*
(2.20 to 2.31) 2.02*
(1.97 to 2.07) ↓ -10.6* (-12.1 to -9.1)
-0.24* (-0.27 to -0.20)
Disparity Rate Difference (Q1 − Q5) (95% CI)
462* (449 to 476)
463* (449 to 477)
— — — 420* (407 to 433)
373* (360 to 385) ↓ -11.3*
(-15.2 to -7.3) -47*
(-65 to -30)
Addressing Income-Related Inequality for Mental Illness Hospitalization
These analyses suggest that income-related inequality for Mental Illness Hospitalization decreased over time. This decrease was primarily due to an increase in hospitalization rates in the highest income level, while the lowest income level remained stable. Nonetheless, hospitalizations for mental illness continued to occur disproportionally more often among Canadians in the lower income levels than among those in the higher income levels. The difference between the lowest and second-lowest income levels was substantially larger than the differences between all other successive income levels.
Inequality Impact Measures
In 2012, 26.8% or approximately 40,300 mental illness hospitalizations could have been avoided if Canadians in all income levels had experienced the same mental illness hospitalization rate as individuals in the highest income level.
•

176
Trends in Income-Related Health Inequalities in Canada
Table 12: Mental Illness Hospitalization Inequality Impact Measures, Canada, 2006 to 2012
Both Sexes Men Women 2006 2012 2006 2012 2006 2012
Potential Rate Reduction (Percentage)‡‡ (95% CI)
30.3* (29.3 to 31.3)
26.8* (25.9 to 27.8)
29.8* (28.4 to 31.1)
28.3* (27.0 to 29.6)
30.8* (29.4 to 32.2)
25.3* (23.9 to 26.6)
Population Impact Number 43,300 40,300 21,800 22,400 21,500 17,900
Note ‡‡ Also known as “population-attributable fraction.”
Approaches for Addressing Inequality
The relationship between low income and mental illness is complex. Mental illness is a risk factor for low income, and low income is a risk factor for mental illness.483, 484 For example, mental illness can limit a person’s opportunities for education and employment, which may limit his or her income-earning potential.485 Poverty reduction policies and programs can help to mitigate the consequences of mental illness, such as by supporting employment attainment and retention.486
In Changing Directions, Changing Lives: The Mental Health Strategy for Canada, the Mental Health Commission of Canada identified reducing inequalities in risk factors for mental illness and improving access to mental health services as a strategic direction.475 Providing mental health care in the community, involving persons with mental illness and their families in the design and delivery of services, and improving financial supports and housing are a few examples of key priorities cited for improving mental health care.475, 487, 488 Intersectoral action and strengthening the relationships between health care professionals and community services (e.g., police services) are also key mechanisms to improve the health and well-being of those living with mental illnesses.475, 489 An example of a community-based intervention for addressing mental illness is outlined in Box 17.
As mentioned, the current best practice for the appropriate and effective treatment of mental illness is to receive care in the community, thus minimizing the need for hospitalization.475, 490 This improves the quality of life of individuals with mental illness, reduces the amount of time spent in hospital settings and reduces the overall burden and costs associated with mental illness hospitalizations.475, 490 If mental illness is being effectively managed and treated in community and primary health care settings, then a reduction in Mental Illness Hospitalization rates would be expected. However, a decrease in the Mental Illness Hospitalization indicator could also reflect an access issue wherein fewer people are receiving treatment for mental illness, either in the community or in a hospital setting. Without this contextual information about the extent and availability of treatment for mental illness in the community, interpretations based on the Mental Illness Hospitalization indicator should be made with caution.

177
Section 3: Health and Well-Being Outcomes
Box 17: Integrated Mobile Crisis Response Team, Vancouver Island, British Columbia, 2004 Issue: The importance of diverting mental health care away from institutions to community-based services is widely recognized across Canada; however, the availability of programs across provinces and territories is not consistent.488, 491 Coordinating mental health policies across governments and across sectors is a strategic priority in Changing Directions, Changing Lives: The Mental Health Strategy for Canada.475
Intervention: The Integrated Mobile Crisis Response Team (IMCRT) of Vancouver Island Health Authority provides emergency mental health services to individuals and families who are experiencing mental health and addiction issues. The IMCRT is made up of a multidisciplinary team of nursing, law enforcement, social work, psychology and child/youth care professionals. The IMCRT recognizes the value of delivering mental health services in the community and promotes intersectoral collaboration among police officers and other health professionals for the appropriate care for persons experiencing a mental health crisis.492
Rationale/Evidence: Community-based crisis response teams employ mechanisms ranging from phone lines to walk-in centres and hospital protocols488 to support patients and minimize the use of hospital resources for those who could be treated in a community setting.493 An evaluation of the program found that the IMCRT helped decrease emergency department visits for persons with mental health and addiction issues; for those who did present to the emergency department, wait times were less than half the time reported in the absence of assistance from a crisis team member.492
How Did Income-Related Inequality for Mental Illness Hospitalization Change Between 2006 and 2012 by Province?
• This indicator captures inpatient treatment at general hospitals and psychiatric facilities for selected mental illnesses; however, data capture from psychiatric facilities varies by province and may have changed over time. As a result, comparisons across provinces should be made with caution.
• Income-related inequality for Mental Illness Hospitalization persisted over time on both the relative and absolute scales in British Columbia, Saskatchewan, Quebec, New Brunswick and Newfoundland and Labrador. However, rate trends by income level varied across these provinces. In British Columbia and New Brunswick, hospitalization rates increased in the lowest income level. In Quebec, rates decreased in the highest and lowest income levels. In Saskatchewan and Newfoundland and Labrador, hospitalization rates did not change in the highest and lowest income levels.
• Income-related inequality for Mental Illness Hospitalization decreased on both the relative and absolute scales in Nova Scotia, because hospitalization rates decreased in the lowest income level.
• Income-related inequality for Mental Illness Hospitalization decreased on the relative scale and persisted on the absolute scale in Ontario, while rates increased in both the highest and lowest income levels.
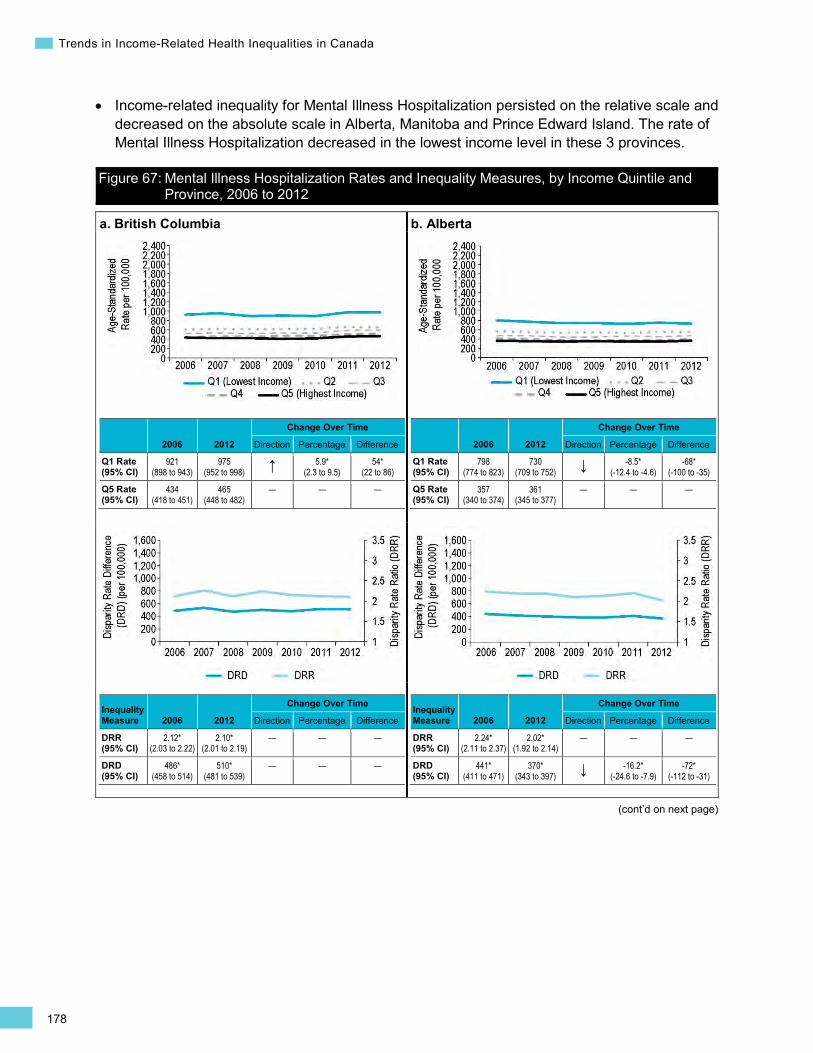
178
Trends in Income-Related Health Inequalities in Canada
(cont’d on next page)
• Income-related inequality for Mental Illness Hospitalization persisted on the relative scale and decreased on the absolute scale in Alberta, Manitoba and Prince Edward Island. The rate of Mental Illness Hospitalization decreased in the lowest income level in these 3 provinces.
Figure 67: Mental Illness Hospitalization Rates and Inequality Measures, by Income Quintile and Province, 2006 to 2012
a. British Columbia
2006 2012
Change Over Time
Direction Percentage Difference
Q1 Rate (95% CI)
921 (898 to 943)
975 (952 to 998) ↑ 5.9*
(2.3 to 9.5) 54*
(22 to 86)
Q5 Rate (95% CI)
434 (418 to 451)
465 (448 to 482)
— — —
Inequality Measure 2006 2012
Change Over Time
Direction Percentage Difference
DRR (95% CI)
2.12* (2.03 to 2.22)
2.10* (2.01 to 2.19)
— — —
DRD (95% CI)
486* (458 to 514)
510* (481 to 539)
— — —
b. Alberta
2006 2012
Change Over Time
Direction Percentage Difference
Q1 Rate (95% CI)
798 (774 to 823)
730 (709 to 752) ↓ -8.5*
(-12.4 to -4.6) -68*
(-100 to -35)
Q5 Rate (95% CI)
357 (340 to 374)
361 (345 to 377)
— — —
Inequality Measure 2006 2012
Change Over Time
Direction Percentage Difference
DRR (95% CI)
2.24* (2.11 to 2.37)
2.02* (1.92 to 2.14)
— — —
DRD (95% CI)
441* (411 to 471)
370* (343 to 397) ↓ -16.2*
(-24.6 to -7.9) -72*
(-112 to -31)
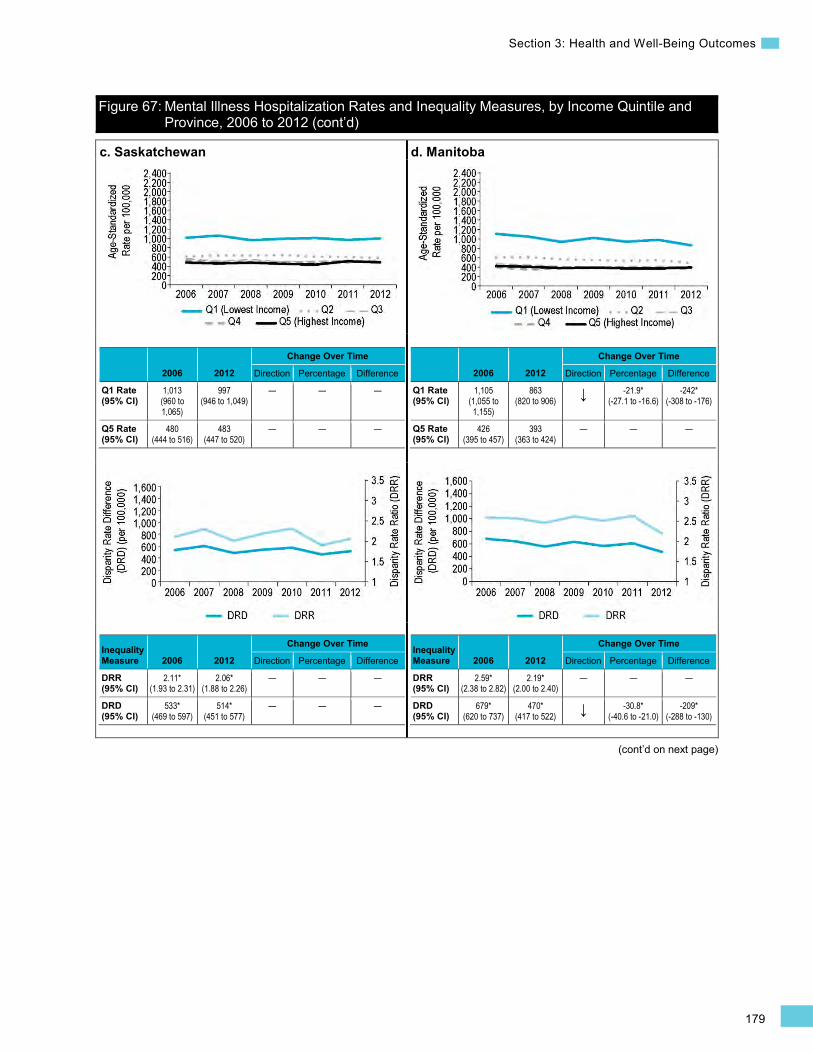
179
Section 3: Health and Well-Being Outcomes
Figure 67: Mental Illness Hospitalization Rates and Inequality Measures, by Income Quintile and Province, 2006 to 2012 (cont’d)
(cont’d on next page)
c. Saskatchewan
2006 2012
Change Over Time
Direction Percentage Difference
Q1 Rate (95% CI)
1,013 (960 to 1,065)
997 (946 to 1,049)
— — —
Q5 Rate (95% CI)
480 (444 to 516)
483 (447 to 520)
— — —
Inequality Measure 2006 2012
Change Over Time
Direction Percentage Difference
DRR (95% CI)
2.11* (1.93 to 2.31)
2.06* (1.88 to 2.26)
— — —
DRD (95% CI)
533* (469 to 597)
514* (451 to 577)
— — —
d. Manitoba
2006 2012
Change Over Time
Direction Percentage Difference
Q1 Rate (95% CI)
1,105 (1,055 to 1,155)
863 (820 to 906) ↓ -21.9*
(-27.1 to -16.6) -242*
(-308 to -176)
Q5 Rate (95% CI)
426 (395 to 457)
393 (363 to 424)
— — —
Inequality Measure 2006 2012
Change Over Time
Direction Percentage Difference
DRR (95% CI)
2.59* (2.38 to 2.82)
2.19* (2.00 to 2.40)
— — —
DRD (95% CI)
679* (620 to 737)
470* (417 to 522) ↓ -30.8*
(-40.6 to -21.0) -209*
(-288 to -130)
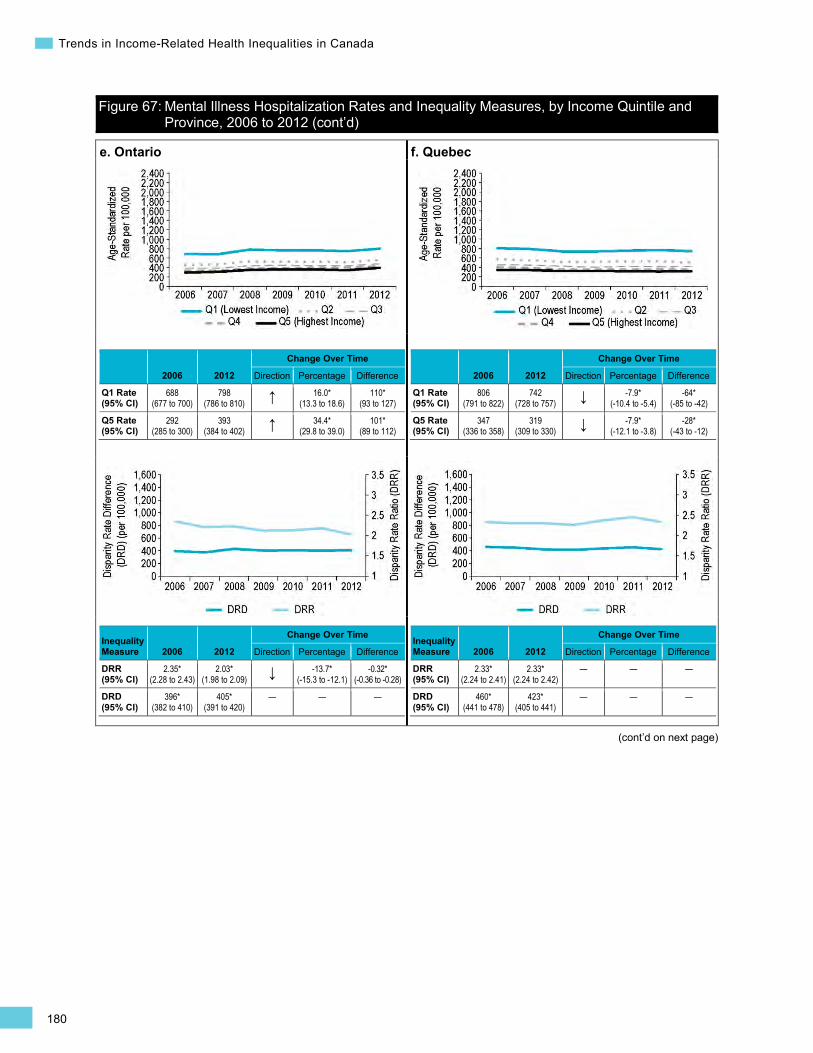
180
Trends in Income-Related Health Inequalities in Canada
Figure 67: Mental Illness Hospitalization Rates and Inequality Measures, by Income Quintile and Province, 2006 to 2012 (cont’d)
(cont’d on next page)
e. Ontario
2006 2012
Change Over Time
Direction Percentage Difference
Q1 Rate (95% CI)
688 (677 to 700)
798 (786 to 810) ↑ 16.0*
(13.3 to 18.6) 110*
(93 to 127)
Q5 Rate (95% CI)
292 (285 to 300)
393 (384 to 402) ↑ 34.4*
(29.8 to 39.0) 101*
(89 to 112)
Inequality Measure 2006 2012
Change Over Time
Direction Percentage Difference
DRR (95% CI)
2.35* (2.28 to 2.43)
2.03* (1.98 to 2.09) ↓ -13.7*
(-15.3 to -12.1) -0.32*
(-0.36 to -0.28)
DRD (95% CI)
396* (382 to 410)
405* (391 to 420)
— — —
f. Quebec
2006 2012
Change Over Time
Direction Percentage Difference
Q1 Rate (95% CI)
806 (791 to 822)
742 (728 to 757) ↓ -7.9*
(-10.4 to -5.4) -64*
(-85 to -42)
Q5 Rate (95% CI)
347 (336 to 358)
319 (309 to 330) ↓ -7.9*
(-12.1 to -3.8) -28*
(-43 to -12)
Inequality Measure 2006 2012
Change Over Time
Direction Percentage Difference
DRR (95% CI)
2.33* (2.24 to 2.41)
2.33* (2.24 to 2.42)
— — —
DRD (95% CI)
460* (441 to 478)
423* (405 to 441)
— — —
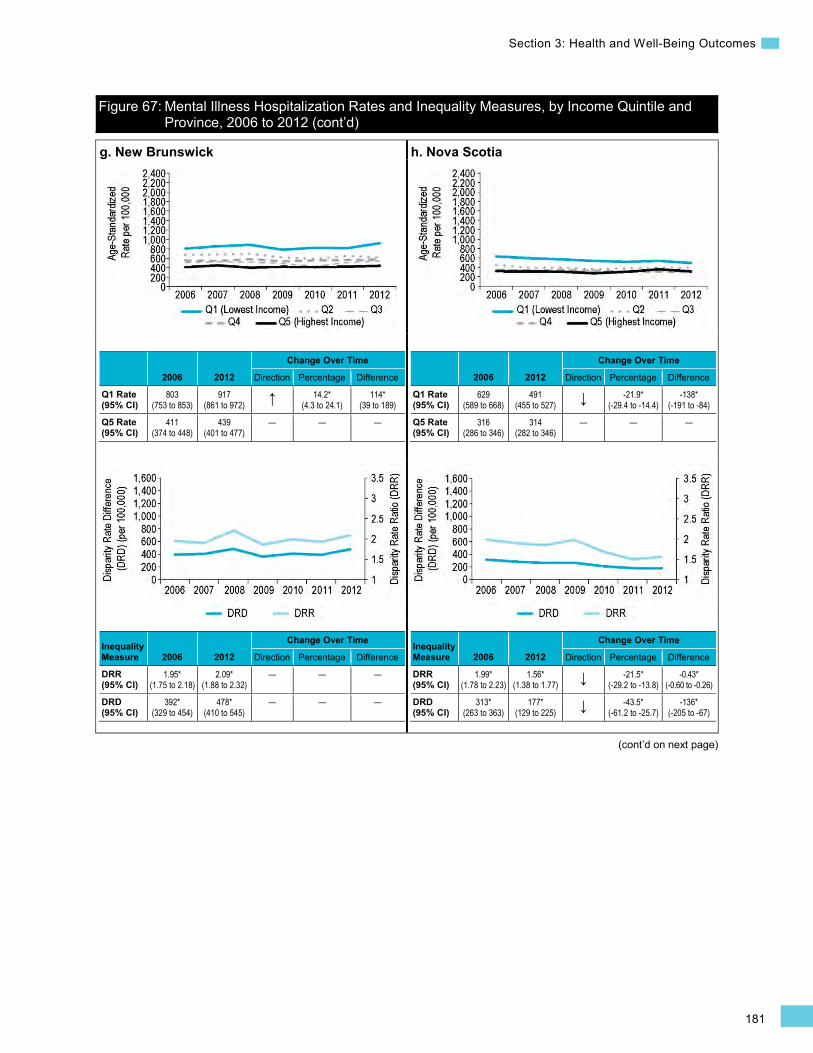
181
Section 3: Health and Well-Being Outcomes
Figure 67: Mental Illness Hospitalization Rates and Inequality Measures, by Income Quintile and Province, 2006 to 2012 (cont’d)
(cont’d on next page)
g. New Brunswick
2006 2012
Change Over Time
Direction Percentage Difference
Q1 Rate (95% CI)
803 (753 to 853)
917 (861 to 972) ↑ 14.2*
(4.3 to 24.1) 114*
(39 to 189)
Q5 Rate (95% CI)
411 (374 to 448)
439 (401 to 477)
— — —
Inequality Measure 2006 2012
Change Over Time
Direction Percentage Difference
DRR (95% CI)
1.95* (1.75 to 2.18)
2.09* (1.88 to 2.32)
— — —
DRD (95% CI)
392* (329 to 454)
478* (410 to 545)
— — —
h. Nova Scotia
2006 2012
Change Over Time
Direction Percentage Difference
Q1 Rate (95% CI)
629 (589 to 668)
491 (455 to 527) ↓ -21.9*
(-29.4 to -14.4) -138*
(-191 to -84)
Q5 Rate (95% CI)
316 (286 to 346)
314 (282 to 346)
— — —
Inequality Measure 2006 2012
Change Over Time
Direction Percentage Difference
DRR (95% CI)
1.99* (1.78 to 2.23)
1.56* (1.38 to 1.77) ↓ -21.5*
(-29.2 to -13.8) -0.43*
(-0.60 to -0.26)
DRD (95% CI)
313* (263 to 363)
177* (129 to 225) ↓ -43.5*
(-61.2 to -25.7) -136*
(-205 to -67)
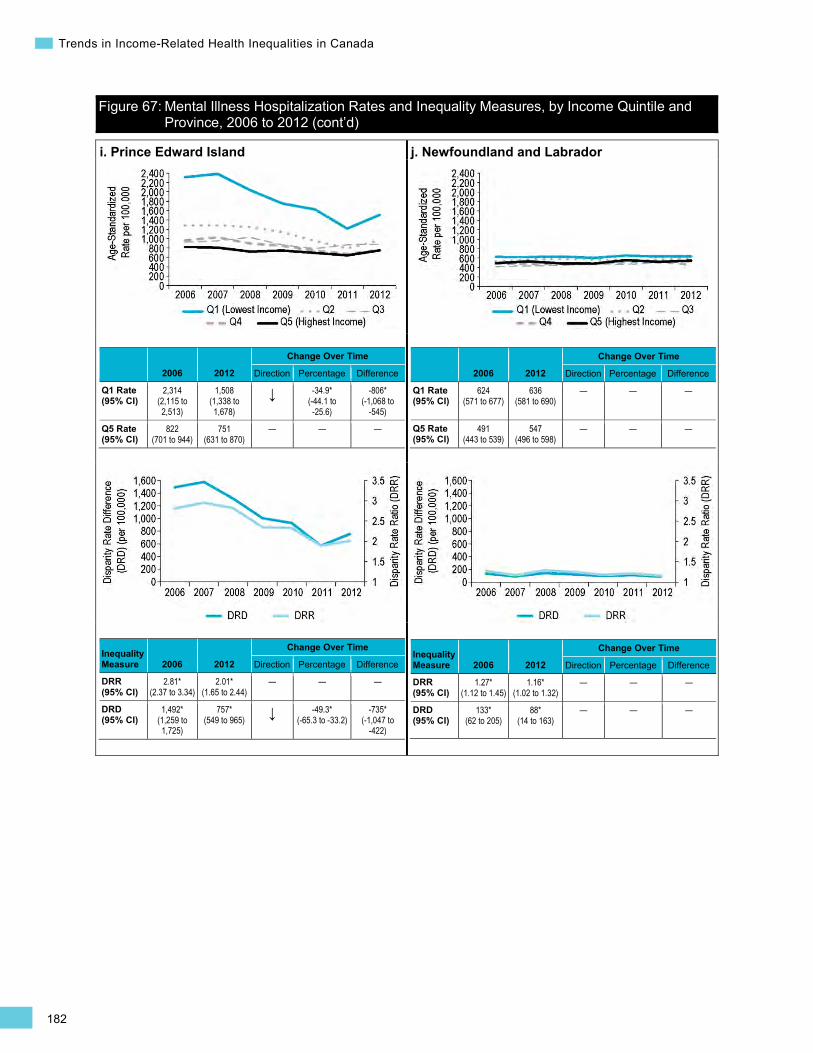
182
Trends in Income-Related Health Inequalities in Canada
Figure 67: Mental Illness Hospitalization Rates and Inequality Measures, by Income Quintile and Province, 2006 to 2012 (cont’d)
i. Prince Edward Island
2006 2012
Change Over Time
Direction Percentage Difference
Q1 Rate (95% CI)
2,314 (2,115 to 2,513)
1,508 (1,338 to 1,678)
↓ -34.9* (-44.1 to -25.6)
-806* (-1,068 to
-545)
Q5 Rate (95% CI)
822 (701 to 944)
751 (631 to 870)
— — —
Inequality Measure 2006 2012
Change Over Time
Direction Percentage Difference
DRR (95% CI)
2.81* (2.37 to 3.34)
2.01* (1.65 to 2.44)
— — —
DRD (95% CI)
1,492* (1,259 to 1,725)
757* (549 to 965) ↓ -49.3*
(-65.3 to -33.2) -735*
(-1,047 to -422)
j. Newfoundland and Labrador
2006 2012
Change Over Time
Direction Percentage Difference
Q1 Rate (95% CI)
624 (571 to 677)
636 (581 to 690)
— — —
Q5 Rate (95% CI)
491 (443 to 539)
547 (496 to 598)
— — —
Inequality Measure 2006 2012
Change Over Time
Direction Percentage Difference
DRR (95% CI)
1.27* (1.12 to 1.45)
1.16* (1.02 to 1.32)
— — —
DRD (95% CI)
133* (62 to 205)
88* (14 to 163)
— — —
183
Section 3: Health and Well-Being Outcomes
Alcohol-Attributable Hospitalization Background
The Alcohol-Attributable Hospitalization indicator captures inpatient treatment at general hospitals for chronic diseases or conditions that have been classified as entirely attributable to alcohol,494 excluding alcohol-related injuries (including motor vehicle–related ones) and suicides. It is calculated for individuals age 15 and older and is expressed as a separation rate (including discharges, deaths, sign-outs and transfers) per 100,000 Canadians. Using this definition, mental and behavioural disorders (e.g., acute intoxication, withdrawal, dependence syndrome) are the most common reason Canadians require hospitalization for an alcohol-attributable disease or condition, responsible for approximately 60% of all alcohol-attributable hospitalizations between 2007 and 2012. This is followed by acute pancreatitis and liver cirrhosis, each causing approximately 11% of all alcohol-attributable hospitalizations. Notably, alcohol-attributable hospitalizations for mental and behavioural disorders are also captured in the Mental Illness Hospitalization indicator in this report, making up approximately 16% of these mental illness hospitalizations.
There is a well-established and growing body of evidence demonstrating that certain patterns of alcohol consumption cause or contribute to the development of many health conditions and diseases.495–497 Indeed, research has linked alcohol consumption to more than 60 disease conditions; however, it is important to note that the rates of Alcohol-Attributable Hospitalization reported here are due to conditions where alcohol is defined as the necessary cause (i.e., 100% attributable to alcohol).498
The amount of alcohol consumed and patterns of alcohol consumption (e.g., binge drinking) influence the type of alcohol-related harm that individuals may experience.495, 497, 499 The Canadian guideline for low-risk drinking from the Canadian Centre for Substance Abuse provides general strategies to limit harmful patterns of alcohol consumption, as well as sex-specific recommendations regarding upper thresholds for daily and weekly drinking.500 For women, the recommended drinking range is 0 to 2 standard drinksxi a day and a maximum of 10 standard drinks per week, whereas for men it is 0 to 3 standard drinks a day, with no more than 15 standard drinks per week.500 Nevertheless, risky patterns of alcohol consumption, such as binge drinking and heavy alcohol consumption, have been reported within the Canadian population.501,
502 For example, in 2009–2010, approximately 30% of past-year male drinkers and 20% of past-year female drinkers reported consuming 5 or more standard drinks on 1 occasion.501, 503
xi. In Canada, a standard drink refers to quantities of alcoholic beverages containing 13.45 g or 17.05 ml of ethanol: for beer, cider or coolers, a standard drink is equal to 341 ml (12 oz.); for wine, a standard drink is equal to 142 ml (5 oz.); and for distilled liquor, a standard drink is equal to 43 ml (1.5 oz.).500
Excessive and/or chronic alcohol consumption has substantial health and socio-economic consequences. For example, alcohol has been identified as 1 of the leading risk factors for premature mortality in higher-income countries such as Canada.504 Moreover, there were approximately 28,000xii acute care hospitalizations in 2012 for a disease or condition for which alcohol was considered a necessary cause. The average cost per hospitalization for an alcohol-
xii. Excludes hospitalization records missing postal code information (approximately 0.2% of all records).
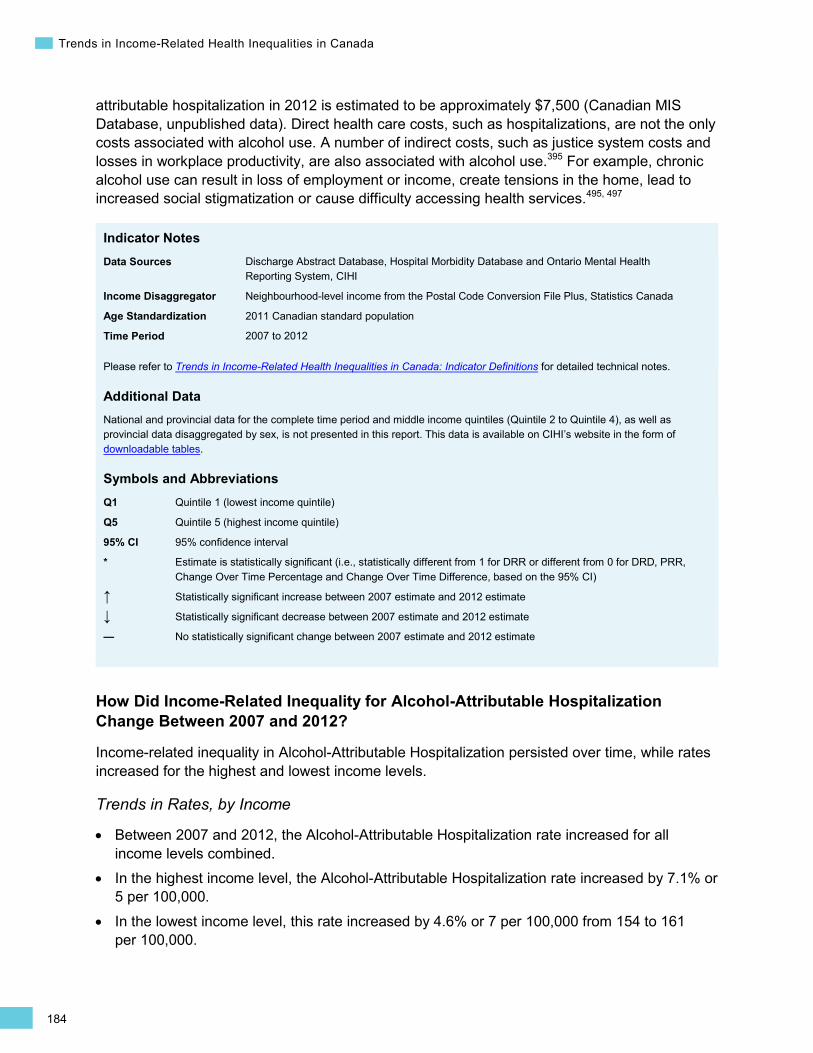
184
Trends in Income-Related Health Inequalities in Canada
attributable hospitalization in 2012 is estimated to be approximately $7,500 (Canadian MIS Database, unpublished data). Direct health care costs, such as hospitalizations, are not the only costs associated with alcohol use. A number of indirect costs, such as justice system costs and losses in workplace productivity, are also associated with alcohol use.395 For example, chronic alcohol use can result in loss of employment or income, create tensions in the home, lead to increased social stigmatization or cause difficulty accessing health services.495, 497
Indicator Notes Data Sources Discharge Abstract Database, Hospital Morbidity Database and Ontario Mental Health
Reporting System, CIHI
Income Disaggregator Neighbourhood-level income from the Postal Code Conversion File Plus, Statistics Canada
Age Standardization 2011 Canadian standard population
Time Period 2007 to 2012
Please refer to Trends in Income-Related Health Inequalities in Canada: Indicator Definitions for detailed technical notes.
Additional Data National and provincial data for the complete time period and middle income quintiles (Quintile 2 to Quintile 4), as well as provincial data disaggregated by sex, is not presented in this report. This data is available on CIHI’s website in the form of downloadable tables.
Symbols and Abbreviations
* Estimate is statistically significant (i.e., statistically different from 1 for DRR or different from 0 for DRD, PRR, Change Over Time Percentage and Change Over Time Difference, based on the 95% CI)
Q1 Quintile 1 (lowest income quintile)
Q5 Quintile 5 (highest income quintile)
95% CI 95% confidence interval
↑ Statistically significant increase between 2007 estimate and 2012 estimate
↓ Statistically significant decrease between 2007 estimate and 2012 estimate
— No statistically significant change between 2007 estimate and 2012 estimate
How Did Income-Related Inequality for Alcohol-Attributable Hospitalization Change Between 2007 and 2012?
Income-related inequality in Alcohol-Attributable Hospitalization persisted over time, while rates increased for the highest and lowest income levels.
Trends in Rates, by Income
• Between 2007 and 2012, the Alcohol-Attributable Hospitalization rate increased for all income levels combined.
• In the highest income level, the Alcohol-Attributable Hospitalization rate increased by 7.1% or 5 per 100,000.
• In the lowest income level, this rate increased by 4.6% or 7 per 100,000 from 154 to 161 per 100,000.
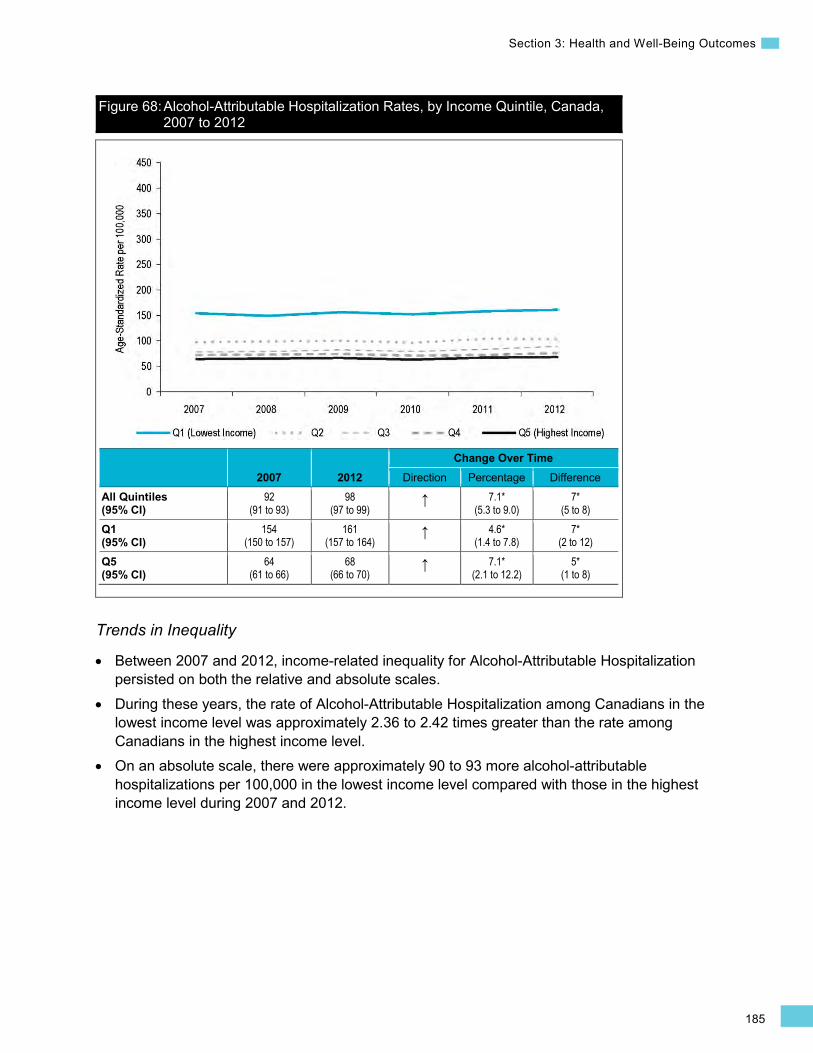
185
Section 3: Health and Well-Being Outcomes
Figure 68: Alcohol-Attributable Hospitalization Rates, by Income Quintile, Canada, 2007 to 2012
2007 2012 Change Over Time
Direction Percentage Difference All Quintiles (95% CI)
92 (91 to 93)
98 (97 to 99)
↑ 7.1* (5.3 to 9.0)
7* (5 to 8)
Q1 (95% CI)
154 (150 to 157)
161 (157 to 164)
↑ 4.6* (1.4 to 7.8)
7* (2 to 12)
Q5 (95% CI)
64 (61 to 66)
68 (66 to 70)
↑ 7.1* (2.1 to 12.2)
5* (1 to 8)
Trends in Inequality
• Between 2007 and 2012, income-related inequality for Alcohol-Attributable Hospitalization persisted on both the relative and absolute scales.
• During these years, the rate of Alcohol-Attributable Hospitalization among Canadians in the lowest income level was approximately 2.36 to 2.42 times greater than the rate among Canadians in the highest income level.
• On an absolute scale, there were approximately 90 to 93 more alcohol-attributable hospitalizations per 100,000 in the lowest income level compared with those in the highest income level during 2007 and 2012.
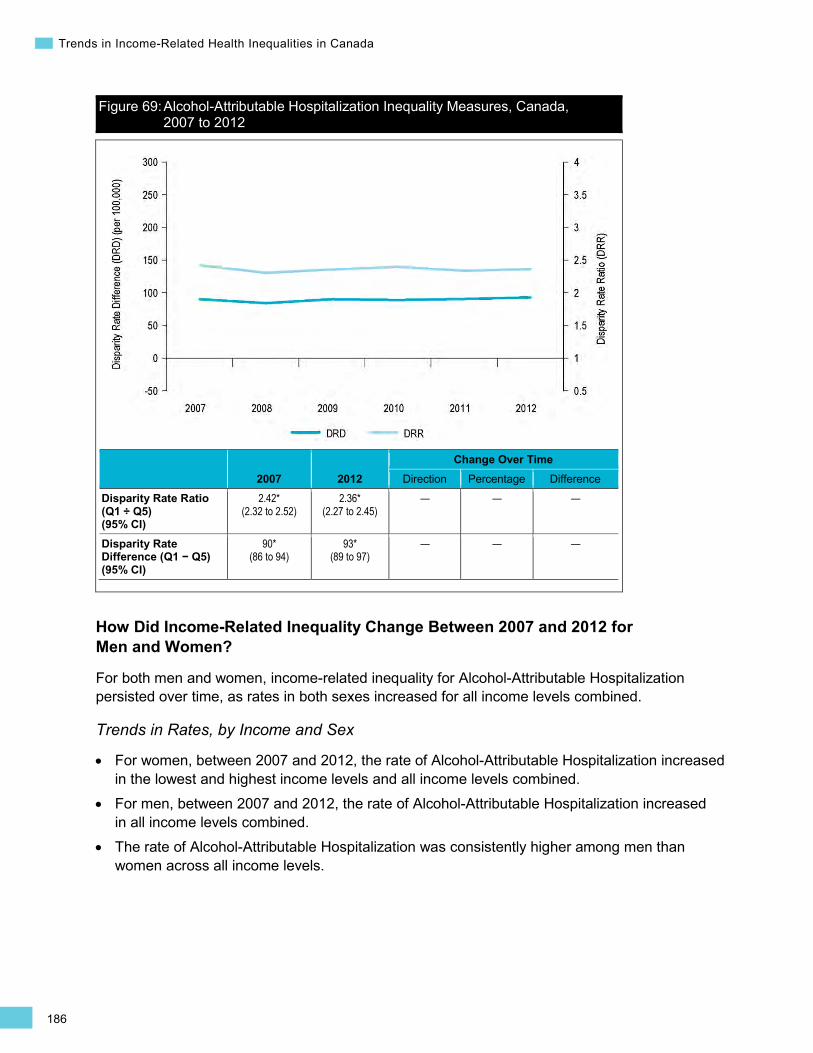
186
Trends in Income-Related Health Inequalities in Canada
Figure 69: Alcohol-Attributable Hospitalization Inequality Measures, Canada, 2007 to 2012
2007 2012 Change Over Time
Direction Percentage Difference Disparity Rate Ratio (Q1 ÷ Q5) (95% CI)
2.42* (2.32 to 2.52)
2.36* (2.27 to 2.45)
— — —
Disparity Rate Difference (Q1 − Q5) (95% CI)
90* (86 to 94)
93* (89 to 97)
— — —
How Did Income-Related Inequality Change Between 2007 and 2012 for Men and Women?
For both men and women, income-related inequality for Alcohol-Attributable Hospitalization persisted over time, as rates in both sexes increased for all income levels combined.
Trends in Rates, by Income and Sex
• For women, between 2007 and 2012, the rate of Alcohol-Attributable Hospitalization increased in the lowest and highest income levels and all income levels combined.
• For men, between 2007 and 2012, the rate of Alcohol-Attributable Hospitalization increased in all income levels combined.
• The rate of Alcohol-Attributable Hospitalization was consistently higher among men than women across all income levels.
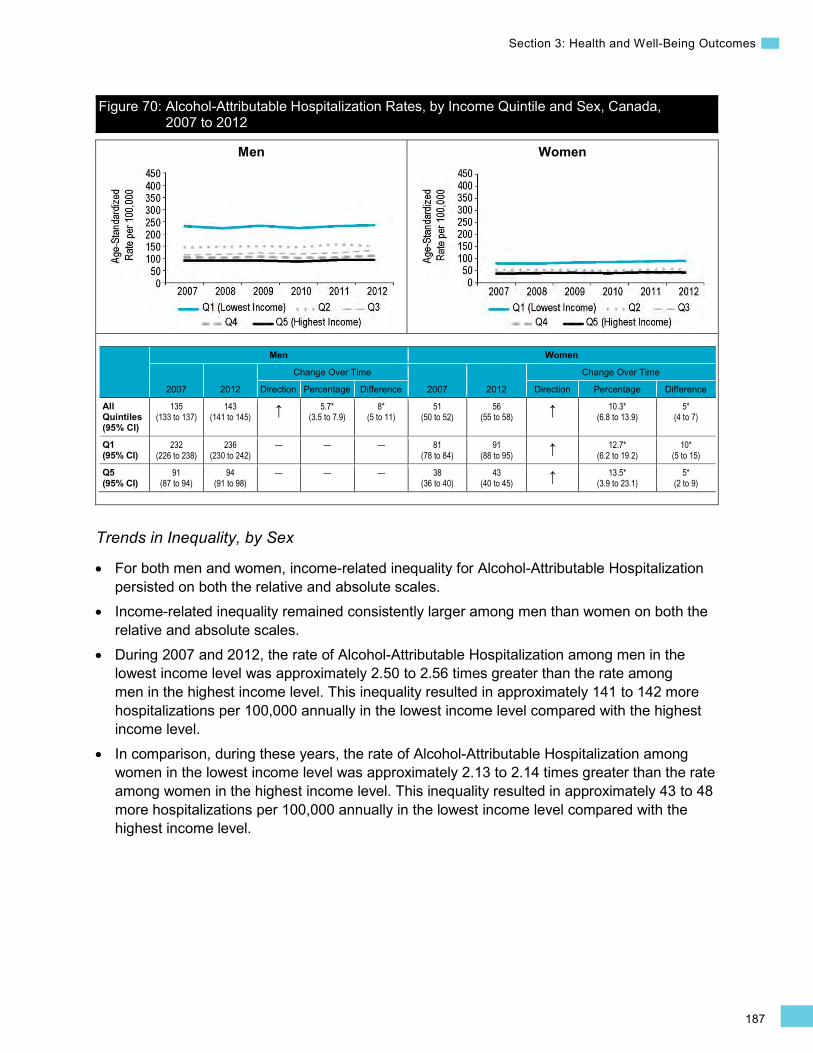
187
Section 3: Health and Well-Being Outcomes
Men Women
Figure 70: Alcohol-Attributable Hospitalization Rates, by Income Quintile and Sex, Canada, 2007 to 2012
Men Women
2007 2012
Change Over Time
2007 2012
Change Over Time
Direction Percentage Difference Direction Percentage Difference
All Quintiles (95% CI)
135 (133 to 137)
143 (141 to 145) ↑ 5.7*
(3.5 to 7.9) 8*
(5 to 11) 51
(50 to 52) 56
(55 to 58) ↑ 10.3* (6.8 to 13.9)
5* (4 to 7)
Q1 (95% CI)
232 (226 to 238)
236 (230 to 242)
— — — 81 (78 to 84)
91 (88 to 95) ↑ 12.7*
(6.2 to 19.2) 10*
(5 to 15)
Q5 (95% CI)
91 (87 to 94)
94 (91 to 98)
— — — 38 (36 to 40)
43 (40 to 45) ↑ 13.5*
(3.9 to 23.1) 5*
(2 to 9)
Trends in Inequality, by Sex
• For both men and women, income-related inequality for Alcohol-Attributable Hospitalization persisted on both the relative and absolute scales.
• Income-related inequality remained consistently larger among men than women on both the relative and absolute scales.
• During 2007 and 2012, the rate of Alcohol-Attributable Hospitalization among men in the lowest income level was approximately 2.50 to 2.56 times greater than the rate among men in the highest income level. This inequality resulted in approximately 141 to 142 more hospitalizations per 100,000 annually in the lowest income level compared with the highest income level.
• In comparison, during these years, the rate of Alcohol-Attributable Hospitalization among women in the lowest income level was approximately 2.13 to 2.14 times greater than the rate among women in the highest income level. This inequality resulted in approximately 43 to 48 more hospitalizations per 100,000 annually in the lowest income level compared with the highest income level.
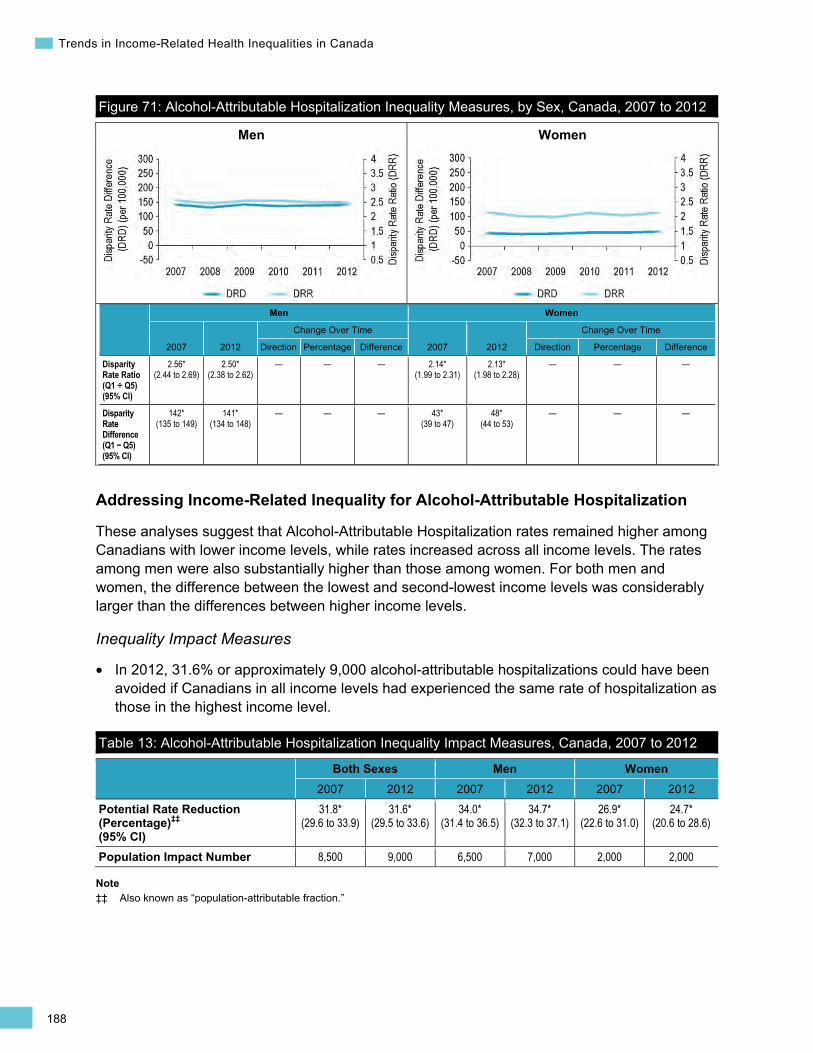
188
Trends in Income-Related Health Inequalities in Canada
Men Women
Figure 71: Alcohol-Attributable Hospitalization Inequality Measures, by Sex, Canada, 2007 to 2012
Men Women
2007 2012
Change Over Time
2007 2012
Change Over Time
Direction Percentage Difference Direction Percentage Difference
Disparity Rate Ratio (Q1 ÷ Q5) (95% CI)
2.56* (2.44 to 2.69)
2.50* (2.38 to 2.62)
— — — 2.14* (1.99 to 2.31)
2.13* (1.98 to 2.28)
— — —
Disparity Rate Difference (Q1 − Q5) (95% CI)
142* (135 to 149)
141* (134 to 148)
— — — 43* (39 to 47)
48* (44 to 53)
— — —
Addressing Income-Related Inequality for Alcohol-Attributable Hospitalization
These analyses suggest that Alcohol-Attributable Hospitalization rates remained higher among Canadians with lower income levels, while rates increased across all income levels. The rates among men were also substantially higher than those among women. For both men and women, the difference between the lowest and second-lowest income levels was considerably larger than the differences between higher income levels.
Inequality Impact Measures
In 2012, 31.6% or approximately 9,000 alcohol-attributable hospitalizations could have been avoided if Canadians in all income levels had experienced the same rate of hospitalization as those in the highest income level.
Table 13: Alcohol-Attributable Hospitalization Inequality Impact Measures, Canada, 2007 to 2012
Both Sexes Men Women 2007 2012 2007 2012 2007 2012
Potential Rate Reduction (Percentage)‡‡ (95% CI)
31.8* (29.6 to 33.9)
31.6* (29.5 to 33.6)
34.0* (31.4 to 36.5)
34.7* (32.3 to 37.1)
26.9* (22.6 to 31.0)
24.7* (20.6 to 28.6)
Population Impact Number 8,500 9,000 6,500 7,000 2,000 2,000
Note ‡‡ Also known as “population-attributable fraction.”
•
189
Section 3: Health and Well-Being Outcomes
Approaches for Addressing Inequality
Alcohol consumption (i.e., patterns and amount consumed) as well as the potential health consequences are complex and vary by age, sex and social factors such as income level.495, 505 For example, even when drinking patterns in groups across the socio-economic spectrum are similar, the evidence suggests that the negative impacts are higher for individuals in lower socio-economic groups.497, 506 Additional factors that influence the likelihood that individuals will engage in higher-risk alcohol consumption include the availability of alcohol, the cost of alcohol, the drinking context or environment and social norms regarding drinking.501, 505
Lower-income populations are more susceptible to the health consequences associated with alcohol due to a number of factors, such as higher levels of stress, increased exposure to alcohol sales (e.g., density of alcohol retail outlets), higher risk of consuming non-beverage or other low-quality alcohol that contains methanol or other additives, and increased exposure to unsafe drinking settings.495, 507 Moreover, individuals in lower socio-economic groups may be more vulnerable to the negative consequences of drinking because they have fewer resources to cope or may not have a strong social support network.497, 507 Biological factors and health-related consequences of low socio-economic status, such as having nutritional deficiencies or having a comorbidity, also increase an individual’s vulnerability to the harms of alcohol consumption.495, 507 Access or treatment barriers to health services (e.g., inconvenient location of health services, cost of treatment) can also contribute to inequalities in alcohol-related harm.507
Both universal and targeted approaches may be needed to reduce alcohol-attributable harm overall and to address the disproportionate burden of alcohol-attributable harm on lower-income Canadians.508–510 In Canada, a wide range of policies and programs that aims to reduce the consumption of alcohol and alcohol-related harms has been implemented at the national, provincial and local levels.509 Some of these approaches have been universally applied to the general population (e.g., pricing, taxation, availability), while other more targeted approaches (e.g., treatment and prevention programs, wet shelters that allow drinking on the premises) have been implemented and are designed to address the needs of specific populations or groups, such as high-risk drinkers.508, 509, 511 For an example of a targeted program, please see the Kwae Kii Win Centre managed alcohol program described in Box 18.
Despite the breadth of existing alcohol policies and programming in Canada, alcohol consumption has remained stable, and increased slightly for women, over the last decade,501, 512 while alcohol-attributable hospitalizations have increased and income-related inequalities have persisted. Factors such as increased privatization of alcohol sales and more comprehensive, advanced marketing techniques may be counteracting alcohol control efforts.509, 513 To further reduce alcohol-related harm, it has been suggested that collaborative approaches involving different levels and areas of government (e.g., employment and social development, transport, justice, social welfare, education, law enforcement) as well as actors outside government (local communities, non-governmental organizations, the alcohol industry) are needed.510, 514
190
Trends in Income-Related Health Inequalities in Canada
Box 18: Kwae Kii Win Centre Managed Alcohol Program, 2012 to Present Issue: Homeless populations are at a higher risk for numerous physical and mental health problems compared with other populations and are especially vulnerable to the health consequences of risky alcohol consumption.225,
507, 515 A number of barriers to sobriety have been identified for this population group, such as a lack of stable housing, mental illness, length of time addicted to alcohol, lack of social support and refusal of treatment services.516 Homeless populations tend to be high users of emergency medical services as well as police services.233, 516
Intervention: In March 2012, the Kwae Kii Win Centre, a managed alcohol program (MAP), was opened in Shelter House, a social service organization located in Thunder Bay, Ontario. MAPs, such as the Kwae Kii Win Centre, are increasingly being implemented across Canada. A MAP is a type of harm reduction program that seeks to reduce the harms of excessive alcohol use by providing small, regulated doses of alcohol to participants as well as shelter and, in some cases, access to food and health services.517 Harm reduction programs focus on reducing levels of substance use but also have other intended outcomes including, but not limited to, improving access to care, building self-management skills and reducing costs to society.518 The purpose of the Kwae Kii Win Centre MAP was to reduce the alcohol-related harms experienced by the participants and to reduce the use of police, hospital, detoxification and emergency medical services by this population.517
Rationale/Evidence: While participants were engaged in the program, some experienced reductions in alcohol-related harm such as withdrawal seizures. Participants experienced reduced rates of police contacts, hospital admissions and detoxification admissions to hospital.517 The program was also found to help some participants with housing retention and improved mental health and well-being.
How Did Income-Related Inequality for Alcohol-Attributable Hospitalization Change Between 2007 and 2012 by Province?
• Across all provinces, income-related inequality in Alcohol-Attributable Hospitalization persisted over time. However, there were large variations between provinces in terms of the magnitude of inequality.
• Across provinces, hospitalization rates largely remained unchanged over time, with the exception of British Columbia, Alberta, Saskatchewan and Ontario, where rates of Alcohol-Attributable Hospitalization increased in the lowest income level.
• In 2012, inequality in Alcohol-Attributable Hospitalization rates ranged from approximately 1.45 to 1.53 times or 27 to 33 more hospitalizations per 100,000 in the lowest income level compared with the highest in Newfoundland and Labrador and Nova Scotia, to a high of 3.46 times or 268 more hospitalizations per 100,000 in Saskatchewan.
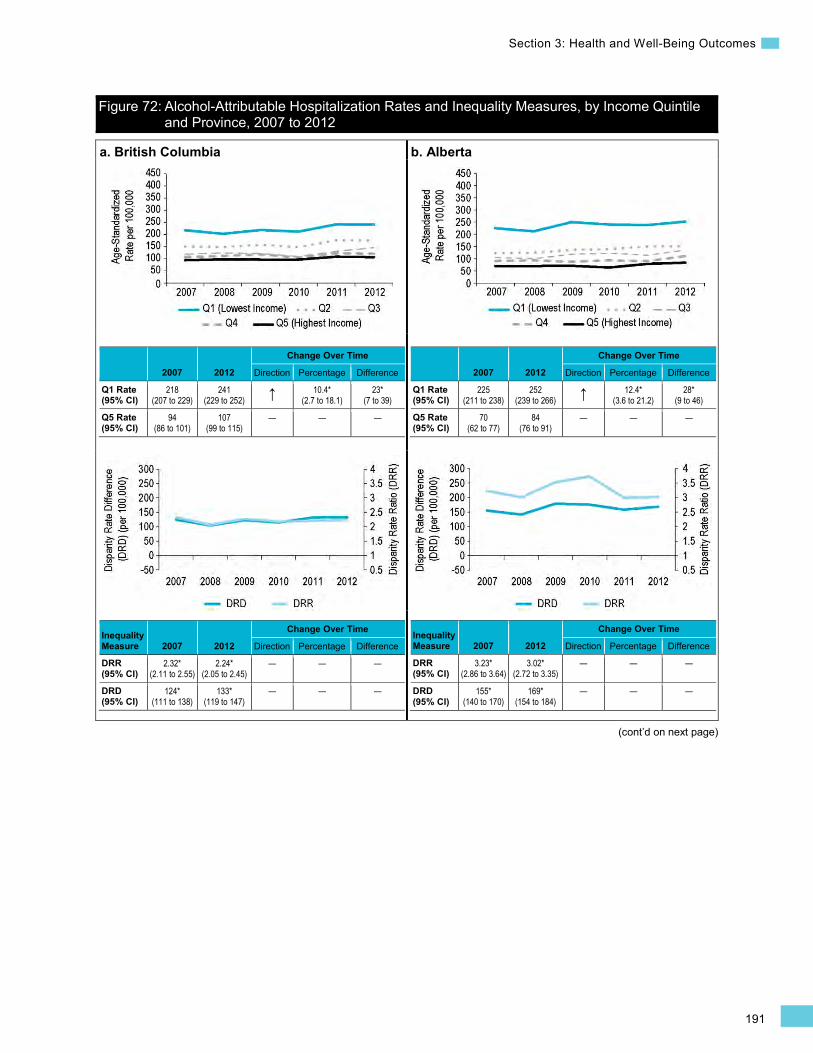
191
Section 3: Health and Well-Being Outcomes
(cont’d on next page)
Figure 72: Alcohol-Attributable Hospitalization Rates and Inequality Measures, by Income Quintile and Province, 2007 to 2012
a. British Columbia
2007 2012
Change Over Time
Direction Percentage Difference
Q1 Rate (95% CI)
218 (207 to 229)
241 (229 to 252) ↑ 10.4*
(2.7 to 18.1) 23*
(7 to 39)
Q5 Rate (95% CI)
94 (86 to 101)
107 (99 to 115)
— — —
Inequality Measure 2007 2012
Change Over Time
Direction Percentage Difference
DRR (95% CI)
2.32* (2.11 to 2.55)
2.24* (2.05 to 2.45)
— — —
DRD (95% CI)
124* (111 to 138)
133* (119 to 147)
— — —
b. Alberta
2007 2012
Change Over Time
Direction Percentage Difference
Q1 Rate (95% CI)
225 (211 to 238)
252 (239 to 266) ↑ 12.4*
(3.6 to 21.2) 28*
(9 to 46)
Q5 Rate (95% CI)
70 (62 to 77)
84 (76 to 91)
— — —
Inequality Measure 2007 2012
Change Over Time
Direction Percentage Difference
DRR (95% CI)
3.23* (2.86 to 3.64)
3.02* (2.72 to 3.35)
— — —
DRD (95% CI)
155* (140 to 170)
169* (154 to 184)
— — —
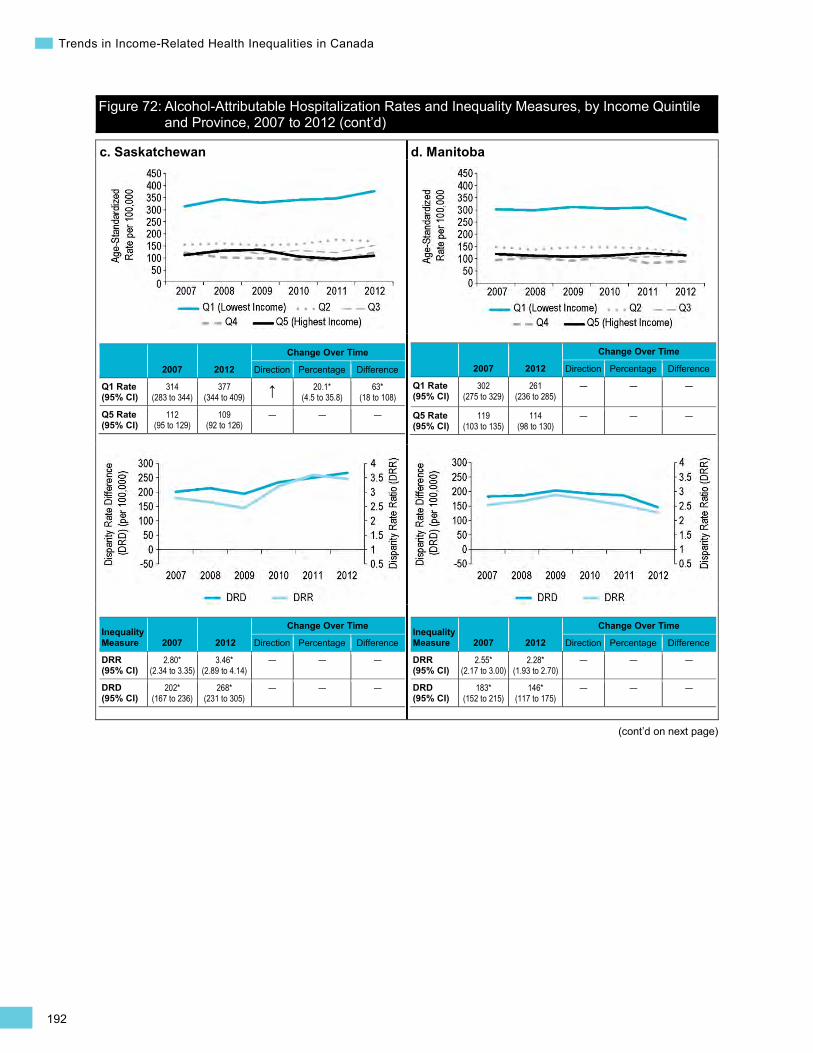
192
Trends in Income-Related Health Inequalities in Canada
Figure 72: Alcohol-Attributable Hospitalization Rates and Inequality Measures, by Income Quintile and Province, 2007 to 2012 (cont’d)
(cont’d on next page)
c. Saskatchewan
2007 2012
Change Over Time
Direction Percentage Difference
Q1 Rate (95% CI)
314 (283 to 344)
377 (344 to 409) ↑ 20.1*
(4.5 to 35.8) 63*
(18 to 108)
Q5 Rate (95% CI)
112 (95 to 129)
109 (92 to 126)
— — —
Inequality Measure 2007 2012
Change Over Time
Direction Percentage Difference
DRR (95% CI)
2.80* (2.34 to 3.35)
3.46* (2.89 to 4.14)
— — —
DRD (95% CI)
202* (167 to 236)
268* (231 to 305)
— — —
d. Manitoba
2007 2012
Change Over Time
Direction Percentage Difference
Q1 Rate (95% CI)
302 (275 to 329)
261 (236 to 285)
— — —
Q5 Rate (95% CI)
119 (103 to 135)
114 (98 to 130)
— — —
Inequality Measure 2007 2012
Change Over Time
Direction Percentage Difference
DRR (95% CI)
2.55* (2.17 to 3.00)
2.28* (1.93 to 2.70)
— — —
DRD (95% CI)
183* (152 to 215)
146* (117 to 175)
— — —
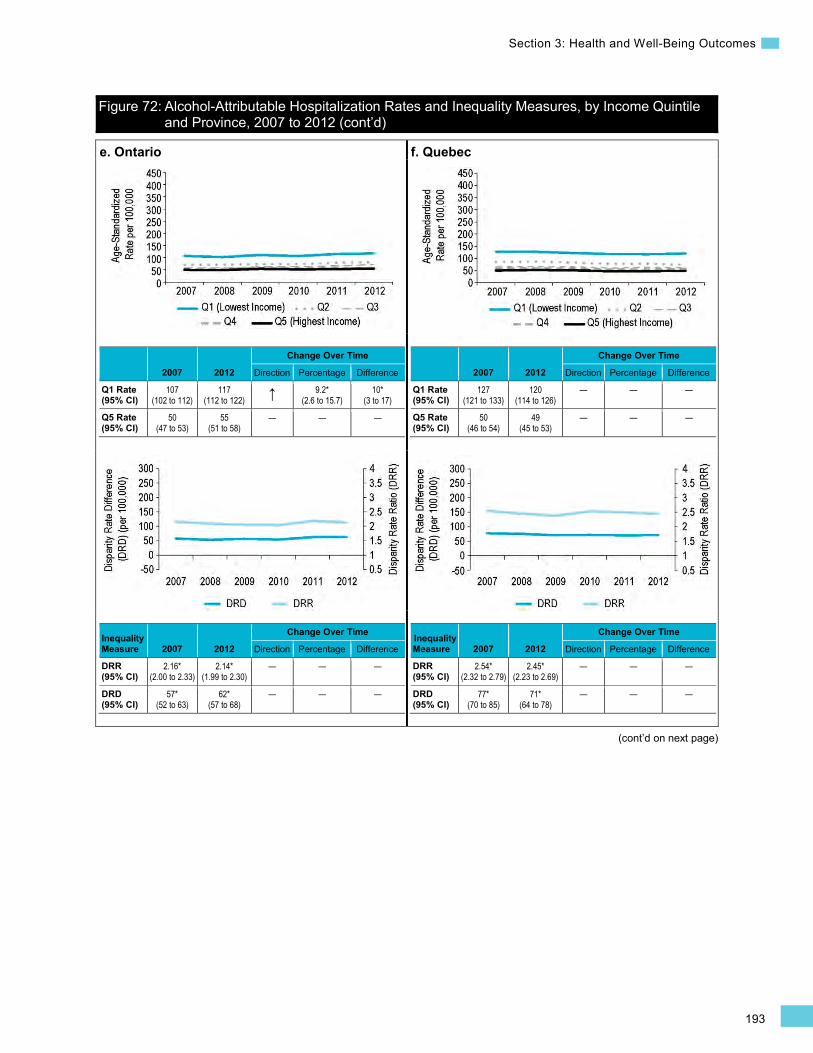
193
Section 3: Health and Well-Being Outcomes
Figure 72: Alcohol-Attributable Hospitalization Rates and Inequality Measures, by Income Quintile and Province, 2007 to 2012 (cont’d)
(cont’d on next page)
e. Ontario
2007 2012
Change Over Time
Direction Percentage Difference
Q1 Rate (95% CI)
107 (102 to 112)
117 (112 to 122) ↑ 9.2*
(2.6 to 15.7) 10*
(3 to 17)
Q5 Rate (95% CI)
50 (47 to 53)
55 (51 to 58)
— — —
Inequality Measure 2007 2012
Change Over Time
Direction Percentage Difference
DRR (95% CI)
2.16* (2.00 to 2.33)
2.14* (1.99 to 2.30)
— — —
DRD (95% CI)
57* (52 to 63)
62* (57 to 68)
— — —
f. Quebec
2007 2012
Change Over Time
Direction Percentage Difference
Q1 Rate (95% CI)
127 (121 to 133)
120 (114 to 126)
— — —
Q5 Rate (95% CI)
50 (46 to 54)
49 (45 to 53)
— — —
Inequality Measure 2007 2012
Change Over Time
Direction Percentage Difference
DRR (95% CI)
2.54* (2.32 to 2.79)
2.45* (2.23 to 2.69)
— — —
DRD (95% CI)
77* (70 to 85)
71* (64 to 78)
— — —

194
Trends in Income-Related Health Inequalities in Canada
Figure 72: Alcohol-Attributable Hospitalization Rates and Inequality Measures, by Income Quintile and Province, 2007 to 2012 (cont’d)
(cont’d on next page)
g. New Brunswick
2007 2012
Change Over Time
Direction Percentage Difference
Q1 Rate (95% CI)
139 (118 to 160)
103 (85 to 121)
— — —
Q5 Rate (95% CI)
61 (47 to 76)
58 (44 to 72)
— — —
Inequality Measure 2007 2012
Change Over Time
Direction Percentage Difference
DRR (95% CI)
2.26* (1.72 to 2.98)
1.78* (1.33 to 2.38)
— — —
DRD (95% CI)
78* (52 to 103)
45* (22 to 68)
— — —
h. Nova Scotia
2007 2012
Change Over Time
Direction Percentage Difference
Q1 Rate (95% CI)
80 (66 to 94)
78 (65 to 92)
— — —
Q5 Rate (95% CI)
46 (35 to 58)
51 (40 to 63)
— — —
Inequality Measure 2007 2012
Change Over Time
Direction Percentage Difference
DRR (95% CI)
1.73* (1.28 to 2.35)
1.53* (1.15 to 2.04)
— — —
DRD (95% CI)
34* (16 to 52)
27* (9 to 45)
— — —
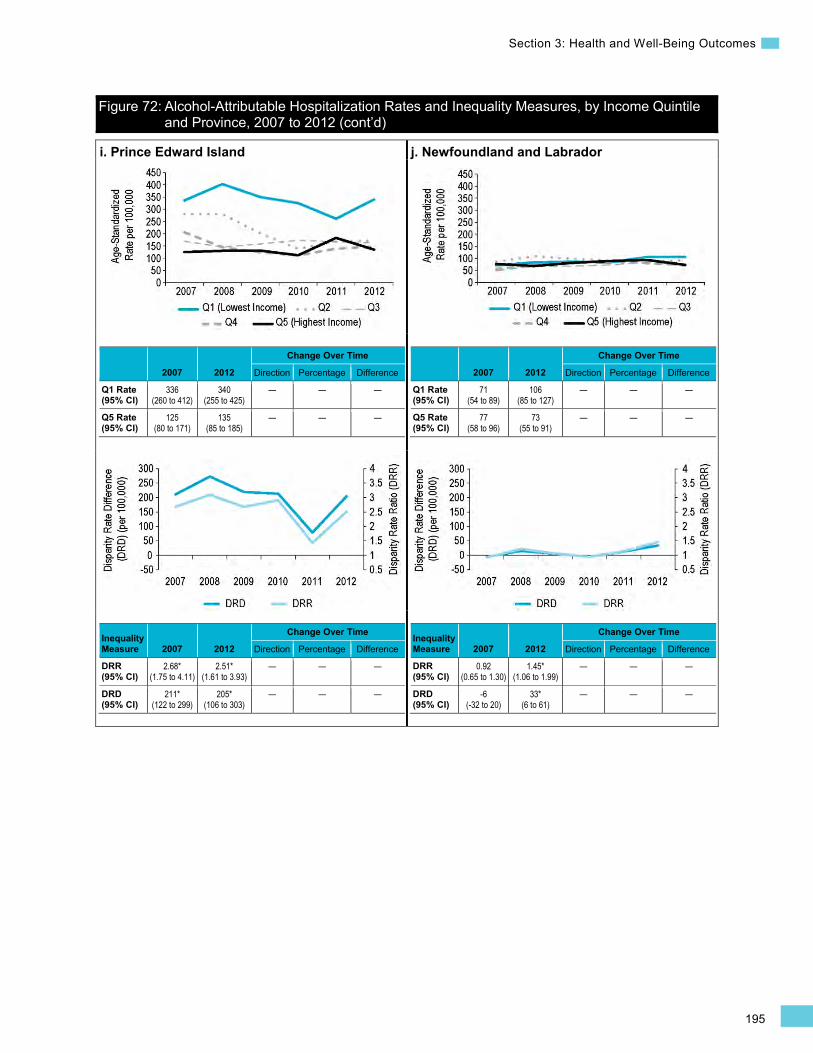
195
Section 3: Health and Well-Being Outcomes
Figure 72: Alcohol-Attributable Hospitalization Rates and Inequality Measures, by Income Quintile and Province, 2007 to 2012 (cont’d)
i. Prince Edward Island
2007 2012
Change Over Time
Direction Percentage Difference
Q1 Rate (95% CI)
336 (260 to 412)
340 (255 to 425)
— — —
Q5 Rate (95% CI)
125 (80 to 171)
135 (85 to 185)
— — —
Inequality Measure 2007 2012
Change Over Time
Direction Percentage Difference
DRR (95% CI)
2.68* (1.75 to 4.11)
2.51* (1.61 to 3.93)
— — —
DRD (95% CI)
211* (122 to 299)
205* (106 to 303)
— — —
j. Newfoundland and Labrador
2007 2012
Change Over Time
Direction Percentage Difference
Q1 Rate (95% CI)
71 (54 to 89)
106 (85 to 127)
— — —
Q5 Rate (95% CI)
77 (58 to 96)
73 (55 to 91)
— — —
Inequality Measure 2007 2012
Change Over Time
Direction Percentage Difference
DRR (95% CI)
0.92 (0.65 to 1.30)
1.45* (1.06 to 1.99)
— — —
DRD (95% CI)
-6 (-32 to 20)
33* (6 to 61)
— — —
196
Trends in Income-Related Health Inequalities in Canada
(cont’d on next page)
Hospitalized Heart Attacks Background
This indicator captures the rate of admissions to acute care hospitals for either a first or a recurrent heart attack, also known as an acute myocardial infarction (AMI), occurring at least 28 days after the initial AMI event. It is calculated for individuals age 20 and older and is expressed as an event rate per 100,000 Canadians per year.519 An AMI is a life-threatening event that occurs when blood does not flow properly through the heart, usually as the result of an arterial blockage.520
In 2012, there were approximately 73,000xiii hospitalizations for AMI events in Canada. The average cost per hospitalization for an AMI event is estimated to be $11,800, for a total cost of approximately $853,698,000 in 2012 (Canadian MIS Database, unpublished data).
xiii. Excludes hospitalization records missing postal code information (approximately 1.1% of all records).
Although an indicator measuring the rate of hospitalized heart attacks enables pan-Canadian comparisons and monitoring over time, it underestimates the occurrence of heart attacks because it is limited to hospitalized events.521 In Canada, approximately 1 in 4 heart attacks results in death before reaching medical care.520 Of the heart attacks that were treated in hospital in 2011, the majority of patients survived past 30 days and did not experience a recurrence with 1 year; however, approximately 7% of AMI patients died in hospital within 30 days.522 After suffering a heart attack, patients can suffer additional physical and emotional health risks, including depression and an elevated risk of mortality.523, 524
Heart attacks are largely preventable and are highly correlated with cardiovascular risk factors including obesity, diabetes, high blood pressure, stress, smoking, physical inactivity and poor diet.520 People with lower incomes or lower levels of education also have a higher likelihood of experiencing a heart attack and dying as a result of a heart attack.524–526 Studies in Canada and the United States evaluating the impact of income, education and occupation found that all 3 dimensions of SES were related to a more than 40% increased risk of having a heart attack.525
Indicator Notes Data Sources Discharge Abstract Database and Hospital Morbidity Database, CIHI
Income Disaggregator Neighbourhood-level income from the Postal Code Conversion File Plus, Statistics Canada
Age Standardization 2011 Canadian standard population
Time Period 2008 to 2012
Please refer to Trends in Income-Related Health Inequalities in Canada: Indicator Definitions for detailed technical notes.
Additional Data National and provincial data for the complete time period and middle income quintiles (Quintile 2 to Quintile 4), as well as provincial data disaggregated by sex, is not presented in this report. This data is available on CIHI’s website in the form of downloadable tables.
197
Section 3: Health and Well-Being Outcomes
Symbols and Abbreviations
* Estimate is statistically significant (i.e., statistically different from 1 for DRR or different from 0 for DRD, PRR, Change Over Time Percentage and Change Over Time Difference, based on the 95% CI)
Q1 Quintile 1 (lowest income quintile)
Q5 Quintile 5 (highest income quintile)
95% CI 95% confidence interval
↑ Statistically significant increase between 2008 estimate and 2012 estimate
↓ Statistically significant decrease between 2008 estimate and 2012 estimate
— No statistically significant change between 2008 estimate and 2012 estimate
How Did Income-Related Inequality for Hospitalized Heart Attacks Change Between 2008 and 2012?
Income-related inequality for hospitalized heart attacks persisted over time, while rates decreased in the lowest 2 income levels.
Trends in Rates, by Income
• Between 2008 and 2012, hospitalized heart attack rates decreased by 3.6%, from 283 per 100,000 to 273 per 100,000 for all income levels combined. This trend was largely due to decreased rates in the 2 lowest income levels.
• Hospitalized heart attack rates in the lowest income level decreased by 5.4%, from 326 per 100,000 in 2008 to 309 per 100,000 in 2012.
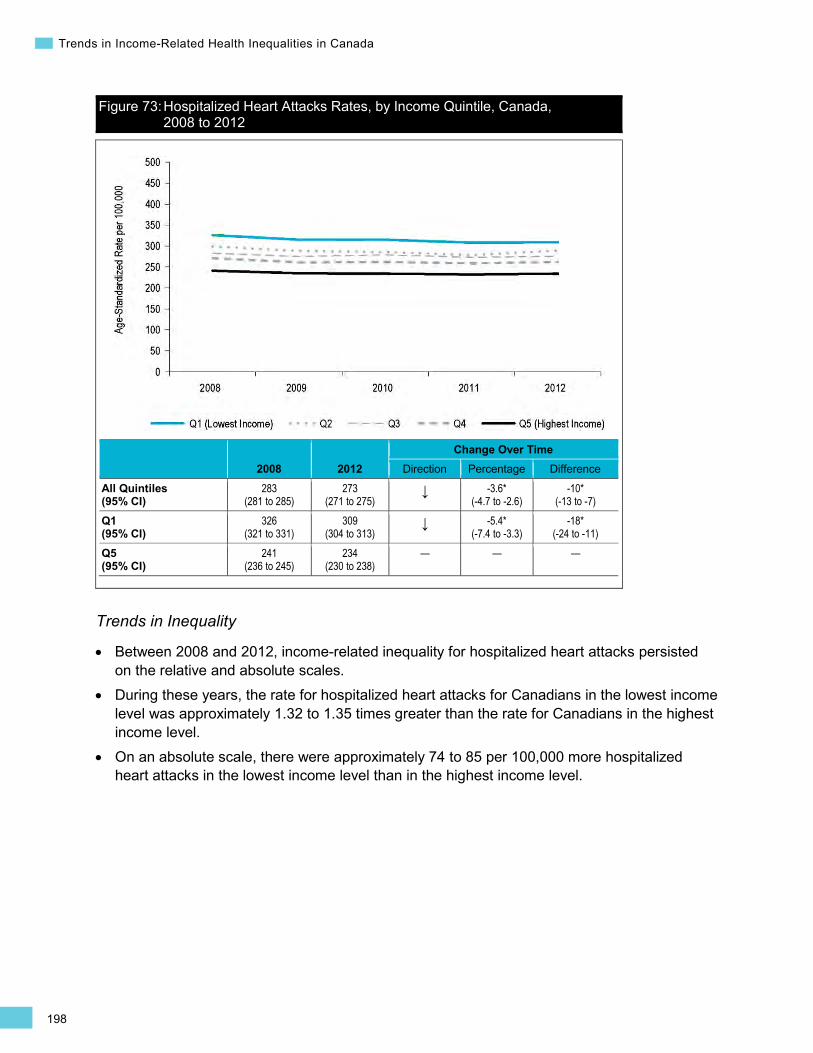
198
Trends in Income-Related Health Inequalities in Canada
Figure 73: Hospitalized Heart Attacks Rates, by Income Quintile, Canada, 2008 to 2012
2008 2012 Change Over Time
Direction Percentage Difference
All Quintiles (95% CI)
283 (281 to 285)
273 (271 to 275)
↓ -3.6* (-4.7 to -2.6)
-10* (-13 to -7)
Q1 (95% CI)
326 (321 to 331)
309 (304 to 313)
↓ -5.4* (-7.4 to -3.3)
-18* (-24 to -11)
Q5 (95% CI)
241 (236 to 245)
234 (230 to 238)
— — —
Trends in Inequality
• Between 2008 and 2012, income-related inequality for hospitalized heart attacks persisted on the relative and absolute scales.
• During these years, the rate for hospitalized heart attacks for Canadians in the lowest income level was approximately 1.32 to 1.35 times greater than the rate for Canadians in the highest income level.
• On an absolute scale, there were approximately 74 to 85 per 100,000 more hospitalized heart attacks in the lowest income level than in the highest income level.
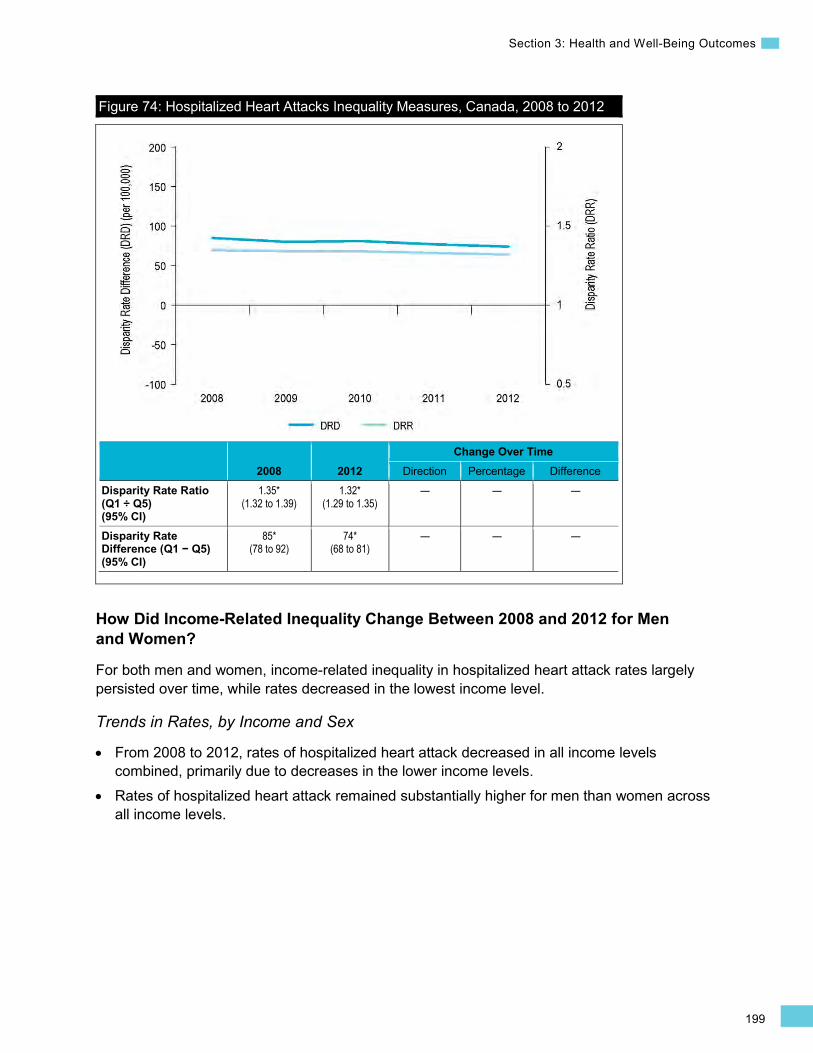
199
Section 3: Health and Well-Being Outcomes
Figure 74: Hospitalized Heart Attacks Inequality Measures, Canada, 2008 to 2012
2008 2012 Change Over Time
Direction Percentage Difference Disparity Rate Ratio (Q1 ÷ Q5) (95% CI)
1.35* (1.32 to 1.39)
1.32* (1.29 to 1.35)
— — —
Disparity Rate Difference (Q1 − Q5) (95% CI)
85* (78 to 92)
74* (68 to 81)
— — —
How Did Income-Related Inequality Change Between 2008 and 2012 for Men and Women?
For both men and women, income-related inequality in hospitalized heart attack rates largely persisted over time, while rates decreased in the lowest income level.
Trends in Rates, by Income and Sex
• From 2008 to 2012, rates of hospitalized heart attack decreased in all income levels combined, primarily due to decreases in the lower income levels.
• Rates of hospitalized heart attack remained substantially higher for men than women across all income levels.
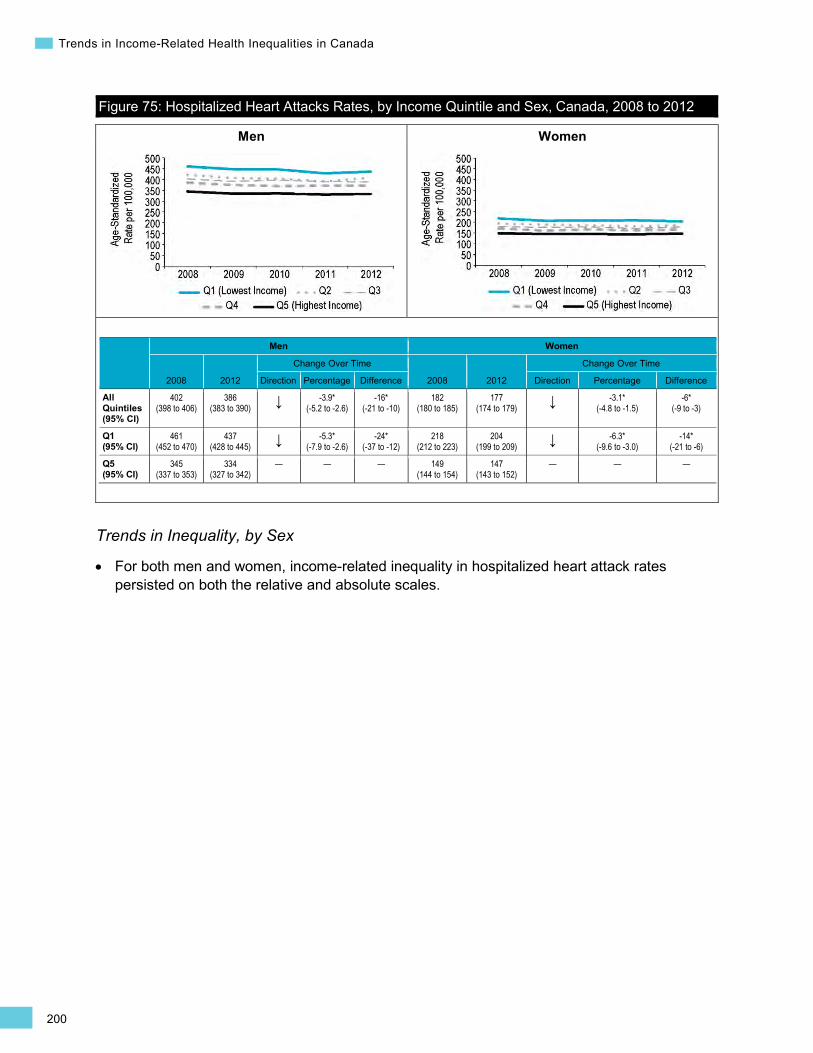
200
Trends in Income-Related Health Inequalities in Canada
Men Women
Figure 75: Hospitalized Heart Attacks Rates, by Income Quintile and Sex, Canada, 2008 to 2012
Men Women
2008 2012
Change Over Time
2008 2012
Change Over Time
Direction Percentage Difference Direction Percentage Difference
All Quintiles (95% CI)
402 (398 to 406)
386 (383 to 390) ↓ -3.9*
(-5.2 to -2.6) -16*
(-21 to -10) 182
(180 to 185) 177
(174 to 179) ↓ -3.1* (-4.8 to -1.5)
-6* (-9 to -3)
Q1 (95% CI)
461 (452 to 470)
437 (428 to 445) ↓ -5.3*
(-7.9 to -2.6) -24*
(-37 to -12) 218
(212 to 223) 204
(199 to 209) ↓ -6.3* (-9.6 to -3.0)
-14* (-21 to -6)
Q5 (95% CI)
345 (337 to 353)
334 (327 to 342)
— — — 149 (144 to 154)
147 (143 to 152)
— — —
Trends in Inequality, by Sex
For both men and women, income-related inequality in hospitalized heart attack rates persisted on both the relative and absolute scales.
•

201
Section 3: Health and Well-Being Outcomes
•
Men Women
Figure 76: Hospitalized Heart Attacks Inequality Measures, by Sex, Canada, 2008 to 2012
Men Women
2008 2012
Change Over Time
2008 2012
Change Over Time
Direction Percentage Difference Direction Percentage Difference
Disparity Rate Ratio (Q1 ÷ Q5) (95% CI)
1.34* (1.29 to 1.38)
1.31* (1.27 to 1.35)
— — — 1.46* (1.40 to 1.52)
1.38* (1.33 to 1.44)
— — —
Disparity Rate Difference (Q1 − Q5) (95% CI)
116* (103 to 128)
102* (91 to 114)
— -— — 69* (62 to 76)
56* (50 to 63)
— — —
Addressing Income-Related Inequality for Hospitalized Heart Attacks
These analyses suggest that income-related inequality for hospitalized heart attack persisted between 2008 and 2012. Rates of hospitalized heart attacks were lowest among Canadians in the highest income level and increased along the income gradient.
Inequality Impact Measures
In 2012, 14.6% or approximately 11,000 hospitalized heart attacks could have been avoided for both sexes combined if Canadians in all income levels had experienced the same hospitalized heart attack rate as Canadians in the highest income level.
Table 14: Hospitalized Heart Attacks Inequality Impact Measures, Canada, 2008 to 2012
Both Sexes Men Women 2008 2012 2008 2012 2008 2012
Potential Rate Reduction (Percentage)‡‡ (95% CI)
15.3* (13.9 to 16.8)
14.6* (13.2 to 16.0)
14.5* (12.7 to 16.3)
13.9* (12.1 to 15.7)
18.6* (16.1 to 20.9)
16.8* (14.5 to 19.2)
Population Impact Number 12,200 11,000 7,600 7,000 4,600 4,000
Note ‡‡ Also known as “population-attributable fraction.”
202
Trends in Income-Related Health Inequalities in Canada
Approaches for Addressing Inequality
Compared with Canadians of higher socio-economic status (SES), Canadians in lower SES groups tend to have a higher prevalence of cardiovascular disease risk factors, including being a regular smoker and physically inactive, not consuming enough fruits and vegetables, having high blood pressure or having diabetes.520, 527 The higher prevalence of cardiovascular risk factors among lower SES groups has also been associated with worse outcomes for those who do experience a heart attack, including a higher risk of death.526, 528, 529 Income and education influence the knowledge and availability of resources to adopt healthy behaviours (e.g., ability to purchase gym memberships and healthy foods). Individuals living with low income face the daily stress of making ends meet and may adopt unhealthy behaviours such as smoking as a coping mechanism.530 Thus prevention efforts may be more successful when also targeting the socio-economic conditions that give rise to differences in cardiovascular risk factors between SES groups.530
In addition to addressing inequalities in risk factors such as poor diet, smoking and diabetes (which are discussed elsewhere in this report), increasing levels of physical activity is an important approach for reducing the occurrence of heart attack and income-related inequalities in heart attacks. Alone, informational interventions that encourage individuals to make healthy lifestyle changes may increase inequalities if vulnerable groups are limited in their ability to act on this information due to economic, social or environmental constraints.363 For example, barriers such as fees and equipment costs associated with participating in organized sports or community recreation opportunities, lack of transportation and lack of access to child care play a role in limiting participation in physical activity among low-income groups.531 Opportunities for leisure time physical activity can also be reduced for those working more than 1 job to make ends meet.532
Recent evidence points to structural interventions that involve changes to environmental factors that enable or constrain levels of physical activity to be more effective among groups of lower SES.362, 363 For example, installing sidewalks and dedicated cycling lanes and implementing traffic-calming measures are among the many modifications to the built environment that can increase cost-free opportunities for daily physical activity, in addition to having a positive impact on local economic development and community livability.533 As such, local jurisdictions have an important role to play in devising urban planning and development initiatives to create infrastructure that supports walking and cycling among all community members.533 For example, in 2010, the City of Calgary developed a comprehensive Cycling Strategy as part of its larger Transportation Plan to create new infrastructure to encourage more people to cycle and to increase the safety of cyclists.534 See Box 19 below for an example of a comprehensive physical activity strategy in British Columbia. Moreover, there is some evidence that workplace interventions targeted at lower-income workers may be effective at increasing levels of physical activity and reducing excess body weight.535
203
Section 3: Health and Well-Being Outcomes
Box 19: British Columbia Physical Activity Strategy, 2008 to 2010 Issue: Low-income Canadians may experience barriers to participating in regular physical activity.536 Physical inactivity is an important risk factor for a number of health-threatening conditions, including heart attacks.520
Intervention: The British Columbia Healthy Living Alliance’s Physical Activity Strategy had 4 components targeting inactive adults age 35 to 54 and included a focus on making physical activity more accessible for low-income populations:537, 538
• Walk BC provided training for community leaders and distributed grants to establish walking routes and maps, and to begin and promote local walking groups.
• Everybody Active sought to engage communities in addressing barriers to physical activity for low-income populations and distributed grants to a number of communities, including 21 Aboriginal communities and 10 focus communities.
• Community-Based Awareness sought to promote the other components of the strategy and also created resources to help communities raise awareness of physical activity opportunities and promote healthy lifestyles.
• Built Environment and Active Transportation (BEAT) engaged communities by hosting built environment summits and developing training modules and resources while providing grants to communities to develop active transportation plans and apply for infrastructure funding.
Rationale/Evidence: Together, the 4 components of the Physical Activity Strategy reached more than 250,000 people from more than 200 communities, including 63 Aboriginal communities. Workshops engaged more than 3,000 people and provided training for low-income populations on reducing barriers to participating in physical activity, as well as on active transportation planning. Communities supported by BEAT grants leveraged their active transportation plans to receive almost $3.4 million in additional funding.539 While it is difficult to assess the direct impact of such an intervention on the rate of AMI events, any action to reduce the prevalence of cardiovascular risk factors, including physical inactivity, among lower-SES groups is likely to reduce income-related inequality in the rate of heart attacks. Enabling communities to increase opportunities for physical activity among low-income populations and providing funding for their implementation may be 1 component of action to reduce socio-economic inequalities in AMI events.
How Did Income-Related Inequality for Hospitalized Heart Attacks Change Between 2008 and 2012 by Province?
• Rate trends for hospitalized heart attacks from 2008 to 2012 varied across provinces; however, income-related inequality largely persisted, though at varying degrees.
• In Saskatchewan, Ontario and Newfoundland and Labrador, hospitalized heart attack rates decreased in both the lowest and highest income levels; in Manitoba, hospitalization rates decreased in the lowest income level. In contrast, hospitalized heart attack rates increased in Quebec in the highest income level only.
• In 2012, British Columbia had the lowest rates of hospitalized heart attacks across the provinces, while Prince Edward Island and Nova Scotia had the highest.
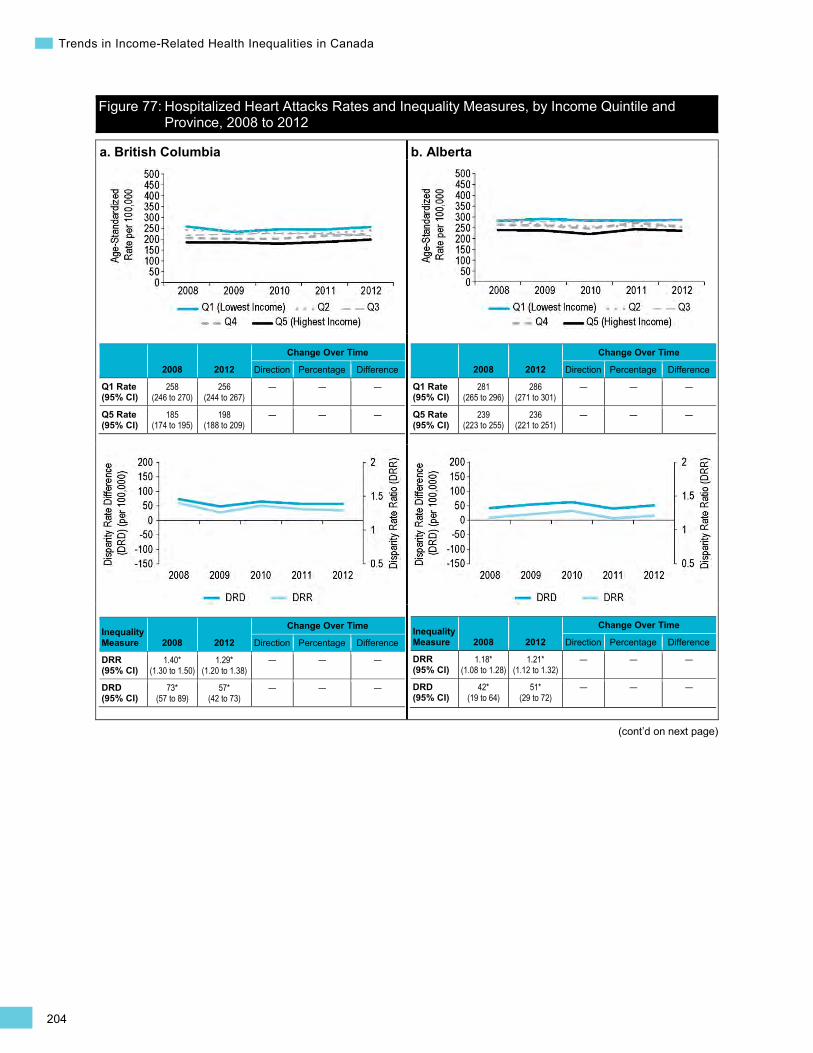
204
Trends in Income-Related Health Inequalities in Canada
(cont’d on next page)
Figure 77: Hospitalized Heart Attacks Rates and Inequality Measures, by Income Quintile and Province, 2008 to 2012
a. British Columbia
2008 2012
Change Over Time
Direction Percentage Difference
Q1 Rate (95% CI)
258 (246 to 270)
256 (244 to 267)
— — —
Q5 Rate (95% CI)
185 (174 to 195)
198 (188 to 209)
— — —
Inequality Measure 2008 2012
Change Over Time
Direction Percentage Difference
DRR (95% CI)
1.40* (1.30 to 1.50)
1.29* (1.20 to 1.38)
— — —
DRD (95% CI)
73* (57 to 89)
57* (42 to 73)
— — —
b. Alberta
2008 2012
Change Over Time
Direction Percentage Difference
Q1 Rate (95% CI)
281 (265 to 296)
286 (271 to 301)
— — —
Q5 Rate (95% CI)
239 (223 to 255)
236 (221 to 251)
— — —
Inequality Measure 2008 2012
Change Over Time
Direction Percentage Difference
DRR (95% CI)
1.18* (1.08 to 1.28)
1.21* (1.12 to 1.32)
— — —
DRD (95% CI)
42* (19 to 64)
51* (29 to 72)
— — —
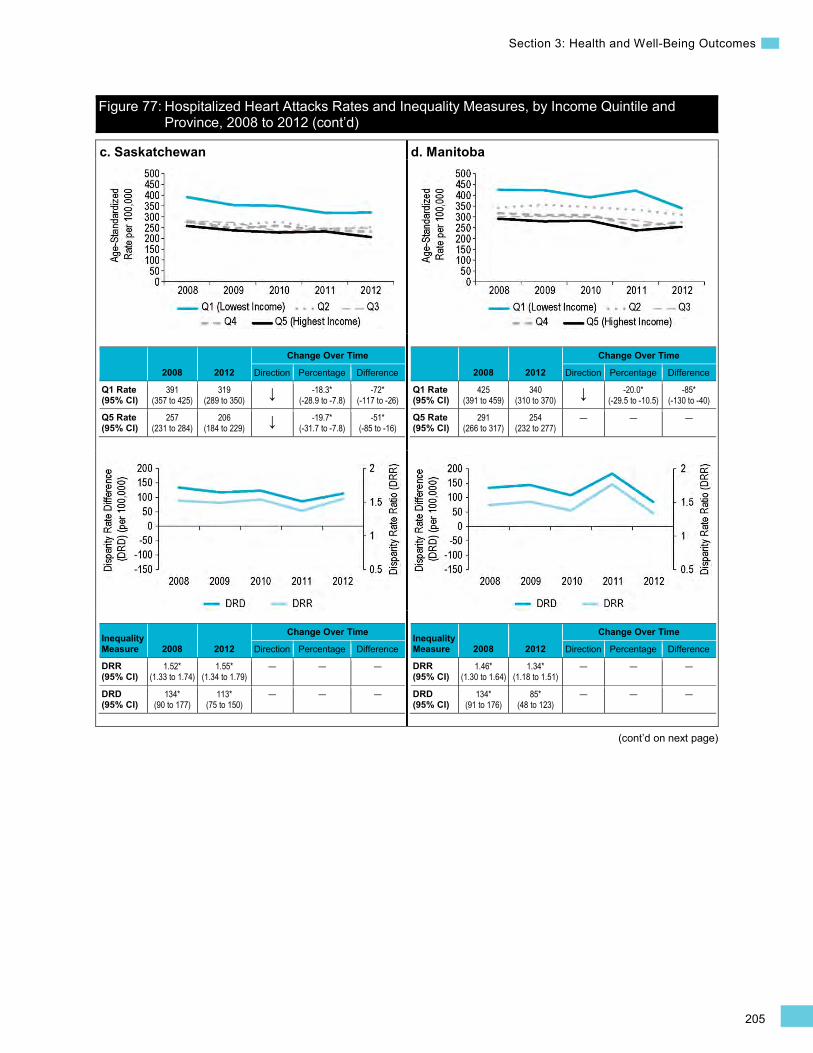
205
Section 3: Health and Well-Being Outcomes
Figure 77: Hospitalized Heart Attacks Rates and Inequality Measures, by Income Quintile and Province, 2008 to 2012 (cont’d)
(cont’d on next page)
c. Saskatchewan
2008 2012
Change Over Time
Direction Percentage Difference
Q1 Rate (95% CI)
391 (357 to 425)
319 (289 to 350) ↓ -18.3*
(-28.9 to -7.8) -72*
(-117 to -26)
Q5 Rate (95% CI)
257 (231 to 284)
206 (184 to 229) ↓ -19.7*
(-31.7 to -7.8) -51*
(-85 to -16)
Inequality Measure 2008 2012
Change Over Time
Direction Percentage Difference
DRR (95% CI)
1.52* (1.33 to 1.74)
1.55* (1.34 to 1.79)
— — —
DRD (95% CI)
134* (90 to 177)
113* (75 to 150)
— — —
d. Manitoba
2008 2012
Change Over Time
Direction Percentage Difference
Q1 Rate (95% CI)
425 (391 to 459)
340 (310 to 370) ↓ -20.0*
(-29.5 to -10.5) -85*
(-130 to -40)
Q5 Rate (95% CI)
291 (266 to 317)
254 (232 to 277)
— — —
Inequality Measure 2008 2012
Change Over Time
Direction Percentage Difference
DRR (95% CI)
1.46* (1.30 to 1.64)
1.34* (1.18 to 1.51)
— — —
DRD (95% CI)
134* (91 to 176)
85* (48 to 123)
— — —
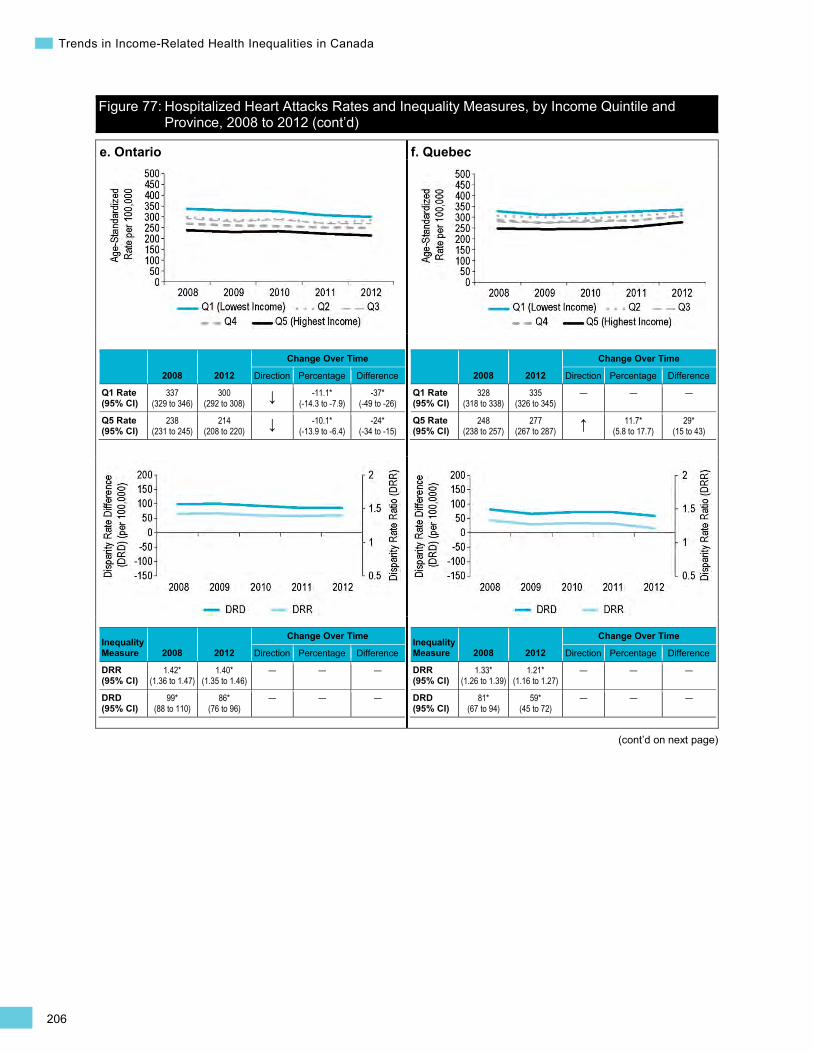
206
Trends in Income-Related Health Inequalities in Canada
Figure 77: Hospitalized Heart Attacks Rates and Inequality Measures, by Income Quintile and Province, 2008 to 2012 (cont’d)
(cont’d on next page)
e. Ontario
2008 2012
Change Over Time
Direction Percentage Difference
Q1 Rate (95% CI)
337 (329 to 346)
300 (292 to 308) ↓ -11.1*
(-14.3 to -7.9) -37*
(-49 to -26)
Q5 Rate (95% CI)
238 (231 to 245)
214 (208 to 220) ↓ -10.1*
(-13.9 to -6.4) -24*
(-34 to -15)
Inequality Measure 2008 2012
Change Over Time
Direction Percentage Difference
DRR (95% CI)
1.42* (1.36 to 1.47)
1.40* (1.35 to 1.46)
— — —
DRD (95% CI)
99* (88 to 110)
86* (76 to 96)
— — —
f. Quebec
2008 2012
Change Over Time
Direction Percentage Difference
Q1 Rate (95% CI)
328 (318 to 338)
335 (326 to 345)
— — —
Q5 Rate (95% CI)
248 (238 to 257)
277 (267 to 287) ↑ 11.7*
(5.8 to 17.7) 29*
(15 to 43)
Inequality Measure 2008 2012
Change Over Time
Direction Percentage Difference
DRR (95% CI)
1.33* (1.26 to 1.39)
1.21* (1.16 to 1.27)
— — —
DRD (95% CI)
81* (67 to 94)
59* (45 to 72)
— — —
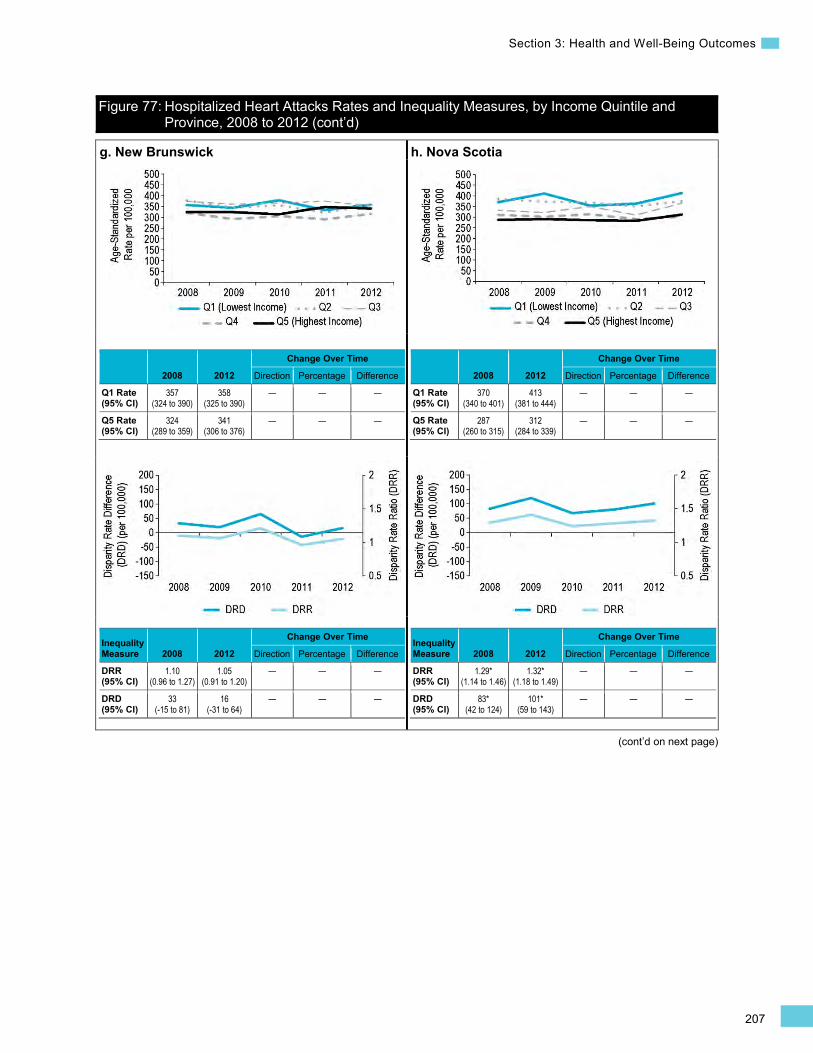
207
Section 3: Health and Well-Being Outcomes
Figure 77: Hospitalized Heart Attacks Rates and Inequality Measures, by Income Quintile and Province, 2008 to 2012 (cont’d)
(cont’d on next page)
g. New Brunswick
2008 2012
Change Over Time
Direction Percentage Difference
Q1 Rate (95% CI)
357 (324 to 390)
358 (325 to 390)
— — —
Q5 Rate (95% CI)
324 (289 to 359)
341 (306 to 376)
— — —
Inequality Measure 2008 2012
Change Over Time
Direction Percentage Difference
DRR (95% CI)
1.10 (0.96 to 1.27)
1.05 (0.91 to 1.20)
— — —
DRD (95% CI)
33 (-15 to 81)
16 (-31 to 64)
— — —
h. Nova Scotia
2008 2012
Change Over Time
Direction Percentage Difference
Q1 Rate (95% CI)
370 (340 to 401)
413 (381 to 444)
— — —
Q5 Rate (95% CI)
287 (260 to 315)
312 (284 to 339)
— — —
Inequality Measure 2008 2012
Change Over Time
Direction Percentage Difference
DRR (95% CI)
1.29* (1.14 to 1.46)
1.32* (1.18 to 1.49)
— — —
DRD (95% CI)
83* (42 to 124)
101* (59 to 143)
— — —
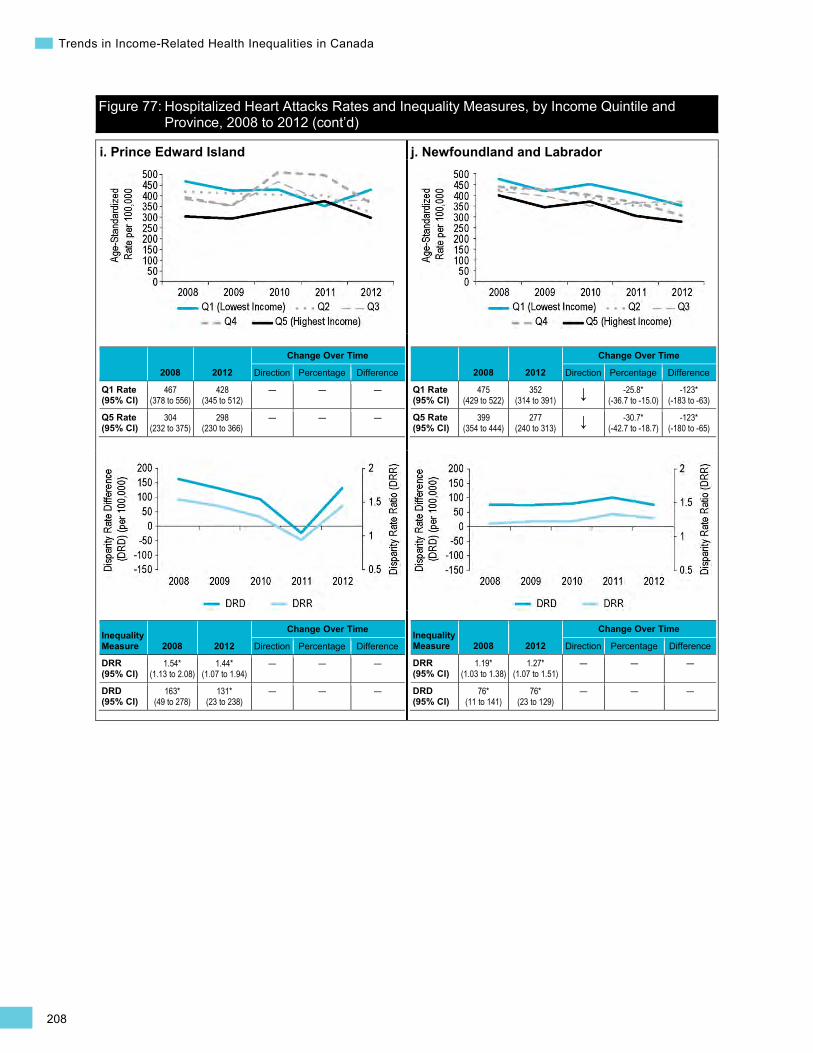
208
Trends in Income-Related Health Inequalities in Canada
Figure 77: Hospitalized Heart Attacks Rates and Inequality Measures, by Income Quintile and Province, 2008 to 2012 (cont’d)
i. Prince Edward Island
2008 2012
Change Over Time
Direction Percentage Difference
Q1 Rate (95% CI)
467 (378 to 556)
428 (345 to 512)
— — —
Q5 Rate (95% CI)
304 (232 to 375)
298 (230 to 366)
— — —
Inequality Measure 2008 2012
Change Over Time
Direction Percentage Difference
DRR (95% CI)
1.54* (1.13 to 2.08)
1.44* (1.07 to 1.94)
— — —
DRD (95% CI)
163* (49 to 278)
131* (23 to 238)
— — —
j. Newfoundland and Labrador
2008 2012
Change Over Time
Direction Percentage Difference
Q1 Rate (95% CI)
475 (429 to 522)
352 (314 to 391) ↓ -25.8*
(-36.7 to -15.0) -123*
(-183 to -63)
Q5 Rate (95% CI)
399 (354 to 444)
277 (240 to 313) ↓ -30.7*
(-42.7 to -18.7) -123*
(-180 to -65)
Inequality Measure 2008 2012
Change Over Time
Direction Percentage Difference
DRR (95% CI)
1.19* (1.03 to 1.38)
1.27* (1.07 to 1.51)
— — —
DRD (95% CI)
76* (11 to 141)
76* (23 to 129)
— — —
209
Section 3: Health and Well-Being Outcomes
(cont’d on next page)
Diabetes Background
This indicator measures the prevalence of diabetes among Canadians age 18 and older. Survey respondents were asked whether their diabetes was diagnosed by a health professional, and no distinction was made between different types of diabetes.349
Diabetes is a common and serious chronic condition that is rapidly rising in prevalence. In 2014, about 9% of Canadians, or 3.3 million, were estimated to be living with diabetes, and this number is expected to rise to 4.8 million over the next 10 years.540 Diabetes affects the body’s ability to produce insulin, a hormone that regulates the amount of glucose (sugar) in the blood. In the 2 major types of diabetes, the body cannot produce insulin (type 1 diabetes), or either does not produce enough insulin or cannot effectively use the insulin it produces (type 2 diabetes). Without proper treatment or management (which includes good nutrition, regular exercise, monitoring of blood sugar levels and, in some cases, medication), diabetes increases the risk of serious complications, including heart disease, stroke, hypertension, kidney failure and premature death.541, 542 As such, diabetes places a heavy burden on patients, their families and the health care system. The estimated cost of diabetes in Canada is $13.5 billion annually, which is expected to rise to $17 billion by 2024.540
Type 2 diabetes accounts for more than 90% of all cases of diabetes and is strongly linked with obesity, physical inactivity, unhealthy diet and genetic factors.541, 543 Certain ethnic groups, such as Aboriginal, South Asian, Latin American and African/Caribbean peoples, have an elevated risk of diabetes and tend to develop this condition at a younger age than Europeans.543 Structural and material factors affecting health, such as income, education and housing, are also important to the development and progression of diabetes because they shape key risk factors, including health behaviours, levels of chronic stress and ability to access health-promoting resources.544–547 Low-income Canadians, particularly younger adults and women, have an increased risk of developing diabetes than their wealthier counterparts.548–550 Compared with higher-income adults with diabetes, low-income adults with diabetes are also less likely to receive recommended diabetes care551 and are at significantly higher risk of developing diabetes-related complications and premature death.552–554
Indicator Notes Data Sources Canadian Community Health Survey (CCHS), Statistics Canada
Income Disaggregator Self-reported adjusted household income from the CCHS
Age Standardization 2011 Canadian standard population
Time Period 2003 to 2013
Please refer to Trends in Income-Related Health Inequalities in Canada: Indicator Definitions for detailed technical notes.
Additional Data National and provincial data for the complete time period and middle income quintiles (Quintile 2 to Quintile 4), as well as provincial data disaggregated by sex, is not presented in this report. This data is available on CIHI’s website in the form of downloadable tables.
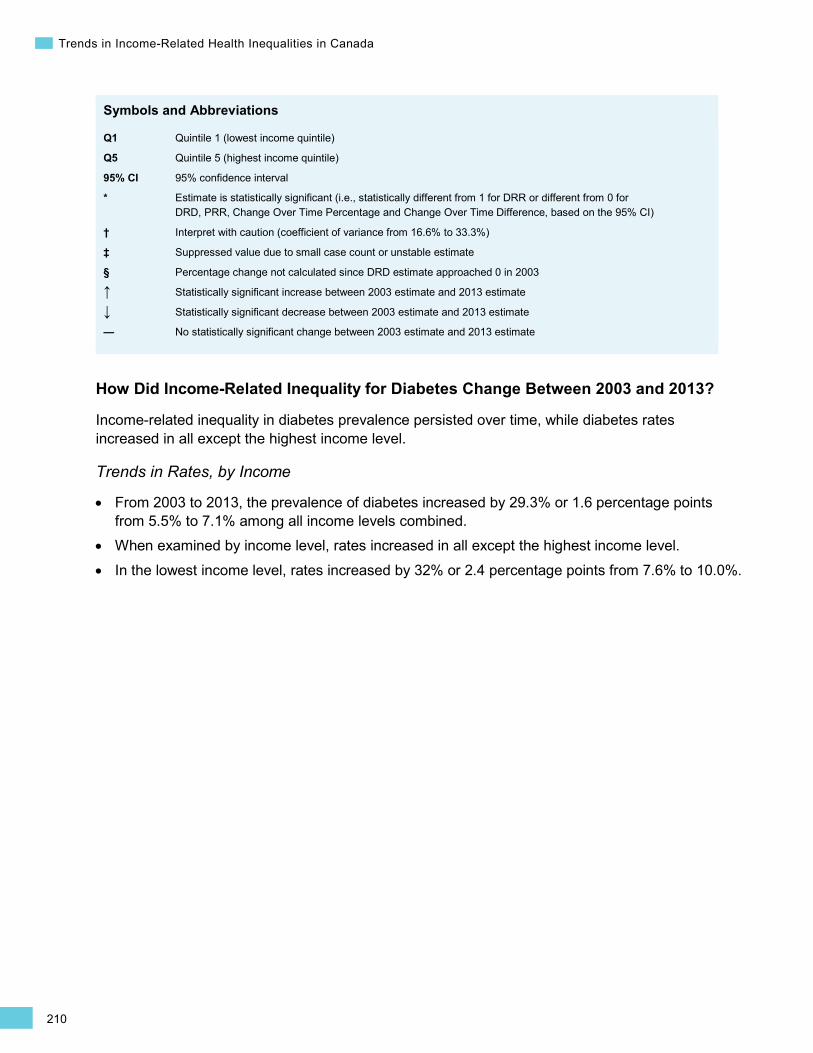
210
Trends in Income-Related Health Inequalities in Canada
Symbols and Abbreviations
* Estimate is statistically significant (i.e., statistically different from 1 for DRR or different from 0 for DRD, PRR, Change Over Time Percentage and Change Over Time Difference, based on the 95% CI)
† Interpret with caution (coefficient of variance from 16.6% to 33.3%)
Q1 Quintile 1 (lowest income quintile)
Q5 Quintile 5 (highest income quintile)
95% CI 95% confidence interval
‡ Suppressed value due to small case count or unstable estimate
§ Percentage change not calculated since DRD estimate approached 0 in 2003
↑ Statistically significant increase between 2003 estimate and 2013 estimate
↓ Statistically significant decrease between 2003 estimate and 2013 estimate
— No statistically significant change between 2003 estimate and 2013 estimate
How Did Income-Related Inequality for Diabetes Change Between 2003 and 2013?
Income-related inequality in diabetes prevalence persisted over time, while diabetes rates increased in all except the highest income level.
Trends in Rates, by Income
• From 2003 to 2013, the prevalence of diabetes increased by 29.3% or 1.6 percentage points from 5.5% to 7.1% among all income levels combined.
• When examined by income level, rates increased in all except the highest income level. • In the lowest income level, rates increased by 32% or 2.4 percentage points from 7.6% to 10.0%.

211
Section 3: Health and Well-Being Outcomes
Figure 78: Diabetes Prevalence Rates, by Income Quintile, Canada, 2003 to 2013
2003 2013 Change Over Time
Direction Percentage Difference All Quintiles (95% CI)
5.5 (5.3 to 5.7)
7.1 (6.8 to 7.5)
↑ 29.3* (21.0 to 37.7)
1.6* (1.2 to 2.1)
Q1 (95% CI)
7.6 (7.0 to 8.2)
10.0 (9.0 to 11.1)
↑ 32.0* (14.5 to 49.5)
2.4* (1.2 to 3.7)
Q5 (95% CI)
4.2 (3.7 to 4.7)
4.9 (4.2 to 5.6)
— — —
Trends in Inequality
• Between 2003 and 2013, income-related inequality in diabetes prevalence persisted on both the relative and absolute scales.
• During these years, rates of diabetes among adults in the lowest income level were approximately 1.8 to 2 times greater than the rates among those in the highest income level.
• During 2003 and 2013, there were approximately 3.4 to 5.1 more cases of diabetes for every 100 adults in the lowest versus the highest income level.

212
Trends in Income-Related Health Inequalities in Canada
Figure 79: Diabetes Inequality Measures, Canada, 2003 to 2013
2003 2013 Change Over Time
Direction Percentage Difference
Disparity Rate Ratio (Q1 ÷ Q5) (95% CI)
1.81* (1.57 to 2.10)
2.05* (1.71 to 2.47)
— — —
Disparity Rate Difference (Q1 − Q5) (95% CI)
3.4* (2.6 to 4.2)
5.1* (3.9 to 6.4)
— — —
How Did Income-Related Inequality Change Between 2003 and 2013 for Men and Women?
For both men and women, income-related inequality in diabetes prevalence persisted over time, while rates increased among all income levels combined.
Trends in Rates, by Income and Sex
• For both sexes, between 2003 and 2013, rates of diabetes prevalence increased among all income levels combined.
• For men in the lowest income level, rates of diabetes increased by 35.5% or 2.9 percentage points from 8.0% to 10.9%.
• For men and women, rates also increased in the second-lowest income level.
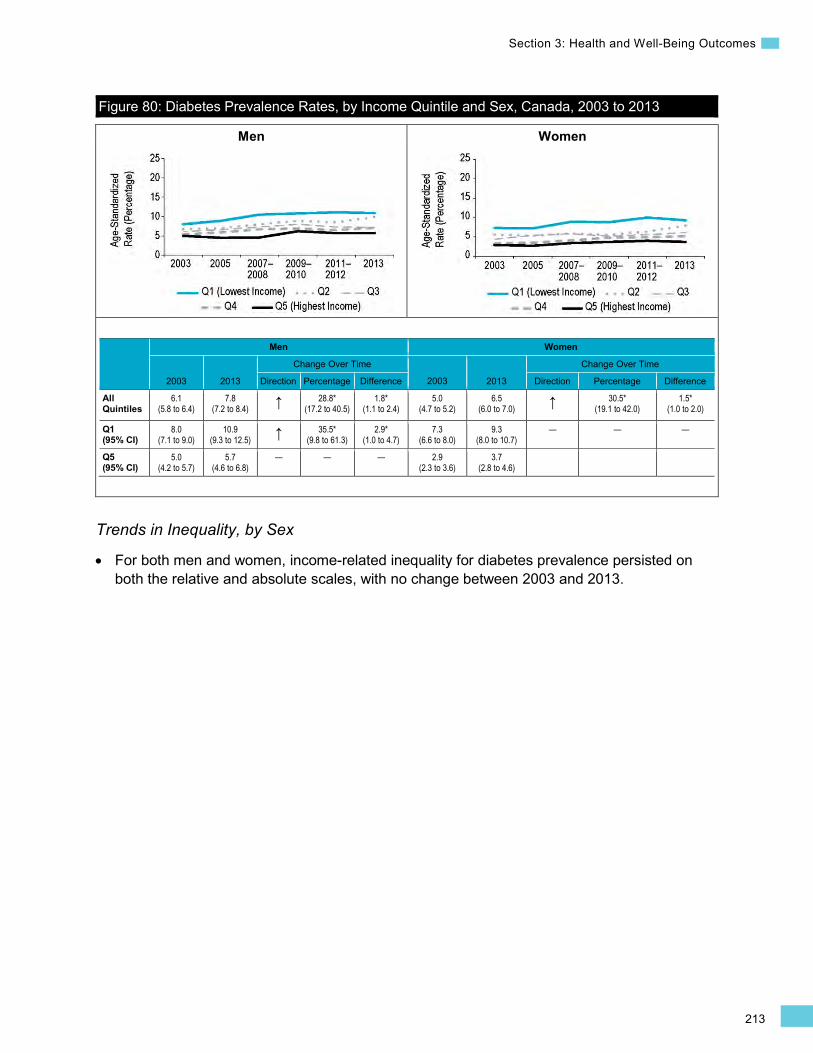
213
Section 3: Health and Well-Being Outcomes
Men Women
Figure 80: Diabetes Prevalence Rates, by Income Quintile and Sex, Canada, 2003 to 2013
Men Women
2003 2013
Change Over Time
2003 2013
Change Over Time
Direction Percentage Difference Direction Percentage Difference
All Quintiles
6.1 (5.8 to 6.4)
7.8 (7.2 to 8.4) ↑ 28.8*
(17.2 to 40.5) 1.8*
(1.1 to 2.4) 5.0
(4.7 to 5.2) 6.5
(6.0 to 7.0) ↑ 30.5* (19.1 to 42.0)
1.5* (1.0 to 2.0)
Q1 (95% CI)
8.0 (7.1 to 9.0)
10.9 (9.3 to 12.5) ↑ 35.5*
(9.8 to 61.3) 2.9*
(1.0 to 4.7) 7.3
(6.6 to 8.0) 9.3
(8.0 to 10.7) — — —
Q5 (95% CI)
5.0 (4.2 to 5.7)
5.7 (4.6 to 6.8)
— — — 2.9 (2.3 to 3.6)
3.7 (2.8 to 4.6)
Trends in Inequality, by Sex
For both men and women, income-related inequality for diabetes prevalence persisted on both the relative and absolute scales, with no change between 2003 and 2013.
•
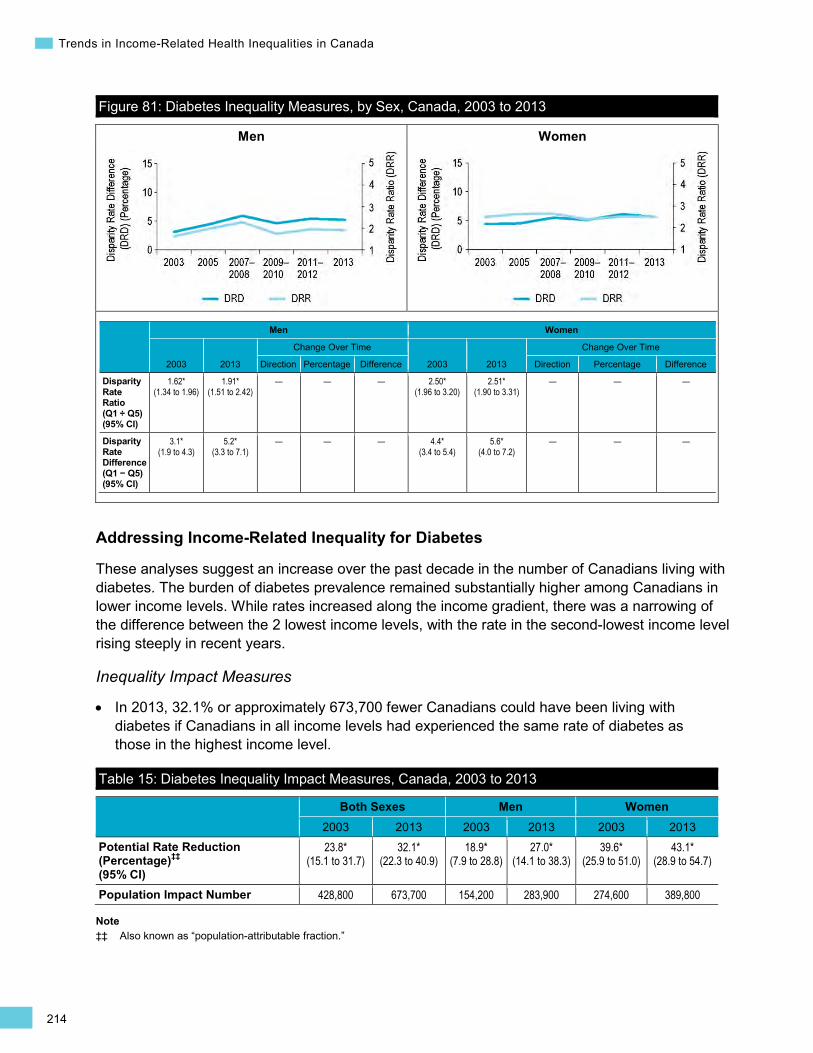
214
Trends in Income-Related Health Inequalities in Canada
•
Men Women
Figure 81: Diabetes Inequality Measures, by Sex, Canada, 2003 to 2013
Men Women
2003 2013
Change Over Time
2003 2013
Change Over Time
Direction Percentage Difference Direction Percentage Difference
Disparity Rate Ratio (Q1 ÷ Q5) (95% CI)
1.62* (1.34 to 1.96)
1.91* (1.51 to 2.42)
— — — 2.50* (1.96 to 3.20)
2.51* (1.90 to 3.31)
— — —
Disparity Rate Difference (Q1 − Q5) (95% CI)
3.1* (1.9 to 4.3)
5.2* (3.3 to 7.1)
— — — 4.4* (3.4 to 5.4)
5.6* (4.0 to 7.2)
— — —
Addressing Income-Related Inequality for Diabetes
These analyses suggest an increase over the past decade in the number of Canadians living with diabetes. The burden of diabetes prevalence remained substantially higher among Canadians in lower income levels. While rates increased along the income gradient, there was a narrowing of the difference between the 2 lowest income levels, with the rate in the second-lowest income level rising steeply in recent years.
Inequality Impact Measures
In 2013, 32.1% or approximately 673,700 fewer Canadians could have been living with diabetes if Canadians in all income levels had experienced the same rate of diabetes as those in the highest income level.
Table 15: Diabetes Inequality Impact Measures, Canada, 2003 to 2013
Both Sexes Men Women 2003 2013 2003 2013 2003 2013
Potential Rate Reduction (Percentage)‡‡ (95% CI)
23.8* (15.1 to 31.7)
32.1* (22.3 to 40.9)
18.9* (7.9 to 28.8)
27.0* (14.1 to 38.3)
39.6* (25.9 to 51.0)
43.1* (28.9 to 54.7)
Population Impact Number 428,800 673,700 154,200 283,900 274,600 389,800
Note ‡‡ Also known as “population-attributable fraction.”
215
Section 3: Health and Well-Being Outcomes
Approaches for Addressing Inequality
In light of the rapidly rising prevalence of diabetes in Canada, a number of programs and policies at the federal, provincial and local levels have aimed to reduce the overall burden of diabetes, as well as inequalities in diabetes prevalence and its associated complications.543, 558,
613 At the federal level, programs include the Canadian Diabetes Strategy and the Aboriginal Diabetes Initiative, both of which support the prevention and management of type 2 diabetes among vulnerable populations.543 Despite such efforts, the prevalence of diabetes has continued to rise across Canada over the past 10 years, and the income-related gap has persisted. Canadians in the lowest income level continue to be at least twice as likely to have diabetes as those in the highest income level.
The determinants of diabetes are multi-factorial and complex. Therefore, strategies to reduce the overall burden of diabetes, or the disproportionately high burden borne by low-income Canadians, would ideally involve a comprehensive suite of actions that address the social, economic, environmental and lifestyle determinants of diabetes.543, 555 For example, interventions aimed at preventing diabetes among high-risk urban residents may target underprivileged areas by improving neighbourhood walkability and access to local services and amenities (e.g., free or low-cost recreational facilities, sources of fresh, affordable food).556, 557 Culturally and linguistically specific community-based programs can also be effective at reaching high-risk populations (see Box 20 below).558
Following the recommended nutritional, exercise and treatment strategies to successfully manage diabetes is challenging without adequate living conditions and financial resources.545 For example, adults with diabetes who live in households that are food insecure due to financial constraints are only half as likely to consume the recommended 5 or more daily servings of fruits and vegetables as those in food secure households.242 In many jurisdictions, the high out-of-pocket costs associated with good self-management of diabetes (e.g., cost of medications, blood sugar testing equipment) place a disproportionate burden on lower-income Canadians and challenge their ability to effectively manage this condition.553, 559 Thus allocating appropriate health care resources to ensure affordable and accessible diabetes treatment for low-income and other vulnerable groups is an important component of reducing socio-economic inequalities in diabetes.549, 553 Given the particularly strong connection of diabetes to social and economic conditions of life, interventions such as those addressing access to affordable housing and employment opportunities will also have an important impact on reducing socio-economic inequalities in the development and management of diabetes.544, 546, 547, 560
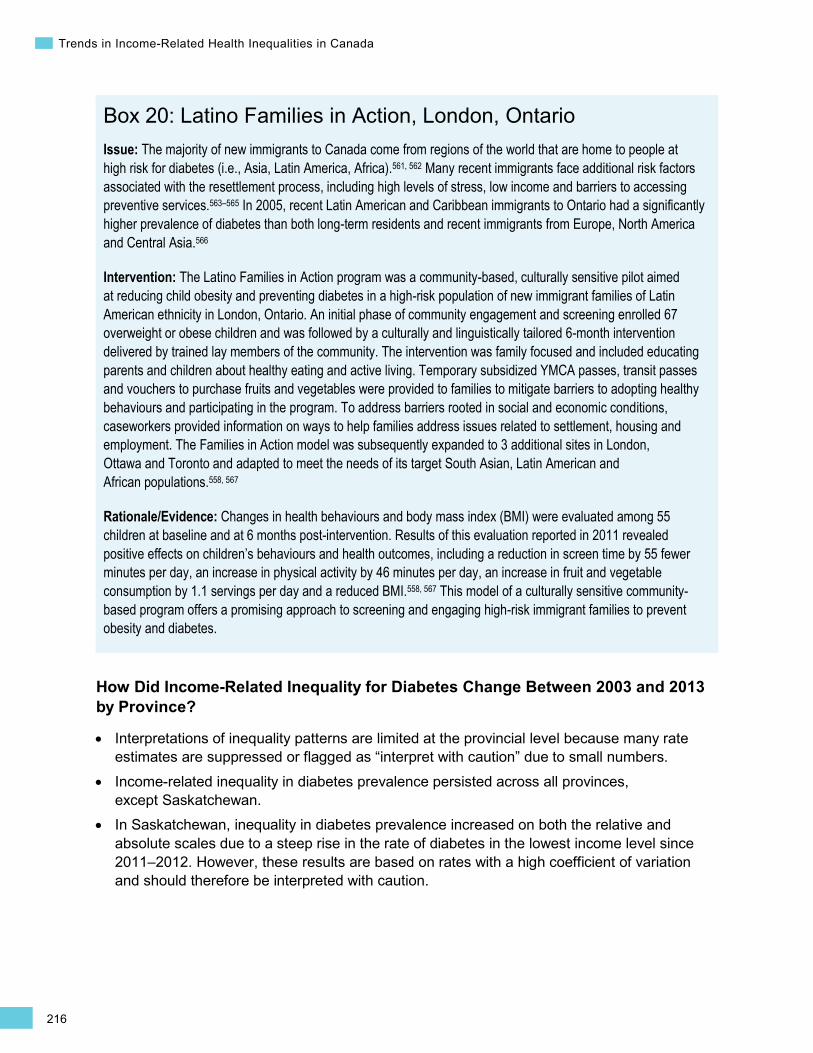
216
Trends in Income-Related Health Inequalities in Canada
Box 20: Latino Families in Action, London, Ontario Issue: The majority of new immigrants to Canada come from regions of the world that are home to people at high risk for diabetes (i.e., Asia, Latin America, Africa).561, 562 Many recent immigrants face additional risk factors associated with the resettlement process, including high levels of stress, low income and barriers to accessing preventive services.563–565 In 2005, recent Latin American and Caribbean immigrants to Ontario had a significantly higher prevalence of diabetes than both long-term residents and recent immigrants from Europe, North America and Central Asia.566
Intervention: The Latino Families in Action program was a community-based, culturally sensitive pilot aimed at reducing child obesity and preventing diabetes in a high-risk population of new immigrant families of Latin American ethnicity in London, Ontario. An initial phase of community engagement and screening enrolled 67 overweight or obese children and was followed by a culturally and linguistically tailored 6-month intervention delivered by trained lay members of the community. The intervention was family focused and included educating parents and children about healthy eating and active living. Temporary subsidized YMCA passes, transit passes and vouchers to purchase fruits and vegetables were provided to families to mitigate barriers to adopting healthy behaviours and participating in the program. To address barriers rooted in social and economic conditions, caseworkers provided information on ways to help families address issues related to settlement, housing and employment. The Families in Action model was subsequently expanded to 3 additional sites in London, Ottawa and Toronto and adapted to meet the needs of its target South Asian, Latin American and African populations.558, 567
Rationale/Evidence: Changes in health behaviours and body mass index (BMI) were evaluated among 55 children at baseline and at 6 months post-intervention. Results of this evaluation reported in 2011 revealed positive effects on children’s behaviours and health outcomes, including a reduction in screen time by 55 fewer minutes per day, an increase in physical activity by 46 minutes per day, an increase in fruit and vegetable consumption by 1.1 servings per day and a reduced BMI.558, 567 This model of a culturally sensitive community-based program offers a promising approach to screening and engaging high-risk immigrant families to prevent obesity and diabetes.
How Did Income-Related Inequality for Diabetes Change Between 2003 and 2013 by Province?
• Interpretations of inequality patterns are limited at the provincial level because many rate estimates are suppressed or flagged as “interpret with caution” due to small numbers.
• Income-related inequality in diabetes prevalence persisted across all provinces, except Saskatchewan.
• In Saskatchewan, inequality in diabetes prevalence increased on both the relative and absolute scales due to a steep rise in the rate of diabetes in the lowest income level since 2011–2012. However, these results are based on rates with a high coefficient of variation and should therefore be interpreted with caution.
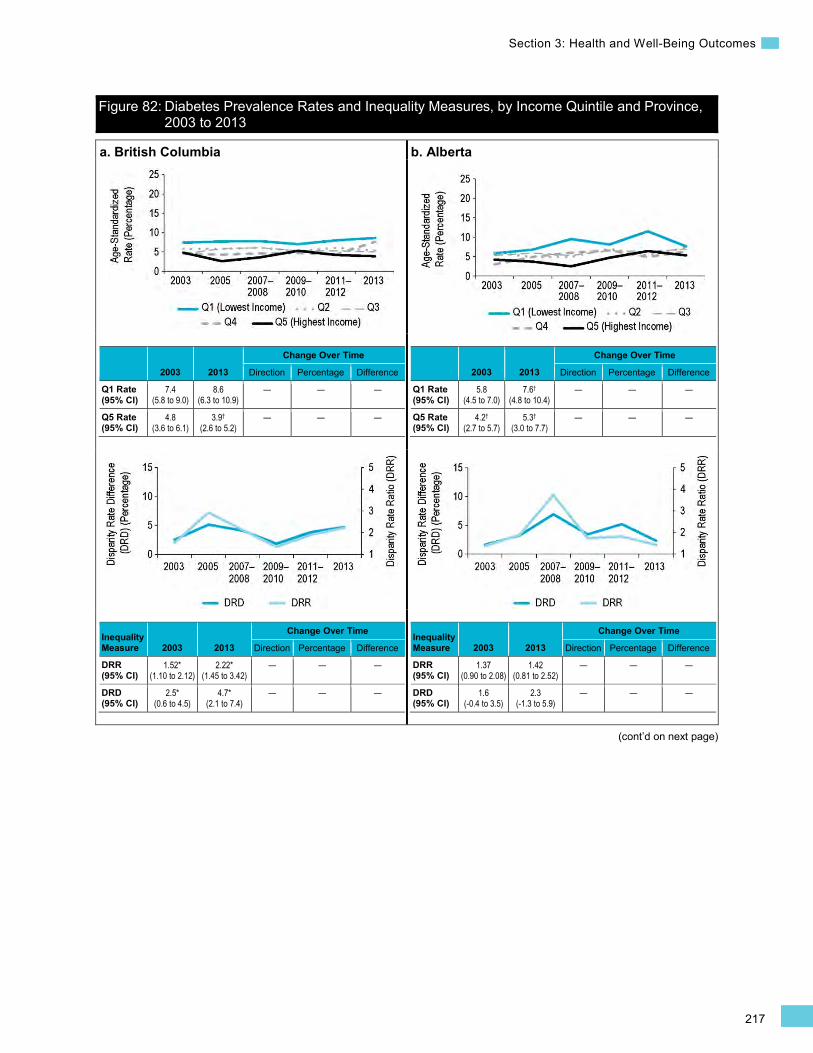
217
Section 3: Health and Well-Being Outcomes
(cont’d on next page)
Figure 82: Diabetes Prevalence Rates and Inequality Measures, by Income Quintile and Province, 2003 to 2013
a. British Columbia
2003 2013
Change Over Time
Direction Percentage Difference
Q1 Rate (95% CI)
7.4 (5.8 to 9.0)
8.6 (6.3 to 10.9)
— — —
Q5 Rate (95% CI)
4.8 (3.6 to 6.1)
3.9†
(2.6 to 5.2) — — —
Inequality Measure 2003 2013
Change Over Time
Direction Percentage Difference
DRR (95% CI)
1.52* (1.10 to 2.12)
2.22* (1.45 to 3.42)
— — —
DRD (95% CI)
2.5* (0.6 to 4.5)
4.7* (2.1 to 7.4)
— — —
b. Alberta
2003 2013
Change Over Time
Direction Percentage Difference
Q1 Rate (95% CI)
5.8 (4.5 to 7.0)
7.6†
(4.8 to 10.4) — — —
Q5 Rate (95% CI)
4.2†
(2.7 to 5.7) 5.3†
(3.0 to 7.7) — — —
Inequality Measure 2003 2013
Change Over Time
Direction Percentage Difference
DRR (95% CI)
1.37 (0.90 to 2.08)
1.42 (0.81 to 2.52)
— — —
DRD (95% CI)
1.6 (-0.4 to 3.5)
2.3 (-1.3 to 5.9)
— — —
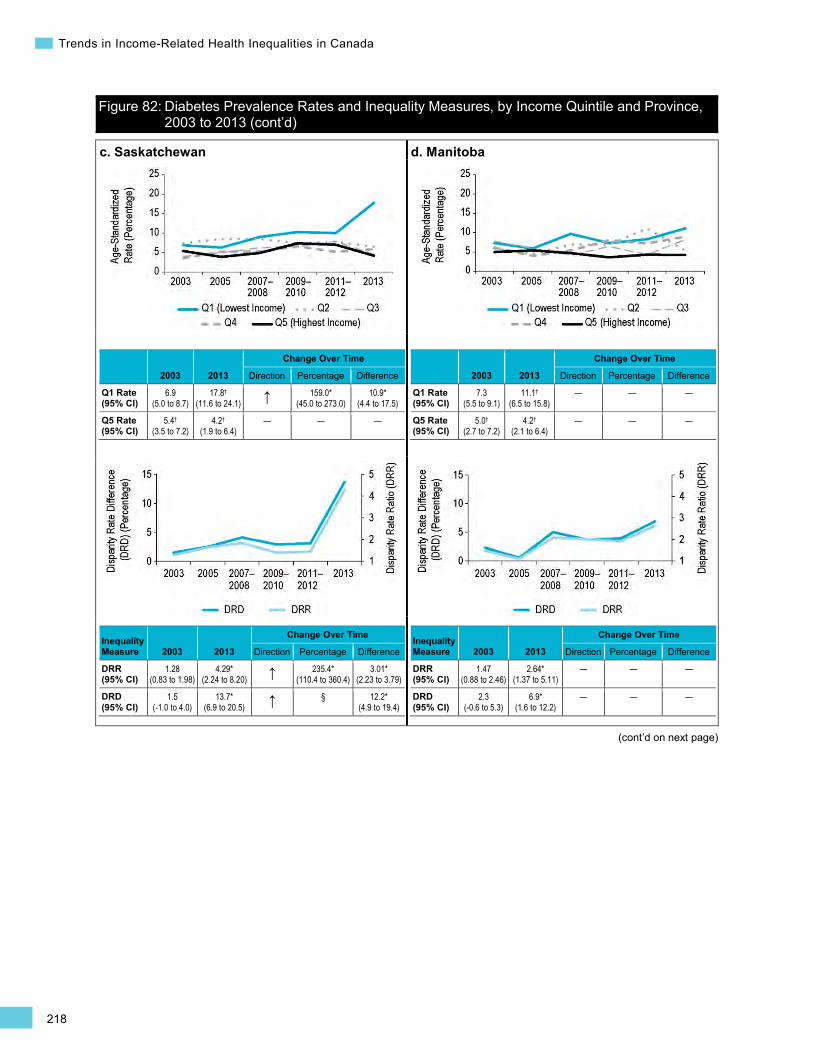
218
Trends in Income-Related Health Inequalities in Canada
Figure 82: Diabetes Prevalence Rates and Inequality Measures, by Income Quintile and Province, 2003 to 2013 (cont’d)
(cont’d on next page)
c. Saskatchewan
2003 2013
Change Over Time
Direction Percentage Difference
Q1 Rate (95% CI)
6.9 (5.0 to 8.7)
17.8†
(11.6 to 24.1) ↑ 159.0* (45.0 to 273.0)
10.9* (4.4 to 17.5)
Q5 Rate (95% CI)
5.4†
(3.5 to 7.2) 4.2†
(1.9 to 6.4) — — —
Inequality Measure 2003 2013
Change Over Time
Direction Percentage Difference
DRR (95% CI)
1.28 (0.83 to 1.98)
4.29* (2.24 to 8.20) ↑ 235.4*
(110.4 to 360.4) 3.01*
(2.23 to 3.79)
DRD (95% CI)
1.5 (-1.0 to 4.0)
13.7* (6.9 to 20.5) ↑ § 12.2*
(4.9 to 19.4)
d. Manitoba
2003 2013
Change Over Time
Direction Percentage Difference
Q1 Rate (95% CI)
7.3 (5.5 to 9.1)
11.1†
(6.5 to 15.8) — — —
Q5 Rate (95% CI)
5.0†
(2.7 to 7.2) 4.2†
(2.1 to 6.4) — — —
Inequality Measure 2003 2013
Change Over Time
Direction Percentage Difference
DRR (95% CI)
1.47 (0.88 to 2.46)
2.64* (1.37 to 5.11)
— — —
DRD (95% CI)
2.3 (-0.6 to 5.3)
6.9* (1.6 to 12.2)
— — —

219
Section 3: Health and Well-Being Outcomes
Figure 82: Diabetes Prevalence Rates and Inequality Measures, by Income Quintile and Province, 2003 to 2013 (cont’d)
(cont’d on next page)
e. Ontario
2003 2013
Change Over Time
Direction Percentage Difference
Q1 Rate (95% CI)
7.9 (6.8 to 8.9)
10.7 (8.7 to 12.7)
— — —
Q5 Rate (95% CI)
4.0 (3.3 to 4.8)
5.7 (4.3 to 7.0)
— — —
Inequality Measure 2003 2013
Change Over Time
Direction Percentage Difference
DRR (95% CI)
1.95* (1.55 to 2.47)
1.88* (1.39 to 2.56)
— — —
DRD (95% CI)
3.8* (2.5 to 5.2)
5.0* (2.6 to 7.5)
— — —
f. Quebec
2003 2013
Change Over Time
Direction Percentage Difference
Q1 Rate (95% CI)
7.6 (6.2 to 9.0)
10.0 (7.7 to 12.3)
— — —
Q5 Rate (95% CI)
4.7†
(3.1 to 6.4) 3.9†
(2.6 to 5.2) — — —
Inequality Measure 2003 2013
Change Over Time
Direction Percentage Difference
DRR (95% CI)
1.61* (1.08 to 2.39)
2.56* (1.70 to 3.86)
— — —
DRD (95% CI)
2.9* (0.7 to 5.1)
6.1* (3.5 to 8.7)
— — —
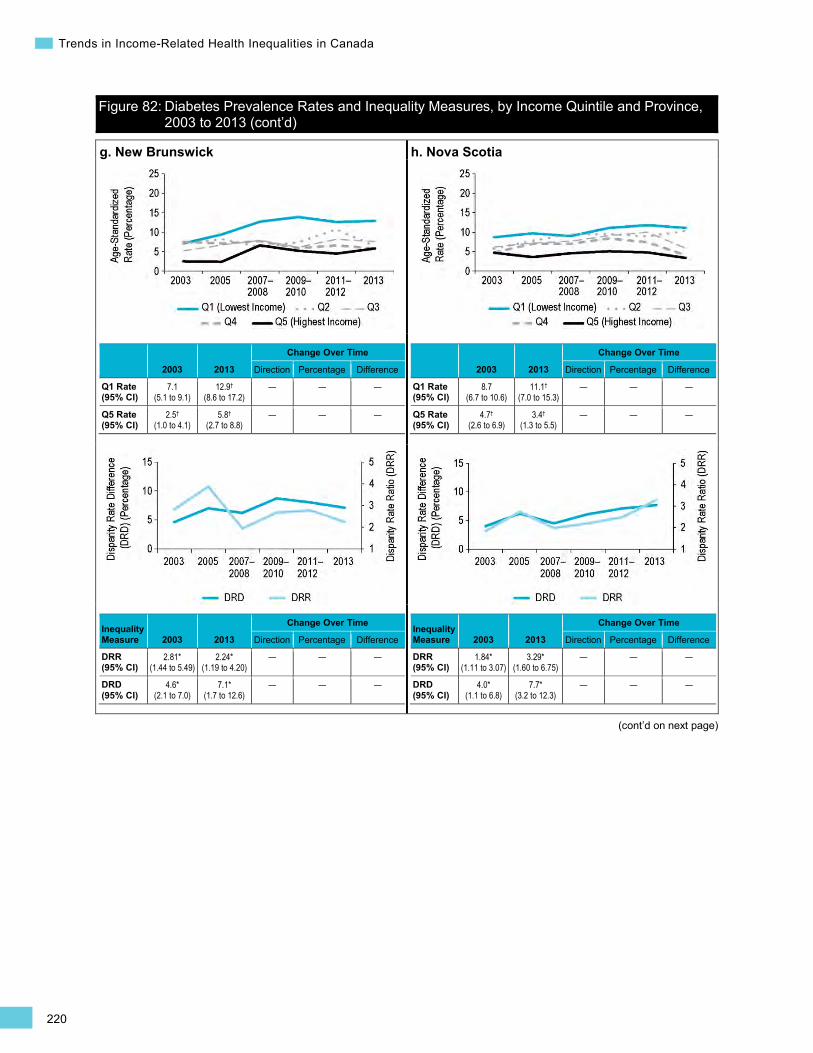
220
Trends in Income-Related Health Inequalities in Canada
Figure 82: Diabetes Prevalence Rates and Inequality Measures, by Income Quintile and Province, 2003 to 2013 (cont’d)
(cont’d on next page)
g. New Brunswick
2003 2013
Change Over Time
Direction Percentage Difference
Q1 Rate (95% CI)
7.1 (5.1 to 9.1)
12.9†
(8.6 to 17.2) — — —
Q5 Rate (95% CI)
2.5†
(1.0 to 4.1) 5.8†
(2.7 to 8.8) — — —
Inequality Measure 2003 2013
Change Over Time
Direction Percentage Difference
DRR (95% CI)
2.81* (1.44 to 5.49)
2.24* (1.19 to 4.20)
— — —
DRD (95% CI)
4.6* (2.1 to 7.0)
7.1* (1.7 to 12.6)
— — —
h. Nova Scotia
2003 2013
Change Over Time
Direction Percentage Difference
Q1 Rate (95% CI)
8.7 (6.7 to 10.6)
11.1†
(7.0 to 15.3) — — —
Q5 Rate (95% CI)
4.7†
(2.6 to 6.9) 3.4†
(1.3 to 5.5) — — —
Inequality Measure 2003 2013
Change Over Time
Direction Percentage Difference
DRR (95% CI)
1.84* (1.11 to 3.07)
3.29* (1.60 to 6.75)
— — —
DRD (95% CI)
4.0* (1.1 to 6.8)
7.7* (3.2 to 12.3)
— — —

221
Section 3: Health and Well-Being Outcomes
Figure 82: Diabetes Prevalence Rates and Inequality Measures, by Income Quintile and Province, 2003 to 2013 (cont’d)
i. Prince Edward Island
2003 2013
Change Over Time
Direction Percentage Difference
Q1 Rate (95% CI)
10.0†
(5.9 to 14.0) 13.9†
(7.9 to 19.9) — — —
Q5 Rate (95% CI)
‡ 5.4†
(2.0 to 8.7) ‡ ‡ ‡
Note Due to suppressed data points in Q5, inequality graphs and tables are not provided for Prince Edward Island. To access Diabetes indicator data for this province, please refer to the downloadable tables on CIHI’s website.
j. Newfoundland and Labrador Note Due to a large number of suppressed data points, graphs and tables are not provided for Newfoundland and Labrador. To access Diabetes indicator data for this province, please refer to the downloadable tables on CIHI’s website.

222
Trends in Income-Related Health Inequalities in Canada
Well-Being Indicator Self-Rated Mental Health Background
The Self-Rated Mental Health indicator captures the prevalence of Canadians age 18 and older who report their mental health as being either fair or poor.
Mental health refers to a general state of well-being, such as having the ability to cope with stress, enjoy life and meaningfully participate in society (e.g., work and social activities).568, 569 Fair or poor self-rated mental health among Canadians has been found to be associated with a wide variety of mental morbidity measures, such as having a self-reported mental disorder diagnosed by a health professional.570 However, persons with mental morbidity may not perceive their mental health as fair or poor. For example, 54% of Canadians in 2002 self-reported having a diagnosed mental health disorder but did not perceive their mental health as fair or poor.570 Moreover, a small percentage of Canadians without mental morbidity perceived their mental health to be fair or poor.570
In 2013, just more than 6% of Canadians reported that their mental health was fair or poor.616 Lower socio-economic status (SES), as measured by income or education, is associated with a greater prevalence of poor mental health and is also associated with difficulties in accessing mental health care.475, 484 Poor mental health can also contribute to lower SES through stigmatization and exclusion from educational and employment opportunities.486 In addition, poor mental health can be associated with poor physical health.571, 572
Indicator Notes Data Source Canadian Community Health Survey (CCHS), Statistics Canada
Income Disaggregator Self-reported adjusted household income from the CCHS
Age Standardization 2011 Canadian standard population
Time Period 2003 to 2013
Please refer to Trends in Income-Related Health Inequalities in Canada: Indicator Definitions for detailed technical notes.
Additional Data National and provincial data for the complete time period and middle income quintiles (Quintile 2 to Quintile 4), as well as provincial data disaggregated by sex, is not presented in this report. This data is available on CIHI’s website in the form of downloadable tables.
Symbols and Abbreviations
* Estimate is statistically significant (i.e., statistically different from 1 for DRR or different from 0 for DRD, PRR, Change Over Time Percentage and Change Over Time Difference, based on the 95% CI)
† Interpret with caution (coefficient of variance from 16.6% to 33.3%)
Q1 Quintile 1 (lowest income quintile)
Q5 Quintile 5 (highest income quintile)
95% CI 95% confidence interval
‡ Suppressed value due to small case count or unstable estimate
↑ Statistically significant increase between 2003 estimate and 2013 estimate
↓ Statistically significant decrease between 2003 estimate and 2013 estimate
— No statistically significant change between 2003 estimate and 2013 estimate
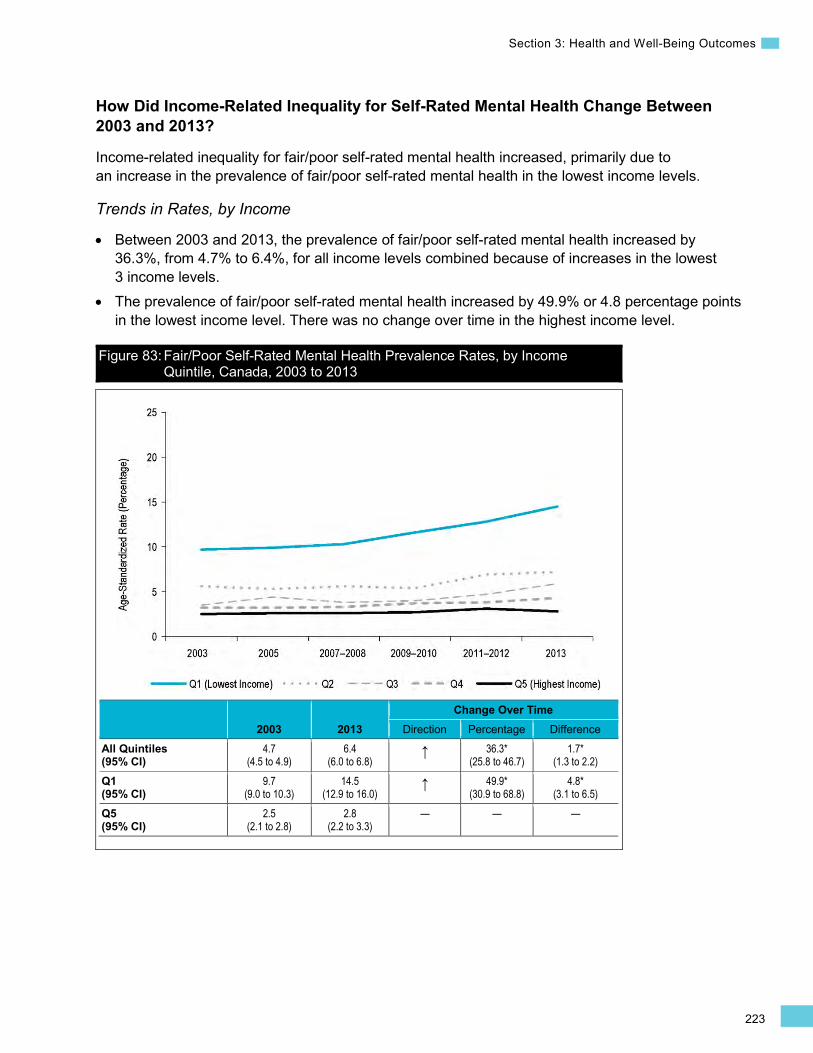
223
Section 3: Health and Well-Being Outcomes
How Did Income-Related Inequality for Self-Rated Mental Health Change Between 2003 and 2013?
Income-related inequality for fair/poor self-rated mental health increased, primarily due to an increase in the prevalence of fair/poor self-rated mental health in the lowest income levels.
Trends in Rates, by Income
• Between 2003 and 2013, the prevalence of fair/poor self-rated mental health increased by 36.3%, from 4.7% to 6.4%, for all income levels combined because of increases in the lowest 3 income levels.
• The prevalence of fair/poor self-rated mental health increased by 49.9% or 4.8 percentage points in the lowest income level. There was no change over time in the highest income level.
Figure 83: Fair/Poor Self-Rated Mental Health Prevalence Rates, by Income Quintile, Canada, 2003 to 2013
2003 2013 Change Over Time
Direction Percentage Difference All Quintiles (95% CI)
4.7 (4.5 to 4.9)
6.4 (6.0 to 6.8)
↑ 36.3* (25.8 to 46.7)
1.7* (1.3 to 2.2)
Q1 (95% CI)
9.7 (9.0 to 10.3)
14.5 (12.9 to 16.0)
↑ 49.9* (30.9 to 68.8)
4.8* (3.1 to 6.5)
Q5 (95% CI)
2.5 (2.1 to 2.8)
2.8 (2.2 to 3.3)
— — —
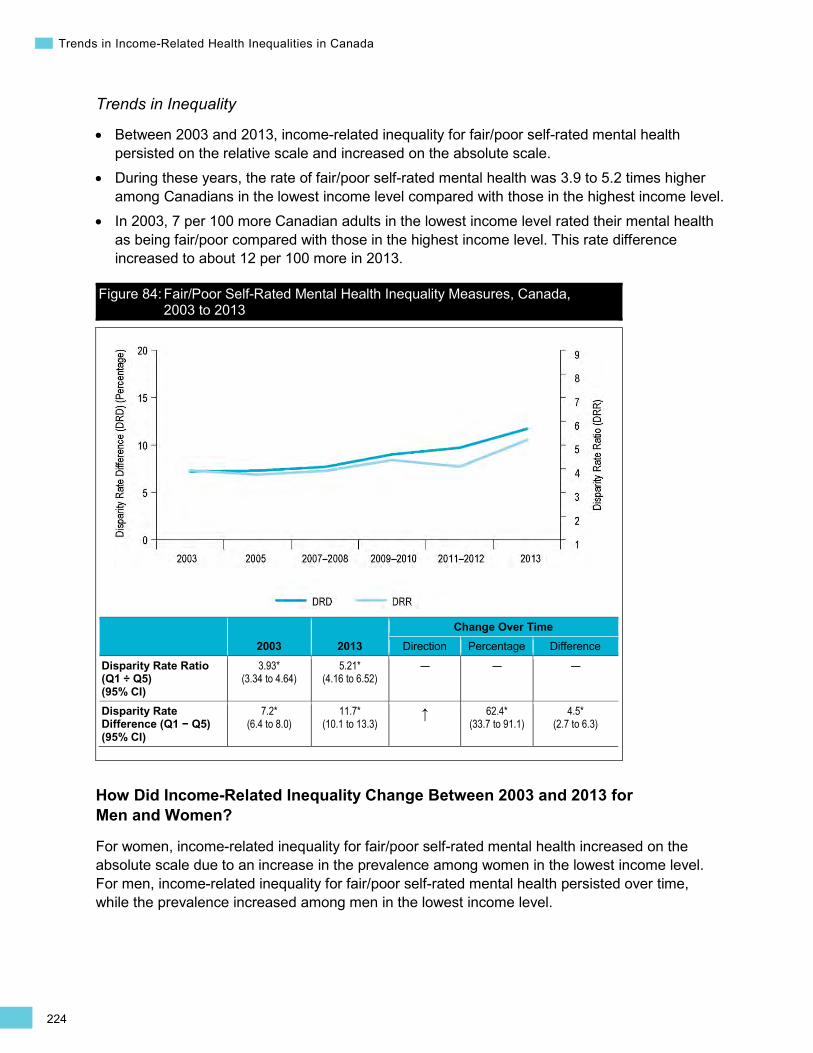
224
Trends in Income-Related Health Inequalities in Canada
Trends in Inequality
• Between 2003 and 2013, income-related inequality for fair/poor self-rated mental health persisted on the relative scale and increased on the absolute scale.
• During these years, the rate of fair/poor self-rated mental health was 3.9 to 5.2 times higher among Canadians in the lowest income level compared with those in the highest income level.
• In 2003, 7 per 100 more Canadian adults in the lowest income level rated their mental health as being fair/poor compared with those in the highest income level. This rate difference increased to about 12 per 100 more in 2013.
Figure 84: Fair/Poor Self-Rated Mental Health Inequality Measures, Canada, 2003 to 2013
2003 2013 Change Over Time
Direction Percentage Difference
Disparity Rate Ratio (Q1 ÷ Q5) (95% CI)
3.93* (3.34 to 4.64)
5.21* (4.16 to 6.52)
— — —
Disparity Rate Difference (Q1 − Q5) (95% CI)
7.2* (6.4 to 8.0)
11.7* (10.1 to 13.3)
↑ 62.4* (33.7 to 91.1)
4.5* (2.7 to 6.3)
How Did Income-Related Inequality Change Between 2003 and 2013 for Men and Women?
For women, income-related inequality for fair/poor self-rated mental health increased on the absolute scale due to an increase in the prevalence among women in the lowest income level. For men, income-related inequality for fair/poor self-rated mental health persisted over time, while the prevalence increased among men in the lowest income level.

225
Section 3: Health and Well-Being Outcomes
•
Men Women
Trends in Rates, by Income and Sex
Between 2003 and 2013, for both sexes, the prevalence of fair/poor self-rated mental health increased for all income levels combined. This was due to an increase in the prevalence of fair/poor self-rated mental health in the lowest income level, while there was no change in the highest income level.
Figure 85: Fair/Poor Self-Rated Mental Health Prevalence Rates, by Income Quintile and Sex, Canada, 2003 to 2013
Men Women
2003 2013
Change Over Time
2003 2013
Change Over Time
Direction Percentage Difference Direction Percentage Difference
All Quintiles (95% CI)
4.3 (4.0 to 4.6)
5.9 (5.4 to 6.5) ↑ 36.7*
(20.9 to 52.4) 1.6*
(1.0 to 2.2) 5.1
(4.9 to 5.4) 7.0
(6.4 to 7.6) ↑ 35.8* (22.0 to 49.6)
1.8* (1.2 to 2.5)
Q1 (95% CI)
9.2 (8.2 to 10.3)
13.2 (11.1 to 15.2) ↑ 42.5*
(14.9 to 70.1) 3.9*
(1.6 to 6.2) 10.1
(9.1 to 11.0) 15.4
(13.2 to 17.5) ↑ 52.9* (27.3 to 78.5)
5.3* (3.0 to 7.7)
Q5 (95% CI)
2.4 (1.9 to 2.9)
3.1 (2.3 to 3.9)
— — — 2.7 (2.0 to 3.3)
2.4 (1.7 to 3.0)
— — —
Trends in Inequality, by Sex
• For men, income-related inequality in fair/poor self-rated mental health persisted on both the relative and absolute scales between 2003 and 2013.
• For women, income-related inequality in fair/poor self-rated mental health persisted on the relative scale and increased on the absolute scale.
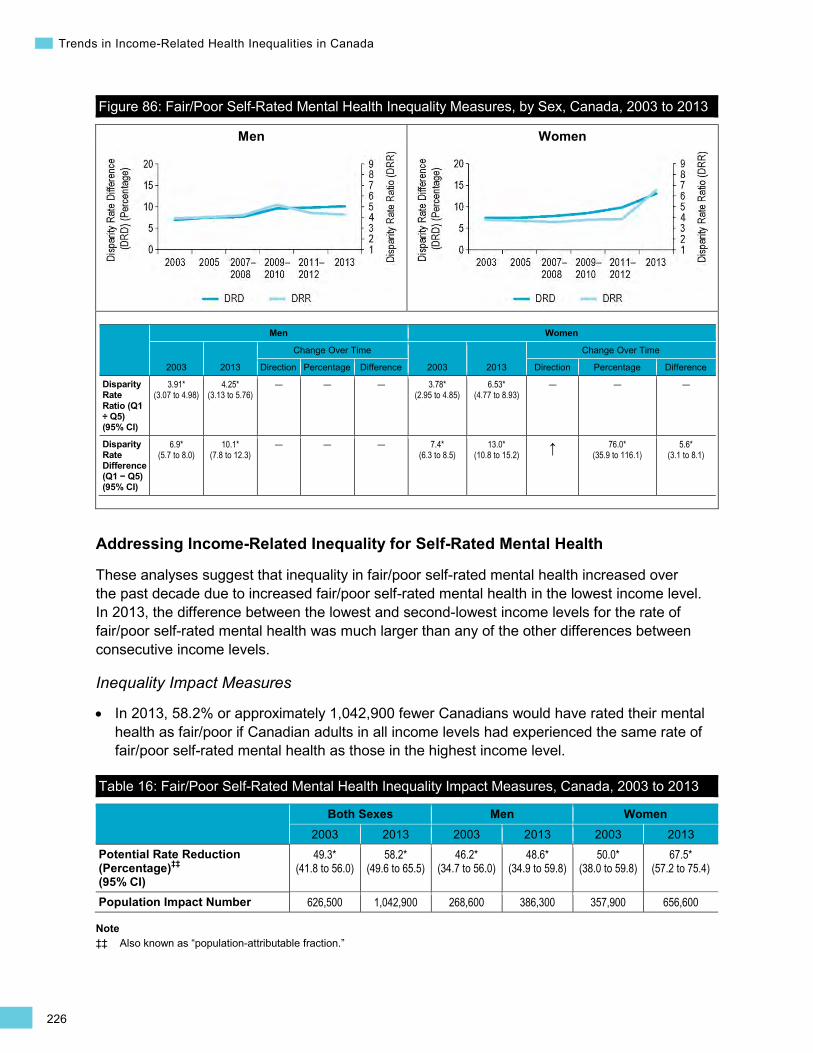
226
Trends in Income-Related Health Inequalities in Canada
•
Men Women
Figure 86: Fair/Poor Self-Rated Mental Health Inequality Measures, by Sex, Canada, 2003 to 2013
Men Women
2003 2013
Change Over Time
2003 2013
Change Over Time
Direction Percentage Difference Direction Percentage Difference
Disparity Rate Ratio (Q1 ÷ Q5) (95% CI)
3.91* (3.07 to 4.98)
4.25* (3.13 to 5.76)
— — — 3.78* (2.95 to 4.85)
6.53* (4.77 to 8.93)
— — —
Disparity Rate Difference (Q1 − Q5) (95% CI)
6.9* (5.7 to 8.0)
10.1* (7.8 to 12.3)
— — — 7.4* (6.3 to 8.5)
13.0* (10.8 to 15.2) ↑ 76.0*
(35.9 to 116.1) 5.6*
(3.1 to 8.1)
Addressing Income-Related Inequality for Self-Rated Mental Health
These analyses suggest that inequality in fair/poor self-rated mental health increased over the past decade due to increased fair/poor self-rated mental health in the lowest income level. In 2013, the difference between the lowest and second-lowest income levels for the rate of fair/poor self-rated mental health was much larger than any of the other differences between consecutive income levels.
Inequality Impact Measures
In 2013, 58.2% or approximately 1,042,900 fewer Canadians would have rated their mental health as fair/poor if Canadian adults in all income levels had experienced the same rate of fair/poor self-rated mental health as those in the highest income level.
Table 16: Fair/Poor Self-Rated Mental Health Inequality Impact Measures, Canada, 2003 to 2013
Both Sexes Men Women 2003 2013 2003 2013 2003 2013
Potential Rate Reduction (Percentage)‡‡ (95% CI)
49.3* (41.8 to 56.0)
58.2* (49.6 to 65.5)
46.2* (34.7 to 56.0)
48.6* (34.9 to 59.8)
50.0* (38.0 to 59.8)
67.5* (57.2 to 75.4)
Population Impact Number 626,500 1,042,900 268,600 386,300 357,900 656,600
Note ‡‡ Also known as “population-attributable fraction.”

227
Section 3: Health and Well-Being Outcomes
Approaches for Addressing Inequality
Mental health promotion is grounded in a population health approach, as it considers the wide range of social, economic and environmental factors that influence mental health.569 Across Canada and internationally, there is a growing recognition that several broad approaches for promoting mental health are needed, including the following:
• Creating more supportive environments to foster positive well-being and to build social support networks in schools, workplaces and other social settings.569, 573, 574
• Focusing on broader determinants of mental health, including poverty, housing, unemployment, education and early life experiences and development.475, 487, 569, 572, 575 For example, investments in poverty reduction are important for reducing inequalities in mental health because of the associations between social and economic disadvantage and mental health.475, 572, 576 To address the range of determinants affecting mental health, collaborations across different levels and sectors of government (e.g., justice, education) and with stakeholders outside of government may be required.475, 569, 572, 574
• Increasing the resilience of individuals and communities by building capacity to cope with stresses of daily life.569, 572, 574, 577 Increasing resilience could also be expected to contribute to a reduction in inequalities, as exposure to stressful life events is more common for disadvantaged populations.569
• Promoting awareness and understanding of mental illness in order to reduce the stigma associated with mental illness.475, 487, 569, 574
To support decision-making and program development, more evidence is required on the effectiveness of mental health promotion interventions.475, 575, 576 In particular, interventions should be evaluated using a health equity lens to inform what works to reduce inequalities in the burden of poor mental health and the distribution of mental wellness.475
While early evidence suggests that the greatest return on investment for mental health promotion activities can be achieved by targeting children and youth, the evidence base is still emerging to evaluate the cost-effectiveness of mental health promotion activities.578 The Nobody’s Perfect intervention is an example of an approach that aims to improve mental health by targeting new parents who are socio-economically disadvantaged and their children (see Box 21).
228
Trends in Income-Related Health Inequalities in Canada
Box 21: Nobody’s Perfect, National, 1987 to Present Issue: Parenting without proper resources and support can create a significant amount of stress. Many parents feel unprepared or lack the confidence, support or resources for the challenges of parenting.579 Parenting styles also affect the health outcomes of children and how well they develop.577 Supportive home environments and family relationships help to create and maintain resiliency and foster mental well-being among both parents and children.577
Intervention: Nobody’s Perfect aims to meet the needs of single young parents who have low income and low education, and who are socially, geographically or culturally isolated.580 The program is a series of facilitated group sessions carried out over a 6- to 8-week period that cover a number of topics ranging from health to child development. The program also facilitates the development of support networks for parents and connects them with community-based resources and support mechanisms.
Rationale/Evidence: Nobody’s Perfect has been evaluated numerous times over the years with different methodologies and goals.580, 581 The program was evaluated to determine the impact on both parents and children through the parent–child relationship. The impact of the program on self-rated mental health was not measured directly. However, the program was associated with positive outcomes related to increased resilience in coping with stressors that can negatively affect mental health.580 The evaluation also noted an increase in parents’ ability to solve problems and cope with stressors.580 Evaluations also noted more positive parent–child interactions, increased confidence of parents in dealing with the stresses affecting them, increased peer support and an increased knowledge of available community resources and supports.581 The effect on positive parent–child interactions, however, had disappeared 6 months after the intervention. Evaluations using pre- and post-test methodologies and comparing results with a control group noted a significant decrease in the use of spanking and an increase in positive discipline.580 It should be noted that establishing direct links to 1 particular program is difficult given the variety of resources and programs at work in supporting new parents.
How Did Income-Related Inequality for Self-Rated Mental Health Change Between 2003 and 2013 by Province?
• Interpretations of inequality patterns are limited at the provincial level because many rate estimates, particularly for the highest income levels, are suppressed or flagged as “interpret with caution” due to small numbers.
• The rate of fair/poor self-rated mental health increased in the lowest income level in British Columbia, Manitoba, Saskatchewan, Ontario and Nova Scotia. This led to an increase in absolute inequality in British Columbia and Ontario.
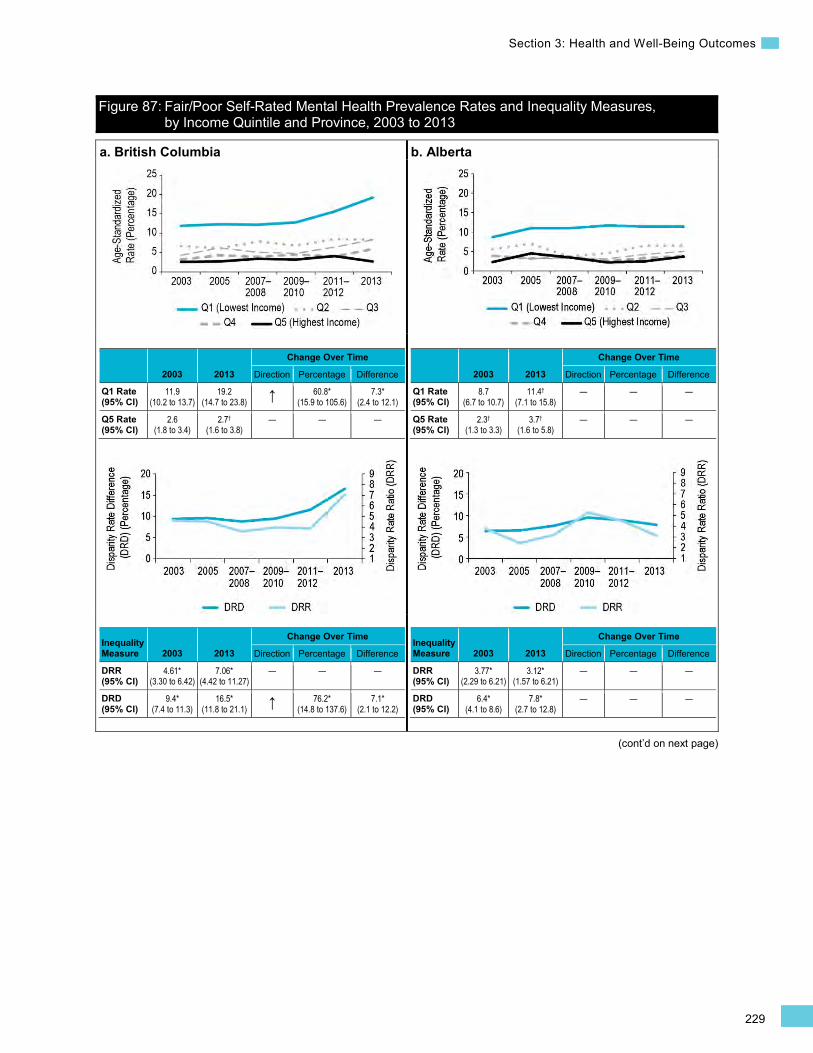
229
Section 3: Health and Well-Being Outcomes
(cont’d on next page)
Figure 87: Fair/Poor Self-Rated Mental Health Prevalence Rates and Inequality Measures, by Income Quintile and Province, 2003 to 2013
a. British Columbia
2003 2013
Change Over Time
Direction Percentage Difference
Q1 Rate (95% CI)
11.9 (10.2 to 13.7)
19.2 (14.7 to 23.8) ↑ 60.8*
(15.9 to 105.6) 7.3*
(2.4 to 12.1)
Q5 Rate (95% CI)
2.6 (1.8 to 3.4)
2.7†
(1.6 to 3.8) — — —
Inequality Measure 2003 2013
Change Over Time
Direction Percentage Difference
DRR (95% CI)
4.61* (3.30 to 6.42)
7.06* (4.42 to 11.27)
— — —
DRD (95% CI)
9.4* (7.4 to 11.3)
16.5* (11.8 to 21.1) ↑ 76.2*
(14.8 to 137.6) 7.1*
(2.1 to 12.2)
b. Alberta
2003 2013
Change Over Time
Direction Percentage Difference
Q1 Rate (95% CI)
8.7 (6.7 to 10.7)
11.4†
(7.1 to 15.8) — — —
Q5 Rate (95% CI)
2.3†
(1.3 to 3.3) 3.7†
(1.6 to 5.8) — — —
Inequality Measure 2003 2013
Change Over Time
Direction Percentage Difference
DRR (95% CI)
3.77* (2.29 to 6.21)
3.12* (1.57 to 6.21)
— — —
DRD (95% CI)
6.4* (4.1 to 8.6)
7.8* (2.7 to 12.8)
— — —
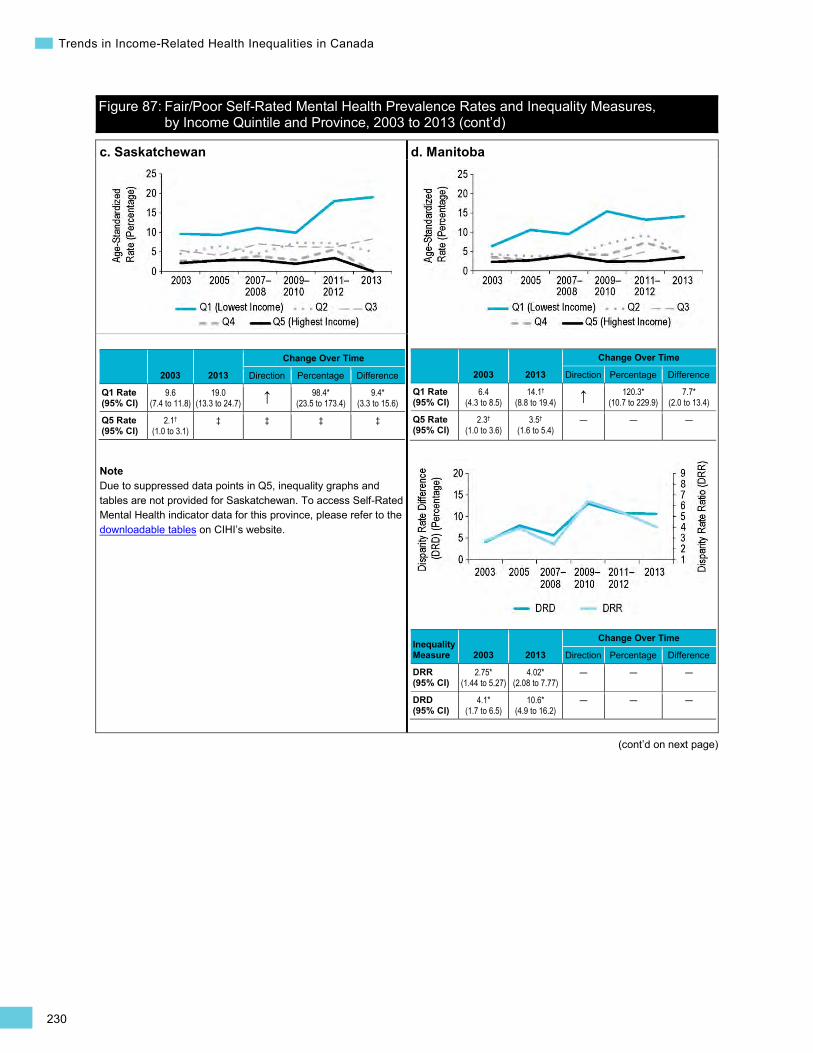
230
Trends in Income-Related Health Inequalities in Canada
Figure 87: Fair/Poor Self-Rated Mental Health Prevalence Rates and Inequality Measures, by Income Quintile and Province, 2003 to 2013 (cont’d)
(cont’d on next page)
c. Saskatchewan
2003 2013
Change Over Time
Direction Percentage Difference
Q1 Rate (95% CI)
9.6 (7.4 to 11.8)
19.0 (13.3 to 24.7) ↑ 98.4*
(23.5 to 173.4) 9.4*
(3.3 to 15.6)
Q5 Rate (95% CI)
2.1†
(1.0 to 3.1) ‡ ‡ ‡ ‡
Note Due to suppressed data points in Q5, inequality graphs and tables are not provided for Saskatchewan. To access Self-Rated Mental Health indicator data for this province, please refer to the downloadable tables on CIHI’s website.
d. Manitoba
2003 2013
Change Over Time
Direction Percentage Difference
Q1 Rate (95% CI)
6.4 (4.3 to 8.5)
14.1†
(8.8 to 19.4) ↑ 120.3* (10.7 to 229.9)
7.7* (2.0 to 13.4)
Q5 Rate (95% CI)
2.3†
(1.0 to 3.6) 3.5†
(1.6 to 5.4) — — —
Inequality Measure 2003 2013
Change Over Time
Direction Percentage Difference
DRR (95% CI)
2.75* (1.44 to 5.27)
4.02* (2.08 to 7.77)
— — —
DRD (95% CI)
4.1* (1.7 to 6.5)
10.6* (4.9 to 16.2)
— — —
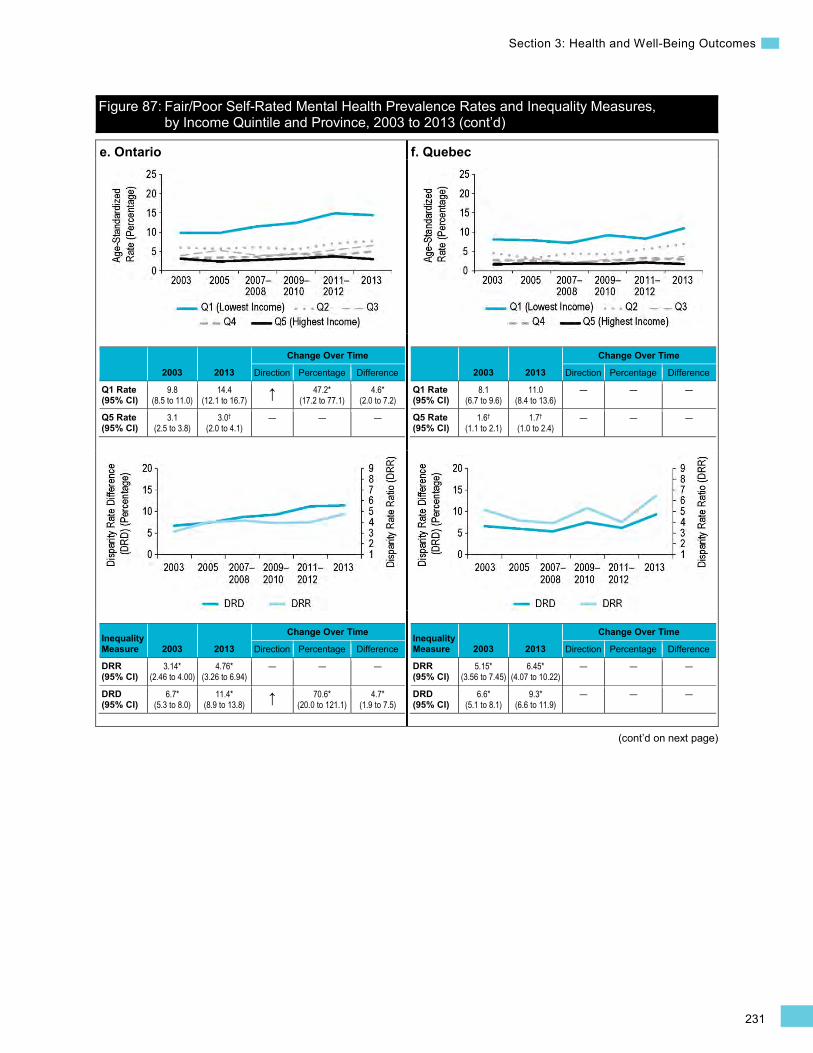
231
Section 3: Health and Well-Being Outcomes
Figure 87: Fair/Poor Self-Rated Mental Health Prevalence Rates and Inequality Measures, by Income Quintile and Province, 2003 to 2013 (cont’d)
(cont’d on next page)
e. Ontario
2003 2013
Change Over Time
Direction Percentage Difference
Q1 Rate (95% CI)
9.8 (8.5 to 11.0)
14.4 (12.1 to 16.7) ↑ 47.2*
(17.2 to 77.1) 4.6*
(2.0 to 7.2)
Q5 Rate (95% CI)
3.1 (2.5 to 3.8)
3.0†
(2.0 to 4.1) — — —
Inequality Measure 2003 2013
Change Over Time
Direction Percentage Difference
DRR (95% CI)
3.14* (2.46 to 4.00)
4.76* (3.26 to 6.94)
— — —
DRD (95% CI)
6.7* (5.3 to 8.0)
11.4* (8.9 to 13.8) ↑ 70.6*
(20.0 to 121.1) 4.7*
(1.9 to 7.5)
f. Quebec
2003 2013
Change Over Time
Direction Percentage Difference
Q1 Rate (95% CI)
8.1 (6.7 to 9.6)
11.0 (8.4 to 13.6)
— — —
Q5 Rate (95% CI)
1.6†
(1.1 to 2.1) 1.7†
(1.0 to 2.4) — — —
Inequality Measure 2003 2013
Change Over Time
Direction Percentage Difference
DRR (95% CI)
5.15* (3.56 to 7.45)
6.45* (4.07 to 10.22)
— — —
DRD (95% CI)
6.6* (5.1 to 8.1)
9.3* (6.6 to 11.9)
— — —
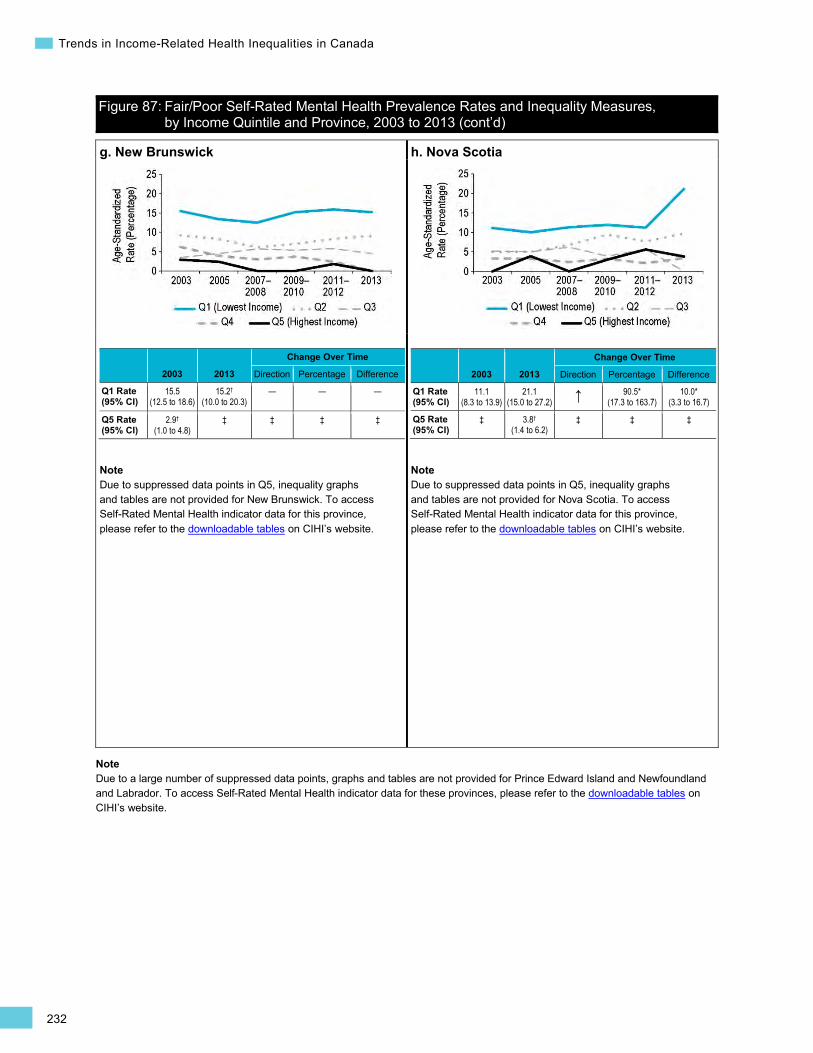
232
Trends in Income-Related Health Inequalities in Canada
Figure 87: Fair/Poor Self-Rated Mental Health Prevalence Rates and Inequality Measures, by Income Quintile and Province, 2003 to 2013 (cont’d)
g. New Brunswick
2003 2013
Change Over Time
Direction Percentage Difference
Q1 Rate (95% CI)
15.5 (12.5 to 18.6)
15.2†
(10.0 to 20.3) — — —
Q5 Rate (95% CI)
2.9†
(1.0 to 4.8) ‡ ‡ ‡ ‡
Note Due to suppressed data points in Q5, inequality graphs and tables are not provided for New Brunswick. To access Self-Rated Mental Health indicator data for this province, please refer to the downloadable tables on CIHI’s website.
h. Nova Scotia
2003 2013
Change Over Time
Direction Percentage Difference
Q1 Rate (95% CI)
11.1 (8.3 to 13.9)
21.1 (15.0 to 27.2) ↑ 90.5*
(17.3 to 163.7) 10.0*
(3.3 to 16.7)
Q5 Rate (95% CI)
‡ 3.8†
(1.4 to 6.2) ‡ ‡ ‡
Note Due to suppressed data points in Q5, inequality graphs and tables are not provided for Nova Scotia. To access Self-Rated Mental Health indicator data for this province, please refer to the downloadable tables on CIHI’s website.
Note Due to a large number of suppressed data points, graphs and tables are not provided for Prince Edward Island and Newfoundland and Labrador. To access Self-Rated Mental Health indicator data for these provinces, please refer to the downloadable tables on CIHI’s website.
233
Section 3: Health and Well-Being Outcomes
Mortality Indicator Infant Mortality Background
The Infant Mortality indicator captures the number of infants who die in the first year of life, expressed as a rate per 1,000 live births within a given year.582
In 2011, approximately 1,810 babies (or 4.8 per 1,000 births) died within their first year of life in Canada.583 The most common causes of infant death (based on 2005 to 2009 Canadian data) were immaturity (29.4%), congenital anomalies (22%), asphyxia (10.4%) and sudden infant death syndrome (6.4%).584 It is difficult to estimate the economic and social consequences of infant mortality. When the death is preceded by illness, acute care and/or palliative care, treatment costs may be incurred. In 2011, approximately 1,600 babies younger than 1 year died in an acute care hospital, with hospitalization costs averaging an estimated $20,800 per stay (Canadian MIS Database, unpublished data). The loss of a baby within the first year of life can also negatively affect the psychological and physical well-being of parents and other family members.585–587
Infant mortality is an established indicator of maternal and child health and, by extension, the health of a population. A wide range of factors has been found to be associated with infant mortality, including socio-economic status (SES) and educational attainment,273, 588, 589 quality of living conditions and environments, health behaviours, and access to and use of adequate health care services.590–594
Indicator Notes Data Source Canadian Vital Statistics, Birth Database and Death Database, Statistics Canada
Income Disaggregator Neighbourhood-level income from the Postal Code Conversion File, Statistics Canada
Time Period 2001 (2000 to 2002), 2006 (2005 to 2007), 2011 (2009 to 2011)
Please refer to Trends in Income-Related Health Inequalities in Canada: Indicator Definitions for detailed technical notes.
Additional Data National and provincial data for the complete time period and middle income quintiles (Quintile 2 to Quintile 4) is not presented in this report. This data is available on CIHI’s website in the form of downloadable tables.
Symbols and Abbreviations
* Estimate is statistically significant (i.e., statistically different from 1 for DRR or different from 0 for DRD, PRR, Change Over Time Percentage and Change Over Time Difference, based on the 95% CI)
Q1 Quintile 1 (lowest income quintile)
Q5 Quintile 5 (highest income quintile)
95% CI 95% confidence interval
↑ Statistically significant increase between 2001 estimate and 2011 estimate
↓ Statistically significant decrease between 2001 estimate and 2011 estimate — No statistically significant change between 2001 estimate and 2011 estimate
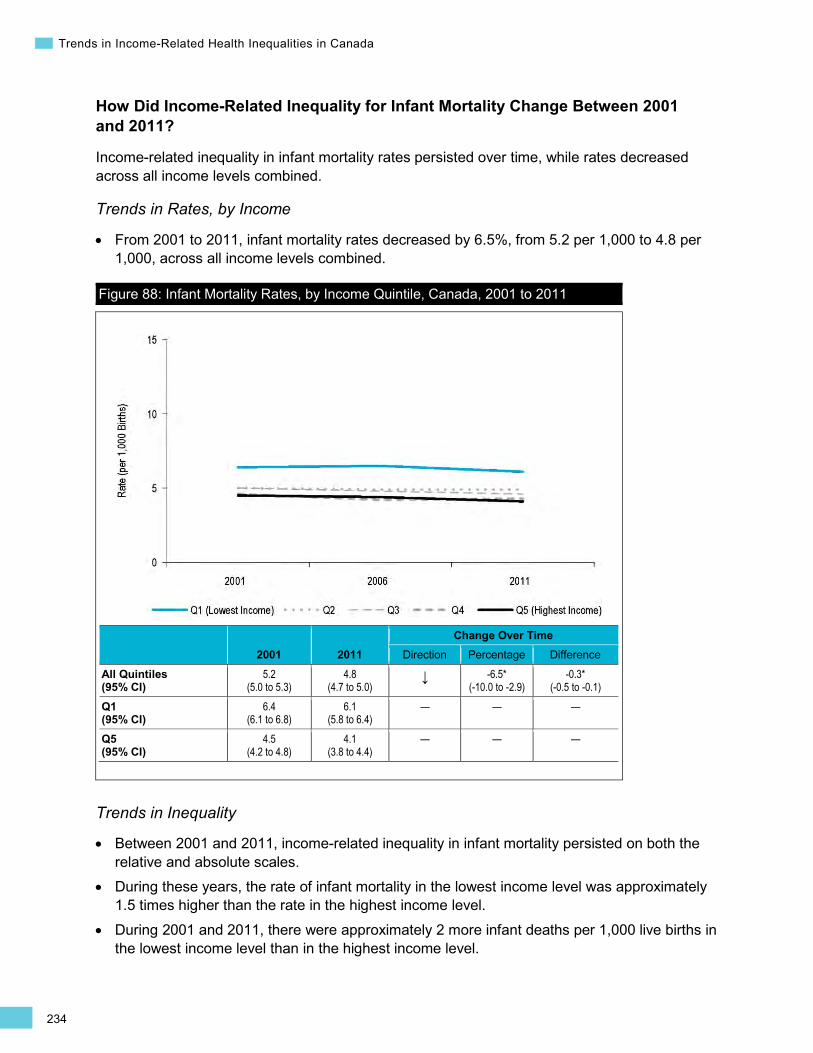
234
Trends in Income-Related Health Inequalities in Canada
•
How Did Income-Related Inequality for Infant Mortality Change Between 2001 and 2011?
Income-related inequality in infant mortality rates persisted over time, while rates decreased across all income levels combined.
Trends in Rates, by Income
From 2001 to 2011, infant mortality rates decreased by 6.5%, from 5.2 per 1,000 to 4.8 per 1,000, across all income levels combined.
Figure 88: Infant Mortality Rates, by Income Quintile, Canada, 2001 to 2011
2001 2011 Change Over Time
Direction Percentage Difference
All Quintiles (95% CI)
5.2 (5.0 to 5.3)
4.8 (4.7 to 5.0)
↓ -6.5* (-10.0 to -2.9)
-0.3* (-0.5 to -0.1)
Q1 (95% CI)
6.4 (6.1 to 6.8)
6.1 (5.8 to 6.4)
— — —
Q5 (95% CI)
4.5 (4.2 to 4.8)
4.1 (3.8 to 4.4)
— — —
Trends in Inequality
• Between 2001 and 2011, income-related inequality in infant mortality persisted on both the relative and absolute scales.
• During these years, the rate of infant mortality in the lowest income level was approximately 1.5 times higher than the rate in the highest income level.
• During 2001 and 2011, there were approximately 2 more infant deaths per 1,000 live births in the lowest income level than in the highest income level.
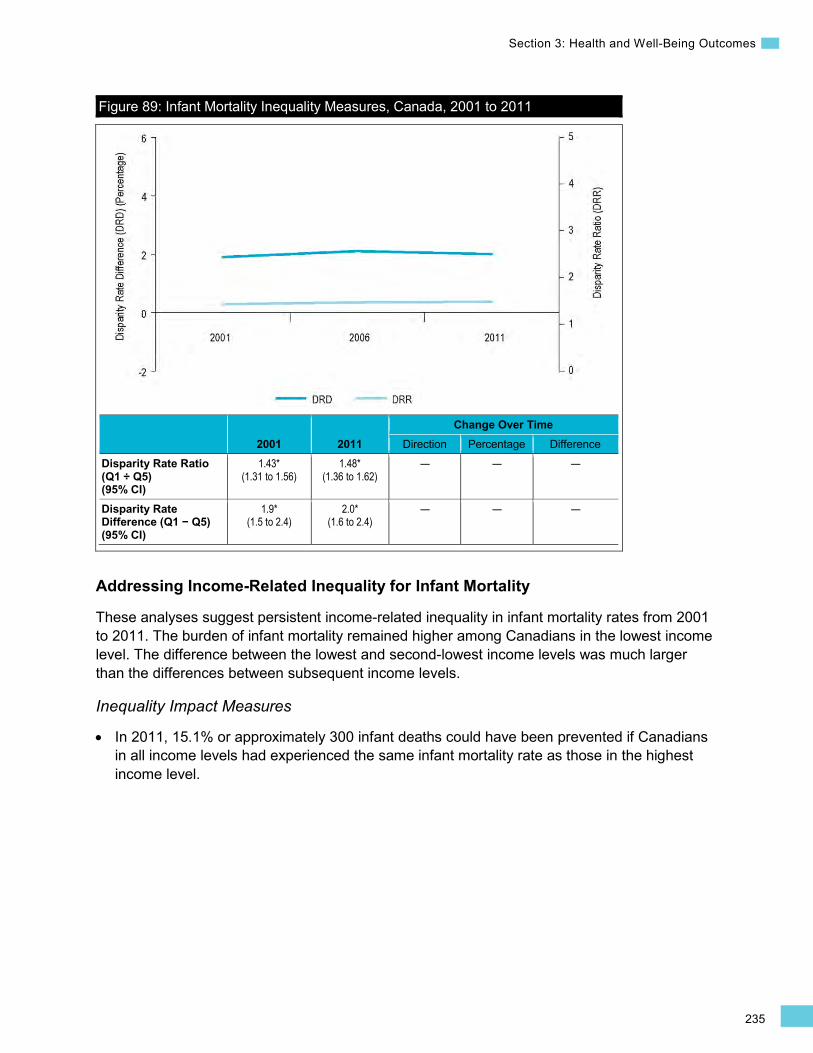
235
Section 3: Health and Well-Being Outcomes
Figure 89: Infant Mortality Inequality Measures, Canada, 2001 to 2011
2001 2011 Change Over Time
Direction Percentage Difference Disparity Rate Ratio (Q1 ÷ Q5) (95% CI)
1.43* (1.31 to 1.56)
1.48* (1.36 to 1.62)
— — —
Disparity Rate Difference (Q1 − Q5) (95% CI)
1.9* (1.5 to 2.4)
2.0* (1.6 to 2.4)
— — —
Addressing Income-Related Inequality for Infant Mortality
These analyses suggest persistent income-related inequality in infant mortality rates from 2001 to 2011. The burden of infant mortality remained higher among Canadians in the lowest income level. The difference between the lowest and second-lowest income levels was much larger than the differences between subsequent income levels.
Inequality Impact Measures
In 2011, 15.1% or approximately 300 infant deaths could have been prevented if Canadians in all income levels had experienced the same infant mortality rate as those in the highest income level.
•
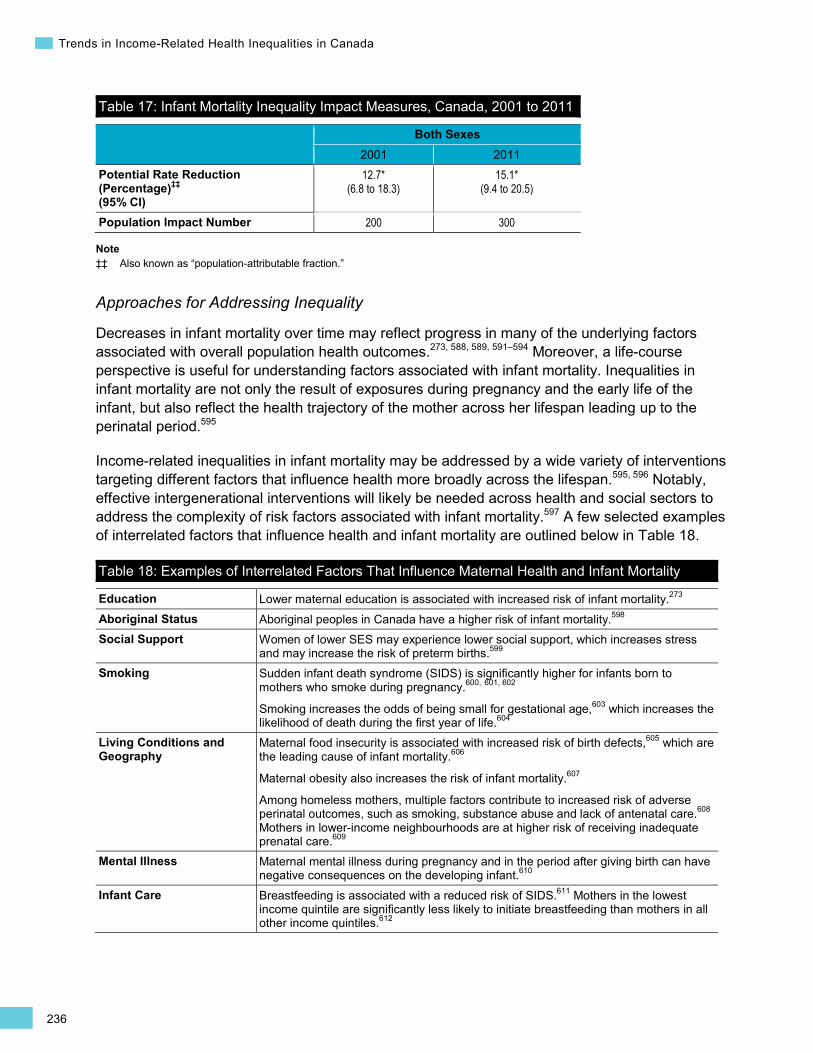
236
Trends in Income-Related Health Inequalities in Canada
Table 17: Infant Mortality Inequality Impact Measures, Canada, 2001 to 2011
Both Sexes 2001 2011
Potential Rate Reduction (Percentage)‡‡ (95% CI)
12.7* (6.8 to 18.3)
15.1* (9.4 to 20.5)
Population Impact Number 200 300
Note ‡‡ Also known as “population-attributable fraction.”
Approaches for Addressing Inequality
Decreases in infant mortality over time may reflect progress in many of the underlying factors associated with overall population health outcomes.273, 588, 589, 591–594 Moreover, a life-course perspective is useful for understanding factors associated with infant mortality. Inequalities in infant mortality are not only the result of exposures during pregnancy and the early life of the infant, but also reflect the health trajectory of the mother across her lifespan leading up to the perinatal period.595
Income-related inequalities in infant mortality may be addressed by a wide variety of interventions targeting different factors that influence health more broadly across the lifespan.595, 596 Notably, effective intergenerational interventions will likely be needed across health and social sectors to address the complexity of risk factors associated with infant mortality.597 A few selected examples of interrelated factors that influence health and infant mortality are outlined below in Table 18.
Table 18: Examples of Interrelated Factors That Influence Maternal Health and Infant Mortality
Education Lower maternal education is associated with increased risk of infant mortality.273
Aboriginal Status Aboriginal peoples in Canada have a higher risk of infant mortality.598
Social Support Women of lower SES may experience lower social support, which increases stress and may increase the risk of preterm births.599
Smoking Sudden infant death syndrome (SIDS) is significantly higher for infants born to mothers who smoke during pregnancy.600, 601, 602
Smoking increases the odds of being small for gestational age,603 which increases the likelihood of death during the first year of life.604
Living Conditions and Geography
Maternal food insecurity is associated with increased risk of birth defects,605 which are the leading cause of infant mortality.606
Maternal obesity also increases the risk of infant mortality.607
Among homeless mothers, multiple factors contribute to increased risk of adverse perinatal outcomes, such as smoking, substance abuse and lack of antenatal care.608 Mothers in lower-income neighbourhoods are at higher risk of receiving inadequate prenatal care.609
Mental Illness Maternal mental illness during pregnancy and in the period after giving birth can have negative consequences on the developing infant.610
Infant Care Breastfeeding is associated with a reduced risk of SIDS.611 Mothers in the lowest income quintile are significantly less likely to initiate breastfeeding than mothers in all other income quintiles.612
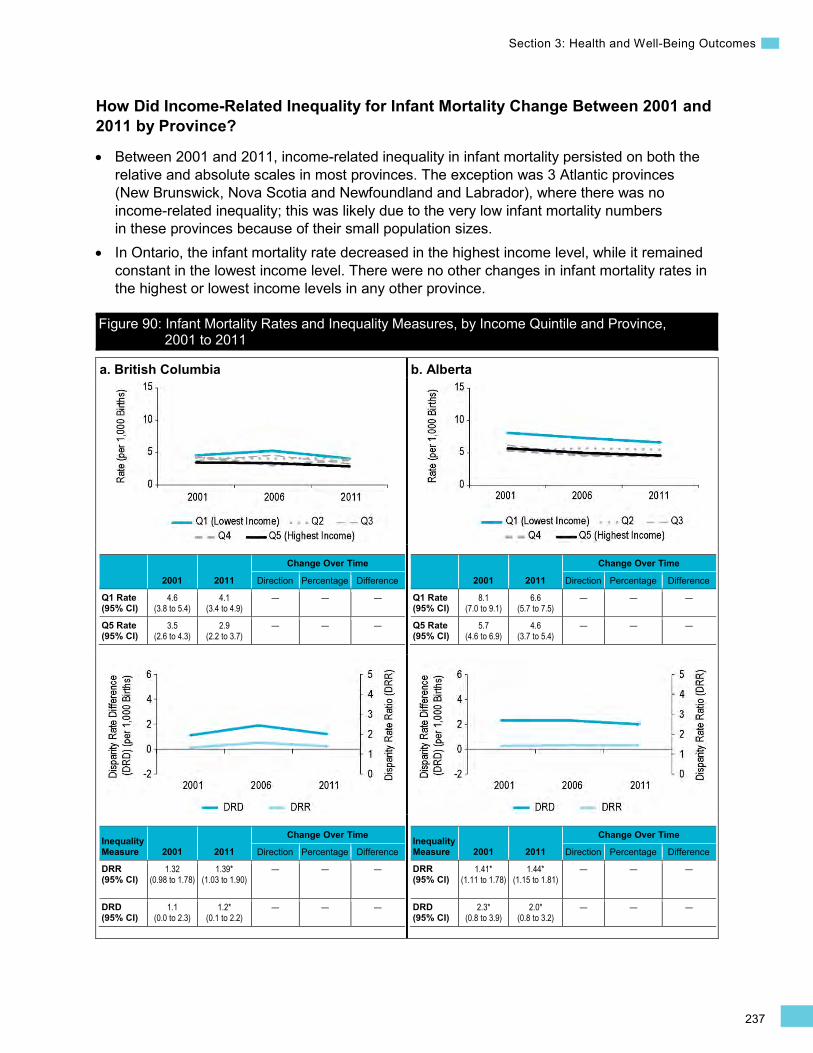
237
Section 3: Health and Well-Being Outcomes
How Did Income-Related Inequality for Infant Mortality Change Between 2001 and 2011 by Province?
• Between 2001 and 2011, income-related inequality in infant mortality persisted on both the relative and absolute scales in most provinces. The exception was 3 Atlantic provinces (New Brunswick, Nova Scotia and Newfoundland and Labrador), where there was no income-related inequality; this was likely due to the very low infant mortality numbers in these provinces because of their small population sizes.
• In Ontario, the infant mortality rate decreased in the highest income level, while it remained constant in the lowest income level. There were no other changes in infant mortality rates in the highest or lowest income levels in any other province.
Figure 90: Infant Mortality Rates and Inequality Measures, by Income Quintile and Province, 2001 to 2011
a. British Columbia
2001 2011
Change Over Time
Direction Percentage Difference
Q1 Rate (95% CI)
4.6 (3.8 to 5.4)
4.1 (3.4 to 4.9)
— — —
Q5 Rate (95% CI)
3.5 (2.6 to 4.3)
2.9 (2.2 to 3.7)
— — —
Inequality Measure 2001 2011
Change Over Time
Direction Percentage Difference
DRR (95% CI)
1.32 (0.98 to 1.78)
1.39* (1.03 to 1.90)
— — —
DRD (95% CI)
1.1 (0.0 to 2.3)
1.2* (0.1 to 2.2)
— — —
b. Alberta
2001 2011
Change Over Time
Direction Percentage Difference
Q1 Rate (95% CI)
8.1 (7.0 to 9.1)
6.6 (5.7 to 7.5)
— — —
Q5 Rate (95% CI)
5.7 (4.6 to 6.9)
4.6 (3.7 to 5.4)
— — —
Inequality Measure 2001 2011
Change Over Time
Direction Percentage Difference
DRR (95% CI)
1.41* (1.11 to 1.78)
1.44* (1.15 to 1.81)
— — —
DRD (95% CI)
2.3* (0.8 to 3.9)
2.0* (0.8 to 3.2)
— — —
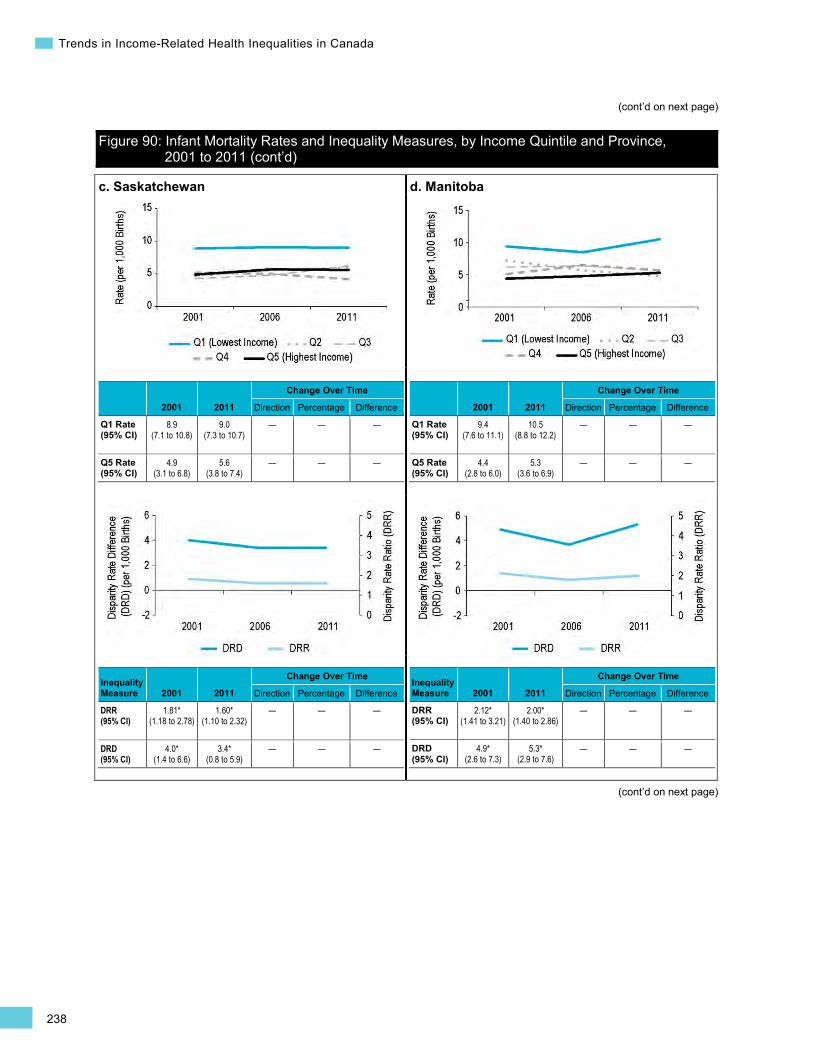
238
Trends in Income-Related Health Inequalities in Canada
(cont’d on next page)
Figure 90: Infant Mortality Rates and Inequality Measures, by Income Quintile and Province, 2001 to 2011 (cont’d)
(cont’d on next page)
c. Saskatchewan
2001 2011
Change Over Time
Direction Percentage Difference
Q1 Rate (95% CI)
8.9 (7.1 to 10.8)
9.0 (7.3 to 10.7)
— — —
Q5 Rate (95% CI)
4.9 (3.1 to 6.8)
5.6 (3.8 to 7.4)
— — —
Inequality Measure 2001 2011
Change Over Time
Direction Percentage Difference
DRR (95% CI)
1.81* (1.18 to 2.78)
1.60* (1.10 to 2.32)
— — —
DRD (95% CI)
4.0* (1.4 to 6.6)
3.4* (0.8 to 5.9)
— — —
d. Manitoba
2001 2011
Change Over Time
Direction Percentage Difference
Q1 Rate (95% CI)
9.4 (7.6 to 11.1)
10.5 (8.8 to 12.2)
— — —
Q5 Rate (95% CI)
4.4 (2.8 to 6.0)
5.3 (3.6 to 6.9)
— — —
Inequality Measure 2001 2011
Change Over Time
Direction Percentage Difference
DRR (95% CI)
2.12* (1.41 to 3.21)
2.00* (1.40 to 2.86)
— — —
DRD (95% CI)
4.9* (2.6 to 7.3)
5.3* (2.9 to 7.6)
— — —

239
Section 3: Health and Well-Being Outcomes
Figure 90: Infant Mortality Rates and Inequality Measures, by Income Quintile and Province, 2001 to 2011 (cont’d)
(cont’d on next page)
e. Ontario
2001 2011
Change Over Time
Direction Percentage Difference
Q1 Rate (95% CI)
6.4 (5.9 to 6.9)
5.8 (5.3 to 6.3)
— — —
Q5 Rate (95% CI)
4.8 (4.3 to 5.4)
3.8 (3.4 to 4.3) ↓ -21.1*
(-34.1 to -8.0) -1.0*
(-1.7 to -0.3)
Inequality Measure 2001 2011
Change Over Time
Direction Percentage Difference
DRR (95% CI)
1.33* (1.16 to 1.52)
1.52* (1.31 to 1.77)
— — —
DRD (95% CI)
1.6* (0.9 to 2.3)
2.0* (1.3 to 2.7)
— — —
f. Quebec
2001 2011
Change Over Time
Direction Percentage Difference
Q1 Rate (95% CI)
5.4 (4.7 to 6.0)
5.7 (5.1 to 6.3)
— — —
Q5 Rate (95% CI)
4.3 (3.6 to 4.9)
4.5 (3.9 to 5.1)
— — —
Inequality Measure 2001 2011
Change Over Time
Direction Percentage Difference
DRR (95% CI)
1.26* (1.04 to 1.52)
1.25* (1.05 to 1.49)
— — —
DRD (95% CI)
1.1* (0.2 to 2.0)
1.1* (0.3 to 2.0)
— — —
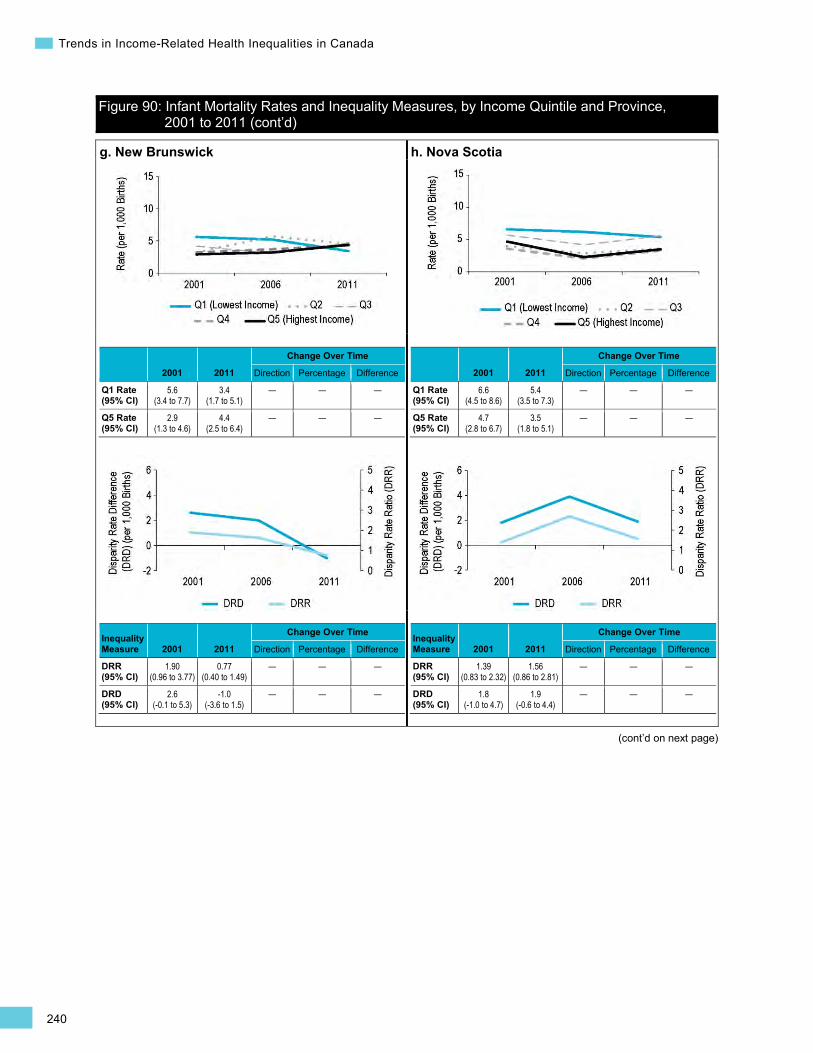
240
Trends in Income-Related Health Inequalities in Canada
Figure 90: Infant Mortality Rates and Inequality Measures, by Income Quintile and Province, 2001 to 2011 (cont’d)
(cont’d on next page)
g. New Brunswick
2001 2011
Change Over Time
Direction Percentage Difference
Q1 Rate (95% CI)
5.6 (3.4 to 7.7)
3.4 (1.7 to 5.1)
— — —
Q5 Rate (95% CI)
2.9 (1.3 to 4.6)
4.4 (2.5 to 6.4)
— — —
Inequality Measure 2001 2011
Change Over Time
Direction Percentage Difference
DRR (95% CI)
1.90 (0.96 to 3.77)
0.77 (0.40 to 1.49)
— — —
DRD (95% CI)
2.6 (-0.1 to 5.3)
-1.0 (-3.6 to 1.5)
— — —
h. Nova Scotia
2001 2011
Change Over Time
Direction Percentage Difference
Q1 Rate (95% CI)
6.6 (4.5 to 8.6)
5.4 (3.5 to 7.3)
— — —
Q5 Rate (95% CI)
4.7 (2.8 to 6.7)
3.5 (1.8 to 5.1)
— — —
Inequality Measure 2001 2011
Change Over Time
Direction Percentage Difference
DRR (95% CI)
1.39 (0.83 to 2.32)
1.56 (0.86 to 2.81)
— — —
DRD (95% CI)
1.8 (-1.0 to 4.7)
1.9 (-0.6 to 4.4)
— — —
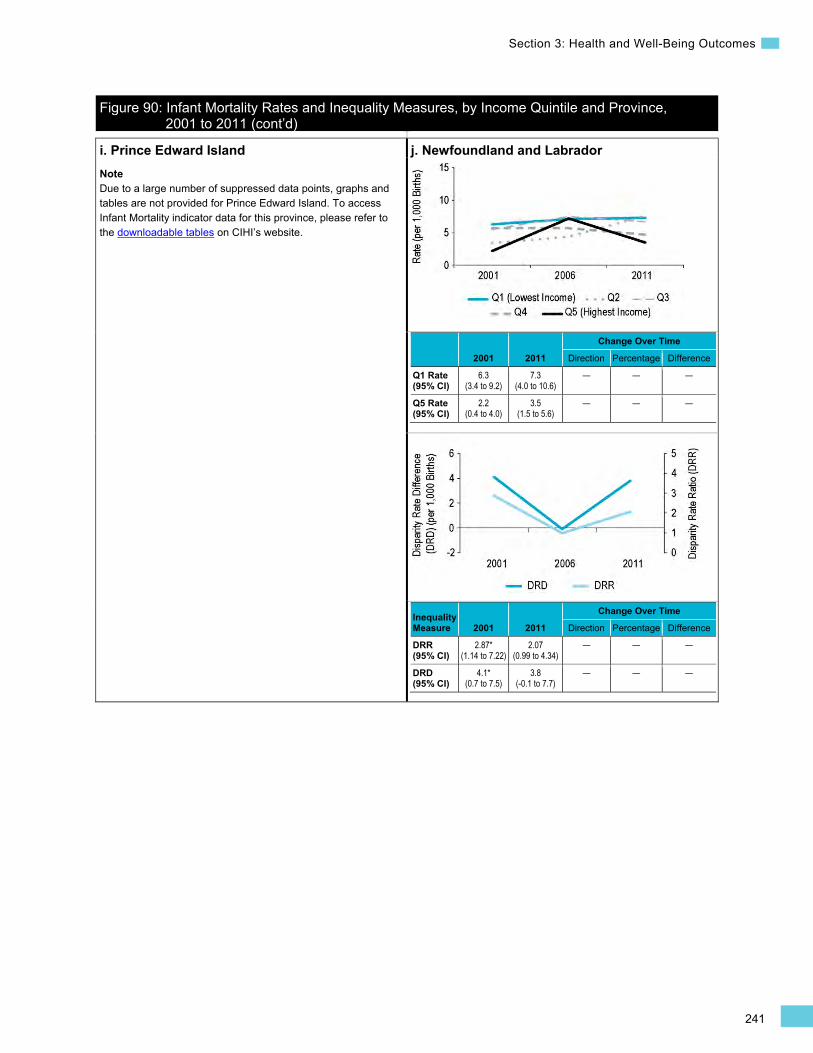
241
Section 3: Health and Well-Being Outcomes
Figure 90: Infant Mortality Rates and Inequality Measures, by Income Quintile and Province, 2001 to 2011 (cont’d)
i. Prince Edward Island Note Due to a large number of suppressed data points, graphs and tables are not provided for Prince Edward Island. To access Infant Mortality indicator data for this province, please refer to the downloadable tables on CIHI’s website.
j. Newfoundland and Labrador
2001 2011
Change Over Time
Direction Percentage Difference
Q1 Rate (95% CI)
6.3 (3.4 to 9.2)
7.3 (4.0 to 10.6)
— — —
Q5 Rate (95% CI)
2.2 (0.4 to 4.0)
3.5 (1.5 to 5.6)
— — —
Inequality Measure 2001 2011
Change Over Time
Direction Percentage Difference
DRR (95% CI)
2.87* (1.14 to 7.22)
2.07 (0.99 to 4.34)
— — —
DRD (95% CI)
4.1* (0.7 to 7.5)
3.8 (-0.1 to 7.7)
— — —

This page has been intentionally left blank

243
References
References 1. Kawachi I, Subramanian SV, Almeida-Filho N. A glossary for health inequalities.
J Epidemiol Community Health. 2002;56(9):647-652.
2. Health Disparities Task Group of the Federal/Provincial/Territorial Advisory Committee on Population Health and Health Security. Reducing Health Disparities—The Role of the Health Sector: Discussion Paper. Ottawa, ON: Public Health Agency of Canada; 2005.
3. Public Health Agency of Canada. The Chief Public Health Officer’s Report on the State of Public Health in Canada. Ottawa, ON: PHAC; 2008. http://www.phac-aspc.gc.ca/cphorsphc-respcacsp/2008/fr-rc/index-eng.php. Accessed December 19, 2014.
4. Population Health Promotion Expert Group P-CPHN. Indicators of Health Inequalities. Canada: Pan-Canadian Public Health Network; 2010.
5. Public Health Agency of Canada. Reducing Health Inequalities: A Challenge for Our Time. Ottawa, ON: PHAC; 2011. http://publications.gc.ca/collections/collection_2012/aspc-phac/HP35-22-2011-eng.pdf. Accessed December 19, 2014.
6. Reading C, Wien F. Health Inequalities and Social Determinants of Aboriginal Peoples’ Health. Prince George, BC: National Collaborating Centre for Aboriginal Health; 2013.
7. Standing Committee on Finance. Income Inequality in Canada: An Overview. Ottawa, ON: Parliament of Canada; 2013.
8. The Standing Senate Committee on Social Affairs. A Healthy, Productive Canada: A Determinant of Health Approach. Ottawa, ON: Senate of Canada; 2009.
9. Canadian Medical Association. Health Equity and the Social Determinants of Health: A Role for the Medical Profession. Ottawa, ON: CMA; 2013. https://www.cma.ca/Assets/assets-library/document/en/advocacy/PD13-03-e.pdf. Accessed February 17, 2015.
10. Canadian Institute for Health Information. Health Indicators 2013. Ottawa, ON: CIHI; 2013. https://secure.cihi.ca/free_products/HI2013_Jan30_EN.pdf. Accessed March 25, 2014.
11. Government of Canada. Canada Health Act. 1985.
12. World Conference on Social Determinants of Health. Rio Political Declaration on Social Determinants of Health. Geneva, Switzerland: World Health Organization; http://www.who.int/mwg-internal/de5fs23hu73ds/progress?id=5V1RNMR9Mf. Updated 2011. Accessed March 25, 2014.
13. Butler-Jones D. Report on the State of Public Health in Canada: Addressing Health Inequalities. Ottawa, ON: Public Health Agency of Canada; 2008. http://www.phac-aspc.gc.ca/cphorsphc-respcacsp/2008/fr-rc/pdf/CPHO-Report-e.pdf. Accessed December 19, 2014.
244
Trends in Income-Related Health Inequalities in Canada
14. Tjepkema M, Wilkins R, Long A. Cause-Specific Mortality by Income Adequacy in Canada: A 16-Year Follow-Up Study. Ottawa, ON: Statistics Canada; 2013.
15. Organisation for Economic Co-operation and Development. Society at a Glance 2014 Highlights—Canada OECD Social Indicators. Paris, France: OECD Publishing; 2014. http://www.oecd.org/canada/OECD-SocietyAtaGlance2014-Highlights-Canada.pdf.
16. McGrail KMP, van Doorslaer E, Ross NAP, Sanmartin C. Income-related health inequalities in Canada and the United States: a decomposition analysis. Am J Public Health. 2009;99(10):1856-1863. http://www.ncbi.nlm.nih.gov/pmc/articles/PMC2741511/.
17. Gunasekara FI, Carter K, McKenzie S. Income-related health inequalities in working age men and women in Australia and New Zealand. Aust N Z J Public Health. 2013;37(3):211-217. http://www.ncbi.nlm.nih.gov/pubmed/23731102.
18. Devaux M, De Looper M. Income-Related Inequalities in Health Service Utilisation in 19 OECD Countries, 2008–2009. Paris, France: OECD Publishing; 2012. http://www.oecd-ilibrary.org/social-issues-migration-health/income-related-inequalities-in-health-service-utilisation-in-19-oecd-countries-2008-2009_5k95xd6stnxt-en.
19. van Doorslaer E, Koolman X. Explaining the differences in income-related health inequalities across European countries. Health Econ. 2004;13(7):609-628. http://www.ncbi.nlm.nih.gov/pubmed/15259042.
20. Turrell G, Stanley L, De Looper M, Oldenburg B. Health Inequalities in Australia: Morbidity, Health Behaviours, Risk Factors and Health Service Use. Canberra, Australia: Australian Institute of Health and Welfare; 2006. http://www.aihw.gov.au/publication-detail/?id=6442467837.
21. Burgard SA, King MM. The Poverty and Inequality Report 2014. Stanford, US: The Stanford Center on Poverty and Inequality; 2014. http://web.stanford.edu/mwg-internal/de5fs23hu73ds/progress?id=Os2l126zbiMvN_2-FPBEQfgBXF9jQ_wv1oagKQvNwZE.
22. Canadian Institute for Health Information. Reducing Gaps in Health: A Focus on Socio-Economic Status in Urban Canada. Ottawa, ON: CIHI; 2008. https://secure.cihi.ca/free_products/Reducing_Gaps_in_Health_Report_EN_081009.pdf. Accessed March 25, 2014.
23. Canadian Institute for Health Information. Urban Physical Environments and Health Inequalities. Ottawa, ON: CIHI; 2011.
24. Manitoba Centre for Health Policy. Health Inequities in Manitoba: Is the Socioeconomic Gap in Health Narrowing or Widening Over Time?. Winnipeg, MB: MCHP; 2010. http://mchp-appserv.cpe.umanitoba.ca/reference/Health_Ineq_final_WEB.pdf. Accessed March 25, 2014.
245
References
25. Provincial Health Services Authority. Towards Reducing Health Inequities. Vancouver, BC: PHSA; 2011. http://www.phsa.ca/NR/rdonlyres/0F19BDB8-2153-49D1-A214-E7D0D0B9DA3B/52162/TowardsReducingHealthInequitiesFinalDiscussionPape.pdf. Accessed December 19, 2014.
26. World Health Organization. Closing the Gap in a Generation: Health Equity Through Action on the Social Determinants of Health. Geneva, Switzerland: WHO; 2008.
27. Whitehead M. The Concepts and Principles of Equity in Health. Copenhagen, Denmark: WHO Regional Office for Europe; 1990.
28. Braveman P, Gruskin S. Defining equity in health. J Epidemiol Community Health. 2003;57:254-258. http://jech.bmj.com/content/57/4/254.full.
29. World Health Organization. A Conceptual Framework for Action on the Social Determinants of Health. Geneva, Switzerland: WHO; 2010. http://www.who.int/sdhconference/resources/ConceptualframeworkforactiononSDH_eng.pdf. Accessed December 19, 2014.
30. Solar O, Irwin A. Figure 5. Final form of the CSDH conceptual framework. In: A Conceptual Framework for Action on the Social Determinants of Health. Geneva, Switzerland: World Health Organization; 2010.
31. World Health Organization. Handbook on Health Inequality Monitoring With a Special Focus on Low- and Middle-Income Countries. Geneva, Switzerland: WHO; 2013.
32. Keppel K, Pamuk E, Lynch J, et al. Methodological issues in measuring health disparities. Vital Health Stat. 2005;2(141):1-16.
33. O’Donnell O, van Doorslaer E, Wagstaff A, Lindelow M. Analyzing Health Equity Using Household Survey Data. Washington, DC, US: World Bank; 2008.
34. Regidor E. Measures of health inequalities: part 1. J Epidemiol Community Health. 2004;58(10):858-861.
35. Regidor E. Measures of health inequalities: part 2. J Epidemiol Community Health. 2004;58(11):900-903.
36. Pearcy JN, Keppel K. A summary measure of health disparity. Public Health Rep. 2002;117(3):273-280.
37. Anand S, Diderichsen F, Evans T, Shkolnikov VM, Wirth M. Measuring disparities in health: methods and indicators. In: Evans T, ed. Challenging Inequities in Health: From Ethics to Action. New York, US: Oxford University Press; 2015.
38. Canadian Institute for Health Information. Health Indicators 2013. Ottawa, ON: CIHI; 2013. https://secure.cihi.ca/free_products/HI2013_Jan30_EN.pdf. Accessed March 25, 2014.
246
Trends in Income-Related Health Inequalities in Canada
39. Canadian Institute for Health Information. Injury Hospitalizations and Socio-Economic Status. Ottawa, ON: CIHI; 2010. https://secure.cihi.ca/free_products/Injury_aib_vE4CCF_v3_en.pdf. Accessed December 19, 2014.
40. Manitoba Centre for Health Policy. Health Inequities in Manitoba: Is the Socioeconomic Gap in Health Narrowing or Widening Over Time?. Winnipeg, MB: MCHP; 2010. http://mchp-appserv.cpe.umanitoba.ca/reference/Health_Ineq_final_WEB.pdf. Accessed March 25, 2014.
41. Nickel N, Martens P, Chateau D, et al. Have we left some behind? Trends in socio-economic inequalities in breastfeeding initiation: a population-based epidemiological surveillance study. Can J Public Health. 2014;105(5):362-368.
42. Peel Public Health. Health in Peel: Determinants and Disparities. Mississauga, ON: Region of Peel; 2011.
43. Ontario Agency for Health Protection and Promotion (Public Health Ontario). Summary Measures of Socioeconomic Inequalities in Health. Toronto, ON: Queen’s Printer for Ontario; 2013. http://www.publichealthontario.ca/en/eRepository/Summary_Measures_Socioeconomic_Inequalities_Health_2013.pdf.
44. Public Health Agency of Canada. The Chief Public Health Officer’s Report on the States of Public Health in Canada. Ottawa, ON: PHAC; 2008. http://www.phac-aspc.gc.ca/cphorsphc-respcacsp/2008/fr-rc/index-eng.php. Accessed December 19, 2014.
45. Toronto Public Health. Unequal City: Income and Health Inequalities in Toronto. Toronto, ON: TPH; 2008. http://www.toronto.ca/health/map/pdf/unequalcity_20081016.pdf. Accessed October 22, 2012.
46. Statistics Canada. Canadian Community Health Survey (CCHS) Annual Component, 2009–1010 Common Content. Ottawa, ON: Statistics Canada; 2011.
47. Statistics Canada. Low income cut-offs. http://www.statcan.gc.ca/pub/75f0002m/2009002/s2-eng.htm#n6. Updated 2009. Accessed December 19, 2014.
48. Wilkins R, Peters P. PCCF + Version 5K* User’s Guide. Ottawa, ON: Statistics Canada; 2012.
49. Harper S, Lynch J. Methods for Measuring Cancer Disparities: Using Data Relevant to Healthy People 2010 Cancer-Related Objectives. Bethesda, US: National Cancer Institute; 2005.
50. Harper S. Implicit value judgements in the measurements of health inequalities. Milbank Q. 2010;88(1):4-29.
51. Kelly MP, Bonnefoy J. The Social Determinants of Health: Developing an Evidence Base for Political Action. Geneva, Switzerland: World Health Organization; 2007.
247
References
52. Whitehead M, Dahlgren G. Levelling Up (Part 1): A Discussion Paper on Concepts and Principles for Tackling Social Inequities in Health. Copenhagen, Denmark: WHO Regional Office for Europe; 2006. http://www.who.int/social_determinants/resources/leveling_up_part1.pdf.
53. King NB. Use of relative and absolute effect measures in reporting health inequalities: structured review. BMJ. 2012;345(e5774).
54. Moser K, Frost C, Leon DA. Comparing health inequalities across time and place—rate ratios and rate differences lead to different conclusions: analysis of cross-sectional data from 22 countries 1991–2001. Int J Epidemiol. 2007;36(1285):1291.
55. Harper S, Lynch J. Highly active antiretroviral therapy and socioeconomic inequalities in AIDS mortality in Spain. Eur J Public Health. 2007;17:231.
56. Speybroeck N, Harper S, de Savigny D, Victora C. Inequalities of health indicators for policy makers: six hints. Int J Public Health. 2012;57(5):859-860. http://link.springer.com/article/10.1007%2Fs00038-012-0386-5.
57. Martens P. The right kind of evidence—integrating, measuring, and making it count in health equity research. J Urban Health. 2012;89(6):925-936.
58. Rockhill B, Newman B, Weinberg C. Use and misuse of population attributable fractions. Am J Public Health. 1998;88(1):15-19.
59. Heller RF, Buchan I, Edwards R, Lyratzopoulos G, McElduff P, St Leger S. Communicating risks at the population level: application of population impact numbers. BMJ. 2003;327:1162-1165.
60. Phelan JC, Link BG. Controlling disease and creating disparities: a fundamental cause perspective. J Gerontol B Psychol Sci Soc Sci. 2005;60(Special Issue 2):S27-S33. http://psychsocgerontology.oxfordjournals.org/content/60/Special_Issue_2/S27.abstract.
61. Mechanic D. Policy challenges in addressing racial disparities and improving population health. Health Aff (Millwood). 2005;24(2):335-338. http://content.healthaffairs.org/content/24/2/335.abstract.
62. National Collaborating Centre for Determinants of Health. Universal and Targeted Approaches to Health Equity. Antigonish, NS: NCCDH; 2013.
63. Offord DR, Kraemer HC, Kazdin AE, Jensen PS, Harrington R. Lowering the burden of suffering from child psychiatric disorder: trade-offs among clinical, targeted, and universal interventions. J Am Acad Child Adolesc Psychiatry. 1998;37(7):686-694.
64. National Collaborating Centre for Healthy Public Policy. Thirteen Public Health Interventions in Canada That Have Contributed to a Reduction in Health Inequalities. Québec, QC: NCCHPP; 2010.
248
Trends in Income-Related Health Inequalities in Canada
65. Mackenbach J, Bakker M, Sihto M, Diderichsen F. Strategies to reduce socioeconomic inequalities in health. In: Mackenbach J, Bakker M, eds. Reducing Inequalities in Health: A European Perspective. London, UK: Taylor & Francis Group; 2002;25-49.
66. Public Health Agency of Canada and World Health Organization. Mobilizing Intersectoral Action to Promote Health: The Case of ActNowBC. Ottawa, ON: PHAC; 2009. http://www.phac-aspc.gc.ca/publicat/2009/ActNowBC/pdf/anbc-eng.pdf.
67. Huang TT, Drewnowski A, Kumanyika S, Glass TA. A systems-oriented multilevel framework for addressing obesity in the 21st century. Prev Chronic Dis. 2009;6(3).
68. Gortmaker SL, Swinburn B, Levy D, et al. Changing the future of obesity: science, policy and action. Lancet. 2011;378(9793):838-847.
69. World Health Organization. WHO Report on the Global Tobacco Epidemic, 2008: The MPOWER Package. Geneva, Switzerland: WHO; 2008.
70. Stockwell T, Zhao J, Martin G, et al. Minimum alcohol prices and outlet densities in British Columbia, Canada: estimated impacts on alcohol-attributable hospital admissions. Res Practice. 2013;103(11).
71. Stockwell T, Zhao J, Giesbrecht N, MacDonald S, Thomas G, Wettlaufer A. The raising of minimum alcohol pricing in Saskatchewan, Canada: impacts on consumption and implications for public health. Am J Public Health. 2012;102(12):103-110.
72. Institute of Medicine and National Research Council. Local Government Actions to Prevent Childhood Obesity. Washington, DC, US: National Academy of Sciences; 2009.
73. Brownell KD, Farley T, Willett WC, et al. The public health and economic benefits of taxing sugar-sweetened beverages. N Engl J Med. 2009;361(16):1599-1605.
74. Chronic Disease Prevention Alliance of Canada. Extra Sugar, Extra Calories, Extra Weight More Chronic Disease. Ottawa, ON: CDPAC; 2011.
75. Faulkner G, Nguyen P, Ferrence R, Mendelson R, Donnelly P, Abour-Nicitopoulos K. Economic Policy, Obesity and Health: A Scoping Review. Ottawa, ON: Heart and Stroke Foundation of Canada; 2010.
76. Buhler S, Raine K, Arango M, Pellerin S, Neary N. Building a strategy for obesity prevention one piece at a time: the case of sugar-sweetened beverage taxation. Can J Diabetes. 2013;37(2): 97-102. http://www.ncbi.nlm.nih.gov/pubmed/?term=Can+J+Diabetes+buhler+raine.
77. Canadian Medical Association. Tax Incentives for Better Living. Ottawa, ON: CMA; 2007.
78. BC Healthy Living Alliance. BC Healthy Living Alliance Submission to the 2015 Budget Consultation. Vancouver, BC: BCHLA; 2014.
249
References
79. Alberta Policy Coalition for Chronic Disease Prevention. 2011 Decision Maker Survey of Knowledge, Attitudes & Beliefs: Summary of Results. Edmonton, AB: APCCP; 2011.
80. Coalition poids. Obesity epidemic: solutions. http://www.cqpp.qc.ca/en/obesity-epidemic/solutions. Updated 2015.
81. Frohlich KL, Potvin L. Transcending the known in public health practice: the inequality paradox: the population approach and vulnerable populations. Am J Public Health. 2008;98(2):216-221.
82. Lorenc T, Petticrew M, Welch V, Tugwell P. What types of interventions generate inequalities? Evidence from systematic reviews. J Epidemiol Community Health. 2013;67:190-193.
83. Warner KE. The economics of tobacco: myths and realities. Tob Control. 2000;9(1):78-89.
84. Bader P, Boisclair D, Ferrence R. Effects of tobacco taxation and pricing on smoking behavior in high risk populations: a knowledge synthesis. Int J Environ Res Public Health. 2011;8(11):4118-4139.
85. Thow AM, Downs S, Jan S. A systematic review of the effectiveness of food taxes and subsidies to improve diets: understanding the recent evidence. Nutr Rev. 2014;72(9):551-565.
86. World Health Organization. Alcohol and Inequities: Guidance for Addressing Inequities in Alcohol-Related Harm. Geneva, Switzerland: WHO; 2014.
87. Hill S, Amos A, Clifford D, Platt S. Impact of tobacco control interventions on socioeconomic inequalities in smoking: review of the evidence. Tob Control. 2014;23(e2):e89-e97.
88. Thomas S, Fayter D, Misso K, et al. Population tobacco control interventions and their effects on social inequalities in smoking: systematic review. Tob Control. 2008;17(4):230-237.
89. Physicians for a Smoke-Free Canada. Tax Revenue From Tobacco Sales, 1990–2013. Ottawa, ON: PSFC; 2013. http://www.smoke-free.ca/factsheets/pdf/totaltax.pdf.
90. Health Canada. Tobacco—A National Strategy. Ottawa, ON: Health Canada; 1999. http://www.hc-sc.gc.ca/hc-ps/pubs/tobac-tabac/ns-sn/index-eng.php#a4.
91. Corsi DJ, Lear SA, Chow CK, Subramanian SV, Boyle MH, Teo KK. Socioeconomic and geographic patterning of smoking behaviour in Canada: a cross-sectional multilevel analysis. PLoS One. 2013;8(2):e57646.
92. Corsi DJ, Boyle MH, Lear SA, Chow CK, Teo KK, Subramanian SV. Trends in smoking in Canada from 1950 to 2011: progression of the tobacco epidemic according to socioeconomic status and geography. Cancer Causes Control. 2014;25(1):45-57.

250
Trends in Income-Related Health Inequalities in Canada
93. Smith P, Frank J, Mustard C. Trends in educational inequalities in smoking and physical activity in Canada: 1974–2005. J Epidemiol Community Health. 2009;63(4):317-323.
94. Reid JL, Hammond D, Driezen P. Socioeconomic status and smoking in Canada, 1999– 2006: has there been any progress on disparities in tobacco use? Can J Public Health. 2010;101(1):73-78.
95. Main C, Thomas S, Ogilvie D, et al. Population tobacco control interventions and their effects on social inequalities in smoking: placing an equity lens on existing systematic reviews. BMC Public Health. 2008;8:178.
96. Greaves L, Johnson J, Bottorff J, et al. What are the effects of tobacco policies on vulnerable populations? A better practices review. Can J Public Health. 2006;97(4):310-315.
97. Ontario Ministry of Health and Long-Term Care. Health equity impact assessment. http://www.health.gov.on.ca/en/pro/programs/heia/. Updated 2013. Accessed December 6, 2013.
98. Wellesley Institute. Health equity: templates and user guides for equity focused impact assessment. http://www.wellesleyinstitute.com/health/user_guides_to_equity-focused_impact_assessment/. Updated August 19, 2009. Accessed February 10, 2015.
99. Lynch JW, Smith GD, Kaplan GA, House JS. Income inequality and mortality: importance to health of individual income, psychosocial environment, or material conditions. BMJ. 2000;320:1200-1204.
100. Marmot M, Wilkinson RG. Psychosocial and material pathways in the relation between income and health: a response to Lynch et al. BMJ. 2001;322:1233-1236.
101. Raphael D, MacDonal J, Colman R, Labonte R, Hayward K, Torgerson R. Researching income and income distribution as determinants of health in Canada: gaps between theoretical knowledge, research practice, and policy implementation. Health Policy. 2005;72:217-232.
102. Wilkins R, Tjepkema M, Mustard C, Choinière R. The Canadian census mortality follow-up study, 1991 through 2001. Health Rep. 2008;19(3):25-43.
103. Kawachi I, Kennedy BP, Lochner K, Prothrow-Stith D. Social capital, income inequality, and mortality. Am J Public Health. 1997;87(9):1491-1498.
104. Wilkinson R, Pickett K. The Spirit Level: Why Equality Is Better for Everyone. London, UK: Penguin Books; 2010.
105. Pickett KE, Wilkinson RG. Income inequality and health: a causal review. Soc Sci Med. 2014.
106. Lynch JW, Kaplan GA. Understanding how inequality in the distribution of income affects health. J Health Psychol. 1997;2(3):297-314.
251
References
107. Krieger N. Theories for social epidemiology in the 21st century: an ecosocial perspective. Int J Epidemiol. 2001;30:668-677.
108. Organisation for Economic Co-operation and Development. Divided We Stand: Why Inequality Keeps Rising. Paris, France: OECD Publishing; 2011.
109. Fortin N, Green D, Lemieux T, Milligan K, Riddell C. Canadian inequality: recent developments and policy options. Can Public Policy. 2012;38(2):121-145.
110. Murphy B, Roberts P, Wolfson M. High-Income Canadians. Ottawa, ON: Statistics Canada; 2007. http://www.statcan.gc.ca/pub/75-001-x/2007109/article/10350-eng.pdf. Accessed December 19, 2014.
111. Cingano F. Trends in Income Inequality and Its Impact on Economic Growth. Paris, France: OECD Publishing; 2014. http://dx.doi.org/10.1787/5jxrjncwxv6j-en.
112. Ostry J, Berg A, Tsangarides C. Redistribution, Inequality, and Growth. Washington, DC, US: International Monetary Fund; 2014. http://www.imf.org/external/pubs/ft/sdn/2014/sdn1402.pdf.
113. Hsieh C-C, Pugh MD. Poverty, income inequality, and violent crime: a meta-analysis of recent aggregate data studies. Crim Justice Rev. 1993;18(2):182-202.
114. Marmot M, Allen J, Goldblatt P, et al. Fair Society, Healthy Lives. London, UK: Institute of Health Equity; 2010. http://www.instituteofhealthequity.org/projects/fair-society-healthy-lives-the-marmot-review. Accessed March 25, 2014.
115. Lancee B, van de Werfhorst HG. Income Inequality and Participation: A Comparison of 24 European Countries. Amsterdam, the Netherlands: AIAS; 2011.
116. Uslaner EM, Brown M. Inequality, trust, and civic engagement. American Politics Research. 2005;33(6):868-894.
117. Deininger K, Squire L. A new data set measuring income inequality. The World Bank Economic Review. 1996;10(3):565-591.
118. Statistics Canada. Low income cut-offs. http://www.statcan.gc.ca/pub/75f0002m/2012002/lico-sfr-eng.htm. Updated 2013. Accessed February 11, 2015.
119. Statistics Canada. Table 202-0804: Persons in low income, by economic family type. http://www5.statcan.gc.ca/cansim/a05?lang=eng&id=2020804. Updated 2013. Accessed April 4, 2014.
120. Statistics Canada. Table 202-0802: Persons in low income families. http://www5.statcan.gc.ca/cansim/a26. Updated 2014. Accessed February 20, 2014.
252
Trends in Income-Related Health Inequalities in Canada
121. Heisz A. Income Inequality and Redistribution in Canada: 1976–2004. Ottawa, ON: Statistics Canada; 2007. http://www.statcan.gc.ca/pub/11f0019m/11f0019m2007298-eng.pdf. Accessed December 19, 2014.
122. Oxfam. Wealth: Having It All and Wanting More. Oxford, UK: Oxfam International; 2015. http://www.oxfam.org/en/research/wealth-having-it-all-and-wanting-more.
123. Statistics Canada. Table 204-0001: High income trends of tax filers in Canada, provinces, territories and census metropolitan areas (CMA), national thresholds. http://www5.statcan.gc.ca/cansim/a26?lang=eng&retrLang=eng&id=2040001&paSer=&pattern=&stByVal=1&p1=1&p2=31&tabMode=dataTable&csid. Updated 2014. Accessed February 5, 2015.
124. Organisation for Economic Co-Operation and Development. OECD Skills Outlook 2013: First Results From the Survey of Adult Skills, Chapter 1. Paris, France: OECD Publishing; 2013. http://dx.doi.org/10.1787/9789264204256-en.
125. Osberg L. Economic Growth, Income Distribution and Economic Welfare in Canada 1975–1994. Halifax, NS: Dalhousie; 2005.
126. Osberg L. A Quarter Century of Economic Inequality in Canada: 1981–2006. Toronto, ON: Canadian Centre for Policy Alternatives; 2008. http://www.policyalternatives.ca/sites/default/files/uploads/publications/National_Office_Pubs/2008/Quarter_Century_of_Inequality.pdf. Accessed December 19, 2014.
127. Canadian Institute for Health Information. Lifetime Distributional Effects of Publicly Financed Health Care in Canada. Ottawa, ON: CIHI; 2013. https://secure.cihi.ca/estore/productSeries.htm?pc=PCC851.
128. Organisation for Economic Co-operation and Development. Reducing income inequality while boosting economic growth: can it be done? Economic Policy Reforms 2012: Going for Growth. 2015;181-202.
129. Government of Canada. The National Child Benefit: Progress Report 2008. Ottawa, ON: Government of Canada; 2013. http://www.nationalchildbenefit.ca/eng/pdf/ncb_progress_report_2008.pdf. Accessed April 3, 2014.
130. Department of Finance Canada. Tax expenditures and evaluations 2013. http://www.fin.gc.ca/taxexp-depfisc/2013/taxexp1301-eng.asp. Updated 2014. Accessed April 3, 2014.
131. Myles J. The Maturation of Canada’s Retirement Income System: Income Levels, Income Inequality and Low-Income Among the Elderly. Ottawa, ON: Statistics Canada; 2000. http://www.statcan.gc.ca/pub/11f0019m/11f0019m2000147-eng.pdf. Accessed April 3, 2014.
253
References
132. Osberg L. Poverty among senior citizens: a Canadian success story. In: Grady P, Sharpe A, eds. The State of Economics in Canada: Festschrift in Honour of David Slater. Ottawa, ON: Centre for the Study of Living Standards; 2001:151-181.
133. Hum D, Simpson W. A guaranteed annual income? From Mincome to the millennium. Policy Options. 2001;78-82.
134. Forget E. The town with no poverty: using health administration data to revisit outcomes of a Canadian guaranteed annual income field experiment. Can Public Policy. 2011;37(3):283-305. http://public.econ.duke.edu/~erw/197/forget-cea%20%282%29.pdf. Accessed March 17, 2014.
135. Galarneau D, Fecteau E. The Ups and Downs of Minimum Wage. Ottawa, ON: Statistics Canada; 2014.
136. Piketty T. Capital in the Twenty-First Century. Cambridge, US: Belknap Harvard; 2014.
137. Organisation for Economic Co-operation and Development. Equity and Quality in Education: Supporting Disadvantaged Students and Schools. Paris, France: OECD; 2012. http://www.oecd.org/edu/school/50293148.pdf. Accessed October 15, 2014.
138. d’Addio A. Intergenerational Transmission of Disadvantage: Mobility or Immobility Across Generations? A Review of the Evidence for OECD Countries. Paris, France: Organisation for Economic Co-operation and Development; 2007. http://www.oecd.org/els/38335410.pdf.
139. Diderichsen F. Income maintenance policies. In: Mackenbach J, Bakker M, eds. Reducing Inequalities in Health: A European Perspective. London, UK: Taylor & Francis Group; 2002:53-65.
140. National Council of Welfare. The Dollars and Sense of Solving Poverty. Ottawa, ON: National Council of Welfare; 2011. http://publications.gc.ca/collections/collection_2011/cnb-ncw/HS54-2-2011-eng.pdf. Accessed September 17, 2014.
141. Barnes S, Block S, Gardner B, Shapcott M. Poverty Is a Health Issue: Wellesley Institute Submission on the Ontario Poverty Reduction Strategy. Toronto, ON: Wellesley Institute; 2013. http://www.wellesleyinstitute.com/wp-content/uploads/2013/09/Poverty-Reduction-Strategy-2013.pdf. Accessed April 4, 2014.
142. Canadian Medical Association. Health Care in Canada: What Makes Us Sick? Ottawa, ON: CMA; 2013. http://www.cma.ca/multimedia/CMA/Content_Images/Inside_cma/Advocacy/HCT/What-makes-us-sick_en.pdf. Accessed April 8, 2014.
143. Canada Without Poverty. Poverty progress profiles. http://www.cwp-csp.ca/poverty/poverty-progress-profiles/. Updated 2014. Accessed September 18, 2014.

254
Trends in Income-Related Health Inequalities in Canada
144. Government of Saskatchewan. Speech From the Throne 2014. Delivered on the Occasion of the Opening of the Fourth Session of the Twenty-Seventh Legislature. Regina, SK: Province of Saskatchewan; 2015.
145. Government of Newfoundland and Labrador. Newfoundland and Labrador Poverty Reduction Strategy Progress Report. St. John’s, NL: Government of Newfoundland and Labrador; 2014. http://www.aes.gov.nl.ca/poverty/pdf/prs_progress_report.pdf. Accessed September 18, 2014.
146. Shavers VL. Measurement of socioeconomic status in health disparities research. J Natl Med Assoc. 2007;99(9):1013-1023.
147. Bierman A, Johns A, Hyndman B, et al. Chapter 12: Social determinants of health and populations at risk. In: Volume 2 Ontario Women’s Health Equity Report. Toronto, ON: St. Michael’s Hospital and the Institute for Clinical Evaluative Sciences; 2012. http://powerstudy.ca/wp-content/uploads/downloads/2012/10/Chapter12-SDOHandPopsatRisk.pdf.
148. Lahelma E, Martikainen P, Laaksonen M, Aittomäki A. Pathways between socioeconomic determinants of health. J Epidemiol Community Health. 2004;58:327-332.
149. Clark D, Royer H. The Effect of Education on Adult Health and Mortality: Evidence From Britain. Cambridge, US: National Bureau of Economic Research; 2010.
150. The Conference Board of Canada. High-school completion. http://www.conferenceboard.ca/hcp/details/education/high-school-graduation-rate.aspx. Updated 2013. Accessed December 19, 2014.
151. Human Resources and Skills Development Canada. What difference does learning make to financial security? http://www4.hrsdc.gc.ca/[email protected]?iid=54. Updated 2008. Accessed October 2, 2013.
152. Lin SS, Kelsey JL. Use of race and ethnicity in epidemiologic research: concepts, methodological issues, and suggestions for research. Epidemiol Rev. 2000;22(2):187-202.
153. Frenette M. Why Are Youth From Lower-Income Families Less Likely to Attend University? Evidence From Academic Abilities, Parental Influences, and Financial Constraints. Ottawa, ON: Statistics Canada; 2007. http://www.statcan.gc.ca/pub/11f0019m/11f0019m2007295-eng.pdf. Accessed January 28, 2014.
154. Guilmette S. Competing Priorities—Education and Retirement Saving Behaviours of Canadian Families. Ottawa, ON: Statistics Canada; 2011. http://www.statcan.gc.ca/pub/81-004-x/2011001/article/11432-eng.htm. Accessed January 29, 2014.

255
References
155. Standing Senate Committee on Social Affairs. Opening the Door: Reducing Barriers to Post-Secondary Education in Canada. Ottawa, ON: Senate of Canada; 2011. http://www.parl.gc.ca/content/sen/committee/411/soci/rep/rep06dec11-e.pdf. Accessed January 28, 2014.
156. Janus M, Duku E. The school entry gap: socioeconomic, family, and health factors associated with children’s school readiness to learn. Early Educ Dev. 2007;18(3):375-403.
157. Zhang Y. The distribution of access to educational resources for 8th grade math in Canada: how equitable is it? In: Towards Evidence-Based Policy for Canadian Education. Oxford University Press; 2001:271-293.
158. Social Research and Demonstration Corporation. Future to Discover: Post-Secondary Impacts Report. Ottawa, ON: SRDC; 2012.
159. Marmot MG, Rose G, Shipley M, Hamilton PJ. Employment grade and coronary heart disease in British civil servants. J Epidemiol Community Health. 1978;32(4):244-249.
160. Marmot MG, Smith GD, Stansfeld S, et al. Health inequalities among British civil servants: the Whitehall II study. Lancet. 1991;337(8754):1387-1393.
161. Mustard CA, Bielecky A, Etches J, et al. Mortality following unemployment in Canada, 1991–2001. BMC Public Health. 2013;13:441.
162. Safaei J. Long-term employment and health inequalities in Canadian communities. Can J Public Health. 2008;99(3):195-200. http://journal.cpha.ca/index.php/cjph/article/viewFile/1629/1813. Accessed December 19, 2014.
163. Statistics Canada, Council of Ministers of Education, Canada. Economic Downturn and Educational Attainment. Ottawa, ON: Statistics Canada; 2012.
164. Canadian Council for Health and Active Living at Work. A Statistical Profile of Canadian Workplace Characteristics. CCHALW; 2009. http://www.cchalw.ca/english/info/MappingofCanadianIndustriesreport1.pdf. Accessed May 6, 2014.
165. Vosko L, Zukewich N, Cranford C. Precarious jobs: a new typology of employment. Perspectives on Labour and Income. 2003;4(10):16-26. http://www.statcan.gc.ca/pub/75-001-x/75-001-x2003010-eng.pdf.
166. Statistics Canada. Table 282-0080: Labour force survey estimates (LFS), employees by job permanency, North American Industry Classification System (NAICS), sex and age group. http://www5.statcan.gc.ca/cansim/a26?lang=eng&retrLang=eng&id=2820080&paSer=&pattern=&stByVal=1&p1=1&p2=35&tabMode=dataTable&csid. Updated 2015. Accessed February 5, 2015.
167. Osberg L. Long run trends in income inequality in the United States, UK, Sweden, Germany and Canada: a birth cohort view. East Econ J. 2003;29(1):121-141.
256
Trends in Income-Related Health Inequalities in Canada
168. Wellesley Institute. 6 good ideas about jobs in Ontario. http://www.wellesleyinstitute.com/publication/talking-about-jobs/attachment/6-good-ideas-about-jobs-in-ontario-2/. Updated 2011. Accessed May 6, 2014.
169. Thompson S, Ben-Galim D. Childmind the Gap: Reforming Childcare to Support Mothers Into Work. London, UK: Institute for Public Policy Research; 2014. http://www.ippr.org/images/media/files/publication/2014/02/childmind-the-gap_Feb2014_11899.pdf. Accessed April 3, 2014.
170. Canadian Council for Health and Active Living at Work. A Statistical Profile of Canadian Workplace Characteristics. CCHALW; 2009. http://www.cchalw.ca/english/info/MappingofCanadianIndustriesreport1.pdf. Accessed May 6, 2014.
171. Industry Training Authority. Women in Trades. http://www.itabc.ca/women-trades/programs. Updated 2012. Accessed March 12, 2014.
172. Levy J, Ansara D, Stover A. Racialization and Health Inequities in Toronto. Toronto, ON: Toronto Public Health; 2013.
173. Nestel S. Colour Coded Health Care: The Impact of Race and Racism on Canadians’ Health. Toronto, ON: Wellesley Institute; 2012.
174. Public Health Agency of Canada. Report on the State of Public Health in Canada 2012. Influencing Health—The Importance of Sex and Gender. Ottawa, ON: PHAC; 2012. http://publications.gc.ca/collections/collection_2012/aspc-phac/HP2-10-2012-eng.pdf. Accessed September 17, 2014.
175. The Conference Board of Canada. Gender income gap. http://www.conferenceboard.ca/hcp/details/society/gender-income-gap.aspx. Updated 2013. Accessed February 5, 2015.
176. Statistics Canada. Table 202-0102: Average female and male earnings, and female-to-male earnings ratio, by work activity. http://www5.statcan.gc.ca/cansim/ a05?lang=eng&id=2020102&pattern=2020102&searchTypeByValue=1&p2=35. Updated 2013.
177. Afshari R, Bhopal R. Ethnicity has overtaken race in medical science: MEDLINE-based comparison of trends in the USA and the rest of the world, 1965–2005. Int J Epidemiol. 2010;39(6):1682-1684.
178. Veenstra G. Racialized identity and health in Canada: results from a nationally representative survey. Soc Sci Med. 2009;69(4):538-542.
179. Teelucksingh C, Galabuzi G-E. Working precariously: the impact of race and immigrant’s status on employment opportunities and outcomes in Canada. Directions. 2005;2(1):15-52.
257
References
180. Hou F, Balakrishnan T, Jurdi R. The economic integration of visible minorities in contemporary Canadian society: revisited. In: Grabb E, Guppy N, eds. Social Inequality in Canada. 5th ed. Toronto, ON: Pearson Education Canada; 2009:253-272.
181. Palameta B. Low income among immigrants and visible minorities. Perspectives on Labour and Income. 2004;5(4). http://www.statcan.gc.ca/pub/75-001-x/10404/6843-eng.htm.
182. Picot G, Hou F. Immigration, Low Income, and Income Inequality in Canada: What’s New in 2000s? Ottawa, ON: Statistics Canada; 2014. http://www.statcan.gc.ca/pub/11f0019m/11f0019m2014364-eng.pdf. Accessed February 5, 2015.
183. Organisation for Economic Co-operation and Development. How’s Life? Measuring Wellbeing. Paris, France: OECD; 2011.
184. National Collaborating Centre for Aboriginal Health. The State of Knowledge of Aboriginal Health: A Review of Aboriginal Public Health in Canada. Prince George, BC: NCCAH; 2012. http://www.nccah-ccnsa.ca/Publications/Lists/Publications/Attachments/52/The%20State%20of%20Knowledge%20of%20Aboringal%20Health%20(EN).pdf.
185. Health Council of Canada. Empathy, Dignity, and Respect: Creating Cultural Safety for Aboriginal People in Urban Health Care. Toronto, ON: HCC; 2012.
186. Tang SY, Browne AJ. “Race” matters: racialization and egalitarian discourses involving Aboriginal people in the Canadian health care context. Ethn Health. 2008;13(2):109-127.
187. Browne AJ, Smye VL, Rodney P, Tang SY, Mussell B, O’Neil J. Access to primary care from the perspective of Aboriginal patients at an urban emergency department. Qual Health Res. 2011;21(3):333-348.
188. National Collaborating Centre for Aboriginal Health. Achieving Strength Through Numbers: First Nations, Inuit, and Métis Health Information. Prince George, BC: NCCAH; 2010.
189. Reading C, Wien F. Health Inequalities and Social Determinants of Aboriginal Peoples Health. Prince George, BC: NCCAH; 2013. http://www.nccah-ccnsa.ca/Publications/Lists/Publications/Attachments/46/health_inequalities_EN_web.pdf. Accessed December 19, 2014.
190. Chandler MJ, Lalonde CE. Cultural Continuity as a Moderator of Suicide Risk Among Canada’s First Nations. Vancouver, BC: University of British Columbia; 2006.
191. Nettleton C, Napolitano DA, Stephens C. Overview of Current Knowledge of the Social Determinants of Indigenous Health. London, UK; London School of Hygiene and Tropical Medicine; 2007. http://som.flinders.edu.au/FUSA/SACHRU/Symposium/Social%20Determinants%20of%20Indigenous%20Health.pdf.
192. First Nations Health Authority. Healthy, Self-Determining and Vibrant BC First Nations Children, Families and Communities. West Vancouver, BC: FNHA; 2014. http://www.fnha.ca/Documents/FNHA_AboutUS.pdf.
258
Trends in Income-Related Health Inequalities in Canada
193. Sacks G, Swinburn BA, Lawrence MA. A systematic policy approach to changing the food system and physical activity environments to prevent obesity. Aust New Zealand Health Policy. 2008;5(13):1-7.
194. Canada Mortgage and Housing Corporation. Canadian Housing Observer. Ottawa, ON: CMHC; 2014. http://www.cmhc-schl.gc.ca/odpub/pdf/68189.pdf. Accessed November 26, 2014.
195. Canada Mortgage and Housing Corporation. Canadian Housing Observer. Ottawa, ON: CMHC; 2011. http://www.cmhc-schl.gc.ca/odpub/pdf/67508.pdf?fr=1327596686971.
196. Canadian Institute for Health Information. Housing and Population Health. Ottawa, ON: CIHI; 2004. https://secure.cihi.ca/free_products/HousingPopHealth_e.pdf. Accessed February 6, 2014.
197. Bryant T. Housing and health: more than bricks and mortar. In: Raphael D, ed. Social Determinants of Health. 2nd ed. Toronto, ON: Canadian Scholars’ Press Inc.; 2009:235-249.
198. Shaw M. Housing and public health. Annu Rev Public Health. 2004;25:397-418.
199. Thomson H, Thomas S, Sellstrom E, Petticrew M. Housing improvements for health and associated socio-economic outcomes. Cochrane Database of Systematic Reviews. 2013.
200. Canada Mortgage and Housing Corporation. Canadian Housing Observer. Ottawa, ON: CMHC; 2013. http://www.cmhc-schl.gc.ca/odpub/pdf/67989.pdf?fr=1387830981331. Accessed February 27, 2014.
201. Dales R, Zwanenburg H, Burnett R, Franklin C. Respiratory health effects of home dampness and molds among Canadian children. Am J Epidemiol. 1991;134(2):196-203.
202. Rauh V, Landrigan P, Claudio L. Housing and health: intersection of poverty and environmental exposures. Ann N Y Acad Sci. 2008;1136:276-288.
203. Health Canada. Summary of Health Canada’s strategy against tuberculosis for First Nations on-reserve. http://www.hc-sc.gc.ca/fniah-spnia/pubs/diseases-maladies/_tuberculos/tuberculos-strateg/index-eng.php. Updated 2012. Accessed February 26, 2014.
204. Canadian Tuberculosis Committee. Housing conditions that serve as risk factors for tuberculosis infection and disease. Can Commun Dis Rep. 2007;33.
205. Canada Mortgage and Housing Corporation. Canadian Housing Observer. Ottawa, ON: CMHC; 2012.
206. Canada Mortgage and Housing Corporation. Investment in Affordable Housing Bilateral Agreements and Public Reporting. Ottawa, ON: CMHC; 2014. http://www.cmhc-schl.gc.ca/en/inpr/afhoce/fuafho/iah/iah_003.cfm. Accessed September 22, 2014.

259
References
207. Canada Mortgage and Housing Corporation. Canadian Housing Observer. Ottawa, ON: CMHC; 2013. http://www.cmhc-schl.gc.ca/odpub/pdf/67989.pdf?fr=1387830981331. Accessed February 27, 2014.
208. The Conference Board of Canada. Building From the Ground Up: Enhancing Affordable Housing in Canada. Ottawa, ON: The Conference Board of Canada 2010. http://www.conferenceboard.ca/temp/42289f7f-b568-4f27-8a6f-8381f4af140f/10-122_buildingfromthegroundupv4.pdf. Accessed March 24, 2014.
209. Federation of Canadian Municipalities. No Vacancy: Trends in Rental Housing in Canada. Ottawa, ON: FCM; 2012. http://www.fcm.ca/Documents/reports/FCM/No_Vacancy_Trends_in_Rental_Housing_in_Canada_EN.pdf. Accessed April 10, 2014.
210. Federation of Canadian Municipalities. Trends & Issues in Affordable Housing & Homelessness. Ottawa, ON: FCM; 2008. https://www.fcm.ca/Documents/reports/Trends_and_Issues_in_Affordable_Housing_and_Homelessness_EN.pdf. Accessed April 10, 2014.
211. Standing Senate Committee on Social Affairs. In From the Margins: A Call to Action on Poverty, Housing, and Homelessness. Ottawa, ON: Senate of Canada; 2009. http://www.parl.gc.ca/Content/SEN/Committee/402/citi/rep/rep02dec09-e.pdf. Accessed December 19, 2014.
212. Ontario Non-Profit Housing Association. Waiting Lists Survey 2014. Toronto, ON: ONPHA; 2014. http://www.onpha.on.ca/onpha/CMDownload.aspx?ContentKey=82f06b40-8516-4c78-9bc0-a5869858ffa4&ContentItemKey=2d8a0bcf-8169-4417-aedc-812660e5971c. Accessed November 26, 2014.
213. Government of British Columbia. Housing Matters BC. Victoria, BC: Government of British Columbia; 2006. http://www.housingmattersbc.ca/docs/HousingMattersBC.pdf.
214. Government of Ontario. Investment in Affordable Housing for Ontario Program Guidelines. Toronto, ON: Government of Ontario; 2011. http://www.mah.gov.on.ca/AssetFactory.aspx?did=9288. Accessed February 9, 2015.
215. Government of Alberta. Support for Renters. Edmonton, AB: Government of Alberta; 2015. http://www.seniors.alberta.ca/housing/support_for_renters.html. Accessed February 9, 2015.
216. Government of Manitoba. Portable Housing Benefit. Winnipeg, MB: Government of Manitoba; 2009. http://www.gov.mb.ca/fs/allaboard/portable.html.
217. MacNeil M. Affordable Housing Study. Calgary, AB: Housing Strategies Inc.; 2004. http://www.homelesshub.ca/ResourceFiles/r1vmj30b.pdf.
218. Dunn JR. Housing and inequalities in health: a study of socioeconomic dimensions of housing and self reported health from a survey of Vancouver residents. J Epidemiol Community Health. 2002;56(9):671-681.
260
Trends in Income-Related Health Inequalities in Canada
219. Rohe W, Quercia R, van Zandt S. The social-psychological effects of affordable homeownership. In: Rohe W, Watson L, eds. Chasing the American Dream: New Perspectives on Affordable Homeownership. New York, US: Cornell University Press; 2007:284-318.
220. Northwest Territories Housing Corporation. Housing choices. http://www.nwthc.gov.nt.ca/_live/pages/wpPages/HousingChoices2013.aspx. Updated 2013. Accessed March 21, 2014.
221. Northwest Territories Housing Corporation. NWT Housing Choices Programs (CARE, PATH, & HELP) Evaluations. Yellowknife, NT: NWTHC; 2011.
222. Gaetz S, Donaldson J, Richter T, Gulliver T. The State of Homelessness in Canada 2013. Toronto, ON: Canadian Homelessness Research Network; 2013.
223. Gaetz S, Gulliver T, Richter T. The State of Homelessness in Canada 2014. Toronto, ON: Homelessness Hub; 2014. http://www.homelesshub.ca/sites/default/files/SOHC2014.pdf. Accessed December 19, 2014.
224. Human Resources and Skills Development Canada. The National Shelter Study. Ottawa, ON: HRSDC; 2012.
225. Mikkonen J, Raphael D. Social Determinants of Health: The Canadian Facts. Toronto, ON: York University School of Health Policy and Management; 2010. http://www.thecanadianfacts.org/The_Canadian_Facts.pdf. Accessed December 19, 2014.
226. Hwang S, Wilkins R, Tjepkema M, O’Campo P, Dunn J. Mortality among residents of shelters, rooming houses, and hotels in Canada: 11 year follow-up study. BMJ Online. 2009;339:b4036.
227. Roy E, Boivin J, Haley N, Lemire N. Mortality among street youth. Lancet. 1998;352:32.
228. REACH3. Housing Vulnerability and Health: Canada’s Hidden Emergency. Toronto, ON: St. Michael’s Hospital; 2010. http://www.stmichaelshospital.com/pdf/crich/housing-vulnerability-and-health.pdf. Accessed December 19, 2014.
229. Frankish CJ, Hwang SW, Quantz D. Homelessness and health in Canada: research lessons and priorities. Can J Public Health. 2005;96(Suppl-9).
230. Shapcott M. Physical and Sexual Violence Rates for Homeless Many Times Higher Than Housed. Toronto, ON: Wellesley Institute; 2007. http://www.wellesleyinstitute.com/wp-content/uploads/2011/11/wi-backgrounder-homeless-violence.pdf.
231. Mental Health Commission of Canada. What is housing first? http://www.mentalhealthcommission.ca/English/system/files/private/Housing_Housing_First_Summary_0.pdf?terminitial=23. Updated 2013. Accessed March 21, 2014.
261
References
232. Fitzpatrick-Lewis D, Ganann R, Krishnaratne S, Ciliska D, Kouyoumdjian F, Hwang S. Effectiveness of interventions to improve the health and housing status of homeless people: a rapid systematic review. BMC Public Health. 2011;11. http://www.biomedcentral.com/content/pdf/1471-2458-11-638.pdf. Accessed April 8, 2014.
233. Mental Health Commission of Canada. National Final Report Cross-Site At Home / Chez Soi Project. Ottawa, ON: MHCC; 2014. http://www.mentalhealthcommission.ca/English/system/files/private/document/MHCC_At_Home_Report_(National_Cross-Site)_ENG.pdf. Accessed April 8, 2014.
234. Canadian Population Health Initiative. Mental health, mental illness, and homelessness in Canada. In: Hulchanski J, Campsie P, Chau S, Hwang S, Paradis E, eds. Finding Home. Toronto, ON: University of Toronto; 2009.
235. Mental Health Commission of Canada. The At Home / Chez Soi Research Project Methodology. Ottawa, ON: MHCC; 2013.
236. Health Canada. Determining food security status. http://www.hc-sc.gc.ca/fn-an/surveill/nutrition/commun/insecurit/status-situation-eng.php. Accessed March 17, 2015.
237. Mark S, Lambert M, O’Loughlin J, Gray-Donald K. Household income, food insecurity, and nutrition in Canadian youth. Can J Public Health. 2012;103(2):94-99. http://journal.cpha.ca/index.php/cjph/article/viewFile/2888/2608.
238. Kirkpatrick S, Tarasuk V. Food insecurity is associated with nutrient inadequacies among Canadian adults and adolescents. J Nutr. 2008;138:604-612. http://jn.nutrition.org/content/138/3/604.full.pdf+html.
239. Tarasuk V, McIntyre L, Li J. Low-income women’s dietary intakes are sensitive to the depletion of household resources in one month. J Nutr. 2007;137(8):1980-1987. http://jn.nutrition.org/content/137/8/1980.full.pdf+html.
240. Tarasuk VS. Household food insecurity with hunger is associated with women’s food intakes, health and household circumstances. J Nutr. 2001;131(10):2670-2676. http://jn.nutrition.org/content/131/10/2670.long.
241. Tarasuk VS, Beaton GH. Women’s dietary intakes in the context of household food insecurity. J Nutr. 1999;129(3):672-679. http://jn.nutrition.org/content/129/3/672.long.
242. Gucciardi E, Vogt J, DeMelo M, Stewart D. Exploration of the relationship between household food insecurity and diabetes in Canada. Diabetes Care. 2009;32(12):2218-2224.
243. Vozoris NT, Tarasuk VS. Household food insufficiency is associated with poorer health. J Nutr. 2003;133(1):120-126.
244. Che J, Chen J. Food insecurity in Canadian households. Health Rep. 2001;12(4):11-22.
262
Trends in Income-Related Health Inequalities in Canada
245. McIntyre L, Connor SK, Warren J. Child hunger in Canada: results of the 1994 National Longitudinal Survey of Children and Youth. CMAJ. 2000;163(8):961-965. http://www.ncbi.nlm.nih.gov/pmc/articles/PMC80544/?report=reader.
246. Kirkpatrick S, McIntyre L, Potestio M. Child hunger and long-term adverse consequences for health. Arch Pediatr Adolesc Med. 2010;164(8):754-762. http://www.ucalgary.ca/lmcintyre/files/lmcintyre/hunger%20consequences.pdf.
247. Melchior M, Chastang J, Falissard B, et al. Food insecurity and children’s mental health: a prospective birth cohort study. PLoS One. 2012;7(12). http://www.plosone.org/article/fetchObject.action?uri=info%3Adoi%2F10.1371%2Fjournal.pone.0052615&representation=PDF.
248. Statistics Canada. Household food insecurity, 2011–2012. http://www.statcan.gc.ca/pub/82-625-x/2013001/article/11889-eng.htm. Updated December 13, 2013.
249. Tarasuk V, Mitchell A, Dachner N. Household Food Insecurity in Canada 2012. Toronto, ON: PROOF; 2012. http://nutritionalsciences.lamp.utoronto.ca/wp-content/uploads/2014/02/Household_Food_Insecurity_in_Canada-2012ENG.pdf. Accessed February 6, 2014.
250. Health Canada. Household food insecurity in Canada in 2007–2008: key statistics and graphics. http://www.hc-sc.gc.ca/fn-an/surveill/nutrition/commun/insecurit/key-stats-cles-2007-2008-eng.php. Updated July 25, 2012.
251. Agriculture and Agri-Food Canada. Follow-Up on the Implementation of the World Food Summit Plan of Action—Canada’s Fifth Progress Report on Food Security. Ottawa, ON: AAFC; 2008. http://www4.agr.gc.ca/resources/prod/doc/misb/fsec-seca/pdf/1245790426228_rpt_5_e.pdf. Accessed February 21, 2014.
252. The Expert Panel on the State of Knowledge of Food Security in Northern Canada. Aboriginal Food Security in Northern Canada: An Assessment of the State of Knowledge. Ottawa, ON: Council of Canadian Academies; 2014. http://www.scienceadvice.ca/uploads/eng/assessments%20and%20publications%20and%20news%20releases/food%20security/foodsecurity_fullreportEN.pdf.
253. Power E. Individual and household food insecurity in Canada: position of Dietitians of Canada. Can J Diet Pract Res. 2005;66(1):43-46. http://www.dietitians.ca/Downloadable-Content/Public/householdfoodsec-exec-summary.aspx.
254. Loopstra R, Tarasuk V. The relationship between food banks and household food insecurity among low-income Toronto families. Can Public Policy. 2012;38(4):497-514. https://muse.jhu.edu/login?auth=0&type=summary&url=/journals/canadian_public_policy/v038/38.4.loopstra.pdf.
263
References
255. Jaquith M. An Assessment of Canadian Food Charters. Baltimore, US: Johns Hopkins University; 2011. http://www.jhsph.edu/research/centers-and-institutes/johns-hopkins-center-for-a-livable-future/_pdf/projects/FPN/Ordinances_Model_Policies/An_Assessment_of_Canadian_Food_Charters.pdf.
256. Ionescu-Ittu R, Glymour MM, Kaufman JS. A difference-in-differences approach to estimate the effect of income-supplementation on food insecurity. Prev Med. 2015;70(Jan.):108-116.
257. Power E. Individual and Household Food Insecurity in Canada: Position of Dietitians of Canada. Toronto, ON: Dietitians of Canada; 2005. http://www.dietitians.ca/Downloadable-Content/Public/householdfoodsec-position-paper.aspx.
258. Health Canada. Income-Related Household Food Security in Canada. Ottawa, ON: Health Canada; 2007. http://www.hc-sc.gc.ca/fn-an/alt_formats/hpfb-dgpsa/pdf/surveill/income_food_sec-sec_alim-eng.pdf.
259. Barrett CB. Measuring food insecurity. Science. 2010;327:825-828.
260. Community Food Centres Canada. 2012/2013 Progress Report. Toronto, ON: CFCC; 2013. http://cfccanada.ca/sites/default/files/documents/CFCC%20Progress%20Report%202012-13.pdf. Accessed March 12, 2014.
261. The Stop Community Food Centre CFCC. The Stop’s Community Advocacy Program: Impacts and Insights. Toronto, ON: CFCC; 2013. http://cfccanada.ca/sites/default/files/documents/Atkinson%20Community%20Advocacy%20Evaluation%202013.pdf.
262. Community Food Centres Canada. CFCC evaluation [personal communication]. 2014.
263. Loopstra R, Dachner N, Tarasuk V. An exploration of the unprecedented decline in the prevalence of household food insecurity in Newfoundland and Labrador [unpublished manuscript]. 2014.
264. Kramer MSM, Platt RWP, Wen SWMP, et al. A new and improved population-based Canadian reference for birth weight for gestational age. Pediatrics. 2001;108(2):e35.
265. Canadian Institute for Health Information. Highlights of 2011–2012 Selected Indicators Describing the Birthing Process in Canada. Ottawa, ON: CIHI; 2013.
266. Kirstensen S, Salihu H, Keith L, Kirby R, Fowler K, Pass M. SGA subtypes and mortality risk among singleton births. Early Hum Dev. 2007;83(2):99-105. http://www.ncbi.nlm.nih.gov/pubmed/16842940.
267. Barker DJ. The fetal origins of coronary heart disease. Acta Paediatr Suppl. 1997; 422:78-82.
264
Trends in Income-Related Health Inequalities in Canada
268. Barker DJP. Fetal nutrition and cardiovascular disease in later life. Br Med Bull. 1997;53(1):96-108.
269. Leon DA, Lithell HO, Vagero D, et al. Reduced fetal growth rate and increased risk of death from ischaemic heart disease: cohort study of 15 000 Swedish men and women born 1915-29. BMJ. 1998;317(7153):241-245.
270. Sharma P, McKay K, Roesenkrantz TS, Hussain N. Comparisons of mortality and pre-discharge respiratory outcomes in small-for-gestational-age and appropriate-for-gestational-age premature infants. BMC Pediatrics. 2004;4(9).
271. Canadian Institute for Health Information. Too Early, Too Small: A Profile of Small Babies Across Canada. Ottawa, ON: CIHI; 2009.
272. Hayward I, Malcoe LH, Cleathero LA, et al. Investigating maternal risk factors as potential targets of intervention to reduce socioeconomic inequality in small for gestational age: a population-based study. BMC Public Health. 2012;12:333.
273. Luo Z, Wilkins R, Kramer M. Effect of neighbourhood income and maternal education on birth outcomes: a population-based study. CMAJ. 2006;174(10):1415-1421.
274. Savard N, Levallois P, Rivest LP, Gingras S. A study of the association between characteristics of CLSCs and the risk of small for gestational age births among term and preterm births in Quebec, Canada. Can J Public Health. 2012;103(2):152-157.
275. Auger N, Giraud J, Daniel M. The joint influence of area income, income inequality, and immigrant density on adverse birth outcomes: a population-based study. BMC Public Health. 2009;9:237.
276. Hansen M, Bower C. The impact of assisted reproductive technologies on intra-uterine growth and birth defects in singletons. Semin Fetal Neonatal Med. 2014;19(4):228-233.
277. Abu-Saad K, Fraser D. Maternal nutrition and birth outcomes. Epidemiol Rev. 2010;32(1):5-25.
278. Ahluwalia IB, Hogan VK, Grummer-Strawn L, Colville WR, Peterson A. The effect of WIC participation on small-for-gestational-age births: Michigan 1992. Am J Public Health. 1998;88:1374-1377.
279. Statistics Canada. Births. Ottawa, ON: Statistics Canada; 2009. Catalogue no. 84F0210X.
280. Bushnik T, Cook J, Hughes E, Tough S. Seeking medical help to conceive. Health Rep. 2012;23(4):7-13.
281. Das UG, Sysyn GD. Abnormal fetal growth: intrauterine growth retardation, small for gestational age, large for gestational age. Pediatr Clin North Am. 2004;51(3):639-654.
265
References
282. Liu N, Wen SW, Katherine W, Bottomley J, Yang Q, Walker MC. Neighbourhood family income and adverse birth outcomes among singleton deliveries. J Obstet Gynaecol Can. 2010;32(11):1042-1048.
283. Muhajarine N, Ng J, Bowen A, Cushon J, Johnson S. Understanding the impact of the Canada Prenatal Nutrition Program: a quantitative evaluation. Can J Public Health. 2012;103(7:Suppl 1):Suppl-31.
284. Public Health Agency of Canada. Summative evaluation of the Canada Prenatal Nutrition Program 2004–2009. http://www.phac-aspc.gc.ca/about_apropos/evaluation/reports-rapports/2009-2010/cpnp-pcnp/index-eng.php. Updated June 16, 2010.
285. Canadian Institute for Health Information. Children Vulnerable in Areas of Early Development: A Determinant of Child Health. Ottawa, ON: CIHI; 2014. https://secure.cihi.ca/free_products/Children_Vulnerable_in_Areas_of_Early_Development_EN.pdf.
286. Janus M, Brinkman S, Duku E, et al. The Early Development Instrument: Population-Based Measure for Communities. Hamilton, ON: Offord Centre for Child Studies, McMaster University; 2006.
287. Janus M, Offord D. Development and psychometric properties of the Early Development Instrument (EDI): a measure of children’s school readiness. Can J Behav Sci. 2007;39(1):1-22.
288. Heckman JJ. The case for investing in disadvantaged young children. In: First Focus, ed. Big Ideas for Children: Investing in Our Nation’s Future. Washington, DC, US: First Focus; 2009:49-58.
289. Case A, Fertig A, Paxon C. The lasting impact of childhood health and circumstance. J Health Econ. 2005;24(2):365-89.
290. Santos R, Brownell M, Ekuma O, Mayer T, Soodeen R. The Early Development Instrument (EDI) in Manitoba: Linking Socioeconomic Adversity and Biological Vulnerability at Birth to Children’s Outcomes at Age 5. Winnipeg, MB: Manitoba Centre for Health Policy; 2012.
291. Irwin LG, Siddiqi A. Early Child Development: A Powerful Equalizer. Geneva, Switzerland: World Health Organization; 2007.
292. Hertzman C. The state of child development in Canada: are we moving toward, or away from, equity from the start? Paediatr Child Health. 2009;14(10):673-676.
293. Chan M. Linking child survival and child development for health, equity, and sustainable development. Lancet. 2013;381(9877):1514-1515.
294. Center on the Developing Child. The Foundations of Lifelong Health Are Built in Early Childhood. Cambridge, US: Harvard University; 2010.
266
Trends in Income-Related Health Inequalities in Canada
295. Childcare Resource and Research Unit. Early Childhood Education and Care in Canada. Ottawa, ON: Human Resources and Skills Development Canada; 2008.
296. Government of Alberta. Investing in Early Childhood Development: What’s the Payoff? Edmonton, AB: Government of Alberta; 2013.
297. Karoly LA, Greenwood PW, Everingham SS, et al. Investing In Our Children: What We Know and Don’t Know About the Costs and Benefits of Early Childhood Interventions. Santa Monica, US: RAND; 1998.
298. Michael Baker. Universal Early Childhood Interventions: What Is the Evidence Base?. Vancouver, BC: Canadian Labour Market and Skills Researcher Network; 2011.
299. Case A, Lubotsky D, Paxon C. Economic Status and Health in Childhood: The Origins of the Gradient. Princeton, US: Princeton University; 2001.
300. Evans GW. The environment of childhood poverty. Am Psychol. 2004;59(2):77-92.
301. Brooks-Gunn J, Duncan GJ. The Effects of Poverty on Children. Princeton, US: Princeton University; 1997.
302. VanLandeghem K, Curtis D, Abrams M. Reasons and Strategies for Strengthening Childhood Development Services in the Healthcare System. Portland, US: National Academy for State Health Policy; 2002. http://www.commonwealthfund.org/usr_doc/vanlandeghem_nashp_630.pdf. Accessed December 19, 2014.
303. Heckman JJ. The case for investing in disadvantaged young children. In: First Focus, ed. Big Ideas for Children: Investing in Our Nation’s Future. Washington, DC, US: First Focus; 2009:49-58.
304. Peters RD. Developing Capacity and Competence in the Better Beginnings, Better Futures Communities: Short-Term Findings Report. Waterloo, ON: Better Beginnings, Better Futures; 2000.
305. Better Beginnings, Better Futures. Summary and Conclusions—Better Beginnings, Better Futures: Project Sustainability. Waterloo, ON: BBBF; 2005.
306. Peters RD, Nelson G, Petrunka K, et al. Investing in Our Future: Highlight of Better Beginnings, Better Futures Research Findings at Grade 12. Kingston, ON: Better Beginnings, Better Futures Research Coordination Unit, Queen’s University; 2010.
307. World Health Organization. Global Health Risks. Geneva, Switzerland: WHO; 2009. http://www.who.int/healthinfo/global_burden_disease/GlobalHealthRisks_report_full.pdf. Accessed October 16, 2012.
308. World Health Organization. WHO Report on the Global Tobacco Epidemic, 2008: The MPOWER Package. Geneva, Switzerland: WHO; 2008.

267
References
309. Public Health Agency of Canada. Chronic Disease Risk Factor Atlas. Ottawa, ON: PHAC; 2008. http://www.phac-aspc.gc.ca/cd-mc/atlas/index-eng.php.
310. Baliunas D, Patra J, Rehm J, Popova S, Kaiserman M, Taylor B. Smoking-attributable mortality and expected years of life lost in Canada 2002: conclusions for prevention and policy. Chronic Dis Can. 2007;27(4):154-162.
311. Rehm J, Baliunas D, Brochu S, et al. The Cost of Substance Abuse in Canada 2002. Ottawa, ON: Canadian Centre on Substance Abuse; 2006.
312. Baliunas D, Patra J, Rehm J, Popova S, Taylor B. Smoking-attributable morbidity: acute care hospital diagnoses and days of treatment in Canada, 2002. BMC Public Health. 2007;7(247). http://www.biomedcentral.com/1471-2458/7/247.
313. Reid JL, Hammond D. Tobacco Use in Canada: Patterns and Trends, 2014 Edition (Supplement: Tobacco Control Policies in Canada). Waterloo, ON: Propel Centre for Population Health Impact, University of Waterloo; 2014. http://tobaccoreport.ca/2014/TobaccoUseinCanada_2014_PolicySupplement.pdf. Accessed December 19, 2014.
314. Reid JL, Hammond D, Rynard VL, Burkhalter R. Tobacco Use in Canada: Patterns and Trends, 2014 Edition. Waterloo, ON: Propel Centre for Population Health Impact, University of Waterloo; 2014.
315. Statistics Canada. Select health behaviours by Aboriginal and non-Aboriginal populations, aged 12 and over, Canada. http://www.statcan.gc.ca/pub/82-624-x/2013001/article/chart/11763-02-chart2-eng.htm. Updated 2013. Accessed September 30, 2014.
316. National Collaborating Centre for Aboriginal Health. Tobacco Fact Sheet. Prince George, BC: NCCAH; 2013. http://www.nccah-ccnsa.ca/Publications/Lists/Publications/Attachments/74/Tobacco.pdf.
317. Corsi DJ, Lear SA, Chow CK, Subramanian SV, Boyle MH, Teo KK. Socioeconomic and geographic patterning of smoking behaviour in Canada: a cross-sectional multilevel analysis. PLoS One. 2013;8(2):e57646.
318. Corsi DJ, Boyle MH, Lear SA, Chow CK, Teo KK, Subramanian SV. Trends in smoking in Canada from 1950 to 2011: progression of the tobacco epidemic according to socioeconomic status and geography. Cancer Causes Control. 2014;25(1):45-57.
319. Reid JL, Hammond D, Driezen P. Socioeconomic status and smoking in Canada, 1999– 2006: has there been any progress on disparities in tobacco use? Can J Public Health. 2010;101(1):73-78.
320. Smith P, Frank J, Mustard C. Trends in educational inequalities in smoking and physical activity in Canada: 1974–2005. J Epidemiol Community Health. 2009;63(4):317-323.
268
Trends in Income-Related Health Inequalities in Canada
321. Physicians for a Smoke-Free Canada. Smoking and Household Income, Canada 2007– 2008. Ottawa, ON: PSFC; 2010. http://www.smoke-free.ca/factsheets/pdf/cchs/canada-2007-2008-householdincome1.pdf. Accessed December 6, 2013.
322. Tobacco Labelling Resource Centre. Health warnings, Canada. http://www.tobaccolabels.ca/countries/canada. Updated 2013.
323. The International Tobacco Control Policy Evaluation Project. ITC Canada National Report. Findings From the Wave 1 to 8 Surveys (2002–2011). Waterloo, ON: University of Waterloo; 2013. http://www.itcproject.org/files/ITC_Canada_Report-English-Dec62013-web.pdf.
324. Health Canada and Public Health Agency of Canada. Federal Tobacco Control Strategy 2001–2011 Horizontal Evaluation Final Report. Ottawa, ON: Government of Canada; 2012.
325. The International Tobacco Control Policy Evaluation Project. ITC Canada National Report. Findings From the Wave 1 to 8 Surveys (2002–2011). Waterloo, ON: University of Waterloo; 2013. http://www.itcproject.org/files/ITC_Canada_Report-English-Dec62013-web.pdf.
326. Marmot M. Fair Society, Healthy Lives: The Marmot Review, Strategic Review of Health Inequalities in England Post-2010. London, UK: The Marmot Review; 2010.
327. Institut national de santé publique du Québec. Policy Avenues: Interventions to Reduce Social Inequalities in Health—Synthesis. Québec, QC: INSPQ; 2014. http://www.inspq.qc.ca/pdf/publications/1830_Policy_Reduce_Social_Inequalities_Synthesis.pdf.
328. David A, Esson K, Perucic A-M, Fitzpatrick C. Tobacco use: equity and social determinants. In: Equity, Social Determinants and Public Health Programmes. Geneva, Switzerland: World Health Organization; 2010:199-218.
329. Seidenberg AB, Caughey RW, Rees VW, Connolly GN. Storefront cigarette advertising differs by community demographic profile. Am J Health Promot. 2010;24(6):e26-e31.
330. Yu D, Peterson NA, Sheffer MA, Reid RJ, Schnieder JE. Tobacco outlet density and demographics: analysing the relationships with a spatial regression approach. Public Health. 2010;124(7):412-416.
331. Loomis BR, Kim AE, Goetz JL, Juster HR. Density of tobacco retailers and its association with sociodemographic characteristics of communities across New York. Public Health. 2013;127(4):333-338.
332. Chuang YC, Cubbin C, Ahn D, Winkleby MA. Effects of neighbourhood socioeconomic status and convenience store concentration on individual level smoking. J Epidemiol Community Health. 2005;59(7):568-573.
333. Cohen JE, Planinac LC, Griffin K, et al. Tobacco promotions at point-of-sale: the last hurrah. Can J Public Health. 2008;99(3):166-171.

269
References
334. Chaiton MO, Mecredy GC, Cohen JE, Tilson ML. Tobacco retail outlets and vulnerable populations in Ontario, Canada. Int J Environ Res Public Health. 2013;10(12):7299-7309. http://www.ncbi.nlm.nih.gov/pmc/articles/PMC3881168/.
335. Lovato C, Watts A, Stead LF. Impact of tobacco advertising and promotion on increasing adolescent smoking behaviours. Cochrane Database of Systematic Reviews. 2011(10):CD003439.
336. Chen J, Millar WJ. Age of smoking initiation: implications for quitting. Health Rep. 1999;9(4):39-46. http://www.statcan.gc.ca/pub/82-003-x/1997004/article/3685-eng.pdf.
337. Breslau N, Peterson EL. Smoking cessation in young adults: age at initiation of cigarette smoking and other suspected influences. Am J Public Health. 1996;86(2):214-220.
338. The Conference Board of Canada. Smoking Cessation and the Workplace: Briefing 1—Profile of Tobacco Smokers in Canada. Ottawa, ON: The Conference Board of Canada; 2013.
339. Johnston V, Liberato S, Thomas D. Incentives for preventing smoking in children and adolescents. Cochrane Database of Systematic Reviews. 2012;10:CD008645.
340. Butler-Jones D. Report on the State of Public Health in Canada 2011: Youth and Young Adults, Life in Transition. Ottawa, ON: Public Health Agency of Canada; 2011.
341. Hanson MD, Chen E. Socioeconomic status and health behaviour in adolescence: a review of the literature. J Behav Med. 2007;30:263-285. doi:10.1007/s10865-007-9098-3.
342. The First Nations Information Governance Centre. First Nations Regional Health Survey (RHS) Phase 2 (2008/10) National Report on Adults, Youth and Children Living in First Nation Communities. Ottawa, ON: The First Nations Information Governance Centre; 2012.
343. Botvin GJ, Griffin KW. Life Skills Training: empirical findings and future directions. J Prim Prev. 2004;25(2):211-232.
344. Thomas RE, McLellan J, Perera R. School-based programmes for preventing smoking. Evid Based Child Health. 2013;8(5):1616-2040.
345. Botvin LifeSkills Training. Canada’s First Nations communities focus on prevention with Botvin LifeSkills Training. http://www.lifeskillstraining.com/press_detail.php?id=35. Updated December 10, 2011.
346. The Canadian Best Practices Portal. Lifeskills Training (LST). http://cbpp-pcpe.phac-aspc.gc.ca/interventions/lifeskills-training-lst/. Updated May 13, 2013.
347. Baydala LT, Sewlal B, Rasmussen C, et al. A culturally adapted drug and alcohol abuse prevention program for Aboriginal children and youth. Prog Community Health Partnersh. 2009;3(1).
270
Trends in Income-Related Health Inequalities in Canada
348. Baydala LT, Kyme G, Rasmussen C, Fletcher F, Letendre L, Sewlal B. Life Skills Training (LST) Substance Abuse Prevention Program for Aboriginal Children and Youth Final Report. Edmonton, AB: Alberta Centre for Child, Family & Community Research; 2012.
349. Statistics Canada. Canadian Community Health Survey. 2011.
350. Institute for Health Metrics and Evaluation. Global Burden of Disease Study (GBD) profile: Canada. http://www.healthmetricsandevaluation.org. Updated 2010.
351. Guh D, Zhang W, Bansback N, Amarsi Z, Birmingham C, Anis A. The incidence of co-morbidities related to obesity and overweight: a systematic review and meta-analysis. BMC Public Health. 2009;9(88).
352. Canadian Institute for Health Information and Public Health Agency of Canada. Obesity in Canada. Ottawa, ON: CIHI; 2011.
353. Twells LK, Gregory DM, Reddigan J, Midodzi WK. Current and predicted prevalence of obesity in Canada: a trend analysis. CMAJ. 2014;2(1):e18-e26.
354. Shields M, Gorber SC, Tremblay MS. Effects of Measurement on Obesity and Morbidity. Ottawa, ON: Statistics Canada; 2008.
355. Statistics Canada. Canadian Health Measures Survey: Cycle 2 Data Tables. Ottawa, ON: Statistics Canada; 2012. http://publications.gc.ca/collections/collection_2012/statcan/82-626-x/82-626-x2012002-eng.pdf.
356. Egger G, Swinburn B. An “ecological” approach to the obesity pandemic. BMJ. 1997;315(7106):477-480.
357. Swinburn B, Egger G, Raza F. Dissecting obesogenic environments: the development and application of a framework for identifying and prioritizing environmental interventions for obesity. Prev Med. 1999;6(1):563-570. http://www.ncbi.nlm.nih.gov/pubmed/10600438.
358. Raine KD. Overweight and Obesity in Canada: A Population Health Perspective. Ottawa, ON: Canadian Institute for Health Information; 2004. https://secure.cihi.ca/free_products/CPHIOverweightandObesityAugust2004_e.pdf.
359. Slater J, Green C, Sevenhuysen G, O’Neil J, Edginton B. Socio-demographic and geographic analysis of overweight and obesity in Canadian adults using the Canadian Community Health Survey. Chronic Dis Can. 2009;30(1):4-15. http://www.ncbi.nlm.nih.gov/pubmed/20031083.
360. Statistics Canada. Health Reports. Ottawa, ON: Statistics Canada; 2006. http://publications.gc.ca/Collection-R/Statcan/82-003-XIE/82-003-XIE2005003.pdf.
361. Shields M. Overweight and obesity among children and youth. Health Rep. 2006;17(3):27-42.
271
References
362. Beauchamp A, Backholer K, Magliano D, Peeters A. The effect of obesity prevention interventions according to socioeconomic position: a systematic review. Obes Rev. 2014;15(7):541-554. http://onlinelibrary.wiley.com/doi/10.1111/obr.12161/pdf.
363. Loring B, Robertson A. Obesity and Inequities: Guidance for Addressing Inequities in Overweight and Obesity. Copenhagen, Denmark: World Health Organization Regional Office for Europe; 2014. http://ec.europa.eu/health/social_determinants/docs/policybrief_obesity_en.pdf.
364. McLaren L, deGroot J, Adair C, Russel-Mayhew S. Socio-economic position, social inequality, and weight-related issues. In: McVey G, Levine M, Piran N, Ferguson B, eds. Preventing Eating-Related and Weight-Related Disorders: Collaborative Research, Advocacy and Policy Change. Waterloo, ON: Wilfrid Laurier University Press; 2012:249-267.
365. Faulkner G, Grootendorst P, Nguyen V, et al. Economic instruments for obesity prevention: results of a scoping review and modified Delphi survey. Int J Behav Nutr Phys Act. 2011;8(109). http://www.ncbi.nlm.nih.gov/pubmed/?term=faulkner+nguyen+andreyeva.
366. Wilson MG, Guindon EG, Baskerville BN, Gauvin F-P. Evidence Brief: Promoting Healthy Weights Using Population-Based Interventions in Canada. Hamilton, ON: McMaster University; 2012. http://www.mcmasterhealthforum.org/docs/default-source/Product-Documents/evidence-briefs/promoting-healthy-weights-in-canada-eb.pdf?sfvrsn=2.
367. McMillan CJ. Tax Incentives for Better Living: The Canadian Medical Association’s 2007 Pre-Budget Consultation Brief to the Standing Committee on Finance. Ottawa, ON: Canadian Medical Association; 2007. http://cspinet.org/canada/pdf/cmaj-finance-advice-food-taxes.pdf.
368. Throw AM, Downs S, Jan S. A systematic review of the effectiveness of food taxes and subsidies to improve diets: understanding the recent evidence. Nutr Rev. 2014;72(9):551-565.
369. Healthy Alberta Communities: making healthy choices easier. http://www.healthyalbertacommunities.com/. Updated 2010.
370. Raine K, Plotnikoff R, Schopflocher D, et al. Healthy Alberta Communities: impact of a three-year community-based obesity and chronic disease prevention intervention. Prev Med. 2013;57(6):955-962.
371. World Health Organization. Influenza (seasonal) fact sheet no. 211. http://www.who.int/mediacentre/factsheets/fs211/en/. 2014.
372. Jefferson T, Di Pietrantonj C, Al-Ansary LA, Ferroni E, Thorning S, Thomas RE. Vaccines for preventing influenza in the elderly. Cochrane Database of Systematic Reviews. 2010.
272
Trends in Income-Related Health Inequalities in Canada
373. Organisation for Economic Co-operation and Development. Health at a Glance 2013: OECD Indicators. Paris, France: OECD Publishing; 2013. http://dx.doi.org/10.1787/health_glance-2013-en. Accessed December 19, 2014.
374. Violan C, Foguet-Boreu Q, Flores-Mateo G, et al. Prevalence, determinants and patterns of multimorbidity in primary care: a systematic review of observational studies. PLoS One. 2014;9(7):e102149.
375. Armstrong K, Berlin M, Schwartz JS, Propert K, Ubel PA. Barriers to influenza immunization in a low-income urban population. Am J Prev Med. 2001;20(1):21-25.
376. Hobbs JL, Buxton JA. Influenza immunization in Canada’s low-income population. BMC Public Health. 2014;14:740.
377. National Advisory Committee on Immunization. Statement on seasonal influenza Vaccine for 2013–2014. Canada Communicable Disease Report. 2013;39. http://www.phac-aspc.gc.ca/publicat/ccdr-rmtc/13vol39/acs-dcc-4/index-eng.php. Accessed December 19, 2014.
378. World Health Organization. Vaccines against influenza WHO position paper—November 2012. The Weekly Epidemiological Record. 2012;87(47):461-476. http://www.who.int/wer/2012/wer8747/en/. Accessed December 19, 2014.
379. Sander B, Kwong JC, Bauch CT, et al. Economic appraisal of Ontario’s Universal Influenza Immunization Program: a cost-utility analysis. PLoS Med. 2010;7(4):e1000256.
380. Public Health Agency of Canada. Final report of outcomes from the National Consensus Conference for Vaccine-Preventable Diseases in Canada: June 12–14, 2005—Quebec City, Quebec. Canada Communicable Disease Report. 2008;34S2(suppl):1-56.
381. Health Canada. Publicly-funded influenza and pneumococcal immunization programs in Canada: a progress report. Canada Communicable Disease Report. 2000;26(17):141-148.
382. Public Health Agency of Canada. Public funding for influenza vaccination by province/territory (as of September 2014). http://www.phac-aspc.gc.ca/im/ptimprog-progimpt/fluvacc-eng.php. Updated September, 2014.
383. Thomas RE, Jefferson T, Lasserson TJ. Influenza vaccination for healthcare workers who work with the elderly. Cochrane Database Syst Rev. 2010;2.
384. Marra F, Kaczorowski J, Gastonguay L, Marra CA, Lynd LD, Kendall P. Pharmacy-based Immunization in Rural Communities Strategy (PhICS): a community cluster-randomized trial. Can Pharm J (Ott). 2014;147(1):33-44.
385. Tannenbaum C, Tsuyuki RT. The expanding scope of pharmacists’ practice: implications for physicians. CMAJ. 2013;1-5. http://www.cmaj.ca/site/press/cmaj.121990.pdf.
273
References
386. Canadian Pharmacists Association. Summary of Pharmacists’ Expanded Scope of Practice Activities Across Canada. Ottawa, ON: CPhA; 2013. http://blueprintforpharmacy.ca/docs/kt-tools/pharmacists%27-expanded-scope_summary-chart---cpha---october-2013.pdf.
387. The Canadian Lung Association. Chronic obstructive pulmonary disease. http://www.lung.ca/copd. Updated December 8, 2014.
388. Caminal J, Starfield B, Sánchez E, Casanova C, Morales M. The role of primary care in preventing ambulatory care sensitive conditions. Eur J Public Health. 2004;14:246-251.
389. Canadian Institute for Health Information. Health Indicators 2008. Ottawa, ON: CIHI; 2008. https://secure.cihi.ca/free_products/HealthIndicators2008_ENGweb.pdf.
390. Starfield B, Shi L, Macinko J. Contribution of primary care to health systems and health. Milbank Q. 2005;83(3):457-502.
391. Statistics Canada. Table 102-0552: Deaths and mortality rate, by selected grouped causes and sex, Canada, provinces and territories. http://www5.statcan.gc.ca/cansim/a26?lang=eng&retrLang=eng&id=1020552&tabMode=dataTable&srchLan=-1&p1=-1&p2=9#F1. Updated January 27, 2014.
392. Buist AS, McBurnie MA, Vollmer WM, et al. International variation in the prevalence of COPD (The BOLD Study): a population-based prevalence study. Lancet. 2007;370:741-750.
393. García-Olmos L, Alberquilla Á, Ayala V, et al. Comorbidity in patients with chronic obstructive pulmonary disease in family practice: a cross sectional study. BMC Fam Pract. 2013;14(11):1-8. doi:10.1186/1471-2296-14-11.
394. Gershon AS, Guan J, Victor JC, Goldstein R, To T. Quantifying health services use for chronic obstructive pulmonary disease. Am J Respir Crit Care Med. 2013;187(6):596-601. doi:10.1164/rccm.201211-2044OC.
395. Rehm J, Baliunas D, Brochu S, et al. The Cost of Substance Abuse in Canada. Ottawa, ON: Canadian Centre on Substance Abuse; 2006.
396. Miravitlles M, Ferrer M, Zalacain R, et al. Effects of exacerbations on quality of life in patients with chronic obstructive pulmonary disease: a 2 year follow up study. Thorax. 2004;59:387-395.
397. Canadian Institute for Health Information. All-Cause Readmission to Acute Care and Return to the Emergency Department. Ottawa, ON: CIHI; 2012.
398. Donaldson GC, Seemungal TAR, Bhowmik A, Wedzicha JA. Relationship between exacerbation frequency and lung function decline in chronic obstructive pulmonary disease. Thorax. 2002;57:847-852.
274
Trends in Income-Related Health Inequalities in Canada
399. Seemungal TAR, Donaldson GC, Paul EA, Bestall JC, Jeffries DJ, Wedzicha JA. Effect of exacerbation on quality of life in patients with chronic obstructive pulmonary disease. Am J Respir Crit Care Med. 1998;157:1418-1422.
400. Groenwegen KH, Schols AMWJ, Wouters EFM. Mortality and mortality-related factors after hospitalization for acute exacerbation of COPD. Chest. 2003;124(2):459-467.
401. Global Initiative for Chronic Obstructive Lung Disease. Global Strategy for the Diagnosis, Management, and Prevention of Chronic Obstructive Pulmonary Disease (UPDATED 2014). GOLD; 2014.
402. Bahadori K, Fitzgerald JM. Risk factors for hospitalization and readmission of patients with COPD exacerbation—systematic review. Int J Chron Obstruct Pulmon Dis. 2007;2(3):241-251.
403. Miravitlles M, Guerrero T, Mayodormo C, Sánchez-Agudo L, Nicolau F, Segú JL. Factors associated with increased risk of exacerbation and hospital admission in a cohort of ambulatory COPD patients: a multiple logistic regression analysis. Respiration. 2000;67:495-501.
404. Garcia-Aymerich J, Farrero E, Félez MA, Izquierdo J, Marrades RM, Antó JM. Risk factors of readmission to hospital for COPD exacerbation: a prospective study. Thorax. 2003;58:100-105.
405. Hurst JR, Vestbo J, Anzueto A, et al. Susceptibility to exacerbation in chronic obstructive pulmonary disease. N Engl J Med. 2010;363(12):1128-1138.
406. Wedzicha JA, Seemungal TAR. COPD exacerbations: defining their cause and prevention. Lancet. 2007;370(9589):786-796.
407. OHTAC COPD Collaborative. Chronic obstructive pulmonary disease (COPD) evidentiary framework. Ontario Health Technology Assessment Series. 2012;12(2):1-97. www.hqontario.ca/en/mas/tech/pdfs/2012/rev_COPD_Framework_March.pdf. Accessed December 19, 2014.
408. Kruis AL, Smidt N, Assendelft WJJ, et al. Cochrane corner: is integrated disease management for patients with COPD effective? Thorax. 2014;69(11):1053-1055.
409. Law MR, Cheng L, Dhalla IA, Heard D, Morgan SG. The effect of cost adherence to prescription medications in Canada. CMAJ. 2012;184(3):297-302. http://www.cmaj.ca/content/184/3/297.full.
410. Newfoundland and Labrador Department of Health and Community Services. Prescription Drug Program—plan overview. http://www.health.gov.nl.ca/health/prescription/nlpdp_plan_overview.html. Updated 2014.
411. British Columbia Ministry of Health. Partnership supports those managing chronic conditions. http://www2.news.gov.bc.ca/news_releases_2013-2017/2014HLTH0096-001384.htm. Updated 2014.
275
References
412. Ontario Ministry of Health and Long-Term Care. Assisted Devices Program. http://www.health.gov.on.ca/en/public/programs/adp/default.aspx. Updated 2014.
413. Yukon Health and Social Services. Chronic Disease Program. http://www.hss.gov.yk.ca/chronic_disease.php. Updated October 15, 2013.
414. Dziadekwicz R. Integrated care pathway: using best practices to manage chronic disease. Presented at: Best Practices in Rehabilitation 2014: Collaborate, Innovate, Rehabilitate; June 6, 2014; Winnipeg, MB.
415. Fernandes R, Norrie O. COPD Integrated Pathway (ICP) Project. http://www.gov.mb.ca/health/mpan/docs/2013/monday/norrie.pdf. Updated November 18, 2013.
416. Winnipeg Regional Health Authority. Winnipeg Regional Health Authority Annual Report 2013. Winnipeg, MB: WRHA; 2013.
417. City of Winnipeg and Statistics Canada. 2006 Census data—Point Douglas north neighbourhood cluster. http://winnipeg.ca/census/2006/Clusters/Point%20Douglas%20North%20Neighbourhood%20Cluster/Point%20Douglas%20North%20Neighbourhood%20Cluster.pdf. Updated 2006.
418. City of Winnipeg and Statistics Canada. 2006 Census data—Point Douglas south neighbourhood cluster. http://winnipeg.ca/census/2006/Clusters/Point%20Douglas% 20South%20Neighbourhood%20Cluster/Point%20Douglas%20South%20Neighbourhood%20Cluster.pdf. Updated 2006.
419. City of Winnipeg and Statistics Canada. 2006 Census data—Inkster east neighbourhood cluster. http://winnipeg.ca/census/2006/Clusters/Inkster%20East%20Neighbourhood%20Cluster/Inkster%20East%20Neighbourhood%20Cluster.pdf. Updated 2006.
420. City of Winnipeg and Statistics Canada. 2006 Census data—Inkster west neighbourhood cluster. http://winnipeg.ca/census/2006/Clusters/Inkster%20West%20Neighbourhood%20Cluster/Inkster%20West%20Neighbourhood%20Cluster.pdf. Updated 2006.
421. City of Winnipeg and Statistics Canada. 2006 Census data—Seven Oaks east neighbourhood cluster. http://winnipeg.ca/census/2006/Clusters/Seven%20Oaks%20East%20Neighbourhood%20Cluster/Seven%20Oaks%20East%20Neighbourhood%20Cluster.pdf. Updated 2006.
422. City of Winnipeg and Statistics Canada. City of Winnipeg selected census topics: income—2006 low income households. http://www.winnipeg.ca/census/2006/Selected%20Topics/. Updated January 28, 2014.
423. Dziadekwich R. COPD Integrated Care Project [personal communication]. 2014.
424. Scott V, Wagar L, Elliott S. Falls and Related Injuries Among Canadians: Fall-Related Hospitalizations and Prevention Initiatives. Victoria, BC: Victoria Scott Consulting; 2010.
276
Trends in Income-Related Health Inequalities in Canada
425. Alexander BH, Frederick P, Marsha E. The cost and frequency of hospitalization for fall-related injuries in older adults. Am J Public Health. 1992;82(7):1020-1023.
426. Accreditation Canada, Canadian Institute for Health Information, Canadian Patient Safety Institute. Preventing Falls: From Evidence to Improvement in Canadian Health Care. Ottawa, ON: CIHI; 2014.
427. Public Health Agency of Canada. Seniors’ Falls in Canada: Second Report. Ottawa, ON: PHAC; 2014.
428. SMARTRISK. The Economic Burden of Injury in Canada. Toronto, ON: SMARTRISK; 2009.
429. Rubenstein LZ. Falls in older people: epidemiology, risk factors and strategies for prevention. Age Ageing. 2006;(35-S2):ii37-ii41.
430. Rosen T, Mack KA, Noonan RK. Slipping and tripping: fall injuries in adults associated with rugs and carpets. J Inj Violence Res. 2013;5(1):61-69.
431. Zoltick ES, Sahni S, McLean RR, Quach L, Casey VA, Hannan MT. Dietary protein intake and subsequent falls in older men and women: the Framingham study. J Nutr Health Aging. 2011;15(2):147-152.
432. Vivanti AP, McDonald CK, Palmer MA, Sinnott M. Malnutrition associated with increased risk of frail mechanical falls among older people presenting to an emergency department. Emerg Med Australas. 2009;21(5):386-394.
433. Canadian Institute for Health Information. Injury Hospitalizations and Socioeconomic Status. Ottawa, ON: CIHI; 2010. https://secure.cihi.ca/free_products/Injury_aib_vE4CCF_v3_en.pdf. Accessed October 9, 2014.
434. Public Health Agency of Canada. Report on Seniors’ Falls in Canada. Ottawa, ON: Minister of Public Works and Government Services Canada; 2005.
435. World Health Organization. WHO Global Report on Falls Prevention in Older Age. Geneva, Switzerland: WHO; 2007.
436. Statistics Canada. Table 202-0804: Persons in low income, by economic family type. http://www5.statcan.gc.ca/cansim/a05?lang=eng&id=2020804. Updated 2013. Accessed April 4, 2014.
437. Murphy B, Zhang X, Dionne C. Low Income in Canada: A Multi-Line and Multi-Index Perspective. Ottawa, ON: Statistics Canada; 2012. http://www.statcan.gc.ca/pub/75f0002m/75f0002m2012001-eng.pdf. Accessed December 19, 2014.
438. The Conference Board of Canada. Elderly poverty. http://www.conferenceboard.ca/hcp/details/society/elderly-poverty.aspx. Updated 2013. Accessed May 5, 2014.

277
References
439. Federal/Provincial/Territorial Committee of Officials (Seniors) for the Ministers Responsible for Seniors. A Best Practices Guide for the Prevention of Falls Among Seniors Living in the Community. Ottawa, ON: Minister of Public Works and Government Services Canada; 2001.
440. The Atlantic Collaborative on Injury Prevention. The Social Determinants of Injury. ACIP; 2012. http://www.parachutecanada.org/downloads/research/reports/ACIP_Report_SDOI.pdf. Accessed December 19, 2014.
441. World Health Organization. What Are the Main Risk Factors for Falls Amongst Older People and What Are the Most Effective Interventions to Prevent These Falls? Geneva, Switzerland: WHO; 2004.
442. Canada Mortgage and Housing Corporation. Renovation Assistance Programs Evaluation Report. Ottawa, ON: CMHC; 2009.
443. British Columbia Ministry of Health. Home support—Strategies and Actions for Independent Living (SAIL). http://www.health.gov.bc.ca/prevention/fallhome.html. Updated 2014. Accessed November 19, 2014.
444. Lord SR, Menz HB, Sherrington C. Home environment risk factors for falls in older people and the efficacy of home modifications. Age Ageing. 2006;35(suppl 2):ii55-ii59. http://ageing.oxfordjournals.org/content/35/suppl_2/ii55.abstract. Accessed December 19, 2014.
445. Canada Mortgage and Housing Corporation. Home Adaptations for Seniors’ Independence (HASI): minor home alterations have major impact on senior’s quality of life. http://www.cmhc-schl.gc.ca/en/inpr/afhoce/afhoce/vi/vi_075.cfm. Updated 2015. Accessed January 30, 2015.
446. Canada Mortgage and Housing Corporation. Home Adaptations for Seniors’ Independence (HASI): helping a lifelong gardener stay in the home that she loves. http://www.cmhc-schl.gc.ca/en/inpr/afhoce/afhoce/vi/vi_076.cfm. Updated 2015. Accessed January 30, 2015.
447. Vellas BJ, Wayne SJ, Romero LJ, Baumgartner RN, Garry PJ. Fear of falling and restriction of mobility in elderly fallers. Age Ageing. 1997;26(3):189-193. http://ageing.oxfordjournals.org/content/26/3/189.abstract.
448. Zijlstra GAR, van Haastregt JCM, van Eijk JT, van Rossum E, Stalenhoef PA, Kempen GIJM. Prevalence and correlates of fear of falling, and associated avoidance of activity in the general population of community-living older people. Age Ageing. 2007;36(3):304-309. http://ageing.oxfordjournals.org/content/36/3/304.abstract.
449. Public Health Agency of Canada. Injury in Review 2012: Spotlight on Road and Transport Safety. Ottawa, ON: PHAC; 2012.

278
Trends in Income-Related Health Inequalities in Canada
450. Canadian Institute for Health Information. Injury hospitalizations by cause and province/territory, 2012–2013. www.cihi.ca/web/resource/en/STATS_injuryhosp_12-13_EN.xlsx. Updated 2014. Accessed February 11, 2015.
451. Alghnam S, Palta M, Remington P, Mullahy J, Durkin M. The association between motor vehicle injuries and health-related quality of life: a longitudinal study of population-based sample in the United States. Qual Life Res. 2014;23(1):119-127.
452. Shults R, Jones B, Kresnow M, Langlois J, Guerrero J. Disability among adults injured in motor-vehicle crashes in the United States. J Safety Res. 2004;35(4):447-452.
453. Ameratunga S, Norton R, Bennett D, Jackson R. Risk of disability due to car crashes: a review of the literature and methodological issues. Injury. 2004;35:1116-1127.
454. Transport Canada. Canadian Motor Vehicle Traffic Collision Statistics 2012. Ottawa, ON: Transport Canada; 2014. http://www.tc.gc.ca/media/documents/roadsafety/cmvtcs2012_eng.pdf. Accessed December 19, 2014.
455. Canadian Council of Motor Transport Administrators. Canada’s Road Safety Strategy 2015. Ottawa, ON: Canadian Council of Motor Transport Administrators; 2011. http://ccmta.ca/crss-2015/_files/road_safety_strategy_2015.pdf. Accessed March 3, 2014.
456. Canadian Council of Motor Transport Administrators. Road Safety Vision 2010. Ottawa, ON: Canadian Council of Motor Transport Administrators; 2013. http://ccmta.ca/images/publications/pdf/RSV-2010-closeout-11-12-2013-EN.pdf. Accessed February 11, 2015.
457. Morrison D, Petticrew M, Thomson H. What are the most effective ways of improving population health through transport interventions? Evidence from systematic reviews. J Epidemiol Community Health. 2003;57:327-333.
458. Schuurman N, Cinnamon J, Crooks V, Hameed S. Pedestrian injury and the built environment: an environmental scan of hotspots. BMC Public Health. 2009;9:233.
459. Day K, Anderson C, Powe M, McMillan T, Winn D. Remaking Minnie Street: the impacts of urban revitalization on crime and pedestrian safety. J Plan Edu Res. 2007;26:315-331.
460. Gagnon F. A 30-km/h Speed Limit on Local Streets. Montréal, QC: National Collaborating Centre for Healthy Public Policy; 2014. http://www.ncchpp.ca/docs/2014_EnvBati_30KmHZone_En.pdf. Accessed October 9, 2014.
461. Transport Canada. Traffic Calming in Canadian Urban Areas. Ottawa, ON: Transport Canada; 2005. http://www.tc.gc.ca/media/documents/programs/cs35e_trafficcalming.pdf.
462. bfu—Swiss Council for Accident Prevention. Zones 30. Berne, Switzerland: bfu; 2008. http://www.bfu.ch/sites/assets/Shop/bfu_2.002.02_Zones%2030.pdf.
279
References
463. Elvik R, Christensen P, Amundsen A. Speed and Road Accidents. Oslo, Norway: Institute of Transport Economics; 2004. http://www.trg.dk/elvik/740-2004.pdf. Accessed December 19, 2014.
464. Retting R, Ferguson S, McCartt A. A review of evidence-based traffic engineering measures designed to reduce pedestrian–motor vehicle crashes. Am J Public Health. 2003;93(9):1456-1463.
465. Huang H, Cynecki M. Effects of traffic calming measures on pedestrian and motorist behavior. TRR Journal. 2000;1705:26-31.
466. Lyons R, Kendrick D, Towner E, et al. The advocacy for pedestrian safety study: cluster randomised trial evaluating a political advocacy approach to reduce pedestrian injuries in deprived communities. PLoS One. 2013;8(4).
467. Grant T. Walking, Walkability, and Health Disparities: A Review of the Evidence and Directions for Action in Ontario. Ottawa, ON: Population Health Improvement Research Network; 2011.
468. Agence de la santé et des services sociaux de Montréal. Social Inequalities in Health in Montréal. Montréal, QC: ASSS de Montréal; 2011. http://publications.santemontreal.qc.ca/uploads/tx_asssmpublications/978-2-89673-119-0.pdf. Accessed October 9, 2014.
469. Bergman A, Gray B, Moffat J, Simpson E, Rivara F. Mobilizing for pedestrian safety: an experiment in community action. Inj Prev. 2002;8:264-267.
470. Grant T, Edwards N, Sveistrup H, Andrew C, Egan M. Inequitable walking conditions among older people: examining the interrelationship of neighbourhood socio-economic status and urban form using a comparative case study. BMC Public Health. 2010;10(677).
471. Roberts H, Meddings D. Equity, Social Determinants and Public Health Programmes. Geneva, Switzerland: World Health Organization; 2010.
472. Grundy C, Steinbach R, Edwards P, Green J, Armstrong B, Wilkinson P. Effect of 20 mph traffic zones on road injuries in London, 1986–2006: controlled interrupted time series analysis. BMJ. 2009;339. http://www.bmj.com/content/339/bmj.b4469.
473. Canadian Council of Motor Transport Administrators. Countermeasures to Improve Pedestrian Safety in Canada. Ottawa, ON: Canadian Council of Motor Transport Administrators; 2013.
474. Ibrahim S, El-Basyouny K, Islam T. Investigating the impact of reducing residential speed limits in Edmonton: a follow-up analysis. Presented at: 23rd Canadian Multidisciplinary Road Safety Conference; May 26–29, 2013; Montréal, QC.
280
Trends in Income-Related Health Inequalities in Canada
475. Mental Health Commission of Canada. Changing Directions, Changing Lives: The Mental Health Strategy for Canada. Ottawa, ON: MHCC; 2012. http://www.mentalhealthcommission.ca/English/system/files/private/MHStrategy_Strategy_ENG_0.pdf. Accessed April 17, 2014.
476. Canadian Mental Health Association. Making a Difference: Ontario Community Mental Health Evaluation Initiative. Ottawa, ON: CMHA; 2004.
477. Canadian Institute for Health Information. Health system performance indicators: Mental Illness Hospitalization. http://www.cihi.ca/CIHI-ext-portal/internet/en/document/health+system+performance/indicators/health/indic_def_character_11. Updated 2014.
478. Mental Health Commission of Canada. Making the Case for Investing in Mental Health in Canada. Ottawa, ON: MHCC; 2013. http://www.mentalhealthcommission.ca/English/system/files/private/document/Investing_in_Mental_Health_FINAL_Version_ENG.pdf. Accessed December 19, 2014.
479. Organisation for Economic Co-operation and Development. Mental Health and Work: Do We Need a Fundamental Change in Policy? Mid-Term Summary and Conclusions of OECD’s “Mental Health and Work” Review. Paris, France: OECD; 2013.
480. Smetanin P, Stiff D, Briante C, Adair C, Ahmad S, Khan M. The Life and Economic Impact of Major Mental Illnesses in Canada: 2011–2041. Ottawa, ON: Mental Health Commission of Canada; 2011.
481. The Standing Senate Committee on Social Affairs. Mental Health, Mental Illness and Addiction: Overview of Policies and Programs in Canada. Ottawa, ON: Senate of Canada; 2004. http://www.parl.gc.ca/content/sen/committee/381/soci/rep/report1/repintnov04vol1-e.pdf. Accessed December 19, 2014.
482. Organisation for Economic Co-operation and Development. Sick on the Job? Myths and Realities About Mental Health and Work. Paris, France: OECD; 2011. http://www.oecd.org/els/emp/49227343.pdf.
483. Sareen J, Afifi TO, McMillan KA, Asmundson GJ. Relationship between household income and mental disorders: findings from a population-based longitudinal study. Arch Gen Psychiatry. 2011;68(4):419-427.
484. Lorant V, Deliège D, Robert A, Philippot P, Ansseau M. Socioeconomic inequalities in depression: a meta-analysis. Am J Epidemiol. 2003;157(2):98-112.
485. Canadian Mental Health Association. Poverty and Mental Illness. Ottawa, ON: CMHA; 2007. http://ontario.cmha.ca/download.php?docid=504. Accessed August 14, 2014.
486. Canadian Mental Health Association. Poverty Reduction: A Necessary Component of the Federal Government’s Mental Health Strategy for Canadians. Ottawa, ON: CMHA; 2009.

281
References
487. Standing Senate Committee on Social Affairs. Out of the Shadows at Last: Transforming Mental Health, Mental Illness and Addiction Services in Canada. Ottawa, ON: Senate of Canada; 2006. http://www.parl.gc.ca/content/sen/committee/391/soci/rep/rep02may06-e.htm. Accessed December 19, 2014.
488. Goering P, Wasylenki D, Durbin J. Canada’s mental health system. Int J Law Psychiatry. 2000;23(3-4):345-359. http://www.ncbi.nlm.nih.gov/pubmed/10981276. Accessed December 19, 2014.
489. Coleman TG, Cotton D. Police Interactions With Persons With a Mental Illness: Police Learning in the Environment of Contemporary Policing. Ottawa, ON: Mental Health Commission of Canada; 2010. http://www.mentalhealthcommission.ca/English/system/files/private/Law_Police_Interactions_Mental_Illness_Report_ENG_0.pdf. Accessed December 19, 2014.
490. Canadian Mental Health Association. Making a Difference: Ontario Community Mental Health Evaluation Initiative. Ottawa, ON: CMHA; 2004.
491. Mental Health Commission of Canada. Territorial and Provincial Initiatives for Improving Mental Health in Primary Health Care in Canada: An Environmental Scan. Ottawa, ON: MHCC; 2012. http://www.mentalhealthcommission.ca/English/system/files/private/document/PrimaryCare_Environmental_Scan_ENG.pdf.
492. Baess EP. Integrated Mobile Crisis Response Team (IMCRT): Review of Pairing Police With Mental Health Outreach Services. Police/Mental Health Liaison; 2005. http://www.pmhl.ca/webpages/reports/Pairing-report.pdf. Accessed December 19, 2014.
493. Canadian Medical Association. Community Partnerships Fill Mental Health Gaps. Ottawa, ON: CMA; 2013. http://www.cmaj.ca/content/185/17/E779.full.pdf+html. Accessed December 19, 2014.
494. Shield KD, Parry C, Rehm J. Chronic diseases and conditions related to alcohol use. Alcohol Res. 2013;35(2):155-173. http://pubs.niaaa.nih.gov/publications/arcr352/155-173.htm. Accessed December 19, 2014.
495. Schmidt LA, Makela P, Rehm J, Room R. Alcohol: equity and social determinants. In: Blas E, Sivasankara Kurup A, eds. Equity, Social Determinants and Public Health Programmes. Geneva, Switzerland: World Health Organization; 2010:11-30.
496. Rehm J, Baliunas D, Borges GLG, et al. The relation between different dimensions of alcohol consumption and burden of disease: an overview. Addiction. 2010;105(5):817-843. doi:10.1111/j.1360-0443.2010.02899.x.
497. World Health Organization. Global Status Report on Alcohol and Health—2014. Geneva, Switzerland: WHO; 2014. http://apps.who.int/iris/handle/10665/112736. Accessed December 19, 2014.
282
Trends in Income-Related Health Inequalities in Canada
498. Rehm J, Gmel G, Sempos CT, Trevisan M. Alcohol-related morbidity and mortality. Alcohol Research Health. 2003;27(1):39-51.
499. Rehm J, Mathers C, Popova S, Thanvorncharoensap M. Global burden of disease and injury and economic cost attributable to alcohol use and alcohol-use disorders. Lancet. 2009;373:2223-2233.
500. Butt P, Beirness D, Stockwell T, Gliksman L, Paradis C. Alcohol and Health in Canada. Ottawa, ON: Canadian Centre on Substance Abuse; 2011.
501. Thomas G. Levels and Patterns of Alcohol Use in Canada. (Alcohol Price Policy Series: Report 1). Ottawa, ON: Canadian Centre on Substance Abuse; 2012. http://www.ccsa.ca/Resource%20Library/CCSA-Patterns-Alcohol-Use-Policy-Canada-2012-en.pdf. Accessed December 19, 2014.
502. Canadian Centre on Substance Abuse. Alcohol. http://www.ccsa.ca/Resource%20Library/CCSA-2013_Canadian-Drug-Summary-Alcohol-en.pdf. Updated 2013. Accessed June 13, 2014.
503. Statistics Canada. Health profile—definitions, sources and symbols—31. Heavy Drinking. http://www12.statcan.gc.ca/health-sante/82-228/help-aide/DQ-QD04.cfm?Lang=E. Updated April 15, 2014. Accessed February 10, 2015.
504. World Health Organization. Global Health Risks: Mortality and Burden of Disease Attributable to Selected Major Risk Factors. Geneva, Switzerland: WHO; 2009.
505. Babor T, Caetano R, Casswell S, et al. Alcohol: No Ordinary Commodity. 2nd ed. New York, US: Oxford University Press Inc.; 2010.
506. Grittner U, Kuntsche S, Graham K, Bloomfield K. Social inequalities and gender differences in the experience of alcohol-related problems. Alcohol Alcohol. 2012;47(5):597-605.
507. Loring B. Alcohol and Inequities, Guidance for Addressing Inequities in Alcohol-Related Harm. Copenhagen, Denmark: WHO Regional Office for Europe; 2014. http://www.euro.who.int/__data/assets/pdf_file/0003/247629/Alcohol-and-Inequities.pdf. Accessed December 19, 2014.
508. Thomas G. Price Policies to Reduce Alcohol-Related Harm in Canada (Alcohol Price Policy Series: Report 3). Ottawa, ON: Canadian Centre on Substance Abuse; 2012. http://www.ccsa.ca/Resource%20Library/CCSA-Price-Policies-Reduce-Alcohol-Harm-Canada-2012-en.pdf. Accessed December 19, 2014.

283
References
509. Giesbrecht N, Wettlaufer A, April N, et al. Strategies to Reduce Alcohol-Related Harms and Costs in Canada: A Comparison of Provincial Policies. Toronto, ON: Centre for Addiction and Mental Health; 2013. http://www.camh.ca/en/research/news_and_publications/reports_and_books/Documents/Strategies%20to%20Reduce%20Alcohol%20Related%20Harms%20and%20Costs%202013.pdf. Accessed December 19, 2014.
510. Finnerty M, Perron M. Reducing Alcohol-Related Harm in Canada: Toward a Culture of Moderation. Ottawa, ON: Canadian Centre on Substance Abuse; 2007. http://www.ccsa.ca/Resource%20Library/ccsa-023876-2007.pdf. Accessed December 19, 2014.
511. British Columbia Ministry of Labour and Citizens’ Services. Wet Shelters: The Benefits and Risks Associated With Alcohol-Administering Homeless Shelters—A Scoping Review. Victoria, BC: British Columbia Ministry of Labour and Citizens’ Services; 2008. http://www.cio.gov.bc.ca/local/cio/kis/pdfs/wet_shelters.pdf.
512. Health Canada. Canadian Alcohol and Drug Use Monitoring Survey—Summary of Results for 2012. Ottawa, ON: Health Canada; 2014. http://www.hc-sc.gc.ca/hc-ps/drugs-drogues/stat/_2012/summary-sommaire-eng.php. Accessed December 19, 2014.
513. Giesbrecht N, Grovestine L, Hersi I, et al. Alcohol Retail Monopolies and Privatization of Retail Sales. Toronto, ON: Centre for Addiction and Mental Health; 2010. http://www.camh.ca/en/hospital/about_camh/influencing_public_policy/public_policy_submissions/alcohol/Documents/privatization_backgrounder_jun2010.pdf.
514. World Health Organization. Global Strategy to Reduce the Harmful Use of Alcohol. Geneva, Switzerland: WHO; 2008.
515. Canadian Institute for Health Information. Mental Health and Homelessness. Ottawa, ON: CIHI; 2007.
516. Podymow T, Turnbull J, Coyle D, Yetisir E, Wells G. Shelter-based managed alcohol administration to chronically homeless people addicted to alcohol. CMAJ. 2006;174(1):45-49.
517. Pauly B, Stockwell T, Chow C, et al. Toward Alcohol Harm Reduction: Preliminary Results From an Evaluation of a Canadian Managed Alcohol Program. Victoria, BC: Centre for Addictions Research of British Columbia; 2013.
518. Pauly B, Reist D, Schactman C, Belle-Isle L. Housing and Harm Reduction: A Policy Framework for Greater Victoria. Victoria, BC: University of Victoria; 2011.
519. Canadian Institute for Health Information. Health Indicators 2009. Ottawa, ON: CIHI; 2009.
520. Public Health Agency of Canada. Tracking Heart Disease and Stroke in Canada. Ottawa, ON: PHAC; 2009. http://www.phac-aspc.gc.ca/publicat/2009/cvd-avc/pdf/cvd-avs-2009-eng.pdf.
284
Trends in Income-Related Health Inequalities in Canada
521. Tu K, Mituku T, Guo H, Lee D, Tu J. Myocardial infarction and the validation of physician billing and hospitalization data using electronic medical records. Chronic Dis Can. 2010;30(4):141-146.
522. Canadian Institute for Health Information. Health Indicators interactive tool: health system performance—30-Day Acute Myocardial Infarction In-Hospital Mortality, Canada, both sexes (2011). http://www.cihi.ca/hirpt/SearchServlet. Updated 2014. Accessed December 15, 2014.
523. Public Health Agency of Canada. 2009 Tracking Heart Disease and Stroke in Canada: report highlights. http://www.phac-aspc.gc.ca/publicat/2009/cvd-avc/report-rapport-eng.php. Updated 2009. Accessed December 15, 2014.
524. Alter D, Franklin B, Ko D, et al. Socioeconomic status, functional recovery, and long-term mortality among patients surviving acute myocardial infarction. PLoS One. 2013;8(6).
525. Manrique-Garcia E, Sidorchuk A, Hallqvist J, Moradi T. Socioeconomic position and incidence of acute myocardial infarction: a meta-analysis. J Epidemiol Community Health. 2011;65:301-309.
526. Alter D, Chong A, Austin P, et al. Socioeconomic status and mortality after acute myocardial infarction. Ann Intern Med. 2006;144(2):82-93.
527. Choinière R, Lafontaine P, Edwards AC. Distribution of cardiovascular disease risk factors by socioeconomic status among Canadian adults. CMAJ. 2000;162(9 suppl):S13-S24.
528. Alter D, Iron K, Austin P, Naylor C. Socioeconomic status, service patterns, and perceptions of care among survivors of acute myocardial infarction in Canada. JAMA. 2004;291(9):1100-1107.
529. Pilote L, Tu J, Humphries K, et al. Socioeconomic status, access to health care, and outcomes after acute myocardial infarction in Canada’s universal health care system. Med Care. 2007;45(7):638-646.
530. Heart and Stroke Foundation. The Growing Burden of Heart Disease and Stroke. Ottawa, ON: Heart and Stroke Foundation; 2003. http://www.cvdinfobase.ca/cvdbook/CVD_En03.pdf. Accessed December 19, 2014.
531. Active Living by Design. Low Income Populations and Physical Activity. Chapel Hill, US: Active Living by Design; 2012. http://www.bms.com/documents/together_on_diabetes/2012-Summit-Atlanta/Physical-Activity-for-Low-Income-Populations-The-Health-Trust.pdf. Accessed October 1, 2014.
532. BC Healthy Living Alliance. Why Don’t People Participate? Vancouver, BC: BCHLA; 2014. http://www.physicalactivitystrategy.ca/pdfs/Why_Dont_People_Participate.pdf. Accessed October 1, 2014.

285
References
533. Transport Canada. Active Transportation in Canada: A Resource and Planning Guide. Ottawa, ON: Transport Canada; 2011. http://www.tc.gc.ca/media/documents/programs/atge.pdf.
534. City of Calgary. Cycling Strategy. Calgary AB: City of Calgary; 2011. http://www.calgary.ca/_layouts/cocis/DirectDownload.aspx?target=http%3a%2f%2fwww.calgary.ca%2fTransportation%2fTP%2fDocuments%2fcycling%2fCycling-Strategy%2f2011-cycling-strategy.pdf&sf=1. Accessed December 19, 2014.
535. Cairns JM, Bambra C, Hillier-Brown FC, Moore H, Moore HJ, Summerbell CD. Weighing up the evidence: a systematic review of the effectiveness of workplace interventions to tackle socio-economic inequalities in obesity. J Public Health (Oxf). 2014;Epub ahead of print.
536. Active Living by Design. Low Income Populations and Physical Activity. Chapel Hill, US: Active Living by Design; 2012. http://www.bms.com/documents/together_on_diabetes/2012-Summit-Atlanta/Physical-Activity-for-Low-Income-Populations-The-Health-Trust.pdf. Accessed October 1, 2014.
537. British Columbia Healthy Living Alliance. BC Healthy Living Alliance Physical Activity Strategy. Vancouver, BC: BCHLA; 2007. http://www.bchealthyliving.ca/wp-content/uploads/2014/07/BCHLA_PhysicalActivityStrategy.pdf. Updated March 15, 2007.
538. BC Recreation and Parks Association. BCHLA Physical Activity Strategy Evaluation Report September 2008–September 2010. Vancouver, BC: British Columbia Healthy Living Alliance; 2010. http://www.bchealthyliving.ca/sites/all/files/file/BCHLA_PAS_Evaluation_Executive_Summary.pdf. Accessed October 1, 2014.
539. BC Recreation and Parks Association. BCHLA Physical Activity Strategy Evaluation Report September 2008–September 2010. Vancouver, BC: British Columbia Healthy Living Alliance; 2010. http://www.bchealthyliving.ca/sites/all/files/file/BCHLA_PAS_Evaluation_Executive_Summary.pdf. Accessed October 1, 2014.
540. Canadian Diabetes Association. Diabetes Charter. Ottawa, ON: CDA; 2014. http://www.diabetes.ca/getmedia/513a0f6c-b1c9-4e56-a77c-6a492bf7350f/diabetes-charter-backgrounder-national-english.pdf. Accessed September 24, 2014.
541. Canadian Diabetes Association. About diabetes. http://www.diabetes.ca/getmedia/71283b83-d37a-489f-bfe4-90c38ee29921/backgrounder-about-diabetes-english.pdf. Updated 2014. Accessed September 24, 2014.
542. Canadian Diabetes Association Clinical Practice Guidelines Expert Committee. Canadian Diabetes Association 2013 clinical practice guidelines for the prevention and management of diabetes. Can J Diabetes. 2013;37(suppl 1):S1-S212.
286
Trends in Income-Related Health Inequalities in Canada
543. Public Health Agency of Canada. Diabetes in Canada: Facts and Figures From a Public Health Perspective. Ottawa, ON: PHAC; 2011. http://www.phac-aspc.gc.ca/cd-mc/publications/diabetes-diabete/facts-figures-faits-chiffres-2011/pdf/facts-figures-faits-chiffres-eng.pdf. Accessed September 24, 2014.
544. Hill J, Nielsen M, Fox M. Understanding the social factors that contribute to diabetes: a means to informing health care and social policies for the chronically ill. Perm J. 2013;17(2):67-72.
545. Pilkington F, Daiski I, Bryant T, Dinca-Panaitescu M, Dinca-Panaitescu S, Raphael D. The experience of living with diabetes for low-income Canadians. Can J Diabetes. 2010;34(2):119-126.
546. Raphael D, Anstice S, McGannon K, Raine K, Rizvi S, Yu V. The social determinants of the incidence and management of type 2 diabetes mellitus: are we prepared to rethink our questions and redirect our research activities? Int J Health Care Qual Assur. 2003;16(3):10-20.
547. Yu V, Raphael D. Identifying and addressing the social determinants of the incidence and successful management of type 2 diabetes mellitus in Canada. Can J Public Health. 2004;95(5):366-368.
548. Ross N, Gilmour H, Dasgupta K. 14-year diabetes incidence: the role of socio-economic status. Health Rep. 2010;21(3):19-28. http://www.statcan.gc.ca/pub/82-003-x/2010003/article/11325-eng.pdf. Accessed September 24, 2014.
549. Lysy Z, Booth G, Shah B, Austin P, Luo J, Lipscombe L. The impact of income on the incidence of diabetes: a population-based study. Diabetes Res Clin Pract. 2013;99:372-379.
550. Dinca-Panaitescu M, Dinca-Panaitescu S, Raphael D, Bryant T, Pilkington B, Daiski I. The dynamics of the relationship between diabetes incidence and low income: longitudinal results from Canada’s National Population Health Survey. Maturitas. 2012;72:229-235.
551. Canadian Institute for Health Information. Diabetes Care Gaps and Disparities in Canada. Ottawa, ON: CIHI; 2009. https://secure.cihi.ca/free_products/Diabetes_care_gaps_disparities_aib_e.pdf. Accessed September 24, 2014.
552. Booth G, Lipscombe L, Bhattacharyya O, et al. Diabetes. In: Bierman A, ed. Project for an Ontario Women’s Health Evidence-Based Report. Toronto, ON: Institute for Clinical Evaluative Sciences; 2010.
553. Booth G, Bishara P, Lipscombe L, et al. Universal drug coverage and socioeconomic disparities in major diabetes outcomes. Diabetes Care. 2012;35:2257-2264.
554. Lipscombe L, Austin P, Manuel DG, Shah B, Hux J, Booth G. Income-related differences in mortality among people with diabetes mellitus. CMAJ. 2010;182(1):e1-e17.

287
References
555. Hill J, Galloway J, Goley A, et al. Scientific statement: sociological determinants of prediabetes and type 2 diabetes. Diabetes Care. 2013;36:2430-2439.
556. Booth G, Creatore MI, Moineddin R, et al. Unwalkable neighbourhoods, poverty, and the risk of diabetes among recent immigrants to Canada compared with long-term residents. Diabetes Care. 2013;36(302):308.
557. Auchincloss A, Diez Roux AV, Mujahid M, Shen M, Bertoni A, Carnethon M. Neighbourhood resources for physical activity and healthy foods and incidence of type 2 diabetes mellitus. Arc Intern Med. 2009;169(18):1698-1704.
558. Public Health Agency of Canada. Reducing Health Disparities Related to Diabetes: Lessons Learned Through the Canadian Diabetes Strategy Community-Based Program. Ottawa, ON: PHAC; 2011. http://www.phac-aspc.gc.ca/cd-mc/diabetes-diabete/rhd-rds-2011/pdf/rhd-rds-2011-eng.pdf. Accessed July 21, 2014.
559. Canadian Diabetes Association. The Burden of Out of Pocket Costs for Canadians With Diabetes. Ottawa, ON: CDA; 2011. http://www.diabetes.ca/CDA/media/documents/publications-and-newsletters/advocacy-reports/burden-of-out-of-pocket-costs-for-canadians-with-diabetes.pdf. Accessed September 24, 2014.
560. Kongats K. Diabetes Prevention and Management Through a Health Equity Lens. Toronto, ON: Wellesley Institute; 2013. http://www.diabetes.ca/CDA/media/documents/publications-and-newsletters/advocacy-reports/burden-of-out-of-pocket-costs-for-canadians-with-diabetes.pdf. Accessed September 24, 2014.
561. Statistics Canada. Immigration and Ethnocultural Diversity in Canada. Ottawa, ON: Statistics Canada; 2013. http://www12.statcan.gc.ca/nhs-enm/2011/as-sa/99-010-x/99-0
10-x2011001-eng.pdf. Accessed September 29, 2014.
562. Public Health Agency of Canada. Diabetes in Canada: Facts and Figures From a Public Health Perspective. Ottawa, ON: PHAC; 2011. http://www.phac-aspc.gc.ca/cd-mc/publications/diabetes-diabete/facts-figures-faits-chiffres-2011/pdf/facts-figures-faits-chiffres-eng.pdf.
563. Misra A, Ganda O. Migration and its impact on adiposity and type 2 diabetes. Nutrition. 2007;23:696-708.
564. Heisz A, McLeod L. Low Income in Census Metropolitan Areas. Ottawa, ON: Statistics Canada; 2004. http://www.statcan.gc.ca/pub/75-001-x/10504/6868-eng.pdf. Accessed September 29, 2014.
565. Gushulak B, Pottie K, Roberts J, Torres S, DesMeules M. Migration and health in Canada: health in the global village. CMAJ. 2011;183(12):E952-E958.

288
Trends in Income-Related Health Inequalities in Canada
566. Creatore MI, Moineddin R, Booth G, et al. Age- and sex-related prevalence of diabetes mellitus among immigrants to Ontario, Canada. CMAJ. 2010;182(8):781-789.
567. Harvey B, Mandrich G. Latino Families in Action: Implementing and Evaluating a Community-Based Obesity Prevention Program for a High-Risk Paediatric Population. Ottawa, ON: Canadian Public Health Association; 2014. http://resources.cpha.ca/CPHA/Conf/Data/2009/A09-532e.pdf. Accessed July 21, 2014.
568. World Health Organization. Mental health: strengthening our response—factsheet 220. http://www.who.int/mediacentre/factsheets/fs220/en/. Updated April 2014. Accessed April 16, 2014.
569. Public Health Agency of Canada. The Human Face of Mental Health and Mental Illness in Canada. Ottawa, ON: PHAC; 2006. http://www.phac-aspc.gc.ca/publicat/human-humain06/pdf/human_face_e.pdf. Accessed December 19, 2014.
570. Mawani FN, Gilmour H. Validation of Self-Rated Mental Health. Ottawa, ON: Statistics Canada; 2010. http://www.statcan.gc.ca/pub/82-003-x/2010003/article/11288-eng.pdf. Accessed December 19, 2014.
571. Canadian Mental Health Association. The Relationship Between Mental Health, Mental Illness and Chronic Physical Conditions. Ottawa, ON: CMHA; 2008.
572. World Health Organization. Promoting Mental Health: Concepts, Emerging Evidence, and Practice. Geneva, Switzerland: WHO; 2004. http://www.who.int/mental_health/evidence/en/promoting_mhh.pdf. Accessed April 22, 2014.
573. Jané-Llopis E, Barry M, Hosman C, Patel V. Mental health promotion works: a review. Promot Educ. 2005;13(suppl 2):9-25.
574. Canadian Mental Health Association. Mental health promotion: a framework for action. http://www.cmha.ca/public_policy/mental-health-promotion-a-framework-for-action/#.U1fR66KQRI0. Updated 2008. Accessed April 23, 2014.
575. Canadian Institute for Health Information. Exploring Positive Mental Health. Ottawa, ON: CIHI; 2009. http://www.cihi.ca/cihi-ext-portal/pdf/internet/improving_health_canadians_en. Accessed April 17, 2014.
576. World Health Organization. Investing in Mental Health: Evidence for Action. Geneva, Switzerland: WHO; 2013. http://apps.who.int/iris/bitstream/10665/87232/1/9789241564618_eng.pdf. Accessed April 11, 2014.
577. World Health Organization. Promoting Mental Health. Geneva, Switzerland: WHO; 2005. http://www.who.int/mental_health/evidence/MH_Promotion_Book.pdf.
289
References
578. Canadian Institute for Health Information. Return on Investment: Mental Health Promotion and Mental Illness Prevention. Ottawa, ON: CIHI; 2011. https://secure.cihi.ca/free_products/roi_mental_health_report_en.pdf. Accessed December 19, 2014.
579. Oldershaw L. A National Survey of Parents of Young Children. Toronto, ON: Invest in Kids; 2002. http://www.phoenixpembroke.com/sites/default/files/National_Survey_of_Parents_of_Young_Children_FULL_REPORT.pdf.
580. Skrypnek B, Charchun J. An Evaluation of the Nobody’s Perfect Parenting Program. Ottawa, ON: Canadian Association of Family Resource Programs; 2009. http://www.parentsmatter.ca/document/docWindow.cfm?fuseaction=document.viewDocument&documentid=420&documentFormatId=1110. Accessed May 2, 2014.
581. Nobody’s Perfect. Summaries of evaluations and reports. http://www.nobodysperfect.ca/innerpage.aspx?x=SKFCdBKfEk8VjBJNA1F1AgVfmsYwZjeRdMzqWD4rDuNqX4JHOFTpRj%2FQB79Biig3. Updated 2013. Accessed November 14, 2014.
582. Statistics Canada. Health Indicators (82-221-XWE). Ottawa, ON: Statistics Canada; 2012. http://www.statcan.gc.ca/pub/82-221-x/2013001/tblstructure/1hs/1de/de1imx-eng.htm.
583. Statistics Canada. Table 102-0504: Deaths and mortality rates, by age group and sex, Canada, provinces and territories. http://www5.statcan.gc.ca/cansim/a05?lang=eng&id=1020504&paSer=&pattern=102-0504&stByVal=1&csid. Updated 2013.
584. Public Health Agency of Canada. Perinatal Health Indicators for Canada 2013: A Report From the Canadian Perinatal Surveillance System. Ottawa, ON: PHAC; 2013.
585. Hammersley L. The prevention of psychological morbidity following perinatal death. Br J Gen Pract. 1997;(47):583-586.
586. Stroebe M, Schut H, Stroebe W. Review: health outcomes of bereavement. Lancet. 2007;370(9603):1960.
587. Kersting A, Wagner B. Complicated grief after perinatal loss. Dialogues Clin Neurosci. 2012;14(2)
588. Gilbert NL, Auger N, Wilkins R, Kramer M. Neighbourhood income and neonatal, postneonatal and sudden infant death syndrome (SIDS) mortality in Canada, 1991–2005. Can J Public Health. 2013;104(3):e187-e192.
589. Arntzen A, Samuelsen SO, Bakketeig LS, Stoltenberg C. Socioeconomic status and risk of infant death. A population-based study of trends in Norway, 1967–1998. Int J Epidemiol. 2004;33(2):279-288.
290
Trends in Income-Related Health Inequalities in Canada
590. The Conference Board of Canada. Infant mortality. http://www.conferenceboard.ca/hcp/details/health/infant-mortality-rate.aspx. Updated 2012. Accessed January 16, 2013.
591. Organisation for Economic Co-operation and Development. “Infant Mortality” in OECD Factbook 2013: Economic, Environmental and Social Statistics. Paris, France: OECD Publishing; 2013. http://dx.doi.org/10.1787/factbook-2013-96-en.
592. Reidpath D, Allotey P. Infant mortality rate as an indicator of population health. J Epidemiol Community Health. 2003;57:344-346.
593. Spong CY, Iams J, Goldenberg R, Hauck FR, Willinger M. Disparities in perinatal medicine: preterm birth, stillbirth, and infant mortality. Obstet Gynecol. 2011;117(4):948-955.
594. World Health Organization. Neonatal and Perinatal Mortality: Country, Regional, Global Estimates. Geneva, Switzerland: WHO; 2006. http://whqlibdoc.who.int/Publications/2006/9241563206_Eng.Pdf.
595. Lu MC, Kotelchuck M, Hogan V, Jones L, Wright K, Halfon N. Closing the black–white gap in birth outcomes: a life-course approach. Ethn Dis. 2010;20(2):62-76.
596. Lu MC, Halfon N. Racial and ethnic disparities in birth outcomes: a life-course perspective. Matern Child Health J. 2003;7(1):13-30.
597. Lu MC, Johnson KA. Toward a national strategy on infant mortality. Am J Public Health. 2014;104(S1):S13-S16.
598. Smylie J, Fell D, Ohlsson A; Joint Working Group on First Nations, Indian, Inuit, and Métis Infant Mortality of the Canadian Perinatal Surveillance System. A review of Aboriginal infant mortality rates in Canada: striking and persistent Aboriginal/non-Aboriginal inequities. Can J Public Health. 2010;101(2):143-148.
599. Kramer M, Goulet L, Lydon J, et al. Socio-economic disparities in preterm birth: causal pathways and mechanisms. Paediatr Perinat Epidemiol. 2001;15(2):104-123.
600. Jenkins A, Gyorkos T, Culman K, Ward B, Pekeles G, Mills E. An overview of factors influencing the health of Canadian Inuit infants. Int J Circumpolar Health. 2003;62(1):17-39.
601. Ali K, Ahmed N, Greenough A. Sudden infant death syndrome (SIDS), substance misuse, and smoking in pregnancy. Res Rep Neonatol. 2012;2:95-1.
602. Zhang K, Wang X. Maternal smoking and increased risk of sudden infant death syndrome: a meta-analysis. Leg Med. 2013;15(3):115-121.
603. Heaman M, Kingston D, Chalmers B, Sauve R, Lee L, Young D. Risk factors for preterm birth and small-for-gestational-age births among Canadian women. Paediatr Perinat Epidemiol. 2013;27(1):54-61.

291
References
604. Pulver LS, Geust-Warnick G, Stoddard GJ, Byington CL, Young PC. Weight for gestational age affects the mortality of late preterm infants. Pediatrics. 2009;123(6):1072-1077.
605. Carmichael SL, Yang W, Herring A, Abrams B, Shaw GM. Maternal food insecurity is associated with increased risk of certain birth defects. J Nutr. 2007:2087-2092.
606. Statistics Canada. Table 102-0562: Leading causes of death, infants, by sex, Canada, annual. http://www5.statcan.gc.ca/cansim/pick-choisir?lang=eng&searchTypeByValue=1&id=1020562. Updated 2014.
607. Aune D, Saugstad OD, Henriksen T, Tonstad S. Maternal body mass index and the risk of fetal death, stillbirth, and infant death: a systematic review and meta-analysis. JAMA. 2014;311(15):1536-1546.
608. Little M, Shah R, Vermeulen MJ, Gorman A, Dezendoletas D, Ray JG. Adverse perinatal outcomes associated with homelessness and substance use in pregnancy. CMAJ. 2005:615-618.
609. Heaman MI, Green CG, Newburn-Cook CV, Elliott LJ, Helewa ME. Social inequalities in use of prenatal care in Manitoba. J Obstet Gynaecol Can. 2007;29(10):806-816.
610. Brand SR, Brennan PA. Impact of antenatal and postpartum maternal mental illness: how are the children? Clin Obstet Gynecol. 2009;52(3):441-455.
611. Ip S, Chung M, Raman G, et al. Breastfeeding and maternal and infant health outcomes in developed countries. Evid Rep Technol Assess (Full Rep). 2007;(153):1-186.
612. Health Canada. Breastfeeding initiation in Canada: key statistics and graphics (2009– 2010). http://www.hc-sc.gc.ca/fn-an/surveill/nutrition/commun/prenatal/initiation-eng.php. Updated June 27, 2012.
613. Canadian Diabetes Association and Diabetes Quebec. Diabetes: Canada at the Tipping Point—Charting a New Path. 2011. http://www.diabetes.ca/CDA/media/documents/publications-and-newsletters/advocacy-reports/canada-at-the-tipping-point-english.pdf. Accessed March 30, 2015.
614. Eller JD. Ethnicity, culture, and “the past.” Mich Q Rev. 1997;XXXVI(4). http://hdl.handle.net/2027/spo.act2080.0036.411. Accessed April 8, 2015.
615. Statistics Canada and Organisation for Economic Co-operation and Development. Learning a Living: First Results of the Adult Literacy and Life Skills Survey. Ottawa, ON and Paris, France: OECD Publishing; 2005. http://www.oecd-ilibrary.org/education/learning-a-living_9789264010390-en.
616. Statistics Canada. Table 105-0501: Health indicator profile, annual estimates, by age group and sex, Canada, provinces, territories, health regions (2013 boundaries) and peer groups, occasional. http://www5.statcan.gc.ca/cansim/a26?lang=eng&id=1050501. Updated 2015. Accessed June 29, 2015.

Production of this document is made possible by financial contributions from Health Canada and provincial and territorial governments. The views expressed herein do not necessarily represent the views of Health Canada or any provincial or territorial government.
All rights reserved.
The contents of this publication may be reproduced unaltered, in whole or in part and by any means, solely for non-commercial purposes, provided that the Canadian Institute for Health Information is properly and fully acknowledged as the copyright owner. Any reproduction or use of this publication or its contents for any commercial purpose requires the prior written authorization of the Canadian Institute for Health Information. Reproduction or use that suggests endorsement by, or affiliation with, the Canadian Institute for Health Information is prohibited.
For permission or information, please contact CIHI:
Canadian Institute for Health Information 495 Richmond Road, Suite 600 Ottawa, Ontario K2A 4H6
Phone: 613-241-7860 Fax: 613-241-8120 [email protected]
ISBN 978-1-77109-508-2 (PDF)
© 2016 Canadian Institute for Health Information
How to cite this document: Canadian Institute for Health Information. Trends in Income-Related Health Inequalities in Canada, Revised July 2016. Ottawa, ON: CIHI; 2016.
Cette publication est aussi disponible en français sous le titre Tendances des inégalités en santé liées au revenu au Canada, révisé en juillet 2016. ISBN 978-1-77109-509-9 (PDF)
Talk to Us CIHI Ottawa 495 Richmond Road, Suite 600 Ottawa, Ontario K2A 4H6 Phone: 613-241-7860
CIHI Toronto 4110 Yonge Street, Suite 300 Toronto, Ontario M2P 2B7 Phone: 416-481-2002
CIHI Victoria 880 Douglas Street, Suite 600 Victoria, British Columbia V8W 2B7 Phone: 250-220-4100
CIHI Montréal 1010 Sherbrooke Street West, Suite 300 Montréal, Quebec H3A 2R7 Phone: 514-842-2226
CIHI St. John’s 140 Water Street, Suite 701 St. John’s, Newfoundland and Labrador A1C 6H6 Phone: 709-576-7006
13436-0716
www.cihi.ca At the heart of data