trends in us power, gas, and renewable economics · 2017-05-02 · trends in us power, gas, and...
TRANSCRIPT

1
Trends in US power, gas, and renewable economics
● Factors pushing and pulling on wholesale power prices˗ Fuel prices˗ Renewable merit order effect˗ Slowing load growth˗ Energy smart technologies (demand shifting)
● Key trends in US power and gas markets˗ Overcapacity and lingering coal plants - waiting for martyrs?˗ US gas: low-cost production and increasing exports˗ Operational trends for combined-cycle gas turbines˗ Renewables pipeline, system costs, realized prices and associated merit order effect

2
Supply curve (merit order)
Price -
$/MWh
Quantity - MW
Wholesale price
Demand curve (load)
Source: Bloomberg New Energy Finance
Factors that have contributed (and will continue to contribute) to wholesale power price suppression

COAL AND GAS GENERATION ECONOMICS

4March 27 2017
July 2008$13.58
March 2016$1.66
Today$3.00
Source: Bloomberg
Henry Hub natural gas price, 2007-17

5
0
20
40
60
80
100
120
2005 2006 2007 2008 2009 2010 2011 2012 2013 2014 2015 2016 2017 2018 2019 2020
Short-run marginal cost of generation of coal and gas versus ERCOT North Hub on-off peak spreads($/MWh real 2016 USD)
● Gas marginal costs have undercut coal and the forwardcurves show fierce competition
● Transport (railcar) costs make up approximately 65% ofdelivered fuel costs and 50% of a TX coal plant’s SRMC,assuming 2014 average rail costs of $22/ton from WY.
● Texas is the greatest consumer of PRB coal, leavingthe Wyoming producers’ very dependent on ERCOTcoal demand.
Source: Bloomberg New Energy Finance Note: Assumes heat rate 7MMBtu/MWh for CCGT and 10MMBtu/MWh assuming constant $22/sttransport for PRB8800 coal. Excludes variable O&M which is typically higher for coal than for gas.
SRMC on Waha Hub gas
ERCOT North Hub on-off peak spread
SRMC on PRB coal
history forward curve
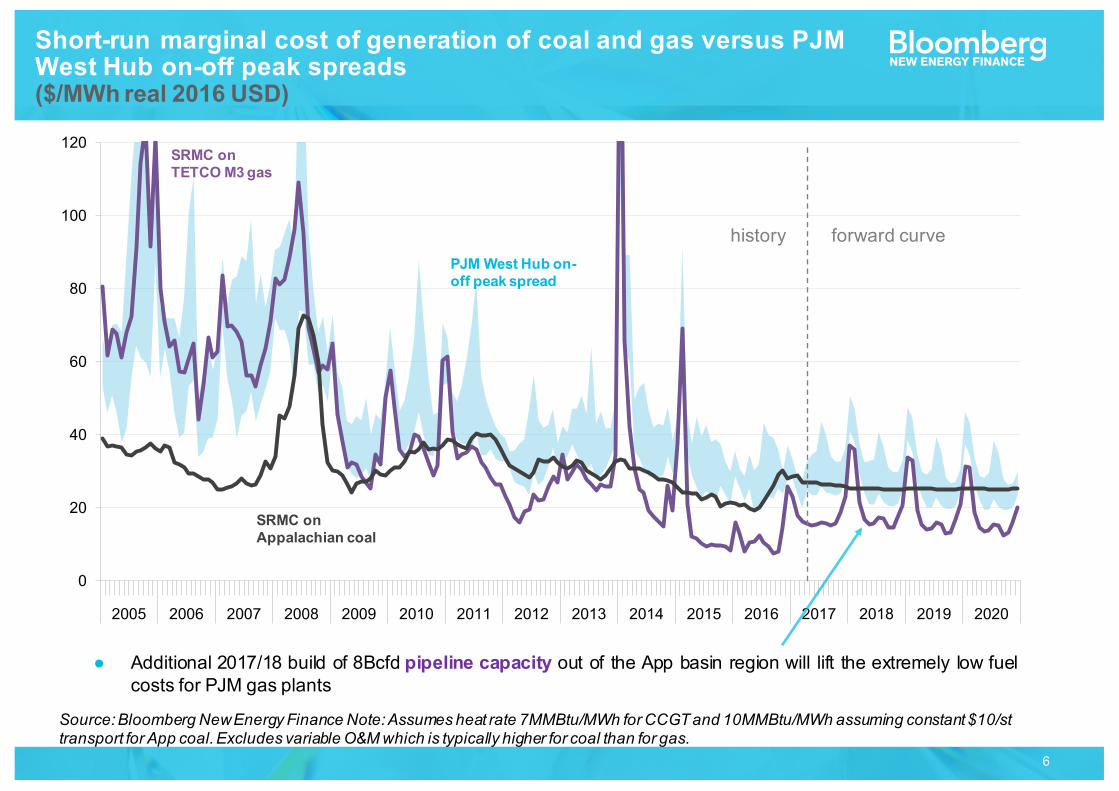
6
0
20
40
60
80
100
120
2005 2006 2007 2008 2009 2010 2011 2012 2013 2014 2015 2016 2017 2018 2019 2020
Short-run marginal cost of generation of coal and gas versus PJM West Hub on-off peak spreads($/MWh real 2016 USD)
Source: Bloomberg New Energy Finance Note: Assumes heat rate 7MMBtu/MWh for CCGT and 10MMBtu/MWh assuming constant $10/sttransport for App coal. Excludes variable O&M which is typically higher for coal than for gas.
SRMC on TETCO M3 gas
PJM West Hub on-off peak spread
SRMC on Appalachian coal
● Additional 2017/18 build of 8Bcfd pipeline capacity out of the App basin region will lift the extremely low fuelcosts for PJM gas plants
history forward curve

7
Daily power mix, 2012 - yesterday

8
Planned US coal retirements according to the EIA (GW)
EIA reports about 8GW of US coal planned to retire in the next few years. Even more could be driven by:● Overcapacity: the low cost of gas and the policy-driven addition of renewables (discussed later) are
pushing coal out ● Load growth is sub-1% in almost all markets● Will Munis and Co-ops respond differently? The value of local jobs?
-16.0
-14.0
-12.0
-10.0
-8.0
-6.0
-4.0
-2.0
0.0
2014
2015
2016
2017
2018
2019
2020
2021
Bituminous
Sub-bituminous
GW
Source: Bloomberg New Energy Finance
9
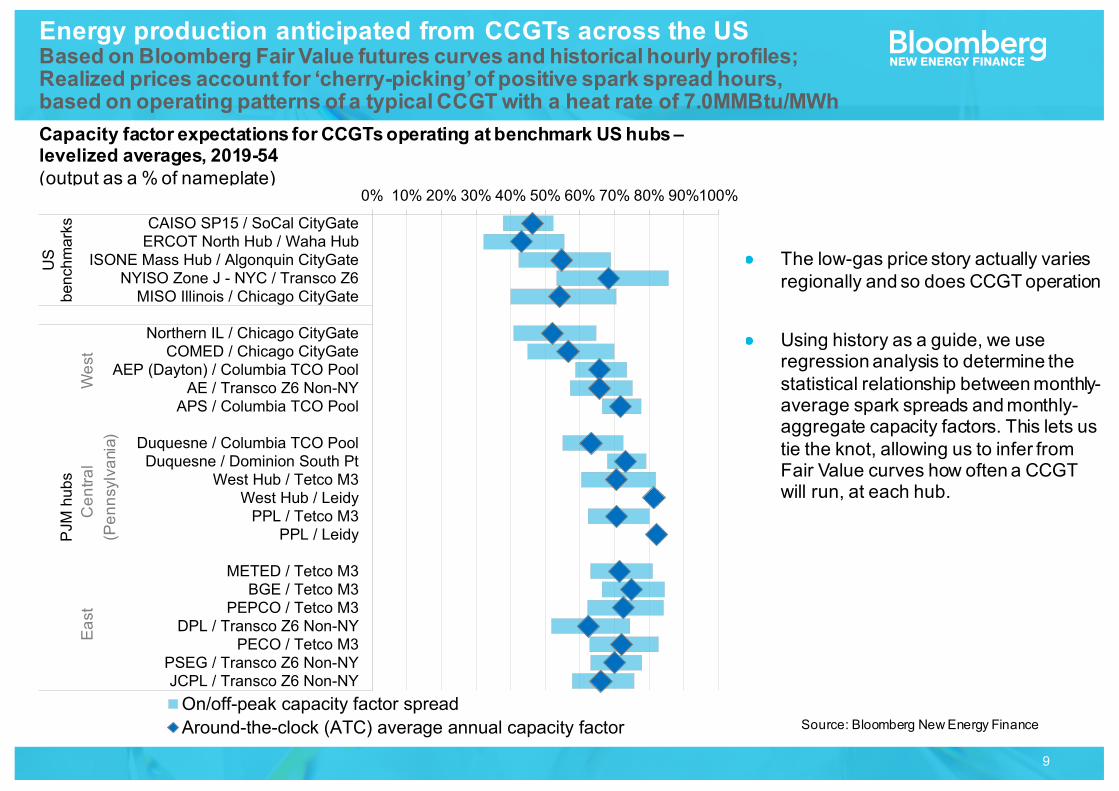
Energy production anticipated from CCGTs across the USBased on Bloomberg Fair Value futures curves and historical hourly profiles;Realized prices account for ‘cherry-picking’ of positive spark spread hours,based on operating patterns of a typical CCGT with a heat rate of 7.0MMBtu/MWh
● The low-gas price story actually varies regionally and so does CCGT operation
● Using history as a guide, we use regression analysis to determine the statistical relationship between monthly-average spark spreads and monthly-aggregate capacity factors. This lets us tie the knot, allowing us to infer from Fair Value curves how often a CCGT will run, at each hub.
Capacity factor expectations for CCGTs operating at benchmark US hubs –levelized averages, 2019-54(output as a % of nameplate)
0% 10% 20% 30% 40% 50% 60% 70% 80% 90%100%
CAISO SP15 / SoCal CityGateERCOT North Hub / Waha Hub
ISONE Mass Hub / Algonquin CityGateNYISO Zone J - NYC / Transco Z6
MISO Illinois / Chicago CityGate
Northern IL / Chicago CityGateCOMED / Chicago CityGate
AEP (Dayton) / Columbia TCO PoolAE / Transco Z6 Non-NY
APS / Columbia TCO Pool
Duquesne / Columbia TCO PoolDuquesne / Dominion South Pt
West Hub / Tetco M3West Hub / Leidy
PPL / Tetco M3PPL / Leidy
METED / Tetco M3BGE / Tetco M3
PEPCO / Tetco M3DPL / Transco Z6 Non-NY
PECO / Tetco M3PSEG / Transco Z6 Non-NYJCPL / Transco Z6 Non-NY
US
benc
hmar
ksPJ
M h
ubs
On/off-peak capacity factor spreadAround-the-clock (ATC) average annual capacity factor
East
C
entra
l
Wes
t(P
enns
ylva
nia)
Source: Bloomberg New Energy Finance

10
Spark spreads ($/MWh)
Gross margins ($/MW)
Daily spark spread and capacity factor profilesFor a typical CCGT selling day-ahead power into CAISO’s SP15 Hub;buying SoCal CityGate gas and California carbon allowances; operating at a heat rate of 7.0MMBtu/MWh
Two weeks in March 2016
-15-10-505
10152025
9 10 11 12 13 14 15 16 17 18 19 20 21 22Mar 2016
0%
25%
50%
75%
100%
-20
-10
0
10
20
30
40
9 10 11 12 13 14 15 16 17 18 19 20 21 22Mar 2016
Capacity factor (%)
CCGT output (capacity factor) Spark spreads
Losses associated without-of-the-money energy output
Gains from producing during positive spark-hours
Startup and shutdown costs

U.S. NATURAL GAS

12
● Production in the Utica and Marcellus shale plays has been growing rapidly in recent years, increasing nearly 70% since 2014.
● Ohio, Pennsylvania and West Virginia fill the 22.5Bcfd of pipeline capacity that moves gas out of the region. Growth in production therefore depends on growth in pipeline infrastructure.
● Takeaway pipeline capacity, or what we call “first mile” pipelines, are the bottleneck in Appalachian production. Therefore, it is no surprise that many projects are underway to increase this takeaway capacity.
● Some projects plan to expand capacity on existing pipelines in the region or reverse the direction of pipes that were originally designed to move gas into the North-Atlantic.
Appalachian pipeline buildout
13
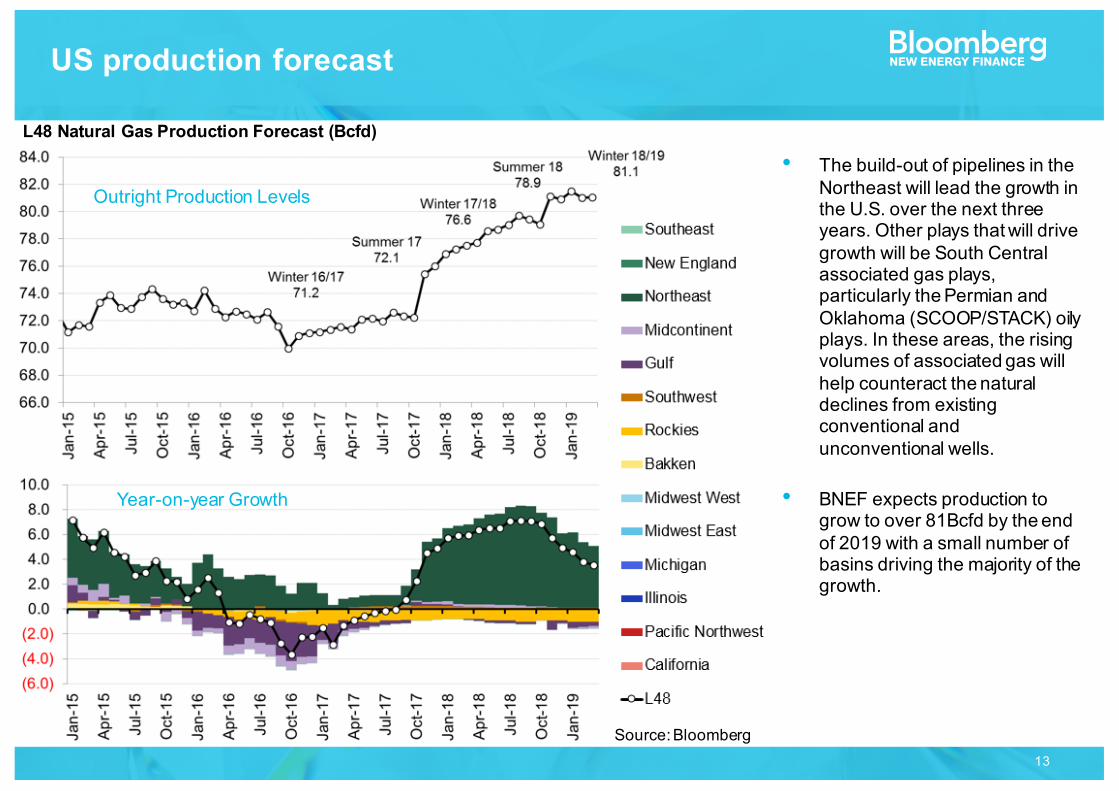
L48 Natural Gas Production Forecast (Bcfd)
Source: Bloomberg
• The build-out of pipelines in the Northeast will lead the growth in the U.S. over the next three years. Other plays that will drive growth will be South Central associated gas plays, particularly the Permian and Oklahoma (SCOOP/STACK) oily plays. In these areas, the rising volumes of associated gas will help counteract the natural declines from existing conventional and unconventional wells.
• BNEF expects production to grow to over 81Bcfd by the end of 2019 with a small number of basins driving the majority of the growth.
Outright Production Levels
Year-on-year Growth
US production forecast

14
10.29 12.79
3.33 0.87
27.64 24.09
21.67 9.79
3.25 13.00
6.91 15.94
3.61
10.06 14.88
31.67 2.94
54.82
EuropePortugalSpainItalyMaltaAsiaChinaIndiaJapanSouth KoreaMiddle EastU.A.E.JordanKuwaitTurkeyEgyptSouth AmericaBrazilArgentinaChileDominican RepublicMexico
Note: Some ships offloaded gas at multiple destinations. We count each offload as a delivery.
Note: data in Bcf
● Over the last decade, the U.S. went from an importer to an exporter of LNG.
● 95 tankers with 298Bcf have left for 18 countries (in South America, the Middle East, Europe, and Asia)
● Sabine Trains 1, 2, and 3 have commenced operations, while Sabine Train 4 and Cove Point are expected to come on in H2 2017. Cheniere’s commercial structure has a stated cost structure of 115% Henry Hub with a $2.25/MMBtu fixed fee. (We view this fixed fee as a sunk cost)
● US LNG appears cost-competitive, offering positive netbacks throughout the year based on NBP, SLInG and Brent futures prices.
U.S. Henry Hub trades at a discount to global prices
Singapore SLInGUK NBP PricesBrent Oil Index (12.5%)
US Henry Hub
Where US exports have gone?
Source: Bloomberg
LNG exports

15March 27 2017
Capacity by region● Canada 2.1MMtpa (0.28Bcfd)
● US East 7.75MMtpa (1.0Bcfd)
● US Gulf 61.8MMtpa (8.1Bcfd)
− South Texas 24.3MMtpa (3.2Bcfd)
− Henry Hub 37.5MMtpa (4.9Bcfd) Source: BNEF/ Bloomberg
Upcoming LNG terminals

16
Source: Bloomberg
1.5Bcfd
4.0Bcfd
Gas exports to Mexico
17
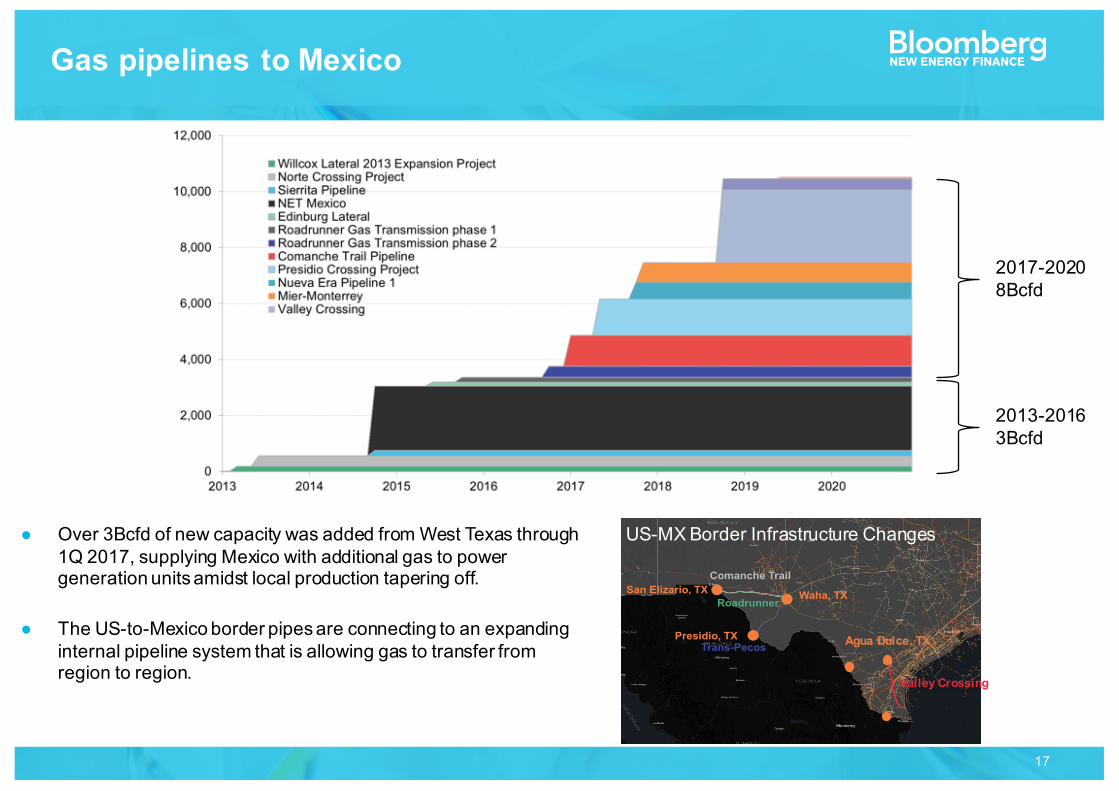
2.3 Bcfd
1.1 Bcfd1.7 Bcfd
2.6 Bcfd
Comanche Trail
Roadrunner
Trans-Pecos
San Elizario, TX
Presidio, TX
Waha, TX
Agua Dulce, TX
Valley Crossing
US-MX Border Infrastructure Changes● Over 3Bcfd of new capacity was added from West Texas through 1Q 2017, supplying Mexico with additional gas to power generation units amidst local production tapering off.
● The US-to-Mexico border pipes are connecting to an expanding internal pipeline system that is allowing gas to transfer from region to region.
2013-20163Bcfd
2017-20208Bcfd
Gas pipelines to Mexico
18
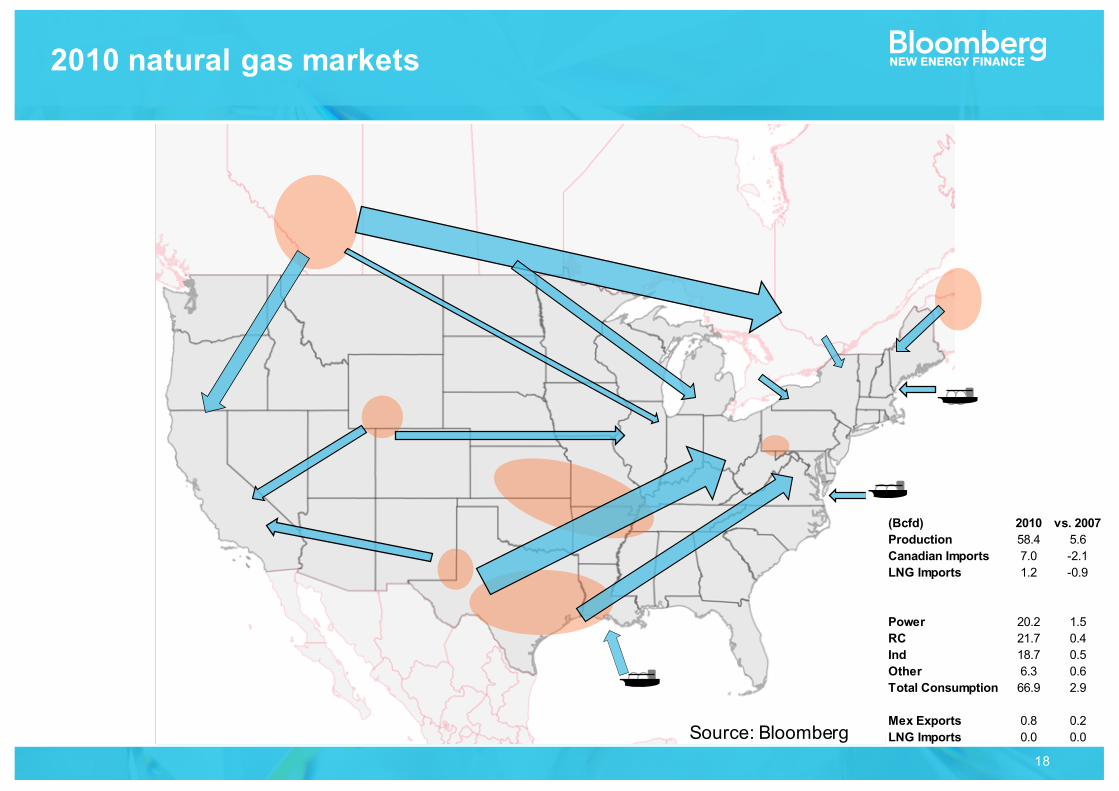
(Bcfd) 2010 vs. 2007Production 58.4 5.6Canadian Imports 7.0 -2.1LNG Imports 1.2 -0.9
Power 20.2 1.5RC 21.7 0.4Ind 18.7 0.5Other 6.3 0.6Total Consumption 66.9 2.9
Mex Exports 0.8 0.2LNG Imports 0.0 0.0Source: Bloomberg
2010 natural gas markets

19
(Bcfd) 2019 vs. 2016Production 81.0 8.7Canadian Imports 6.5 0.7LNG Imports 0.1 -0.1
Power 28.3 1.0RC 20.1 -0.5Ind 23.2 2.1Other 6.5 -0.1Total Consumption 78.1 2.6
Mex Exports 6.0 2.3LNG Imports 5.5 5.0Source: Bloomberg
2019 natural gas markets

20
US natural gas balance

21
● Low-cost production and new transport options˗ Well-head breakeven costs dropping with technological break-throughs˗ Associate gas with modest oil price recovery˗ Greenfield and brownfield pipeline projects
● LNG exports˗ Gulf Coast LNG economics work˗ Build out of new projects along the Gulf cost
● Mexican exports˗ Steady decline in Mexican oil and gas production from offshore fields˗ Mexico’s thirst for natural gas grows with incremental demand from power and industrial customers˗ Major pipeline projects in the U.S. and Canada are filling the domestic production gap
● Canadian imports˗ Midwest, Northeast, and Eastern Canadian markets switching to cheap Marcellus and Utica gas˗ New and modified pipelines making this feasible
must follow gas economics to follow power economicsà
The drivers of transformation in US gas

WIND AND SOLAR ECONOMICS

23
Note: New England has a 17.2% target by 2030, and PJM has a 12% target by 2030. *MI target is to be achieved by 2025. For dataset, see U.S. renewable portfolio standard (RPS) demand database (web | terminal). Source: Bloomberg New Energy Finance.
AL
AK
14%AZ
AR
50%CA
22%CO
26% CT
22% DC
25% DE
FL
1%GA
40%HI
ID
19%IL
8%IN
1%IA
16%KS
KY
LA
38%ME
21% MD
25% MA10%MI
28%MN
MS
11%MO
7%MT
NE
21%NV
23%NH
24% NJ
16%NM
50%NY
11%NC
9%ND
10%OH
15%OK
28%OR
17%PA
14% RI
SC
8%SD
TN
11%TX
20%UT
82%VT
3%VA
8%WA
WV
10%WI
WY
14%US
AL AZ CA CT DE GA ID IN KS LA MD MI MS MT NV NJ NY ND OK PA SC TN UT VA WVWY
US wind and solar build is still largely driven by states’ RPS and federal tax credits
State renewable portfolio standards in 2030, as a percentage of retail sales

24
0 500 1,000 1,500 2,000
Google Inc
Amazon
US Department of Defense
Microsoft Corp
Wal-Mart Stores Inc
Dow Chemical
Equinix
Facebook Inc
Ikea Group Corp
Kaiser Permanente
US General Services Administration
Switch SuperNAP
Mars Inc
Apple Inc
Procter & Gamble
MW
0 500 1,000 1,500 2,000Google Inc
Microsoft CorpEquinix
Kaiser PermanenteMars Inc
Solar
Wind
Other
Fuel Cells
Top corporate offtakers, 2008-16 (MW)
Source: Bloomberg New Energy Finance

25
Wind and solar realized power price estimates versus Day-Ahead Around-the-Clock, On-Peak, and Off-Peak prices($/MWh – real 2015USD)
There is more variation in wind realized power prices than in those of solar. Because of that variation, there is no rule of thumb for US wind realized power prices.
Source: Bloomberg Fair Value Curves, ISO wind production data, NREL PVWatts. Notes: Wind capacity factors employed at the ISO level. Solar capacity factors are hub-specific estimates (see Appendix A). Assumes a project online date of 2017, based on 20 year lifetime.
$0 $5 $10 $15 $20 $25 $30 $35 $40 $45
California SP15ERCOT West Hub
SPP*MISO Illinois
New England MainePJM West Hub
ERCOT West HubERCOT North Hub
ERCOT Houston HubCalifornia SP15California NP15PJM West Hub
PJM JCPLMISO Illinois
MISO IndianaNew York Zone A - West
New York Zone G - Hudson ValleyNew England Mass Hub
Win
dSo
lar P
V
On/off-peak price spread Around-the-clock average (ATC) priceProduction-weighted 'realized' price
Solar catches a premium realized price in all regions nationwide, except in California.
Solar benefits disproportionately from its daytime premium in markets like ERCOT where average prices are very low but daytime prices spike during the summer. ERCOT has the lowest average prices in the US, but solar prevails, realizing a $32/MWh average power price that is comparable with other regions.
26
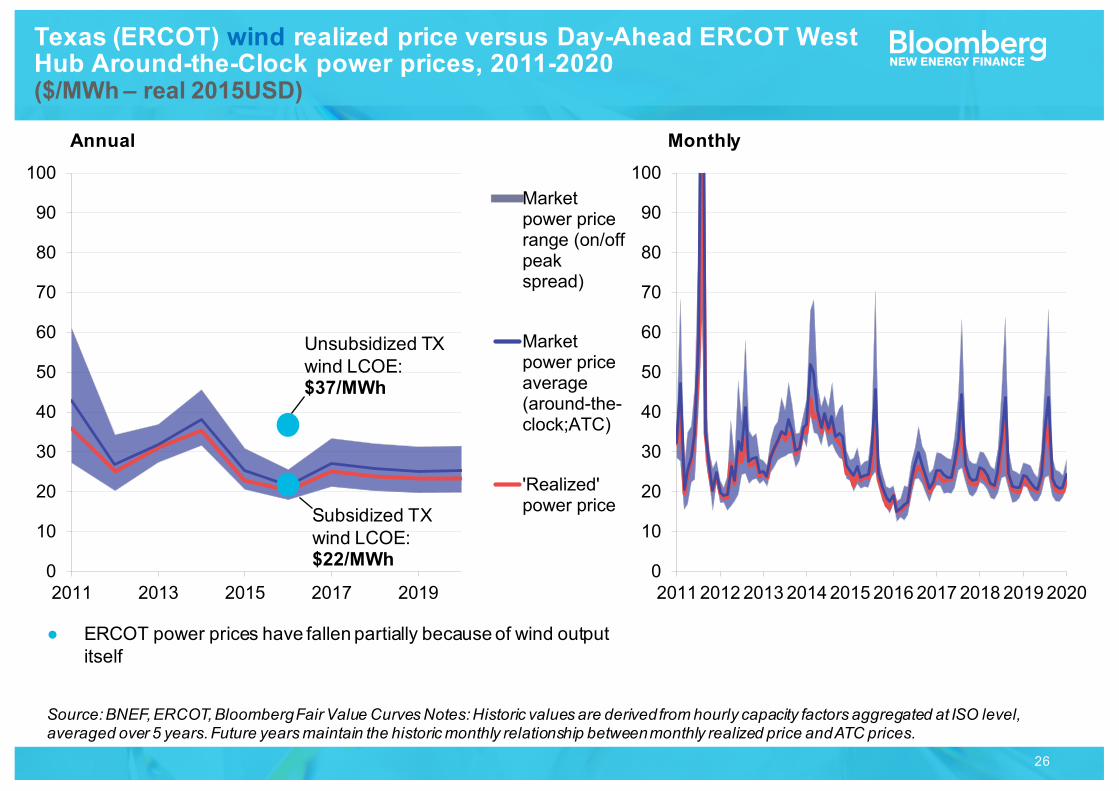
Texas (ERCOT) wind realized price versus Day-Ahead ERCOT West Hub Around-the-Clock power prices, 2011-2020($/MWh – real 2015USD)
Annual Monthly
0
10
20
30
40
50
60
70
80
90
100
2011 2013 2015 2017 20190
10
20
30
40
50
60
70
80
90
100
2011201220132014201520162017201820192020
● ERCOT power prices have fallen partially because of wind output itself
Source: BNEF, ERCOT, Bloomberg Fair Value Curves Notes: Historic values are derived from hourly capacity factors aggregated at ISO level, averaged over 5 years. Future years maintain the historic monthly relationship between monthly realized price and ATC prices.
0
10
20
30
40
50
60
70
80
90
100
2011201220132014201520162017201820192020
Marketpower pricerange (on/offpeakspread)
Marketpower priceaverage(around-the-clock;ATC)
'Realized'power price
Unsubsidized TX wind LCOE: $37/MWh
Subsidized TX wind LCOE: $22/MWh

27
West Texas “fixed-tilt” solar estimated realized price versus Day-Ahead ERCOT West Hub Around-the-Clock power prices, 2011-2020($/MWh – real 2015USD)
Annual Monthly
0
10
20
30
40
50
60
70
80
90
100
2011 2013 2015 2017 20190
10
20
30
40
50
60
70
80
90
100
2011201220132014201520162017201820192020
● ERCOT’s top-heavy price profile gives solar an on-peak realized price premium, rewarding summer daytime generation.
Source: BNEF, NREL PVWatts, Bloomberg Fair Value Curves Notes: Historic values are derived from hourly capacity factors for the city of Lubbock, TX. Future years maintain the historic monthly relationship between monthly realized price and ATC prices.
0
10
20
30
40
50
60
70
80
90
100
2011201220132014201520162017201820192020
Marketpower pricerange (on/offpeakspread)
Marketpower priceaverage(around-the-clock;ATC)
'Realized'power price
Unsubsidized TX solar LCOE: $66/MWh
Subsidized TX solar LCOE: $46/MWh

28
Hourly average ERCOT West Hub power prices and ERCOT wind capacity factors (average price over 2011-16)
Five-year average daily profile Five-year average daily profile by month$/MWh – real 2015USD $/MWh – real 2015USD Capacity factorCapacity factor
0%
10%
20%
30%
40%
50%
60%
70%
80%
90%
100%
0
10
20
30
40
50
60
70
80
90
100
1 3 5 7 9 11
13
15
17
19
21
23
Average daily profile (24 hours)
0%20%40%60%
050
100
J…F…M…A…M…J…J…A…S…O…N…D…
ERCOTWest HubDay-AheadATCpowerprices
ATCcapacityfactor
0%
10%
20%
30%
40%
50%
60%
70%
80%
90%
100%
0
10
20
30
40
50
60
70
80
90
100
Jan Feb Mar Apr May Jun Jul Aug Sep Oct Nov DecAverage daily profile (24 hours)
Source: BNEF, ERCOT, Bloomberg Fair Value Curves CFVL<GO>Notes: Capacity factors are at aggregated ISO level, averaged over 2 years. Actual output of a single project is likely more volatile.
● Over 75% of Texas wind capacity is located in the West, where production is heavily skewed to nighttime (off-peak) hours.

29
Hourly average ERCOT West Hub power prices and estimated West Texas “fixed-tilt” solar capacity factor (average hourly price 2011-16)
Five-year average daily profile Five-year average daily profile by month$/MWh – real 2015USD $/MWh – real 2015USD Capacity factor
Source: BNEF, NREL PVWatts, Bloomberg Fair Value Curves CFVL<GO>Note: The representative solar capacity factors shown correspond to a “fixed-tilt” project located in Lubbock, TX.
Capacity factor
0%
10%
20%
30%
40%
50%
60%
70%
80%
90%
100%
0
10
20
30
40
50
60
70
80
90
100
1 3 5 7 9 11
13
15
17
19
21
23
Average daily profile (24 hours)
0%
10%
20%
30%
40%
50%
60%
70%
80%
90%
100%
0
10
20
30
40
50
60
70
80
90
100
Jan Feb Mar Apr May Jun Jul Aug Sep Oct Nov DecAverage daily profile (24 hours)
0%20%40%60%80%
050
100
J…F…M…A…M…J…J…A…S…O…N…D…
ERCOTWest HubDay-AheadATCpowerprices
ATCcapacityfactor
● Compared with other TX hubs (next slides), West Texas solar power captures more of the sharp evening price spike in ERCOT.
● ERCOT daily prices are bi-modal in winter and evening-spiking in summer. Solar will partially capture the summer price spikes but few of the winter morning price spikes.
30
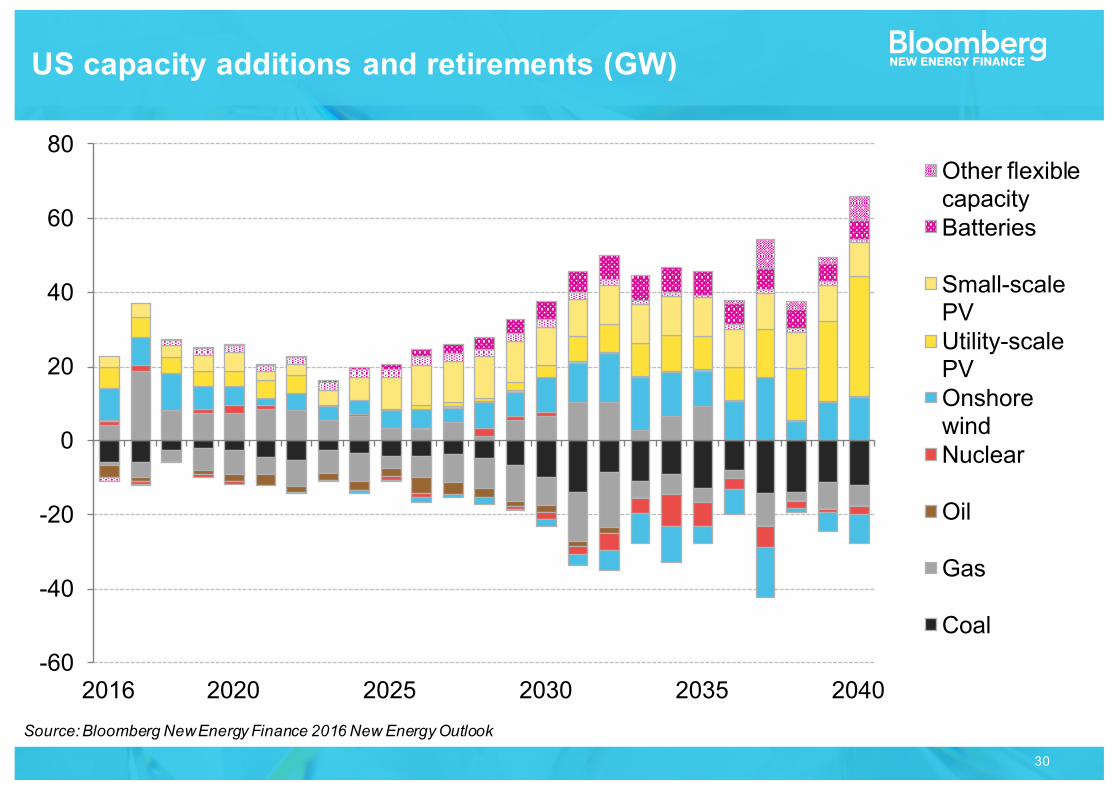
US capacity additions and retirements (GW)
Source: Bloomberg New Energy Finance 2016 New Energy Outlook
-60
-40
-20
0
20
40
60
80
2016 2020 2025 2030 2035 2040
0
10
20
30
40
50
60
70Other flexible capacityBatteries
Small-scale PVUtility-scale PVOnshore windNuclear
Oil
Gas
Coal

31
The system costs of adding variable renewable energy
1. Reduced utilization rate of existing asset base 2. Backup costs (capacity payments and resource adequacy)3. Ramping costs (losses in efficiency of operation of existing assets)4. Network costs5. Curtailment 6. Ancillary services
Many factors are very system-dependent and terribly difficult to quantify.
32
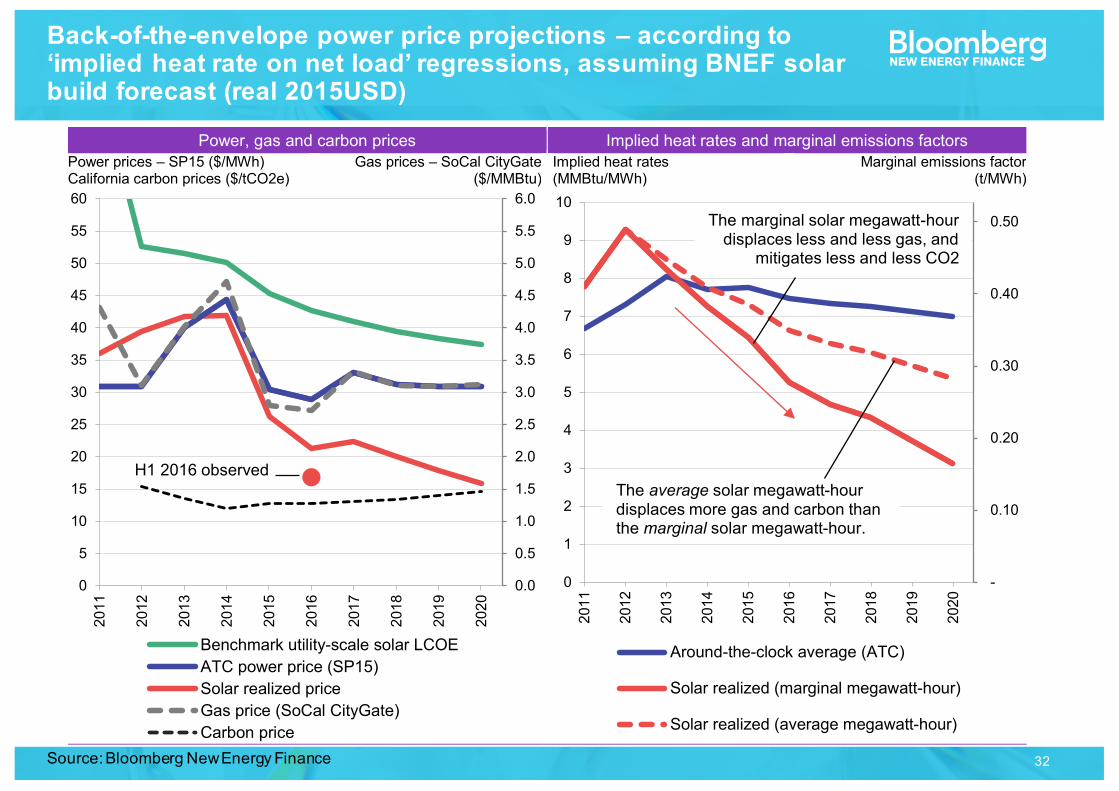
Back-of-the-envelope power price projections – according to ‘implied heat rate on net load’ regressions, assuming BNEF solar build forecast (real 2015USD)
Power, gas and carbon prices Implied heat rates and marginal emissions factors Power prices – SP15 ($/MWh) California carbon prices ($/tCO2e)
Gas prices – SoCal CityGate ($/MMBtu)
Implied heat rates (MMBtu/MWh)
Marginal emissions factor (t/MWh)
0.0
0.5
1.0
1.5
2.0
2.5
3.0
3.5
4.0
4.5
5.0
5.5
6.0
0
5
10
15
20
25
30
35
40
45
50
55
60
2011
2012
2013
2014
2015
2016
2017
2018
2019
2020
H1 2016 observed
-
0.10
0.20
0.30
0.40
0.50
0
1
2
3
4
5
6
7
8
9
10
2011
2012
2013
2014
2015
2016
2017
2018
2019
2020
The marginal solar megawatt-hour displaces less and less gas, and
mitigates less and less CO2
The average solar megawatt-hour displaces more gas and carbon than the marginal solar megawatt-hour.
0369121518
051015202530354045505560
2011
2012
2013
2014
2015
2016
2017
2018
2019
2020
Benchmark utility-scale solar LCOEATC power price (SP15)Solar realized priceGas price (SoCal CityGate)Carbon price
0369121518
051015202530354045505560
2011
2012
2013
2014
2015
2016
2017
2018
2019
2020
Around-the-clock average (ATC)
Solar realized (marginal megawatt-hour)
Solar realized (average megawatt-hour)
Source: Bloomberg New Energy Finance

33
Hourly solar production profile versus net load profile and implied heat rate profiles in California
0.00.51.01.52.02.53.03.54.04.55.05.56.0
2 4 6 8 10 12 14 16 18 20 22 24
Hours of the day
Thousands
2012
2013
2014
2015
H1 2016
02468
101214161820222426
2 4 6 8 10 12 14 16 18 20 22 24
Hours of the day
Thousands
Net load will rise in H2 2016 due to seasonal factors
0123456789
1011121314
2 4 6 8 10 12 14 16 18 20 22 24
Hours of the day
-
5
10
15
20
0
2
4
6
8
10
12
14
16
18
20
22
2 4 6 8 10 12 14 16 18 20 22 24
Hours of the day
Net load (GW)
Solar output (GW)
Implied heat rates (MMBtu/MWh)
02468101214161820222426
2 4 6 8 1 0 1 2 1 4 1 6 1 8 2 0 2 2 2 4
2012 2013 2014 2015 H1 2016
Average hourly utility-scale solar output on CAISO’s grid, by year (GW)
Average hourly net load on CAISO’s grid, by year (GW)
Average hourly real-time implied heat rates at SP15 hub (MMBtu/MWh)
Hourly solar production, net load and implied heat rates, H1 2016
Source: Bloomberg New Energy Finance, Bloomberg Terminal functions ISO<GO>, SPRK<GO>, CAISO daily renewable watch Notes: in Figures 26-28, the thinnest line represents 2012, with the thickest lines representing H1 2016 data; net load is defined as total load minus solar, wind, hydro and nuclear; implied heat rates are measured by dividing real-time SP15 power prices by SoCal CityGate gas (and adjusting for the price of California carbon allowances).
Source: Bloomberg New Energy Finance

34
Merit order effect: predicted reductions in West Hub on-peak power prices associated with BNEF’s solar build forecast, 2016-20
$/MWh – real 2015USD
● BNEF forecasts 4GW of utility scale solar by end of decade● Merit order effect will continue, threatening ERCOT’s historically
peaky day-time pricing
TX solar, May 2016 CDR, 2012-20
-$6.00
-$5.00
-$4.00
-$3.00
-$2.00
-$1.00
$0.00
1
2
3
4
5
6
2016 2017 2018 2019 2020
GWBNEF TX utility-scale solar forecast, 2016-20
$2.58/MWh power price impact associated with BNEF solar forecast
-$6.00$4.00102016 2017 2018 2019 2020
Cumulative capacity Annual Build Cumulative Price impact
GW
0
1
2
3
4
5
6
2012
2013
2014
2015
2016
2017
2018
2019
2020
South
West
Panhandle
● Utility-scale solar is making its debut in ERCOT.
● ERCOT CDR is planning for 2GW by decade end
Source: Bloomberg New Energy Finance
Source: Bloomberg New Energy Finance

35
Trends in US power and gas
● Factors pushing and pulling on wholesale power prices˗ Fuel prices˗ Renewable merit order effect˗ Slowing load growth
● Key trends in US power markets˗ Overcapacity and lingering coal plants - waiting for martyrs?˗ US gas: low-cost production and increasing exports˗ Operational changes for combined-cycle gas turbines˗ Renewables pipeline, system costs, realized prices and associated merit order effect
36
This publication is the copyright of Bloomberg New Energy Finance. No portion of this document may be photocopied, reproduced, scanned into an electronic system or transmitted, forwarded or distributed in any way without prior consent of Bloomberg New Energy Finance.The information contained in this publication is derived from carefully selected sources we believe are reasonable. We do not guarantee its accuracy or completeness and nothing in this document shall be construed to be a representation of such a guarantee. Any opinions expressed reflect the current judgment of the author of the relevant article or features, and does not necessarily reflect the opinion of Bloomberg New Energy Finance, Bloomberg Finance L.P., Bloomberg L.P. or any of their affiliates ("Bloomberg"). The opinions presented are subject to change without notice. Bloomberg accepts no responsibility for any liability arising from use of this document or its contents. Nothing herein shall constitute or be construed as an offering of financial instruments, or as investment advice or recommendations by Bloomberg of an investment strategy or whether or not to "buy," "sell" or "hold" an investment.
COPYRIGHT AND DISCLAIMER
Unique analysis, tools and data for decision-makers driving change in the energy system
MARKETS Renewable EnergyEnergy Smart TechnologiesAdvanced TransportGas Carbon and RECs
SERVICESAmericas ServiceAsia Pacific ServiceEMEA ServiceApplied Research Events and Workshops
Nicholas [email protected]