trends in worldwide internet retail 2016 - … · trends in worldwide internet retail 2016 ... by...
TRANSCRIPT
1
TRENDS IN WORLDWIDE INTERNET RETAIL 2016 PUBLICATION DATE: JULY 2016
PAGE 2 GENERAL INFORMATION I PAGE 3 KEY FINDINGS I PAGE 4 - 8 TABLE OF CONTENTS I PAGE 9 REPORT-SPECIFIC SAMPLE
CHARTS I PAGE 10 METHODOLOGY I PAGE 11 RELATED REPORTS I PAGE 12 CLIENTS I PAGE 13-14 FREQUENTLY ASKED QUESTIONS
PAGE 15 ORDER FORM I PAGE 16 TERMS AND CONDITIONS
2
2
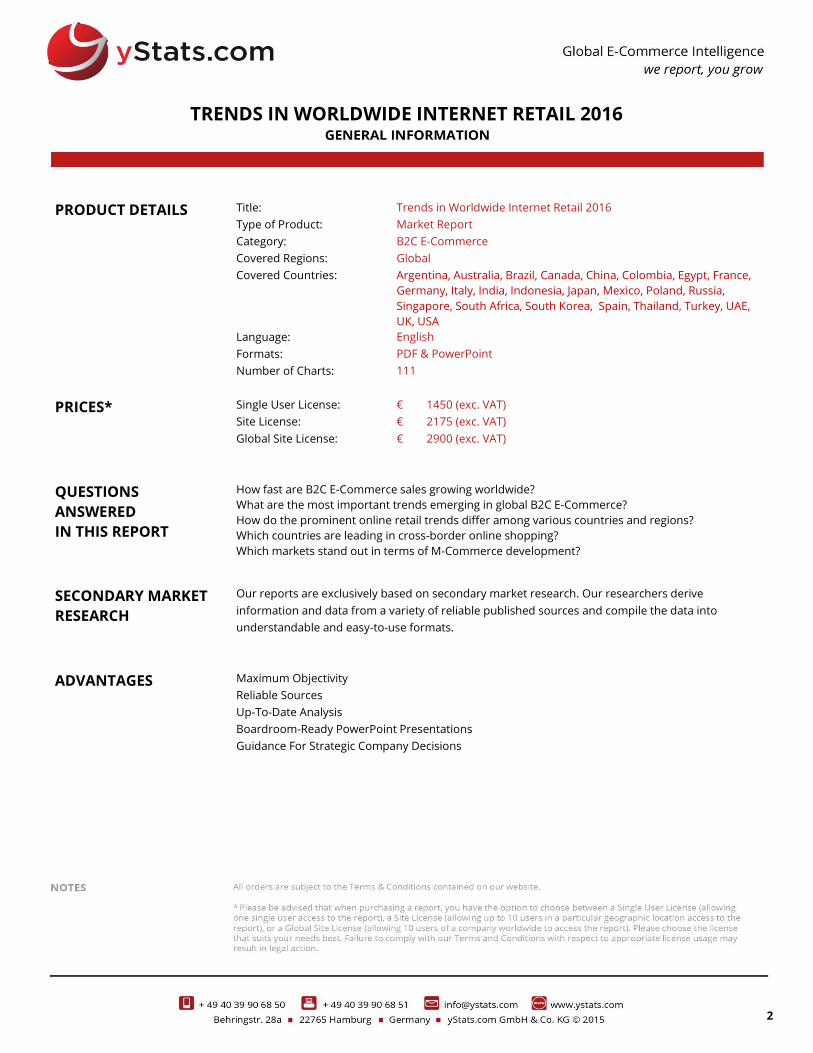
PRODUCT DETAILS Title:
Type of Product:
Category:
Covered Regions:
Covered Countries:
Language:
Formats:
Number of Charts:
Trends in Worldwide Internet Retail 2016
Market Report
B2C E-Commerce
Global
Argentina, Australia, Brazil, Canada, China, Colombia, Egypt, France,
Germany, Italy, India, Indonesia, Japan, Mexico, Poland, Russia,
Singapore, South Africa, South Korea, Spain, Thailand, Turkey, UAE,
UK, USA
English
PDF & PowerPoint
111
PRICES* Single User License:
Site License:
Global Site License:
€ 1450 (exc. VAT)
€ 2175 (exc. VAT)
€ 2900 (exc. VAT)
QUESTIONS
ANSWERED
IN THIS REPORT
How fast are B2C E-Commerce sales growing worldwide?
What are the most important trends emerging in global B2C E-Commerce?
How do the prominent online retail trends differ among various countries and regions?
Which countries are leading in cross-border online shopping?
Which markets stand out in terms of M-Commerce development?
SECONDARY MARKET
RESEARCH
Our reports are exclusively based on secondary market research. Our researchers derive
information and data from a variety of reliable published sources and compile the data into
understandable and easy-to-use formats.
ADVANTAGES Maximum Objectivity
Reliable Sources
Up-To-Date Analysis
Boardroom-Ready PowerPoint Presentations
Guidance For Strategic Company Decisions
TRENDS IN WORLDWIDE INTERNET RETAIL 2016

3
TOP TRENDS IN GLOBAL B2C E-COMMERCE REVEALED
As B2C E-Commerce continues to evolve around the world, several important market
trends have emerged. These are the result of the continuous market development,
technology advancement and growing interconnectedness of consumers worldwide.
Although global online shoppers differ in their preferences regarding which products to
purchase, and which delivery and payment methods to choose, some market trends are
shared by multiple emerging and advanced markets, as the new report by yStats.com
reveals.
The persistent rise of M-Commerce is one example of an overarching trend. A global
consumer survey cited in the yStats.com report revealed that nearly half of online shoppers
worldwide bought products via mobile platforms in 2015, a noticeable improvement on
2014. In the countries of East Asia the convenience of buying on-the-go drives M-Commerce
sales up, such as in South Korea where they reached a medium-high double-digit
percentage share of total online revenues. In Africa, mobile is the most common Internet
access type which likewise drives up mobile commerce on that continent. Furthermore, the
use of mobile devices serves as a link between the online and offline sales channels, leading
to the strengthening omnichannel trend.
Another prominent B2C E-Commerce trend in the increasingly interconnected world
is cross-border shopping via the Internet. Online customers no longer limit their choice of
online retailers to local websites and look at overseas offers in search for better prices and
product availability. Online shoppers in smaller markets, such as Ireland, Austria and
Singapore, were especially likely to buy from overseas retailers in late 2015, according to the
findings of the yStats.com report. Some of the large advanced online retail markets, Japan,
the USA and Germany among them, on the other hand, ranked among the countries with
the lowest cross-border online shopper penetration rates, but with double-digit shares
nonetheless. On the global scale, cross-border B2C E-Commerce sales are predicted to grow
rapidly through 2020.
TRENDS IN WORLDWIDE INTERNET RETAIL 2016
4
MANAGEMENT SUMMARY
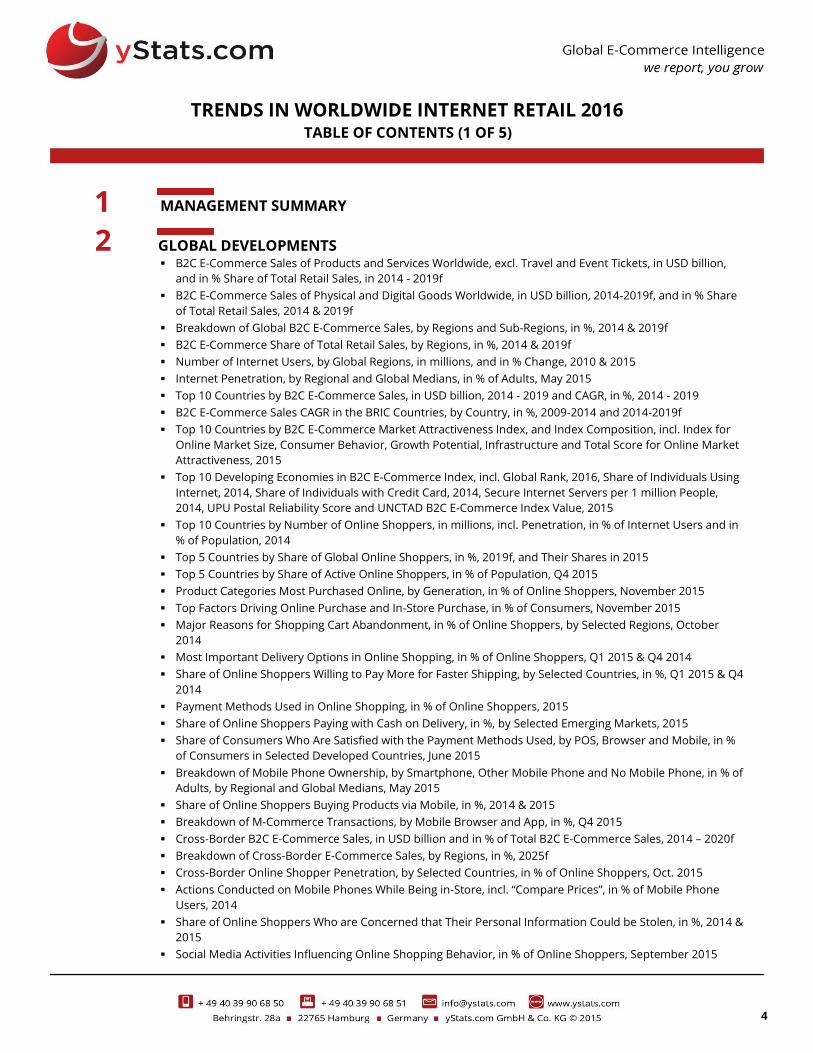
GLOBAL DEVELOPMENTS B2C E-Commerce Sales of Products and Services Worldwide, excl. Travel and Event Tickets, in USD billion,
and in % Share of Total Retail Sales, in 2014 - 2019f
B2C E-Commerce Sales of Physical and Digital Goods Worldwide, in USD billion, 2014-2019f, and in % Share
of Total Retail Sales, 2014 & 2019f
Breakdown of Global B2C E-Commerce Sales, by Regions and Sub-Regions, in %, 2014 & 2019f
B2C E-Commerce Share of Total Retail Sales, by Regions, in %, 2014 & 2019f
Number of Internet Users, by Global Regions, in millions, and in % Change, 2010 & 2015
Internet Penetration, by Regional and Global Medians, in % of Adults, May 2015
Top 10 Countries by B2C E-Commerce Sales, in USD billion, 2014 - 2019 and CAGR, in %, 2014 - 2019
B2C E-Commerce Sales CAGR in the BRIC Countries, by Country, in %, 2009-2014 and 2014-2019f
Top 10 Countries by B2C E-Commerce Market Attractiveness Index, and Index Composition, incl. Index for
Online Market Size, Consumer Behavior, Growth Potential, Infrastructure and Total Score for Online Market
Attractiveness, 2015
Top 10 Developing Economies in B2C E-Commerce Index, incl. Global Rank, 2016, Share of Individuals Using
Internet, 2014, Share of Individuals with Credit Card, 2014, Secure Internet Servers per 1 million People,
2014, UPU Postal Reliability Score and UNCTAD B2C E-Commerce Index Value, 2015
Top 10 Countries by Number of Online Shoppers, in millions, incl. Penetration, in % of Internet Users and in
% of Population, 2014
Top 5 Countries by Share of Global Online Shoppers, in %, 2019f, and Their Shares in 2015
Top 5 Countries by Share of Active Online Shoppers, in % of Population, Q4 2015
Product Categories Most Purchased Online, by Generation, in % of Online Shoppers, November 2015
Top Factors Driving Online Purchase and In-Store Purchase, in % of Consumers, November 2015
Major Reasons for Shopping Cart Abandonment, in % of Online Shoppers, by Selected Regions, October
2014
Most Important Delivery Options in Online Shopping, in % of Online Shoppers, Q1 2015 & Q4 2014
Share of Online Shoppers Willing to Pay More for Faster Shipping, by Selected Countries, in %, Q1 2015 & Q4
2014
Payment Methods Used in Online Shopping, in % of Online Shoppers, 2015
Share of Online Shoppers Paying with Cash on Delivery, in %, by Selected Emerging Markets, 2015
Share of Consumers Who Are Satisfied with the Payment Methods Used, by POS, Browser and Mobile, in %
of Consumers in Selected Developed Countries, June 2015
Breakdown of Mobile Phone Ownership, by Smartphone, Other Mobile Phone and No Mobile Phone, in % of
Adults, by Regional and Global Medians, May 2015
Share of Online Shoppers Buying Products via Mobile, in %, 2014 & 2015
Breakdown of M-Commerce Transactions, by Mobile Browser and App, in %, Q4 2015
Cross-Border B2C E-Commerce Sales, in USD billion and in % of Total B2C E-Commerce Sales, 2014 – 2020f
Breakdown of Cross-Border E-Commerce Sales, by Regions, in %, 2025f
Cross-Border Online Shopper Penetration, by Selected Countries, in % of Online Shoppers, Oct. 2015
Actions Conducted on Mobile Phones While Being in-Store, incl. “Compare Prices”, in % of Mobile Phone
Users, 2014
Share of Online Shoppers Who are Concerned that Their Personal Information Could be Stolen, in %, 2014 &
2015
Social Media Activities Influencing Online Shopping Behavior, in % of Online Shoppers, September 2015
TRENDS IN WORLDWIDE INTERNET RETAIL 2016
1
2
TABLE OF CONTENTS (1 OF 5)
5
5
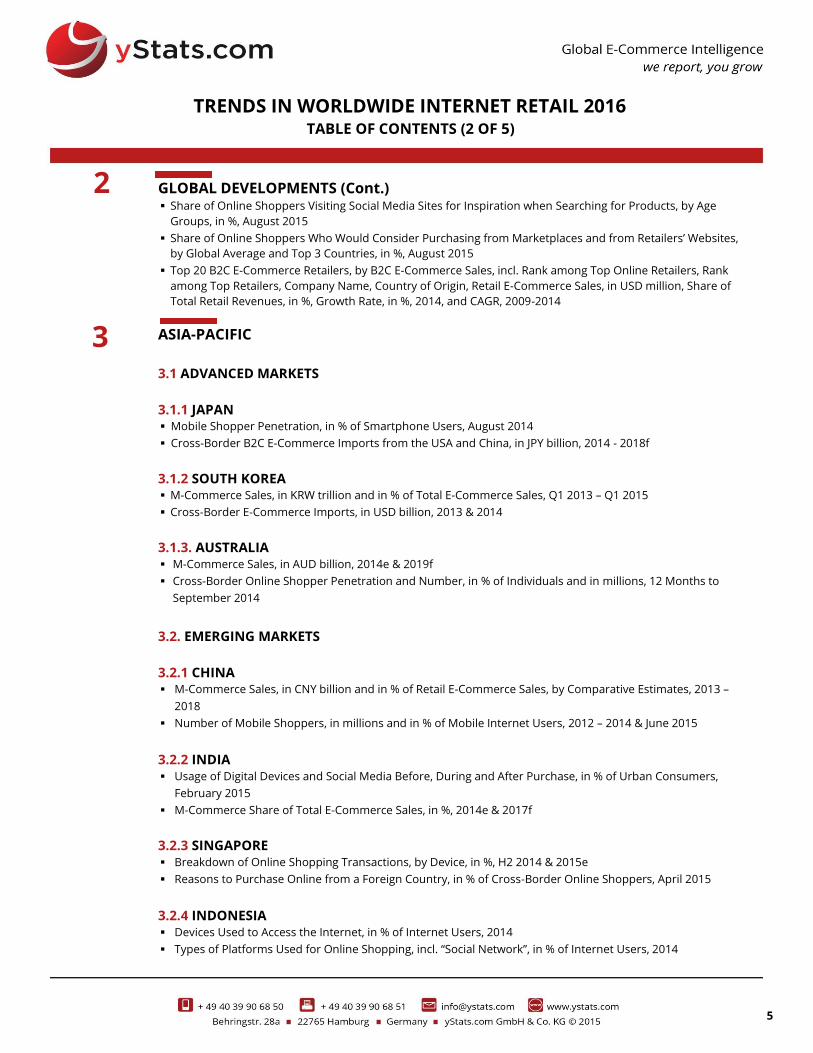
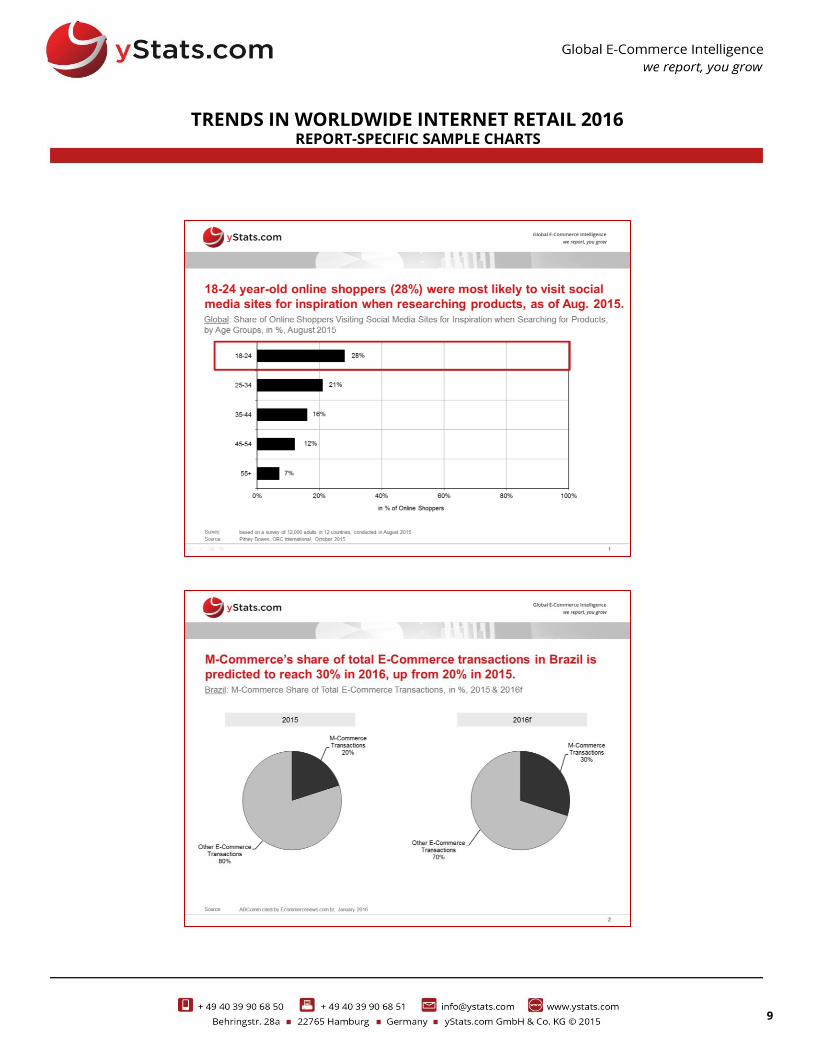
GLOBAL DEVELOPMENTS (Cont.) Share of Online Shoppers Visiting Social Media Sites for Inspiration when Searching for Products, by Age
Groups, in %, August 2015
Share of Online Shoppers Who Would Consider Purchasing from Marketplaces and from Retailers’ Websites,
by Global Average and Top 3 Countries, in %, August 2015
Top 20 B2C E-Commerce Retailers, by B2C E-Commerce Sales, incl. Rank among Top Online Retailers, Rank
among Top Retailers, Company Name, Country of Origin, Retail E-Commerce Sales, in USD million, Share of
Total Retail Revenues, in %, Growth Rate, in %, 2014, and CAGR, 2009-2014
ASIA-PACIFIC
3.1 ADVANCED MARKETS
3.1.1 JAPAN Mobile Shopper Penetration, in % of Smartphone Users, August 2014
Cross-Border B2C E-Commerce Imports from the USA and China, in JPY billion, 2014 - 2018f
3.1.2 SOUTH KOREA M-Commerce Sales, in KRW trillion and in % of Total E-Commerce Sales, Q1 2013 – Q1 2015
Cross-Border E-Commerce Imports, in USD billion, 2013 & 2014
3.1.3. AUSTRALIA M-Commerce Sales, in AUD billion, 2014e & 2019f
Cross-Border Online Shopper Penetration and Number, in % of Individuals and in millions, 12 Months to
September 2014
3.2. EMERGING MARKETS
3.2.1 CHINA M-Commerce Sales, in CNY billion and in % of Retail E-Commerce Sales, by Comparative Estimates, 2013 –
2018
Number of Mobile Shoppers, in millions and in % of Mobile Internet Users, 2012 – 2014 & June 2015
3.2.2 INDIA Usage of Digital Devices and Social Media Before, During and After Purchase, in % of Urban Consumers,
February 2015
M-Commerce Share of Total E-Commerce Sales, in %, 2014e & 2017f
3.2.3 SINGAPORE Breakdown of Online Shopping Transactions, by Device, in %, H2 2014 & 2015e
Reasons to Purchase Online from a Foreign Country, in % of Cross-Border Online Shoppers, April 2015
3.2.4 INDONESIA Devices Used to Access the Internet, in % of Internet Users, 2014
Types of Platforms Used for Online Shopping, incl. “Social Network”, in % of Internet Users, 2014
3
2
TRENDS IN WORLDWIDE INTERNET RETAIL 2016
TABLE OF CONTENTS (2 OF 5)
6
6
ASIA-PACIFIC (Cont.)
3.2. EMERGING MARKETS (Cont.)
3.2.5 THAILAND Mobile Shopping App Penetration, in % of Smartphone App Users, Q1 2014 & Q1 2015
Channels Used to Research Information about Products before Purchase, in % of Mobile Shoppers, January
2015
EUROPE
4.1 ADVANCED MARKETS
4.1.1 UK Usage of Click-and-Collect Services, in % of Online Shoppers, 2012 & 2015
M-Commerce Sales, by Device and Total, in GBP billion, in % Year-on-Year Change and in % Share of Total,
2014 – 2019f
4.1.2 GERMANY Breakdown of Frequency of Webrooming and Showrooming, in % of Online Shoppers, August 2015
Mobile Shopper Penetration, in % of Smartphone Users, by Age Group and Gender, 2013 - 2015
4.1.3 FRANCE M-Commerce Sales, in EUR billion, and in % Share of Total B2C E-Commerce Sales, 2015
Research and Purchase Methods, by Digitally and In-Store, in % of Online Shoppers, September 2015
4.1.4 SPAIN Value of E-Commerce Import Transactions, in EUR million, by Transactions with the EU, the USA, Latin
America, Asia-Pacific, CEMEA, Rest of the World and Total, 2009 - 2014 & H1 2015
Devices Used for Online Shopping, in % of Online Shoppers, 2014 & 2015
4.1.5 ITALY M-Commerce Share of Total E-Commerce Sales, in %, 2014 & 2017f
Cross-Border B2C E-Commerce Imports, in EUR billion, and in %Year-on-Year Change, 2012 – 2015e
4.2 EMERGING MARKETS
4.2.1 RUSSIA Smartphone User Penetration and Mobile Shopper Penetration, in % of Online Shoppers, by Age Group and
Total, October 2015
Cross-Border E-Commerce Statistics, incl. Number of Orders by Location and Platform, Number of Parcels
and Average Check, 2013 & 2014
3
TRENDS IN WORLDWIDE INTERNET RETAIL 2016
TABLE OF CONTENTS (3 OF 5)
4
7
7
EUROPE (Cont.)
4.2 EMERGING MARKETS (Cont.)
4.2.2 POLAND
M-Commerce Sales, in PLN billion, 2014 & 2015e
Cross-Border Online Shopper Penetration, in % of Online Shoppers, 2014
4.2.3 TURKEY
M-Commerce Share of Total B2C E-Commerce Sales, in %, Q1 2015
Product Categories Researched via Social Media Prior to Purchase, in % of Social Media Users, 2015
NORTH AMERICA
5.1. USA M-Commerce Sales, by Smartphones and Tablets, in USD billion, 2015f - 2020f
Research and Purchase Methods Used, in % of Online Shoppers, January 2015
5.2. CANADA M-Commerce Share of Total B2C E-Commerce Sales, in %, 2014 & 2019f
Breakdown of Online Spending, by Country of Origin of the Seller, in %, July 2014
LATIN AMERICA
6.1. BRAZIL M-Commerce Share of Total E-Commerce Transactions, in %, 2015 & 2016f
Share of Online Shoppers Purchasing via Mobile Devices, by Smartphone and Tablet, in % of Online
Shoppers Owing Smartphone or Tablet, October 2015
6.2. MEXICO Cross-Border Online Shopper Penetration, in % of Online Shoppers, October 2015
Shopping-Related Activities Carried Out on Mobile Devices, in % of Mobile Device Users, Q1 2015
6.3. ARGENTINA M-Commerce Share of Total E-Commerce Traffic, in %, 2015
Product Categories Purchased Cross-Border, in % of Cross-Border Online Shoppers, 2015e
6.4. COLOMBIA Devices Used to Access the Internet, in % of Internet Users, 2013 & 2014
Shopping-Related Activities Carried Out on Mobile Devices, in % of Smartphone Users, 2014
4
TRENDS IN WORLDWIDE INTERNET RETAIL 2016
TABLE OF CONTENTS (4 OF 5)
5
6

8
8
MIDDLE EAST & AFRICA
7.1. SOUTH AFRICA Shopping-Related Activities Carried out via Mobile Internet, in % of Mobile Internet Users, August 2015
Share of Online Shoppers Who Check a Retailer's Flyer Online to Ensure They Get the Best Deal Prior to
Purchasing, in %, October 2015
7.2. UAE M-Commerce Share of B2C E-Commerce Sales, in %, 2013 & 2015
Breakdown of the Last Online Purchase, by Website Type, in % of Online Shoppers, April 2015
7.3. SAUDI ARABIA Social Media Platforms Influencing Purchasing Decisions, in % of Consumers, 2015
Breakdown of Internet Traffic, by Device, in %, 2015
8.3. EGYPT Number of Internet Subscriptions by Type, in millions, February 2015 & February 2016
Mobile Share of Online Purchases, in %, 2015e
TRENDS IN WORLDWIDE INTERNET RETAIL 2016
TABLE OF CONTENTS (5 OF 5)
7
9
9
TRENDS IN WORLDWIDE INTERNET RETAIL 2016
REPORT-SPECIFIC SAMPLE CHARTS
10
GENERAL METHODOLOGY OF OUR MARKET REPORTS Secondary Market Research
The reports are compiled based on secondary market
research. Secondary research is information gathered from
previously published sources. Our reports are solely based on
information and data acquired from national and international
statistical offices, industry and trade associations, business reports,
business and company databases, journals, company registries, news
portals and many other reliable sources. By using various sources we
ensure maximum objectivity for all obtained data. As a result,
companies gain a precise and unbiased impression of the market
situation.
Cross referencing of data is conducted in order to ensure
validity and reliability.
The source of information and its release date are provided
on every chart. It is possible that the information contained in one
chart is derived from several sources. If this is the case, all sources
are mentioned on the chart.
The reports include mainly data from the last 12 months
prior to the date of report publication. Exact publication dates are
mentioned in every chart.
Definitions
The reports take into account a broad definition of B2C E-
Commerce, which might include mobile commerce. As definitions
may vary among sources, exact definition used by the source (if
available) is included at the bottom of the chart.
Chart Types
Our reports include text charts, pie charts, bar charts,
rankings, line graphs and tables. Every chart contains an Action Title,
which summarizes the main idea/finding of the chart and a Subtitle,
which provides necessary information about the country, the topic,
units or measures of currency, and the applicable time period(s) to
which the data refers. With respect to rankings, it is possible that the
summation of all categories amounts to more than 100%. In this case,
multiple answers were possible, which is noted at the bottom of the
chart.
Report Structure
Reports are comprised of the following elements, in the
following order: Cover page, preface, legal notice, methodology,
definitions, table of contents, management summary (summarizing
main information contained in each section of report) and report
content (divided into sections and chapters). When available, we also
include forecasts in our report content. These forecasts are not our
own; they are published by reliable sources. Within Global and
Regional reports, we include all major developed and emerging
markets, ranked in order of importance by using evaluative criteria
such as sales figures.
Notes and Currency Values
If available, additional information about the data collection,
for example the time of survey and number of people surveyed, is
provided in the form of a note. In some cases, the note (also) contains
additional information needed to fully understand the contents of the
respective data.
When providing information about amounts of money, local
currencies are most often used. When referencing currency values in
the Action Title, the EUR values are also provided in brackets. The
conversions are always made using the average currency exchange
rate for the respective time period. Should the currency figure be in
the future, the average exchange rate of the past 12 months is used.
METHODOLOGY OF OUR TRENDS IN WORLDWIDE INTERNET RETAIL 2016 REPORT Report Coverage
This report covers the B2C E-Commerce market, focusing
on important market trends, such as M-Commerce, cross-border
shopping, social commerce and omnichannel. All global regions are
covered in this report, including Asia-Pacific, Europe, North America,
Latin America, the Middle East and Africa.
Report Structure
The global chapter opens the report, including an overview
of global market developments, such as sales growth and forecasts,
player rankings, regional and country comparisons that concern
criteria related to B2C E-Commerce, such as B2C E-Commerce sales,
Internet and online shopper penetration. Major B2C E-Commerce
market trends on the global scale are presented.
The rest of the report is divided by regions. The regions are
presented in the order of descending B2C E-Commerce sales. Where
applicable, the countries in the regions are grouped by advanced and
emerging markets.
The countries are also presented in the order of descending
B2C E-Commerce sales. Where no comparable B2C E-Commerce sales
data was available, related criteria, such as online shopper
penetration, Internet penetration and population size were considered
to determine the ranking.
For each country, a selection of one or several important B2C
E-Commerce trends is included. The way the trends are presented
may vary by country. For example, the M-Commerce trend may be
represented by showing the growth of M-Commerce sales, mobile
share of total B2C E-Commerce sales or mobile shopper penetration
among online shoppers. Two charts are included for each country.
TRENDS IN WORLDWIDE INTERNET RETAIL 2016
11
UPCOMING RELATED REPORTS
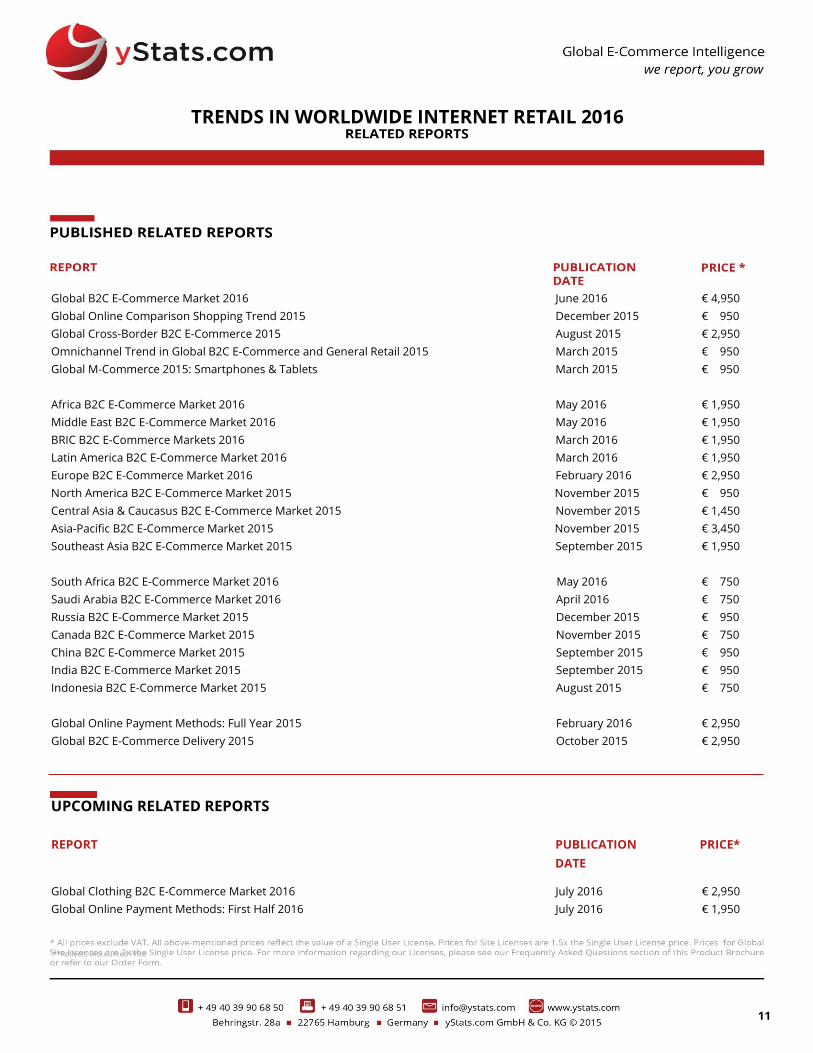
Global B2C E-Commerce Market 2016 June 2016 € 4,950
Global Online Comparison Shopping Trend 2015 December 2015 € 950
Global Cross-Border B2C E-Commerce 2015 August 2015 € 2,950
Omnichannel Trend in Global B2C E-Commerce and General Retail 2015 March 2015 € 950
Global M-Commerce 2015: Smartphones & Tablets March 2015 € 950
Africa B2C E-Commerce Market 2016 May 2016 € 1,950
Middle East B2C E-Commerce Market 2016 May 2016 € 1,950
BRIC B2C E-Commerce Markets 2016 March 2016 € 1,950
Latin America B2C E-Commerce Market 2016 March 2016 € 1,950
Europe B2C E-Commerce Market 2016 February 2016 € 2,950
North America B2C E-Commerce Market 2015 November 2015 € 950
Central Asia & Caucasus B2C E-Commerce Market 2015 November 2015 € 1,450
Asia-Pacific B2C E-Commerce Market 2015 November 2015 € 3,450
Southeast Asia B2C E-Commerce Market 2015 September 2015 € 1,950
South Africa B2C E-Commerce Market 2016 May 2016 € 750
Saudi Arabia B2C E-Commerce Market 2016 April 2016 € 750
Russia B2C E-Commerce Market 2015 December 2015 € 950
Canada B2C E-Commerce Market 2015 November 2015 € 750
China B2C E-Commerce Market 2015 September 2015 € 950
India B2C E-Commerce Market 2015 September 2015 € 950
Indonesia B2C E-Commerce Market 2015 August 2015 € 750
Global Online Payment Methods: Full Year 2015 February 2016 € 2,950
Global B2C E-Commerce Delivery 2015 October 2015 € 2,950
REPORT
PUBLICATION
DATE
PRICE*
Global Clothing B2C E-Commerce Market 2016
Global Online Payment Methods: First Half 2016
July 2016
July 2016
€ 2,950
€ 1,950
TRENDS IN WORLDWIDE INTERNET RETAIL 2016
**Reflects Discounted Price
12
13
14
15

16