tri-service site characterization and analysis … tr-01-9 june 2001 tri-service site...
TRANSCRIPT
ER
DC
/EL
TR
-01-
9E
nvi
ron
men
tal L
abo
rato
ry
Tri-Service Site Characterization andAnalysis Penetrometer System (SCAPS)Validation of the Hydrosparge VolatileOrganic Compound SensorWilliam M. Davis, Karen F. Myers, Mark B. Wise, andCyril V. Thompson
Approved for public release; distribution is unlimited.
June 2001
The contents of this report are not to be used for advertising,publication, or promotional purposes. Citation of trade namesdoes not constitute an official endorsement or approval of the useof such commercial products.
The findings of this report are not to be construed as anofficial Department of the Army position, unless so desig-nated by other authorized documents.
PRINTED ON RECYCLED PAPER

ERDC/EL TR-01-9June 2001
Tri-Service Site Characterization andAnalysis Penetrometer System (SCAPS)Validation of the Hydrosparge VolatileOrganic Compound Sensor
by William M. Davis, Karen F. Myers
Environmental LaboratoryU.S. Army Engineer Research and Development Center3909 Halls Ferry RoadVicksburg, MS 39180-6199
Mark B. Wise, Cyril V. Thompson
Oak Ridge National LaboratoryOak Ridge, TN 37831-6037
Final report
Approved for public release; distribution is unlimited
Prepared for Environmental Security Technology Certification ProgramU.S. Army Engineer Research and Development Center3909 Halls Ferry RoadVicksburg, MS 39180-6199

iii
Contents
Preface . . . . . . . . . . . . . . . . . . . . . . . . . . . . . . . . . . . . . . . . . . . . . . . . . . . . . . . . vi
Abbreviations and Acronyms . . . . . . . . . . . . . . . . . . . . . . . . . . . . . . . . . . . . . . vii
1—Introduction . . . . . . . . . . . . . . . . . . . . . . . . . . . . . . . . . . . . . . . . . . . . . . . . . . 1
Background Information . . . . . . . . . . . . . . . . . . . . . . . . . . . . . . . . . . . . . . . . . 1Official DoD Requirement Statement . . . . . . . . . . . . . . . . . . . . . . . . . . . . . . 2Objectives of Demonstration . . . . . . . . . . . . . . . . . . . . . . . . . . . . . . . . . . . . . 2Regulatory Issues . . . . . . . . . . . . . . . . . . . . . . . . . . . . . . . . . . . . . . . . . . . . . . 3Previous Testing of the Technology . . . . . . . . . . . . . . . . . . . . . . . . . . . . . . . . 3
2—Technology Description . . . . . . . . . . . . . . . . . . . . . . . . . . . . . . . . . . . . . . . . . 4
Description . . . . . . . . . . . . . . . . . . . . . . . . . . . . . . . . . . . . . . . . . . . . . . . . . . . 4Cone penetrometer platform . . . . . . . . . . . . . . . . . . . . . . . . . . . . . . . . . . . 4Hydrosparge VOC sensing system . . . . . . . . . . . . . . . . . . . . . . . . . . . . . . 5
Strengths, Advantages, and Weaknesses . . . . . . . . . . . . . . . . . . . . . . . . . . . . 7Strengths of Hydrosparge VOC sensor . . . . . . . . . . . . . . . . . . . . . . . . . . . 7Advantages of the technology . . . . . . . . . . . . . . . . . . . . . . . . . . . . . . . . . . 7Limitation of Hydrosparge VOC sensor . . . . . . . . . . . . . . . . . . . . . . . . . . 8 Truck-mounted cone penetrometer access limits . . . . . . . . . . . . . . . . . . 8 Cone penetrometer advancement limits . . . . . . . . . . . . . . . . . . . . . . . . . 8 Direct push miniwell groundwater sampling limits . . . . . . . . . . . . . . . . 8 Extremely high level contamination carryover . . . . . . . . . . . . . . . . . . . 8 DSITMS limitations . . . . . . . . . . . . . . . . . . . . . . . . . . . . . . . . . . . . . . . . 9
Factors Influencing Cost and Performance . . . . . . . . . . . . . . . . . . . . . . . . . . . 9
3—Site Descriptions . . . . . . . . . . . . . . . . . . . . . . . . . . . . . . . . . . . . . . . . . . . . . 11
Site Selection Criteria . . . . . . . . . . . . . . . . . . . . . . . . . . . . . . . . . . . . . . . . . . 11Bush River study area, Aberdeen Proving Ground site history . . . . . . . . 12Davis Global Communication site history . . . . . . . . . . . . . . . . . . . . . . . 13Fort Dix site history . . . . . . . . . . . . . . . . . . . . . . . . . . . . . . . . . . . . . . . . . 15
Site Characteristics . . . . . . . . . . . . . . . . . . . . . . . . . . . . . . . . . . . . . . . . . . . . 16Site characteristics, Bush River study area, Aberdeen Proving Ground, MD . . . . . . . . . . . . . . . . . . . . . . . . . . . . . . 16Site characteristics, Davis Global Communications site, CA . . . . . . . . . 17Site characteristics, Fort Dix, NJ . . . . . . . . . . . . . . . . . . . . . . . . . . . . . . . 18
iv
4—Demonstration Approach . . . . . . . . . . . . . . . . . . . . . . . . . . . . . . . . . . . . . . . 20
Sampling Procedures . . . . . . . . . . . . . . . . . . . . . . . . . . . . . . . . . . . . . . . . . . 20SCAPS Hydrosparge VOC sensor sampling locations . . . . . . . . . . . . . . 20Analytical procedures . . . . . . . . . . . . . . . . . . . . . . . . . . . . . . . . . . . . . . . 21Hydrosparge analytical procedures . . . . . . . . . . . . . . . . . . . . . . . . . . . . . 22 Direct sampling ion trap mass spectrometer operation . . . . . . . . . . . . 22 In situ sparge module operation . . . . . . . . . . . . . . . . . . . . . . . . . . . . . . 22Verification sample analytical procedures . . . . . . . . . . . . . . . . . . . . . . . 24
Performance Objectives . . . . . . . . . . . . . . . . . . . . . . . . . . . . . . . . . . . . . . . . 24 SCAPS VOC technologies comparison to conventional methods . . . . . 24Economic considerations. . . . . . . . . . . . . . . . . . . . . . . . . . . . . . . . . . . . . 25Data quality. . . . . . . . . . . . . . . . . . . . . . . . . . . . . . . . . . . . . . . . . . . . . . . 25Range of usefulness . . . . . . . . . . . . . . . . . . . . . . . . . . . . . . . . . . . . . . . . . 26
Technical Performance Criteria . . . . . . . . . . . . . . . . . . . . . . . . . . . . . . . . . . 26Contaminants . . . . . . . . . . . . . . . . . . . . . . . . . . . . . . . . . . . . . . . . . . . . . . 26Process waste. . . . . . . . . . . . . . . . . . . . . . . . . . . . . . . . . . . . . . . . . . . . . . 26Reliability . . . . . . . . . . . . . . . . . . . . . . . . . . . . . . . . . . . . . . . . . . . . . . . . 27 Direct push miniwell . . . . . . . . . . . . . . . . . . . . . . . . . . . . . . . . . . . . . . 27 In situ sparge module . . . . . . . . . . . . . . . . . . . . . . . . . . . . . . . . . . . . . . 27 Direct sampling ion trap mass spectrometer . . . . . . . . . . . . . . . . . . . . 27Ease of use . . . . . . . . . . . . . . . . . . . . . . . . . . . . . . . . . . . . . . . . . . . . . . . . 27Versatility . . . . . . . . . . . . . . . . . . . . . . . . . . . . . . . . . . . . . . . . . . . . . . . . 28Off-the-shelf procurement . . . . . . . . . . . . . . . . . . . . . . . . . . . . . . . . . . . . 28Maintenance . . . . . . . . . . . . . . . . . . . . . . . . . . . . . . . . . . . . . . . . . . . . . . 28
5—Hydrosparge VOC Sensor Performance Assessment . . . . . . . . . . . . . . . . . 29
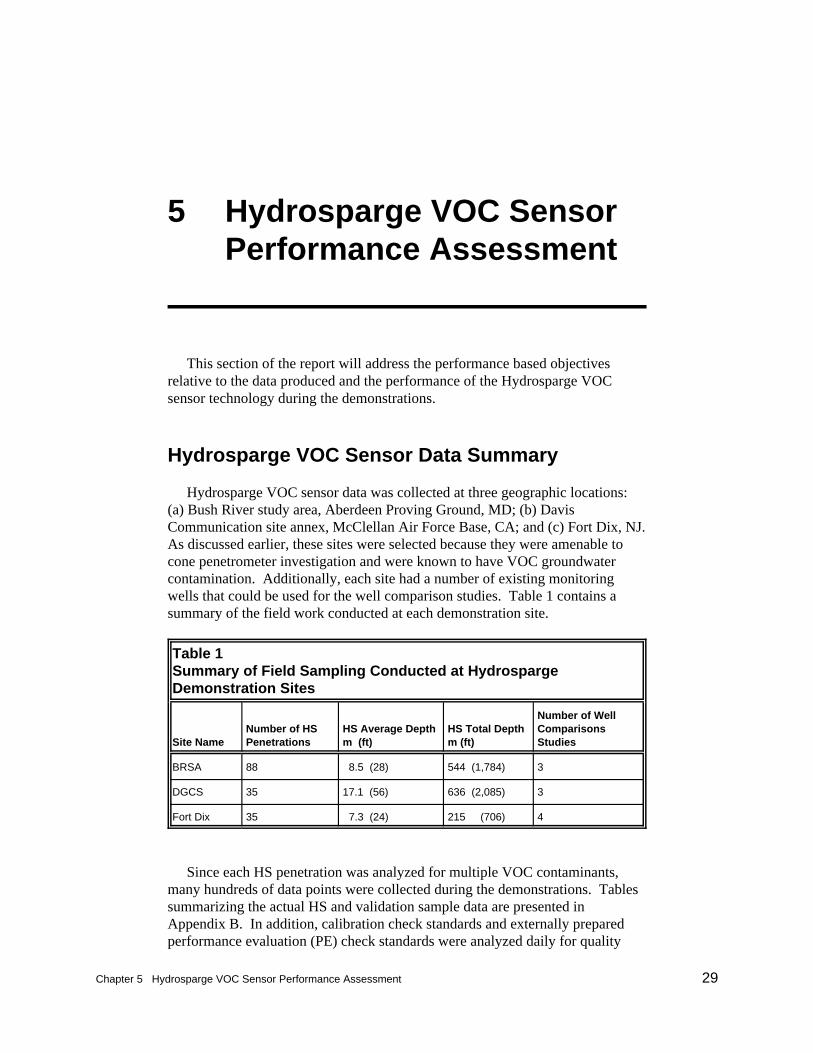
Hydrosparge VOC Sensor Data Summary . . . . . . . . . . . . . . . . . . . . . . . . . . 29Sample matrix effects on HS VOC sensor . . . . . . . . . . . . . . . . . . . . . . . 30Data validation for Bush River study area, Aberdeen Proving Ground . 30Well comparison study at Davis Global Communication site . . . . . . . . . 31Hydrosparge data collected at Fort Dix . . . . . . . . . . . . . . . . . . . . . . . . . . 31
Hydrosparge VOC Sensor Data Assessment . . . . . . . . . . . . . . . . . . . . . . . . 32Comparison of HS VOC Sensor with Conventional Technology . . . . . . . . 33
Comparison between HS VOC sensor and EPA Method 8260A . . . . . . 33Comparison of HS VOC sensor with conventional monitoring wells . . 35
6—Cost Assessment . . . . . . . . . . . . . . . . . . . . . . . . . . . . . . . . . . . . . . . . . . . . . 38
HS VOC Sensor Cost Performance . . . . . . . . . . . . . . . . . . . . . . . . . . . . . . . 38Cost Comparison of HS VOC Sensor to Conventional and Other Technologies . . . . . . . . . . . . . . . . . . . . . . . . . . . . . . . . . . . . . . . 39
7—Status of Regulatory Acceptance . . . . . . . . . . . . . . . . . . . . . . . . . . . . . . . . . 41
8—Technology Implementation . . . . . . . . . . . . . . . . . . . . . . . . . . . . . . . . . . . . 43
DoD Requirements for VOC Site Characterization . . . . . . . . . . . . . . . . . . . 43Hydrosparge VOC Sensor Transition . . . . . . . . . . . . . . . . . . . . . . . . . . . . . . 43
9—Lessons Learned . . . . . . . . . . . . . . . . . . . . . . . . . . . . . . . . . . . . . . . . . . . . . 45
References . . . . . . . . . . . . . . . . . . . . . . . . . . . . . . . . . . . . . . . . . . . . . . . . . . . . . 46
v
Appendix A: Points of Contact . . . . . . . . . . . . . . . . . . . . . . . . . . . . . . . . . . . . A1
Appendix B: HS Site Data Summary Tables . . . . . . . . . . . . . . . . . . . . . . . . . B1
SF 298
List of Figures
Figure 1. Schematic diagram of SCAPS Hydrosparge sensing system . . . . . 6
Figure 2. Site map for Bush River study area SCAPS Hydrosparge investigation . . . . . . . . . . . . . . . . . . . . . . . . . . . . . . . 12
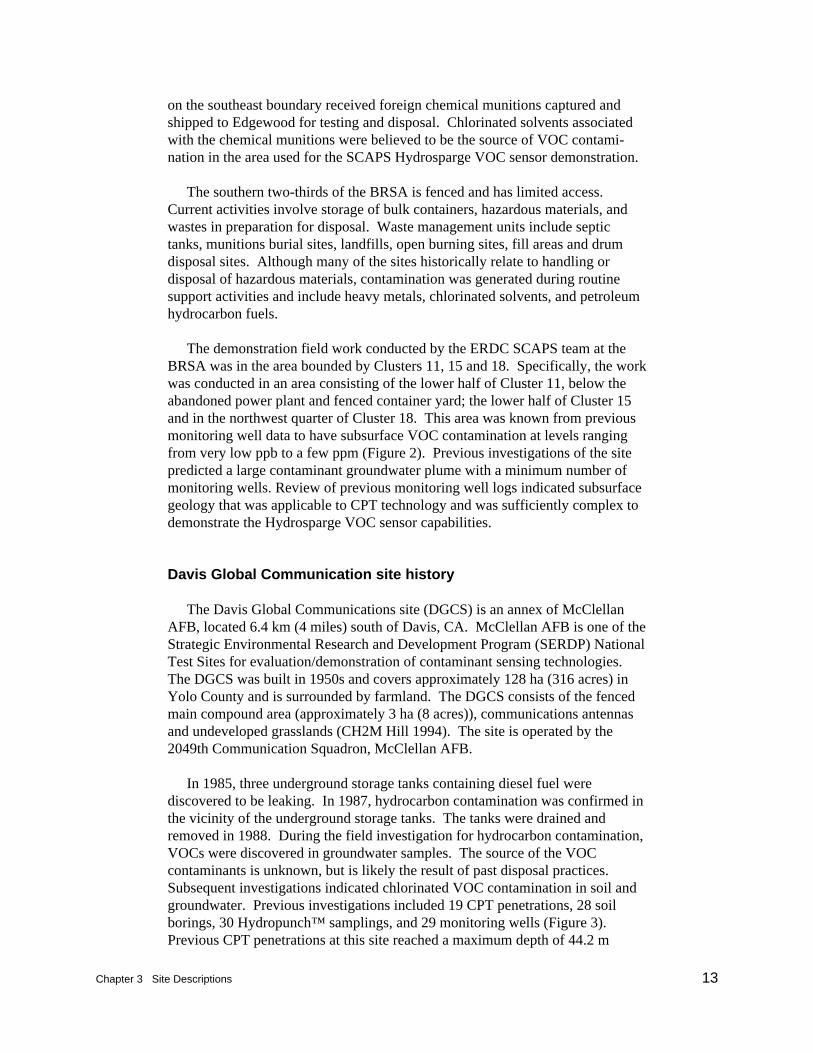
Figure 3. Site map for Davis Global Communication site Hydrosparge investigation . . . . . . . . . . . . . . . . . . . . . . . . . . . . . . . 14
Figure 4. Location of SCAPS Hydrosparge site, Fort Dix, NG . . . . . . . . . . 15
Figure 5. Real-time data output from Hydrosparge VOC sensor illustrating the qualitative identification of analytes based on mass spectra . . . . . . . . . . . . . . . . . . . . . . . . . . . . . . . . . . . . . . . 23
Figure 6. Comparison of PowerPunch direct push well with conventional monitoring well at Davis Communication site . . . . 32
Figure 7. Comparison of HS VOC sensor results with validation sample analyses by EPA Method 8260A for Bush River study area, Aberdeen Proving Ground, MD . . . . . . . . . . . . . . . . . 34
Figure 8. Comparison of HS VOC sensor results with validation sample analyses by EPA Method 8260A for Davis Global Communications site . . . . . . . . . . . . . . . . . . . . . . . . . . . . . 35
Figure 9. Comparison of HS VOC sensor results with validation sample analyses by EPA Method 8260A for Fort Dix, NJ . . . . . . 36
Figure 10. Results of well comparison investigation between conventional monitoring wells and Hydrosparge direct push wells . . . . . . . . . . . . . . . . . . . . . . . . . . . . . . . . . . . . . . . . . . . 37
List of Tables
Table 1. Summary of Field Sampling Conducted at Hydrosparge Demonstration Sites . . . . . . . . . . . . . . . . . . . . . . . 29
Table 2. Comparison of Unit Costs for the HS VOC Sensor and Conventional Technologies . . . . . . . . . . . . . . . . . . . . . . . . . . 40
Table B1. Bush River Study Area . . . . . . . . . . . . . . . . . . . . . . . . . . . . . . . . B2
Table B2. Davis Global Communication Site . . . . . . . . . . . . . . . . . . . . . . . B3
Table B3. Fort Dix . . . . . . . . . . . . . . . . . . . . . . . . . . . . . . . . . . . . . . . . . . . . B5
vi
Preface
The work reported herein was funded by the Environmental SecurityTechnology Certification Program (ESTCP). Mr. George Robataille was thetechnical monitor for the U.S. Army Environmental Center and Dr. M. JohnCullinane served as Program Manager (PM), Environmental RestorationResearch Program (EM-J), U.S. Army Engineer Research and DevelopmentCenter (ERDC).
Personnel who cooperated in the execution of the study and the preparation ofthis report included Dr. William M. Davis, Environmental Processes and EffectsBranch (EP-P), Environmental Processes and Engineering Division (EP),Environmental Laboratory (EL), ERDC; Ms. Karen F. Myers, Environmentaland Molecular Chemistry Branch (EP-C), Environmental Engineering Division(EED), EL, ERDC; Dr. Mark B. Wise, Oak Ridge National Laboratory; and Mr.Cyril V. Thompson, Oak Ridge National Laboratory. The authors also wish toacknowledge Mr. John S. Furey, DynTel Corporation; Mr. Jeff F. Powell andMr. Dan Y. Eng, Information Technology Laboratory (ITL), and Mr. Karl F.Konecny, EL, for technical support. Dr. Jane W. Adams, U.S. Army ResearchLaboratory, and Ms. Cynthia B. Price, EL, reviewed the report.
This report was prepared under the general supervision of Dr. Richard E.Price, Chief, EP; Ms. Denise McMillian, Chief, EP-C; Dr. John Keeley, ActingDirector, EL; Dr. Charles Robert Welch, Chief, Instrumentation SystemsDevelopment Division (ISDD, ITL); and Mr. Timothy D. Ables, Acting Director,ITL.
At the time of publication of this report, Dr. James R. Houston was Directorof ERDC, and Mr. Armando J. Roberto, Jr., was Acting Commander.
The contents of this report are not to be used for advertising, publication, orpromotional purposes. Citation of trade names does not constitute anofficial endorsement or approval of the use of such commercial products.
vii
Abbreviations and Acronyms
Fm Micrometer
Fg/kg Microgram per Kilogram
Fg/g Microgram per Gram
Fg/L Microgram per Liter
AEC U.S. Army Environmental Center
AFB Air Force Base
AOC Areas of Concern
AMCCOM U.S. Army Armament, Munitions, And Chemical Command
ASTM American Society for Testing and Materials
BETX Benzene, ethylbenzene, toluene, xylene
BGS Below Ground Surface
BRSA Bush River Study Area, U.S. Army Aberdeen ProvingGround
oC Degree(s) Celsius
Cal EPA-DTSC California Environmental Protection Agency, Department ofToxic Substance Control
CI Chemical impact ionization
cm Centimeter
CPT Cone Penetrometer Test
viii
CRREL U.S. Army Corps of Engineers Cold Regions Research andEngineering Laboratory
CSCT Consortium for site characterization technology
DCE Dichloroethene
DGCS Davis Global Communications site, McClellan Air ForceBase
DoD Department of Defense
DQO Data quality objective
DSITMS Direct sampling ion trap mass spectrometer
ECB Environmental Chemistry Branch
EI Electron impact ionization
EPA U.S. Environmental Protection Agency
EQT Environmental quality technology
ERDC Engineer Research and Development Center
ft Feet
ft2 Square feet
ft3 Cubic feet
g Gram
GC Gas chromatograph
GC/FID Gas chromatograph/flame ionization detector
GC/MS Gas chromatograph/mass spectrometer
ha Hectare
HS/GC Head space/gas chromatograph
ITMS Ion trap mass spectrometer
ITRC Interstate Technology Regulatory Cooperation
ix
km Kilometer
LAP Load and pack
LCAAP Lake City Army Ammunition Plant
LHAAP Longhorn Army Ammunition Plant
LIF Laser induced fluorescence
L Liter
m Slope of a regression line
MDL Method detection limit
MeOH Methanol
mg/kg Milligrams per kilogram
mg/L Milligrams per liter
ml Milliliter
ml/min Milliliters per minute
mm Millimeter
MT Metric ton
m/z Mass to charge ratio of an ion
ng/g Nanagram per gram
ORNL Oak Ridge National Laboratory
OSHW EPA Office of Solid and Hazardous Waste
PCE Tetrachloroethene
PE Performance evaluation
ppb Parts per billion; equivalent to ng/g, Fg/kg and Fg/L
ppm Parts per million; equivalent to Fg/g, mg/kg and mg/L
QA Quality assurance
QAPP Quality Assurance Project Plan
x
QC Quality control
r2 Correlation coefficient
SCAPS Site Characterization and Analysis Penetrometer System
SCN Soil class number
SWMU Solid waste management units
SERDP Strategic Environmental Research and DevelopmentProgram
SOP Standard operating procedure
TCE Trichloroethene
TDS Thermal Desorption VOC sampler
TIC Total ion chromatogram
TRP Technology Reinvestment Program
U.S. United States
USACE United States Army Corps of Engineers
VOC Volatile organic compound
Chapter 1 Introduction 1
1 Introduction
Background Information
Chlorinated solvents and fuel related volatile organic compounds (VOC)-contaminated groundwater have caused substantial problems at many sitesincluding Department of Defense (DoD) installations. Site characterization ofsuch contaminated sites currently requires time-consuming and costly methods tolocate and delineate subsurface groundwater contamination. Traditional sitecharacterization techniques for these analytes include drilling monitoring wells,water sampling and laboratory analyses. Because placement of monitoring wellson a given site is often based on limited geological information, many wells areplaced at locations that contribute little to the site investigation. Laboratoryanalysis of the groundwater samples obtained from the monitoring wells areoften not available for weeks or months. Currently there is no rapid, on-sitemethod to investigate the extent of groundwater and soil contamination for VOC.
To address these problems, the Tri-Services (U.S. Army, U.S. Navy, andU.S. Air Force) have cooperated in the development and field demonstration ofthe Site Characterization and Analysis Penetrometer System (SCAPS)contaminant sensor and hybrid sensor/sampler technologies. The SCAPSconsists of a hydraulically-operated cone penetrometer test unit mounted in acustom-engineered 18.2 MT (20-ton) truck with onboard computers that providereal-time data acquisition/processing of co-registered geophysical andcontaminant sensor data. The truck is capable of pushing instrumented cones todepths greater than 50 m providing a variety of data and services, including: subsurface soil stratigraphy, depth to groundwater, recovery of soil and watersamples, and in situ measurement of specific contaminants. The SCAPS has alsobeen designed to accommodate sensors and samplers for use in collecting dataon specific classes of subsurface contaminants.
Through funding from the U.S. Army Environmental Center (AEC), a devicewas designed by the Oak Ridge National Laboratories (ORNL) to purge VOCsfrom direct push wells and to transport the purged analytes to a field-portabledirect sampling ion trap mass spectrometer (DSITMS). The DSITMS is capableof both identifying and quantifying VOC contaminants purged in situ fromgroundwater (Wise and Guerin 1997; Wise et al. 1997). The Hydrosparge VOCsensor (HS) concept was developed by the U.S. Army Engineer Research and

2Chapter 1 Introduction
Development Center (ERDC) and involved the deployment of ORNL-developedVOC direct sparge technology in commercially available 5-cm (2-in.) diametermini-well water samplers used by SCAPS. The HS was evaluated in fieldverification demonstrations and shown to provide information equivalent totaking well water samples and analyzing them in the laboratory (Davis et al.1997; Davis et al. 1998a). The HS system provides onsite analysis for VOCswithout actually removing water from the direct push well.
The Hydrosparge VOC sensor is used to provide on-site, near real-time data,to assist site managers in selecting sampling locations. Initial HS samplinglocations are selected based on historical knowledge of potential contaminantsources and site hydrogeology. Additional geologic, hydrologic and contaminantdata are collected during subsequent SCAPS stratigraphic and HS penetrations. Using the SCAPS Hydrosparge VOC sensor, a groundwater contaminant plumecan be rapidly delineated by iteratively locating HS penetrations based on dataproduced on-site in near real-time. Substantial time and cost-savings are realizeddue to the reduced number of conventional monitoring wells that can be locatedbased on the HS data. Cost savings are also realized due to the reduction ininvestigation derived waste produced by direct push techniques compared toconventional drilling and sampling techniques.
Official DoD Requirement Statement
DoD has a critical need to demonstrate advanced rapid cost effectivetechnologies to characterize soil and groundwater contaminated by volatileorganic compounds. The successful completion of this project will provide theDoD with demonstrated capabilities for characterizing VOCs in groundwater atcontaminated sites.
Objectives of Demonstration
The purpose of the SCAPS Hydrosparge VOC sensor demonstration was togenerate field data appropriate for verifying the performance of the technology,and thereby facilitate the technology's acceptance and use by regulatory and usercommunities for field screening of VOCs in the saturated subsurface. To obtainsufficient data to verify the performance of SCAPS Hydrosparge sensor for fieldscreening of VOCs in the subsurface, both primary and secondary demonstrationobjectives were identified.
The primary objectives of this demonstration were to evaluate the SCAPStechnology in the following areas: (a) performance compared to conventionalsampling and analytical methods, i.e., correlation with data collected fromconventional monitoring wells and sample analysis by U.S. EnvironmentalProtection Agency (U.S. EPA) Method 8260A; (b) the logistical and economicresources necessary to operate the technologies; (c) data quality; and (d) therange of environments in which the technology can be operated. Secondary
Chapter 1 Introduction 3
objectives for this demonstration were to evaluate the SCAPS VOC technologyfor reliability, ruggedness, and ease of operation.
Regulatory Issues
A major obstacle to implementation of innovative site characterizationtechniques on DoD sites is acceptance of new technologies by both Federal andState regulatory agencies. The Tri-Service SCAPS program has experience withpursuit of regulator acceptance (e.g., regulatory acceptance of the Laser InducedFluorescence (LIF) petroleum, oil and lubricant sensor). The significant lessonlearned during the LIF sensor regulatory acceptance experience was that there isno clear path to regulatory acceptance of innovative technology, either at theFederal or State agency levels. Therefore, the approach adopted during thisdemonstration project was to interact with State and Federal levelssimultaneously. Early in the project, the California Environmental ProtectionAgency (California EPA) and the Interstate Technology Regulatory Cooperation(ITRC) Workgroup, currently composed of 29 state regulatory agencies, wereapproached to evaluate the Hydrosparge VOC sensor for acceptance into theirrespective technology evaluation and certification programs. Concurrently, theU.S. EPA Office of Solid and Hazardous Waste (OSHW) reviewed a proposedVOC analytical method using the direct sampling ion trap mass spectrometer.This method included the Hydrosparge VOC sensor DSITMS interfaceprocedure for VOC anlaysis of groundwater in situ and other procedures forVOC analysis of air, soil and groundwater. Visitors days at all three fielddemonstrations included on-site observation of the Hydrosparge technique byState and Federal regulators in three regions of the country. Primary points ofcontact for the HS technology demonstration are given in Appendix A.
Previous Testing of the Technology
Initial field testing of the Hydrosparge VOC sensor was conducted in June1995 at the SERDP National Test Site, Dover Air Force Base, Dover, DE. During this field test, the in situ Hydrosparge concept proved viable andverification samples analyzed offsite by EPA Method 8260A confirmed acorrelation between the Hydrosparge method and conventional analyses. InAugust 1995 another field test of the Hydrosparge VOC sensor was conducted atAberdeen Proving Ground, MD. The field test was conducted at a site that hadbeen partially characterized by conventional monitoring wells and offsiteanalysis. During the six-day investigation, 23 Hydrosparge VOC sensorpenetrations and six stratigraphic sensor penetrations were performed to amaximum depth of 21 m (70 ft) below ground surface (bgs). This investigationprovided a detailed characterization of groundwater contamination at the site. Inaddition to subsurface characterization, the DSITMS was used to analyze surfacewater samples obtained from a creek adjacent to the site. The surface wateranalyses confirmed the impact of the groundwater VOC contaminants on thecreek (Davis et al. 1997).
4Chapter 2 Technology Description
2 Technology Description
This section describes the SCAPS VOC sensing technology demonstrated byERDC and includes background information and a description of the equipment,general operating procedures, training and maintenance requirements, andpreliminary information regarding the costs associated with VOC sensingtechnologies.
Description
The SCAPS 18.2 MT (20-ton) cone penetrometer truck is the platform for afamily of rapid field screening technologies for determination of the spacialdistribution of subsurface contaminants. The HS VOC sampling technologydeveloped jointly by ORNL and ERDC provides the capability to detect andspeciate VOC contaminants in groundwater in situ in near real-time
Cone penetrometer platform
Cone penetrometry test (CPT) results have been widely used in thegeotechnical industry for determining soil strength and inferred soilclassification from measurements of tip resistance and sleeve friction on aninstrumented probe. The SCAPS uses a truck-mounted hydraulic ram toadvance chemical and geotechnical sensing probes. The CPT platform providesan 18.2 MT (20-ton) static reaction force associated with the weight of the truck. Located in the forward portion of the truck is the push room, which contains therods, hydraulic rams, and associated system controllers. Underneath the SCAPStruck push room is a pressure manifold system for rod and probe decontamina-tion. The rear portion of the truck contains onboard computers for datacollection as well as the aboveground components of the SCAPS technology. The combination of reaction mass and hydraulics can advance a 1-m-long by4.45-cm-diam threaded-end rod into the ground at a rate of 2 cm per sec inaccordance with ASTM Method D3441, the standard for CPT soil classification. The rods, various sensing probes, and sampling tools can be advanced to depthsin excess of 50 m in nominally compacted soils. The soil classification sensorused during the demonstration was a separate sensor designed for soil
Chapter 2 Technology Description 5
classification data collection only and was used to investigate subsurface soilstratigraphy at select locations where previous soil boring data was not available. The SCAPS platform was also used to deploy the direct push well which is anintegral part of the HS VOC sensor.
Hydrosparge VOC sensing system
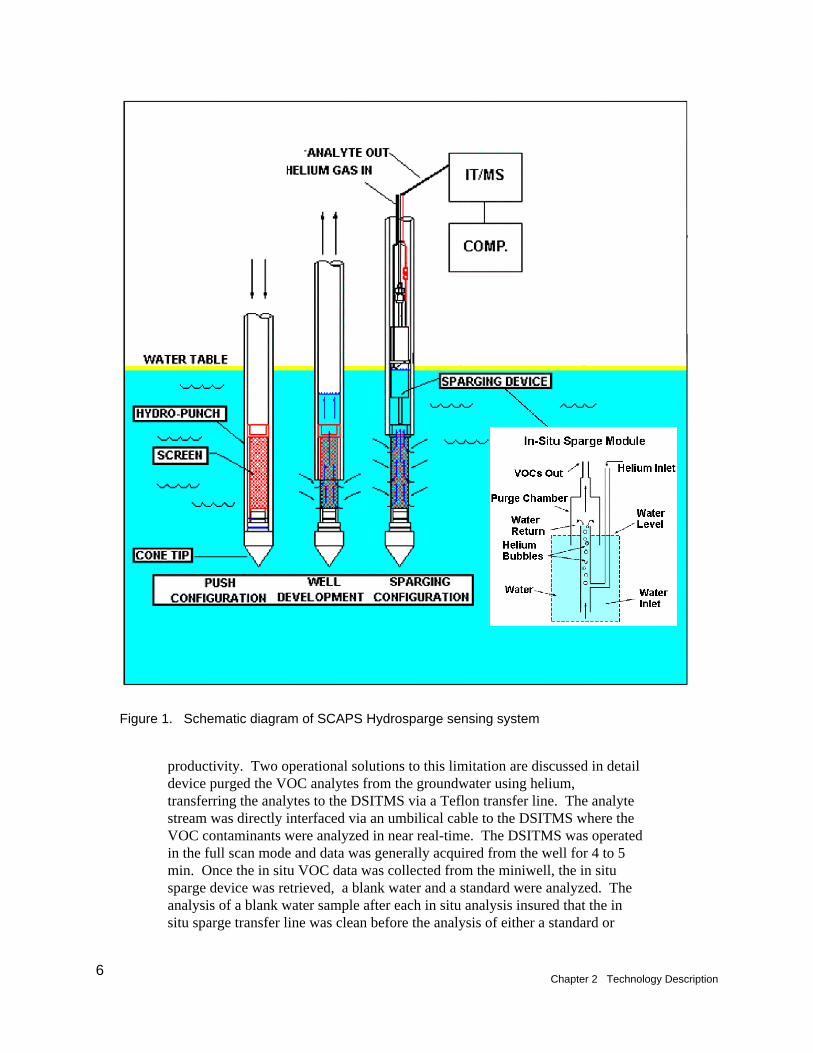
The HS system consists of a commercially available direct push temporaryminiwell (PowerPunch™, Hydropunch ™, or equivalent), an in situ sparge (IS)module, and a direct sampling ion trap mass spectrometer (DSITMS). Normaloperating procedures for HS investigation of groundwater contaminationincludes accessing the groundwater via a direct push miniwell. After theminiwell was pushed to the depth of interest, the push pipes were retracted toexpose an internal screen to groundwater (Figure 1). The depth of the internalscreen sampling interval for each penetration was determined based on the sitestratigraphy and the known or suspected contaminant distribution. When sitestratigraphy was investigated using the SCAPS stratigraphy probe, the numberof stratigraphic penetrations required to characterize a site depended on thecomplexity of subsurface geology and data from previous soil borings. After anumber of stratigraphic and HS penetrations at a site, knowledge of depth togroundwater, relative hydraulic conductivity, and probable contaminantmigration was used to determine new penetration locations and determinescreen depth intervals.
The length of screen interval used during a particular in situ sampling eventwas determined by the subsurface geology and the desired resolution of thevertical contaminant distribution. Use of a PowerPunch ™ direct push wellallowed multiple combinations of 1.5-m (5-ft) screens. The Hydropunch ™ direct push peizometer restricted screen lengths to one 1.2-m (4-ft) screen. Itshould be noted that the PowerPunch ™ operates in an analogous manner to theHydropunch ™; however, the PowerPunch ™ screen can be connected to 1.9-cm(0.75-in.) internal diameter polyvinyl chloride riser pipe providing asemipermanent miniwell for additional site characterization beyond the HS. High resolution, vertical mapping of VOC contaminant distribution can beaccomplished by opening the direct push miniwell screen at intervals as small as0.2 m (0.5 ft). The height of the groundwater in the miniwell is monitoredduring “well development” by lowering a conductivity meter to the groundwatersurface. The time required for water stabilization (generally 15 to 20 min) andthe depth to groundwater are recorded.
When the groundwater level is stable in the miniwell, the in situ spargedevice is lowered into the well, until a conductivity sensor located on the spargedevice indicates that contact with the water has been made. While the in situsparge device is operated at the groundwater surface, the water is sampled at0.46 m (18 in.) below the groundwater surface in the well (Figure 1). Inextremely low hydraulic conductivity aquifers, the time required for thegroundwater depth in the miniwell to stabilize, significantly reduced
6Chapter 2 Technology Description
Figure 1. Schematic diagram of SCAPS Hydrosparge sensing system
productivity. Two operational solutions to this limitation are discussed in detaildevice purged the VOC analytes from the groundwater using helium,transferring the analytes to the DSITMS via a Teflon transfer line. The analytestream was directly interfaced via an umbilical cable to the DSITMS where theVOC contaminants were analyzed in near real-time. The DSITMS was operatedin the full scan mode and data was generally acquired from the well for 4 to 5min. Once the in situ VOC data was collected from the miniwell, the in situsparge device was retrieved, a blank water and a standard were analyzed. Theanalysis of a blank water sample after each in situ analysis insured that the insitu sparge transfer line was clean before the analysis of either a standard or
Chapter 2 Technology Description 7
another HS miniwell. The DSITMS was capable of both qualitative identi-fication of analytes based on their mass spectra and of quantitative measurementbased on the intensities of compound specific ions in the mass spectra.
The current configuration of the Hydrosparge VOC sensor provides anopportunity for sampling at one depth per push. Multiple depths were inves-tigated at a given location by performing additional HS penetrations horizontallyoffset from each other by approximately 0.3 m (1 ft). The number of pene-trations achievable per day was dependent upon the desired depth of each pushand the time it took to achieve groundwater equilibrium conditions. Standardoperating procedures for the Hydrosparge system, including the DSITMS with insitu sparge water sampling, are provided in Davis et al. (1998b).
Strengths, Advantages, and Weaknesses
Strengths of Hydrosparge VOC sensor
The HS sensor was developed in response to the need for near real-time insitu measurements of subsurface VOC contamination at hazardous waste sites. The VOC sensor performs rapid field screening to determine the presence orabsence of volatile organic contaminants within the saturated subsurface of thesite. In addition, the system is interfaced to the DSITMS to provideidentification of specific analytes present based on their mass spectra as well asestimates of contaminant concentrations in groundwater. Based on the datacollected using the SCAPS Hydrosparge VOC sensor, conventional wells can beplaced more effectively. As discussed in the section on cost comparison of theHS VOC sensor to conventional and other technologies, the HS has been usedextensively by U.S. Army Corps of Engineers District SCAPS teams to performsite investigations, and it has significantly reduced the number of monitoringwells installed at these sites. Remediation efforts have been directed on anexpedited basis as a result of the near real-time on-site availability of the HSVOC sensor generated data.
Advantages of the technology
This technology is not intended to be a complete replacement for traditionalmonitoring wells, but a means to optimize the placement of a reduced number ofmonitoring wells to achieve site characterization and long-term monitoringduring remedial actions.
The VOC sensing technology uses a CPT platform to provide rapid fieldscreening of the distribution of VOC groundwater contamination at hazardouswaste sites. The current configuration is designed to quickly and cost-effectively distinguish VOC contaminated areas from uncontaminated areas andprovide semiquantitative estimates of groundwater VOC contaminantconcentrations. This capability allows further investigation and remediation
8Chapter 2 Technology Description
decisions to be made more efficiently and reduces the number of samples thatmust be submitted to laboratories for costly and time consuming analysis. Inaddition, the SCAPS CPT platform allows for the characterization ofcontaminated sites with minimal exposure of site personnel and the communityto toxic contaminants, and minimizes the volume of investigation derived waste (IDW) generated during typical site characterization activities.
Limitation of Hydrosparge VOC sensor
This section discusses the known limitations of the SCAPS Hydrosparge.
Truck-mounted cone penetrometer access limits. The SCAPS supportplatform is an 18.2 MT (20-ton) all-wheel drive diesel-powered truck. Thedimensions of the truck require a minimum access width of 4.6 m (10 ft) and aheight clearance of 3 m (15 ft). It is conceivable that some sites or certain areasof sites may not be accessible to a vehicle the size of the SCAPS truck. Theaccess limits for the SCAPS vehicle are similar to those for conventional drillrigs and heavy excavation equipment.
Cone penetrometer advancement limits. The CPT sensors and other toolsmay be difficult to advance in subsurface lithologies containing cemented sandsand clays, buried debris, gravel units, cobbles, boulders, and shallow bedrock. As with all intrusive site characterization methods, it is extremely important thatall underground utilities and structures be located using reliable geophysicalequipment operated by trained professionals before undertaking activities at asite. This should be done even if subsurface utility plans for the site areavailable for reference.
Direct push miniwell groundwater sampling limits. Direct push miniwellgroundwater sampling tools rely on groundwater conductivity through and acrossa slotted screen to provide groundwater for sampling and analysis. Since nosand filter is present as is the case with conventional wells, the direct pushminiwell screens are subject to clogging when deployed in silty groundwaters. Another limitation is operation in very low hydraulic conductivity aquifers. Since the in situ sparge/DSITMS measurement requires less than 5 min,productivity will be limited by the rate at which the direct push miniwells aredeveloped. One potential solution to this limitation is to use the direct pushminiwell as a temporary well left in place in locations of low hydraulicconductivity. The in situ sparge/DSITMS can be performed after the water levelin the well is stabilized. During that time interval, the CPT can be installinganother PowerPunch™ well at a different location. It should be noted that thismethod of operation was not required at the three sites investigated during thisproject.
Extremely high level contamination carryover. The effective dynamicrange for the HS was determined by two factors: the dynamic range of theDSITMS and the potential for carryover or cross contamination of the samplingdevices during sampling of an extremely high concentration sample (>10 mg/L).
Chapter 2 Technology Description 9
Essentially all analytical systems have upper and lower limits of detection. Theupper limit of detection for the DSITMS is determined by the upper limit of thenumber of molecules it can analyze before the detector is “saturated” with ions. This is not the limiting factor for the HS. The lower limit of detection isdetermined by internal contamination of the transfer lines that transport the VOCanalytes from the in situ sparge to the DSITMS. Extremely high levels of VOCsin groundwater will cause carry-over of analytes between successive runs. Aftercompletion of sampling a very high level sample, residual VOC analytes mayremain in the sampler transfer lines. This sample carry-over between runsresults in less analytical sensitivity and increases the lower limit of detection.
This problem cannot be completely eliminated, but the effects of samplecarry-over can be controlled. After an extremely high level groundwater hasbeen analyzed, a system blank is analyzed. Carry-over is determined to beoccurring if VOC analytes are detected above the system background response. When carry-over is detected in the sample transfer line, the HS is purged withhelium or nitrogen until the background returns to normal. This procedurerequires approximately 30 min, equivalent to approximately one-half to one-thirdthe time required for a normal HS sampling event (i.e., retraction from currentsampling location, move to a new penetration and advance a direct pushminiwell at the new location). Also, if carry-over is observed in the HS transferline, an extra umbilical cable can be installed within 5 min allowing sampling toproceed without interruption while the contaminated transfer line is cleanedoff-line.
DSITMS limitations. The DSITMS is the detector for the HydrospargeVOC sensor and is operated in accordance with EPA draft Method 8265. TheDSITMS is used to identify and quantify VOC analytes purged from miniwellgroundwater by an in situ sparge module. One of the limitations of the DSITMSis, that for particular pairs of analytes, the ITMS cannot distinguish betweenanalytes that yield identical mass fragments. For example, the DSITMS cannotdistinguish between the different positional isomers of the dichloroethenes (cisor trans 1,2 and/or 1,1 DCE) because they yield the same mass ions. Anotherexample is that 1,1,2,2 tetrachloroethane and chloroform (trichloromethane) bothyield ions primarily at masses 83 and 85 and are therefore reported as an analytepair. Using the current DSITMS technology it is not possible to differentiateanalytes yielding identical mass ions, therefore such analytes are reported as asum of the two. It should be noted that the current EPA laboratory method (EPAMethod 8260A) using gas chromatography/mass spectrometry is still not able todifferentiate some analyte pairs (i.e. meta- and para-xylene).
Factors Influencing Cost and Performance
The costs incurred during operation of the Hydrosparge VOC sensor includelabor and equipment costs. The equipment costs, discounting the capital cost ofthe SCAPS vehicle, are consumable supplies for the direct push miniwells, thecost of the DSITMS and analytical supplies, and maintenance of the SCAPSvehicle. The major cost associated with the Hydrosparge VOC sensor operation

10Chapter 2 Technology Description
is labor. Normal operation of the sensor requires three to four individuals: theCPT operator and helper, electronics instrumentation operator and the DSITMSanalyst. Costs are normally broken down to a cost per Hydrosparge sensingevent (considered a production unit). The majority of the time required toperform a single Hydrosparge sensing event is the time required to push andretract the miniwell water sampler to the predetermined depth. As noted earlier,the analytical measurement is made in under 5 min. The time required to pushand retract a probe to depth is the primary factor determining the per unit costassociated with a Hydrosparge sensing event. Another potential limit toproductivity is the rate of water production in low hydraulic conductivitygroundwater formations. For operation in extremely low conductivity units, themode of operation can be modified to leave the direct push miniwell sampler inthe ground as a temporary monitoring well to be sampled later.
Chapter 3 Site Descriptions 11
3 Site Descriptions
Site Selection Criteria
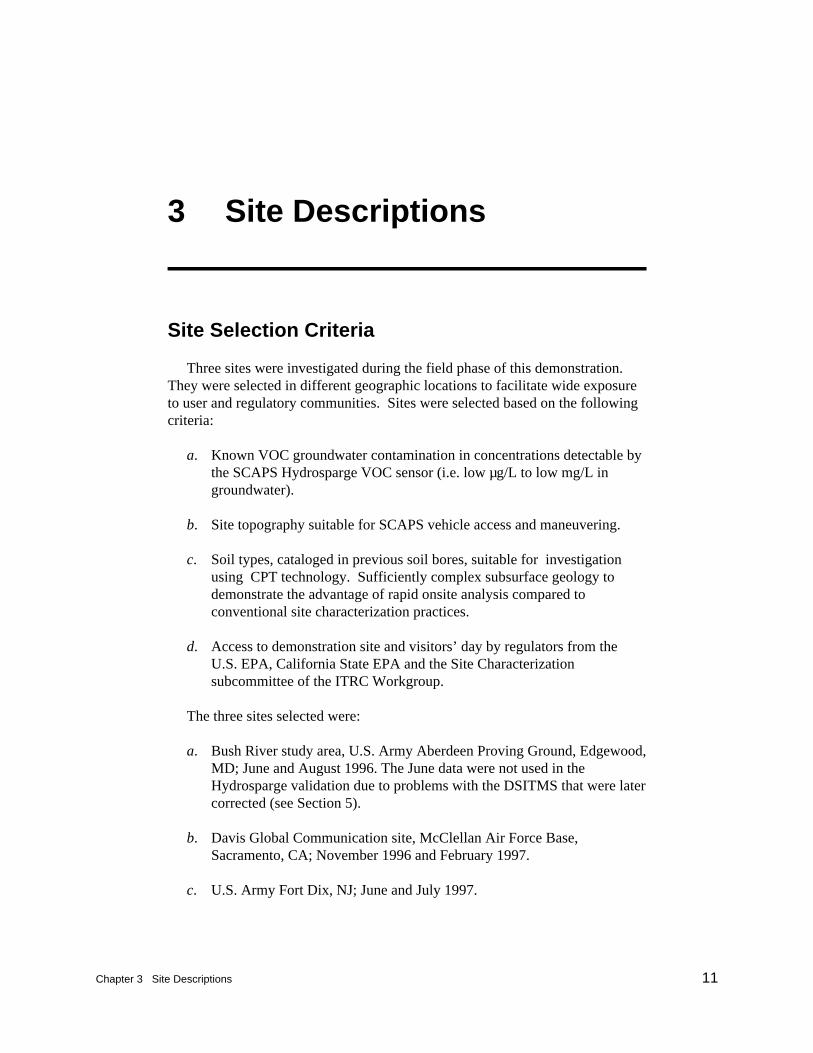
Three sites were investigated during the field phase of this demonstration. They were selected in different geographic locations to facilitate wide exposureto user and regulatory communities. Sites were selected based on the followingcriteria:
a. Known VOC groundwater contamination in concentrations detectable bythe SCAPS Hydrosparge VOC sensor (i.e. low µg/L to low mg/L ingroundwater).
b. Site topography suitable for SCAPS vehicle access and maneuvering.
c. Soil types, cataloged in previous soil bores, suitable for investigationusing CPT technology. Sufficiently complex subsurface geology todemonstrate the advantage of rapid onsite analysis compared toconventional site characterization practices.
d. Access to demonstration site and visitors’ day by regulators from theU.S. EPA, California State EPA and the Site Characterizationsubcommittee of the ITRC Workgroup.
The three sites selected were:
a. Bush River study area, U.S. Army Aberdeen Proving Ground, Edgewood,MD; June and August 1996. The June data were not used in theHydrosparge validation due to problems with the DSITMS that were latercorrected (see Section 5).
b. Davis Global Communication site, McClellan Air Force Base,Sacramento, CA; November 1996 and February 1997.
c. U.S. Army Fort Dix, NJ; June and July 1997.
12Chapter 3 Site Descriptions
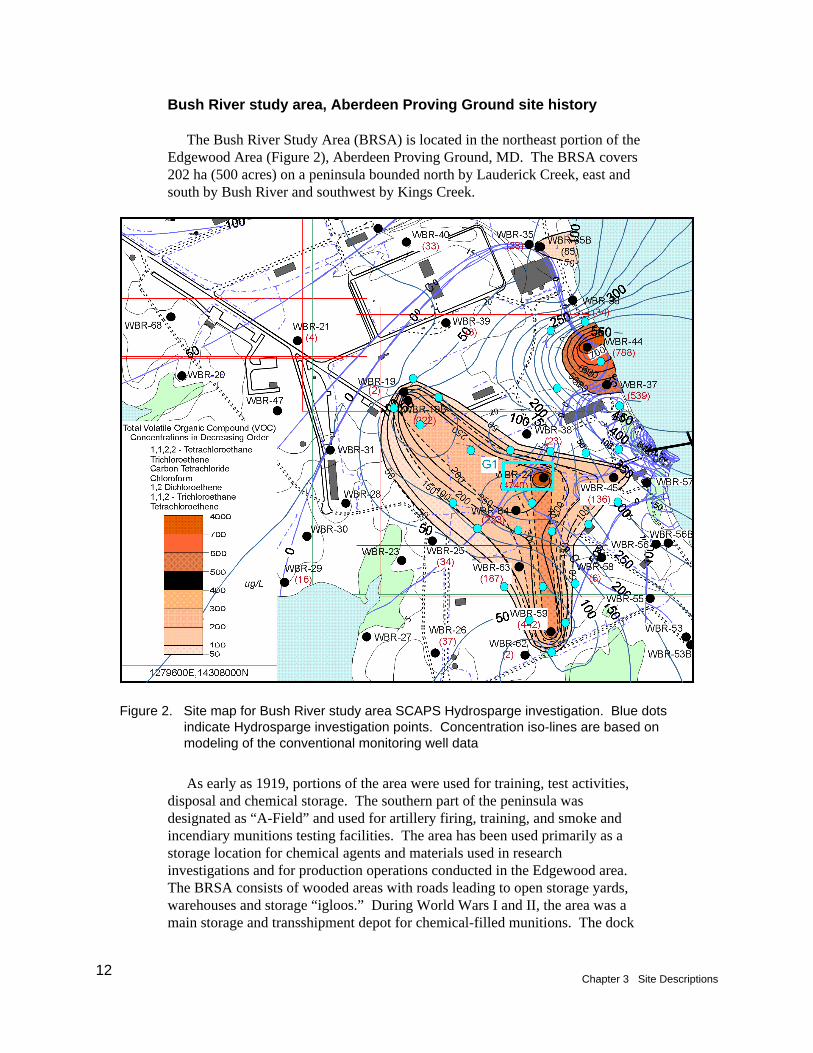
Figure 2. Site map for Bush River study area SCAPS Hydrosparge investigation. Blue dotsindicate Hydrosparge investigation points. Concentration iso-lines are based onmodeling of the conventional monitoring well data
Bush River study area, Aberdeen Proving Ground site history
The Bush River Study Area (BRSA) is located in the northeast portion of theEdgewood Area (Figure 2), Aberdeen Proving Ground, MD. The BRSA covers202 ha (500 acres) on a peninsula bounded north by Lauderick Creek, east andsouth by Bush River and southwest by Kings Creek.
As early as 1919, portions of the area were used for training, test activities,disposal and chemical storage. The southern part of the peninsula wasdesignated as “A-Field” and used for artillery firing, training, and smoke andincendiary munitions testing facilities. The area has been used primarily as astorage location for chemical agents and materials used in researchinvestigations and for production operations conducted in the Edgewood area.The BRSA consists of wooded areas with roads leading to open storage yards,warehouses and storage “igloos.” During World Wars I and II, the area was amain storage and transshipment depot for chemical-filled munitions. The dock
Chapter 3 Site Descriptions 13
on the southeast boundary received foreign chemical munitions captured andshipped to Edgewood for testing and disposal. Chlorinated solvents associatedwith the chemical munitions were believed to be the source of VOC contami-nation in the area used for the SCAPS Hydrosparge VOC sensor demonstration.
The southern two-thirds of the BRSA is fenced and has limited access. Current activities involve storage of bulk containers, hazardous materials, andwastes in preparation for disposal. Waste management units include septictanks, munitions burial sites, landfills, open burning sites, fill areas and drumdisposal sites. Although many of the sites historically relate to handling ordisposal of hazardous materials, contamination was generated during routinesupport activities and include heavy metals, chlorinated solvents, and petroleumhydrocarbon fuels.
The demonstration field work conducted by the ERDC SCAPS team at theBRSA was in the area bounded by Clusters 11, 15 and 18. Specifically, the workwas conducted in an area consisting of the lower half of Cluster 11, below theabandoned power plant and fenced container yard; the lower half of Cluster 15and in the northwest quarter of Cluster 18. This area was known from previousmonitoring well data to have subsurface VOC contamination at levels rangingfrom very low ppb to a few ppm (Figure 2). Previous investigations of the sitepredicted a large contaminant groundwater plume with a minimum number ofmonitoring wells. Review of previous monitoring well logs indicated subsurfacegeology that was applicable to CPT technology and was sufficiently complex todemonstrate the Hydrosparge VOC sensor capabilities.
Davis Global Communication site history
The Davis Global Communications site (DGCS) is an annex of McClellanAFB, located 6.4 km (4 miles) south of Davis, CA. McClellan AFB is one of theStrategic Environmental Research and Development Program (SERDP) NationalTest Sites for evaluation/demonstration of contaminant sensing technologies. The DGCS was built in 1950s and covers approximately 128 ha (316 acres) inYolo County and is surrounded by farmland. The DGCS consists of the fencedmain compound area (approximately 3 ha (8 acres)), communications antennasand undeveloped grasslands (CH2M Hill 1994). The site is operated by the2049th Communication Squadron, McClellan AFB.
In 1985, three underground storage tanks containing diesel fuel werediscovered to be leaking. In 1987, hydrocarbon contamination was confirmed inthe vicinity of the underground storage tanks. The tanks were drained andremoved in 1988. During the field investigation for hydrocarbon contamination,VOCs were discovered in groundwater samples. The source of the VOCcontaminants is unknown, but is likely the result of past disposal practices. Subsequent investigations indicated chlorinated VOC contamination in soil andgroundwater. Previous investigations included 19 CPT penetrations, 28 soilborings, 30 Hydropunch™ samplings, and 29 monitoring wells (Figure 3). Previous CPT penetrations at this site reached a maximum depth of 44.2 m
14Chapter 3 Site Descriptions
Figure 3. Site map for Davis Global Communication site Hydrosparge investigation (to obtainmeters, multiply feet by 0.3048)

Chapter 3 Site Descriptions 15
SCAPS Hydrosparge SiteSCAPS Hydrosparge Site
Figure 4. Location of SCAPS Hydrosparge site, Fort Dix, NJ. Primary site was the Mag 1 area
(145 ft) BGS. The majority of CPT penetrations were greater than 30.5 m(100 ft) BGS.
Fort Dix site history
Fort Dix is located in Burlington and Ocean counties, NJ, about 32 km(20 miles) southeast of Trenton. Fort Dix occupies approximately 12,595 ha(31,110 acres) and adjoins McGuire Air Force Base (Figure 4). The sitesinvestigated during the SCAPS Hydrosparge demonstration were the Mag 1 site,a former base gas station, and the base drinking water supply pumping stationnear New Lisbon, NJ.
The Mag 1 site is located in the northwestern part of the Cantonment area atFort Dix. Installation records indicate that the Mag 1 site existed as early as1917 along the south side of a Pennsylvania Atlantic Railroad spur. The Mag 1site was an ammunition and weapons magazine storage area and a vapordegreasing operation (ABB Environmental Services, Inc. 1996). The vapordegreasing operation used trichloroethene (TCE).
16Chapter 3 Site Descriptions
Standard operating procedures for disposal of spent TCE have been reportedby previous employees to consist of dumping barrels of waste TCE in a rubblepile along the southern boundary of the Mag 1 site. This historical informationsuggests that large quantities of TCE were disposed of at the site. However, datagathered from previous investigations indicate no large volume of TCE in thenear subsurface less than 15 m (50 ft) BGS.
The two other sites investigated during the Fort Dix demonstration were atlocations where suspected leaking underground storage tanks (UST) containingpetroleum had been recently removed by base contractors (within a month of theSCAPS Hydrosparge VOC Demonstration). The former base gas station islocated on Delaware Avenue, one block south of the PembertonAvenue/Delaware Avene/CR 545 traffic circle. The two gasoline USTs wereremoved prior to the SCAPS Hydrosprage Sensor demonstration. The Fort Dixdrinking water pumping station is located southwest of Fort Dix on GreenwoodBranch adjacent to the bridge on New Lisbon Road, New Lisbon, NJ. A singleUST used to store diesel fuel for a backup power generator was removed prior tothe SCAPS Hydrosprge VOC sensor demonstration at this site. Both sites werechosen for SCAPS Hydrosparge investigation because the petroleum UST hadrecently been removed and was beleived to leak. Volatile organic contaminantsassociated with petroleum leaks include benzene, toluene, ethylbenzene andxylenes (BTEX). Previous Hydrosparge VOC sensor investigations haddemonstrated the capabilities for chlorinated solvent contaminant detection. Since no previous Hydrosparge demonstrations had involved sites with BTEX,these two sites were selected to demonstrate the Hydrosparge VOC sensorcapabilities with these analytes.
Site Characteristics
Site characteristics, Bush River study area, Aberdeen Proving Ground, MD
Aberdeen Proving Ground is located in the Atlantic Coastal Plainphysiographic province in the eastern part of Hartford County, MD. The CoastalPlain is underlaid by unconsolidated sediments consisting of clay, silt, sand, andgravel. Coastal Plain sediments in Hartford County were deposited on thesoutheastward-dipping surface of Piedmont basement rocks by the actions ofseas, streams, or rivers and form a wedge-shaped body. These sedimentscomprise three units in the BRSA; from oldest to youngest they are the PotomacGroup of Early Cretaceous age, the Talbot Formation of Pleistocene age, andrecent alluvium. Alluvial deposits occur near drainage ways and topographiclows. The shallowest stratigraphic unit is the Talbot Formation. The lithologyof the Talbot Formation is extremely variable because of the changingthicknesses of clay and sand facies, and presence of clay interbeds in gravellysand facies. The deepest stratigraphic unit is the Potomac Group. The PotomacGroup is undifferentiated in Hartford County and consists of sand and gravelunits interbedded with multicolored clay units. The lithology encountered
Chapter 3 Site Descriptions 17
during the BRSA borehole drilling includes interbedded clay, silt, sand, andgravel facies. These sediments form confining units and aquifers. Silt and siltyclay outcrop over the majority of the BRSA peninsula and form a discontinuoussemiconfining (leaky) unit of varied thickness, averaging about 3 m (10 ft)(General Physics Corp. 1995).
In 40 out of the 44 boreholes, the first significant water-bearing unit encoun-tered is the Upper (water table) aquifer (General Physics Corp. 1995). Theaverage depth to the Upper aquifer in the extreme southern part of the BRSApeninsula in Cluster 18 is about 2 m (8 ft). The Upper aquifer ranges in thick-ness from 0.7 to 8.8 m (2.3 to 28.8 ft), with an overall average thickness of 3.5 m(11.6 ft). The Upper aquifer is thinnest in the northern part of the BRSApeninsula near Cluster 35 and thickest in the south near Cluster 18. The Upperaquifer is unconfined by sand and sandy silt in places near some surface waterbodies. As a result, the Upper aquifer appears to be semiconfined in the BRSA.
A tight, silty clay unit was encountered during drilling immediately below theUpper aquifer and appears to be a confining unit. The deeper, confined “CanalCreek” aquifer is immediately below this confining unit. The Canal Creekaquifer was encountered in one borehole at a depth of about 13 m (43 ft). Thehydraulic conductivity of the shallow groundwater monitoring wells installed inthe Upper aquifer of the BRSA ranges from 0.001 to 9.9 m/day (0.0037 to32.4 ft/day), with an overall average of about 0.8 m/day (2.5 ft per day). Theshallow aquifer was chosen for the SCAPS Hydrosparge sensor demonstrationbecause chlorinated solvent VOC contamination in the range of a few µg/L tomg/L had been previously detected in a small number of widely spacedmonitoring wells. The subsurface geology at the demonstration site wassufficiently complex to demonstrate the advantages of the combination ofSCAPS geophysical data collection and real time groundwater VOC detectionusing the Hydrosparge VOC sensor.
Site characteristics, Davis Global Communications site, CA
The DGCS groundwater is found in three freshwater-bearing units listed fromthe surface to increasing depth and age: the younger alluvium, the older alluviumand the Tehama Formation. The younger alluvium is up to 12 m (40 ft) thickconsisting of primarily fine-grained flood plain of overbank deposits mixed withlesser amounts of stream channel deposits. The older alluvium is 18.3 to 39.6 m(60 to 130 ft) thick and consists of stream deposits of silt, silty clay, gravel andsand deposited by Putah Creek. Fine grained deposits predominate. Gravel andsand deposits comprise about one-fourth of the thickness and occur asdiscontinuous lenses rather than continuous sheets. The Tehama Formationoccurs below about 49 m (160 ft) and is below the operating depth of the SCAPSHydrosparge VOC sensor (CH2M Hill 1994).
Local groundwater levels fluctuate during April to October because ofagricultural pumping. However, during late fall and winter, groundwater levelsapproach mean sea level. The groundwater is generally between 7.6 and 10.7 m
18Chapter 3 Site Descriptions
(25 and 35 ft) BGS during winter and 18.3 to 21.3 m (60 to 70 ft) BGS duringsummer. The aquifer at the DGCS has been classified in Zones A, B, C, D andE. Zones A, B and C are of primary interest in this investigation. Zone Aextends from ground surface to about 18.3 to 21.3 m (60 to 70 ft) BGS. Zone Ahas low permeability 0.9 to 9.0 m/day (3 to 30 ft/day) hydraulic conductivity(HC) consisting mainly of silts and clays except for a sand deposit typically 3 m(10 ft) thick found between 6 to 12 m (20 to 40 ft) BGS. Zone B extends from20 to 29 m (65 to 95 ft) BGS and is more permeable (HC of 8 to 61 m/day or 25to 200 ft/day) than Zone A. Zone C extends from 29 to 37 m (95 to 120 ft) BGSand is also highly permeable (HC of 30 to 46 m/day or 100 to 150 ft/day).
Contaminants of concern at the DGCS are perchloroethene, TCE,dichloroethenes (DCE), dichloroethane, vinyl chloride and benzene. (CH2MHill 1994) summarized the VOC contaminants detected in eight monitoringwells at the DGCS site. It should be noted that MW-1 through MW-8 are allscreened in Zone B at depths between 18 and 25 m (58 and 81 ft) BGS. Thetotal VOC concentrations in these wells vary from a low of 8.3 µg/L to a high of1.38 mg/L. The B zone was chosen for the SCAPS Hydrosparge VOC sensordemonstration because the A zone is often dry due to seasonal agriculturalpumping of the shallow groundwater.
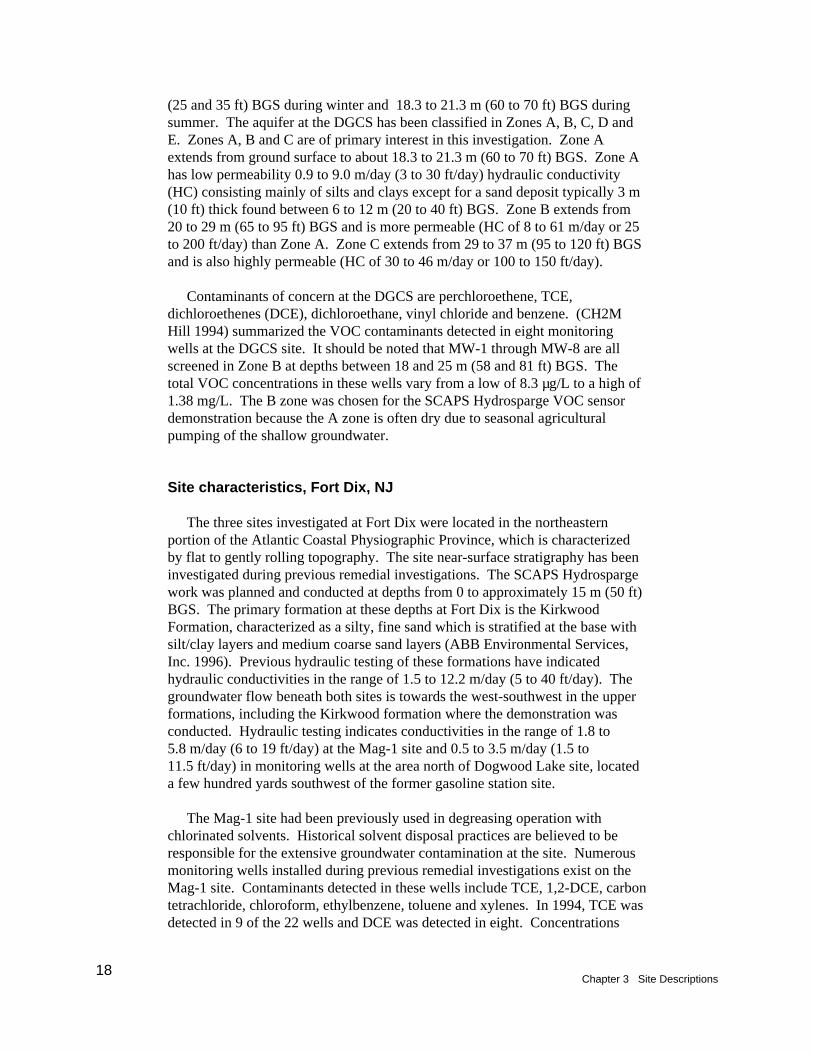
Site characteristics, Fort Dix, NJ
The three sites investigated at Fort Dix were located in the northeasternportion of the Atlantic Coastal Physiographic Province, which is characterizedby flat to gently rolling topography. The site near-surface stratigraphy has beeninvestigated during previous remedial investigations. The SCAPS Hydrospargework was planned and conducted at depths from 0 to approximately 15 m (50 ft)BGS. The primary formation at these depths at Fort Dix is the KirkwoodFormation, characterized as a silty, fine sand which is stratified at the base withsilt/clay layers and medium coarse sand layers (ABB Environmental Services,Inc. 1996). Previous hydraulic testing of these formations have indicatedhydraulic conductivities in the range of 1.5 to 12.2 m/day (5 to 40 ft/day). Thegroundwater flow beneath both sites is towards the west-southwest in the upperformations, including the Kirkwood formation where the demonstration wasconducted. Hydraulic testing indicates conductivities in the range of 1.8 to5.8 m/day (6 to 19 ft/day) at the Mag-1 site and 0.5 to 3.5 m/day (1.5 to11.5 ft/day) in monitoring wells at the area north of Dogwood Lake site, locateda few hundred yards southwest of the former gasoline station site.
The Mag-1 site had been previously used in degreasing operation withchlorinated solvents. Historical solvent disposal practices are believed to beresponsible for the extensive groundwater contamination at the site. Numerousmonitoring wells installed during previous remedial investigations exist on theMag-1 site. Contaminants detected in these wells include TCE, 1,2-DCE, carbontetrachloride, chloroform, ethylbenzene, toluene and xylenes. In 1994, TCE wasdetected in 9 of the 22 wells and DCE was detected in eight. Concentrations
Chapter 3 Site Descriptions 19
ranged from <2 µg/L to 2,000 µg/L for both analytes. The highestconcentrations of contaminants were found in groundwater at the southwestcorner of the site, near the location of the rubble pile (ABB EnvironmentalServices, Inc. 1996). As discussed earlier, visual evidence of petroleum leakagehad been noted during UST removal at the former gasoline station and the FortDix drinking water pumping station sites. Fort Dix environmental personnelwith oversight of the UST removal operations requested that part of the SCAPSHydrosparge technology demonstration be conducted at these sites. Groundwater was less than 3 m (10 ft) BGS at both sites. The leaking petroleumwas expected to contain benzene, toluene, ethyl benzene, and xylene.
20Chapter 4 Demonstration Approach
4 Demonstration Approach
This section discusses the developers’ claims, demonstration objectives,factors that must be considered to meet the performance objectives, samplingdesign, and data analysis used to evaluate the results of the demonstration.
Sampling Procedures
Standard sampling procedures for the Hydrosparge VOC sensordemonstration were implemented to ensure the consistency and integrity of boththe Hydrosparge VOC sensor data and the results of the verification sampleanalyses. The following sections detail the sample collection proceduresnecessary to meet demonstration objectives. Careful adherence to theseprocedures was necessary to ensure that sample data collected using the SCAPSHydrosparge VOC sensor were comparable to results of validation samplesanalyzed in an off-site laboratory by EPA Method 8260A.
The overall purpose of the demonstration sampling program was to collectSCAPS in situ VOC sensor data and validation samples for analysis by tradi-tional analytical methods in parallel to demonstrate the SCAPS HydrospargeVOC sensor technology's capability to delineate the boundary (field screening)of a volatile organic compound plume. It should be noted that in the context ofthe Hydrosparge and this demonstration, sampling can refer to multipleoperations. The term verification sampling denotes the procedures used toobtain a water sample from a direct push miniwell or conventional monitoringwell for offsite laboratory analysis. The term sampling is also used whenreferring to a specific Hydrosparge sensing event, (i.e., when an in situ spargemodule purges VOC analytes from groundwater and transfers the VOCs to theDSITMS for analysis).
SCAPS Hydrosparge VOC sensor sampling locations
The Hydrosparge VOC sensor sampling locations were selected at each sitebased on knowledge of previous remedial investigation results. A series ofpenetrations were performed at each demonstration site using the HS to obtain in

Chapter 4 Demonstration Approach 21
situ VOC sensing data. Validation sampling for the HS consisted of obtaininggroundwater from the direct push miniwell before the HS measurement wasconducted. Groundwater was sampled using a bailer and sample vials filledafter the dissolved oxygen, pH, temperature, and conductivity had stabilized. These geochemical parameters are normally used prior to sampling conventionalmonitoring wells to determine when sufficient groundwater has been purged toensure the water sampled for analysis is representative of the groundwater in thegeologic formation. The groundwater sampled after the geochemical parametershave stabilized is considered formation water. Groundwater samples werecollected in triplicate in precleaned 40 mL VOC vials, preserved with 3 dropsconcentrated HCl and stored on ice for shipment to an offsite laboratory foranalysis by EPA Method 8260A. HS sensor measurements were conducted ateach direct push miniwell penetration after each validation sample was collected.
Experiments were conducted at each site to evaluate whether the watercollected in the HS well was representative of formation water. Three directpush miniwell penetrations were implanted radially (at 0N, 120N and 240N) aroundan existing well, 1.2 to 1.8 m (4 to 6 ft) offset. The direct push miniwells werescreened at the same depth intervals as the conventional well screens. The directpush miniwells were sampled after the water had stabilized (i.e., when bailedsamples yielded constant dissolved oxygen, pH and conductivity). Dissolvedoxygen, pH and conductivity were measured in the field using Standard Methodsfor Examination of Water and Wastewater Methods 423 and 205, respectively(American Public Health Association 1989a,1989b). Conventional monitoringwells were sampled after micropurging with a submersible pump at themidscreen depth until formation water was obtained. The samples collectedfrom both the direct push miniwells and the conventional monitoring wells wereplaced on ice and analyzed by the offsite ERDC laboratory for VOC analytes. In addition to verification sampling, both the direct push miniwells and thepurged conventional monitoring well were analyzed using the in situ purgemodule after the verification sampling had been completed. At least threeexisting conventional monitoring wells at each demonstration site wereinvestigated using this experimental configuration.
Detailed descriptions of the sampling procedures used during demonstrationactivities can be found in Section 5.4 of the Technology Demonstration Plans forthis Project (USACE WES, 1996a, 1996b, 1997).
Analytical procedures
The analytical procedures used during the demonstration include both theHydrosparge in situ measurement method and the U.S. EPA Method 8260A usedto analyze verification samples.

22Chapter 4 Demonstration Approach
Hydrosparge analytical procedures
This section provides a brief overview of the Hydrosparge analytical method.Hydrosparge analytical procedures are described in detail (Davis et al. 1998;Davis, Furey, and Porter 1998b). Details of the direct sampling ion trap massspectrometer operation have been reported (Wise and Guerin 1997; Wise et al.1998). Hydrosparge operation is also included with other direct sampling iontrap mass spectrometric methods in U.S. EPA draft Method 8265 (U.S EPA1994). This method is currently under review by the U.S. EPA (OSHW) forinclusion in the next revision of SW-846.
Direct sampling ion trap mass spectrometer operation. A DSITMS iscomposed of a quadrupole ion trap mass spectrometer, a capillary retractorinterface and a variety of sample inlets for use with gas (air and soil gas), soil,and water. The system employed in this investigation used either a Teledyne3DQ ITMS or a Finnigan ITMS 40 fitted with a 20-cm-long, 100-µm-internal-diameter capillary (J&W part #160-2635) retractor heated interface (ScientificInformation Service, Inc. part #912000) operated at 105EC. The capillaryinterface limits flow into the ITMS to 0.1 to 1.0 mL/min, which is compatiblewith both electron impact (EI) and chemical ionization (CI) sources (Wise andGuerin 1997).
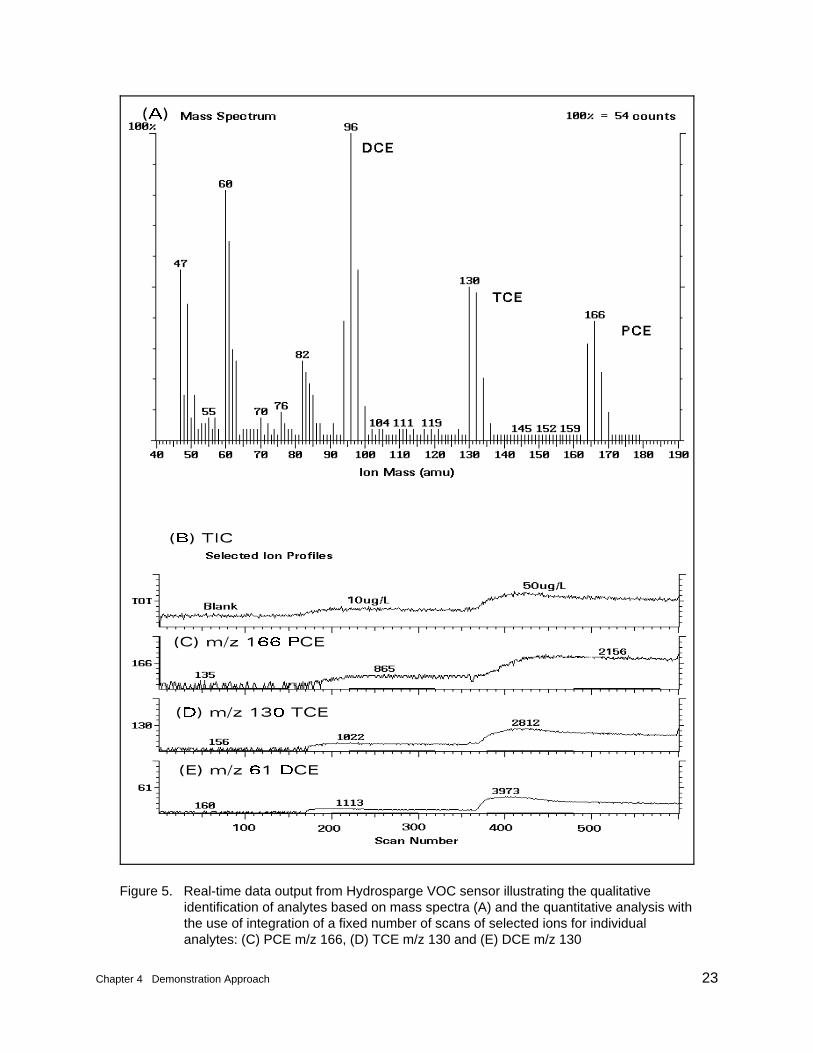
The DSITMS was operated in a full scan mode (40 to 250 daltons) duringcalibration and Hydrosparge data collection. Chlorinated solvents using EI andBTEX were analyzed using water CI. Since ITMS has no separation techniquebefore vapor samples are introduced into the DSITMS, the resulting massspectral data consist of a series of scans containing ions indicating the presenceof VOC analytes (Wise and Guerin 1997). Individual compounds are identifiedand quantified based on ions of selected masses (Figure 5) indicative of theindividual compound (i.e., 130/132 m/z for TCE by EI and 79 m/z for benzeneby water CI). Data acquired during calibration were reduced by integrating afixed number of MS scans (typically 80 to 100 scans) of the specific ions for agiven analyte (U.S. EPA 1994). Typical linear calibration curves for analytes ofinterest extended over three to four orders of magnitude and were quite linear. During data collection from groundwater, the DSITMS was operated in the fullscan mode acquiring data from the well for 3 min. Data acquired during the HSexperiment were reduced in an analogous manner to the calibration standardsand were quantified based on the calibration curves discussed above. Dailycalibration check standards and performance evaluation check standards wereanalyzed to ensure data quality.
In situ sparge module operation. The in situ sparge module, designed topurge VOCs from groundwater in monitoring wells, was modified by reducingits size for use in direct push miniwells. The in situ sparge module operates atthe groundwater/air interface inside a well drawing source water from 0.5 m(18 in.) below the interface (Figure 1). In operation, helium gas flowing throughthe sparge module creates a syphon pulling a constant flow of groundwaterthrough the module as it strips the groundwater of its VOCs. Contaminants arecarried to the surface mounted DSITMS with the helium gas stream via a Teflon
Chapter 4 Demonstration Approach 23
Figure 5. Real-time data output from Hydrosparge VOC sensor illustrating the qualitativeidentification of analytes based on mass spectra (A) and the quantitative analysis withthe use of integration of a fixed number of scans of selected ions for individualanalytes: (C) PCE m/z 166, (D) TCE m/z 130 and (E) DCE m/z 130
24Chapter 4 Demonstration Approach
transfer line. The gas and analyte stream flows directly into the DSITMSallowing the VOCs to be analyzed in real-time. The in situ sparge module andDSITMS were calibrated by spiking a 250 mL volumetric flask containingdistilled water with known concentrations of analytes, inserting the in situ spargemodule into the flask and acquiring data using the DSITMS. The helium flowrate was adjusted at the beginning of calibration (generally between 100 and 160mL/min) and remained constant during calibration and Hydrosparge in situ datacollection. The calibration procedure was conducted under the same operatingconditions used during the Hydrosparge experiment in the direct push miniwells(Davis, Furey, and Porter 1998).
Verification sample analytical procedures
The groundwater verification samples collected during demonstrationactivities were analyzed by the ERDC analytical laboratory according to EPAMethod 8260A. All verification samples were analyzed in accordance with theERDC-WES analytical laboratory standard operating procedures, laboratoryQuality Assurance Manual and the project Quality Assurance Project Plan(USACE WES, 1996a, 1996b, 1997).
Performance Objectives
The primary objectives of this demonstration were to evaluate the HydrospargeVOC sensor in the following areas: (a) performance compared to conventionalsampling and analytical methods; (b) the logistical and economic resourcesnecessary to operate the technologies; (c) data quality; and (d) the range ofapplications in which the technology can be operated. Secondary objectiveswere to evaluate the SCAPS Hydrosparge system for reliability, ruggedness, andease of operation.
SCAPS VOC technologies comparison to conventional methods
The SCAPS Hydrosparge system performance was evaluated by determiningagreement between data produced in situ using the HS/DSITMS and the resultsof duplicate verification sample analyses in an off-site laboratory by EPAMethod 8260A. This objective was achieved by comparing in situ SCAPS VOCdata on a sample by sample basis with results for analysis of groundwatersamples collected during verification sampling activities. The detection limitwas determined prior to demonstration activities using the procedures outlined inDSITMS operation and Davis, Furey, and Porter 1998b. When the DSITMSresponse exceeded the lower detection limit, the data result was considered a“detect.” The detection limit for the verification samples was determined by theERDC analytical laboratory according to procedures outlined in U.S. EPAMethod 8260A.
Chapter 4 Demonstration Approach 25
Data from the HS system was converted to a concentration in water reportedand in µg/L or mg/L (ppb and ppm, respectively). These are the sameconcentration units used to report data from the verification method (EPAMethod 8260A). Therefore, direct comparison of the SCAPS Hydrosparge VOCsensing technology data with that from the verification sample analyses weresimple and straightforward. Agreement between data from the HydrospargeVOC sensing technology and conventional methods of analysis for verificationsamples was evaluated using least squares linear regression over the entireconcentration range of data collected by each method at every site. The HS dataand conventional data were being considered to strongly agree if the correlationcoefficient of the linear regression was 1.0 ± 0.2 and the slope of the regressionline was 1.0 ± 0.20. Previous field demonstrations of the HS system indicatedstrong correlations between HS in situ data and EPA Method 8260A analyses ofverification samples.
Economic considerations
General logistics and economics associated with SCAPS CPT operation areknown from previous work performed by the ERDC SCAPS vehicle and fromwork performed over the last four years by the three U.S. Army Corps ofEngineers (CE) District SCAPS vehicles that perform LIF and other sitecharacterization investigations. Daily operation costs for a four-person crewwere used to estimate labor costs associated with the expected production modedeployment of the HS. Actual production rates obtained for the HydrospargeVOC sensor during demonstrations at each site were used for cost comparisonswith conventional methods of subsurface VOC detection (i.e., monitoring wellinstallation, sampling, and analysis). Costs associated with conventional sitecharacterization were obtained from the actual site managers at each location. Therefore, the cost comparison between the SCAPS HS and conventionaltechnology is a conservative comparison since the actual HS production ratesduring each demonstration were lower than expected in actual production modebecause 100 percent of the HS data were verified by sampling the direct pushwells for offsite analysis. Verification sampling included measurement ofgroundwater geochemical parameters (dissolved oxygen, pH, temperature, andconductivity) as well as filling VOC sample vials for offsite analysis. Experience during the demonstrations indicated that the verification samplingand geochemical measurements required approximately 30 percent of the timefor a full Hydrosparge unit cycle.
Data quality
Data quality was assured by strict adherence to the demonstration QualityAssurance Plan for field analyses and by adherence to the ERDC analyticallaboratory Quality Assurance Manual for verification sample analyses. TheERDC analytical laboratory data quality was also verified splitting at least fivepercent of all Hydrosparge verification samples to independent laboratories for
26Chapter 4 Demonstration Approach
analysis by EPA Method 8260A. Data quality issues will be discussed in detailin the chapter on Hydrosparge VOC sensor performance assessment.
Range of usefulness
The range of usefulness of the SCAPS Hydrosparge VOC sensor technologywas demonstrated at the three sites employed in this demonstration. In addition,the technology was transferred to the three Corps District SCAPS programsduring several site investigations for VOC contaminated groundwater duringfiscal years 1996 and 1997. As discussed previously, there are limits to theability of the CPT to push to groundwater at some locations and DSITMStechnology cannot differentiate some VOC analytes and isomer pairs. The threedemonstrations performed under this project demonstrated the wide range ofapplication for the SCAPS VOC Hydrosparge sensor.
Technical Performance Criteria
Contaminants
The SCAPS Hydrosparge VOC sensor was used to rapidly determine thelocation and relative extent of subsurface VOC contamination in groundwater insitu to depths of up to 50 m. No physical sampling and off-site analyses wererequired by these methods. The Hydrosparge VOC sensor used a field portableDSITMS capable of detecting the 34 VOC analytes included on the EPA TargetCompound List (EPA draft Method 8265, Table 1). Method sensitivity varies byanalyte and with periodic changes in DSITMS performance. However, dailycalibration check standards are analyzed to ensure system performance includingsensitivities for target analytes in the single µg/L range for HS groundwateranalyses. If required, the methods can be modified to detect VOC contaminationin the sub-ppb range. The method yields both qualitative and quantitativeresults, making it appropriate for preliminary assessments of contaminant distri-bution such as environmental field screening applications.
Process waste
The SCAPS Hydrosparge VOC sensor does not bring soil in the form ofauger cuttings to the surface as do conventional drilling methods. However,investigation-derived wastes are generated during the steam cleaning ofpenetrometer rods and probes during retraction. The steam cleaning waste areplaced in 208 L (55-gallon) drums, which are labeled and stored onsite forappropriate disposal by the facility. If permitted, this wastewater could be ana-lyzed onsite using the DSITMS, determined to contain non-detectable levels ofthe contaminants of concern, and discharged to the site. Data collected duringthe three-site demonstration activities indicated that the wastewater production
Chapter 4 Demonstration Approach 27
rate for rod decontamination was approximately 19 L per 15.2 m (5 gal per 50 ft)retraction.
Reliability
The Hydrosparge VOC sensing system consists of three components; a directpush miniwell, an in situ sparge module, and a DSITMS. The complete systemhas been field demonstrated at six different VOC-contaminated sites, includingthe three sites investigated during this ESTCP-sponsored demonstration. Validation sample results obtained at each site and analyzed by EPAMethod 8260A indicated that the Hydrosparge system yields groundwater VOCcontamination characterization equivalent to that obtained by conventionalsampling and analysis (Davis et al. 1997; 1998). The reliability of eachcomponent is discussed below.
Direct push miniwell. Direct push miniwells are subject to the samelimitations of application as all CPT direct push tools and sensors (i.e., certainsubsurface geologies prevent penetration). However, where CPT is applicable,direct push miniwells are a reliable commercially available groundwatersampling tool and are in widespread use. The Corps SCAPS vehicles havepushed hundreds of direct push miniwell penetrations with no significant prob-lems.
In situ sparge module. The in situ sparge module was developed at ORNLfor use in conventional monitoring wells. Data obtained from this applicationhave indicated that the in situ sparge module, interfaced to the DSITMS,provides data equivalent to conventional methods of groundwater analysis(Davis et al. 1997).
Direct sampling ion trap mass spectrometer. The DSITMS used with theHS was developed under the Technology Reinvestment Program (TRP) for fieldportable use. This ITMS technology has been commercially available for over adecade for laboratory use. The DSITMS used in this demonstration has providedreliable detection of VOC analytes in the concentration ranges required for µg/Ldetection limits in groundwater (Davis et al. 1998) in both laboratory and fieldstudies.
Ease of use
Typically, a four-person crew is employed to complete all aspects ofHydrosparge VOC sensing field operations: a field site manager, two push roompersonnel and a DSITMS operator. SCAPS operation encompasses a large partof the field activities associated with standard geotechnical CPT technologies. The DSITMS system operator requires a background in science and moredetailed training relating to the Hydrosparge VOC sensor components in theevent debugging a field problem is required.
28Chapter 4 Demonstration Approach
Versatility
When the SCAPS stratigraphy sensor is deployed in parallel with the SCAPSHydrosparge VOC sensor, both geotechnical data and contaminant data arerapidly mapped at a site. This field screening data is then used to make deci-sions regarding remediation and monitoring well placement and design.
Off-the-shelf procurement
Cone penetrometer trucks and geotechnical sensors are commerciallyavailable. Direct push miniwell systems have been commercially available for anumber of years and are expected to be available indefinitely. The Hydrospargetechnology developers (ORNL) are currently negotiating a license agreementwith a commercial vendor. The in situ sparge module and DSITMS interfaceshould be commercially available in the near future.
Maintenance
The SCAPS Operations Manual (Koester et al. 1994) details operations andmaintenance items pertaining to Corps SCAPS CPT technologies. Briefly,maintenance falls into two categories: basic truck systems and VOC-samplingsystems. The Operations Manual covers the SCAPS CPT, associatedcomputers/electronics and the sensor probes, but not the Hydrosparge VOCsensing systems deployed during this demonstration.
The SCAPS CPT systems include hydraulics, grout injection, signalconditioning electronics, and data acquisition/processing. The direct pushminiwell ground water sampler components of the HS (Figure 1) requirecleaning with the steam cleaner after each penetration. The in situ spargemodule requires little to no maintenance since it has no moving parts, but doesrequire decontamination after each use. The DSITMS requires routinemaintenance of the instrument. Based on laboratory and three years fieldexperience, with constant use, ion trap instrument cleaning is required aboutevery 3 to 4 months and requires 2 to 4 hr. The electron multiplier that detectsions and produces the actual DSITMS response requires replacement at aboutthe same interval. Maintenance is performed by system operators with theDSITMS systems requiring more specific skills.
Chapter 5 Hydrosparge VOC Sensor Performance Assessment 29
5 Hydrosparge VOC SensorPerformance Assessment
This section of the report will address the performance based objectivesrelative to the data produced and the performance of the Hydrosparge VOCsensor technology during the demonstrations.
Hydrosparge VOC Sensor Data Summary
Hydrosparge VOC sensor data was collected at three geographic locations: (a) Bush River study area, Aberdeen Proving Ground, MD; (b) DavisCommunication site annex, McClellan Air Force Base, CA; and (c) Fort Dix, NJ. As discussed earlier, these sites were selected because they were amenable tocone penetrometer investigation and were known to have VOC groundwatercontamination. Additionally, each site had a number of existing monitoringwells that could be used for the well comparison studies. Table 1 contains asummary of the field work conducted at each demonstration site.
Table 1Summary of Field Sampling Conducted at HydrospargeDemonstration Sites
Site NameNumber of HSPenetrations
HS Average Depthm (ft)
HS Total Depthm (ft)
Number of WellComparisonsStudies
BRSA 88 8.5 (28) 544 (1,784) 3
DGCS 35 17.1 (56) 636 (2,085) 3
Fort Dix 35 7.3 (24) 215 (706) 4
Since each HS penetration was analyzed for multiple VOC contaminants,many hundreds of data points were collected during the demonstrations. Tablessummarizing the actual HS and validation sample data are presented inAppendix B. In addition, calibration check standards and externally preparedperformance evaluation (PE) check standards were analyzed daily for quality
30Chapter 5 Hydrosparge VOC Sensor Performance Assessment
assurance purposes. These data sets will be discussed in detail in the section onHydrosparge VOC sensor data assessment.
Sample matrix effects on HS VOC sensor
The sample matrix investigated using the HS VOC sensor was groundwater. As described previously, the HS VOC sensor accesses groundwater by means ofa direct push miniwell. The only matrix effect one might encounter is varyingamounts of silt entering the miniwell screen, depending on site subsurfacegeology. Although the amount of silt present in sampled groundwater can be ofconcern for some environmental contaminants (i.e., heavy metals), VOCcontaminants do not significantly partition onto or into subsurface soils. Therefore, varying amounts of silt in the groundwater at a particular site oracross different sites is not considered to be a significant matrix effect for the HSVOC Sensor.
Data validation for Bush River study area, Aberdeen Proving Ground
The validation sample results from the HS VOC Sensor demonstrationperformed at Bush River study area during June 1996 indicated that the HS VOCsensor was underestimating the VOC concentrations when compared with theverification samples measured by EPA Method 8260A. This result wassurprising based on the results of three previous HS VOC sensor investigationsthat indicated no difference between the Hydrosparge and verification sampleresults. The data collected during the June demonstration was collected using aTeledyne DSITMS. In mid-August, a week before the demonstration visitorsday, the ERDC SCAPS team performed additional HS VOC sensor penetrationsat the BRSA to identify the source of the low bias provided by the TeledyneDSITMS. This work was conducted using a Finnigan ITMS 40 and the resultswere compared with data collected using the Teledyne DSITMS. Thiscomparison indicated that the Teledyne did yield a low bias for high VOCconcentrations. It should be noted that the bias was only observed atconcentrations >1,000 µg/L. The instrumental bias was not detected during fieldoperations because the highest concentration PE check standard analyzed was50 µg/L. Hence, all subsequent HS VOC sensor demonstrations incorporatedhigher concentration PE check standards.
The source of the bias in the Teledyne data appeared to be caused by athermal cold spot in the DSITMS heated inlet where the helium purge gas fromthe in situ purge module entered the DSITMS. The cold spot was brought to theattention of the Teledyne manufacturer and the problem was corrected. Basedon problems encountered with the Teledyne DSITMS, only the data collectedusing the Finnigan DSITMS were used for data comparisons between the HSVOC Sensor and the validation samples analyzed using EPA Method 8260A.

Chapter 5 Hydrosparge VOC Sensor Performance Assessment 31
Well comparison study at Davis Global Communication site
The comparison of data HS VOC sensor to that of conventional monitoringwells can be evaluated as two separate processes: the access to groundwater andthe analysis of the groundwater, once it is obtained. Results from the DGCSdemonstration indicate, regardless of the source of water (direct push miniwell,or conventional monitoring well), that the in situ sparge/DSITMS measurementof the groundwater VOC concentrations are comparable to measurements madeby offsite sample analyses using EPA Method 8260. The evaluation of the directpush miniwell capability to obtain “formation” groundwater is more difficult toevaluate. The assumption of the current experimental design (i.e., pushing threedirect push miniwells at 0, 120 and 240 deg around an existing monitoring wellas described in the section on SCAPS Hydrosparge VOC sensor samplinglocations) is that the groundwater contamination is homogeneous within thespatial scale of the experiment. The results from the DGCS indicate significantnear scale spatial heterogeneity in groundwater contaminant concentrations.
The problem at the DGCS appeared to be caused by improper well designthat allowed relatively uncontaminated groundwater to leach contaminants fromthe contaminated clay confining layer into the groundwater. Duringconstruction, 6-m- (20-ft-) screens were installed in the wells. Additional HSVOC sensor penetrations conducted adjacent to DGCS MW06 confirmed thatthe 6-m- (20-ft-) screened interval running from 18 to 24 m (60 to 80 ft) BGSintercepted the confined aquifer at about 23 m (75 ft) BGS. At the time ofinvestigation, the groundwater level in adjacent conventional wells and in the PPPeizometer was measured at approximately 11 m (35 ft) BGS. This meant thatthe top 5 m (15 ft) of screen in these wells allowed groundwater intocontaminated clay above the sandy aquifer (Figure 6). The water in the wellthen contained VOC analytes leached from the unsaturated clays. At thislocation, both in November 1996 and February 1997, three PowerPunch wellswere pushed at depths of 18 to 24 m (60 to 70 ft) BGS without yielding water. In addition, during February 1997 a number of SCAPS Thermal DesorptionSampler (TDS) measurements were conducted at this location as part of anotherESTCP VOC sensor project. The TDS results from similar depths indicated upto 400 µg/L PCE present in the unsaturated clay. These data indicated that thewell VOC comparison studies at the DGCS were not useful for evaluating theHS due to improper well design. Contamination from the clay confining layerlead to highly variable VOC results for the HS measurements and a significantbias in the well comparison data set.
Hydrosparge data collected at Fort Dix
All Hydrosparge in situ and verification data collection activities at the FortDix demonstration were conducted as planned. No problems were encounteredwith either the Hydrosparge VOC sensor or the Hydrosparge/conventional wellcomparison study.

32Chapter 5 Hydrosparge VOC Sensor Performance Assessment
Figure 6. Comparison of PowerPunch direct push well with conventional monitoring well at Davis Communication site. Confined aquifer leaked into unstaturated zone because of placement of well screens above the water table
Hydrosparge VOC Sensor Data Assessment
A large volume of data were collected during the HS VOC sensordemonstrations at three sites. Both HS VOC sensor in situ contaminant data andvalidation sample data from EPA Method 8260A analyses were collected formore than 150 HS VOC sensor penetrations. As mentioned above, each HSVOC sensor data collection event analyzed for multiple VOC contaminants. These field operations produced a large volume of both HS VOC sensor andlaboratory validation data (summarized in Appendix B).
Data quality for both the HS VOC sensor and the validation sample analyseswere assured using standard quality assurance procedures including initialsystem calibration, continuing (daily) calibration checks, PE check standards,blanks and spike recoveries (for EPA Method 8260A only). Further qualityassurance checks included spilt sample analysis for at least 10 percent of allvalidation samples obtained for analysis by EPA Method 8260. Split sampleswere analyzed by independent contract laboratories as a quality assurance checkof the ERDC analytical laboratory.
Chapter 5 Hydrosparge VOC Sensor Performance Assessment 33
The daily PE check standard analyses performed using the HS VOC Sensorindicated that the system was within acceptable data quality limits during thedemonstrations (Table 1), with the exception of the previously discussed initialdata collected at the Bush River site . All field blanks shipped with thevalidation samples to the ERDC analytical laboratory were analyzed anddetermined to be free of contamination, indicating proper sampling handlingduring field operations. All spike recoveries were within acceptable qualitycontrol ranges for the ERDC analysis of validation samples. Therefore, allvalidation analyses performed by the ERDC analytical laboratory were ofacceptable quality and the verification data set was considered 100 percentcomplete by quality assurance data.
Comparison of HS VOC Sensor with Conventional Technology
The HS VOC sensor was designed to rapidly characterize VOC groundwatercontamination for the purpose of directing the placement of a minimum numberof conventional monitoring wells for remedial monitoring. The primaryobjective of this project was to obtain high quality HS VOC sensor andconventional validation data to demonstrate the capability of the HS VOCsensor. The applicability of the HS VOC sensor data for use in selectinglocations and screen depths for placement of conventional wells dependeddirectly on the HS VOC sensor comparison with conventional data. Therefore,two sets of data were collected to demonstrate the HS VOC sensor capabilities: (a) HS VOC sensor data and validation samples were collected at locationsknown to be contaminated with chlorinated VOC analytes and at locationscontaminated with BTEX; (b) HS VOC Sensor data were collected adjacent toexisting conventional monitoring wells contaminated with chlorinated andBTEX VOC analytes. The former data set can be used to evaluate the HS VOCsensor ability to produce data comparable to that obtained from conventionallaboratory analysis (i.e., EPA Method 8260A). The later data set can be used tocompare direct push groundwater sampling to conventional monitoring wells foraccessing groundwater VOC contaminants.
Comparison between HS VOC sensor and EPA Method 8260A
During this demonstration, the HS VOC sensor was extensively tested withover 150 penetrations from three geographic locations to depths in excess of24 m (80 ft) BGS (Table 1). In situ data were collected in groundwaterscontaminated with both chlorinated VOCs and BTEX analytes withconcentrations ranging over four orders of magnitude from single µg/l to 10s ofmg/l (ppb to ppm). Validation of the technique was conducted by samplinggroundwater from the direct push wells after HS data collection and offsiteanalysis of validation samples by EPA Method 8260A. This method was chosenfor validation because it involves purging the VOC analytes from the water with
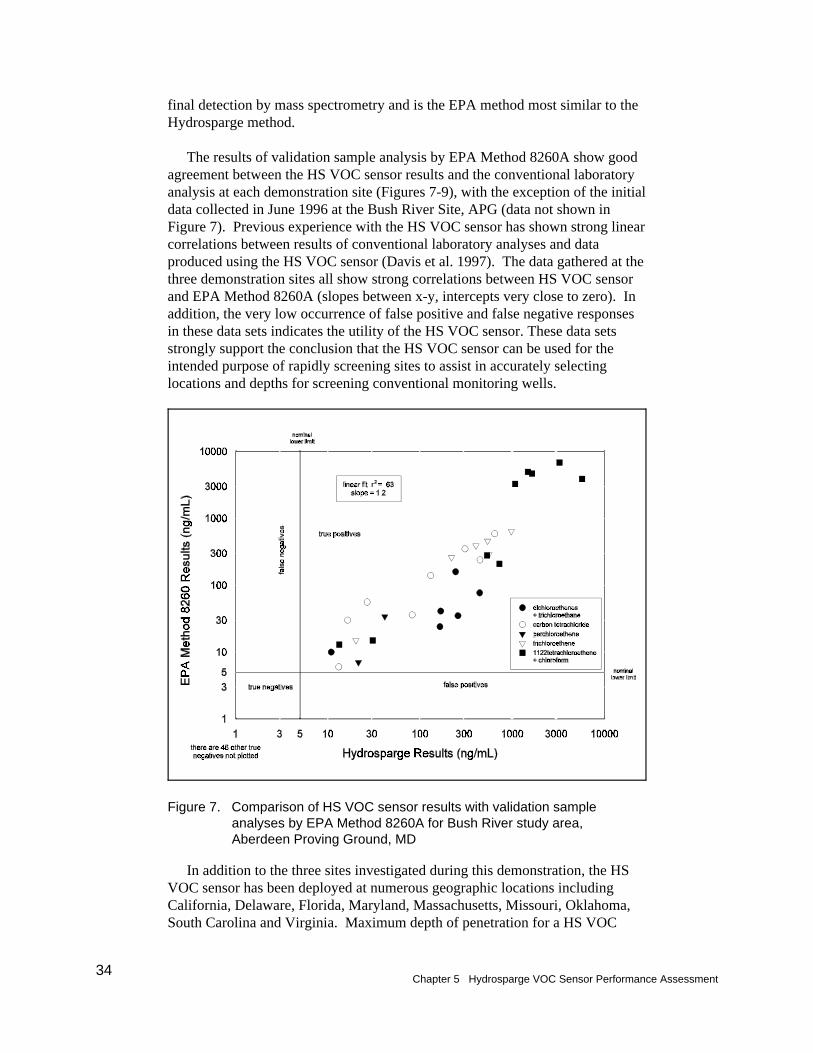
34Chapter 5 Hydrosparge VOC Sensor Performance Assessment
Figure 7. Comparison of HS VOC sensor results with validation sampleanalyses by EPA Method 8260A for Bush River study area, Aberdeen Proving Ground, MD
final detection by mass spectrometry and is the EPA method most similar to theHydrosparge method.
The results of validation sample analysis by EPA Method 8260A show goodagreement between the HS VOC sensor results and the conventional laboratoryanalysis at each demonstration site (Figures 7-9), with the exception of the initialdata collected in June 1996 at the Bush River Site, APG (data not shown inFigure 7). Previous experience with the HS VOC sensor has shown strong linearcorrelations between results of conventional laboratory analyses and dataproduced using the HS VOC sensor (Davis et al. 1997). The data gathered at thethree demonstration sites all show strong correlations between HS VOC sensorand EPA Method 8260A (slopes between x-y, intercepts very close to zero). Inaddition, the very low occurrence of false positive and false negative responsesin these data sets indicates the utility of the HS VOC sensor. These data setsstrongly support the conclusion that the HS VOC sensor can be used for theintended purpose of rapidly screening sites to assist in accurately selectinglocations and depths for screening conventional monitoring wells.
In addition to the three sites investigated during this demonstration, the HSVOC sensor has been deployed at numerous geographic locations includingCalifornia, Delaware, Florida, Maryland, Massachusetts, Missouri, Oklahoma,South Carolina and Virginia. Maximum depth of penetration for a HS VOC
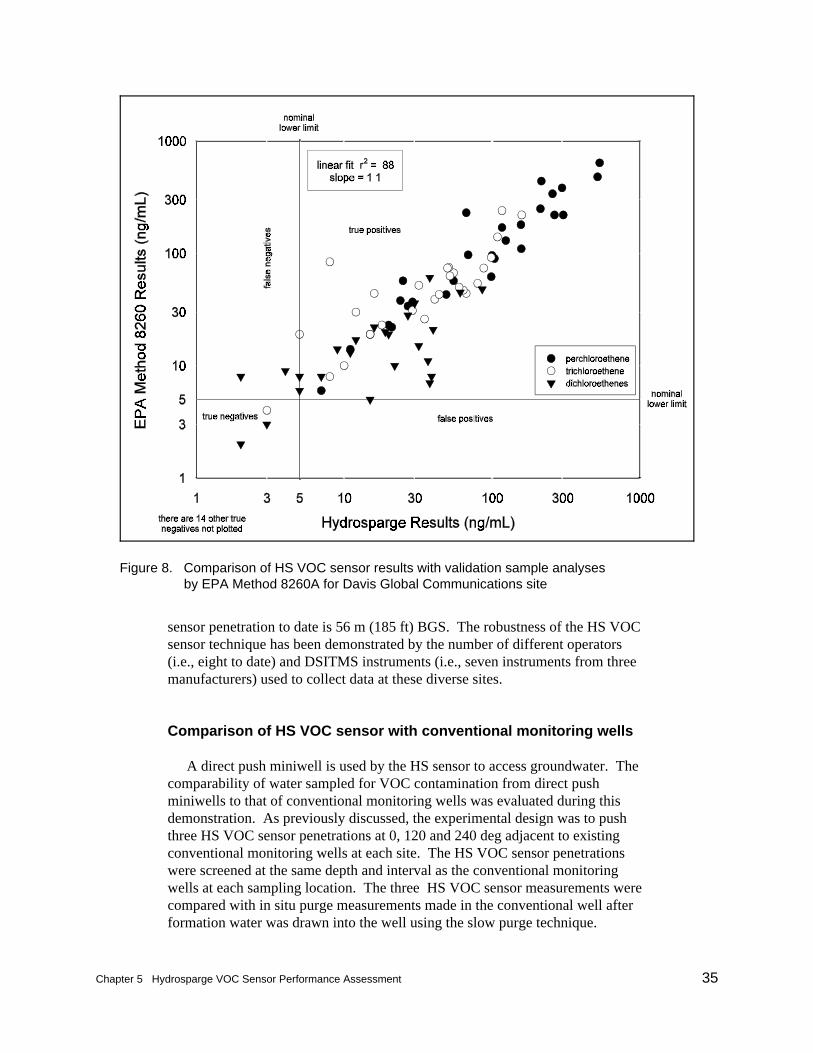
Chapter 5 Hydrosparge VOC Sensor Performance Assessment 35
Figure 8. Comparison of HS VOC sensor results with validation sample analyses by EPA Method 8260A for Davis Global Communications site
sensor penetration to date is 56 m (185 ft) BGS. The robustness of the HS VOCsensor technique has been demonstrated by the number of different operators(i.e., eight to date) and DSITMS instruments (i.e., seven instruments from threemanufacturers) used to collect data at these diverse sites.
Comparison of HS VOC sensor with conventional monitoring wells
A direct push miniwell is used by the HS sensor to access groundwater. Thecomparability of water sampled for VOC contamination from direct pushminiwells to that of conventional monitoring wells was evaluated during thisdemonstration. As previously discussed, the experimental design was to pushthree HS VOC sensor penetrations at 0, 120 and 240 deg adjacent to existingconventional monitoring wells at each site. The HS VOC sensor penetrationswere screened at the same depth and interval as the conventional monitoringwells at each sampling location. The three HS VOC sensor measurements werecompared with in situ purge measurements made in the conventional well afterformation water was drawn into the well using the slow purge technique.
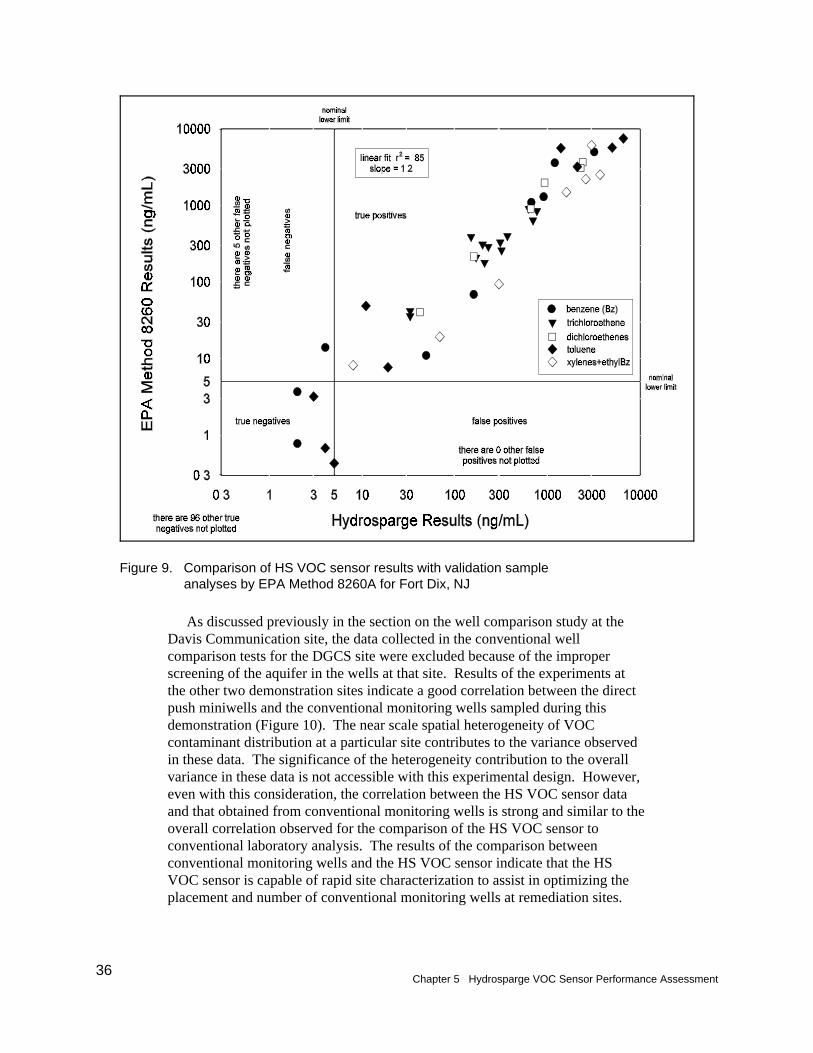
36Chapter 5 Hydrosparge VOC Sensor Performance Assessment
Figure 9. Comparison of HS VOC sensor results with validation sampleanalyses by EPA Method 8260A for Fort Dix, NJ
As discussed previously in the section on the well comparison study at theDavis Communication site, the data collected in the conventional wellcomparison tests for the DGCS site were excluded because of the improperscreening of the aquifer in the wells at that site. Results of the experiments atthe other two demonstration sites indicate a good correlation between the directpush miniwells and the conventional monitoring wells sampled during thisdemonstration (Figure 10). The near scale spatial heterogeneity of VOCcontaminant distribution at a particular site contributes to the variance observedin these data. The significance of the heterogeneity contribution to the overallvariance in these data is not accessible with this experimental design. However,even with this consideration, the correlation between the HS VOC sensor dataand that obtained from conventional monitoring wells is strong and similar to theoverall correlation observed for the comparison of the HS VOC sensor toconventional laboratory analysis. The results of the comparison betweenconventional monitoring wells and the HS VOC sensor indicate that the HSVOC sensor is capable of rapid site characterization to assist in optimizing theplacement and number of conventional monitoring wells at remediation sites.
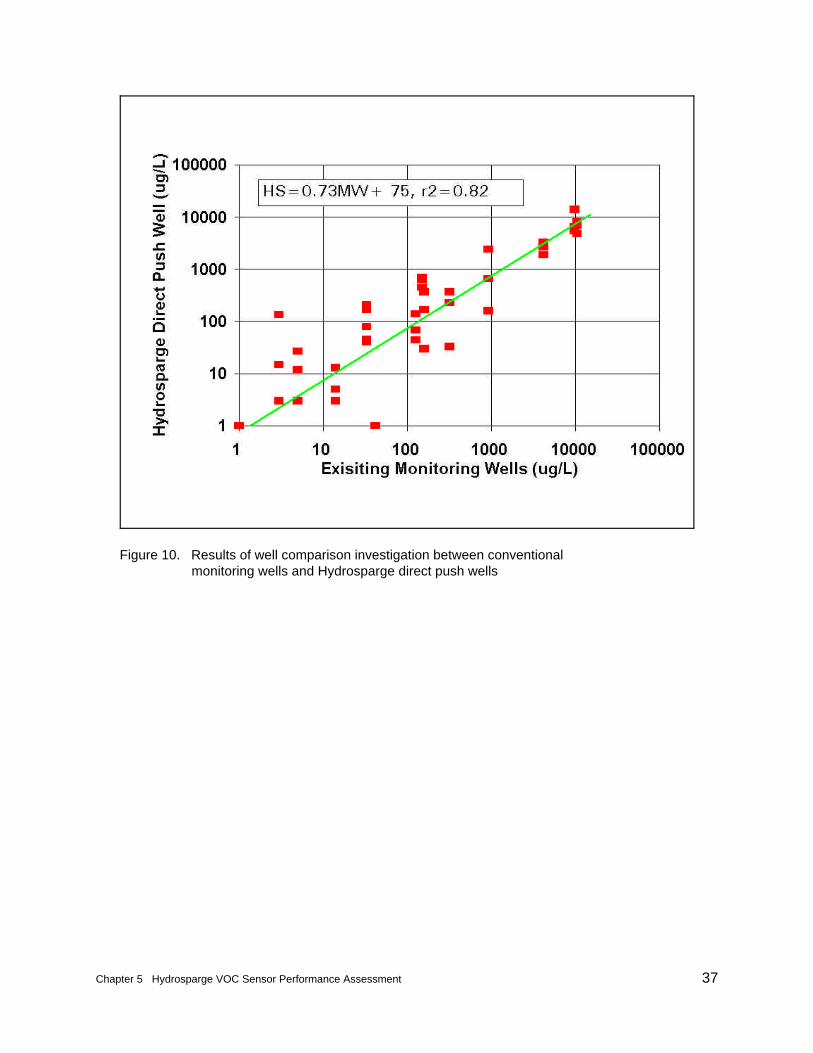
Chapter 5 Hydrosparge VOC Sensor Performance Assessment 37
Figure 10. Results of well comparison investigation between conventionalmonitoring wells and Hydrosparge direct push wells
38Chapter 6 Cost Assessment
6 Cost Assessment
HS VOC Sensor Cost Performance
The costs associated with the HS VOC sensor operation include equipmentcost for the SCAPS vehicle, expendable supplies, crew travel expenses andlabor. The cost for SCAPS field operations are well documented from previouswork performed by the ERDC SCAPS and from work performed over the pastfour years by the three Corps District SCAPS vehicles. The average cost ofoperating a SCAPS truck in the field during production work, regardless ofsensor type, is approximately $4,500 per day.
The cost per HS VOC sensor data point (unit cost) depends on the number ofsensor penetrations (unit operations) completed per day. The number ofpenetrations per day achievable at a particular site depends on site mobility,subsurface geology and depth of penetration. As previously discussed, theDSITMS analysis is very fast (<5 min per measurement). The majority of thetime associated with a unit operation of the HS VOC sensor is the time requiredto install the direct push miniwell, access groundwater and retract thepenetrometer push pipe after the DSITMS measurement is completed. Thedeeper the average penetration depth pushed at a particular site, the lower theunit production rate and the higher the unit cost. However, it should be notedthe same unit production/unit cost relationship exists for conventionalmonitoring well installation and groundwater sampling.
Production rates obtained during this demonstration were lower than ratesexpected during actual production work using the HS VOC sensor. The lowerunit production rate was partially attributed to the 100 percent verificationsampling performed for each HS VOC sensor penetration event. The timerequired for verification sampling added approximately 30 percent to the timerequired for a unit HS VOC sensor measurement.
Chapter 6 Cost Assessment 39
Cost Comparison of HS VOC Sensor to Conventional and Other Technologies
Costs associated with conventional monitoring well installation, groundwatersampling from monitoring wells, and offsite laboratory analysis are well known. The costs for conventional technologies were obtained from managers at eachdemonstration site. These costs were not always broken out in ways that couldbe related directly comparable to the HS VOC sensor technology. Forcomparison purposes, costs associated with three technologies (HS VOC sensoronsite analysis, conventional monitoring well installation and sampling withoffsite analysis, and direct push monitoring well installation with offsiteanalysis) were itemized for a similar site characterization project consisting often 30-ft pushes and the analysis of 10 samples for VOCs. A comparison of eachtechnology is summarized in Table 2.
When compared on a unit cost basis, the SCAPS HS VOC sensor withDSITMS shows a considerable cost savings to conventional groundwatermonitoring methods. In addition, the HS VOC sensor has the advantage of real-time turnaround. During several demonstrations, immediate sample turnaroundenabled the SCAPS crew to take additional samples to fill in gaps in the data set. Using conventional technology, the drill rig and sampling crew would have hadto be remobilized. This alone is a great cost savings that cannot be factored intocosts on a per unit basis.
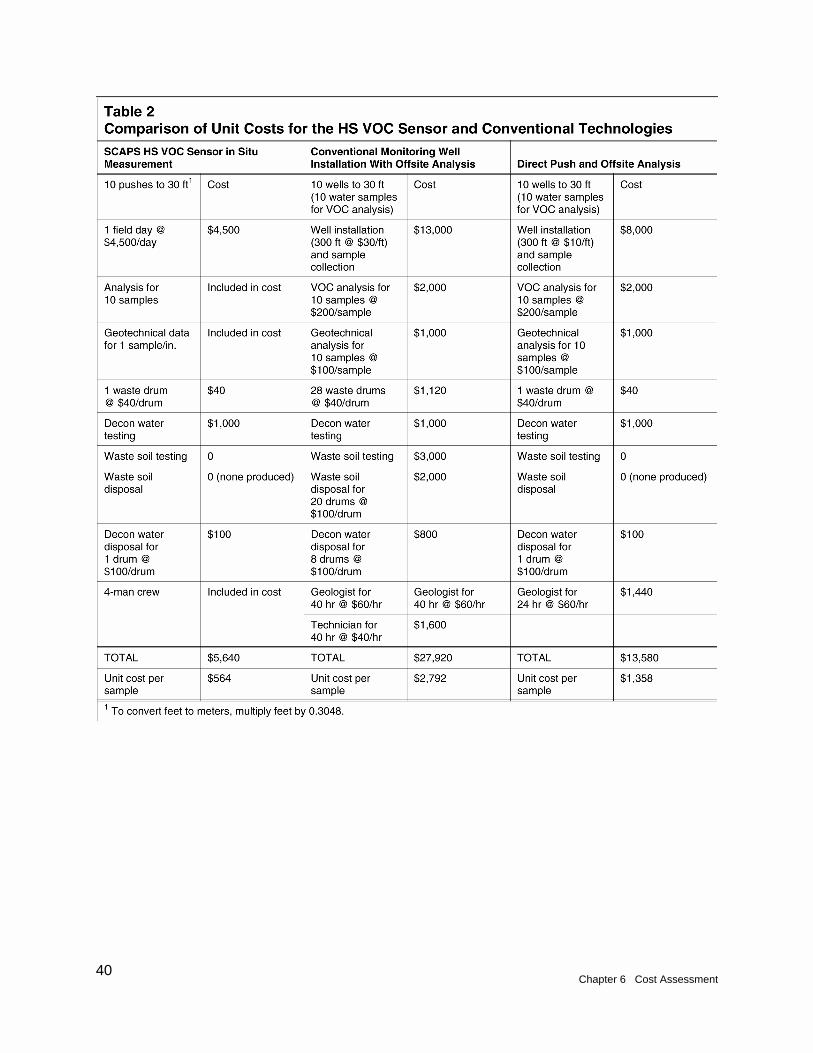
40Chapter 6 Cost Assessment
Chapter 7 Status of Regulatory Acceptance 41
7 Status of RegulatoryAcceptance
One of the objectives of this demonstration was to gather high quality datafor use in perusing regulatory acceptance of the Hydrosparge VOC sensormethod at State and Federal levels. Previous experience in the Tri-ServiceSCAPS program with regulatory acceptance of the Laser induced Fluorescence(LIF) sensor demonstrated that there is no clear path to regulatory acceptance ofinnovative environmental technologies (Lieberman 1996). Therefore, a multi-pathed approach to State and Federal regulatory acceptance was initiated early inthe demonstration.
In cooperation with Dr. Marc Wise, ORNL, the HS VOC sensor was includedwith other sample inlet devices in a draft DSITMS method submitted toU.S. EPA OSHW. The OSHW designated the draft as Draft Method 8265. Thismethod is currently under review for inclusion in the next revision of “Testmethods for evaluating solid and hazardous waste, SW 846” (U.S. EPA 1995). Drs. Wise and Davis defended the method before the Organic Methods WorkingGroup at the annual methods review meeting in July 1997. Since that review,EPA has been provided additional data in support of Method 8265 performance.
The HS VOC sensor is currently under review by the California EPADepartment of Toxic Substances Control (DTSC) under the state HazardousWaste Environmental Technology Certification Program. The agreement forevaluation was initiated in July 1997 and was ongoing at the time of reportpublication. The evaluation process included high level data validation of boththe HS VOC sensor data sets and laboratory validation data sets. In addition,representatives of the California EPA DTSC reviewed the Davis Communicationsite demonstration plan, provided comments before the demonstration wasinitiated, and observed the field operation of the HS VOC sensor at the Davissite. No obstacles are anticipated in receiving regulatory certification of the HSVOC sensor method for field screening operation.
The final effort for regulatory acceptance of the HS VOC sensor method wasparticipation in evaluation of the technology by the ITRC workgroup. The SiteCharacterization Subtask Committee (SCSC) attended multiple deployments ofthe HS VOC sensor (Davis Communication site, CA, and Fort Dix, NJ) to

42Chapter 7 Status of Regulatory Acceptance
observe firsthand the field operation of the HS VOC Sensor. The SCSC wasalso allowed to review and provide comments on demonstration work plans forthe Davis Communication site demonstration and was provided HS VOC sensordata sets for review in evaluating the technology for field screening application. In January 1998 the SCSC endorsed the HS VOC sensor for field screening ofVOC contaminants in groundwater (ITRC 1997).
The multi-pathed approach to State and Federal Regulatory acceptance hasworked well during the HS VOC sensor demonstration. The acceptance of thetechnology by local regulators has been adequate to allow the three Corpsdistrict SCAPS programs to use HS VOC sensor technology extensively sincetransition began in August 1996.
Chapter 8 Technology Implementation 43
8 TechnologyImplementation
DoD Requirements for VOC Site Characterization
A large number of sites at DoD installations are known to be contaminatedwith volatile organic compounds including chlorinated solvents (also known asdense nonaqueous phase liquids, DNAPL) and BTEX. The U.S. EPA surveyedsite remediation needs within Federal and State agencies and determined that8,300 DoD sites require remediation at 2,000 installations. Of the reported sites,65 percent contained VOCs (5,395 VOC sites) (Happel, Beckenbach, andHalden 1997).
There is a high probability that new sites will be discovered as well as knownsites that require additional investigation during remediation activities. Also,there is the potential for new VOC contaminants that are applicable toinvestigation (i.e., methyl tert-butyl ether (MTBE), an oxygenate additive tounleaded petroleum products). The high toxicity of MTBE has lead toheightened concern over groundwater contaminated from leaking undergroundstorage tanks (Laurence Livermore National Laboratory 1998). Preliminarylaboratory studies at ERDC have indicated that the HS VOC sensor is capable ofdetecting MTBE at low concentrations in groundwater.
Hydrosparge VOC Sensor Transition
The HS VOC sensor technology has been fully transitioned to Corps Districtsthat operate SCAPS vehicles, which include Kansas City, Tulsa, and SavannahDistricts. Two of the Districts, Tulsa and Savannah, own DSITMS instrumentsand have trained chemists operating the HS VOC sensor during field operations. The ERDC HS VOC sensor developers in coordination with ORNL have trainedthe Tulsa and Savannah District chemists in the operation and data interpretationof the HS VOC sensor. The Kansas City District contracts with ORNL forDSITMS equipment and operators on a project-by-project basis.
44Chapter 8 Technology Implementation
Since the initial transition of the first DSITMS to the Savannah DistrictSCAPS team following the HS VOC sensor Bush River demonstration in August1996, the three Corps SCAPS District SCAPS teams have performed more than 1,000 HS VOC sensor measurements at numerous DoD installations (Army,Navy, and Air Force facilities) throughout the continental United States. Inaddition to DoD installations, the Savannah District SCAPS program recentlyperformed a HS VOC sensor site characterization at an abandoned industrial sitein Cowpens, SC, under the U.S. EPA Brownfield Demonstration Program.
Although the successful transition of the HS VOC sensor technology to theCorps SCAPS District programs has reduced site characterization costs at DoDinstallations, ultimate transition to private industry has been prevented by thelack of a commercially available DSITMS and associated interfaces. The ORNLpatented DSITMS interfaces have been licensed to Teledyne ElectronicTechnologies (TET). However, TET chose not to market the interfaces whenthey chose not to complete the commercial development of a DSITMS. Commercial ion trap mass spectrometers are available (e.g., Finnigan/ThermoQuest ITMS 40 and Varian Instruments Saturn 2000 ITMS) that can bemodified to accept the ORNL interfaces.
A number of private industry parties have expressed an interest in obtainingHS VOC sensor technology including environmental researchers from PhillipsPetroleum and Shell Oil Corp. Also, the HS VOC sensor was demonstrated in acommercial Fugro Geosciences cone penetrometer vehicle at Whiting FieldNaval Air Station in April 1997. Fugro Geosciences has expressed interest inthe technology. Varian Instruments, Inc. has expressed an interest in developinga modified Saturn 2000 ITMS as a field deployable DSITMS. The U.S. ArmyEnvironmental Center is leading an effort to fund the Varian Instrumentsproposal for a TRP project under the Defense Advanced Research ProjectAgency (DARPA). Execution of a TRP project with Varian Instruments willfacilitate the commercial availability of the DSTIMS and ORNL sample inletsand will greatly increase the acceptance of the HS VOC sensor by commercialenvironmental consulting firms. Commercialization of HS VOC sensortechnology will lead to increased application of the technology and will reducethe cost of site characterization and cleanup at DoD and non-DoD sites.
Chapter 9 Lessons Learned 45
9 Lessons Learned
The most significant lessons learned in this demonstration relate to regulatoryacceptance. As discussed earlier, previous experience within the Tri-ServiceSCAPS program indicated that no clear path existed for regulatory acceptance ofinnovative environmental technology. The multi-pathed approach to State andFederal regulatory acceptance has worked well. However, the process is verytime consuming and slow. Sensor verification/demonstrations with significantemphasis on regulatory acceptance should involve Federal and State regulatoryagencies at the beginning the project. Also, project managers should notunderestimate the amount of time and cost required for regulatory certificationtasks.
46References
References
ABB Environmental Services, Inc. (1996). “Remedial investigation/feasibilitystudy Fort Dix U.S. Army Installation Fort Dix, NJ,” ABB EnvironmentalServices, Inc., Portland, ME.
American Public Health Association. (1989a). “Standard methods forexamination of water and wastewater,” Methods 205 Conductivity.
__________. (1989b). “Standard methods for examination of water andwastewater,” Methods 423 pH Value.
American Society for Testing and Material (ASTM). (1995). “Standard testmethod for deep, quasi-static, cone and friction-cone penetration tests ofsoil,” ASTM 04.08 (D-3441), West Conshohocken, PA.
CH2M Hill. (1994). “Remedial investigation/feasibility study, Davis GlobalCommunication site,” prepared for McClellan Air Force Base, CA.
Davis, W. M., Powell, J. F., Miller, S. M., and Swartzel, S. P. (1997). “SCAPSinvestigation of chlorinated volatile organic compounds in groundwater atBuilding 525, Aberdeen Proving Ground, MD,” Technical Report EL-97-18,U.S. Army Engineer Waterways Experiment Station, Vicksburg, MS.
Davis, W. M., Wise, M. B., Furey, J. S., and Thompson, C. V. (1998a). “Rapiddetection of volatile organic compounds in groundwater by in situ purge anddirect sampling ion trap mass spectrometry,” Field Analytical Chemistry andTechnology 2, 86-96.
Davis, W. M., Furey, J. S., and Porter, B. (1998b). “Field screening of VOCs ingroundwater using the hydrosparge VOC sensor,” Current Protocols inField Analytical Chemistry, V. Lopez-Avila, ed., J. Wiley and Sons, Inc.,New York, NY, 1C.4., 1-10.
General Physics Corp. (1995). “Shallow groundwater monitoring wellinstallation report for clusters 18, 35 and 36 of the Bush River study area,Edgewood, MD,” Columbia, MD.
References 47
Happel, A. M., Beckenbach, E. H., and Halden, R. U. (1997). “Cleaning up thenation’s wastes sites: Markets and technology trends, 1996 Edition,”U.S. Environmental Protection Agency Office of Solid Waste andEmergency Response, EPA-542-F-97-010, Washington, DC.
Interstate Technology and Regulatory Cooperation. (1997). “Multi-stateevaluation of the site characterization and analysis penetrometer systemvolatile organic compound (SCAPS-VOC) sensing technologies.”
Koester, J. P., Lee, L. T., Powell, J. F., and Goodson, R. (1994). “Operationsmanual for the site characterization and anlysis penetrometer system(SCAPS),” U.S. Army Engineer Waterways Experiment Station, Vicksburg,MS.
Lawrence Livermore National Laboratory. (1998). “An evaluation of MTBEimpacts to California groundwater resources,” UCRL-AR-130897.
Lieberman, S. (1996). “Site characterization and analysis penetrometer system(SCAPS) validation technology demonstration report.” EnvironmentalSecurity Technology Certification Program (ESTCP) Final Report,U.S. Army Engineer Waterways Experiment Station, Vicksburg, MS.
U.S. Environmental Protection Agency. (1994). Draft Method 8265: Volatilesin Water, Soil, and Air by Direct Sampling Ion Trap Mass Spectrometry. “Test methods for evaluating solid waste; physical/chemical methods, SW-846,” Washington, DC.
__________. (1995). “Test methods for evaluating solid waste; Physical/chemical methods, SW-846 Third Edition,” Washington, DC.
U.S. Army Corps of Engineer Waterways Experiment Station. (1996a). “Tri-service site characterization and analysis penetrometer system (SCAPS)validation at Bush River study area, Edgewood area, Aberdeen ProvingGround, MD,” unpublished Technology Demonstration Plan, Vicksburg,MS.
__________. (1996b). “Tri-service site characterization and analysispenetrometer system (SCAPS) validation at McClellan Air Force Base, CA,” unpublished Technology Demonstration Plan, Vicksburg, MS.
__________. (1997). “Tri-service site characterization and analysispenetrometer system (SCAPS) validation at Cold Regions Research andEngineering Laboratory, NH and Fort Dix, NJ,” unpublished TechnologyDemonstration Plan, Vicksburg, MS.
Wise, M. B., and Guerin, M. R. (1997a). “Direct sampling MS forenvironmental screening,” Analytical Chemistry 69, 26A-32A.
48References
Wise, M. B., Thompson, C. V., Merriweather, R., and Guerin, M. R. (1997b). “Review of direct MS analysis of environmental samples,” Field AnalyticalChemistry and Technology 1, 251-276.
Appendix A Points of Contact A1
Appendix APoints of Contact
List of Demonstration Participants:
Mr. George Robitaille, Project LeadU.S. Army Environmental CenterTechnical Support DivisionCETHA-TS-CAberdeen Proving Ground, MD 21020-5401(410) 612-6865 FAX (410) 612-6836E-Mail: [email protected]
Dr. William Davis, ERDC Project ManagerU.S. Army Engineer Research and Development CenterEnvironmental Processes and Effect BranchVicksburg, MS 39180(601) 634-0627 FAX: (601) 634-3410E-Mail: [email protected]
Dr. Marc WiseChemical and Analytical Sciences DivisionOak Ridge National LaboratoryBethel Valley Rd.Bldg. 4500-s, Room s-139Oak Ridge, TN 37831-6120(615) 574-4861 FAX (615) 576-7956E-Mail: [email protected]
A2Appendix A Points of Contact
Interstate Technology Regulatory Cooperation Accelerated Site Characterization Subtask Committee Chair
Mr. John PrendergrastNew Jersey Department of Environmental Protection401 East State StreetTrenton, NJ 08625(609) 984-9757E-mail: [email protected]
Appendix B HS Site Data Summary Tables B1
Appendix BHS Site Data Summary Tables
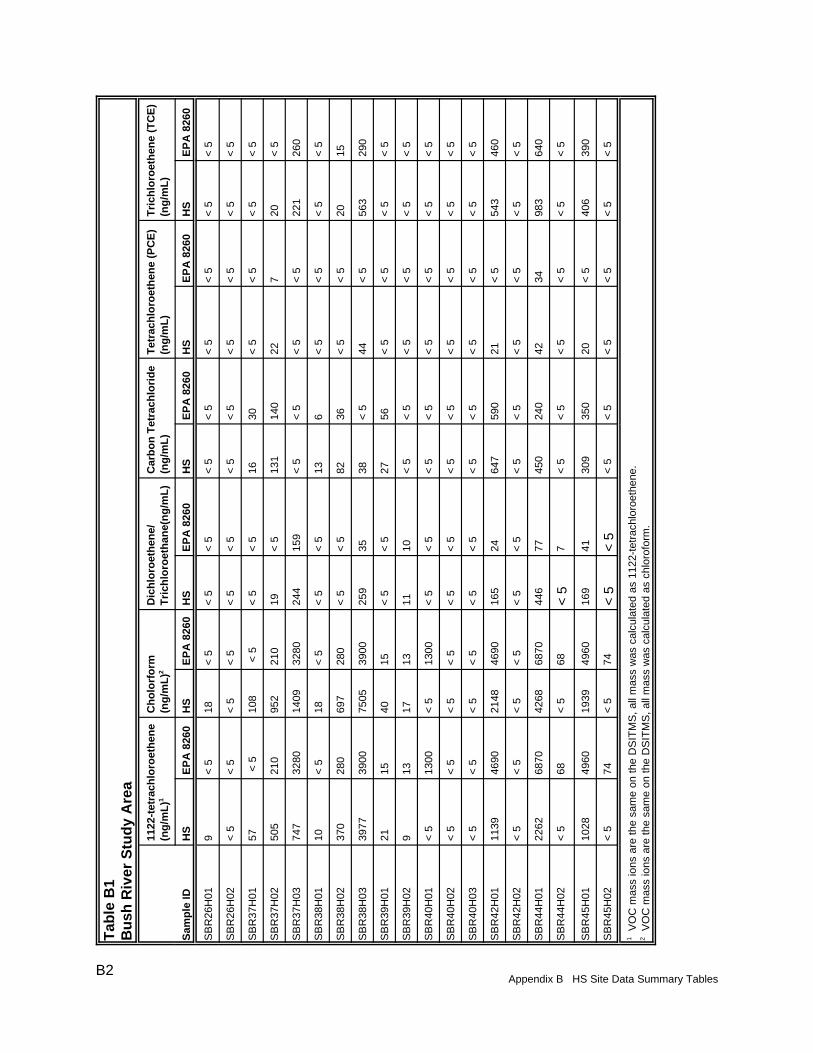
B2Appendix B HS Site Data Summary Tables
Tab
le B
1B
ush
Riv
er S
tud
y A
rea
1122
-tet
rach
loro
eth
ene
(ng
/mL
)1C
ho
lorf
orm
(ng
/mL
)2D
ich
loro
eth
ene/
Tri
chlo
roet
han
e(n
g/m
L)
Car
bo
n T
etra
chlo
rid
e(n
g/m
L)
Tet
rach
loro
eth
ene
(PC
E)
(ng
/mL
)T
rich
loro
eth
ene
(TC
E)
(ng
/mL
)
Sam
ple
IDH
S
EP
A 8
260
HS
EP
A 8
260
HS
EP
A 8
260
HS
EP
A 8
260
HS
EP
A 8
260
HS
EP
A 8
260
SB
R26
H01
9<
518
< 5
< 5
< 5
< 5
< 5
< 5
< 5
< 5
< 5
SB
R26
H02
< 5
< 5
< 5
< 5
< 5
< 5
< 5
< 5
< 5
< 5
< 5
< 5
SB
R37
H01
57 <
510
8 <
5<
5<
516
30<
5<
5<
5<
5
SB
R37
H02
505
210
952
210
19<
513
114
022
720
< 5
SB
R37
H03
747
3280
1409
3280
244
159
< 5
< 5
< 5
< 5
221
260
SB
R38
H01
10<
518
< 5
< 5
< 5
136
< 5
< 5
< 5
< 5
SB
R38
H02
370
280
697
280
< 5
< 5
8236
< 5
< 5
2015
SB
R38
H03
3977
3900
7505
3900
259
3538
< 5
44<
556
329
0
SB
R39
H01
2115
4015
< 5
< 5
2756
< 5
< 5
< 5
< 5
SB
R39
H02
913
1713
1110
< 5
< 5
< 5
< 5
< 5
< 5
SB
R40
H01
< 5
1300
< 5
1300
< 5
< 5
< 5
< 5
< 5
< 5
< 5
< 5
SB
R40
H02
< 5
< 5
< 5
< 5
< 5
< 5
< 5
< 5
< 5
< 5
< 5
< 5
SB
R40
H03
< 5
< 5
< 5
< 5
< 5
< 5
< 5
< 5
< 5
< 5
< 5
< 5
SB
R42
H01
1139
4690
2148
4690
165
2464
759
021
< 5
543
460
SB
R42
H02
< 5
< 5
< 5
< 5
< 5
< 5
< 5
< 5
< 5
< 5
< 5
< 5
SB
R44
H01
2262
6870
4268
6870
446
7745
024
042
3498
364
0
SB
R44
H02
< 5
68<
568
< 5
7<
5<
5<
5<
5<
5<
5
SB
R45
H01
1028
4960
1939
4960
169
4130
935
020
< 5
406
390
SB
R45
H02
< 5
74<
574
< 5
< 5
< 5
< 5
< 5
< 5
< 5
< 5
1 VO
C m
ass
ions
are
the
sam
e on
the
DS
ITM
S, a
ll m
ass
was
cal
cula
ted
as 1
122-
tetr
achl
oroe
then
e.2 V
OC
mas
s io
ns a
re th
e sa
me
on th
e D
SIT
MS
, all
mas
s w
as c
alcu
late
d as
chl
orof
orm
.
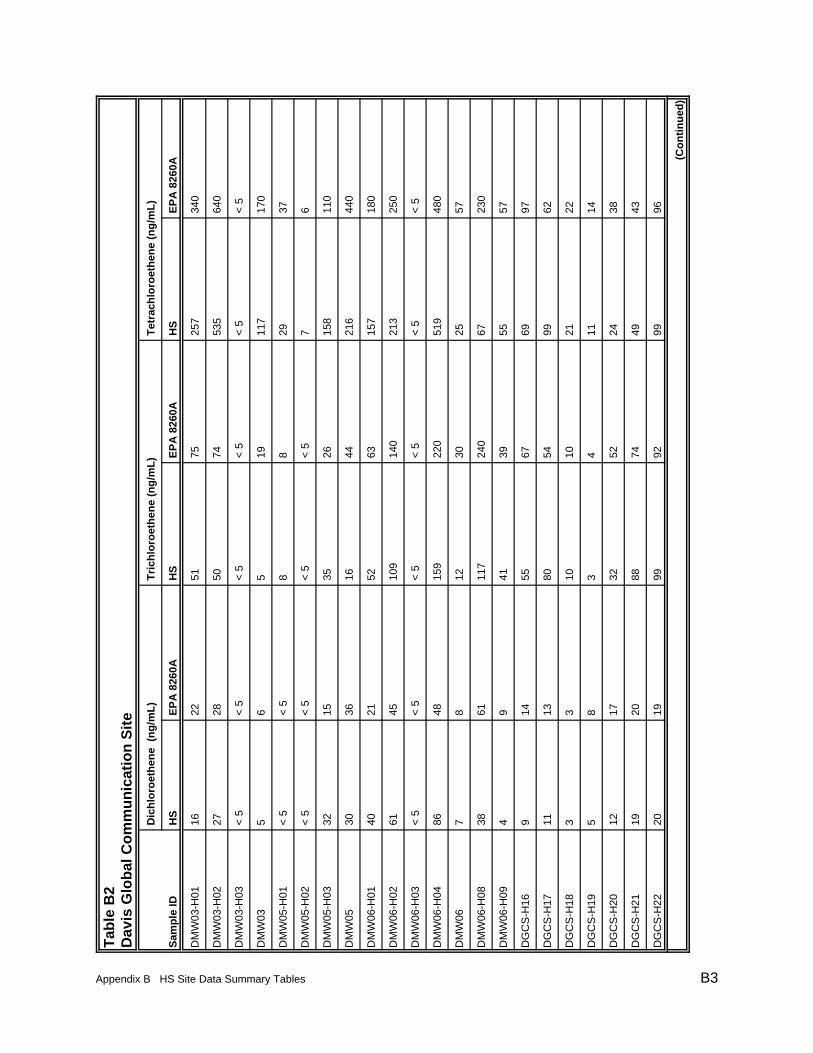
Appendix B HS Site Data Summary Tables B3
Tab
le B
2D
avis
Glo
bal
Co
mm
un
icat
ion
Sit
e
Dic
hlo
roet
hen
e (
ng
/mL
)T
rich
loro
eth
ene
(ng
/mL
)T
etra
chlo
roet
hen
e (n
g/m
L)
Sam
ple
IDH
SE
PA
826
0A
HS
EP
A 8
260A
H
SE
PA
826
0A
DM
W03
-H01
1622
5175
257
340
DM
W03
-H02
2728
5074
535
640
DM
W03
-H03
< 5
< 5
< 5
< 5
< 5
< 5
DM
W03
56
519
117
170
DM
W05
-H01
< 5
< 5
88
2937
DM
W05
-H02
< 5
< 5
< 5
< 5
76
DM
W05
-H03
3215
3526
158
110
DM
W05
3036
1644
216
440
DM
W06
-H01
4021
5263
157
180
DM
W06
-H02
6145
109
140
213
250
DM
W06
-H03
< 5
< 5
< 5
< 5
< 5
< 5
DM
W06
-H04
86
4815
922
051
948
0
DM
W06
78
1230
2557
DM
W06
-H08
3861
117
240
6723
0
DM
W06
-H09
49
4139
5557
DG
CS
-H16
914
5567
6997
DG
CS
-H17
1113
8054
9962
DG
CS
-H18
33
1010
2122
DG
CS
-H19
58
34
1114
DG
CS
-H20
1217
3252
2438
DG
CS
-H21
1920
8874
4943
DG
CS
-H22
2019
9992
9996
(Co
nti
nu
ed)
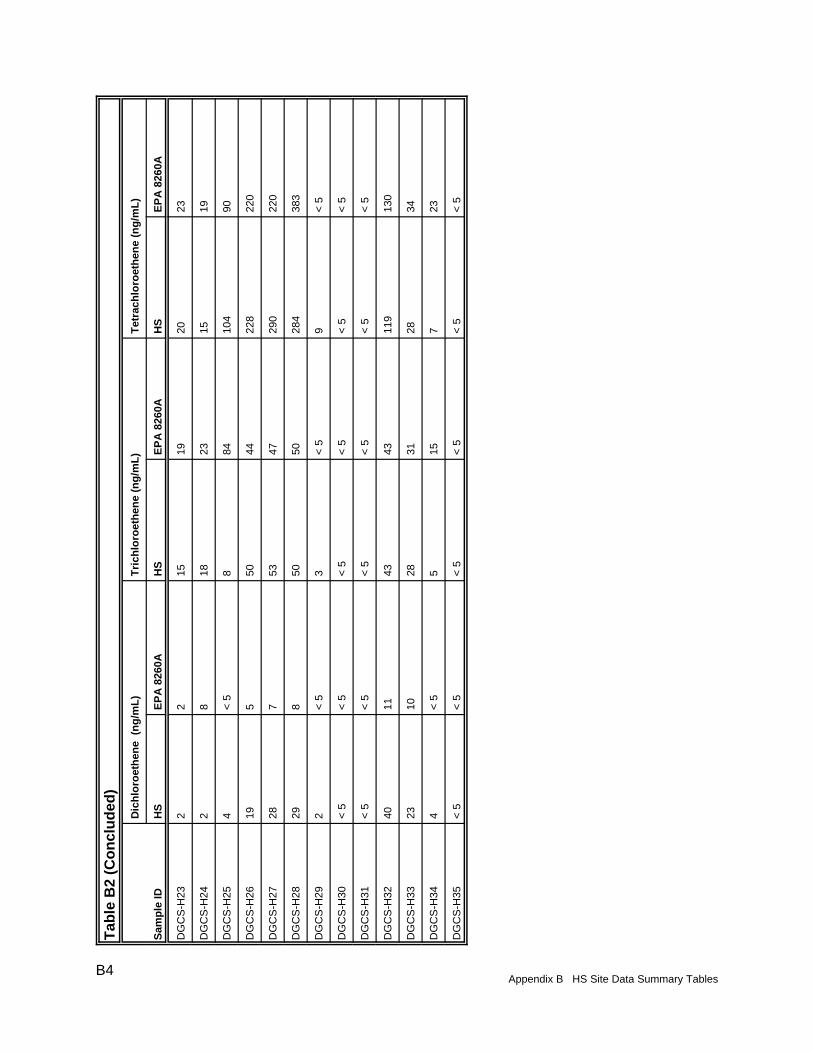
B4Appendix B HS Site Data Summary Tables
Tab
le B
2 (C
on
clu
ded
)
Dic
hlo
roet
hen
e (
ng
/mL
)T
rich
loro
eth
ene
(ng
/mL
)T
etra
chlo
roet
hen
e (n
g/m
L)
Sam
ple
IDH
SE
PA
826
0A
HS
EP
A 8
260A
H
SE
PA
826
0A
DG
CS
-H23
22
1519
2023
DG
CS
-H24
28
1823
1519
DG
CS
-H25
4<
58
8410
490
DG
CS
-H26
195
5044
228
220
DG
CS
-H27
287
5347
290
220
DG
CS
-H28
298
5050
284
383
DG
CS
-H29
2<
53
< 5
9<
5
DG
CS
-H30
< 5
< 5
< 5
< 5
< 5
< 5
DG
CS
-H31
< 5
< 5
< 5
< 5
< 5
< 5
DG
CS
-H32
4011
4343
119
130
DG
CS
-H33
2310
2831
2834
DG
CS
-H34
4<
55
157
23
DG
CS
-H35
< 5
< 5
< 5
< 5
< 5
< 5
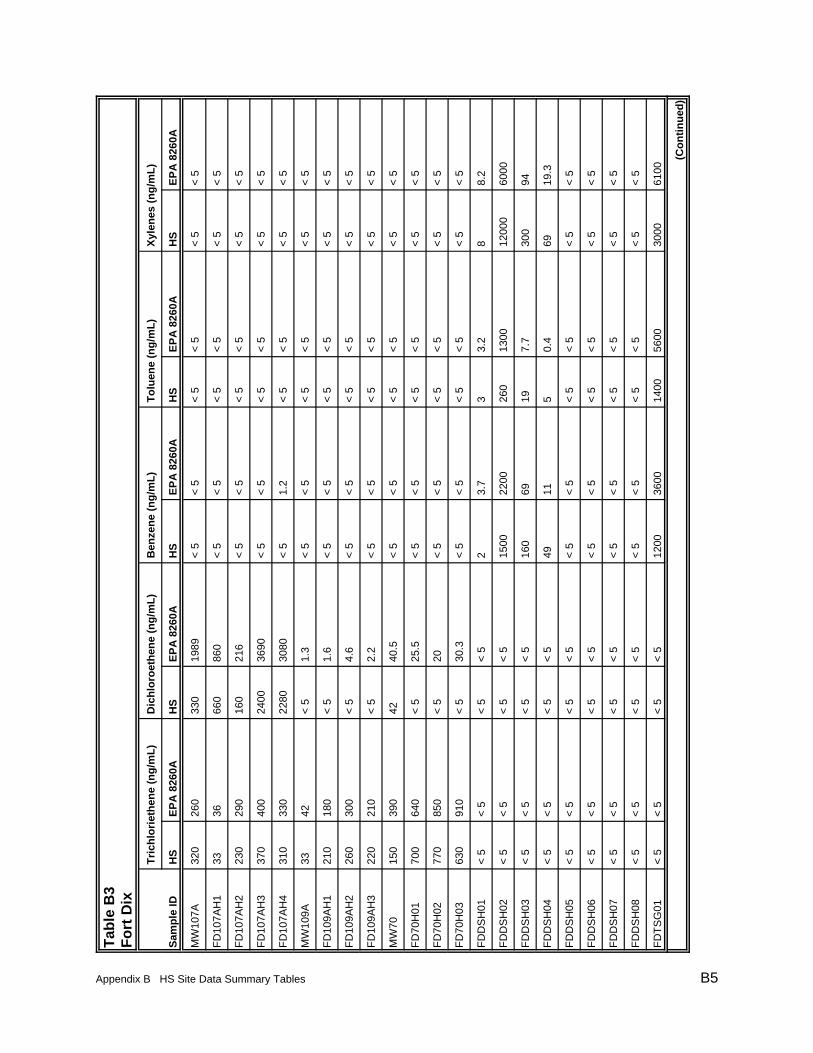
Appendix B HS Site Data Summary Tables B5
Tab
le B
3F
ort
Dix
Tri
chlo
riet
hen
e (n
g/m
L)
Dic
hlo
roet
hen
e (n
g/m
L)
Ben
zen
e (n
g/m
L)
To
luen
e (n
g/m
L)
Xyl
enes
(n
g/m
L)
Sam
ple
IDH
SE
PA
826
0AH
SE
PA
826
0AH
SE
PA
826
0AH
SE
PA
826
0AH
SE
PA
826
0A
MW
107A
320
260
330
1989
< 5
< 5
< 5
< 5
< 5
< 5
FD
107A
H1
3336
660
860
< 5
< 5
< 5
< 5
< 5
< 5
FD
107A
H2
230
290
160
216
< 5
< 5
< 5
< 5
< 5
< 5
FD
107A
H3
370
400
2400
3690
< 5
< 5
< 5
< 5
< 5
< 5
FD
107A
H4
310
330
2280
3080
< 5
1.2
< 5
< 5
< 5
< 5
MW
109A
3342
< 5
1.3
< 5
< 5
< 5
< 5
< 5
< 5
FD
109A
H1
210
180
< 5
1.6
< 5
< 5
< 5
< 5
< 5
< 5
FD
109A
H2
260
300
< 5
4.6
< 5
< 5
< 5
< 5
< 5
< 5
FD
109A
H3
220
210
< 5
2.2
< 5
< 5
< 5
< 5
< 5
< 5
MW
7015
039
042
40.5
< 5
< 5
< 5
< 5
< 5
< 5
FD
70H
0170
064
0<
525
.5<
5<
5<
5<
5<
5<
5
FD
70H
0277
085
0<
520
< 5
< 5
< 5
< 5
< 5
< 5
FD
70H
0363
091
0<
530
.3<
5<
5<
5<
5<
5<
5
FD
DS
H01
< 5
< 5
< 5
< 5
23.
73
3.2
88.
2
FD
DS
H02
< 5
< 5
< 5
< 5
1500
2200
260
1300
1200
060
00
FD
DS
H03
< 5
< 5
< 5
< 5
160
6919
7.7
300
94
FD
DS
H04
< 5
< 5
< 5
< 5
4911
50.
469
19.3
FD
DS
H05
< 5
< 5
< 5
< 5
< 5
< 5
< 5
< 5
< 5
< 5
FD
DS
H06
< 5
< 5
< 5
< 5
< 5
< 5
< 5
< 5
< 5
< 5
FD
DS
H07
< 5
< 5
< 5
< 5
< 5
< 5
< 5
< 5
< 5
< 5
FD
DS
H08
< 5
< 5
< 5
< 5
< 5
< 5
< 5
< 5
< 5
< 5
FD
TS
G01
< 5
< 5
< 5
< 5
1200
3600
1400
5600
3000
6100
(Co
nti
nu
ed)
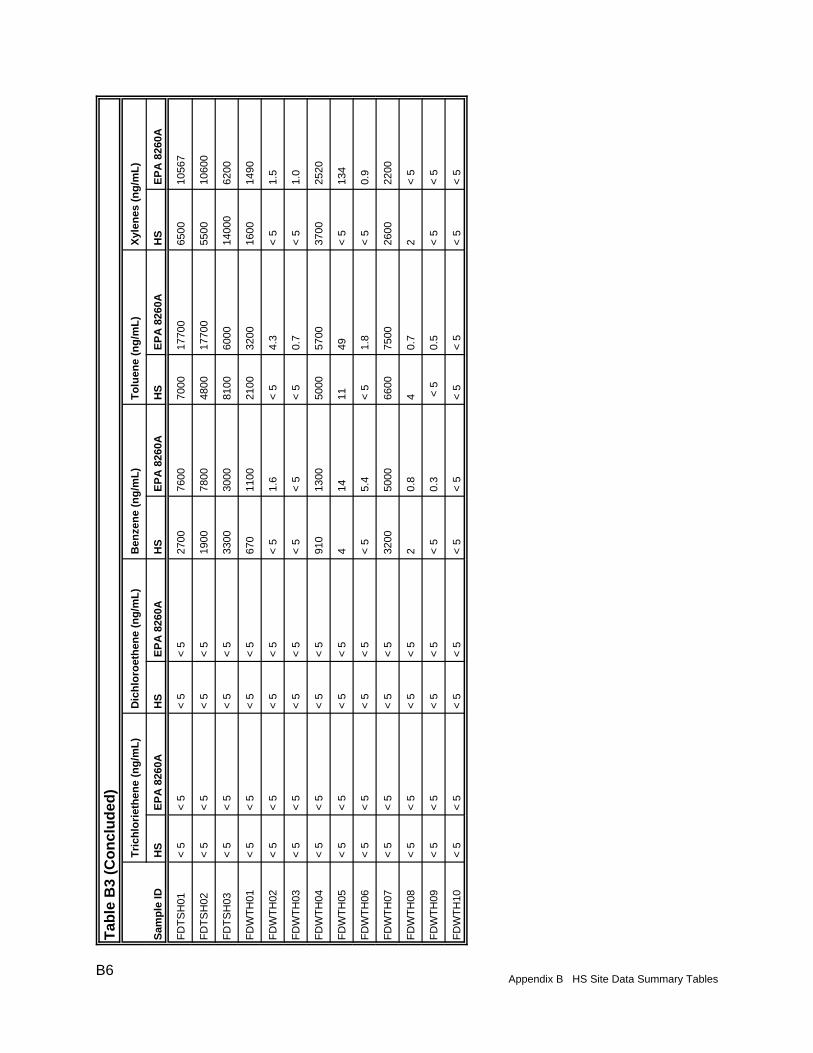
B6Appendix B HS Site Data Summary Tables
Tab
le B
3 (C
on
clu
ded
)
Tri
chlo
riet
hen
e (n
g/m
L)
Dic
hlo
roet
hen
e (n
g/m
L)
Ben
zen
e (n
g/m
L)
To
luen
e (n
g/m
L)
Xyl
enes
(n
g/m
L)
Sam
ple
IDH
SE
PA
826
0AH
SE
PA
826
0AH
SE
PA
826
0AH
SE
PA
826
0AH
SE
PA
826
0A
FD
TS
H01
< 5
< 5
< 5
< 5
2700
7600
7000
1770
065
0010
567
FD
TS
H02
< 5
< 5
< 5
< 5
1900
7800
4800
1770
055
0010
600
FD
TS
H03
< 5
< 5
< 5
< 5
3300
3000
8100
6000
1400
062
00
FD
WT
H01
< 5
< 5
< 5
< 5
670
1100
2100
3200
1600
1490
FD
WT
H02
< 5
< 5
< 5
< 5
< 5
1.6
< 5
4.3
< 5
1.5
FD
WT
H03
< 5
< 5
< 5
< 5
< 5
< 5
< 5
0.7
< 5
1.0
FD
WT
H04
< 5
< 5
< 5
< 5
910
1300
5000
5700
3700
2520
FD
WT
H05
< 5
< 5
< 5
< 5
414
1149
< 5
134
FD
WT
H06
< 5
< 5
< 5
< 5
< 5
5.4
< 5
1.8
< 5
0.9
FD
WT
H07
< 5
< 5
< 5
< 5
3200
5000
6600
7500
2600
2200
FD
WT
H08
< 5
< 5
< 5
< 5
20.
84
0.7
2<
5
FD
WT
H09
< 5
< 5
< 5
< 5
< 5
0.3
< 5
0.5
< 5
< 5
FD
WT
H10
< 5
< 5
< 5
< 5
< 5
< 5
< 5
< 5
< 5
< 5
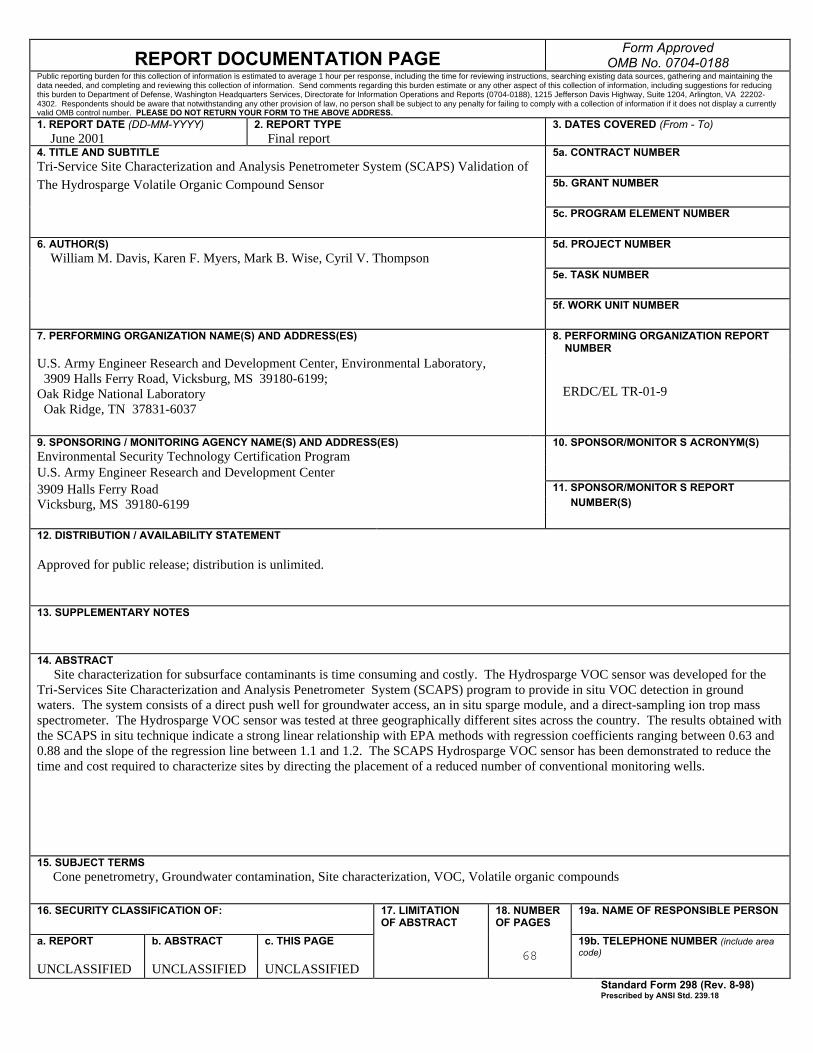
REPORT DOCUMENTATION PAGEForm Approved
OMB No. 0704-0188Public reporting burden for this collection of information is estimated to average 1 hour per response, including the time for reviewing instructions, searching existing data sources, gathering and maintaining thedata needed, and completing and reviewing this collection of information. Send comments regarding this burden estimate or any other aspect of this collection of information, including suggestions for reducingthis burden to Department of Defense, Washington Headquarters Services, Directorate for Information Operations and Reports (0704-0188), 1215 Jefferson Davis Highway, Suite 1204, Arlington, VA 22202-4302. Respondents should be aware that notwithstanding any other provision of law, no person shall be subject to any penalty for failing to comply with a collection of information if it does not display a currentlyvalid OMB control number. PLEASE DO NOT RETURN YOUR FORM TO THE ABOVE ADDRESS.
1. REPORT DATE (DD-MM-YYYY) June 2001
2. REPORT TYPE Final report
3. DATES COVERED (From - To)
4. TITLE AND SUBTITLETri-Service Site Characterization and Analysis Penetrometer System (SCAPS) Validation of
5a. CONTRACT NUMBER
The Hydrosparge Volatile Organic Compound Sensor 5b. GRANT NUMBER
5c. PROGRAM ELEMENT NUMBER
6. AUTHOR(S) William M. Davis, Karen F. Myers, Mark B. Wise, Cyril V. Thompson
5d. PROJECT NUMBER
5e. TASK NUMBER
5f. WORK UNIT NUMBER
7. PERFORMING ORGANIZATION NAME(S) AND ADDRESS(ES) 8. PERFORMING ORGANIZATION REPORT NUMBER
U.S. Army Engineer Research and Development Center, Environmental Laboratory, 3909 Halls Ferry Road, Vicksburg, MS 39180-6199;Oak Ridge National Laboratory Oak Ridge, TN 37831-6037
ERDC/EL TR-01-9
9. SPONSORING / MONITORING AGENCY NAME(S) AND ADDRESS(ES) 10. SPONSOR/MONITOR’S ACRONYM(S)Environmental Security Technology Certification ProgramU.S. Army Engineer Research and Development Center3909 Halls Ferry Road 11. SPONSOR/MONITOR’S REPORT
Vicksburg, MS 39180-6199 NUMBER(S)
12. DISTRIBUTION / AVAILABILITY STATEMENT
Approved for public release; distribution is unlimited.
13. SUPPLEMENTARY NOTES
14. ABSTRACT Site characterization for subsurface contaminants is time consuming and costly. The Hydrosparge VOC sensor was developed for theTri-Services Site Characterization and Analysis Penetrometer System (SCAPS) program to provide in situ VOC detection in groundwaters. The system consists of a direct push well for groundwater access, an in situ sparge module, and a direct-sampling ion trop massspectrometer. The Hydrosparge VOC sensor was tested at three geographically different sites across the country. The results obtained withthe SCAPS in situ technique indicate a strong linear relationship with EPA methods with regression coefficients ranging between 0.63 and0.88 and the slope of the regression line between 1.1 and 1.2. The SCAPS Hydrosparge VOC sensor has been demonstrated to reduce thetime and cost required to characterize sites by directing the placement of a reduced number of conventional monitoring wells.
15. SUBJECT TERMS Cone penetrometry, Groundwater contamination, Site characterization, VOC, Volatile organic compounds
16. SECURITY CLASSIFICATION OF: 17. LIMITATIONOF ABSTRACT
18. NUMBEROF PAGES
19a. NAME OF RESPONSIBLE PERSON
a. REPORT
UNCLASSIFIED
b. ABSTRACT
UNCLASSIFIED
c. THIS PAGE
UNCLASSIFIED68
19b. TELEPHONE NUMBER (include areacode)
Standard Form 298 (Rev. 8-98)Prescribed by ANSI Std. 239.18


Destroy this report when no longer needed. Do not return it to the originator.
