twin city fire insurance company and reported (sch p, pt 5) 87 summary investment schedule 15...
TRANSCRIPT

ANNUAL STATEMENTOF THE
TWIN CITY FIRE INSURANCECOMPANY
Of
Indianapolis
in the state of IN
to the Insurance Departmentof the State of
For the Year EndedDecember 31, 2002

INDEX TO THE PROPERTY & CASUALTY ANNUAL STATEMENT
Accident and Health Exhibit (SCH H) 46 Organization Chart (SCH Y, PT 1) 109
Aggregate Statement and Fair Values of Bonds and Preferred Stock (SCH DM) E23 Other Long-Term Invested Assets (SCH BA) E06
Analysis of Losses and Loss Expenses (SCH P) 49 Overflow Page for Write-ins 112
Analysis of Nonadmitted Assets and Related Items (EX 1) 13 Portfolio Reinsurance (SCH F, PT2) 39
Assets (Admitted) 2 Preferred Stock (SCH D, PT 2, SN 1) E09
Assumed Reinsurance (SCH F, PT 1) 38 Preferred Stock, Aggregate Statement and Fair Values (SCH DM) E23
Bonds (SCH D, PT 1) E08 Premiums Earned (PT 1) 6
Bonds – Aggregate Statement and Fair Values (SCH DM) E23 Premiums Written (PT 1B) 8
Bonds – Quality and Maturity Distribution of All Bonds at Statement Values and Real Estate (SCH A) E01
by Major Types of Issues and NAIC Designations (SCH D, PT 1A, SN 1) 27 Recapitulation of All Premiums (Unearned Premiums) (PT 1A) 7
Bonds – Maturity Distribution of All Bonds at Statement Values by Major Type Reinsurance (SCH F) 38
And Subtype of Issues (SCH D, PT 1A, SN2) 30 Replicated (Synthetic) Assets (SCH DB, PT F) 36
Capital and Surplus Account 4 Schedule E – Part 2 – Special Deposits E25
Capital Gains and (Losses) on Investments (PT 1A) 6 Schedule P Interrogatories 107
Cash (SCH E, PT 1) E24 Schedules:
Cash Flow 5 A - Real Estate E01
Ceded Reinsurance (SCH F, PT 3) 40 B - Mortgage Loans E04
Collar, Swap and Forward Agreements (SCH DB, PT C) E19 BA – Other Long-Term Invested Assets E06
Common Stock (SCH D, PT 2, SN 2) E10 D - Bonds and Stocks E08
Counterparty Exposure from Derivative Instruments (SCH DB, PT E) E22 DA – Short-term Investments E15
Detailed Information of Losses and Loss Expenses (SCH P, PT 1) 49 DB – Derivative Instruments E16
Exhibit of Capital Gains (Losses) 12 DM – Aggregate Statement & Fair Values of Bonds and Preferred Stock E23
Exhibit of Net Investment Income 12 E - Part 1 – Cash E24
Exhibit of Premiums and Losses – Business in the State of - Part 2 – Special Deposits E25
(Separate Page for Each State) 24 F - Reinsurance 38
Exhibit of Premiums Written (allocated by state) (SCH T) 108 H – Accident and Health Exhibit 46
Exhibit 1 – Analysis of Nonadmitted Assets and Related Items 13 P - Analysis of Losses and Loss Expenses 49
Expenses (PT 3) 11 Y - Information Concerning Activities of Insurer Members of Holding
Futures Contracts (SCH DB, PT D) E20 Company Group 109
Five-Year Historical Data 22 T - Exhibit of Premiums Written Allocated by States and Territories 108
General Interrogatories – Part 1 16 Short-Term Investments (SCH DA) E15
General Interrogatories – Part 2 20 Special Deposits (SCH E, PT 2) E25
History of Bulk and Incurred But Not Reported Reserves (SCH P, PT 4) 50 State Page 24
History of Claims (Direct and Assumed): Closed with Loss Payments, Statement of Income 4
Outstanding and Reported (SCH P, PT 5) 87 Summary Investment Schedule 15
History of Incurred Losses and Allocated Expenses (SCH P, PT 2) 50 Supplemental Exhibits and Schedules Interrogatories 111
History of Loss Sensitive Contracts (SCH P, PT 7) 103 Title Page and Jurat 1
History of Paid Loss and Allocated Expense Payments (SCH P, PT 3) 77 Transactions with Any Affiliates (SCH Y, PT 2) 110
History of Premiums Earned: Direct and Assumed, and Ceded (SCH P, PT 6) 98 Unpaid Losses and Loss Adjustment Expenses (PT 2A) 10
Holding Company Activities of Insurer Members (SCH Y) 110 Verifications:
Liabilities, Surplus and Other Funds 3 Schedule A, B, BA 25
Losses Paid and Incurred (PT 2) 9 Schedule D – Summary 26
Mortgage Loans (SCH B) E04 Schedule DA – Part 2 33
Notes to Financial Statements 14 Schedule DB – Parts A and B 34
Options, Caps and Floors Owned (SCH DB, PT A) E16 Schedule DB – Parts C, D and E 35
Options, Caps and Floors Written (SCH DB, PT B) E17

PROPERTY AND CASUALTY COMPANIES - ASSOCIATION EDITION
*29459200220100100*
ANNUAL STATEMENTFor the Year Ended December 31, 2002
of the Condition and Affairs of the
TWIN CITY FIRE INSURANCE COMPANYNAIC Group Code..... 0091, 0091 NAIC Company Code..... 29459 Employer's ID Number..... 06-0732738 (Current Period) (Prior Period)
Organized under the Laws of Indiana State of Domicile or Port of Entry IndianaCountry of Domicile USIncorporated..... March 5, 1987 Commenced Business..... July 1, 1987
Statutory Home Office 4040 Vincennes Circle, Suite 100….. Indianapolis ..... IN ..... 46268 (Street and Number) (City or Town, State and Zip Code)Main Administrative Office Hartford Plaza….. Hartford ..... CT ..... 06115-0000 860-547-5000 (Street and Number) (City or Town, State and Zip Code) (Area Code) (Telephone Number)Mail Address Hartford Plaza….. Hartford ..... CT ..... 06115-0000 (Street and Number or P. O. Box) (City or Town, State and Zip Code)Primary Location of Books and Records Hartford Plaza….. Hartford ..... CT ..... 06115-0000 860-547-5000 (Street and Number) (City or Town, State and Zip Code) (Area Code) (Telephone Number)Internet Website Address www.thehartford.comStatement Contact Randolph A. Dalton 860-547-3935 (Name) (Area Code) (Telephone Number) (Extension) [email protected] 860-547-3622 (E-Mail Address) (Fax Number)Policyowner Relations Contact Hartford Plaza….. Hartford ..... CT ..... 06115-0000 860-547-4707 (Street and Number) (City or Town, State and Zip Code) (Area Code) (Telephone Number) (Extension)
OFFICERSPresident ..... David Kenneth Zwiener Treasurer ..... John Nicholas Giamalis # Secretary ..... Brian Stuart Becker #
VICE PRESIDENTSJudith Ann Blades # Fredrick Henry Eppinger # Joseph Zigmund Gauches Calvin Hudson James Paul Kennedy David Richard Robb Raymond James Sprague Neal Stephen Wolin David Harold Annis Ann Boucher Glover # Randall Irwin Kiviat David Mark Znamierowski Brian Stuart Becker # Michael John Dury John Nicholas Giamalis Richard William Palczynski Robert Jennings Price #
DIRECTORS OR TRUSTEESHugh Michael Arnaud Ramani Ayer John Nicholas Giamalis Thomas Michael Marra #Neal Stephen Wolin David Mark Znamierowski David Kenneth Zwiener
State of........ ConnecticutCounty of..... Hartford
The officers of this reporting entity being duly sworn, each depose and say that they are the described officers of said reporting entity, and that on the reporting periodstated above, all of the herein described assets were the absolute property of the said reporting entity, free and clear from any liens or claims thereon, except asherein stated, and that this statement, together with related exhibits, schedules and explanations therein contained, annexed or referred to, is a full and true statementof all the assets and liabilities and of the condition and affairs of the said reporting entity as of the reporting period stated above, and of its income and deductionstherefrom for the period ended, and have been completed in accordance with the NAIC Annual Statement Instructions and Accounting Practices and Proceduresmanual except to the extent that: (1) state law may differ; or, (2) that state rules or regulations require differences in reporting not related to accounting practices andprocedures, according to the best of their information, knowledge and belief, respectively.
(Signature) (Signature) (Signature)David Kenneth Zwiener Brian Stuart Becker John Nicholas Giamalis (Printed Name) (Printed Name) (Printed Name)President Secretary Treasurer
Subscribed and sworn to before me this
..............day of ............................................................, 2003 a. Is this an original filing? Yes [ X ] No [ ]
................................................................................................ b. If no: 1. State the amendment number 2. Date filed..... 3. Number of pages attached.....

Annual Statement for the year 2002 of the TWIN CITY FIRE INSURANCE COMPANY
2
ASSETSCurrent Year Prior Year
1 2 3 4Net Admitted
Nonadmitted Assets Net AdmittedAssets Assets (Cols. 1 - 2) Assets
1. Bonds........................................................................................................................................... .............363,588,352 ...............................0 .............363,588,352 .............326,031,385
2. Stocks:
2.1 Preferred stocks (Schedule D, Part 2, Section 1).............................................................. .................9,597,851 ...............................0 .................9,597,851 .................9,505,251
2.2 Common stocks (Schedule D, Part 2, Section 2).............................................................. ...............................0 ...............................0 ...............................0 ...............................0
3. Mortgage loans on real estate (Schedule B):
3.1 First liens............................................................................................................................ ...............................0 ...............................0 ...............................0 ...............................0
3.2 Other than first liens........................................................................................................... ...............................0 ...............................0 ...............................0 ...............................0
4. Real estate (Schedule A):
4.1 Properties occupied by the company (less $............0 encumbrances)............................. ...............................0 ...............................0 ...............................0 ...............................0
4.2 Properties held for the production of income (less $............0 encumbrances)................. ...............................0 ...............................0 ...............................0 ...............................0
4.3 Properties held for sale (less $............0 encumbrances).................................................. ...............................0 ...............................0 ...............................0 ...............................0
5. Cash ($.....3,641,255 Schedule E, Part 1) and short-term investments ($..........0 Schedule DA, Part 2)................................................................................................... .................3,641,255 ...............................0 .................3,641,255 ...............13,291,640
6. Other invested assets (Schedule BA).......................................................................................... ...............................0 ...............................0 ...............................0 ...............................0
7. Receivable for securities.............................................................................................................. ...............................0 ...............................0 ...............................0 ...............................0
8. Aggregate write-ins for invested assets....................................................................................... ...............................0 ...............................0 ...............................0 ...............................0
9. Subtotals, cash and invested assets (Lines 1 to 8)..................................................................... .............376,827,458 ...............................0 .............376,827,458 .............348,828,276
10. Agents' balances or uncollected premiums:
10.1 Premiums and agents' balances in course of collection.................................................... ...............................0 ...............................0 ...............................0 ...............................0
10.2 Premiums, agents' balances and installments booked but deferred and not yet due (including $..........0 earned but unbilled premiums)................................. ...............................0 ...............................0 ...............................0 ...............................0
10.3 Accrued retrospective premiums....................................................................................... .................2,907,750 ....................290,775 .................2,616,975 .................2,582,495
11. Funds held by or deposited with reinsured companies............................................................... ...............................0 ...............................0 ...............................0 ...............................0
12. Bills receivable, taken for premiums............................................................................................ ...............................0 ...............................0 ...............................0 ...............................0
13. Amounts receivable under high deductible policies..................................................................... ...............................0 ...............................0 ...............................0 ...............................0
14. Reinsurance recoverables on loss and loss adjustment expense payments (Schedule F, Part 3, Cols. 7 and 8)............................................................................. ...............................0 ...............................0 ...............................0 ...............................0
15. Federal and foreign income tax recoverable and interest thereon (including $.....10,712,000 net deferred tax asset) - ................................................................... ...............15,882,000 .................5,170,000 ...............10,712,000 .................6,264,000
16. Guaranty funds receivable or on deposit..................................................................................... ....................273,424 ...............................0 ....................273,424 ...............................0
17. Electronic data processing equipment and software................................................................... ...............................0 ...............................0 ...............................0 ...............................0
18. Interest, dividends and real estate income due and accrued...................................................... .................5,834,469 ...............................0 .................5,834,469 .................5,404,862
19. Net adjustments in assets and liabilities due to foreign exchange rates..................................... ...............................0 ...............................0 ...............................0 ...............................0
20. Receivable from parent, subsidiaries and affiliates..................................................................... .................1,032,193 ...............................0 .................1,032,193 ...............................0
21. Amount due from/to protected cells............................................................................................. ...............................0 ...............................0 ...............................0 ...............................0
22. Equities and deposits in pools and associations......................................................................... ...............................0 ...............................0 ...............................0 ...............................0
23. Amounts receivable relating to uninsured accident and health plans......................................... ...............................0 ...............................0 ...............................0 ...............................0
24. Other assets nonadmitted (Exhibit 1)........................................................................................... ...............................0 ...............................0 ...............................0 ...............................0
25. Aggregate write-ins for other than invested assets...................................................................... ........................3,713 ...............................0 ........................3,713 ...............................0
26. Total assets excluding protected cell assets (Lines 9 through 25).............................................. .............402,761,007 .................5,460,775 .............397,300,232 .............363,079,633
27. Protected cell assets.................................................................................................................... ...............................0 ...............................0 ...............................0 ...............................0
28. TOTALS (Lines 26 and 27).......................................................................................................... .............402,761,007 .................5,460,775 .............397,300,232 .............363,079,633
DETAILS OF WRITE-INS
0801......................................................................................................................................................................................................................................................0 ...............................0 ...............................0 ...............................0
0802......................................................................................................................................................................................................................................................0 ...............................0 ...............................0 ...............................0
0803......................................................................................................................................................................................................................................................0 ...............................0 ...............................0 ...............................0
0898. Summary of remaining write-ins for Line 8 from overflow page.................................................. ...............................0 ...............................0 ...............................0 ...............................0
0899. Totals (Lines 0801 thru 0803 plus 0898) (Line 8 above)............................................................. ...............................0 ...............................0 ...............................0 ...............................0
2501. Sundry assets............................................................................................................................... ........................3,713 ...............................0 ........................3,713 ...............................0
2502......................................................................................................................................................................................................................................................0 ...............................0 ...............................0 ...............................0
2503......................................................................................................................................................................................................................................................0 ...............................0 ...............................0 ...............................0
2598. Summary of remaining write-ins for Line 25 from overflow page................................................ ...............................0 ...............................0 ...............................0 ...............................0
2599. Totals (Lines 2501 thru 2503 plus 2598) (Line 25 above)........................................................... ........................3,713 ...............................0 ........................3,713 ...............................0

Annual Statement for the year 2002 of the TWIN CITY FIRE INSURANCE COMPANY
3
LIABILITIES, SURPLUS AND OTHER FUNDS1 2
Current Year Prior Year
1. Losses (Part 2A, Line 34, Column 8)................................................................................................................................................................................... ..............134,364,316 ..............127,900,501
2. Reinsurance payable on paid loss and loss adjustment expenses (Schedule F, Part 1, Column 6)................................................................................... ................................0 ................................0
3. Loss adjustment expenses (Part 2A, Line 34, Column 9)................................................................................................................................................... ................20,394,834 ................19,304,282
4. Commissions payable, contingent commissions and other similar charges........................................................................................................................ ..................1,520,104 ..................1,274,813
5. Other expenses (excluding taxes, licenses and fees)......................................................................................................................................................... ..................2,210,143 ..................2,475,660
6. Taxes, licenses and fees (excluding federal and foreign income taxes)............................................................................................................................. ..................3,102,600 ..................2,416,439
7. Federal and foreign income taxes (including $..........0 on realized capital gains (losses)) (including $..........0 net deferred tax liability)........................... .....................227,898 .....................717,249
8. Borrowed money $..........0 and interest thereon $..........0................................................................................................................................................... ................................0 ................................0
9. Unearned premiums (Part 1A, Line 37, Column 5) (after deducting unearned premiums for ceded reinsurance of $.....609,762,553 and including warranty reserves of $..........0)...................................................................................................................................................................... ................53,315,937 ................46,327,271
10. Advance premiums.............................................................................................................................................................................................................. ................................0 ................................0
11. Dividends declared and unpaid:
11.1 Stockholders................................................................................................................................................................................................................ ................................0 ................................0
11.2 Policyholders............................................................................................................................................................................................................... .....................383,385 .....................270,060
12. Ceded reinsurance premiums payable (net of ceding commissions).................................................................................................................................. ................................0 ................................0
13. Funds held by company under reinsurance treaties (Schedule F, Part 3, Column 19)....................................................................................................... ................................0 ................................0
14. Amounts withheld or retained by company for account of others........................................................................................................................................ ................................0 ................................0
15. Remittances and items not allocated................................................................................................................................................................................... ................................0 ................................0
16. Provision for reinsurance (Schedule F, Part 7).................................................................................................................................................................... ................................0 ................................0
17. Net adjustments in assets and liabilities due to foreign exchange rates............................................................................................................................. ................................0 ................................0
18. Drafts outstanding................................................................................................................................................................................................................ ................................0 ................................0
19. Payable to parent, subsidiaries and affiliates...................................................................................................................................................................... ................................0 ..................8,991,047
20. Payable for securities.......................................................................................................................................................................................................... ................................0 ................................0
21. Liability for amounts held under uninsured accident and health plans................................................................................................................................ ................................0 ................................0
22. Capital notes $..........0 and interest thereon $..........0......................................................................................................................................................... ................................0 ................................0
23. Aggregate write-ins for liabilities.......................................................................................................................................................................................... ................................0 ................................0
24. Total liabilities excluding protected cell liabilities (Lines 1 through 23)................................................................................................................................ ..............215,519,217 ..............209,677,322
25. Protected cell liabilities........................................................................................................................................................................................................ ................................0 ................................0
26. Total liabilities (Lines 24 and 25)......................................................................................................................................................................................... ..............215,519,217 ..............209,677,322
27. Aggregate write-ins for special surplus funds...................................................................................................................................................................... ................................0 ................................0
28. Common capital stock......................................................................................................................................................................................................... ..................4,200,000 ..................4,200,000
29. Preferred capital stock......................................................................................................................................................................................................... ................................0 ................................0
30. Aggregate write-ins for other than special surplus funds.................................................................................................................................................... ................................0 ................................0
31. Surplus notes....................................................................................................................................................................................................................... ................................0 ................................0
32. Gross paid in and contributed surplus................................................................................................................................................................................. ................16,014,823 ..................5,600,000
33. Unassigned funds (surplus)................................................................................................................................................................................................. ..............161,566,192 ..............143,602,311
34. Less treasury stock, at cost:
34.1 ..........0.000 shares common (value included in Line 28 $..........0).......................................................................................................................... ................................0 ................................0
34.2 ..........0.000 shares preferred (value included in Line 29 $..........0)......................................................................................................................... ................................0 ................................0
35. Surplus as regards policyholders (Lines 27 to 33, less 34) (Page 4, Line 38).................................................................................................................... ..............181,781,015 ..............153,402,311
36. TOTALS (Page 2, Line 28, Col. 3)....................................................................................................................................................................................... ..............397,300,232 ..............363,079,633
DETAILS OF WRITE-INS
2301. ............................................................................................................................................................................................................................................. ................................0 ................................0
2302. ............................................................................................................................................................................................................................................. ................................0 ................................0
2303. ............................................................................................................................................................................................................................................. ................................0 ................................0
2398. Summary of remaining write-ins for Line 23 from overflow page......................................................................................................................................... ................................0 ................................0
2399. Totals (Lines 2301 thru 2303 plus 2398) (Line 23 above)................................................................................................................................................... ................................0 ................................0
2701. ............................................................................................................................................................................................................................................. ................................0 ................................0
2702. ............................................................................................................................................................................................................................................. ................................0 ................................0
2703. ............................................................................................................................................................................................................................................. ................................0 ................................0
2798. Summary of remaining write-ins for Line 27 from overflow page......................................................................................................................................... ................................0 ................................0
2799. Totals (Lines 2701 thru 2703 plus 2798) (Line 27 above)................................................................................................................................................... ................................0 ................................0
3001. ............................................................................................................................................................................................................................................. ................................0 ................................0
3002. ............................................................................................................................................................................................................................................. ................................0 ................................0
3003. ............................................................................................................................................................................................................................................. ................................0 ................................0
3098. Summary of remaining write-ins for Line 30 from overflow page......................................................................................................................................... ................................0 ................................0
3099. Totals (Lines 3001 thru 3003 plus 3098) (Line 30 above)................................................................................................................................................... ................................0 ................................0

Annual Statement for the year 2002 of the TWIN CITY FIRE INSURANCE COMPANY
4
UNDERWRITING AND INVESTMENT EXHIBIT1 2
STATEMENT OF INCOME Current Year Prior YearUNDERWRITING INCOME
1. Premiums earned (Part 1, Line 34, Column 4)................................................................................................................................................... ..................115,175,752 ....................93,124,497 DEDUCTIONS
2. Losses incurred (Part 2, Line 34, Column 7)...................................................................................................................................................... ....................68,973,497 ....................64,796,8073. Loss expenses incurred (Part 3, Line 25, Column 1)......................................................................................................................................... ....................12,937,041 ......................9,922,7994. Other underwriting expenses incurred (Part 3, Line 25, Column 2)................................................................................................................... ....................34,532,096 ....................32,588,1645. Aggregate write-ins for underwriting deductions................................................................................................................................................ ....................................0 ....................................06. Total underwriting deductions (Lines 2 through 5)............................................................................................................................................. ..................116,442,634 ..................107,307,7707. Net income of protected cells............................................................................................................................................................................. ....................................0 ....................................08. Net underwriting gain (loss) (Line 1 minus Line 6 plus Line 7).......................................................................................................................... ....................(1,266,882) ..................(14,183,273)
INVESTMENT INCOME9. Net investment income earned (Exhibit of Net Investment Income, Line 17).................................................................................................... ....................19,360,831 ....................18,821,72010. Net realized capital gains (losses) (Exhibit of Capital Gains (Losses)).............................................................................................................. .........................842,266 .........................903,09611. Net investment gain (loss) (Lines 9 + 10)........................................................................................................................................................... ....................20,203,097 ....................19,724,816
OTHER INCOME 12. Net gain (loss) from agents' or premium balances charged off (amount recovered $..........0
amount charged off $..........0)........................................................................................................................................................................... ....................................0 ....................................013. Finance and service charges not included in premiums.................................................................................................................................... ......................6,584,483 ......................6,132,16714. Aggregate write-ins for miscellaneous income................................................................................................................................................... ....................................0 ....................................015. Total other income (Lines 12 through 14).......................................................................................................................................................... ......................6,584,483 ......................6,132,16716. Net income before dividends to policyholders and before federal and foreign income taxes (Lines 8 + 11 + 15)............................................. ....................25,520,698 ....................11,673,71017. Dividends to policyholders................................................................................................................................................................................. .........................481,554 .........................290,75318. Net income, after dividends to policyholders but before federal and foreign income taxes (Line 16 minus Line 17)......................................... ....................25,039,144 ....................11,382,95719. Federal and foreign income taxes incurred........................................................................................................................................................ ......................5,831,655 ......................1,589,20520. Net income (Line 18 minus Line 19) (to Line 22)............................................................................................................................................... ....................19,207,489 ......................9,793,752
CAPITAL AND SURPLUS ACCOUNT 21. Surplus as regards policyholders, December 31 prior year (Page 4, Line 38, Column 2)................................................................................. ..................153,402,311 ..................137,639,435
GAINS AND (LOSSES) IN SURPLUS 22. Net income (from Line 20).................................................................................................................................................................................. ....................19,207,489 ......................9,793,75223. Net unrealized capital gains or (losses)............................................................................................................................................................. .......................(728,778) ...........................67,18024. Change in net unrealized foreign exchange capital gains (loss)........................................................................................................................ ....................................0 ....................................025. Change in net deferred income tax.................................................................................................................................................................... ......................2,179,000 ......................2,667,00026. Change in nonadmitted assets (Exhibit 1, Line 5, Column 3)............................................................................................................................ ......................2,306,169 .........................633,24527. Change in provision for reinsurance (Page 3, Line 16, Column 2 minus Column 1)......................................................................................... ....................................0 ....................................028. Change in surplus notes.................................................................................................................................................................................... ....................................0 ....................................029. Surplus (contributed to) withdrawn from protected cells.................................................................................................................................... ....................................0 ....................................030. Cumulative effect of changes in accounting principles...................................................................................................................................... ....................................0 ......................2,601,70031. Capital changes:
31.1 Paid in....................................................................................................................................................................................................... ....................................0 ....................................031.2 Transferred from surplus (Stock Dividend)............................................................................................................................................... ....................................0 ....................................031.3 Transferred to surplus............................................................................................................................................................................... ....................................0 ....................................0
32. Surplus adjustments: 32.1 Paid in....................................................................................................................................................................................................... ....................10,414,823 ....................................032.2 Transferred to capital (Stock Dividend)..................................................................................................................................................... ....................................0 ....................................032.3. Transferred from capital........................................................................................................................................................................... ....................................0 ....................................0
33. Net remittances from or (to) Home Office.......................................................................................................................................................... ....................................0 ....................................034. Dividends to stockholders.................................................................................................................................................................................. ....................(5,000,000) ....................................035. Change in treasury stock (Page 3, Line 34.1 and 34.2, Column 2 minus Column 1)........................................................................................ ....................................0 ....................................036. Aggregate write-ins for gains and losses in surplus........................................................................................................................................... ....................................0 ....................................037. Change in surplus as regards policyholders for the year (Lines 22 through 36)................................................................................................ ....................28,378,704 ....................15,762,87638. Surplus as regards policyholders, December 31 current year (Line 21 plus Line 37) (Page 3, Line 35)........................................................... ..................181,781,015 ..................153,402,311
DETAILS OF WRITE-INS0501. ........................................................................................................................................................................................................................... ....................................0 ....................................00502. ........................................................................................................................................................................................................................... ....................................0 ....................................00503. ........................................................................................................................................................................................................................... ....................................0 ....................................00598. Summary of remaining write-ins for Line 5 from overflow page......................................................................................................................... ....................................0 ....................................00599. Totals (Lines 0501 thru 0503 plus 0598) (Line 5 above).................................................................................................................................... ....................................0 ....................................01401. ........................................................................................................................................................................................................................... ....................................0 ....................................01402. ........................................................................................................................................................................................................................... ....................................0 ....................................01403. ........................................................................................................................................................................................................................... ....................................0 ....................................01498. Summary of remaining write-ins for Line 14 from overflow page....................................................................................................................... ....................................0 ....................................01499. Totals (Lines 1401 thru 1403 plus 1498) (Line 14 above).................................................................................................................................. ....................................0 ....................................03601. ........................................................................................................................................................................................................................... ....................................0 ....................................03602. ........................................................................................................................................................................................................................... ....................................0 ....................................03603. ........................................................................................................................................................................................................................... ....................................0 ....................................03698. Summary of remaining write-ins for Line 36 from overflow page....................................................................................................................... ....................................0 ....................................03699. Totals (Lines 3601 thru 3603 plus 3698) (Line 36 above).................................................................................................................................. ....................................0 ....................................0

Annual Statement for the year 2002 of the TWIN CITY FIRE INSURANCE COMPANY
5
CASH FLOW1 2
Current Year Prior Year CASH FROM OPERATIONS
1. Premiums collected net of reinsurance...................................................................................................................................................... ......................122,126,108 ........................97,901,9942. Loss and loss adjustment expenses paid (net of salvage and subrogation)............................................................................................. ........................74,356,171 ........................75,802,2483. Underwriting expenses paid...................................................................................................................................................................... ........................34,207,048 ........................32,119,2174. Other underwriting income (expenses)...................................................................................................................................................... ........................................0 ........................................05. Cash from underwriting (Line 1 minus Line 2 minus Line 3 plus Line 4)................................................................................................... ........................13,562,889 ......................(10,019,471)6. Net investment income.............................................................................................................................................................................. ........................17,880,102 ........................17,359,9507. Other income (expenses):
7.1 Agents' balances charged off........................................................................................................................................................... ........................................0 ........................................07.2 Net funds held under reinsurance treaties....................................................................................................................................... ........................................0 ........................................07.3 Net amount withheld or retained for account of others.................................................................................................................... ........................................0 ........................................07.4 Aggregate write-ins for miscellaneous items................................................................................................................................... ..........................6,584,483 ..........................6,238,1117.5 Total other income (Lines 7.1 to 7.4)............................................................................................................................................... ..........................6,584,483 ..........................6,238,111
8. Dividends to policyholders on direct business, less $..........0 dividends on reinsurance assumed or ceded (net).................................... .............................368,229 .............................585,9389. Federal and foreign income taxes (paid) recovered.................................................................................................................................. ........................(6,321,006) ..........................3,056,081
10. Net cash from operations (Line 5 plus Line 6 plus Line 7.5 minus Line 8 plus Line 9).............................................................................. ........................31,338,239 ........................16,048,733 CASH FROM INVESTMENTS
11. Proceeds from investments sold, matured or repaid: 11.1 Bonds............................................................................................................................................................................................... ........................55,959,445 ........................33,211,88011.2 Stocks.............................................................................................................................................................................................. ........................................0 ........................................011.3 Mortgage loans................................................................................................................................................................................ ........................................0 ........................................011.4 Real estate....................................................................................................................................................................................... ........................................0 ........................................011.5 Other invested assets...................................................................................................................................................................... ........................................0 ........................................011.6 Net gains or (losses) on cash and short-term investments.............................................................................................................. ........................................0 ........................................011.7 Miscellaneous proceeds.................................................................................................................................................................. ........................................0 ........................................011.8 Total investment proceeds (Lines 11.1 to 11.7)............................................................................................................................... ........................55,959,445 ........................33,211,880
12. Cost of investments acquired (long-term only): 12.1 Bonds............................................................................................................................................................................................... ........................92,335,938 ........................49,891,11312.2 Stocks.............................................................................................................................................................................................. ........................................0 ..........................2,000,00012.3 Mortgage loans................................................................................................................................................................................ ........................................0 ........................................012.4 Real estate....................................................................................................................................................................................... ........................................0 ........................................012.5 Other invested assets...................................................................................................................................................................... ........................................0 ........................................012.6 Miscellaneous applications.............................................................................................................................................................. ........................................0 ........................................012.7 Total investments acquired (Lines 12.1 to 12.6).............................................................................................................................. ........................92,335,938 ........................51,891,113
13. Net cash from investments (Line 11.8 minus Line 12.7)............................................................................................................................ ......................(36,376,493) ......................(18,679,232) CASH FROM FINANCING AND MISCELLANEOUS SOURCES
14. Cash provided: 14.1 Surplus notes, capital and surplus paid in....................................................................................................................................... ........................................0 ........................................014.2 Capital notes $..........0 less amounts repaid $..........0..................................................................................................................... ........................................0 ........................................014.3 Net transfers from affiliates.............................................................................................................................................................. ..........................1,423,776 ..........................9,374,59014.4 Borrowed funds received................................................................................................................................................................. ........................................0 ........................................014.5 Other cash provided........................................................................................................................................................................ ........................................0 ........................................014.6 Total (Lines 14.1 to 14.5)................................................................................................................................................................. ..........................1,423,776 ..........................9,374,590
15. Cash applied: 15.1 Dividends to stockholders paid........................................................................................................................................................ ..........................5,000,000 ........................................015.2 Net transfers to affiliates.................................................................................................................................................................. ..........................1,032,193 ........................................015.3 Borrowed funds repaid..................................................................................................................................................................... ........................................0 ........................................015.4 Other applications............................................................................................................................................................................ .................................3,714 ........................................015.5 Total (Lines 15.1 to 15.4)................................................................................................................................................................. ..........................6,035,907 ........................................0
16. Net cash from financing and miscellaneous sources (Line 14.6 minus Line 15.5).................................................................................... ........................(4,612,131) ..........................9,374,590
RECONCILIATION OF CASH AND SHORT-TERM INVESTMENTS 17. Net change in cash and short-term investments (Line 10 plus Line 13 plus Line 16)............................................................................... ........................(9,650,385) ..........................6,744,09118. Cash and short-term investments:
18.1 Beginning of year............................................................................................................................................................................. ........................13,291,640 ..........................6,547,54918.2 End of year (Line 17 plus Line 18.1)................................................................................................................................................ ..........................3,641,255 ........................13,291,640
DETAILS OF WRITE-INS7.401 Finance and service charges not included in premiums............................................................................................................................ ..........................6,584,483 ..........................6,238,1117.402 ................................................................................................................................................................................................................... ........................................0 ........................................07.403 ................................................................................................................................................................................................................... ........................................0 ........................................07.498 Summary of remaining write-ins for Line 7.4 from overflow page.............................................................................................................. ........................................0 ........................................07.499 Total (Lines 7.401 thru 7.403 plus 7.498) (Line 7.4 above)....................................................................................................................... ..........................6,584,483 ..........................6,238,111

Annual Statement for the year 2002 of the TWIN CITY FIRE INSURANCE COMPANY
6
UNDERWRITING AND INVESTMENT EXHIBIT PART 1 - PREMIUMS EARNED
1 2 3 4Unearned Premiums Unearned Premiums
Net December 31 December 31 PremiumsPremiums Prior Year- Current Year- EarnedWritten per per Col. 3 Last per Col. 5 During Year
Line of Business Column 6, Part 1B Year's Part 2 Part 1A (Cols. 1 + 2 - 3)
1. Fire...................................................................................................... ...........................4,446,122 ...........................1,537,194 ...........................1,852,388 ...........................4,130,928
2. Allied lines........................................................................................... ...........................1,920,330 ..............................432,784 ..............................543,292 ...........................1,809,822
3. Farmowners multiple peril................................................................... ..................................1,951 .....................................338 ..................................1,113 ..................................1,176
4. Homeowners multiple peril.................................................................. ...........................9,664,784 ...........................4,733,890 ...........................5,323,716 ...........................9,074,958
5. Commercial multiple peril.................................................................... .........................22,390,887 ...........................9,592,725 .........................11,428,578 .........................20,555,034
6. Mortgage guaranty.............................................................................. .........................................0 .........................................0 .........................................0 .........................................0
8. Ocean marine..................................................................................... ..............................381,647 ................................63,189 ................................67,257 ..............................377,579
9. Inland marine...................................................................................... ...........................3,622,224 ...........................1,700,253 ...........................1,799,259 ...........................3,523,218
10. Financial guaranty............................................................................... .........................................0 .........................................0 .........................................0 .........................................0
11.1 Medical malpractice - occurrence....................................................... .......................................30 .........................................1 .........................................1 .......................................30
11.2 Medical malpractice - claims-made..................................................... .........................................0 .........................................0 .........................................0 .........................................0
12. Earthquake.......................................................................................... ..............................258,101 ..............................132,041 ..............................133,262 ..............................256,880
13. Group accident and health.................................................................. .........................................0 .........................................0 .........................................0 .........................................0
14. Credit accident and health (group and individual)............................... .........................................0 .........................................0 .........................................0 .........................................0
15. Other accident and health................................................................... .........................................0 .........................................0 .........................................0 .........................................0
16. Workers' compensation....................................................................... .........................21,253,604 ...........................2,145,212 ...........................3,339,486 .........................20,059,330
17.1 Other liability - occurrence.................................................................. ...........................4,717,329 ..............................576,562 ...........................1,407,997 ...........................3,885,894
17.2 Other liability - claims-made................................................................ ...........................3,414,067 ...........................1,112,520 ...........................1,995,072 ...........................2,531,515
18.1 Products liability - occurrence............................................................. ..............................697,033 ..............................253,538 ..............................361,340 ..............................589,231
18.2 Products liability - claims-made.......................................................... ................................29,089 ................................14,470 ................................15,495 ................................28,064
19.1, 19.2 Private passenger auto liability........................................................... .........................18,645,892 ...........................8,885,002 ...........................9,093,321 .........................18,437,573
19.3, 19.4 Commercial auto liability..................................................................... ...........................7,691,517 ...........................3,249,178 ...........................3,552,303 ...........................7,388,392
21. Auto physical damage......................................................................... .........................14,186,398 ...........................6,588,268 ...........................6,779,551 .........................13,995,115
22. Aircraft (all perils)................................................................................ ...........................1,100,235 ..............................216,851 ..............................360,590 ..............................956,496
23. Fidelity................................................................................................. ..............................693,068 ..............................377,852 ..............................409,939 ..............................660,981
24. Surety.................................................................................................. ...........................1,627,274 ..............................734,061 ..............................825,958 ...........................1,535,377
26. Burglary and theft................................................................................ ................................94,278 ................................61,954 ................................53,658 ..............................102,574
27. Boiler and machinery.......................................................................... .................................(5,796) ..................................7,539 ..................................3,876 .................................(2,133)
28. Credit.................................................................................................. .........................................0 .........................................0 .........................................0 .........................................0
29. International........................................................................................ ..............................598,889 ..............................101,326 ................................31,475 ..............................668,740
30. Reinsurance - nonproportional assumed property.............................. ...........................3,343,637 ..............................610,454 ..............................704,583 ...........................3,249,508
31. Reinsurance - nonproportional assumed liability................................ ...........................1,311,731 ..............................279,190 ..............................290,710 ...........................1,300,211
32. Reinsurance - nonproportional assumed financial lines..................... ................................41,783 ................................51,440 ................................33,965 ................................59,258
33. Aggregate write-ins for other lines of business................................... .........................................0 .........................................0 .........................................0 .........................................0
34. TOTALS......................................................................................... .......................122,126,104 .........................43,457,832 .........................50,408,185 .......................115,175,751
DETAILS OF WRITE-INS
3301. ............................................................................................................ .........................................0 .........................................0 .........................................0 .........................................0
3302. ............................................................................................................ .........................................0 .........................................0 .........................................0 .........................................0
3303. ............................................................................................................ .........................................0 .........................................0 .........................................0 .........................................0
3398. Summary of remaining write-ins for Line 33 from overflow page........ .........................................0 .........................................0 .........................................0 .........................................0
3399. Totals (Lines 3301 thru 3303 plus 3398) (Line 33 above).................. .........................................0 .........................................0 .........................................0 .........................................0

Annual Statement for the year 2002 of the TWIN CITY FIRE INSURANCE COMPANY
7
UNDERWRITING AND INVESTMENT EXHIBIT PART 1A - RECAPITULATION OF ALL PREMIUMS
(a) Gross premiums (less reinsurance) and unearned premiums on all unexpired risks and reserve for return premiums under rate credit or retrospective rating plans based upon experience, viz:
1 2 3 4 5Amount Unearned Amount Unearned Reserve for(Running One Year (Running more than Rate Credits Total Reserveor Less from Date One Year from and Retrospective for Unearned
of Policy) Date of Policy) Earned But Adjustments Based PremiumsLine of Business (b) (b) Unbilled Premium on Experience Cols. 1 + 2 + 3 + 4
1. Fire................................................................................................. ...................1,805,756 ........................46,632 .................................0 .................................0 ...................1,852,388
2. Allied lines...................................................................................... ......................511,492 ........................31,800 .................................0 .................................0 ......................543,292
3. Farmowners multiple peril.............................................................. ..........................1,113 .................................0 .................................0 .................................0 ..........................1,113
4. Homeowners multiple peril............................................................ ...................5,323,716 .................................0 .................................0 .................................0 ...................5,323,716
5. Commercial multiple peril.............................................................. .................11,426,697 ..........................1,881 .................................0 .................................0 .................11,428,578
6. Mortgage guaranty......................................................................... .................................0 .................................0 .................................0 .................................0 .................................0
8. Ocean marine................................................................................ ........................67,255 .................................2 .................................0 .................................0 ........................67,257
9. Inland marine................................................................................. ...................1,702,861 ........................96,398 .................................0 .................................0 ...................1,799,259
10. Financial guaranty......................................................................... .................................0 .................................0 .................................0 .................................0 .................................0
11.1 Medical malpractice - occurrence.................................................. .................................1 .................................0 .................................0 .................................0 .................................1
11.2 Medical malpractice - claims-made............................................... .................................0 .................................0 .................................0 .................................0 .................................0
12. Earthquake.................................................................................... ......................133,262 .................................0 .................................0 .................................0 ......................133,262
13. Group accident and health............................................................. .................................0 .................................0 .................................0 .................................0 .................................0
14. Credit accident and health (group and individual)......................... .................................0 .................................0 .................................0 .................................0 .................................0
15. Other accident and health.............................................................. .................................0 .................................0 .................................0 .................................0 .................................0
16. Workers' compensation................................................................. ...................4,887,879 ........................10,302 .................................0 ..................(1,558,695) ...................3,339,486
17.1 Other liability - occurrence............................................................. ...................2,561,673 ........................22,284 .................................0 ..................(1,175,960) ...................1,407,997
17.2 Other liability - claims-made.......................................................... ...................1,994,247 .............................825 .................................0 .................................0 ...................1,995,072
18.1 Products liability - occurrence........................................................ ......................352,352 ..........................8,988 .................................0 .................................0 ......................361,340
18.2 Products liability - claims-made..................................................... ........................11,851 ..........................3,644 .................................0 .................................0 ........................15,495
19.1, 19.2 Private passenger auto liability...................................................... ...................9,093,321 .................................0 .................................0 .................................0 ...................9,093,321
19.3, 19.4 Commercial auto liability................................................................ ...................3,555,232 ..........................7,301 .................................0 .......................(10,230) ...................3,552,303
21. Auto physical damage................................................................... ...................6,778,312 ..........................1,239 .................................0 .................................0 ...................6,779,551
22. Aircraft (all perils)........................................................................... ......................360,590 .................................0 .................................0 .................................0 ......................360,590
23. Fidelity........................................................................................... ......................267,479 ......................142,460 .................................0 .................................0 ......................409,939
24. Surety............................................................................................ ......................531,765 ......................294,193 .................................0 .................................0 ......................825,958
26. Burglary and theft.......................................................................... ........................39,808 ........................13,850 .................................0 .................................0 ........................53,658
27. Boiler and machinery..................................................................... ..........................3,858 ...............................18 .................................0 .................................0 ..........................3,876
28. Credit............................................................................................. .................................0 .................................0 .................................0 .................................0 .................................0
29. International................................................................................... ........................31,475 .................................0 .................................0 .................................0 ........................31,475
30. Reinsurance - nonproportional assumed property......................... ......................704,583 .................................0 .................................0 .................................0 ......................704,583
31. Reinsurance - nonproportional assumed liability........................... ......................290,710 .................................0 .................................0 .................................0 ......................290,710
32. Reinsurance - nonproportional assumed financial lines................ ........................33,965 .................................0 .................................0 .................................0 ........................33,965
33. Aggregate write-ins for other lines of business.............................. .................................0 .................................0 .................................0 .................................0 .................................0
34. TOTALS......................................................................................... .................52,471,253 ......................681,817 .................................0 ..................(2,744,885) .................50,408,185
35. Accrued retrospective premiums based on experience............................................................................................................................................................................ ...................2,907,750
36. Earned but unbilled premiums.................................................................................................................................................................................................................. .................................0
37. Balance (sum of Lines 34 through 36)...................................................................................................................................................................................................... .................53,315,935
DETAILS OF WRITE-INS
3301. ....................................................................................................... .................................0 .................................0 .................................0 .................................0 .................................0
3302. ....................................................................................................... .................................0 .................................0 .................................0 .................................0 .................................0
3303. ....................................................................................................... .................................0 .................................0 .................................0 .................................0 .................................0
3398. Summary of remaining write-ins for Line 33 from overflow page... .................................0 .................................0 .................................0 .................................0 .................................0
3399. TOTALS (Lines 3301 thru 3303 plus 3398) (Line 33 above)......... .................................0 .................................0 .................................0 .................................0 .................................0
(a) By gross premiums is meant the aggregate of all the premiums written in the policies or renewals in force. Are they so returned in this statement? Yes [ X ] No [ ]. (b) State here basis of computation used in each case: Semi-monthly pro rata except Marine Risks not terminated: 100%

Annual Statement for the year 2002 of the TWIN CITY FIRE INSURANCE COMPANY
8
UNDERWRITING AND INVESTMENT EXHIBIT PART 1B - PREMIUMS WRITTEN
Gross Premiums (Less Return Premiums), Including Policy and Membership Fees Written and Renewed During Year 1 6
Reinsurance Assumed Reinsurance Ceded2 3 4 5 Net Premiums
Direct WrittenBusiness (Cols. 1 + 2 + 3
Line of Business (a) From Affiliates From Non-Affiliates To Affiliates To Non-Affiliates - 4 - 5)
1. Fire............................................................................................... ............2,692,257 ............4,446,122 ..........................0 ............2,692,257 ..........................0 ............4,446,122
2. Allied lines.................................................................................... ............9,354,047 ............1,920,330 ..........................0 ............9,354,047 ..........................0 ............1,920,330
3. Farmowners multiple peril............................................................ ..........................0 ...................1,951 ..........................0 ..........................0 ..........................0 ...................1,951
4. Homeowners multiple peril.......................................................... ..........43,187,482 ............9,664,784 ..........................0 ..........43,187,482 ..........................0 ............9,664,784
5. Commercial multiple peril............................................................ ........130,434,606 ..........22,390,887 ..........................0 ........130,434,606 ..........................0 ..........22,390,887
6. Mortgage guaranty....................................................................... ..........................0 ..........................0 ..........................0 ..........................0 ..........................0 ..........................0
8. Ocean marine.............................................................................. ...............260,366 ...............381,647 ..........................0 ...............260,366 ..........................0 ...............381,647
9. Inland marine............................................................................... ..........22,385,643 ............3,622,224 ..........................0 ..........22,385,643 ..........................0 ............3,622,224
10. Financial guaranty....................................................................... ..........................0 ..........................0 ..........................0 ..........................0 ..........................0 ..........................0
11.1 Medical malpractice - occurrence................................................ ..........................0 ........................30 ..........................0 ..........................0 ..........................0 ........................30
11.2 Medical malpractice - claims-made............................................. ..........................0 ..........................0 ..........................0 ..........................0 ..........................0 ..........................0
12. Earthquake.................................................................................. ...............368,660 ...............258,101 ..........................0 ...............368,660 ..........................0 ...............258,101
13. Group accident and health........................................................... ..........................0 ..........................0 ..........................0 ..........................0 ..........................0 ..........................0
14. Credit accident and health (group and individual)....................... ..........................0 ..........................0 ..........................0 ..........................0 ..........................0 ..........................0
15. Other accident and health............................................................ ..........................0 ..........................0 ..........................0 ..........................0 ..........................0 ..........................0
16. Workers' compensation............................................................... ........508,984,399 ..........21,253,604 ..........................0 ........508,984,399 ..........................0 ..........21,253,604
17.1 Other liability - occurrence........................................................... ..........78,196,149 ............4,717,329 ..........................0 ..........78,196,149 ..........................0 ............4,717,329
17.2 Other liability - claims-made........................................................ ........319,681,791 ............3,414,067 ..........................0 ........319,681,791 ..........................0 ............3,414,067
18.1 Products liability - occurrence...................................................... ..........25,779,512 ...............697,033 ..........................0 ..........25,779,512 ..........................0 ...............697,033
18.2 Products liability - claims-made................................................... ...............727,947 .................29,089 ..........................0 ...............727,947 ..........................0 .................29,089
19.1, 19.2 Private passenger auto liability.................................................... ........111,946,351 ..........18,645,892 ..........................0 ........111,946,351 ..........................0 ..........18,645,892
19.3, 19.4 Commercial auto liability.............................................................. ..........82,922,892 ............7,691,517 ..........................0 ..........82,922,892 ..........................0 ............7,691,517
21. Auto physical damage................................................................. ........104,932,307 ..........14,186,398 ..........................0 ........104,932,307 ..........................0 ..........14,186,398
22. Aircraft (all perils)......................................................................... ..........................0 ............1,100,235 ..........................0 ..........................0 ..........................0 ............1,100,235
23. Fidelity......................................................................................... ............1,730,638 ...............693,068 ..........................0 ............1,730,638 ..........................0 ...............693,068
24. Surety.......................................................................................... ..................(4,281) ............1,627,274 ..........................0 ..................(4,281) ..........................0 ............1,627,274
26. Burglary and theft........................................................................ ..........................0 .................94,278 ..........................0 ..........................0 ..........................0 .................94,278
27. Boiler and machinery................................................................... .................88,940 ..................(5,796) ..........................0 .................88,940 ..........................0 ..................(5,796)
28. Credit........................................................................................... ..........................0 ..........................0 ..........................0 ..........................0 ..........................0 ..........................0
29. International................................................................................. ..........................0 ...............598,889 ..........................0 ..........................0 ..........................0 ...............598,889
30. Reinsurance - nonproportional assumed property....................... ............XXX............ ............3,343,637 ..........................0 ..........................0 ..........................0 ............3,343,637
31. Reinsurance - nonproportional assumed liability......................... ............XXX............ ............1,311,731 ..........................0 ..........................0 ..........................0 ............1,311,731
32. Reinsurance - nonproportional assumed financial lines.............. ............XXX............ .................41,783 ..........................0 ..........................0 ..........................0 .................41,783
33. Aggregate write-ins for other lines of business............................ ..........................0 ..........................0 ..........................0 ..........................0 ..........................0 ..........................0
34. TOTALS....................................................................................... .....1,443,669,706 ........122,126,104 ..........................0 .....1,443,669,706 ..........................0 ........122,126,104
DETAILS OF WRITE-INS
3301. ..................................................................................................... ..........................0 ..........................0 ..........................0 ..........................0 ..........................0 ..........................0
3302. ..................................................................................................... ..........................0 ..........................0 ..........................0 ..........................0 ..........................0 ..........................0
3303. ..................................................................................................... ..........................0 ..........................0 ..........................0 ..........................0 ..........................0 ..........................0
3398. Summary of remaining write-ins for Line 33 from overflow page. ..........................0 ..........................0 ..........................0 ..........................0 ..........................0 ..........................0
3399. TOTALS (Lines 3301 thru 3303 plus 3398) (Line 33 above)....... ..........................0 ..........................0 ..........................0 ..........................0 ..........................0 ..........................0
(a) Does the company's direct premiums written include premiums recorded on an installment basis? Yes [ X ] No [ ] If yes: 1. The amount of such installment premiums $.....232,286,272. 2. Amount at which such installment premiums would have been reported had they been recorded on an annualized basis $.....236,603,725.

Annual Statement for the year 2002 of the TWIN CITY FIRE INSURANCE COMPANY
9
UNDERWRITING AND INVESTMENT EXHIBIT PART 2 - LOSSES PAID AND INCURRED
Losses Paid Less Salvage 5 6 7 81 2 3 4 Percentage of
Net Losses Losses Losses IncurredUnpaid Net Losses Incurred (Col. 7, Part 2)
Direct Reinsurance Reinsurance Net Payments Current Year Unpaid Current Year to Premiums EarnedLine of Business Business Assumed Recovered (Cols. 1 + 2 - 3) (Part 2A, Col. 8) Prior Year (Cols. 4 + 5 - 6) (Col. 4, Part 1)
1. Fire................................................................................................... ..............................999,688 ...........................1,566,400 ..............................999,688 ...........................1,566,400 ...........................1,923,943 ...........................1,625,515 ...........................1,864,828 ...................................45.12. Allied lines......................................................................................... ...........................5,325,737 ...........................1,077,129 ...........................5,325,737 ...........................1,077,129 ..............................835,521 ..............................626,034 ...........................1,286,616 ...................................71.13. Farmowners multiple peril.................................................................. ........................................0 ................................(1,819) ........................................0 ................................(1,819) ...............................12,300 ...............................34,344 ..............................(23,863) .............................(2,029.2)4. Homeowners multiple peril................................................................. .........................20,632,608 ...........................5,136,440 .........................20,632,608 ...........................5,136,440 ...........................2,466,011 ...........................2,106,336 ...........................5,496,115 ...................................60.65. Commercial multiple peril................................................................... .........................47,080,909 ...........................9,119,530 .........................47,080,909 ...........................9,119,530 .........................13,952,016 .........................13,810,807 ...........................9,260,739 ...................................45.16. Mortgage guaranty............................................................................. ........................................0 ........................................0 ........................................0 ........................................0 ........................................0 ........................................0 ........................................0 .....................................0.08. Ocean marine.................................................................................... ...............................49,884 ..............................109,867 ...............................49,884 ..............................109,867 ..............................215,347 ..............................225,775 ...............................99,439 ...................................26.39. Inland marine..................................................................................... .........................31,817,346 ...........................1,137,319 .........................31,817,346 ...........................1,137,319 ..............................587,667 ..............................460,514 ...........................1,264,472 ...................................35.9
10. Financial guaranty............................................................................. ........................................0 ........................................0 ........................................0 ........................................0 ........................................0 ........................................0 ........................................0 .....................................0.011.1 Medical malpractice - occurrence....................................................... ........................................0 ...............................18,181 ........................................0 ...............................18,181 ...............................46,234 ...............................59,444 .................................4,971 .............................16,570.011.2 Medical malpractice - claims-made.................................................... ...............................90,000 ...............................55,604 ...............................90,000 ...............................55,604 ..............................282,475 ..............................303,751 ...............................34,328 .....................................0.012. Earthquake........................................................................................ ........................................0 ...............................22,635 ........................................0 ...............................22,635 .................................4,817 ...............................18,478 .................................8,974 .....................................3.513. Group accident and health................................................................. ........................................0 ........................................0 ........................................0 ........................................0 ........................................0 ........................................0 ........................................0 .....................................0.014. Credit accident and health (group and individual)................................ ........................................0 ........................................0 ........................................0 ........................................0 ........................................0 ........................................0 ........................................0 .....................................0.015. Other accident and health.................................................................. ........................................0 ........................................0 ........................................0 ........................................0 ........................................0 ........................................0 ........................................0 .....................................0.016. Workers' compensation...................................................................... .......................182,190,656 ...........................9,560,044 .......................182,190,656 ...........................9,560,044 .........................48,676,451 .........................45,791,375 .........................12,445,120 ...................................62.017.1 Other liability - occurrence................................................................. .......................112,516,241 ...........................2,676,361 .......................112,516,241 ...........................2,676,361 .........................19,329,006 .........................18,293,112 ...........................3,712,255 ...................................95.517.2 Other liability - claims-made............................................................... .........................26,464,000 ..............................583,469 .........................26,464,000 ..............................583,469 ...........................2,735,951 ...........................1,922,277 ...........................1,397,143 ...................................55.218.1 Products liability - occurrence............................................................ ...........................6,643,035 ..............................275,657 ...........................6,643,035 ..............................275,657 ...........................2,248,084 ...........................3,156,245 ............................(632,504) ................................(107.3)18.2 Products liability - claims-made.......................................................... ..............................100,000 .................................8,389 ..............................100,000 .................................8,389 ...............................71,453 ...............................84,667 ................................(4,825) ..................................(17.2)
19.1, 19.2 Private passenger auto liability........................................................... .........................80,138,370 .........................12,937,561 .........................80,138,370 .........................12,937,561 .........................15,317,996 .........................14,141,854 .........................14,113,703 ...................................76.519.3, 19.4 Commercial auto liability.................................................................... .........................28,033,639 ...........................4,263,521 .........................28,033,639 ...........................4,263,521 ...........................6,750,395 ...........................6,890,392 ...........................4,123,524 ...................................55.8
21. Auto physical damage........................................................................ .........................52,958,968 ...........................8,083,939 .........................52,958,968 ...........................8,083,939 ..............................951,267 ...........................1,194,011 ...........................7,841,195 ...................................56.022. Aircraft (all perils)............................................................................... ........................................0 ..............................396,889 ........................................0 ..............................396,889 ..............................376,369 ..............................308,704 ..............................464,554 ...................................48.623. Fidelity.............................................................................................. ...............................63,691 ..............................223,391 ...............................63,691 ..............................223,391 ..............................305,113 ..............................384,778 ..............................143,726 ...................................21.724. Surety............................................................................................... ........................................0 ..............................537,445 ........................................0 ..............................537,445 ..............................838,543 ..............................571,642 ..............................804,346 ...................................52.426. Burglary and theft.............................................................................. .................................1,950 .................................9,502 .................................1,950 .................................9,502 ...............................93,126 ...............................78,456 ...............................24,172 ...................................23.627. Boiler and machinery......................................................................... ........................................0 .................................2,181 ........................................0 .................................2,181 ................................(3,507) ...............................10,435 ..............................(11,761) .................................551.428. Credit................................................................................................ ........................................0 ........................................0 ........................................0 ........................................0 ...............................10,296 .................................5,675 .................................4,621 .....................................0.029. International...................................................................................... ........................................0 ..............................574,504 ........................................0 ..............................574,504 ..............................930,250 ..............................934,772 ..............................569,982 ...................................85.230. Reinsurance - nonproportional assumed property............................... ....................XXX................ ...........................2,203,576 ........................................0 ...........................2,203,576 ...........................4,372,173 ...........................4,768,543 ...........................1,807,206 ...................................55.631. Reinsurance - nonproportional assumed liability................................. ....................XXX................ ...........................1,731,300 ........................................0 ...........................1,731,300 .........................10,610,365 ...........................9,722,087 ...........................2,619,578 .................................201.532. Reinsurance - nonproportional assumed financial lines....................... ....................XXX................ ..............................200,666 ........................................0 ..............................200,666 ..............................424,654 ..............................370,478 ..............................254,842 .................................430.133. Aggregate write-ins for other lines of business.................................... ........................................0 ........................................0 ........................................0 ........................................0 ........................................0 ........................................0 ........................................0 .....................................0.034. TOTALS............................................................................................ .......................595,106,722 .........................62,509,681 .......................595,106,722 .........................62,509,681 .......................134,364,316 .......................127,900,501 .........................68,973,496 ...................................59.9
DETAILS OF WRITE-INS3301. ......................................................................................................... ........................................0 ........................................0 ........................................0 ........................................0 ........................................0 ........................................0 ........................................0 .....................................0.03302. ......................................................................................................... ........................................0 ........................................0 ........................................0 ........................................0 ........................................0 ........................................0 ........................................0 .....................................0.03303. ......................................................................................................... ........................................0 ........................................0 ........................................0 ........................................0 ........................................0 ........................................0 ........................................0 .....................................0.03398. Summary of remaining write-ins for Line 33 from overflow page.......... ........................................0 ........................................0 ........................................0 ........................................0 ........................................0 ........................................0 ........................................0 ...........................................3399. Totals (Lines 3301 thru 3303 plus 3398) (Line 33 above).................... ........................................0 ........................................0 ........................................0 ........................................0 ........................................0 ........................................0 ........................................0 .....................................0.0

Annual Statement for the year 2002 of the TWIN CITY FIRE INSURANCE COMPANY
10
UNDERWRITING AND INVESTMENT EXHIBIT PART 2A - UNPAID LOSSES AND LOSS ADJUSTMENT EXPENSES
Reported Losses Incurred But Not Reported 8 91 2 3 4 5 6 7
Deduct Reinsurance Net Losses ExcludingRecoverable from Incurred but Net Losses Unpaid Loss
Authorized and not Reported Reinsurance Reinsurance Unpaid AdjustmentLine of Business Direct Reinsurance Assumed Unauthorized Companies (Cols. 1 + 2 - 3) Direct Assumed Ceded (Cols. 4 + 5 + 6 - 7) Expenses
1. Fire.............................................................................................. ......................1,224,640 ......................1,235,230 ......................1,224,640 ......................1,235,230 .........................482,268 .........................688,713 .........................482,268 ......................1,923,943 .........................136,0432. Allied lines.................................................................................... ......................1,311,549 .........................125,305 ......................1,311,549 .........................125,305 .........................772,341 .........................710,216 .........................772,341 .........................835,521 ...........................48,3513. Farmowners multiple peril............................................................. ...................................0 ...........................14,608 ...................................0 ...........................14,608 .............................2,380 ............................(2,308) .............................2,380 ...........................12,300 ............................(2,906)4. Homeowners multiple peril............................................................ ......................5,661,902 ......................1,675,499 ......................5,661,902 ......................1,675,499 ......................3,839,972 .........................790,512 ......................3,839,972 ......................2,466,011 .........................480,1135. Commercial multiple peril.............................................................. ....................53,031,218 ......................8,656,700 ....................53,031,218 ......................8,656,700 ....................25,454,110 ......................5,295,316 ....................25,454,110 ....................13,952,016 ......................4,763,8926. Mortgage guaranty....................................................................... ...................................0 ...................................0 ...................................0 ...................................0 ...................................0 ...................................0 ...................................0 ...................................0 ...................................08. Ocean marine............................................................................... .............................8,130 .........................120,831 .............................8,130 .........................120,831 ...........................40,818 ...........................94,516 ...........................40,818 .........................215,347 ..........................(31,285)9. Inland marine............................................................................... ....................28,889,261 .........................388,153 ....................28,889,261 .........................388,153 ........................(105,666) .........................199,514 ........................(105,666) .........................587,667 .........................117,555
10. Financial guaranty........................................................................ ...................................0 ...................................0 ...................................0 ...................................0 ...................................0 ...................................0 ...................................0 ...................................0 ...................................011.1 Medical malpractice - occurrence.................................................. ...................................0 ...........................38,040 ...................................0 ...........................38,040 ........................(344,412) .............................8,194 ........................(344,412) ...........................46,234 ...........................32,25811.2 Medical malpractice - claims-made............................................... .........................284,924 ...........................89,305 .........................284,924 ...........................89,305 .........................693,456 .........................193,170 .........................693,456 .........................282,475 ...........................34,21412. Earthquake................................................................................... .............................5,051 .............................2,980 .............................5,051 .............................2,980 ...................................0 .............................1,837 ...................................0 .............................4,817 ..................................9713. Group accident and health............................................................ ...................................0 ...................................0 ...................................0 ...................................0 ...................................0 ...................................0 ...................................0 (a)...............................0 ...................................014. Credit accident and health (group and individual)........................... ...................................0 ...................................0 ...................................0 ...................................0 ...................................0 ...................................0 ...................................0 ...................................0 ...................................015. Other accident and health............................................................. ...................................0 ...................................0 ...................................0 ...................................0 ...................................0 ...................................0 ...................................0 (a)...............................0 ...................................016. Workers' compensation................................................................ ..................506,777,490 ....................26,696,576 ..................506,777,490 ....................26,696,576 ..................353,632,673 ....................21,979,875 ..................353,632,673 ....................48,676,451 ......................5,448,58117.1 Other liability - occurrence............................................................ ..................169,153,989 ......................4,502,284 ..................169,153,989 ......................4,502,284 ..................241,974,597 ....................14,826,722 ..................241,974,597 ....................19,329,006 ......................2,687,52417.2 Other liability - claims-made.......................................................... ....................54,199,006 .........................747,572 ....................54,199,006 .........................747,572 ..................158,380,315 ......................1,988,379 ..................158,380,315 ......................2,735,951 .........................981,70318.1 Products liability - occurrence....................................................... ......................8,058,670 .........................431,824 ......................8,058,670 .........................431,824 ....................60,859,712 ......................1,816,260 ....................60,859,712 ......................2,248,084 .........................706,24918.2 Products liability - claims-made..................................................... .........................307,500 ...........................27,243 .........................307,500 ...........................27,243 .........................696,519 ...........................44,210 .........................696,519 ...........................71,453 ...........................62,611
19.1, 19.2 Private passenger auto liability...................................................... ....................75,696,667 ....................10,050,384 ....................75,696,667 ....................10,050,384 ....................36,761,933 ......................5,267,612 ....................36,761,933 ....................15,317,996 ......................2,978,82619.3, 19.4 Commercial auto liability............................................................... ....................32,858,825 ......................4,506,755 ....................32,858,825 ......................4,506,755 ....................23,155,982 ......................2,243,640 ....................23,155,982 ......................6,750,395 ......................1,043,899
21. Auto physical damage.................................................................. ......................5,986,530 .........................911,350 ......................5,986,530 .........................911,350 .........................237,955 ...........................39,917 .........................237,955 .........................951,267 .........................423,63922. Aircraft (all perils)......................................................................... ...................................0 .........................343,745 ...................................0 .........................343,745 ...................................0 ...........................32,624 ...................................0 .........................376,369 ...........................88,75623. Fidelity......................................................................................... .........................416,167 .........................184,240 .........................416,167 .........................184,240 ......................1,059,677 .........................120,873 ......................1,059,677 .........................305,113 ...........................77,37924. Surety.......................................................................................... ...................................0 .........................557,551 ...................................0 .........................557,551 ...............................(264) .........................280,992 ...............................(264) .........................838,543 .........................213,65726. Burglary and theft......................................................................... ...................................0 .............................3,769 ...................................0 .............................3,769 ...................................0 ...........................89,357 ...................................0 ...........................93,126 .............................6,67027. Boiler and machinery.................................................................... ...................................0 ...............................(422) ...................................0 ...............................(422) ............................(6,093) ............................(3,085) ............................(6,093) ............................(3,507) ...............................(102)28. Credit........................................................................................... ...................................0 ...................................0 ...................................0 ...................................0 ...................................0 ...........................10,296 ...................................0 ...........................10,296 .............................3,52229. International................................................................................. ...................................0 .........................683,766 ...................................0 .........................683,766 ...................................0 .........................246,484 ...................................0 .........................930,250 ...........................20,51830. Reinsurance - nonproportional assumed property.......................... ................XXX................ ......................1,463,971 ...................................0 ......................1,463,971 ................XXX................ ......................2,908,202 ...................................0 ......................4,372,173 ...........................28,78931. Reinsurance - nonproportional assumed liability............................ ................XXX................ ......................6,615,883 ...................................0 ......................6,615,883 ................XXX................ ......................3,994,482 ...................................0 ....................10,610,365 ...........................43,94832. Reinsurance - nonproportional assumed financial lines.................. ................XXX................ .........................369,065 ...................................0 .........................369,065 ................XXX................ ...........................55,589 ...................................0 .........................424,654 ................................33133. Aggregate write-ins for other lines of business.............................. ...................................0 ...................................0 ...................................0 ...................................0 ...................................0 ...................................0 ...................................0 ...................................0 ...................................034. TOTALS....................................................................................... ..................943,871,519 ....................70,442,207 ..................943,871,519 ....................70,442,207 ..................907,588,273 ....................63,922,109 ..................907,588,273 ..................134,364,316 ....................20,394,832
DETAILS OF WRITE-INS3301. .................................................................................................... ...................................0 ...................................0 ...................................0 ...................................0 ...................................0 ...................................0 ...................................0 ...................................0 ...................................03302. .................................................................................................... ...................................0 ...................................0 ...................................0 ...................................0 ...................................0 ...................................0 ...................................0 ...................................0 ...................................03303. .................................................................................................... ...................................0 ...................................0 ...................................0 ...................................0 ...................................0 ...................................0 ...................................0 ...................................0 ...................................03398. Summary of remaining write-ins for Line 33 from overflow page..... ...................................0 ...................................0 ...................................0 ...................................0 ...................................0 ...................................0 ...................................0 ...................................0 ...................................03399. Totals (Lines 3301 thru 3303 plus 3398) (Line 33 above)............... ...................................0 ...................................0 ...................................0 ...................................0 ...................................0 ...................................0 ...................................0 ...................................0 ...................................0
(a) Including $..........0 for present value of life indemnity claims.

Annual Statement for the year 2002 of the TWIN CITY FIRE INSURANCE COMPANY
11
UNDERWRITING AND INVESTMENT EXHIBIT PART 3 - EXPENSES
1 2 3 4Other
Loss Adjustment Underwriting InvestmentExpenses Expenses Expenses Total
1. Claim adjustment services:
1.1 Direct....................................................................................................................... .................76,222,219 ................................0 ................................0 .................76,222,219
1.2 Reinsurance assumed.............................................................................................. ..................7,304,417 ................................0 ................................0 ..................7,304,417
1.3 Reinsurance ceded................................................................................................... .................76,222,219 ................................0 ................................0 .................76,222,219
1.4 Net claim adjustment services (1.1 + 1.2 - 1.3).......................................................... ..................7,304,417 ................................0 ................................0 ..................7,304,417
2. Commission and brokerage:
2.1 Direct excluding contingent....................................................................................... ................................0 ...............147,773,419 ................................0 ...............147,773,419
2.2 Reinsurance assumed excluding contingent.............................................................. ................................0 .................12,392,482 ................................0 .................12,392,482
2.3 Reinsurance ceded excluding contingent................................................................... ................................0 ...............147,773,419 ................................0 ...............147,773,419
2.4 Contingent - direct.................................................................................................... ................................0 .................24,285,826 ................................0 .................24,285,826
2.5 Contingent - reinsurance assumed............................................................................ ................................0 ..................2,053,265 ................................0 ..................2,053,265
2.6 Contingent - reinsurance ceded................................................................................. ................................0 .................24,285,826 ................................0 .................24,285,826
2.7 Policy and membership fees..................................................................................... ................................0 ................................0 ................................0 ................................0
2.8 Net commission and brokerage (2.1 + 2.2 - 2.3 + 2.4 + 2.5 - 2.6 + 2.7)...................... ................................0 .................14,445,747 ................................0 .................14,445,747
3. Allowances to managers and agents................................................................................. ...........................(149) ..................1,018,571 ................................0 ..................1,018,422
4. Advertising....................................................................................................................... ..............................69 .......................37,435 ..............................40 .......................37,544
5. Boards, bureaus and associations.................................................................................... .......................77,547 .....................377,651 ..............................11 .....................455,209
6. Surveys and underwriting reports...................................................................................... .....................110,468 .....................334,668 ..............................12 .....................445,148
7. Audit of assureds' records................................................................................................ ........................(1,585) ............................207 ................................0 ........................(1,378)
8. Salary and related items:
8.1 Salaries.................................................................................................................... ..................2,431,774 ..................8,580,702 .....................171,562 .................11,184,038
8.2 Payroll taxes............................................................................................................. .....................231,619 .....................881,604 .......................11,539 ..................1,124,762
9. Employee relations and welfare........................................................................................ .....................926,854 .....................337,088 .......................11,969 ..................1,275,911
10. Insurance......................................................................................................................... .......................22,565 .....................126,160 ............................726 .....................149,451
11. Directors' fees.................................................................................................................. ...............................(7) ................................0 ................................0 ...............................(7)
12. Travel and travel items..................................................................................................... .....................187,384 .....................540,155 .........................2,805 .....................730,344
13. Rent and rent items.......................................................................................................... .....................543,009 .....................970,070 ......................(17,100) ..................1,495,979
14. Equipment........................................................................................................................ .......................62,232 .....................148,363 ........................(5,124) .....................205,471
15. Cost or depreciation of EDP equipment and software........................................................ .....................688,227 ....................(477,000) .......................22,953 .....................234,180
16. Printing and stationery...................................................................................................... .....................193,889 .....................286,695 .........................3,355 .....................483,939
17. Postage, telephone and telegraph, exchange and express................................................ .....................289,822 .....................937,956 .......................27,777 ..................1,255,555
18. Legal and auditing............................................................................................................ ......................(33,842) .......................81,808 .......................12,694 .......................60,660
19. Totals (Lines 3 to 18)........................................................................................................ ..................5,729,876 .................14,182,133 .....................243,219 .................20,155,228
20. Taxes, licenses and fees:
20.1 State and local insurance taxes deducting guaranty association credits of $.....30,304.......................................................................................................... ..............................29 ..................3,235,934 .....................412,913 ..................3,648,876
20.2. Insurance department licenses and fees................................................................. ................................0 .....................196,834 .........................1,533 .....................198,367
20.3. Gross guaranty association assessments............................................................... ................................0 .....................571,309 ................................0 .....................571,309
20.4. All other (excluding federal and foreign income and real estate).............................. ........................(2,497) .....................135,707 ..............................77 .....................133,287
20.5. Total taxes, licenses and fees (20.1 + 20.2 + 20.3 + 20.4)...................................... ........................(2,468) ..................4,139,784 .....................414,523 ..................4,551,839
21. Real estate expenses....................................................................................................... ................................0 ................................0 ................................0 ................................0
22. Real estate taxes............................................................................................................. ................................0 ................................0 ................................0 ................................0
23. Reimbursements by uninsured accident and health plans.................................................. ................................0 ................................0 ................................0 ................................0
24. Aggregate write-ins for miscellaneous expenses............................................................... ......................(94,784) ..................1,764,434 .......................24,654 ..................1,694,304
25. Total expenses incurred................................................................................................... .................12,937,041 .................34,532,098 .....................682,396 (a)............48,151,535
26. Less unpaid expenses - current year................................................................................. .................20,394,834 ..................6,242,188 .....................317,234 .................26,954,256
27. Add unpaid expenses - prior year...................................................................................... .................19,304,282 ..................5,917,141 .....................249,771 .................25,471,194
28. Amounts receivable relating to uninsured accident and health plans, prior year.................. ................................0 ................................0 ................................0 ................................0
29. Amounts receivable relating to uninsured accident and health plans, current year.............. ................................0 ................................0 ................................0 ................................0
30. TOTAL EXPENSES PAID (Lines 25 - 26 + 27 - 28 + 29).............................................. .................11,846,489 .................34,207,051 .....................614,933 .................46,668,473
DETAILS OF WRITE-INS2401. Miscellaneous.................................................................................................................. ......................(95,030) ..................1,762,585 .......................24,624 ..................1,692,179
2402. Donations......................................................................................................................... ............................246 .........................1,849 ..............................30 .........................2,125
2403. ........................................................................................................................................ ................................0 ................................0 ................................0 ................................0
2498. Summary of remaining write-ins for Line 24 from overflow page......................................... ................................0 ................................0 ................................0 ................................0
2499. Totals (Lines 2401 thru 2403 plus 2498) (Line 24 above)................................................... ......................(94,784) ..................1,764,434 .......................24,654 ..................1,694,304
(a) Includes management fees of $.....268,918 to affiliates and $..........0 to non-affiliates.

Annual Statement for the year 2002 of the TWIN CITY FIRE INSURANCE COMPANY
12
EXHIBIT OF NET INVESTMENT INCOME1 2
Collected EarnedDuring Year During Year
1. U.S. government bonds........................................................................................................................................................ (a).............................342,083 .................................396,2441.1 Bonds exempt from U.S. tax................................................................................................................................................. (a)........................16,420,732 ............................16,827,3421.2 Other bonds (unaffiliated)...................................................................................................................................................... (a)..........................1,945,718 ..............................1,995,0691.3 Bonds of affiliates................................................................................................................................................................. (a).......................................0 ...........................................02.1 Preferred stocks (unaffiliated)............................................................................................................................................... (b).............................642,535 .................................562,0192.11 Preferred stocks of affiliates.................................................................................................................................................. (b).......................................0 ...........................................02.2 Common stocks (unaffiliated)................................................................................................................................................ ...........................................0 ...........................................02.21 Common stocks of affiliates.................................................................................................................................................. ...........................................0 ...........................................03. Mortgage loans..................................................................................................................................................................... (c).......................................0 ...........................................04. Real estate........................................................................................................................................................................... (d).......................................0 ...........................................05. Contract loans...................................................................................................................................................................... ...........................................0 ...........................................06. Cash/short-term investments................................................................................................................................................ (e).............................263,863 .................................263,8637. Derivative instruments.......................................................................................................................................................... (f)........................................0 ...........................................08. Other invested assets........................................................................................................................................................... ...........................................0 ...........................................09. Aggregate write-ins for investment income............................................................................................................................ ....................................(1,308) ....................................(1,308)
10. Total gross investment income............................................................................................................................................. ............................19,613,623 ............................20,043,22911. Investment expenses............................................................................................................................................................................................................ (g).............................267,87612. Investment taxes, licenses and fees, excluding federal income taxes..................................................................................................................................... (g).............................414,52213. Interest expense................................................................................................................................................................................................................... (h).......................................014. Depreciation on real estate and other invested assets............................................................................................................................................................ (i)........................................015. Aggregate write-ins for deductions from investment income................................................................................................................................................... ...........................................016. Total deductions (Lines 11 through 15).................................................................................................................................................................................. .................................682,39817. Net investment income (Line 10 minus Line 16)..................................................................................................................................................................... ............................19,360,831
DETAILS OF WRITE-INS0901. Miscellaneous interest.......................................................................................................................................................... ....................................(1,308) ....................................(1,308)0902. ............................................................................................................................................................................................ ...........................................0 ...........................................00903. ............................................................................................................................................................................................ ...........................................0 ...........................................00998. Summary of remaining write-ins for Line 9 from overflow page............................................................................................... ...........................................0 ...........................................00999. Totals (Lines 0901 thru 0903 plus 0998) (Line 9 above)......................................................................................................... ....................................(1,308) ....................................(1,308)1501. ............................................................................................................................................................................................................................................. ...........................................01502. ............................................................................................................................................................................................................................................. ...........................................01503. ............................................................................................................................................................................................................................................. ...........................................01598. Summary of remaining write-ins for Line 15 from overflow page............................................................................................................................................. ...........................................01599. Totals (Lines 1501 thru 1503 plus 1598) (Line 15 above)........................................................................................................................................................ ...........................................0(a) Includes $.....1,552,175 accrual of discount less $.....433,590 amortization of premium and less $.....494,697 paid for accrued interest on purchases. (b) Includes $..........0 accrual of discount less $..........0 amortization of premium and less $..........0 paid for accrued dividends on purchases. (c) Includes $..........0 accrual of discount less $..........0 amortization of premium and less $..........0 paid for accrued interest on purchases. (d) Includes $..........0 for company's occupancy of its own buildings; and excludes $..........0 interest on encumbrances. (e) Includes $..........0 accrual of discount less $..........0 amortization of premium and less $..........0 paid for accrued interest on purchases. (f) Includes $..........0 accrual of discount less $..........0 amortization of premium. (g) Includes $.....622,548 investment expenses and $.....59,850 investment taxes, licenses and fees, excluding federal income taxes, attributable to segregated and Separate Accounts. (h) Includes $..........0 interest on surplus notes and $..........0 interest on capital notes. (i) Includes $..........0 depreciation on real estate and $..........0 depreciation on other invested assets.
EXHIBIT OF CAPITAL GAINS (LOSSES)1 2 3 4 5
Net Gain or (Loss)from Change in
Difference BetweenRealized Basis Book/
Gain (Loss) Other Increases Adjustedon Sales Realized (Decreases) by Carrying and
or Maturity Adjustments Adjustment Admitted Values Total1. U.S. government bonds............................................................ ........................26,072 ................................0 ................................0 ................................0 ........................26,0721.1 Bonds exempt from U.S. tax..................................................... ......................868,084 ................................0 ................................0 ................................0 ......................868,0841.2 Other bonds (unaffiliated)......................................................... .......................(51,891) ................................0 ................................0 .....................(780,378) .....................(832,269)1.3 Bonds of affiliates..................................................................... ................................0 ................................0 ................................0 ................................0 ................................02.1 Preferred stocks (unaffiliated)................................................... ................................0 ................................0 ................................0 ........................92,600 ........................92,6002.11 Preferred stocks of affiliates..................................................... ................................0 ................................0 ................................0 ................................0 ................................02.2 Common stocks (unaffiliated)................................................... ................................0 ................................0 ................................0 ................................0 ................................02.21 Common stocks of affiliates...................................................... ................................0 ................................0 ................................0 ................................0 ................................03. Mortgage loans........................................................................ ................................0 ................................0 ................................0 ................................0 ................................04. Real estate.............................................................................. ................................0 ................................0 ................................0 ................................0 ................................05. Contract loans.......................................................................... ................................0 ................................0 ................................0 ................................0 ................................06. Cash/short-term investments.................................................... ................................0 ................................0 ................................0 ................................0 ................................07. Derivative instruments.............................................................. ................................0 ................................0 ................................0 ................................0 ................................08. Other invested assets............................................................... ................................0 ................................0 ................................0 ................................0 ................................09. Aggregate write-ins for capital gains (losses)............................ ................................0 ................................0 ................................0 .......................(41,000) .......................(41,000)
10. Total capital gains (losses)....................................................... ......................842,265 ................................0 ................................0 .....................(728,778) ......................113,487DETAILS OF WRITE-INS
0901. Net deferred tax unrealized gain(loss)....................................... ................................0 ................................0 ................................0 .......................(41,000) .......................(41,000)0902. ................................................................................................ ................................0 ................................0 ................................0 ................................0 ................................00903. ................................................................................................ ................................0 ................................0 ................................0 ................................0 ................................00998. Summary of remaining write-ins for Line 9 from overflow page.. ................................0 ................................0 ................................0 ................................0 ................................00999. Totals (Lines 0901 thru 0903 plus 0998) (Line 9 above)............. ................................0 ................................0 ................................0 .......................(41,000) .......................(41,000)

Annual Statement for the year 2002 of the TWIN CITY FIRE INSURANCE COMPANY
13
EXHIBIT 1 - ANALYSIS OF NONADMITTED ASSETS AND RELATED ITEMS1 2 3
End of End of Changes for YearCurrent Year Prior Year (Increase) Decrease
1. Summary of Items Page 2, Lines 10 to 17 and 19 to 23, Column 2................................................ ............................5,460,775 ............................7,766,945 ............................2,306,170
2. Other Nonadmitted Assets:
2.1 Bills receivable..................................................................................................................... .........................................0 .........................................0 .........................................0
2.2 Furniture, equipment and supplies........................................................................................ .........................................0 .........................................0 .........................................0
2.3 Leasehold improvements...................................................................................................... .........................................0 .........................................0 .........................................0
2.4 Loans on personal security, endorsed or not......................................................................... .........................................0 .........................................0 .........................................0
3. Total (Lines 2.1 to 2.4)................................................................................................................. .........................................0 .........................................0 .........................................0
4. Aggregate write-ins for other assets............................................................................................. .........................................0 .........................................0 .........................................0
5. Total (Line 1 plus Lines 3 and 4)................................................................................................... ............................5,460,775 ............................7,766,945 ............................2,306,170
DETAILS OF WRITE-INS
0401. .................................................................................................................................................... .........................................0 .........................................0 .........................................0
0402. .................................................................................................................................................... .........................................0 .........................................0 .........................................0
0403. .................................................................................................................................................... .........................................0 .........................................0 .........................................0
0498. Summary of remaining write-ins for Line 4 from overflow page...................................................... .........................................0 .........................................0 .........................................0
0499. Totals (Lines 0401 thru 0403 plus 0498) (Line 4 above)................................................................ .........................................0 .........................................0 .........................................0

Annual Statement for the year 2002 of the TWIN CITY FIRE INSURANCE COMPANY
14
1. SUMMARY OF SIGNIFICANT ACCOUNTING POLICIES
A. Accounting Practices
The accompanying financial statements of the Company have been prepared in conformity with statutory accounting practices prescribed, or otherwisepermitted by the National Association of Insurance Commissioners (“NAIC”) and the State of Domicile. The NAIC Accounting and Practices andProcedures manual, (“NAIC SAP”) has been adopted, by the State of Domicile.
B. Use of Estimates in the Preparation of the Financial Statements
The preparation of financial statements in conformity with Statutory Accounting Principles requires management to make estimates and assumptions thataffect the reported amounts of assets and liabilities. It also requires disclosure of contingent assets and liabilities at the date of the financial statements andthe reported amounts of revenue and expenses during the period. Actual results could differ from those estimates.
C. Accounting Policy
Premiums are earned over the terms of the related insurance policies and reinsurance contracts. Unearned premium reserves are established to cover theunexpired portion of the premiums written. Such reserves are computed by pro rata methods for direct business and are based on reports received fromceding companies for reinsurance.
Expenses incurred in connection with acquiring new insurance business, including such acquisition costs as sales commission, are changed to operationsas incurred. Expenses incurred are reduced for ceding allowances received or receivable.
In addition, the company uses the following accounting policies:
Short-term investments are stated at amortized cost.
Bonds not backed by other loans are stated at amortized cost using the interest method.
The Company has no investments in common stocks.
Preferred stocks are carried at market with the exception of redeemable preferred stocks, which are stated at cost.
The Company has no investments in mortgage loans.
Loan backed bonds and structured securities are carried at amortized cost using the interest method including anticipated prepayments at the date ofpurchase. Significant changes in estimated cash flows from the original purchase assumptions are accounted for using the prospective method,except for highly rated fixed rate securities, which use the retrospective method.
The Company has no investments in subsidiaries.
The Company does not have any interest in joint ventures, partnerships and limited liability companies.
The Company has no investments in derivative instruments.
10. The Company did not consider anticipated investment income as a factor in the premium deficiency calculation, in accordance with Statements ofStatutory Accounting Principles (SSAP) No.53, Property-Casualty Contracts-Premiums.
11. Unpaid losses and loss adjustment expenses include an amount determined from individual case estimates and loss reports and an amount, basedon past experience, for losses incurred but not reported. Such liabilities are necessarily based on assumptions and estimates and while managementbelieves the amount is adequate, the ultimate liability may be in excess of or less than the amount provided. The methods for establishing theresulting liabilities are continually reviewed and any adjustments are reflected in the period determined.
2. ACCOUNTING CHANGES AND CORRECTIONS OF ERRORS
A. Not applicable
B. Cumulative Effect of Changes in Accounting Principles as a Result of the Initial Implementation of Codification
The Company prepares its statutory financial statements in conformity with accounting practices prescribed or permitted by the State of Domicile. EffectiveJanuary 1, 2001, the State of Domicile required that insurance companies prepare their statutory basis financial statements in accordance with the NAICAccounting Practices and Procedures manual subject to any deviations prescribed or permitted by the State of Domicile’s insurance commissioner.
Accounting changes adopted to conform to the provisions of the NAIC Accounting Practices and Procedures manual are reported as changes inaccounting principles. The cumulative effect of changes in accounting principles is reported as an adjustment to unassigned funds (surplus) in the period ofthe change in accounting principle. The cumulative effect is the difference between the amount of capital and surplus at the beginning of the year and theamount of capital and surplus that would have been reported at that date if the new accounting principles had been applied retroactively for all priorperiods. As a result of these changes, the Company reported a change of accounting principle, as an adjustment that increased unassigned funds(surplus), of $2,601,700 as of January 1, 2001, which was related to SSAP No.10 (Income Taxes).
During 2002, no SSAP’s were implemented that caused any material impacts to net income or surplus.
3. BUSINESS COMBINATIONS AND GOODWILL
A. Statutory Purchase Method
NONE B. Merger
NONE
C. Impairment Loss
NONE
4. DISCONTINUED OPERATIONS
NONE
NOTES TO FINANCIAL STATEMENTS

Annual Statement for the year 2002 of the TWIN CITY FIRE INSURANCE COMPANY
14.1
5. INVESTMENTS
A. Mortgage Loans, including Mezzanine Real Estate Loans
The Company has no investments in Mortgage Loans. B. Debt Restructuring
The Company did not have any recorded investment in restructured loans, as of year-end.
C. Reverse Mortgages
The company has no investments in reverse mortgages.
D. Loan-Backed Securities
1. The company has not elected to use the book value as of January 1, 1994 as the cost for applying the retrospective adjustment method to securitiespurchased prior to that date.
2. Prepayment assumptions for single class and multi-class mortgage-backed/asset-backed securities were obtained from broker dealer survey valuesor internal estimates.
3. The Company used the IDC Pricing Service in determining the market value of its loan-backed securities.
4. In 2002, the Company did not have any securities with negative yields when it changed from the retrospective to prospective methodology.
E. Repurchase Agreements
For repurchase agreements, Company policies require a minimum of 102% of the fair value of securities purchased under repurchase agreements to bemaintained as collateral.
6. JOINT VENTURES, PARTNERSHIPS AND LIMITED LIABILITY COMPANIES
A. The Company has no investments in Joint Ventures, Partnerships or Limited Liability Companies.
B. Not applicable
7. INVESTMENT INCOME
1. Due and accrued was excluded from surplus on the following bases:All investment income due and accrued with amounts that are over 90 days past due.
2. The total amount excluded was $0.
8. DERIVATIVE INSTRUMENTS
NONE
9. INCOME TAXES
A. The components of the net deferred tax asset/(liability) at December 31 are as follows: 12/31/02 12/31/01
1. Total of all deferred tax assets (admitted & nonadmitted) 20,370,000 17,900,000 2. Total of all deferred tax liabilities (4,488,000) (4,156,000) 3. Net Deferred Tax Asset 15,882,000 13,744,000 4. Deferred tax assets nonadmitted (5,170,000) (7,480,000) 5. Net Admitted Deferred Tax Asset 10,712,000 6,264,000 6. (Increase)/decrease in deferred tax assets nonadmitted 2,310,000 614,000
B. Deferred tax liabilities are not recognized for the following amounts: Not applicable
C. Current income taxes incurred consist of the following major components:12/31/02 12/31/01
1. Federal and Foreign Income Tax Expense/(Benefit) before credits and AMT 4,459,379 339,922 2. Tax Credits - - 3. Alternative Minimum Tax 92,303 - 4. Prior period accrual adjustments 1,279,973 1,249,283 5. Current Federal and Foreign Income Taxes Incurred 5,831,655 1,589,205
The main components of the December 31 deferred tax amounts and the change in those components are as follows: (Includes change from 20% to 35%)
12/31/02 12/31/01 Change Deferred Tax Assets 6. Loss Reserve Discounting 9,617,000 8,814,000 803,000 7. Other Insurance/Underwriting Related 4,569,000 3,893,000 676,000 8. Investment Related 22,000 11,000 11,000 9. Benefits Related 585,000 518,000 67,000 10. Depreciable and Amortizable Assets 636,000 559,000 77,000 11. Other 4,941,000 4,105,000 836,000 12. Total deferred tax assets 20,370,000 17,900,000 2,470,000 13. Total nonadmitted deferred tax assets (5,170,000) (7,480,000) 2,310,000
NOTES TO FINANCIAL STATEMENTS

Annual Statement for the year 2002 of the TWIN CITY FIRE INSURANCE COMPANY
14.2
9. INCOME TAXES (continued)
12/31/02 12/31/01 ChangeDeferred Tax Liabilities14. Insurance Related (2,125,000) (1,975,000) (150,000)15. Investment Related (1,280,000) (1,340,000) 60,000 16. Benefits Related (181,000) (88,000) (93,000)17. Other (902,000) (753,000) (149,000)18. Total deferred tax liabilities (4,488,000) (4,156,000) (332,000)
19. Net admitted deferred tax asset 10,712,000 6,264,000 4,448,000
Summary of Deferred Taxes20. Total deferred tax assets 20,370,000 17,900,000 2,470,000 21. Total deferred tax liabilities (4,488,000) (4,156,000) (332,000)22. Net deferred tax asset/(liability) 15,882,000 13,744,000 2,138,000 23. Tax effect of unrealized gains/(losses) 41,000 24. Change in net deferred income tax 2,179,000
D. The sum of the income tax incurred and the change in the deferred tax asset is different From the result obtained by applying the statutory federal income tax rate to the pretax net income. The significant items causing this difference are as follows: % of Pre-Tax
IncomeTax Effect $ 25,039,144
Statutory Tax - 35% 8,763,700 35.00%
1. Tax exempt interest (net of proration) (4,866,013) -19.43%2. Dividends received deduction (net of proration) (89,343) -0.36%3. Nontaxable gain on intercompany transfer 0 0.00%4. All other (155,689) -0.62%5. Total Statutory Income Tax 3,652,655 14.59%
6. Federal and Foreign Income taxes Incurred 5,831,655 23.29%7. Change in Net Deferred Income Taxes (2,179,000) -8.70%8. Total Statutory Income Tax 3,652,655 14.59%
E. 1. At December 31, 2002, the Company had $46,773 of foreign tax credit carryforwards originating in years 1999 through 2002 which expire, if unused, in years 2004 and 2007.
2. The amount of federal income taxes incurred in the current year and prior year that will be available for recoupment in the event of future net losses are:
2002 4,285,136 2001 -
NOTES TO FINANCIAL STATEMENTS

Annual Statement for the year 2002 of the TWIN CITY FIRE INSURANCE COMPANY
14.3
9. INCOME TAXES (continued)
F. 1. The Company's federal income tax return is consolidated with the following entities:
The Hartford Financial Services Group, Inc. (Parent) Access CoverageCorp Technologies, Inc.Nutmeg Insurance Company Hartford Holdings, Inc.Heritage Holdings, Inc. Hartford Life, Inc.Hartford Fire Insurance Company Hartford Life and Accident Insurance CompanyHartford Accident and Indemnity Company Hart Life Insurance CompanyHartford Casualty Insurance Company Nutmeg Life Insurance CompanyHartford Underwriters Insurance Company Hartford Life International Ltd. Twin City Fire Insurance Company Hartford Financial Services Life Insurance CompanyPacific Insurance Company, Ltd. Hartford Equity Sales Company, Inc.Trumbull Insurance Company Hartford Comprehensive Employee Benefit Service Co.Hartford Insurance Company of Illinois Hartford Securities Distribution Company, Inc.Hartford Insurance Company of the Midwest PLANCO IncorporatedHartford Insurance Company of the Southeast PLANCO Financial Services, Inc.Hartford Lloyds Insurance Company The Evergreen Group, Inc.Property & Casualty Insurance Co. of Hartford Hartford Administrative Services CompanySentinel Insurance Company, Ltd. Woodbury Financial Services, Inc.First State Insurance Company Woodbury Financial Agency NM, Inc. (Formerly knownNew England Insurance Company as Fortis Investors NM, Inc.)New England Reinsurance Corporation Woodbury Financial Agency TX, Inc. (Formerly knownFencourt Reinsurance Company, Ltd. As Fortis Agency TX, Inc.)Heritage Reinsurance Co., Ltd. Woodbury Financial Agency MA, Inc. (Formerly knownNew Ocean Insurance Co., Ltd. As Fortis Investors MA, Inc.)Omni Insurance Group, Inc. Hartford Investment Financial Services Co.Omni Insurance Company Hartford Life, Ltd.Omni Indemnity Company Hartford Life Insurance CompanyOmni General Agency, Inc. Hartford Life and Annuity Insurance CompanySpecialty Risk Services, Inc. Hartford International Life Reassurance Corp.Hartford Investment Management Co. Hartford Investment Services, Inc. Limited Liability CompaniesHARCO Property Services, Inc. Trumbull Services L.L.C.Four Thirty Seven Land Company, Inc. Trumbull Finance L.L.C.HRA, Inc. Hartford Technology Services Company, L.L.C.HRA Brokerage Services. Inc. Horizon Management Group L.L.C.Trumbull Recovery Services, Inc. Hartford Int'l Management Services Co. L.L.C.Hartford Technology Services Company BMG Capital Advisors Group, L.L.C.Ersatz Corporation Hart Re Group, L.L.C.The Confluence Group, Inc. Hartre Company, L.L.C.The Hartford Fidelity and Bonding Company Hartford of Florida L.L.C.Hartford Specialty Company Hartford Financial Services L.L.C.1810 Corporation HL Investment Advisors, L.L.C.Terry Associates, Inc. The Hartford International Financial Services Group, L.L.C.Hartford Integrated Technologies, Inc. 1StepSurety, L.L.C.CLA Corporation Nutmeg Administrator, L.L.C.Business Management Group, Inc. Hartford Specialty Insurance Services of Texas, L.L.C.Hartford Fire International, Ltd. First State Management Group Insurance ServicesPersonal Lines Insurance Center, Inc. of Texas, L.L.C.Hartford Re Company Hartford Investor Services Company, L.L.C.Hartford Risk Management, Inc. Hartford Investments Canada CorporationNutmeg Insurance Agency, Inc. Hartford Investment Financial Services, L.L.C.Hartford Lloyds Corporation International Corporate Marketing Group, L.L.C.1st AgChoice, Inc. (Formerly known as Dornberger Specialty Insurance Agency, L.L.C. Berry and Company, Inc.) Capstone Risk Management, L.L.C.ITT New England Management Company, Inc. PPL Holdings L.L.C.First State Management Group, Inc. P2P Link L.L.C.The Hartford Bank, FSB Hartford Strategic Investments, L.L.C.ClaimPlace, Inc. Hartford Hedge Fund Company, L.L.C.Access CoverageCorp, Inc. Hartford Hedge Fund Management, L.L.C.
2. Federal Income Tax Allocation
The Company is included in the consolidated federal income tax return of The Hartford Financial Services Group, Inc. and its includable subsidiaries. Estimated tax payments are made quarterly, at which time intercompany tax settlements are made. In the subsequent year, additional settlements aremade on the unextended due date of the return and at the time that the return is filed. The method of allocation among affiliates of the Company issubject to written agreement approved by the Board of Directors and based upon separate return calculations with current credit for net losses to theextent the losses provide a benefit in the consolidated tax return.
10. INFORMATION CONCERNING PARENT, SUBSIDIARIES, AND AFFILIATES
A&C. See Schedule Y Part 2 Summary of Insurer’s Transactions With Any Affiliates on Page 110.
B. The Schedule of Affiliate Transactions is on Page 14.14.
D. At December 31, 2002, the Company reported $0 as amounts due to an affiliate. At December 31, 2002, the Company reported $1,032,193 amounts duefrom Parent Company, Hartford Fire Insurance Company. When balances exit the terms of the settlement require that these amounts be settled within 30days.
NOTES TO FINANCIAL STATEMENTS

Annual Statement for the year 2002 of the TWIN CITY FIRE INSURANCE COMPANY
14.4
10. INFORMATION CONCERNING PARENT, SUBSIDIARIES, AND AFFILIATES (continued)
E. Guarantees or undertakings including the Company and any affiliated insurers:
1. In 1981, in order for Hartford Insurance Company of the Midwest to be admitted to New Jersey, Hartford Fire Insurance Company (“Hartford Fire”)guaranteed that Hartford Insurance Company of the Midwest's capital and surplus would remain in compliance with the present minimum required bythat state.
2. In 1981, in order for Nutmeg Insurance Company to be admitted to the state of New Jersey, Hartford Accident and Indemnity Company guaranteedthat Nutmeg Insurance Company’s capital and surplus would remain in compliance with the present minimum required by that state.
3. In 1983, in order for Hartford Insurance Company of the Midwest to be admitted to North Carolina, Hartford Fire Insurance Company guaranteed that
Hartford Insurance Company of the Midwest’s capital and surplus would remain in compliance with the present minimum required by that state .4. In 1987, in order for Trumbull Insurance Company to be admitted to the state of New Jersey, Hartford Fire Insurance Company guaranteed that
Trumbull Insurance Company's capital and surplus would remain in compliance with the present minimum required by that state.
5. In 1989, in order for Hartford Insurance Company of the Midwest to be admitted to the state of Maine, Hartford Fire Insurance Company guaranteedthat Hartford Insurance Company of the Midwest's capital and surplus would remain in compliance with the present minimum required by that state.
6. In 1990, Hartford Fire Insurance Company guaranteed the obligations of Hartford Life Insurance Company and Hartford Life and Accident InsuranceCompany with respect to life, accident and health insurance and annuity contracts issued after January 1, 1990. Although the guarantee wasterminated in 1997, it still covers policies that were issued from 1990 to 1997.
7. In 1993, in order for Hartford Life and Annuity Insurance Company to gain unlimited variable annuity authority in North Carolina, Hartford Life andAccident Insurance Company guaranteed Hartford Life and Annuity Insurance Company's variable annuity contract obligations to North Carolinaresidents.
8. In 1993, Hartford Life Insurance Company guaranteed the obligations of the reinsurance agreements of Hartford International Life ReassuranceCorporation.
9. In 1995, in order for Property and Casualty Insurance Company of Hartford to be admitted to the states of Iowa, New Jersey, Maine and Virginia,Hartford Fire Insurance Company guaranteed that Property and Casualty Insurance Company of Hartford’s capital and surplus would remain incompliance with the present minimum required by those states.
10. In 1996, in order for Property and Casualty Insurance Company of Hartford to be admitted to the state of Connecticut, Nutmeg Insurance Companyguaranteed that Property and Casualty Insurance Company of Hartford’s capital and surplus would remain in compliance with the present minimumrequired by that state.
11. In 1997, Hartford Life Insurance Company guaranteed the obligations of Hartford - Comprehensive Employee Benefit Service Company with respectto structured settlement liability obligations.
12. In 1997, Hartford Life Insurance Company guaranteed the obligations of Hartford Life and Annuity Insurance Company with respect to life, accidentand health insurance and annuity contracts.
13. In 1998, Hartford Life and Accident Insurance Company guaranteed the obligations of Hartford - Comprehensive Employee Benefit ServiceCompany with respect to structured settlement liability obligations.
14. In 1999, in order for Hart Life Insurance Company to extend its current Certificate of Authority to include the authority to transact the business ofcontracts on a variable basis, Hartford Life and Accident Insurance Company guaranteed Hart Life Insurance Company’s capital and surplus wouldmeet or exceed the requirements of the State of New Jersey, as amended at any time, for a minimum of ten years.
15. In 1999, in order for Servus Life Insurance Company to extend its current Certificate of Authority to include the authority to transact the business of
contracts on a variable basis, Hartford Life Insurance Company guaranteed Servus Life Insurance Company’s capital and surplus would meet orexceed the requirements of the State of New Jersey, as amended at any time, for a minimum of ten years.
16. In 2000, in order for Omni Indemnity Company to be admitted to the states of Colorado and Virginia, Hartford Fire Insurance Company guaranteedthat Omni Indemnity Company’s capital and surplus would remain in compliance with the present minimum required by those states.
17. In 2001, Hartford Life and Accident Insurance Company guaranteed that it would make funds available in cash to Hartford Life Insurance CompanyK.K. for the timely payment of contractual claims made under variable life and annuity contracts.
18. In 2002, in order for Sentinel Insurance Company, Ltd. to be admitted to the state of New York, Hartford Fire Insurance Company guaranteed thatSentinel Insurance Company, Ltd.’s policyholder surplus would not fall below the Company Action Level Risk Based Capital.
19. In 2002, in order for Omni Indemnity Company to become licensed in the state of New Mexico, Hartford Fire Insurance Company guaranteed thatOmni Indemnity Company’s capital and surplus and risk based capital requirements will remain in compliance with the minimum levels prescribed bythe state of New Mexico.
20. In 2002, in order for Omni Insurance Company to become licensed in the state of New Mexico, Hartford Fire Insurance Company guaranteed thatOmni Insurance Company’s capital and surplus and risk based capital requirements will remain in compliance with the minimum levels prescribed bythe state of New Mexico.
F. Management or expense allocation contracts involving the Consolidated Companies:
1. The Hartford Insurance Group Reinsurance and Pooling Agreement as described in note number 25, “Intercompany Pooling Arrangement”.
2. Management Agreement between Hartford Fire Insurance Company and HartRe Company, L.L.C.
3. Reinsurance Agreement between Hartford Fire Insurance Company and Hartford Life and Accident Insurance Company.
4. Management Agreement between Hartford Fire Insurance Company, Hartford Accident and Indemnity Company and Hartford InvestmentManagement Company.
5. Investment Management Agreement between Hartford Investment Services, Inc. (an affiliate of the pool participants) and Hartford Accident andIndemnity Company, Hartford Casualty Insurance Company, Hartford Fire Insurance Company, Hartford Insurance Company of Illinois, HartfordInsurance Company of the Midwest, Hartford Life and Accident Insurance Company, Hartford Life Insurance Company, Hartford UnderwritersInsurance Company, Hartford International Life Reassurance Corporation, Hartford Life and Annuity Insurance Company, Nutmeg InsuranceCompany, Pacific Insurance Company, Limited, Property and Casualty Insurance Company of Hartford, Servus Life Insurance Company, TrumbullInsurance Company, Twin City Fire Insurance Company, Sentinel Insurance Company, Ltd., Hartford Insurance Company of the Southeast,American Maturity Life Insurance Company, First State Insurance Company, New England Insurance Company, New England ReinsuranceCompany, Omni Insurance Company, Omni Indemnity Company.
NOTES TO FINANCIAL STATEMENTS

Annual Statement for the year 2002 of the TWIN CITY FIRE INSURANCE COMPANY
14.5
10. INFORMATION CONCERNING PARENT, SUBSIDIARIES, AND AFFILIATES (continued)
6. Service Agreement between Omni Insurance Company and Trumbull Insurance Company, Hartford Accident and Indemnity Company, Hartford FireInsurance Company, Hartford Underwriters Insurance Company, Hartford Insurance Company of Illinois, Hartford Casualty Insurance Company,Hartford Insurance Company of the Midwest, Property and Casualty Insurance Company of Hartford and Twin City Fire Insurance Company.
7. Quota Share Reinsurance Agreement between Omni Insurance Company and Hartford Fire Insurance Company.
8. Reinsurance Agreement between Hartford Fire Insurance Company and Heritage Reinsurance Company, LTD.
9. Cost Allocation Agreement between Hartford Fire Insurance Company, Hartford Life, Inc., Hartford Life and Accident Insurance Company, HartfordLife International, Ltd., International Corporate Marketing Group, Inc., The Evergreen Group, Inc., Hartford Financial Services Life InsuranceCompany, American Maturity Life Insurance Company, Hart Life Insurance Company, Hartford Life Insurance Company, Hartford International LifeReassurance Corporation, Hartford Life and Annuity Insurance Company, Comprehensive Employee Benefit Service Company, Hartford EquitySales Company, Inc., The Hartford Investment Management Company, Hartford Securities Distribution Company, Inc., Servus Life InsuranceCompany, Nutmeg Life Insurance Company.
G. The Company is a member of The Hartford Financial Services Group. For specific ownership/affiliate relationships, refer to the Legal Entities OrganizationChart contained in Schedule Y.
H. The Company does not own shares of an upstream intermediate or ultimate parent, either directly or indirectly via a downstream subsidiary, controlled oraffiliated company.
I. The Company has no investments in subsidiary controlled and affiliated entities.
J. Not applicable
11. DEBT
A. Capital Notes
NONE
B. All Other Debt
NONE
12. RETIREMENT PLANS, DEFERRED COMPENSATION, POSTEMPLOYMENT BENEFITS AND COMPENSATED ABSENCES AND OTHER POSTRETIREMENTBENEFITS PLANS
Retirement plans and deferred compensation plans are included in the financial statements of Hartford Fire Insurance Company (an affiliated insurer), withthe exception of the U.S. Qualified Retirement Plan. Sponsorship of that plan was transferred effective November 1, 2002 to Hartford Financial ServicesGroup, Inc. Certain postretirement medical, dental, and life benefit plan related assets and liabilities are included in the financials of Hartford RiskManagement Inc., which is a subsidiary of Hartford Underwriters Insurance Company (an affiliated insurer).
13. CAPITAL AND SURPLUS, DIVIDEND RESTRICTIONS AND QUASI-REORGANIZATIONS
1. See Page 18 General Interrogatories 17.
2. The Company has no preferred shares authorized.
3. The maximum amount of dividends that can be paid by State of Indiana insurance companies to shareholders without prior approval of the InsuranceCommissioner is subject to restrictions relating to policyholder surplus and net income. At December 31, 2002 policyholders’ surplus was$181,781,015 and net income was $19,207,489. The maximum dividend payout that may be made without prior approval in 2003 is $19,207,489.
Dividends are paid as determined by the Board of Directors. 2002 common stockholder dividends paid and incurred amounted to $5,000,000.
4. Within the limitations of (3) above, there are no restrictions placed on the portion of Company profits that may be paid as ordinary dividends tostockholders.
5. No restrictions have been placed on the unassigned funds of the Company.
6. Not applicable.
7. No stock is being held by the Company for special purposes.
8. Changes in balances of special surplus funds from the prior year are none.
9. The portion of unassigned funds (surplus) represented or reduced by each item below is as follows:
a. Change in unrealized gains or (losses): $ (728,778)b. Change in non-admitted asset values: $2,306,169c. Separate account business: N/Ad. Asset valuation reserve: N/Ae. Change in provision for reinsurance: $ 0
10. None
11. None
12. None
14. CONTINGENCIES
A. Contingent Commitments
Contingent liabilities for structured settlements are as follows:
Affiliate $ 15,248,340Non-affiliate $ 3,060,710Total $ 18,309,050
The Company has no other material contingent liabilities other than those set forth in note #10E.
NOTES TO FINANCIAL STATEMENTS

Annual Statement for the year 2002 of the TWIN CITY FIRE INSURANCE COMPANY
14.6
14. CONTINGENCIES (continued)
B. Assessments
The 2001 insolvency of Reliance Insurance Company is expected to generate additional guaranty fund assessments against the Hartford FireIntercompany Pool participants in 2003 and subsequent years. Based on currently available information, it is expected that the pool will pay $18.4 millionin guaranty fund assessments in 2003. This amount was charged to operations in the current period. The pool took an additional charge of $19.4 millionin 2002 for guaranty fund assessments related to Reliance Insurance Company received in 2002, and for which no reasonable estimate could be made asof December 31, 2001.
Based on amounts paid in 2002 and prior years, the pool has established an asset for premium tax offsets related to guaranty fund assessments in theamount of $18.2 million. The offsets will be applied to premium taxes over the next five to ten years as provided for by various state statutes. (EachCompany’s impact from the assessments and related offsets can be calculated by using the percentages shown in note number 25, “Intercompany PoolingArrangement”).
C. Gain Contingencies
NONE
D. All Other Contingencies
Various lawsuits against the Company have arisen in the course of the Company’s business. Contingent liabilities arising from litigation, income taxes andother matters are not considered material in relation to the financial position of the Company.
15. LEASES
NONE
16. INFORMATION ABOUT FINANCIAL INSTRUMENTS WITH OFF-BALANCE SHEET RISK AND FINANCIAL INSTRUMENTS WITH CONCENTRATIONS OF CREDIT RISK
The Company is not exposed to any significant credit concentration risk of a single issuer.
Bonds have off-balance sheet risk. For trade terms and other detailed information, see Schedule D. Additionally, bond statement value, market value andunrealized gains and losses are aggregated in Schedule DM.
17. SALE, TRANSFER, AND SERVICING OF FINANCIAL ASSETS AND EXTINGUISHMENTS OF LIABILITES
A. The Company did not have any transfers of receivables reported as sales.
B. NONE
C. NONE
18. GAIN OR LOSS TO THE REPORTING ENTITY FROM UNINSURED A&H PLANS AND THE UNINSURED PORTION OF PARTIALLY INSURED PLANS
A. ASO Plans
NONE
B. ASC Plans
NONE
C. Medicare or Other Similarly Structured Cost Based Reimbursement Contract
NONE
19. DIRECT PREMIUM WRITTEN/PRODUCED BY MANAGING GENERAL AGENTS/THIRD PARTY ADMINISTRATORS
Name and Address ofManaging General
Agent or ThirdParty Administrator
FEINNumber
ExclusiveContract
Types ofBusinessWritten
Type ofAuthorityGranted
TotalDirect
PremiumsWritten/
Produced By
Evergreen Organization 23-2784508 Yes Inland Marine U/W $16,802,991P.O. Box 129 910 Evergreen LaneChester Springs, PA 19425
Aon Association Services 36-3642411 Yes D & O U/W $3,088,227Div. of Affinity Ins. Svcs. Inc.1120 20th Street, N.W. Suite 600Washington, D.C. 20036
Professional Coverage Managers 13-3382300 Yes Architects & U/W $5,741,7955 Hanover Square Engineers New York, NY 10004
Roanoke Trade Services 36-2756330 Yes Foreign Forwarders & U/W $1,047,4741501 Woodfield Road Custom House Brokers Suite 302N E & OSchaumburg, IL 60173
S. H. Smith and Company 06-1061004 No Lawyers Prof. U/W $905,444P. O. Box 270049 Liability West Hartford, CT 06127
W.E. Kingsley & Company 61-0566450 No Crop C,CA,B,P $3,416 210 Malabu Drive R, U P.O. Box 22700Lexington, KY 40522-2700
NOTES TO FINANCIAL STATEMENTS

Annual Statement for the year 2002 of the TWIN CITY FIRE INSURANCE COMPANY
14.7
20. OTHER ITEMS
A. Extraordinary Items
NONE
B. Troubled Debt Restructuring: Debtors
NONE
C. Other Disclosures
NONE
D. Disclose Uncollectible
Not applicable
E. Reinsurance Accounted for as a Deposit
Not applicable
F. Multiple Peril Crop Insurance
Not applicable
G. Mezzanine Real Estate Loans
The Company does not have any mezzanine real estate loans.
H. Health Care Receivable
Not applicable
I. September 11 Events
As a result of the September 11 terrorist attack, the Hartford Fire Intercompany Pool recorded in 2001 an estimated loss amounting to $647 million, beforetax and net of reinsurance. Each company’s share of this loss can be determined by applying the pooling percentage as shown in note number 25,“Intercompany Pooling Arrangement”. The property-casualty portion of the estimate includes coverages related to property, business interruption, workers’compensation, and other liability exposures, including those underwritten by the Company’s assumed reinsurance operation. The Company based the lossestimate, including estimated amounts for incurred but not reported policyholder losses, costs incurred in settling claims and the impact of reinsurancerecoverables, upon a review of insured exposures using a variety of assumptions and actuarial techniques. Since the September 11 terrorist attack was asingle event that was unique and had such a substantial impact on such a large number of individuals and businesses, the nature of this unusual eventadds to the uncertainty of loss estimates relating to the event. Although the Company anticipates certain claims for recovery to be challenged, the impactof these challenges is not expected to be material. As a result of the uncertainties involved in the estimation process, final claims settlement maysignificantly vary from present estimates.
J. Real Estate
NONE
K. Participating Policies
NONE
L. Premium Deficiency Reserves
The Company does not have any premium deficiency reserves and anticipated investment income was not considered in the premium deficiencycalculation.
M. Non-cash Transactions
On March 29, 2002, Hartford Fire Insurance Company made a non-cash capital contribution of $10,414,823 to the Company in the form of a forgiveness ofan intercompany payable.
21. EVENTS SUBSEQUENT
In January 2003, The Hartford Financial Services Group, Inc. announced a new comprehensive ground-up study of its asbestos related exposures, andexpects the study to be completed by the second quarter 2003.
22. REINSURANCE
A. Unsecured Reinsurance Recoverables
As mentioned in footnote 10(f)1, the Company is a participant in the Hartford Insurance Group Reinsurance and Pooling Agreement. All reinsuranceassets and liabilities resulting from this agreement appear in the financial statements of Hartford Fire Insurance Company.
B. Reinsurance Recoverable in Dispute
As mentioned in footnote 10(f)1, the Company is a participant in the Hartford Insurance Group Reinsurance and Pooling Agreement. All reinsuranceassets and liabilities resulting from this agreement appear in the financial statements of Hartford Fire Insurance Company.
A. Reinsurance Assumed and Ceded
As mentioned in footnote 10(f)1, the Company is a participant in the Hartford Insurance Group Reinsurance and Pooling Agreement. All return commissionresulting from reinsurance assumed or ceded appear in the financial statements of Hartford Fire Insurance Company.
B. Uncollectible Reinsurance
NONE
NOTES TO FINANCIAL STATEMENTS

Annual Statement for the year 2002 of the TWIN CITY FIRE INSURANCE COMPANY
14.8
22. REINSURANCE (continued)
C. Commutation of Ceded Reinsurance
NONE
D. Retroactive Reinsurance
See Retroactive Reinsurance Addendum following footnote disclosures.
23. RETROSPECTIVELY RATED CONTRACTS AND CONTRACTS SUBJECT TO REDETERMINATION
A. Accrued retrospective premiums reported on Page 2, Line 10.3, Column 3 have been determined based upon loss experience on business subject to suchexperience rating adjustment.
B. See Schedule P Part 7A.
C. Ten percent of the amount not offset by retrospective return premiums, other liabilities to the same party (other than loss and loss expense reserves), orcollateral as permitted by the NAIC, has been non admitted.
(In thousands) Total Accrued Retro Premiums $2,908 Premiums not Secured 2,908 Non Admitted Portion (10%) 291 Net Admitted Amount $2,617
24. CHANGE IN INCURRED LOSSES AND LOSS ADJUSTMENT EXPENSES
See disclosure on Reinsurance Agreement in note number 29 (“Asbestos/Environmental Reserves”).
25. INTERCOMPANY POOLING ARRANGEMENTS
The following table provides each affiliate Company's participation in the Hartford Fire Insurance Pool (the lead company being Hartford Fire Insurance Company): NAIC# Company % NAIC# Company %
19682 Hartford Fire Insurance Company 41.50 27120 Trumbull Insurance Company .5022357 Hartford Accident & Indemnity Company 32.69 38253 Hartford Lloyds Insurance Company .0129424 Hartford Casualty Insurance Company 5.50 37478 Hartford Insurance Company of the Midwest .5030104 Hartford Underwriters Insurance Company 4.00 38261 Hartford Insurance Company of the Southeast .5029459 Twin City Fire Insurance Company 1.50 39608 Nutmeg Insurance Company .70
10046 Pacific Insurance Company, Limited 1.70 11000 Sentinel Insurance Company, Ltd. .30 38288 Hartford Insurance Company of Illinois 10.10 34690 Property & Casualty Insurance Co. of Hartford .50
Hartford Fire reinsures business with non-affiliated reinsurers prior to pooling with its affiliated pool members. Hartford Fire also assumes all direct business(except for accident & health business) written by pool members. Hartford Fire then cedes a percentage of the total pool to each participant of the pool based onthe percentage shown above. The Provision for Reinsurance (Schedule F, Part 7) is absorbed completely by the lead company in the pool (Hartford Fire).
26. STRUCTURED SETTLEMENTS
A. The Company has not purchased annuities under which the Company is owner and payee.
B. The total value of all annuities due from each respective life insurer in excess of 1% of the Company's policyholders' surplus is as follows
INSURER/LOCATION AMOUNT
Hartford Life Insurance Company/Simsbury CT $15,248,340
27. HIGH DEDUCTIBLES
NONE
28. DISCOUNTING OF LIABILITIES FOR UNPAID LOSSES OR UNPAID LOSS ADJUSTMENT EXPENSE
The Company does not discount liabilities other than for Workers’ Compensation tabular claims. These reserves have been discounted in accordance withtables and interest rates prescribed by the various states. At December 31, 2002 and 2001, liabilities for the Company included a discount of $5.4 millionand $4.2 million, respectively.
29. ASBESTOS/ENVIRONMENTAL RESERVES
A. Does the company have on the books, or has it ever written an insured for which you have identified a potential for the existence of, a liability due toasbestos losses?
Yes (X) No ( )
The Hartford Insurance Group (“The Companies”) have potential exposure to asbestos and arising from direct and assumed contracts. This exposure islargely concentrated in the Other Liability line of business.
The Companies asbestos reserves, which provide for potential exposure from both reported and IBNR losses, are based upon a comprehensive ground-upanalysis of their direct and assumed exposure. This analysis yielded estimates on both a gross and net of reinsurance level. In January 2003, TheHartford Financial Services Group, Inc. announced a new comprehensive ground-up study of its asbestos related exposures, and expects the study to becompleted by the second quarter 2003.
Effective, November 1, 2001 Hartford Fire Insurance Company entered into a reinsurance agreement with Heritage Reinsurance Company Ltd. ("HeritageRe"), a 99.4% owned Bermuda affiliate. The agreement ceded $694 million of loss and loss adjustment expense reserves, of which $537 million was forasbestos and environmental on business effective prior to January 1, 1985 and $157 million was for certain other runoff business, to Heritage Re for $694million in premium consideration. (Each Company’s participation in this transaction can be calculated using the percentages shown in note number 25,(“Intercompany Pooling Arrangement”).
NOTES TO FINANCIAL STATEMENTS

Annual Statement for the year 2002 of the TWIN CITY FIRE INSURANCE COMPANY
14.9
29. ASBESTOS/ENVIRONMENTAL RESERVES (continued)
Asbestos (including IBNR):
Gross of Reinsurance: 1998 1999 2000 2001 2002
Beginning reserves $524,318,985 $470,957,885 $481,476,985 $513,239,000 $602,239,964
Incurred losses and loss adjustment expenses (18,620,100) 44,999,100 113,568,015 178,604,471 254,790,387
Calendar year payments for losses andloss adjustment expenses 34,741,000 34,480,000 81,806,000 89,603,507 103,539,013
Ending Reserves
Ending reserves
$470,957,885 $481,476,985 $513,239,000 $602,239,964 $753,491,338
Net of Reinsurance: 1998 1999 2000 2001 2002
Beginning reserves $344,906,148 $290,521,048 $270,578,148 $243,278,000 $2,218,116
Incurred losses and lossadjustment expenses (26,010,100) (5,001,900) (1,471,148) (186,839,201) 8,094,877
Calendar year payments for losses andloss adjustment expenses 28,375,000 14,941,000 25,829,000 54,220,683 (2,987,911)
Ending reserves $290,521,048 $270,578,148 $243,278,000 $2,218,116 $13,300,904
B. State the amount of the ending reserves for Bulk and IBNR included in A (Loss & LAE):
Amounts at 12/02Gross of Reinsurance $197,361,509Net of Reinsurance $ (123,017)
C. State the amount of ending reserves for loss adjustment expenses included in A (Case, Bulk and IBNR):
Amounts at 12/02Gross of Reinsurance $ 96,525,428Net of Reinsurance $ 2,553,575
On May 14, 2002, The Hartford announced its participation, along with several dozen other insurance carriers, in a settlement in principle with its insured,PPG Industries (“PPG”), of litigation arising from asbestos exposures involving Pittsburgh Corning Corporation (“Pittsburgh Corning”), which is 50% ownedby PPG. The structure of the settlement will allow The Hartford to make fixed payments to a settlement trust over a 20-year period beginning in 2004 andallows The Hartford to prepay its obligations at any time at a fixed discount rate of 5.5%. The settlement is subject to a number of contingencies, includingthe negotiation of a definitive agreement among the parties and approval of the bankruptcy court supervising the reorganization of Pittsburgh Corning. TheHartford estimated the settlement amount to be approximately $327 million (non tax-effected) on a nominal basis and gross of anticipated reinsurancerecoveries and approximately $195 million (non tax-effected) on a discounted basis and gross of anticipated reinsurance recoveries. The settlement wascovered by existing asbestos reserves, and as a result, did not have a material impact on the Company’s consolidated financial condition or results ofoperations. There is no statutory net discounting or impact as it is 100% reinsured.
D. Does the company have on the books, or has it ever written an insured for which you have identified a potential for the existence of, a liability due toenvironmental losses?
Yes (X) No ( )
The Companies environmental reserves, which provide for potential exposure from both reported and IBNR losses, are based upon a comprehensiveground-up analysis of their direct and assumed exposure. This analysis yielded estimates on both a gross and net of reinsurance level.
Environmental Reserves (including IBNR):
Gross of Reinsurance : 1998 1999 2000 2001 2002
Beginning reserves $1,134,394,316 $923,212,336 $757,356,469 $686,252,877 $382,989,324
Incurred losses and loss adjustment expenses (41,563,980) (63,058,867) (1,257,592) (191,473,402) (55,677,298)
Calendar year payments for lossesand loss adjustment expenses 169,618,000 102,797,000 69,846,000 111,790,151 106,243,132
Ending reserves $923,212,336 $757,356,469 $686,252,877 $382,989,324 $221,068,894
Net of Reinsurance: 1998 1999 2000 2001 2002
Beginning reserves $755,037,505 $621,049,525 $486,997,658 $440,551,877 $2,560,126
Incurred losses and lossAdjustment expenses (41,680,980) (61,509,174) (1,286,781) (351,308,899) 13,410,573
Calendar year payments for lossesand loss adjustment expenses 92,307,000 72,542,693 45,159,000 86,682,852 13,167,814
Ending reserves $621,049,525 $486,997,658 $440,551,877 $2,560,126 $2,802,885
NOTES TO FINANCIAL STATEMENTS

Annual Statement for the year 2002 of the TWIN CITY FIRE INSURANCE COMPANY
14.10
29. ASBESTOS/ENVIRONMENTAL RESERVES (continued)
E. State the amount of the ending reserves for Bulk and IBNR included in D (Loss & LAE):
Amounts at 12/02Gross of Reinsurance $137,103,069Net of Reinsurance $ (5,470,611)
F. State the amount of ending reserves for loss adjustment expenses included in D (Case, Bulk and IBNR):
Amounts at 12/02Gross of Reinsurance $ 41,844,998Net of Reinsurance $ (5,740,611)
30. SUBSCRIBER SAVINGS ACCOUNTS
NONE
31. FINANCIAL GUARANTY INSURANCE EXPOSURES
NONE
NOTES TO FINANCIAL STATEMENTS

Annual Statement for the year 2002 of the TWIN CITY FIRE INSURANCE COMPANY
14.11
RETROACTIVE REINSURANCE - ADDENDUM
The line of business and accident year distribution of the unpaid retroactive reinsurance reservesincluded in Miscellaneous Liabilities (after pooling) is as follows:
Schedule P - Part 1O - Reinsurance B
24Years in Which Losses Unpaid Total
Premiums Case Basis Bulk + IBNR NetWere 13 14 15 16 Losses
Earned and Direct Direct andLosses Were and and Expenses
Incurred Assumed Ceded Assumed Ceded Unpaid
1. Prior 0 0 0 2. 1993 (33) 0 (33)3. 1994 9,392 0 9,3924. 1995 10,396 0 10,3965. 1996 14,711 4,805 19,5166. 1997 35,083 79,781 114,8647. 1998 33,670 96,723 130,3938. 1999 37,921 16,279 54,2009. 2000 134,658 37,264 171,92210. 2001 0 0 0 11. 2002 0 0 0
12. Totals 275,797 0 234,852 0 510,649
NOTES TO FINANCIAL STATEMENTS

Annual Statement for the year 2002 of the TWIN CITY FIRE INSURANCE COMPANY
14.12
The accident year distribution of loss, LAE, and salvage reserves included in "Prior" for the Schedule Plines of business is as follows:
Part 1A - Homeowners/ Part 1B - Private PassengerFarmowners Auto Liability/Medical
23. 24. 23. 24.Years in Which Total Total
Premiums Net NetWere Salvage Losses Salvage Losses
Earned and and and And andLosses Were Subrogation Expenses Subrogation Expenses
Incurred Anticipated Unpaid Anticipated UnpaidPrior 0 17 1 1331989 0 0 1 261990 0 2 1 8 1991 0 1 1 24 1992 0 4 1 38
1. Prior 0 24 5 229
Part 1C - Commercial Auto/ Part 1D - Workers'Truck Liability/Medical Compensation
23. 24. 23. 24.Years in Which Total Total
Premiums Net NetWere Salvage Losses Salvage Losses
Earned and and and And andLosses Were Subrogation Expenses Subrogation Expenses
Incurred Anticipated Unpaid Anticipated UnpaidPrior 0 (213) 4 7,1711989 0 12 1 1,265 1990 0 33 1 1,406 1991 0 12 1 1,516 1992 0 34 3 1,461
1. Prior 0 (122) 10 12,818
Part 1E - Commercial Part 1F - Section 1 - MedicalMultiple Peril Malpractice – Occurrence
23. 24. 23. 24.Years in Which Total Total
Premiums Net NetWere Salvage Losses Salvage Losses
Earned and and and And AndLosses Were Subrogation Expenses Subrogation Expenses
Incurred Anticipated Unpaid Anticipated UnpaidPrior 0 140 0 481989 0 34 0 1 1990 0 58 0 1 1991 0 63 0 0 1992 1 74 0 0
1. Prior 1 369 0 50
Part 1F - Section 2 -Medical Part 1G – SpecialMalpractice - Claims-Made Liability
23. 24. 23. 24.Years in Which Total Total
Premiums Net NetWere Salvage Losses Salvage Losses
Earned and And and And AndLosses Were Subrogation Expenses Subrogation Expenses
Incurred Anticipated Unpaid Anticipated UnpaidPrior 0 0 0 231989 0 0 0 3 1990 0 0 0 8 1991 0 2 0 101992 0 4 0 4
1. Prior 0 6 0 49
NOTES TO FINANCIAL STATEMENTS

Annual Statement for the year 2002 of the TWIN CITY FIRE INSURANCE COMPANY
14.13
The accident year distribution of loss, LAE, and salvage reserves included in "Prior" for the Schedule Plines of business is as follows:
Part 1H - Section 1 Part 1H - Section 2Other Liability – Occurrence Other Liability - Claims-Made
23. 24. 23. 24.Years in Which Total Total
Premiums Net NetWere Salvage Losses Salvage Losses
Earned and and And And andLosses Were Subrogation Expenses Subrogation Expenses
Incurred Anticipated Unpaid Anticipated UnpaidPrior 0 1,374 0 3 1989 0 302 0 11990 0 225 0 1 1991 0 218 0 1 1992 0 216 0 1
1. Prior 0 2,335 0 6
Part 1M - International Part 1N - Reinsurance A23. 24. 23. 24.
Years in Which Total TotalPremiums Net Net
Were Salvage Losses Salvage LossesEarned and and and And and
Losses Were Subrogation Expenses Subrogation ExpensesIncurred Anticipated Unpaid Anticipated Unpaid
Prior 0 3 0 1 1989 0 13 0 41990 0 5 0 0 1991 0 7 0 2 1992 0 4 0 12
1. Prior 0 31 0 19
Part 1O - Reinsurance B Part 1P - Reinsurance C23. 24. 23. 24.
Years in Which Total TotalPremiums Net Net
Were Salvage Losses Salvage LossesEarned and and and And And
Losses Were Subrogation Expenses Subrogation ExpensesIncurred Anticipated Unpaid Anticipated Unpaid
Prior 0 10 0 0 1989 0 3 0 0 1990 0 20 0 0 1991 0 38 0 0 1992 0 45 0 0
1. Prior 0 116 0 0
Part 1R - Section 1 – Products Part 1R - Section 2 - ProductsLiability – Occurrence Liability - Claims-Made
23. 24. 23. 24.Years in Which Total Total
Premiums Net NetWere Salvage Losses Salvage Losses
Earned and and And And andLosses Were Subrogation Expenses Subrogation Expenses
Incurred Anticipated Unpaid Anticipated UnpaidPrior 0 184 0 0 1989 0 32 0 0 1990 0 51 0 0 1991 0 39 0 0 1992 0 32 0 0
1. Prior 0 339 0 0
NOTES TO FINANCIAL STATEMENTS

Annual Statement for the year 2002 of the TWIN CITY FIRE INSURANCE COMPANY
14.14
SCHEDULE OF TRANSACTIONS WITH AFFILIATES (Supplement to Footnote #10B)
This schedule contains transactions by the company and any affiliated insurer with any affiliate. Non-insurance transactions involving less than ½ of 1% of the total assets of thelargest affiliated insurer are omitted. Also excluded are reinsurance transactions and cost allocation transactions based on generally accepted accounting principles.
1 2 3 4 5 6 7 8 Assets received by Insurer Assets Transferred by Insurer
Transaction Statement Statement Date Explanation Name of Insurer Name of Affiliate Value Description Value Description
3/02 Capital Contribution Hartford Fire Ins. Co. Hartford Accident & Ind. Co. 226,973,701 Non-cash
8/02 Transfer of ownership Hartford Fire Ins. Co. Hartford Holdings, Inc. 7,200,000,000 PIK Preferred 7,200,000,000 HLI, Inc.Common of HLI, Inc. Shares Stock
9/02 Capital Contribution Hartford Fire Ins. Co. Hartford Financial Services Group Inc. 300,000,000 Cash
12/02 Capital Contribution Hartford Life & Acc. Ins. Co. Hartford Life, Inc. 150,000,000 Cash
12/02 Capital Contribution Hartford Life & Acc. Ins. Co. Hartford Life Ins. Company 150,000,000 Cash
12/02 Capital Contribution Hartford Life Ins. Company Hartford Life & Annuity Ins. Co. 150,000,000 Cash
12/02 Sale of affiliate Hartford Fire Ins. Co. Hartford Financial Services Group Inc. 108,859,931 Cash 108,859,931 Affiliate Stock
12/02 Preferred Stock Hartford Fire Ins. Co. Hartford Holdings, Inc 144,960,000 PIK Preferred Dividend Shares
NOTES TO FINANCIAL STATEMENTS

Annual Statement for the year 2002 of the TWIN CITY FIRE INSURANCE COMPANY
15
SUMMARY INVESTMENT SCHEDULE Gross Admitted Assets as Reported
Investment Holdings in the Annual Statement1 2 3 4
Investment Categories Amount Percentage Amount Percentage
1. Bonds:
1.1 U.S. treasury securities.............................................................................................................................. ...........3,475,180 ................0.9 ...........3,475,180 ................0.9
1.2 U.S. government agency and corporate obligations (excluding mortgage-backed securities):
1.21 Issued by U.S. government agencies................................................................................................ .........................0 ................0.0 .........................0 ................0.0
1.22 Issued by U.S. government sponsored agencies............................................................................... .........................0 ................0.0 .........................0 ................0.0
1.3 Foreign government (including Canada, excluding mortgage-backed securities).......................................... .........................0 ................0.0 .........................0 ................0.0
1.4 Securities issued by states, territories and possessions and political subdivisions in the U.S.:
1.41 States, territories and possessions general obligations...................................................................... .........80,710,152 ..............21.4 .........80,710,152 ..............21.4
1.42 Political subdivisions of states, territories & possessions & political subdivisions general obligations... ........129,151,165 ..............34.3 ........129,151,165 ..............34.3
1.43 Revenue and assessment obligations................................................................................................ ........109,473,478 ..............29.1 ........109,473,478 ..............29.1
1.44 Industrial development and similar obligations................................................................................... .........................0 ................0.0 .........................0 ................0.0
1.5 Mortgage-backed securities (includes residential and commercial MBS):
1.51 Pass-through securities:
1.511 Guaranteed by GNMA............................................................................................................ ...........6,521,136 ................1.7 ...........6,521,136 ................1.7
1.512 Issued by FNMA and FHLMC................................................................................................. ...........4,488,493 ................1.2 ...........4,488,493 ................1.2
1.513 Privately issued...................................................................................................................... .........................0 ................0.0 .........................0 ................0.0
1.52 CMOs and REMICs:
1.521 Issued by FNMA and FHLMC................................................................................................. .........................0 ................0.0 .........................0 ................0.0
1.522 Privately issued and collateralized by MBS issued or guaranteed by GNMA, FNMA or FHLMC........................................................................................................ .........................0 ................0.0 .........................0 ................0.0
1.523 All other privately issued......................................................................................................... ...........2,787,826 ................0.7 ...........2,787,826 ................0.7
2. Other debt and other fixed income securities (excluding short-term):
2.1 Unaffiliated domestic securities (includes credit tenant loans rated by the SVO).......................................... .........22,129,137 ................5.9 .........22,129,137 ................5.9
2.2 Unaffiliated foreign securities...................................................................................................................... ...........4,851,785 ................1.3 ...........4,851,785 ................1.3
2.3 Affiliated securities..................................................................................................................................... .........................0 ................0.0 .........................0 ................0.0
3. Equity interests:
3.1 Investments in mutual funds....................................................................................................................... .........................0 ................0.0 .........................0 ................0.0
3.2 Preferred stocks:
3.21 Affiliated........................................................................................................................................... .........................0 ................0.0 .........................0 ................0.0
3.22 Unaffiliated....................................................................................................................................... ...........9,597,851 ................2.5 ...........9,597,851 ................2.5
3.3 Publicly traded equity securities (excluding preferred stocks):
3.31 Affiliated........................................................................................................................................... .........................0 ................0.0 .........................0 ................0.0
3.32 Unaffiliated....................................................................................................................................... .........................0 ................0.0 .........................0 ................0.0
3.4 Other equity securities:
3.41 Affiliated........................................................................................................................................... .........................0 ................0.0 .........................0 ................0.0
3.42 Unaffiliated....................................................................................................................................... .........................0 ................0.0 .........................0 ................0.0
3.5 Other equity interests including tangible personal property under lease:
3.51 Affiliated........................................................................................................................................... .........................0 ................0.0 .........................0 ................0.0
3.52 Unaffiliated....................................................................................................................................... .........................0 ................0.0 .........................0 ................0.0
4. Mortgage loans:
4.1 Construction and land development............................................................................................................ .........................0 ................0.0 .........................0 ................0.0
4.2 Agricultural................................................................................................................................................. .........................0 ................0.0 .........................0 ................0.0
4.3 Single family residential properties.............................................................................................................. .........................0 ................0.0 .........................0 ................0.0
4.4 Multifamily residential properties................................................................................................................. .........................0 ................0.0 .........................0 ................0.0
4.5 Commercial loans...................................................................................................................................... .........................0 ................0.0 .........................0 ................0.0
5. Real estate investments:
5.1 Property occupied by company................................................................................................................... .........................0 ................0.0 .........................0 ................0.0
5.2 Property held for production of income (includes $..........0 of property acquired in satisfaction of debt)......... .........................0 ................0.0 .........................0 ................0.0
5.3 Property held for sale ($..........0 including property acquired in satisfaction of debt)..................................... .........................0 ................0.0 .........................0 ................0.0
6. Policy loans......................................................................................................................................................... .........................0 ................0.0 .........................0 ................0.0
7. Receivables for securities.................................................................................................................................... .........................0 ................0.0 .........................0 ................0.0
8. Cash and short-term investments......................................................................................................................... ...........3,641,255 ................1.0 ...........3,641,255 ................1.0
9. Other invested assets.......................................................................................................................................... .........................0 ................0.0 .........................0 ................0.0
10. Total invested assets........................................................................................................................................... ........376,827,458 ............100.0 ........376,827,458 ............100.0

Annual Statement for the year 2002 of the TWIN CITY FIRE INSURANCE COMPANY
16
GENERAL INTERROGATORIESPART 1 - COMMON INTERROGATORIES
GENERAL
1.1 Is the reporting entity a member of an Insurance Holding Company System consisting of two or more affiliated persons, one or more of which is an insurer? Yes [ X ] No [ ]
1.2 If yes, did the reporting entity register and file with its domiciliary State Insurance Commissioner, Director or Superintendent or with such regulatory official of the state of domicile of the principal insurer in the Holding Company System, a registration statement providing disclosure substantially similar to the standards adopted by the National Association of Insurance Commissioners (NAIC) in its Model Insurance Holding Company System Regulatory Act and model regulations pertaining thereto, or is the reporting entity subject to standards and disclosure requirements substantially similar to those required by such Act and regulations? Yes [ X ] No [ ] N/A [ ]
1.3 State regulating? IN
2.1 Has any change been made during the year of this statement in the charter, by-laws, articles of incorporation, or deed of settlement of the reporting entity? Yes [ ] No [ X ]
2.2 If yes, date of change: If not previously filed, furnish herewith a certified copy of the instrument as amended.
3.1 State as of what date the latest financial examination of the reporting entity was made or is being made. 12/31/2002
3.2 State the as of date that the latest financial examination report became available from either the state of domicile or the reporting entity. This date should be the date of the examined balance sheet and not the date the report was completed or released. 12/31/1997
3.3 State as of what date the latest financial examination report became available to other states or the public from either the state of domicile or the reporting entity. This is the release date or completion date of the examination report and not the date of the examination (balance sheet date). 07/13/1999
3.4 By what department or departments? CT/IN
4.1 During the period covered by this statement, did any agent, broker, sales representative, non-affiliated sales/service organization or any combination thereof under a common control (other than salaried employees of the reporting entity) receive credit or commissions for or control a substantial part (more than 20 percent of any major line of business measured on direct premiums) of:
4.11 sales of new business? Yes [ ] No [ X ]
4.12 renewals? Yes [ ] No [ X ]
4.2 During the period covered by this statement, did any sales/service organization owned in whole or in part by the reporting entity or an affiliate, receive credit or commissions for or control a substantial part (more than 20 percent of any major line of business measured on direct premiums) of:
4.21 sales of new business? Yes [ ] No [ X ]
4.22 renewals? Yes [ ] No [ X ]
5.1 Has the reporting entity been a party to a merger or consolidation during the period covered by this statement? Yes [ ] No [ X ]
5.2 If yes, provide the name of the entity, NAIC company code, and state of domicile (use two letter state abbreviation) for any entity that has ceased to exist as a result of the merger or consolidation.
1 2 3Name of Entity NAIC Company Code State of Domicile
00000
6.1 Has the reporting entity had any Certificates of Authority, licenses or registrations (including corporate registration, if applicable) suspended or revoked by any governmental entity during the reporting period? (You need not report an action, either formal or informal, if a confidentiality clause is part of the agreement.) Yes [ ] No [ X ]
6.2 If yes, give full information:
7.1 Does any foreign (non-United States) person or entity directly or indirectly control 10% or more of the reporting entity? Yes [ ] No [ X ]
7.2 If yes,
7.21 State the percentage of foreign control. ..........................0.000 %
7.22 State the nationality(ies) of the foreign person(s) or entity(ies); or if the entity is a mutual or reciprocal, the nationality of its manager or attorney-in-fact and identify the type of entity(ies) (e.g., individual, corporation, government, manager or attorney-in-fact)
1 2Nationality Type of Entity

Annual Statement for the year 2002 of the TWIN CITY FIRE INSURANCE COMPANY
17
GENERAL INTERROGATORIES (continued) 8. What is the name and address of the independent certified public accountant or accounting firm retained to conduct the annual audit?
Deloitte and Touche, LLP, City Place, 185 Asylum St. 33rd floor, Hartford, CT 06103-3402
9. What is the name, address and affiliation (officer/employee of the reporting entity or actuary/consultant associated with a(n) actuarial consulting firm) of the individual providing the statement of actuarial opinion/certification? Richard William Palczynski, The Hartford Financial Services Group, Senior Vice-President and Chief Actuary, Hartford Plaza, Hartford, CT 06115
10. FOR UNITED STATES BRANCHES OF ALIEN REPORTING ENTITIES ONLY:
10.1 What changes have been made during the year in the United States manager or the United States trustees of the reporting entity?
10.2 Does this statement contain all business transacted for the reporting entity through its United States Branch on risks wherever located? Yes [ ] No [ ]
10.3 Have there been any changes made to any of the trust indentures during the year? Yes [ ] No [ ]
10.4 If answer to (10.3) is yes, has the domiciliary or entry state approved the changes? Yes [ ] No [ ] N/A [ ]
BOARD OF DIRECTORS
11. Is the purchase or sale of all investments of the reporting entity passed upon either by the Board of Directors or a subordinate committee thereof? Yes [ X ] No [ ]
12. Does the reporting entity keep a complete permanent record of the proceedings of its Board of Directors and all subordinate committees thereof? Yes [ X ] No [ ]
13. Has the reporting entity an established procedure for disclosure to its Board of Directors or trustees of any material interest or affiliation on the part of any of its officers, directors, trustees or responsible employees which is in or is likely to conflict with the official duties of such person? Yes [ X ] No [ ]
FINANCIAL
14.1 Total amount loaned during the year (inclusive of Separate Accounts, exclusive of policy loans):
14.11 To directors or other officers $..................................0
14.12 To stockholders not officers $..................................0
14.13 Trustees, supreme or grand (Fraternal only) $..................................0
14.2 Total amount of loans outstanding at the end of year (inclusive of Separate Accounts, exclusive of policy loans):
14.21 To directors or other officers $..................................0
14.22 To stockholders not officers $..................................0
14.23 Trustees, supreme or grand (Fraternal only) $..................................0
15.1 Were any assets reported in this statement subject to a contractual obligation to transfer to another party without the liability for such obligation being reported in the statement? Yes [ ] No [ X ]
15.2 If yes, state the amount thereof at December 31 of the current year:
15.21 Rented from others $..................................0
15.22 Borrowed from others $..................................0
15.23 Leased from others $..................................0
15.24 Other $..................................0
Disclose in the Notes to Financial the nature of each obligation.
16.1 Does this statement include payments for assessments as described in the Annual Statement Instructions other than guaranty fund or guaranty association assessments? Yes [ ] No [ X ]
16.2 If answer is yes:
16.21 Amount paid as losses or risk adjustment $..................................0
16.22 Amount paid as expenses $..................................0
16.23 Other amounts paid $..................................0
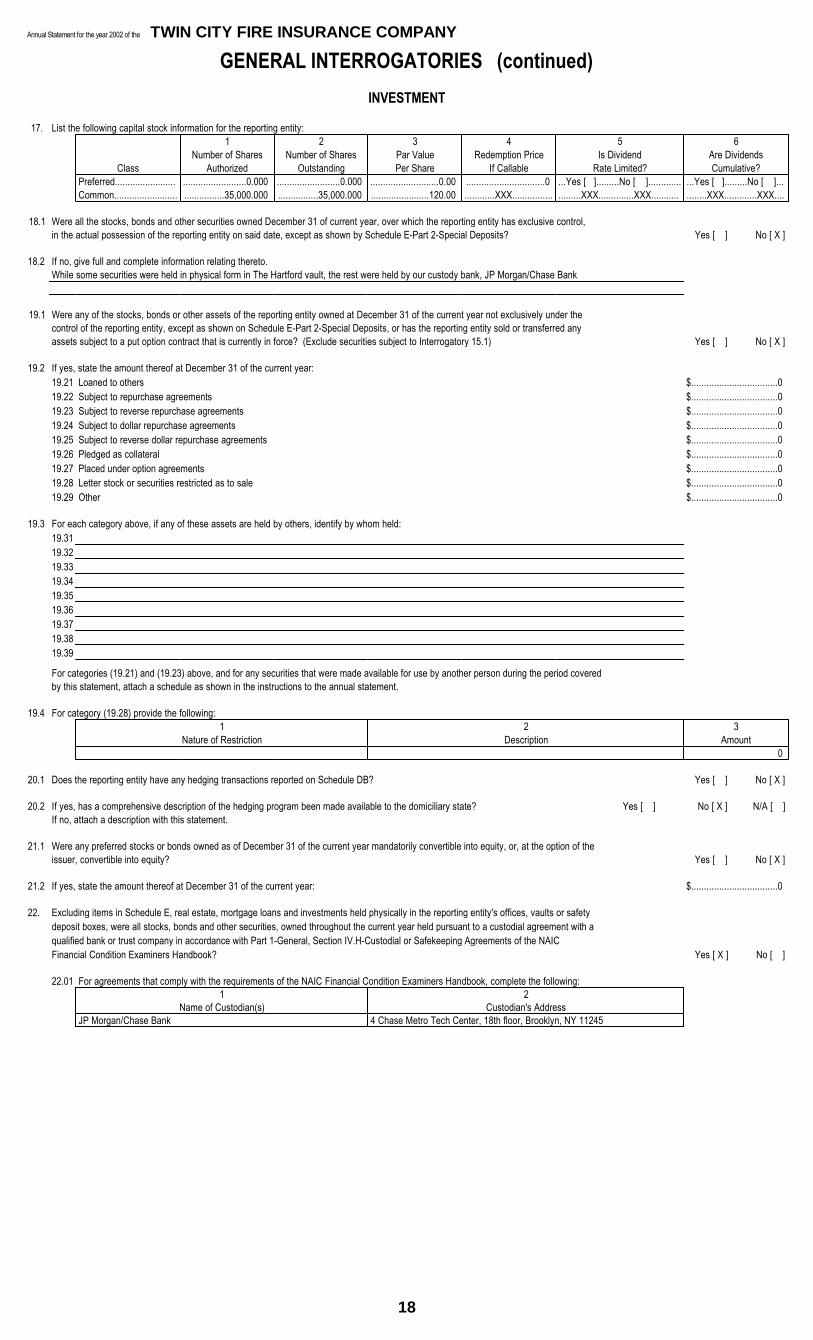
Annual Statement for the year 2002 of the TWIN CITY FIRE INSURANCE COMPANY
18
GENERAL INTERROGATORIES (continued) INVESTMENT
17. List the following capital stock information for the reporting entity: 1 2 3 4 5 6
Number of Shares Number of Shares Par Value Redemption Price Is Dividend Are DividendsClass Authorized Outstanding Per Share If Callable Rate Limited? Cumulative?
Preferred........................ .........................0.000 .........................0.000 ...........................0.00 ...............................0 ...Yes [ ].........No [ ]............. ...Yes [ ].........No [ ]...Common......................... ................35,000.000 ................35,000.000 .......................120.00 ............XXX................ .........XXX..............XXX........... ........XXX.............XXX....
18.1 Were all the stocks, bonds and other securities owned December 31 of current year, over which the reporting entity has exclusive control, in the actual possession of the reporting entity on said date, except as shown by Schedule E-Part 2-Special Deposits? Yes [ ] No [ X ]
18.2 If no, give full and complete information relating thereto. While some securities were held in physical form in The Hartford vault, the rest were held by our custody bank, JP Morgan/Chase Bank.
19.1 Were any of the stocks, bonds or other assets of the reporting entity owned at December 31 of the current year not exclusively under the control of the reporting entity, except as shown on Schedule E-Part 2-Special Deposits, or has the reporting entity sold or transferred any assets subject to a put option contract that is currently in force? (Exclude securities subject to Interrogatory 15.1) Yes [ ] No [ X ]
19.2 If yes, state the amount thereof at December 31 of the current year:19.21 Loaned to others $..................................019.22 Subject to repurchase agreements $..................................019.23 Subject to reverse repurchase agreements $..................................019.24 Subject to dollar repurchase agreements $..................................019.25 Subject to reverse dollar repurchase agreements $..................................019.26 Pledged as collateral $..................................019.27 Placed under option agreements $..................................019.28 Letter stock or securities restricted as to sale $..................................019.29 Other $..................................0
19.3 For each category above, if any of these assets are held by others, identify by whom held:19.3119.3219.3319.3419.3519.3619.3719.3819.39
For categories (19.21) and (19.23) above, and for any securities that were made available for use by another person during the period covered by this statement, attach a schedule as shown in the instructions to the annual statement.
19.4 For category (19.28) provide the following: 1 2 3
Nature of Restriction Description Amount0
20.1 Does the reporting entity have any hedging transactions reported on Schedule DB? Yes [ ] No [ X ]
20.2 If yes, has a comprehensive description of the hedging program been made available to the domiciliary state? Yes [ ] No [ X ] N/A [ ]If no, attach a description with this statement.
21.1 Were any preferred stocks or bonds owned as of December 31 of the current year mandatorily convertible into equity, or, at the option of the issuer, convertible into equity? Yes [ ] No [ X ]
21.2 If yes, state the amount thereof at December 31 of the current year: $..................................0
22. Excluding items in Schedule E, real estate, mortgage loans and investments held physically in the reporting entity's offices, vaults or safety deposit boxes, were all stocks, bonds and other securities, owned throughout the current year held pursuant to a custodial agreement with a qualified bank or trust company in accordance with Part 1-General, Section IV.H-Custodial or Safekeeping Agreements of the NAIC Financial Condition Examiners Handbook? Yes [ X ] No [ ]
22.01 For agreements that comply with the requirements of the NAIC Financial Condition Examiners Handbook, complete the following: 1 2
Name of Custodian(s) Custodian's AddressJP Morgan/Chase Bank 4 Chase Metro Tech Center, 18th floor, Brooklyn, NY 11245

Annual Statement for the year 2002 of the TWIN CITY FIRE INSURANCE COMPANY
19
GENERAL INTERROGATORIES (continued) INVESTMENT
22.02 For all agreements that do not comply with the requirements of the NAIC Financial Condition Examiners Handbook, provide the name, location and a complete explanation:
1 2 3Name(s) Location(s) Complete Explanation(s)
22.03 Have there been any changes, including name changes, in the custodian(s) identified in 22.01 during the current year? Yes [ ] No [ X ]
22.04 If yes, give full and complete information relating thereto: 1 2 3 4
Old Custodian New Custodian Date of Change Reason
22.05 Identify all investment advisors, brokers/dealers or individuals acting on behalf of broker/dealers that have access to the investment accounts, handle securities and have authority to make investments on behalf of the reporting entity:
1 2 3Central Registration Depository Number(s) Name Address
OTHER
23.1 Amount of payments to Trade Associations, Service Organizations and Statistical or Rating Bureaus, if any? $..................................0
23.2 List the name of the organization and the amount paid if any such payment represented 25% or more of the total payments to Trade Associations, Service Organizations and Statistical or Rating Bureaus during the period covered by this statement.
1 2Name Amount Paid
0
24.1 Amount of payments for legal expenses, if any? $..................................0
24.2 List the name of the firm and the amount paid if any such payment represented 25% or more of the total payments for legal expenses during the period covered by this statement.
1 2Name Amount Paid
0
25.1 Amount of payments for expenditures in connection with matters before legislative bodies, officers or departments of government, if any? $..................................0
25.2 List the name of the firm and the amount paid if any such payment represented 25% or more of the total payment expenditures in connection with matters before legislative bodies, officers or departments of government during the period covered by this statement.
1 2Name Amount Paid
0

Annual Statement for the year 2002 of the TWIN CITY FIRE INSURANCE COMPANY
20
GENERAL INTERROGATORIES (continued) Part 2 - Property and Casualty Interrogatories
1.1 Does the reporting entity have any direct Medicare Supplement Insurance in force? Yes [ ] No [ X ]1.2 If yes, indicate premium earned on U.S. business only. $................................01.3 What portion of item (1.2) is not reported on the Medicare Supplement Insurance Experience Exhibit? $................................0
1.31 Reason for excluding:
1.4 Indicate amount of earned premium attributable to Canadian and/or Other Alien not included in Item (1.2) above. $................................01.5 Indicate total incurred claims on all Medicare Supplement insurance. $................................01.6 Individual policies:
Most current three years: 1.61 Total premium earned $................................01.62 Total incurred claims $................................01.63 Number of covered lives ..................................0All years prior to most current three years: 1.64 Total premium earned $................................01.65 Total incurred claims $................................01.66 Number of covered lives ..................................0
1.7 Group policies: Most current three years: 1.71 Total premium earned $................................01.72 Total incurred claims $................................01.73 Number of covered lives ..................................0All years prior to most current three years: 1.74 Total premium earned $................................01.75 Total incurred claims $................................01.76 Number of covered lives ..................................0
2.1 Does the reporting entity issue both participating and non-participating policies? Yes [ X ] No [ ]2.2 If yes, state the amount of calendar year premiums written on:
2.21 Participating $.................11,020,5602.22 Non-participating policies $...............111,120,870
3. For Mutual Reporting Entities and Reciprocal Exchange only: 3.1 Does the reporting entity issue assessable policies? Yes [ ] No [ ]3.2 Does the reporting entity issue non-assessable policies? Yes [ ] No [ ]3.3 If assessable policies are issued, what is the extent of the contingent liability of the policyholders? ............................0.0 %3.4 Total amount of assessments paid or ordered to be paid during the year on deposit notes or contingent premiums. $................................04. For Reciprocal Exchanges only: 4.1 Does the exchange appoint local agents? Yes [ ] No [ ]4.2 If yes, is the commission paid:
4.21 Out of Attorney's-in-fact compensation Yes [ ] No [ ] N/A [ ]4.22 As a direct expense of the exchange Yes [ ] No [ ] N/A [ ]
4.3 What expenses of the exchange are not paid out of the compensation of the Attorney-in-fact?
4.4 Has any Attorney-in-fact compensation, contingent on fulfillment of certain conditions been deferred? Yes [ ] No [ ]4.5 If yes, give full information:
5.1 What provision has this reporting entity made to protect itself from an excessive loss in the event of a catastrophe under a workers' compensation contract issued without limit of loss? Reins treaties effective 7/1/02 provide CAT protection for W/C of 2,250,000 and Blanket of 600,000 excess of 150,000 company retention.
5.2 Describe the method used to estimate this reporting entity's probable maximum insurance loss, and identify the type of insured exposures comprising that probable maximum loss, the locations of concentrations of those exposures and the external resources (such as consulting firms or computer software models), if any, used in the estimation process: The Hartford maintains a full time Catastrophic Loss Underwriting unit which employs a number of methods of calculating Normal Forseeable Losses.Catastrophic Underwriting Plans are developed for all major catastrophic exposed states. We also utilize a sophisticated monitoring, control, andCatastrophic Loss Estimation program to manage the accumulation of exposures on a country-wide basis.
5.3 What provision has this reporting entity made (such as a catastrophic reinsurance program) to protect itself from an excessive loss arising from the types and concentrations of insured exposures comprising its probable property insurance loss? An extensive Property Catastrophic Reinsurance program is purchased to provide a stabilizing effect over time, smooth losses from catastrophic events onour book of business and to moderate a significant loss to policyholders surplus.
5.4 Does the reporting entity carry catastrophe reinsurance protection for at least one reinstatement, in an amount sufficient to cover its estimated probable maximum loss attributable to a single loss event or occurrence? Yes [ X ] No [ ]
5.5 If no, describe any arrangements or mechanisms employed by the reporting entity to supplement its catastrophe reinsurance program or to hedge its exposure to unreinsured catastrophic loss.
6.1 Has the reporting entity reinsured any risk with any other entity under a quota share reinsurance contract which includes a provision which would limit the reinsurer's losses below the stated quota share percentage (e.g., a deductible, a loss ratio corridor, a loss cap, an aggregate limit or any similar provisions)? Yes [ ] No [ X ]
6.2 If yes, indicate the number of reinsurance contracts containing such provisions. ..................................0

Annual Statement for the year 2002 of the TWIN CITY FIRE INSURANCE COMPANY
21
GENERAL INTERROGATORIES (continued) Part 2 - Property and Casualty Interrogatories (continued)
7.1 Has this reporting entity reinsured any risk with any other entity and agreed to release such entity from liability, in whole or in part, from any loss that may occur on this risk, or portion thereof, reinsured? Yes [ ] No [ X ]
7.2 If yes, give full information:
8. If the reporting entity has assumed risks from another entity, there should be a charged on account of such reinsurances a reserve equal to that which the original entity would have been required to charge had it retained the risks. Has this been done? Yes [ X ] No [ ] N/A [ ]
9.1 Has this reporting entity guaranteed policies issued by any other reporting entity and now in force? Yes [ ] No [ X ]9.2 If yes, give full information:
10.1 If the reporting entity recorded accrued retrospective premiums on insurance contracts on Line 10.3 of the assets schedule, Page 2, state the amount of corresponding liabilities recorded for: 10.11 Unpaid losses $..................2,288,52010.12 Unpaid underwriting expenses (including loss adjustment expenses) $.....................328,455
10.2 Of the amount on Line 10.3 of the asset schedule, Page 2, state the amount which is secured by letters of credit, collateral and other funds: $................................010.3 If the reporting entity underwrites commercial insurance risks, such as workers' compensation, are premium or promissory notes accepted from its insureds
covering unpaid premiums and/or unpaid losses? Yes [ ] No [ X ] N/A [ ]10.4 If yes, provide the range of interest rates charged under such notes during the period covered by this statement:
10.41 From ............................0.0 %10.42 To ............................0.0 %
10.5 Are letters of credit or collateral and other funds received from insureds being utilized by the reporting entity to secure premium or promissory notes taken by a reporting entity, or to secure any of the reporting entity's reported direct unpaid loss reserves, including unpaid losses under loss deductible features of commercial policies? Yes [ ] No [ X ]
10.6 If yes, state the amount thereof at December 31 of the current year: 10.61 Letters of credit $................................010.62 Collateral and other funds $................................0
11.1 What amount of installment notes is owned and now held by the reporting entity? $................................011.2 Have any of these notes been hypothecated, sold or used in any manner as security for money loaned within the past year? Yes [ ] No [ X ]11.3 If yes, what amount? $................................012.1 Largest net aggregate amount insured in any one risk (excluding workers' compensation): $.....................287,99112.2 Does any reinsurance contract considered in the calculation of this amount include an aggregate limit of recovery without also including a
reinstatement provision? Yes [ ] No [ X ]12.3 State the number of reinsurance contracts (excluding individual facultative risk certificates, but including facultative programs, automatic facilities
or facultative obligatory contracts) considered in the calculation of this amount. ..................................113.1 Has the reporting entity guaranteed any financed premium accounts? Yes [ ] No [ X ]13.2 If yes, give full information:
14.1 Does the reporting entity own any securities of a real estate holding company or otherwise hold real estate indirectly? Yes [ ] No [ X ]14.11 Name of real estate holding company 14.12 Number of parcels involved ..................................014.13 Total book/adjusted carrying value $................................0
14.2 If yes, provide explanation
15.1 Does the reporting entity write any warranty business? Yes [ ] No [ X ]If yes, disclose the following information for each of the following types of warranty coverage:
1 2 3 4 5Direct Losses Direct Losses Direct Written Direct Premium Direct Premium
Incurred Unpaid Premium Unearned Earned15.11 Home....................................... ...............................0 ...............................0 ...............................0 ...............................0 ..................................015.12 Products.................................. ...............................0 ...............................0 ...............................0 ...............................0 ..................................015.13 Automobile............................... ...............................0 ...............................0 ...............................0 ...............................0 ..................................015.14 Other*...................................... ...............................0 ...............................0 ...............................0 ...............................0 ..................................0* Disclose type of coverage: ..............

Annual Statement for the year 2002 of the TWIN CITY FIRE INSURANCE COMPANY
22
FIVE-YEAR HISTORICAL DATAShow amounts in whole dollars only, no cents; show percentages to one decimal place, i.e. 17.6.
1 2 3 4 52002 2001 2000 1999 1998
Gross Premiums Written (Page 8, Part 1B, Cols. 1, 2 & 3)
1. Liability lines (Lines 11.1, 11.2, 16, 17.1, 17.2, 18.1, 18.2, 19.1, 19.2 & 19.3, 19.4).................. ...1,184,687,602 ......933,082,993 ......848,305,685 ......572,107,388 ......524,590,237 2. Property lines (Lines 1, 2, 9, 12, 21 & 26)............................................................................... ......164,260,367 ......236,127,506 ......137,469,011 ......121,427,952 ......107,676,638 3. Property and liability combined lines (Lines 3, 4, 5, 8, 22 & 27)............................................... ......207,505,102 ......169,461,019 ......139,199,041 ......177,871,518 ......150,682,233 4. All other lines (Lines 6, 10, 13, 14, 15, 23, 24, 28, 29 & 33)..................................................... ..........4,645,588 ..........5,894,709 ..........5,825,717 ..........2,383,498 ..........2,917,551 5. Non-proportional reinsurance lines (Lines 30, 31 & 32)............................................................ ..........4,697,151 .............808,510 ..........4,745,690 ..........3,853,520 ..........3,649,515 6. Total (Line 34)........................................................................................................................ ...1,565,795,810 ...1,345,374,737 ...1,135,545,144 ......877,643,876 ......789,516,174
Net Premiums Written (Page 8, Part 1B, Col. 6)
7. Liability lines (Lines 11.1, 11.2, 16, 17.1, 17.2, 18.1, 18.2, 19.1, 19.2 & 19.3, 19.4).................. ........56,448,561 ........43,028,569 ........45,211,210 ........42,093,833 ........43,053,253 8. Property lines (Lines 1, 2, 9, 12, 21 & 26)............................................................................... ........24,527,453 ........23,091,917 ........20,537,716 ........18,536,877 ........16,471,319 9. Property and liability combined lines (Lines 3, 4, 5, 8, 22 & 27)............................................... ........33,533,708 ........28,261,714 ........26,158,845 ........24,053,796 ........21,713,676 10. All other lines (Lines 6, 10, 13, 14, 15, 23, 24, 28, 29 & 33)..................................................... ..........2,919,231 ..........2,711,283 ..........3,031,725 ..........2,674,785 ..........2,790,847 11. Non-proportional reinsurance lines (Lines 30, 31 & 32)............................................................ ..........4,697,151 .............808,510 ..........4,745,690 ..........3,853,520 ..........3,649,515 12. Total (Line 34)........................................................................................................................ ......122,126,104 ........97,901,993 ........99,685,186 ........91,212,811 ........87,678,610
Statement of Income (Page 4)
13. Net underwriting gain (Loss) (Line 8)...................................................................................... .........(1,266,882) .......(14,183,273) .........(3,146,487) .........(4,529,932) .........(3,399,674) 14. Net investment gain (loss) (Line 11)....................................................................................... ........20,203,097 ........19,724,816 ........19,362,615 ........17,669,320 ........16,664,958 15. Total other income (Line 15)................................................................................................... ..........6,584,483 ..........6,132,167 ..........5,881,551 ..........4,648,456 ..........3,365,255 16. Dividends to policyholders (Line 17)....................................................................................... .............481,554 .............290,753 .............966,330 .............786,513 .............466,734 17. Federal and foreign income taxes incurred (Line 19)............................................................... ..........5,831,655 ..........1,589,205 .........(3,551,669) ..........2,056,938 ..........7,363,528 18. Net income (Line 20).............................................................................................................. ........19,207,489 ..........9,793,752 ........24,683,018 ........14,944,393 ..........8,800,277
Balance Sheet Lines (Pages 2 and 3)
19. Total admitted assets excluding Protected Cell (Page 2, Line 26, Col. 3)................................. ......397,300,232 ......363,079,633 ......334,299,833 ......317,317,987 ......314,146,053 20. Agents' balances or uncollected premiums (Page 2, Col. 3):
20.1 In course of collection (Line 10.1).................................................................................. .......................0 .......................0 .......................0 .......................0 .......................020.2 Deferred and not yet due (Line 10.2).............................................................................. .......................0 .......................0 .......................0 .......................0 .......................020.3 Accrued retrospective premiums (Line 10.3)................................................................... ..........2,616,975 ..........2,582,495 ..........2,755,701 ..........3,012,687 ..........3,100,248
21. Total liabilities excluding Protected Cell (Page 3, Line 24)....................................................... ......215,519,217 ......209,677,322 ......196,660,398 ......194,233,502 ......199,517,421 22. Losses (Page 3, Lines 1 & 2).................................................................................................. ......134,364,316 ......127,900,501 ......126,879,695 ......128,273,673 ......128,828,482 23. Loss adjustment expenses (Page 3, Line 3)............................................................................ ........20,394,834 ........19,304,282 ........21,407,730 ........21,491,150 ........23,057,703 24. Unearned premiums (Page 3, Line 9)..................................................................................... ........53,315,937 ........46,327,271 ........41,742,224 ........37,881,917 ........35,171,252 25. Capital paid up (Page 3, Lines 28 & 29).................................................................................. ..........4,200,000 ..........4,200,000 ..........4,200,000 ..........4,200,000 ..........4,200,000 26. Surplus as regards policyholders (Page 3, Line 35)................................................................. ......181,781,015 ......153,402,311 ......137,639,435 ......123,084,485 ......114,628,632
Risk-Based Capital Analysis 27. Total adjusted capital............................................................................................................. ......181,781,015 ......153,402,311 ......137,639,435 ......123,084,485 ......114,628,632 28. Authorized control level risk-based capital.............................................................................. ........13,625,838 ........12,389,680 ........12,016,081 ........11,876,628 ........12,467,470
Percentage Distribution of Cash and Invested Assets (Page 2, Col. 3) (Item divided by Page 2, Line 9, Col. 3) x 100.0
29. Bonds (Line 1)....................................................................................................................... ..................96.5 ..................93.5 ..................95.7 ..................97.7 ..................97.8 30. Stocks (Lines 2.1 & 2.2)......................................................................................................... ....................2.5 ....................2.7 ....................2.3 ....................0.7 ....................0.9 31. Mortgage loans on real estate (Lines 3.1 & 3.2)...................................................................... ....................0.0 ....................0.0 ....................0.0 ....................0.0 ....................0.0 32. Real estate (Lines 4.1, 4.2 & 4.3)........................................................................................... ....................0.0 ....................0.0 ....................0.0 ....................0.0 ....................0.0 33. Cash and short-term investments (Line 5).............................................................................. ....................1.0 ....................3.8 ....................2.0 ....................1.7 ....................1.3 34. Other invested assets (Line 6)................................................................................................ ....................0.0 ....................0.0 ....................0.0 ....................0.0 ....................0.0 35. Receivable for securities (Line 7)............................................................................................ ....................0.0 ....................0.0 ....................0.0 ....................0.0 ....................0.0 36. Aggregate write-ins for invested assets (Line 8)...................................................................... ....................0.0 ....................0.0 ....................0.0 ....................0.0 ....................0.0 37. Cash and invested assets (Line 9).......................................................................................... ................100.0 ................100.0 ................100.0 ................100.0 ................100.0
Investments in Parent, Subsidiaries and Affiliates 38. Affiliated bonds (Sch. D, Summary, Line 25, Col. 1)................................................................ .......................0 .......................0 .......................0 .......................0 .......................0 39. Affiliated preferred stocks (Sch. D, Summary, Line 39, Col. 1)................................................ .......................0 .......................0 .......................0 .......................0 .......................0 40. Affiliated common stocks (Sch. D, Summary, Line 53, Col. 2)................................................. .......................0 .......................0 .......................0 .......................0 .......................0 41. Affiliated short-term investments (subtotals included in Schedule DA, Part 2, Col. 5, Line 11).. .......................0 .......................0 .......................0 .......................0 .......................0 42. Affiliated mortgage loans on real estate.................................................................................. .......................0 .......................0 .......................0 .......................0 .......................0 43. All other affiliated................................................................................................................... .......................0 .......................0 .......................0 .......................0 .......................0 44. Total of above lines 38 to 43.................................................................................................. .......................0 .......................0 .......................0 .......................0 .......................0 45. Percentage of investments in parent, subsidiaries and affiliates to surplus
as regards policyholders (Line 44 above divided by Page 3, Col. 1, Line 35 x 100.0)............... ....................0.0 ....................0.0 ....................0.0 ....................0.0 ....................0.0

Annual Statement for the year 2002 of the TWIN CITY FIRE INSURANCE COMPANY
23
FIVE-YEAR HISTORICAL DATA(Continued)
1 2 3 4 5
2002 2001 2000 1999 1998
Capital and Surplus Accounts (Page 4)
46. Net unrealized capital gains (losses) (Line 23)........................................................................ ............(728,778) ...............67,180 .............337,165 ............(542,521) .............134,084 47. Dividends to stockholders (Line 34)........................................................................................ .........(5,000,000) .......................0 .......(11,000,050) .........(6,499,850) .........(9,000,250) 48. Change in surplus as regards policyholders for the year (Line 37)........................................... ........28,378,704 ........15,762,876 ........14,554,950 ..........8,455,853 .............287,586
Gross Losses Paid (Page 9, Part 2, Cols. 1 & 2)
49. Liability lines (Lines 11.1, 11.2, 16, 17.1, 17.2, 18.1, 18.2, 19.1, 19.2 & 19.3, 19.4).................. ......466,554,728 ......428,873,787 ......343,269,706 ......342,286,584 ......342,768,535 50. Property lines (Lines 1, 2, 9, 12, 21 & 26)............................................................................... ......103,000,613 ........97,820,909 ........84,961,592 ........68,708,703 ........54,326,584 51. Property and liability combined lines (Lines 3, 4, 5, 8, 22 & 27)............................................... ........82,526,489 ........90,151,357 ........84,160,446 ........85,233,614 ........79,583,260 52. All other lines (Lines 6, 10, 13, 14, 15, 23, 24, 28, 29 & 33)..................................................... ..........1,399,031 ..........1,503,157 ..........1,449,716 ..........1,745,361 ..........1,592,301 53. Nonproportional reinsurance lines (Lines 30, 31 & 32)............................................................. ..........4,135,542 ..........4,550,745 ..........3,176,368 ..........2,002,688 ..........1,949,260 54. Total (Line 34)........................................................................................................................ ......657,616,403 ......622,899,955 ......517,017,828 ......499,976,950 ......480,219,940
Net Losses Paid (Page 9, Part 2, Col. 4)
55. Liability lines (Lines 11.1, 11.2, 16, 17.1, 17.2, 18.1, 18.2, 19.1, 19.2 & 19.3, 19.4).................. ........30,378,787 ........29,953,158 ........28,344,948 ........28,250,299 ........27,261,080 56. Property lines (Lines 1, 2, 9, 12, 21 & 26)............................................................................... ........11,896,924 ........12,321,688 ........12,008,133 ........10,285,303 ..........9,850,735 57. Property and liability combined lines (Lines 3, 4, 5, 8, 22 & 27)............................................... ........14,763,088 ........15,496,283 ........13,469,539 ........12,985,128 ........12,087,091 58. All other lines (Lines 6, 10, 13, 14, 15, 23, 24, 28, 29 & 33)..................................................... ..........1,335,340 ..........1,454,127 ..........1,357,339 ..........1,476,419 ..........1,208,701 59. Nonproportional reinsurance lines (Lines 30, 31 & 32)............................................................. ..........4,135,542 ..........4,550,745 ..........3,176,368 ..........2,002,688 ..........1,949,260 60. Total (Line 34)........................................................................................................................ ........62,509,681 ........63,776,001 ........58,356,327 ........54,999,837 ........52,356,867
Operating Percentages (Page 4) (Item divided by Page 4, Line 1) x 100.0
61. Premiums earned (Line 1)...................................................................................................... ................100.0 ................100.0 ................100.0 ................100.0 ................100.0 62. Losses incurred (Line 2)......................................................................................................... ..................59.9 ..................69.6 ..................59.6 ..................61.6 ..................61.2 63. Loss expenses incurred (Line 3)............................................................................................. ..................11.2 ..................10.7 ..................11.5 ..................10.2 ....................9.4 64. Other underwriting expenses incurred (Line 4)........................................................................ ..................30.0 ..................35.0 ..................32.2 ..................33.3 ..................33.3 65. Net underwriting gain (loss) (Line 8)....................................................................................... ...................(1.1) .................(15.2) ...................(3.3) ...................(5.1) ...................(3.9)
Other Percentages 66. Other underwriting expenses to net premiums written (Page 4, Lines 4 + 5 - 15
divided by Page 8, Part 1B, Col. 6, Line 34 x 100.0)................................................................ ..................22.9 ..................27.0 ..................25.0 ..................27.2 ..................29.0 67. Losses and loss expenses incurred to premiums earned
(Page 4, Lines 2 + 3 divided by Page 4, Line 1 x 100.0).......................................................... ..................71.1 ..................80.2 ..................71.1 ..................71.8 ..................70.7 68. Net premiums written to policyholders' surplus (Page 8, Part 1B,
Col. 6, Line 34, divided by Page 3, Line 35, Col. 1 x 100.0)..................................................... ..................67.2 ..................63.8 ..................72.4 ..................74.1 ..................76.5
One Year Loss Development (000 omitted) 69. Development in estimated losses and loss expenses incurred prior
to current year (Schedule P, Part 2-Summary, Line 12, Col. 11).............................................. ................4,274 .............(10,669) ...............(3,040) ...............(4,240) ...............(4,020) 70. Percent of development of losses and loss expenses incurred to policyholders' surplus of
prior year end (Line 69 above divided by Page 4, Line 21, Col. 1 x 100).................................. ....................2.8 ...................(7.8) ...................(2.5) ...................(3.7) ...................(3.5)
Two Year Loss Development (000 omitted) 71. Development in estimated losses and loss expenses incurred 2 years before the
current year and prior year (Schedule P, Part 2-Summary, Line 12, Col. 12)............................ ...............(6,006) .............(15,327) ...............(8,335) ...............(8,771) ...............(4,720) 72. Percent of development of losses and loss expenses incurred to
reported policyholders' surplus of second year end (Line 71 above divided by Page 4, Line 21, Col. 2 x 100.0)..................................................... ...................(4.4) .................(12.5) ...................(7.3) ...................(7.7) ...................(4.6)

Annual Statement for the year 2002 of the TWIN CITY FIRE INSURANCE COMPANY
24
EXHIBIT OF PREMIUMS AND LOSSES (Statutory Page 14) *29459200243058100*NAIC Group Code.....0091 NAIC Company Code....29459 BUSINESS IN GRAND TOTAL DURING THE YEAR
Gross Premiums, Including Policy and 3 4 5 6 7 8 9 10 11 12Membership Fees, Less Return Premiums
and Premiums on Policies not Taken Dividends Paid or Direct Defense Direct Defense Direct Defense1 2 Credited to Direct Losses and Cost and Cost and Cost Commissions Taxes,
Direct Premiums Direct Premiums Policyholders on Direct Unearned Paid Direct Losses Direct Losses Containment Containment Containment and Brokerage Licenses andLine of Business Written Earned Direct Business Premium Reserves (deducting salvage) Incurred Unpaid Expense Paid Expense Incurred Expense Unpaid Expenses Fees
1. Fire.................................................................................................. ...............2,692,257 ...............3,138,188 ............................0 ..................502,199 ..................999,687 .................(955,673) ...............1,706,906 ..................201,711 ..................227,435 ..................120,823 .................502,599 ...................85,7952.1 Allied lines....................................................................................... ...............9,354,048 ...............9,754,418 ............................0 ..................514,045 ...............5,325,737 ...............3,562,357 ...............2,083,876 ...............1,038,215 ...............1,111,869 ..................148,110 ..............1,942,140 .................202,9512.2 Multiple peril crop............................................................................ .............................0 .............................0 ............................0 .............................0 .............................0 .............................0 ...........................16 .............................0 .............................0 .............................0 ............................0 ............................02.3 Federal flood................................................................................... .............................0 .............................0 ............................0 .............................0 .............................0 .............................0 .............................0 .............................0 .............................0 .............................0 ............................0 ............................03. Farmowners multiple peril............................................................... .............................0 .........................200 ............................0 .............................0 .............................0 .................(337,294) ......................2,380 .............................0 .....................(1,499) ........................(921) ............................0 .....................1,1344. Homeowners multiple peril.............................................................. .............43,187,480 .............41,377,035 ............................0 .............22,868,492 .............20,632,607 .............21,570,939 ...............9,501,873 ...............1,408,239 ...............1,610,210 ..................780,915 ..............4,829,743 ..............1,296,382
5.1 Commercial multiple peril (non-liability portion).............................. .............44,548,335 .............38,390,845 ........................140 .............20,687,911 .............17,155,020 .............11,516,419 .............10,775,340 ..................974,909 ..................158,571 ...............1,176,562 ..............7,227,423 ..............1,792,5685.2 Commercial multiple peril (liability portion)..................................... .............85,886,271 .............76,626,345 .....................5,815 .............40,803,206 .............29,925,885 .............28,654,208 .............67,709,994 .............11,165,231 ...............9,345,554 .............20,194,899 ............14,044,294 ..............2,445,5296. Mortgage guaranty.......................................................................... .............................0 .............................0 ............................0 .............................0 .............................0 .............................0 .............................0 .............................0 .............................0 .............................0 ............................0 ............................08. Ocean marine................................................................................. ..................260,366 ..................271,753 ............................0 ..................126,952 ....................49,882 ....................66,243 ....................48,946 ......................2,268 ......................2,094 ........................(567) ...................30,745 .....................9,8229. Inland marine.................................................................................. .............22,385,643 .............61,210,154 ............................0 .............33,016,851 .............31,817,347 .............53,768,486 .............28,783,596 ...............1,203,710 ...................(11,140) ..............(1,045,932) .................185,982 .................918,350
10. Financial guaranty.......................................................................... .............................0 .............................0 ............................0 .............................0 .............................0 .............................0 .............................0 .............................0 .............................0 .............................0 ............................0 ............................011. Medical malpractice........................................................................ .............................0 .............................0 ............................0 .............................0 ....................90,000 .................(200,855) ..................633,968 ......................8,980 .....................(2,768) ..................203,374 ............................0 .....................2,84712. Earthquake...................................................................................... ..................368,660 ..................391,190 ............................0 ..................169,070 .............................0 .............................0 ......................5,051 ......................6,693 ......................6,693 .............................0 ...................24,728 ...................16,09413. Group accident and health.............................................................. .............................0 .............................0 ............................0 .............................0 .............................0 .............................0 .............................0 .............................0 .............................0 .............................0 ............................0 ............................014. Credit A & H (group and individual)................................................ .............................0 .............................0 ............................0 .............................0 .............................0 .............................0 .............................0 .............................0 .............................0 .............................0 ............................0 ............................0
15.1 Collectively renewable A&H............................................................ .............................0 .............................0 ............................0 .............................0 .............................0 .............................0 .............................0 .............................0 .............................0 .............................0 ............................0 ............................015.2 Non-cancelable A & H..................................................................... .............................0 .............................0 ............................0 .............................0 .............................0 .............................0 .............................0 .............................0 .............................0 .............................0 ............................0 ............................015.3 Guaranteed renewable A & H......................................................... .............................0 .............................0 ............................0 .............................0 .............................0 .............................0 .............................0 .............................0 .............................0 .............................0 ............................0 ............................015.4 Non-renewable for stated reasons only.......................................... .............................0 .............................0 ............................0 .............................0 .............................0 .............................0 .............................0 .............................0 .............................0 .............................0 ............................0 ............................015.5 Other accident only......................................................................... .............................0 .............................0 ............................0 .............................0 .............................0 .............................0 .............................0 .............................0 .............................0 .............................0 ............................0 ............................015.6 All other A & H................................................................................ .............................0 .............................0 ............................0 .............................0 .............................0 .............................0 .............................0 .............................0 .............................0 .............................0 ............................0 ............................015.7 Federal employees health benefits program premium................... .............................0 .............................0 ............................0 .............................0 .............................0 .............................0 .............................0 .............................0 .............................0 .............................0 ............................0 ............................016. Workers' compensation.................................................................. ...........508,984,397 ...........472,310,829 ..............7,471,574 ...........124,874,399 ...........182,190,657 ...........257,522,241 ...........860,410,161 .............19,511,125 .............23,187,166 .............61,676,941 ............48,731,417 ............21,717,78617. Other liability................................................................................... ...........397,877,943 ...........332,470,491 ....................(9,826) ...........223,947,491 ...........138,980,239 ...........169,768,396 ...........623,707,908 .............30,082,249 .............21,504,192 .............68,123,501 ............48,141,310 ..............9,709,02518. Products liability.............................................................................. .............26,507,458 .............23,479,506 ............................0 .............12,393,412 ...............6,743,037 ..............(2,538,343) .............69,922,396 ...............2,083,328 ...............2,842,155 .............17,972,541 ..............3,721,799 .................765,816
19.1 Private passenger auto no-fault (personal injury protection).......... .............10,847,370 .............12,218,679 ............................0 ...............3,811,560 .............11,134,088 .............13,052,350 .............14,283,524 ..................928,834 ...............1,417,876 ...............2,167,113 ..............1,505,196 .................429,94919.2 Other private passenger auto liability............................................. ...........101,094,633 ...........113,373,763 ............................0 .............42,348,682 .............69,004,280 .............73,824,419 .............98,175,078 ...............5,391,262 ...............7,499,903 .............14,085,206 ............13,022,908 ..............2,967,72319.3 Commercial auto no-fault (personal injury protection).................... ...............1,441,089 ...............1,274,932 ............................0 ..................645,555 ..................787,921 ..................464,100 ...............1,496,108 ....................55,217 ....................12,143 ..................116,847 .................242,282 ...................48,83219.4 Other commercial auto liability....................................................... .............81,481,803 .............72,267,236 .....................1,367 .............38,348,846 .............27,245,719 .............22,758,561 .............54,518,697 ...............2,734,204 ...............1,533,225 ...............3,866,629 ............13,244,520 ..............2,679,40621.1 Private passenger auto physical damage....................................... .............79,919,257 .............85,305,666 ........................276 .............33,371,888 .............43,718,325 .............42,610,855 ...............4,060,861 ..................667,726 ..................534,329 ..................151,314 ............10,382,947 ..............2,357,66921.2 Commercial auto physical damage................................................. .............25,013,053 .............22,344,275 ............................3 .............10,837,521 ...............9,240,647 ...............9,363,474 ...............2,163,626 ..................220,949 ..................339,590 ..................615,144 ..............4,153,311 .................807,41122. Aircraft (all perils)............................................................................ .............................0 .............................0 ............................0 .............................0 .............................0 .............................0 .............................0 .............................0 .............................0 .............................0 ............................0 ............................023. Fidelity............................................................................................ ...............1,730,638 ...............2,437,020 ............................0 ..................456,420 ....................63,691 ...............1,141,304 ...............1,475,843 ....................81,900 ..................226,927 ..................185,343 .................114,422 ...................44,48724. Surety.............................................................................................. .....................(4,281) .....................(4,288) ............................0 .............................7 .............................0 ........................(273) ........................(264) .............................0 ..........................(21) ..........................(20) .......................(408) .................240,37526. Burglary and theft............................................................................ .............................0 .............................0 ............................0 .............................0 ......................1,950 ......................1,949 .............................0 .............................0 .............................0 .............................0 ............................0 .......................(708)27. Boiler and machinery...................................................................... ....................88,940 ....................94,727 ............................0 ....................38,040 .............................0 .....................(8,044) .....................(6,096) .............................0 ...........................94 ...........................41 ...................11,897 .....................1,59628. Credit............................................................................................... .............................0 .............................0 ............................0 .............................0 .............................0 .............................0 .............................0 .............................0 .............................0 .............................0 ............................0 ............................033. Aggregate write-ins for other lines of business............................... ......................4,350 ......................4,350 ............................0 .............................0 .............................0 .............................0 .............................0 .............................0 .............................0 .............................0 ............................0 ............................034. TOTALS (a)..................................................................................... ........1,443,669,710 ........1,368,737,314 ..............7,469,349 ...........609,762,547 ...........595,106,719 ...........705,605,819 ........1,851,459,788 .............77,766,750 .............71,544,598 ...........190,537,863 ..........172,059,255 ............48,540,839
DETAILS OF WRITE-INS3301. ........................................................................................................ .............................0 .............................0 ............................0 .............................0 .............................0 .............................0 .............................0 .............................0 .............................0 .............................0 ............................0 ............................03302. Uninsured Motorist.......................................................................... ......................4,350 ......................4,350 ............................0 .............................0 .............................0 .............................0 .............................0 .............................0 .............................0 .............................0 ............................0 ............................03303. ........................................................................................................ .............................0 .............................0 ............................0 .............................0 .............................0 .............................0 .............................0 .............................0 .............................0 .............................0 ............................0 ............................03398. Summary of remaining write-ins for Line 33 from overflow page.... .............................0 .............................0 ............................0 .............................0 .............................0 .............................0 .............................0 .............................0 .............................0 .............................0 ............................0 ............................03399. TOTALS (Lines 3301 thru 3303 plus 3398) (Line 33 above).......... ......................4,350 ......................4,350 ............................0 .............................0 .............................0 .............................0 .............................0 .............................0 .............................0 .............................0 ............................0 ............................0
(a) Finance and service charges not included in Lines 1 to 34 $.....6,713,047.
Annual Statement for the year 2002 of the TWIN CITY FIRE INSURANCE COMPANY
25
SCHEDULE A - VERIFICATION BETWEEN YEARS1. Book/adjusted carrying value, December 31, prior year (prior year statement).............................................................................................................................. 0
2. Increase (decrease) by adjustment:
2.1 Totals, Part 1, Column 10.................................................................................................................................................................................................. 0
2.2 Totals, Part 3, Column 7.................................................................................................................................................................................................... 0
3. Cost of acquired (Totals, Part 2, Column 6, net of encumbrances (Column 7) and net of additions and permanent improvements (Column 9)).............................. 0
4. Cost of additions and permanent improvements:
4.1 Totals, Part 1, Column 13.................................................................................................................................................................................................. 0
4.2 Totals, Part 3, Column 9.................................................................................................................................................................................................... 0
5. Total profit (loss) on sales, Part 3, Column 14............................................................................................................................................................................. 0
6. Increase (decrease) by foreign exchange adjustment:
6.1 Totals, Part 1, Column 11.................................................................................................................................................................................................. 0
6.2 Totals, Part 3, Column 8.................................................................................................................................................................................................... 0
7. Amounts received on sales, Part 3, Column 11 and Part 1, Column 12........................................................................................................................................ 0
8. Book/adjusted carrying value at end of current period.................................................................................................................................................................. 0
9. Total valuation allowance............................................................................................................................................................................................................ 0
10. Subtotal (Lines 8 plus 9).............................................................................................................................................................................................................. 0
11. Total nonadmitted amounts......................................................................................................................................................................................................... 0
12. Statement value, current period (Page 2, real estate lines, current period).................................................................................................................................... 0
NONE
SCHEDULE B - VERIFICATION BETWEEN YEARS1. Book value/recorded investment excluding accrued interest of mortgages owned, December 31 of prior year............................................................................... 0
2. Amount loaned during year:
2.1 Actual cost at time of acquisitions............................................................................................................................................ 0
2.2 Additional investment made after acquisitions.......................................................................................................................... 0 0
3. Accrual of discount and mortgage interest points and commitment fees....................................................................................................................................... 0
4. Increase (decrease) by adjustment.............................................................................................................................................................................................. 0
5. Total profit (loss) on sale............................................................................................................................................................................................................. 0
6. Amounts paid on account or in full during the year....................................................................................................................................................................... 0
7. Amortization of premium............................................................................................................................................................................................................. 0
8. Increase (decrease) by foreign exchange adjustment................................................................................................................................................................... 0
9. Book value/recorded investment excluding accrued interest on mortgages owned at end of current period.................................................................................... 0
10. Total valuation allowance............................................................................................................................................................................................................ 0
11. Subtotal (Lines 9 plus 10)............................................................................................................................................................................................................ 0
12. Total nonadmitted amounts......................................................................................................................................................................................................... 0
13. Statement value of mortgages owned at end of current period..................................................................................................................................................... 0
NONE
SCHEDULE BA - VERIFICATION BETWEEN YEARS1. Book/adjusted carrying value of long-term invested assets owned, December 31 of prior year...................................................................................................... 0
2. Cost of acquisitions during year:
2.1 Actual cost at time of acquisitions............................................................................................................................................ 0
2.2 Additional investment made after acquisitions.......................................................................................................................... 0 0
3. Accrual of discount..................................................................................................................................................................................................................... 0
4. Increase (decrease) by adjustment.............................................................................................................................................................................................. 0
5. Total profit (loss) on sale............................................................................................................................................................................................................. 0
6. Amounts paid on account or in full during the year....................................................................................................................................................................... 0
7. Amortization of premium............................................................................................................................................................................................................. 0
8. Increase (decrease) by foreign exchange adjustment................................................................................................................................................................... 0
9. Book/adjusted carrying value of long-term invested assets at end of current period...................................................................................................................... 0
10. Total valuation allowance............................................................................................................................................................................................................ 0
11. Subtotal (Lines 9 plus 10)............................................................................................................................................................................................................ 0
12. Total nonadmitted amounts......................................................................................................................................................................................................... 0
13. Statement value of long-term invested assets at end of current period......................................................................................................................................... 0
NONE

Annual Statement for the year 2002 of the TWIN CITY FIRE INSURANCE COMPANY
26
SCHEDULE D - SUMMARY BY COUNTRYLong-Term Bonds and Stocks OWNED December 31 of Current Year
1 2 3 4Book/Adjusted Fair Value Par Value
Description Carrying Value (a) Actual Cost of BondsBONDS 1. United States..................... .......................9,996,315 .....................10,005,127 .....................10,027,185 .......................9,820,314
Governments 2. Canada.............................. ....................................0 ....................................0 ....................................0 ....................................0 (Including all obligations guaranteed 3. Other Countries.................. ....................................0 ....................................0 ....................................0 ....................................0 by governments) 4. Totals................................ .......................9,996,315 .....................10,005,127 .....................10,027,185 .......................9,820,314
5. United States..................... .....................80,710,152 .....................85,748,603 .....................80,234,300 .....................80,930,000States, Territories and Possessions 6. Canada.............................. ....................................0 ....................................0 ....................................0 ....................................0 (Direct and guaranteed) 7. Other Countries.................. ....................................0 ....................................0 ....................................0 ....................................0
8. Totals................................ .....................80,710,152 .....................85,748,603 .....................80,234,300 .....................80,930,000Political Subdivisions of States, 9. United States..................... ...................129,151,165 ...................139,095,736 ...................126,749,880 ...................141,830,000Territories and Possessions 10. Canada.............................. ....................................0 ....................................0 ....................................0 ....................................0 (Direct and guaranteed) 11. Other Countries.................. ....................................0 ....................................0 ....................................0 ....................................0
12. Totals................................ ...................129,151,165 ...................139,095,736 ...................126,749,880 ...................141,830,000Special Revenue and Special Assessment 13. United States..................... ...................113,961,970 ...................121,415,545 ...................113,564,564 ...................113,852,103Obligations and all Non-guaranteed Obligations 14. Canada.............................. ....................................0 ....................................0 ....................................0 ....................................0of Agencies and Authorities of Governments 15. Other Countries.................. ....................................0 ....................................0 ....................................0 ....................................0and their Political Subdivisions 16. Totals................................ ...................113,961,970 ...................121,415,545 ...................113,564,564 ...................113,852,103
17. United States..................... .......................4,205,500 .......................4,205,500 .......................4,983,700 .......................5,000,000Public Utilities 18. Canada.............................. ....................................0 ....................................0 ....................................0 ....................................0 (unaffiliated) 19. Other Countries.................. ....................................0 ....................................0 ....................................0 ....................................0
20. Totals................................ .......................4,205,500 .......................4,205,500 .......................4,983,700 .......................5,000,000Industrial and Miscellaneous and 21. United States..................... .....................20,711,463 .....................23,267,017 .....................20,570,725 .....................23,043,000Credit Tenant Loans 22. Canada.............................. ....................................0 ....................................0 ....................................0 ....................................0 (Unaffiliated) 23. Other Countries.................. .......................4,851,787 .......................4,910,874 .......................4,861,470 .......................4,500,000
24. Totals................................ .....................25,563,250 .....................28,177,891 .....................25,432,195 .....................27,543,000Parent, Subsidiaries and Affiliates 25. Totals................................ ....................................0 ....................................0 ....................................0 ....................................0
26. Total Bonds...................... ...................363,588,352 ...................388,648,403 ...................360,991,824 ...................378,975,417PREFERRED STOCKS 27. United States..................... ....................................0 ....................................0 ....................................0
Public Utilities 28. Canada.............................. ....................................0 ....................................0 ....................................0 (Unaffiliated) 29. Other Countries.................. ....................................0 ....................................0 ....................................0
30. Totals................................ ....................................0 ....................................0 ....................................031 United States..................... ....................................0 ....................................0 ....................................0
Banks, Trust and Insurance Companies 32. Canada.............................. ....................................0 ....................................0 ....................................0 (Unaffiliated) 33. Other Countries.................. ....................................0 ....................................0 ....................................0
34. Totals................................ ....................................0 ....................................0 ....................................035. United States..................... .......................6,952,851 .......................7,287,500 .......................6,952,150
Industrial and Miscellaneous 36. Canada.............................. ....................................0 ....................................0 ....................................0 (Unaffiliated) 37. Other Countries.................. .......................2,645,000 .......................2,645,000 .......................2,550,000
38. Totals................................ .......................9,597,851 .......................9,932,500 .......................9,502,150Parent, Subsidiaries and Affiliates 39. Totals................................ ....................................0 ....................................0 ....................................0
40. Total Preferred Stocks..... .......................9,597,851 .......................9,932,500 .......................9,502,150COMMON STOCKS 41. United States..................... ....................................0 ....................................0 ....................................0
Public Utilities 42. Canada.............................. ....................................0 ....................................0 ....................................0 (Unaffiliated) 43. Other Countries.................. ....................................0 ....................................0 ....................................0
44. Totals................................ ....................................0 ....................................0 ....................................045. United States..................... ....................................0 ....................................0 ....................................0
Banks, Trust and Insurance Companies 46. Canada.............................. ....................................0 ....................................0 ....................................0 (Unaffiliated) 47. Other Countries.................. ....................................0 ....................................0 ....................................0
48. Totals................................ ....................................0 ....................................0 ....................................049. United States..................... ....................................0 ....................................0 ....................................0
Industrial and Miscellaneous 50. Canada.............................. ....................................0 ....................................0 ....................................0 (Unaffiliated) 51. Other Countries.................. ....................................0 ....................................0 ....................................0
52. Totals................................ ....................................0 ....................................0 ....................................0Parent, Subsidiaries and Affiliates 53. Totals................................ ....................................0 ....................................0 ....................................0
54. Total Common Stocks...... ....................................0 ....................................0 ....................................055. Total Stocks..................... .......................9,597,851 .......................9,932,500 .......................9,502,15056. Total Bonds and Stocks... ...................373,186,203 ...................398,580,903 ...................370,493,974
(a) The aggregate value of bonds which are valued at other than actual fair value is $.....22,166,292.
SCHEDULE D - VERIFICATION BETWEEN YEARS1. Book/adjusted carrying value of bonds and stocks, prior year....................... 335,536,636 6. Foreign exchange adjustment: 2. Cost of bonds and stocks acquired, Column 6, Part 3.................................. 92,335,938 6.1 Column 17, Part 1........................... 03. Increase (decrease) by adjustment: 6.2 Column 13, Part 2, Section 1........... 0
3.1 Column 16, Part 1.............................................. 351,382 6.3 Column 11, Part 2, Section 2........... 03.2 Column 12, Part 2, Section 1.............................. 92,600 6.4 Column 11, Part 4........................... 0 03.3 Column 10, Part 2, Section 2.............................. 0 7. Book/adjusted carrying value at end of current period............... 373,186,2033.4 Column 10, Part 4.............................................. (13,176) 430,807 8. Total valuation allowance......................................................... 0
4. Total gain (loss), Column 14, Part 4............................................................. 842,265 9. Subtotal (Lines 7 plus 8).......................................................... 373,186,2035. Deduct consideration for bonds and stocks disposed of, Column 6, Part 4... 55,959,445 10. Total nonadmitted amounts...................................................... 0
11. Statement value of bonds and stocks, current period................ 373,186,203

Annual Statement for the year 2002 of the TWIN CITY FIRE INSURANCE COMPANY
27
SCHEDULE D - PART 1A - SECTION 1Quality and Maturity Distribution of All Bonds Owned December 31, At Book/Adjusted Carrying Values By Major Types of Issues and NAIC Designations
1 2 3 4 5 6 7 8 9 10 11Quality Rating per the 1 Year Over 1 Year Over 5 Years Over 10 Years Over 20 Total Column 6 as a Total from Column % from Col. 7 Total Total
NAIC Designation or Less Through 5 Years Through 10 Years Through 20 Years Years Current Year % of Line 10.7 6 Prior Year Prior Year Publicly Traded Privately Placed (a)1. U.S. Governments, Schedules D & DA (Group 1)
1.1 Class 1.............................................................................................. ..............1,206,300 ..............7,141,968 ..............1,115,019 .................462,303 ...................70,726 .................9,996,315 .........................2.7 .................288,052 .........................0.1 ..............9,996,315 ............................01.2 Class 2.............................................................................................. ............................0 ............................0 ............................0 ............................0 ............................0 ..............................0 .........................0.0 ............................0 .........................0.0 ............................0 ............................01.3 Class 3.............................................................................................. ............................0 ............................0 ............................0 ............................0 ............................0 ..............................0 .........................0.0 ............................0 .........................0.0 ............................0 ............................01.4 Class 4.............................................................................................. ............................0 ............................0 ............................0 ............................0 ............................0 ..............................0 .........................0.0 ............................0 .........................0.0 ............................0 ............................01.5 Class 5.............................................................................................. ............................0 ............................0 ............................0 ............................0 ............................0 ..............................0 .........................0.0 ............................0 .........................0.0 ............................0 ............................01.6 Class 6.............................................................................................. ............................0 ............................0 ............................0 ............................0 ............................0 ..............................0 .........................0.0 ............................0 .........................0.0 ............................0 ............................01.7 Totals................................................................................................. ..............1,206,300 ..............7,141,968 ..............1,115,019 .................462,303 ...................70,726 .................9,996,315 .........................2.7 .................288,052 .........................0.1 ..............9,996,315 ............................0
2. All Other Governments, Schedules D & DA (Group 2)2.1 Class 1.............................................................................................. ............................0 ............................0 ............................0 ............................0 ............................0 ..............................0 .........................0.0 ............................0 .........................0.0 ............................0 ............................02.2 Class 2.............................................................................................. ............................0 ............................0 ............................0 ............................0 ............................0 ..............................0 .........................0.0 ............................0 .........................0.0 ............................0 ............................02.3 Class 3.............................................................................................. ............................0 ............................0 ............................0 ............................0 ............................0 ..............................0 .........................0.0 ............................0 .........................0.0 ............................0 ............................02.4 Class 4.............................................................................................. ............................0 ............................0 ............................0 ............................0 ............................0 ..............................0 .........................0.0 ............................0 .........................0.0 ............................0 ............................02.5 Class 5.............................................................................................. ............................0 ............................0 ............................0 ............................0 ............................0 ..............................0 .........................0.0 ............................0 .........................0.0 ............................0 ............................02.6 Class 6.............................................................................................. ............................0 ............................0 ............................0 ............................0 ............................0 ..............................0 .........................0.0 ............................0 .........................0.0 ............................0 ............................02.7 Totals................................................................................................. ............................0 ............................0 ............................0 ............................0 ............................0 ..............................0 .........................0.0 ............................0 .........................0.0 ............................0 ............................0
3. States, Territories and Possessions, etc., Guaranteed,Schedules D & DA (Group 3)
3.1 Class 1.............................................................................................. ............................0 ..............9,610,555 ............13,203,203 ............54,892,047 ..............3,004,347 ...............80,710,152 .......................22.2 ............55,265,697 .......................17.0 ............80,710,152 ............................03.2 Class 2.............................................................................................. ............................0 ............................0 ............................0 ............................0 ............................0 ..............................0 .........................0.0 ............................0 .........................0.0 ............................0 ............................03.3 Class 3.............................................................................................. ............................0 ............................0 ............................0 ............................0 ............................0 ..............................0 .........................0.0 ............................0 .........................0.0 ............................0 ............................03.4 Class 4.............................................................................................. ............................0 ............................0 ............................0 ............................0 ............................0 ..............................0 .........................0.0 ............................0 .........................0.0 ............................0 ............................03.5 Class 5.............................................................................................. ............................0 ............................0 ............................0 ............................0 ............................0 ..............................0 .........................0.0 ............................0 .........................0.0 ............................0 ............................03.6 Class 6.............................................................................................. ............................0 ............................0 ............................0 ............................0 ............................0 ..............................0 .........................0.0 ............................0 .........................0.0 ............................0 ............................03.7 Totals................................................................................................. ............................0 ..............9,610,555 ............13,203,203 ............54,892,047 ..............3,004,347 ...............80,710,152 .......................22.2 ............55,265,697 .......................17.0 ............80,710,152 ............................0
4. Political Subdivisions of States, Territories and Possessions,Guaranteed, Schedules D & DA (Group 4)
4.1 Class 1.............................................................................................. ............................0 ..............2,084,554 ............63,687,527 ............61,381,082 ..............1,998,002 .............129,151,165 .......................35.5 ...........105,662,473 .......................32.4 ...........129,151,165 ............................04.2 Class 2.............................................................................................. ............................0 ............................0 ............................0 ............................0 ............................0 ..............................0 .........................0.0 ............................0 .........................0.0 ............................0 ............................04.3 Class 3.............................................................................................. ............................0 ............................0 ............................0 ............................0 ............................0 ..............................0 .........................0.0 ............................0 .........................0.0 ............................0 ............................04.4 Class 4.............................................................................................. ............................0 ............................0 ............................0 ............................0 ............................0 ..............................0 .........................0.0 ............................0 .........................0.0 ............................0 ............................04.5 Class 5.............................................................................................. ............................0 ............................0 ............................0 ............................0 ............................0 ..............................0 .........................0.0 ............................0 .........................0.0 ............................0 ............................04.6 Class 6.............................................................................................. ............................0 ............................0 ............................0 ............................0 ............................0 ..............................0 .........................0.0 ............................0 .........................0.0 ............................0 ............................04.7 Totals................................................................................................. ............................0 ..............2,084,554 ............63,687,527 ............61,381,082 ..............1,998,002 .............129,151,165 .......................35.5 ...........105,662,473 .......................32.4 ...........129,151,165 ............................0
5. Special Revenue & Special Assessment Obligations,etc., Non-Guaranteed, Schedules D & DA (Group 5)
5.1 Class 1.............................................................................................. .................650,641 ............18,664,633 ............30,848,409 ............59,365,120 ..............3,683,167 .............113,211,970 .......................31.1 ...........129,745,880 .......................39.8 ...........113,211,970 ............................05.2 Class 2.............................................................................................. ............................0 ............................0 ............................0 .................750,000 ............................0 ....................750,000 .........................0.2 ............10,972,930 .........................3.4 .................750,000 ............................05.3 Class 3.............................................................................................. ............................0 ............................0 ............................0 ............................0 ............................0 ..............................0 .........................0.0 ............................0 .........................0.0 ............................0 ............................05.4 Class 4.............................................................................................. ............................0 ............................0 ............................0 ............................0 ............................0 ..............................0 .........................0.0 ............................0 .........................0.0 ............................0 ............................05.5 Class 5.............................................................................................. ............................0 ............................0 ............................0 ............................0 ............................0 ..............................0 .........................0.0 ............................0 .........................0.0 ............................0 ............................05.6 Class 6.............................................................................................. ............................0 ............................0 ............................0 ............................0 ............................0 ..............................0 .........................0.0 ............................0 .........................0.0 ............................0 ............................05.7 Totals................................................................................................. .................650,641 ............18,664,633 ............30,848,409 ............60,115,120 ..............3,683,167 .............113,961,970 .......................31.3 ...........140,718,810 .......................43.2 ...........113,961,970 ............................0

Annual Statement for the year 2002 of the TWIN CITY FIRE INSURANCE COMPANY
28
SCHEDULE D - PART 1A - SECTION 1 (continued)Quality and Maturity Distribution of All Bonds Owned December 31, At Book/Adjusting Carrying Values By Major Types of Issues and NAIC Designations
1 2 3 4 5 6 7 8 9 10 11Quality Rating per the 1 Year Over 1 Year Over 5 Years Over 10 Years Over 20 Total Column 6 as a Total from Column % from Col. 7 Total Total
NAIC Designation or Less Through 5 Years Through 10 Years Through 20 Years Years Current Year % of Line 10.7 6 Prior Year Prior Year Publicly Traded Privately Placed (a)6. Public Utilities (Unaffiliated), Schedules D & DA (Group 6)
6.1 Class 1.............................................................................................. ............................0 ............................0 ............................0 ............................0 ............................0 ..............................0 .........................0.0 ............................0 .........................0.0 ............................0 ............................06.2 Class 2.............................................................................................. ............................0 ............................0 ............................0 ............................0 ............................0 ..............................0 .........................0.0 ..............4,985,068 .........................1.5 ............................0 ............................06.3 Class 3.............................................................................................. ............................0 ............................0 ..............4,205,500 ............................0 ............................0 .................4,205,500 .........................1.2 ............................0 .........................0.0 ..............4,205,500 ............................06.4 Class 4.............................................................................................. ............................0 ............................0 ............................0 ............................0 ............................0 ..............................0 .........................0.0 ............................0 .........................0.0 ............................0 ............................06.5 Class 5.............................................................................................. ............................0 ............................0 ............................0 ............................0 ............................0 ..............................0 .........................0.0 ............................0 .........................0.0 ............................0 ............................06.6 Class 6.............................................................................................. ............................0 ............................0 ............................0 ............................0 ............................0 ..............................0 .........................0.0 ............................0 .........................0.0 ............................0 ............................06.7 Totals................................................................................................. ............................0 ............................0 ..............4,205,500 ............................0 ............................0 .................4,205,500 .........................1.2 ..............4,985,068 .........................1.5 ..............4,205,500 ............................0
7. Industrial & Miscellaneous (Unaffiliated),Schedules D & DA (Group 7)
7.1 Class 1.............................................................................................. .................256,587 ..............2,531,239 ..............8,932,876 .................201,030 ..............3,239,111 ...............15,160,843 .........................4.2 ..............6,975,900 .........................2.1 ............15,160,843 ............................07.2 Class 2.............................................................................................. ............................0 .................998,637 ..............1,895,627 ..............3,745,575 ..............3,664,771 ...............10,304,610 .........................2.8 ............10,144,965 .........................3.1 ..............9,805,434 .................499,1767.3 Class 3.............................................................................................. ............................0 ............................0 ...................97,797 ............................0 ............................0 ......................97,797 .........................0.0 ..............1,990,419 .........................0.6 ...................97,797 ............................07.4 Class 4.............................................................................................. ............................0 ............................0 ............................0 ............................0 ............................0 ..............................0 .........................0.0 ............................0 .........................0.0 ............................0 ............................07.5 Class 5.............................................................................................. ............................0 ............................0 ............................0 ............................0 ............................0 ..............................0 .........................0.0 ............................0 .........................0.0 ............................0 ............................07.6 Class 6.............................................................................................. ............................0 ............................0 ............................0 ............................0 ............................0 ..............................0 .........................0.0 ............................0 .........................0.0 ............................0 ............................07.7 Totals................................................................................................. .................256,587 ..............3,529,876 ............10,926,301 ..............3,946,605 ..............6,903,882 ...............25,563,250 .........................7.0 ............19,111,284 .........................5.9 ............25,064,074 .................499,176
8. Credit Tenant Loans, Schedules D & DA (Group 8)8.1 Class 1.............................................................................................. ............................0 ............................0 ............................0 ............................0 ............................0 ..............................0 .........................0.0 ............................0 .........................0.0 ............................0 ............................08.2 Class 2.............................................................................................. ............................0 ............................0 ............................0 ............................0 ............................0 ..............................0 .........................0.0 ............................0 .........................0.0 ............................0 ............................08.3 Class 3.............................................................................................. ............................0 ............................0 ............................0 ............................0 ............................0 ..............................0 .........................0.0 ............................0 .........................0.0 ............................0 ............................08.4 Class 4.............................................................................................. ............................0 ............................0 ............................0 ............................0 ............................0 ..............................0 .........................0.0 ............................0 .........................0.0 ............................0 ............................08.5 Class 5.............................................................................................. ............................0 ............................0 ............................0 ............................0 ............................0 ..............................0 .........................0.0 ............................0 .........................0.0 ............................0 ............................08.6 Class 6.............................................................................................. ............................0 ............................0 ............................0 ............................0 ............................0 ..............................0 .........................0.0 ............................0 .........................0.0 ............................0 ............................08.7 Totals................................................................................................. ............................0 ............................0 ............................0 ............................0 ............................0 ..............................0 .........................0.0 ............................0 .........................0.0 ............................0 ............................0
9. Parent, Subsidiaries and Affiliates, Schedules D & DA (Group 9)9.1 Class 1.............................................................................................. ............................0 ............................0 ............................0 ............................0 ............................0 ..............................0 .........................0.0 ............................0 .........................0.0 ............................0 ............................09.2 Class 2.............................................................................................. ............................0 ............................0 ............................0 ............................0 ............................0 ..............................0 .........................0.0 ............................0 .........................0.0 ............................0 ............................09.3 Class 3.............................................................................................. ............................0 ............................0 ............................0 ............................0 ............................0 ..............................0 .........................0.0 ............................0 .........................0.0 ............................0 ............................09.4 Class 4.............................................................................................. ............................0 ............................0 ............................0 ............................0 ............................0 ..............................0 .........................0.0 ............................0 .........................0.0 ............................0 ............................09.5 Class 5.............................................................................................. ............................0 ............................0 ............................0 ............................0 ............................0 ..............................0 .........................0.0 ............................0 .........................0.0 ............................0 ............................09.6 Class 6.............................................................................................. ............................0 ............................0 ............................0 ............................0 ............................0 ..............................0 .........................0.0 ............................0 .........................0.0 ............................0 ............................09.7 Totals................................................................................................. ............................0 ............................0 ............................0 ............................0 ............................0 ..............................0 .........................0.0 ............................0 .........................0.0 ............................0 ............................0

Annual Statement for the year 2002 of the TWIN CITY FIRE INSURANCE COMPANY
29
SCHEDULE D - PART 1A - SECTION 1 (continued)Quality and Maturity Distribution of All Bonds Owned December 31, At Book/Adjusted Carrying Values By Major Types of Issues and NAIC Designations
1 2 3 4 5 6 7 8 9 10 11Quality Rating per the 1 Year Over 1 Year Over 5 Years Over 10 Years Over 20 Total Column 6 as a Total from Column % from Col. 7 Total Total
NAIC Designation or Less Through 5 Years Through 10 Years Through 20 Years Years Current Year % of Line 10.7 6 Prior Year Prior Year Publicly Traded Privately Placed (a)10. Total Bonds Current Year
10.1 Class 1.............................................................................................. ..............2,113,528 ............40,032,949 ...........117,787,034 ...........176,301,581 ............11,995,353 .............348,230,445 .......................95.8 ..............XXX.......... ..............XXX.......... ...........348,230,445 ............................010.2 Class 2.............................................................................................. ............................0 .................998,637 ..............1,895,627 ..............4,495,575 ..............3,664,771 ...............11,054,610 .........................3.0 ..............XXX.......... ..............XXX.......... ............10,555,434 .................499,17610.3 Class 3.............................................................................................. ............................0 ............................0 ..............4,303,297 ............................0 ............................0 .................4,303,297 .........................1.2 ..............XXX.......... ..............XXX.......... ..............4,303,297 ............................010.4 Class 4.............................................................................................. ............................0 ............................0 ............................0 ............................0 ............................0 ..............................0 .........................0.0 ..............XXX.......... ..............XXX.......... ............................0 ............................010.5 Class 5.............................................................................................. ............................0 ............................0 ............................0 ............................0 ............................0 (c)..........................0 .........................0.0 ..............XXX.......... ..............XXX.......... ............................0 ............................010.6 Class 6.............................................................................................. ............................0 ............................0 ............................0 ............................0 ............................0 (c)..........................0 .........................0.0 ..............XXX.......... ..............XXX.......... ............................0 ............................010.7 Totals................................................................................................. ..............2,113,528 ............41,031,586 ...........123,985,958 ...........180,797,156 ............15,660,124 (b).........363,588,352 .....................100.0 ..............XXX.......... ..............XXX.......... ...........363,089,176 .................499,17610.8 Line 10.7 as a % of Col. 6................................................................... .........................0.6 .......................11.3 .......................34.1 .......................49.7 .........................4.3 ........................100.0 ..............XXX.......... ..............XXX.......... ..............XXX.......... .......................99.9 .........................0.1
11. Total Bonds Prior Year11.1 Class 1.............................................................................................. ..............8,239,198 ............22,536,114 ...........116,512,714 ...........150,649,975 ............................0 ..............XXX............ ..............XXX.......... ...........297,938,002 .......................91.4 ...........297,938,002 ............................011.2 Class 2.............................................................................................. .................465,437 ..............1,471,646 ............18,905,800 ..............1,603,582 ..............3,656,499 ..............XXX............ ..............XXX.......... ............26,102,963 .........................8.0 ............24,665,069 ..............1,437,89411.3 Class 3.............................................................................................. ..............1,990,419 ............................0 ............................0 ............................0 ............................0 ..............XXX............ ..............XXX.......... ..............1,990,419 .........................0.6 ..............1,990,419 ............................011.4 Class 4.............................................................................................. ............................0 ............................0 ............................0 ............................0 ............................0 ..............XXX............ ..............XXX.......... ............................0 .........................0.0 ............................0 ............................011.5 Class 5.............................................................................................. ............................0 ............................0 ............................0 ............................0 ............................0 ..............XXX............ ..............XXX.......... (c)........................0 .........................0.0 ............................0 ............................011.6 Class 6.............................................................................................. ............................0 ............................0 ............................0 ............................0 ............................0 ..............XXX............ ..............XXX.......... (c)........................0 .........................0.0 ............................0 ............................011.7 Totals................................................................................................. ............10,695,054 ............24,007,760 ...........135,418,515 ...........152,253,558 ..............3,656,499 ..............XXX............ ..............XXX.......... (b)......326,031,384 .....................100.0 ...........324,593,490 ..............1,437,89411.8 Line 11.7 as a % of Col. 8................................................................... .........................3.3 .........................7.4 .......................41.5 .......................46.7 .........................1.1 ..............XXX............ ..............XXX.......... .....................100.0 ..............XXX.......... .......................99.6 .........................0.4
12. Total Publicly Traded Bonds12.1 Class 1.............................................................................................. ..............2,113,528 ............40,032,949 ...........117,787,034 ...........176,301,581 ............11,995,353 .............348,230,445 .......................95.8 ...........297,938,002 .......................91.4 ...........348,230,445 ..............XXX..........12.2 Class 2.............................................................................................. ............................0 .................998,637 ..............1,396,451 ..............4,495,575 ..............3,664,771 ...............10,555,434 .........................2.9 ............24,665,069 .........................7.6 ............10,555,434 ..............XXX..........12.3 Class 3.............................................................................................. ............................0 ............................0 ..............4,303,297 ............................0 ............................0 .................4,303,297 .........................1.2 ..............1,990,419 .........................0.6 ..............4,303,297 ..............XXX..........12.4 Class 4.............................................................................................. ............................0 ............................0 ............................0 ............................0 ............................0 ..............................0 .........................0.0 ............................0 .........................0.0 ............................0 ..............XXX..........12.5 Class 5.............................................................................................. ............................0 ............................0 ............................0 ............................0 ............................0 ..............................0 .........................0.0 ............................0 .........................0.0 ............................0 ..............XXX..........12.6 Class 6.............................................................................................. ............................0 ............................0 ............................0 ............................0 ............................0 ..............................0 .........................0.0 ............................0 .........................0.0 ............................0 ..............XXX..........12.7 Totals................................................................................................. ..............2,113,528 ............41,031,586 ...........123,486,782 ...........180,797,156 ............15,660,124 .............363,089,176 .......................99.9 ...........324,593,490 .......................99.6 ...........363,089,176 ..............XXX..........12.8 Line 12.7 as a % of Col. 6................................................................... .........................0.6 .......................11.3 .......................34.0 .......................49.8 .........................4.3 ........................100.0 ..............XXX.......... ..............XXX.......... ..............XXX.......... .....................100.0 ..............XXX..........12.9 Line 12.7 as a % of Line 10.7, Col. 6, Section 10................................. .........................0.6 .......................11.3 .......................34.0 .......................49.7 .........................4.3 .........................99.9 ..............XXX.......... ..............XXX.......... ..............XXX.......... .......................99.9 ..............XXX..........
13. Total Privately Placed Bonds13.1 Class 1.............................................................................................. ............................0 ............................0 ............................0 ............................0 ............................0 ..............................0 .........................0.0 ............................0 .........................0.0 ..............XXX.......... ............................013.2 Class 2.............................................................................................. ............................0 ............................0 .................499,176 ............................0 ............................0 ....................499,176 .........................0.1 ..............1,437,894 .........................0.4 ..............XXX.......... .................499,17613.3 Class 3.............................................................................................. ............................0 ............................0 ............................0 ............................0 ............................0 ..............................0 .........................0.0 ............................0 .........................0.0 ..............XXX.......... ............................013.4 Class 4.............................................................................................. ............................0 ............................0 ............................0 ............................0 ............................0 ..............................0 .........................0.0 ............................0 .........................0.0 ..............XXX.......... ............................013.5 Class 5.............................................................................................. ............................0 ............................0 ............................0 ............................0 ............................0 ..............................0 .........................0.0 ............................0 .........................0.0 ..............XXX.......... ............................013.6 Class 6.............................................................................................. ............................0 ............................0 ............................0 ............................0 ............................0 ..............................0 .........................0.0 ............................0 .........................0.0 ..............XXX.......... ............................013.7 Totals................................................................................................. ............................0 ............................0 .................499,176 ............................0 ............................0 ....................499,176 .........................0.1 ..............1,437,894 .........................0.4 ..............XXX.......... .................499,17613.8 Line 13.7 as a % of Col. 6................................................................... .........................0.0 .........................0.0 .....................100.0 .........................0.0 .........................0.0 ........................100.0 ..............XXX.......... ..............XXX.......... ..............XXX.......... ..............XXX.......... .....................100.013.9 Line 13.7 as a % of Line 10.7, Col. 6, Section 10................................. .........................0.0 .........................0.0 .........................0.1 .........................0.0 .........................0.0 ...........................0.1 ..............XXX.......... ..............XXX.......... ..............XXX.......... ..............XXX.......... .........................0.1
(a) Includes $.....499,176 freely tradable under SEC Rule 144 or qualified for resale under SEC Rule 144A. (b) Includes $.....5,179,929 current year, $..........0 prior year of bonds with Z designations and $..........0 current year, $..........0 prior year of bonds with Z* designation. The letter "Z" means the NAIC designation was not assigned by the
Securities Valuation Office (SVO) at the date of the statement. "Z*" means the SVO could not evaluate the obligation because valuation procedures for the security class are under regulatory review. (c) Includes $..........0 current year, $..........0 prior year of bonds with 5* designations and $..........0 current year, $..........0 prior year of bonds with 6* designation. "5*" means the NAIC designation was assigned by the SVO in reliance on
the insurer's certification that the issuer is current in all principal and interest payments. "6*" means the NAIC designation was assigned by the SVO due to inadequate certification of principal and interest payments.

Annual Statement for the year 2002 of the TWIN CITY FIRE INSURANCE COMPANY
30
SCHEDULE D - PART 1A - SECTION 2Maturity Distribution of All Bonds Owned December 31, At Book/Adjusting Carrying Values By Major Type and Subtype of Issues
1 2 3 4 5 6 7 8 9 10 111 Year Over 1 Year Over 5 Years Over 10 Years Over 20 Total Column 6 as a Total from Column % from Col. 7 Total Total
Distribution by Type or Less Through 5 Years Through 10 Years Through 20 Years Years Current Year % of Line 10.7 6 Prior Year Prior Year Publicly Traded Privately Placed1. U.S. Governments, Schedules D & DA (Group 1)
1.1 Issuer Obligations............................................................................... .................185,196 ..............3,289,983 ............................0 ............................0 ............................0 .................3,475,180 .........................1.0 .................288,052 .........................0.1 ..............3,475,180 ............................01.2 Single Class Mortgage-Backed/Asset-Backed Securities..................... ..............1,021,104 ..............3,851,985 ..............1,115,019 .................462,303 ...................70,726 .................6,521,136 .........................1.8 ............................0 .........................0.0 ..............6,521,136 ............................01.7 Totals................................................................................................. ..............1,206,300 ..............7,141,968 ..............1,115,019 .................462,303 ...................70,726 .................9,996,315 .........................2.7 .................288,052 .........................0.0 ..............9,996,315 ............................0
2. All Other Governments, Schedules D & DA (Group 2)2.1 Issuer Obligations............................................................................... ............................0 ............................0 ............................0 ............................0 ............................0 ..............................0 .........................0.0 ............................0 .........................0.0 ............................0 ............................02.2 Single Class Mortgage-Backed/Asset-Backed Securities..................... ............................0 ............................0 ............................0 ............................0 ............................0 ..............................0 .........................0.0 ............................0 .........................0.0 ............................0 ............................0
MULTI-CLASS RESIDENTIAL MORTGAGE-BACKED SECURITIES:2.3 Defined.............................................................................................. ............................0 ............................0 ............................0 ............................0 ............................0 ..............................0 .........................0.0 ............................0 .........................0.0 ............................0 ............................02.4 Other................................................................................................. ............................0 ............................0 ............................0 ............................0 ............................0 ..............................0 .........................0.0 ............................0 .........................0.0 ............................0 ............................0
MULTI-CLASS COMMERCIAL MORTGAGE-BACKED/ASSET-BACKED SECURITIES:
2.5 Defined.............................................................................................. ............................0 ............................0 ............................0 ............................0 ............................0 ..............................0 .........................0.0 ............................0 .........................0.0 ............................0 ............................02.6 Other................................................................................................. ............................0 ............................0 ............................0 ............................0 ............................0 ..............................0 .........................0.0 ............................0 .........................0.0 ............................0 ............................02.7 Totals................................................................................................. ............................0 ............................0 ............................0 ............................0 ............................0 ..............................0 .........................0.0 ............................0 .........................0.0 ............................0 ............................0
3. States, Territories and Possessions, Guaranteed,Schedules D & DA (Group 3)
3.1 Issuer Obligations............................................................................... ............................0 ..............9,610,555 ............13,203,203 ............54,892,047 ..............3,004,347 ...............80,710,152 .......................22.2 ............55,265,697 .......................17.0 ............80,710,152 ............................03.2 Single Class Mortgage-Backed/Asset-Backed Securities..................... ............................0 ............................0 ............................0 ............................0 ............................0 ..............................0 .........................0.0 ............................0 .........................0.0 ............................0 ............................0
MULTI-CLASS RESIDENTIAL MORTGAGE-BACKED SECURITIES:3.3 Defined.............................................................................................. ............................0 ............................0 ............................0 ............................0 ............................0 ..............................0 .........................0.0 ............................0 .........................0.0 ............................0 ............................03.4 Other................................................................................................. ............................0 ............................0 ............................0 ............................0 ............................0 ..............................0 .........................0.0 ............................0 .........................0.0 ............................0 ............................0
MULTI-CLASS COMMERCIAL MORTGAGE-BACKED/ASSET-BACKED SECURITIES:
3.5 Defined.............................................................................................. ............................0 ............................0 ............................0 ............................0 ............................0 ..............................0 .........................0.0 ............................0 .........................0.0 ............................0 ............................03.6 Other................................................................................................. ............................0 ............................0 ............................0 ............................0 ............................0 ..............................0 .........................0.0 ............................0 .........................0.0 ............................0 ............................03.7 Totals................................................................................................. ............................0 ..............9,610,555 ............13,203,203 ............54,892,047 ..............3,004,347 ...............80,710,152 .......................22.2 ............55,265,697 .......................17.0 ............80,710,152 ............................0
4. Political Subdivisions of States, Territories and Possessions,Guaranteed, Schedules D & DA (Group 4)
4.1 Issuer Obligations............................................................................... ............................0 ..............2,084,554 ............63,687,527 ............61,381,082 ..............1,998,002 .............129,151,165 .......................35.5 ...........105,662,473 .......................32.4 ...........129,151,165 ............................04.2 Single Class Mortgage-Backed/Asset-Backed Securities..................... ............................0 ............................0 ............................0 ............................0 ............................0 ..............................0 .........................0.0 ............................0 .........................0.0 ............................0 ............................0
MULTI-CLASS RESIDENTIAL MORTGAGE-BACKED SECURITIES:4.3 Defined.............................................................................................. ............................0 ............................0 ............................0 ............................0 ............................0 ..............................0 .........................0.0 ............................0 .........................0.0 ............................0 ............................04.4 Other................................................................................................. ............................0 ............................0 ............................0 ............................0 ............................0 ..............................0 .........................0.0 ............................0 .........................0.0 ............................0 ............................0
MULTI-CLASS COMMERCIAL MORTGAGE-BACKED/ASSET-BACKED SECURITIES:
4.5 Defined.............................................................................................. ............................0 ............................0 ............................0 ............................0 ............................0 ..............................0 .........................0.0 ............................0 .........................0.0 ............................0 ............................04.6 Other................................................................................................. ............................0 ............................0 ............................0 ............................0 ............................0 ..............................0 .........................0.0 ............................0 .........................0.0 ............................0 ............................04.7 Totals................................................................................................. ............................0 ..............2,084,554 ............63,687,527 ............61,381,082 ..............1,998,002 .............129,151,165 .......................35.5 ...........105,662,473 .......................32.4 ...........129,151,165 ............................0
5. Special Revenue & Special Assessment Obligations, etc.,Non-Guaranteed, Schedules D & DA (Group 5)
5.1 Issuer Obligations............................................................................... ............................0 ............16,256,798 ............29,839,578 ............59,730,095 ..............3,647,006 .............109,473,478 .......................30.1 ...........135,232,945 .......................41.5 ...........109,473,478 ............................05.2 Single Class Mortgage-Backed/Asset-Backed Securities..................... .................650,641 ..............2,407,835 ..............1,008,830 .................385,024 ...................36,162 .................4,488,493 .........................1.2 ..............5,485,866 .........................1.7 ..............4,488,493 ............................0
MULTI-CLASS RESIDENTIAL MORTGAGE-BACKED SECURITIES:5.3 Defined.............................................................................................. ............................0 ............................0 ............................0 ............................0 ............................0 ..............................0 .........................0.0 ............................0 .........................0.0 ............................0 ............................05.4 Other................................................................................................. ............................0 ............................0 ............................0 ............................0 ............................0 ..............................0 .........................0.0 ............................0 .........................0.0 ............................0 ............................0
MULTI-CLASS COMMERCIAL MORTGAGE-BACKED/ASSET-BACKED SECURITIES:
5.5 Defined.............................................................................................. ............................0 ............................0 ............................0 ............................0 ............................0 ..............................0 .........................0.0 ............................0 .........................0.0 ............................0 ............................05.6 Other................................................................................................. ............................0 ............................0 ............................0 ............................0 ............................0 ..............................0 .........................0.0 ............................0 .........................0.0 ............................0 ............................05.7 Totals................................................................................................. .................650,641 ............18,664,633 ............30,848,409 ............60,115,120 ..............3,683,167 .............113,961,970 .......................31.3 ...........140,718,810 .......................43.2 ...........113,961,970 ............................0

Annual Statement for the year 2002 of the TWIN CITY FIRE INSURANCE COMPANY
31
SCHEDULE D - PART 1A - SECTION 2 (continued)Maturity Distribution of All Bonds Owned December 31, At Book/Adjusted Carrying Values By Major Type and Subtype of Issues
1 2 3 4 5 6 7 8 9 10 111 Year Over 1 Year Over 5 Years Over 10 Years Over 20 Total Column 6 as a Total from Column % from Col. 7 Total Total
Distribution by Type or Less Through 5 Years Through 10 Years Through 20 Years Years Current Year % of Line 10.7 6 Prior Year Prior Year Publicly Traded Privately Placed6. Public Utilities (Unaffiliated), Schedules D & DA (Group 6)
6.1 Issuer Obligations............................................................................... ............................0 ............................0 ..............4,205,500 ............................0 ............................0 .................4,205,500 .........................1.2 ..............4,985,068 .........................1.5 ..............4,205,500 ............................06.2 Single Class Mortgage-Backed/Asset-Backed Bonds.......................... ............................0 ............................0 ............................0 ............................0 ............................0 ..............................0 .........................0.0 ............................0 .........................0.0 ............................0 ............................0
MULTI-CLASS RESIDENTIAL MORTGAGE-BACKED SECURITIES:6.3 Defined.............................................................................................. ............................0 ............................0 ............................0 ............................0 ............................0 ..............................0 .........................0.0 ............................0 .........................0.0 ............................0 ............................06.4 Other................................................................................................. ............................0 ............................0 ............................0 ............................0 ............................0 ..............................0 .........................0.0 ............................0 .........................0.0 ............................0 ............................0
MULTI-CLASS COMMERCIAL MORTGAGE-BACKED/ASSET-BACKED SECURITIES:
6.5 Defined.............................................................................................. ............................0 ............................0 ............................0 ............................0 ............................0 ..............................0 .........................0.0 ............................0 .........................0.0 ............................0 ............................06.6 Other................................................................................................. ............................0 ............................0 ............................0 ............................0 ............................0 ..............................0 .........................0.0 ............................0 .........................0.0 ............................0 ............................06.7 Totals................................................................................................. ............................0 ............................0 ..............4,205,500 ............................0 ............................0 .................4,205,500 .........................1.2 ..............4,985,068 .........................1.5 ..............4,205,500 ............................0
7. Industrial & Miscellaneous (Unaffiliated),Schedules D & DA (Group 7)
7.1 Issuer Obligations............................................................................... ............................0 .................998,637 ............10,926,301 ..............3,946,605 ..............6,903,882 ...............22,775,424 .........................6.3 ............15,369,447 .........................4.7 ............22,276,248 .................499,1767.2 Single Class Mortgage-Backed/Asset-Backed Bonds.......................... ............................0 ............................0 ............................0 ............................0 ............................0 ..............................0 .........................0.0 ............................0 .........................0.0 ............................0 ............................0
MULTI-CLASS RESIDENTIAL MORTGAGE-BACKED SECURITIES:7.3 Defined.............................................................................................. ............................0 ............................0 ............................0 ............................0 ............................0 ..............................0 .........................0.0 ............................0 .........................0.0 ............................0 ............................07.4 Other................................................................................................. ............................0 ............................0 ............................0 ............................0 ............................0 ..............................0 .........................0.0 ............................0 .........................0.0 ............................0 ............................0
MULTI-CLASS COMMERCIAL MORTGAGE-BACKED/ASSET-BACKED SECURITIES:
7.5 Defined.............................................................................................. ............................0 ............................0 ............................0 ............................0 ............................0 ..............................0 .........................0.0 ............................0 .........................0.0 ............................0 ............................07.6 Other................................................................................................. .................256,587 ..............2,531,239 ............................0 ............................0 ............................0 .................2,787,826 .........................0.8 ..............3,741,837 .........................1.2 ..............2,787,826 ............................07.7 Totals................................................................................................. .................256,587 ..............3,529,876 ............10,926,301 ..............3,946,605 ..............6,903,882 ...............25,563,250 .........................7.0 ............19,111,284 .........................5.9 ............25,064,074 .................499,176
8. Credit Tenant Loans, Schedules D & DA (Group 8)8.1 Issuer Obligations............................................................................... ............................0 ............................0 ............................0 ............................0 ............................0 ..............................0 .........................0.0 ............................0 .........................0.0 ............................0 ............................08.7 Totals................................................................................................. ............................0 ............................0 ............................0 ............................0 ............................0 ..............................0 .........................0.0 ............................0 .........................0.0 ............................0 ............................0
9. Parent, Subsidiaries and Affiliates, Schedules D & DA (Group 9)9.1 Issuer Obligations............................................................................... ............................0 ............................0 ............................0 ............................0 ............................0 ..............................0 .........................0.0 ............................0 .........................0.0 ............................0 ............................09.2 Single Class Mortgage-Backed/Asset-Backed Bonds.......................... ............................0 ............................0 ............................0 ............................0 ............................0 ..............................0 .........................0.0 ............................0 .........................0.0 ............................0 ............................0
MULTI-CLASS RESIDENTIAL MORTGAGE-BACKED SECURITIES:9.3 Defined.............................................................................................. ............................0 ............................0 ............................0 ............................0 ............................0 ..............................0 .........................0.0 ............................0 .........................0.0 ............................0 ............................09.4 Other................................................................................................. ............................0 ............................0 ............................0 ............................0 ............................0 ..............................0 .........................0.0 ............................0 .........................0.0 ............................0 ............................0
MULTI-CLASS COMMERCIAL MORTGAGE-BACKED/ASSET-BACKED SECURITIES:
9.5 Defined.............................................................................................. ............................0 ............................0 ............................0 ............................0 ............................0 ..............................0 .........................0.0 ............................0 .........................0.0 ............................0 ............................09.6 Other................................................................................................. ............................0 ............................0 ............................0 ............................0 ............................0 ..............................0 .........................0.0 ............................0 .........................0.0 ............................0 ............................09.7 Totals................................................................................................. ............................0 ............................0 ............................0 ............................0 ............................0 ..............................0 .........................0.0 ............................0 .........................0.0 ............................0 ............................0

Annual Statement for the year 2002 of the TWIN CITY FIRE INSURANCE COMPANY
32
SCHEDULE D - PART 1A - SECTION 2 (continued)Maturity Distribution of All Bonds Owned December 31, At Book/Adjusted Carrying Values By Major Type and Subtype of Issues
1 2 3 4 5 6 7 8 9 10 111 Year Over 1 Year Over 5 Years Over 10 Years Over 20 Total Column 6 as a Total from Column % from Col. 7 Total Total
Distribution by Type or Less Through 5 Years Through 10 Years Through 20 Years Years Current Year % of Line 10.7 6 Prior Year Prior Year Publicly Traded Privately Placed10. Total Bonds Current Year
10.1 Issuer Obligations............................................................................... .................185,196 ............32,240,527 ...........121,862,109 ...........179,949,829 ............15,553,236 .............349,790,898 .......................96.2 ..............XXX.......... ..............XXX.......... ...........349,291,722 .................499,17610.2 Single Class Mortgage-Backed/Asset-Backed Bonds.......................... ..............1,671,745 ..............6,259,820 ..............2,123,849 .................847,327 .................106,888 ...............11,009,629 .........................3.0 ..............XXX.......... ..............XXX.......... ............11,009,629 ............................0
MULTI-CLASS RESIDENTIAL MORTGAGE-BACKED SECURITIES:10.3 Defined.............................................................................................. ............................0 ............................0 ............................0 ............................0 ............................0 ..............................0 .........................0.0 ..............XXX.......... ..............XXX.......... ............................0 ............................010.4 Other................................................................................................. ............................0 ............................0 ............................0 ............................0 ............................0 ..............................0 .........................0.0 ..............XXX.......... ..............XXX.......... ............................0 ............................0
MULTI-CLASS COMMERCIAL MORTGAGE-BACKED/ASSET-BACKED SECURITIES:
10.5 Defined.............................................................................................. ............................0 ............................0 ............................0 ............................0 ............................0 ..............................0 .........................0.0 ..............XXX.......... ..............XXX.......... ............................0 ............................010.6 Other................................................................................................. .................256,587 ..............2,531,239 ............................0 ............................0 ............................0 .................2,787,826 .........................0.8 ..............XXX.......... ..............XXX.......... ..............2,787,826 ............................010.7 Totals................................................................................................. ..............2,113,528 ............41,031,586 ...........123,985,958 ...........180,797,156 ............15,660,124 .............363,588,352 .....................100.0 ..............XXX.......... ..............XXX.......... ...........363,089,176 .................499,17610.8 Line 10.7 as a % of Col. 6................................................................... .........................0.6 .......................11.3 .......................34.1 .......................49.7 .........................4.3 ........................100.0 ..............XXX.......... ..............XXX.......... ..............XXX.......... .......................99.9 .........................0.1
11. Total Bonds Prior Year11.1 Issuer Obligations............................................................................... ..............9,266,197 ............17,627,066 ...........134,220,774 ...........152,033,145 ..............3,656,499 ..............XXX............ ..............XXX.......... ...........316,803,682 .......................97.2 ...........316,304,563 .................499,11911.2 Single Class Mortgage-Backed/Asset-Backed Bonds.......................... .................963,420 ..............3,104,293 ..............1,197,741 .................220,412 ............................0 ..............XXX............ ..............XXX.......... ..............5,485,866 .........................1.7 ..............5,485,866 ............................0
MULTI-CLASS RESIDENTIAL MORTGAGE-BACKED SECURITIES:11.3 Defined.............................................................................................. ............................0 ............................0 ............................0 ............................0 ............................0 ..............XXX............ ..............XXX.......... ............................0 .........................0.0 ............................0 ............................011.4 Other................................................................................................. ............................0 ............................0 ............................0 ............................0 ............................0 ..............XXX............ ..............XXX.......... ............................0 .........................0.0 ............................0 ............................0
MULTI-CLASS COMMERCIAL MORTGAGE-BACKED/ASSET-BACKED SECURITIES:
11.5 Defined.............................................................................................. ............................0 ............................0 ............................0 ............................0 ............................0 ..............XXX............ ..............XXX.......... ............................0 .........................0.0 ............................0 ............................011.6 Other................................................................................................. .................465,437 ..............3,276,400 ............................0 ............................0 ............................0 ..............XXX............ ..............XXX.......... ..............3,741,837 .........................1.1 ..............2,803,061 .................938,77611.7 Totals................................................................................................. ............10,695,054 ............24,007,760 ...........135,418,515 ...........152,253,558 ..............3,656,499 ..............XXX............ ..............XXX.......... ...........326,031,384 .....................100.0 ...........324,593,490 ..............1,437,89411.8 Line 11.7 as a % of Col. 8................................................................... .........................3.3 .........................7.4 .......................41.5 .......................46.7 .........................1.1 ..............XXX............ ..............XXX.......... .....................100.0 ..............XXX.......... .......................99.6 .........................0.4
12. Total Publicly Traded Bonds12.1 Issuer Obligations............................................................................... .................185,196 ............32,240,527 ...........121,362,933 ...........179,949,829 ............15,553,236 .............349,291,722 .......................96.1 ...........316,304,563 .......................97.0 ...........349,291,722 ..............XXX..........12.2 Single Class Mortgage-Backed/Asset-Backed Bonds.......................... ..............1,671,745 ..............6,259,820 ..............2,123,849 .................847,327 .................106,888 ...............11,009,629 .........................3.0 ..............5,485,866 .........................1.7 ............11,009,629 ..............XXX..........
MULTI-CLASS RESIDENTIAL MORTGAGE-BACKED SECURITIES:12.3 Defined.............................................................................................. ............................0 ............................0 ............................0 ............................0 ............................0 ..............................0 .........................0.0 ............................0 .........................0.0 ............................0 ..............XXX..........12.4 Other................................................................................................. ............................0 ............................0 ............................0 ............................0 ............................0 ..............................0 .........................0.0 ............................0 .........................0.0 ............................0 ..............XXX..........
MULTI-CLASS COMMERCIAL MORTGAGE-BACKED/ASSET-BACKED SECURITIES:
12.5 Defined.............................................................................................. ............................0 ............................0 ............................0 ............................0 ............................0 ..............................0 .........................0.0 ............................0 .........................0.0 ............................0 ..............XXX..........12.6 Other................................................................................................. .................256,587 ..............2,531,239 ............................0 ............................0 ............................0 .................2,787,826 .........................0.8 ..............2,803,061 .........................0.9 ..............2,787,826 ..............XXX..........12.7 Totals................................................................................................. ..............2,113,528 ............41,031,586 ...........123,486,782 ...........180,797,156 ............15,660,124 .............363,089,176 .......................99.9 ...........324,593,490 .......................99.6 ...........363,089,176 ..............XXX..........12.8 Line 12.7 as a % of Col. 6................................................................... .........................0.6 .......................11.3 .......................34.0 .......................49.8 .........................4.3 ........................100.0 ..............XXX.......... ..............XXX.......... ..............XXX.......... .....................100.0 ..............XXX..........12.9 Line 12.7 as a % of Line 10.7, Col. 6, Section 10................................. .........................0.6 .......................11.3 .......................34.0 .......................49.7 .........................4.3 .........................99.9 ..............XXX.......... ..............XXX.......... ..............XXX.......... .......................99.9 ..............XXX..........
13. Total Privately Placed Bonds13.1 Issuer Obligations............................................................................... ............................0 ............................0 .................499,176 ............................0 ............................0 ....................499,176 .........................0.1 .................499,119 .........................0.2 ..............XXX.......... .................499,17613.2 Single Class Mortgage-Backed/Asset-Backed Bonds.......................... ............................0 ............................0 ............................0 ............................0 ............................0 ..............................0 .........................0.0 ............................0 .........................0.0 ..............XXX.......... ............................0
MULTI-CLASS RESIDENTIAL MORTGAGE-BACKED SECURITIES:13.3 Defined.............................................................................................. ............................0 ............................0 ............................0 ............................0 ............................0 ..............................0 .........................0.0 ............................0 .........................0.0 ..............XXX.......... ............................013.4 Other................................................................................................. ............................0 ............................0 ............................0 ............................0 ............................0 ..............................0 .........................0.0 ............................0 .........................0.0 ..............XXX.......... ............................0
MULTI-CLASS COMMERCIAL MORTGAGE-BACKED/ASSET-BACKED SECURITIES:
13.5 Defined.............................................................................................. ............................0 ............................0 ............................0 ............................0 ............................0 ..............................0 .........................0.0 ............................0 .........................0.0 ..............XXX.......... ............................013.6 Other................................................................................................. ............................0 ............................0 ............................0 ............................0 ............................0 ..............................0 .........................0.0 .................938,776 .........................0.3 ..............XXX.......... ............................013.7 Totals................................................................................................. ............................0 ............................0 .................499,176 ............................0 ............................0 ....................499,176 .........................0.1 ..............1,437,894 .........................0.4 ..............XXX.......... .................499,17613.8 Line 13.7 as a % of Col. 6................................................................... .........................0.0 .........................0.0 .....................100.0 .........................0.0 .........................0.0 ........................100.0 ..............XXX.......... ..............XXX.......... ..............XXX.......... ..............XXX.......... .....................100.013.9 Line 13.7 as a % of Line 10.7, Col. 6, Section 10................................. .........................0.0 .........................0.0 .........................0.1 .........................0.0 .........................0.0 ...........................0.1 ..............XXX.......... ..............XXX.......... ..............XXX.......... ..............XXX.......... .........................0.1

Annual Statement for the year 2002 of the TWIN CITY FIRE INSURANCE COMPANY
33, 34, 35, 36, 37
Sch. DA-Pt. 2NONE
Sch. DB-Pt. A-Verification Between YearsNONE
Sch. DB-Pt. B-Verification Between YearsNONE
Sch. DB-Pt. C-Verification Between YearsNONE
Sch. DB-Pt. D-Verification Between YearsNONE
Sch. DB-Pt. E-VerificationNONE
Sch. DB-Pt. F-Sn. 1NONE
Sch. DB-Pt. F-Sn. 2NONE

Annual Statement for the year 2002 of the TWIN CITY FIRE INSURANCE COMPANY
38
SCHEDULE F-PART 1Assumed Reinsurance as of December 31, Current Year (000 Omitted)
1 2 3 4 5 Reinsurance On 8 9 10 11 12 13 146 7 Amount of Assets
Funds Held by Pledged orFederal NAIC Paid Losses and Known Case Contingent Assumed or Deposited Letters of Compensating
ID Company Domiciliary Assumed Loss Adjustment Losses Cols. Commissions Premiums Unearned With Reinsured Credit Balances to SecureNumber Code Name of Reinsured Jurisdiction Premium Expenses and LAE 6 + 7 Payable Receivable Premium Companies Posted Letters of Credit
Affiliated - U. S. Intercompany Pooling:06-0383750.... 19682........ Hartford Fire Insurance Company...................................... Connecticut.......................................................... ............122,126 ......................0 ..............79,352 ..............79,352 ......................0 ......................0 ..............50,408 ......................0 N....................... ..........................0
0199999. Affiliated - U. S. Intercompany Pooling.................................................................................................................................. ............122,126 ......................0 ..............79,352 ..............79,352 ......................0 ......................0 ..............50,408 ......................0 ......................0 ..........................00499999. Total Affiliates...................................................................................................................................................................... ............122,126 ......................0 ..............79,352 ..............79,352 ......................0 ......................0 ..............50,408 ......................0 ......................0 ..........................09999999. Totals.................................................................................................................................................................................. ............122,126 ......................0 ..............79,352 ..............79,352 ......................0 ......................0 ..............50,408 ......................0 ......................0 ..........................0

Annual Statement for the year 2002 of the TWIN CITY FIRE INSURANCE COMPANY
39
SCHEDULE F - PART 2Premium Portfolio Reinsurance Effected or (Canceled) during Current Year
1 2 3 4 5 6Federal NAIC
ID CompanyNumber Code Name of Company Date of Contract Original Premium Reinsurance Premium
NONE

Annual Statement for the year 2002 of the TWIN CITY FIRE INSURANCE COMPANY
40
SCHEDULE F - PART 3Ceded Reinsurance as of December 31, Current Year (000 Omitted)
1 2 3 4 5 6 Reinsurance Recoverable on Reinsurance Payable 18 19Reinsurance 7 8 9 10 11 12 13 14 15 16 17
Contracts Net Amount Funds HeldCeding 75% or Known Known Other Recoverable By Company
Federal NAIC More of Direct Reinsurance Case Case IBNR IBNR Cols. Ceded Amounts From UnderID Company Domiciliary Premiums Premiums Paid Paid Loss LAE Loss LAE Unearned Contingent 7 thru 14 Balances Due to Reinsurers Reinsurance
Number Code Name of Reinsurer Jurisdiction Written Ceded Losses LAE Reserves Reserves Reserves Reserves Premiums Commissions Totals Payable Reinsurers Col. 15-[16+17] TreatiesAuthorizedAffiliates-U.S. Intercompany Pooling06-0383750 19682........ Hartford Fire Insurance Company................................. Connecticut................................... ....................... ..1,443,670 .............0 .............0 .....943,872 .....119,870 ....907,588 ......70,668 ....609,763 ................0 ...2,651,760 ...............0 ...............0 .......2,651,760 .................0
0199999. Total Authorized Affiliates - U.S. Intercompany Pooling...................................................................................................... ..1,443,670 .............0 .............0 .....943,872 .....119,870 ....907,588 ......70,668 ....609,763 ................0 ...2,651,760 ...............0 ...............0 .......2,651,760 .................00499999. Total Authorized Affiliates.................................................................................................................................................. ..1,443,670 .............0 .............0 .....943,872 .....119,870 ....907,588 ......70,668 ....609,763 ................0 ...2,651,760 ...............0 ...............0 .......2,651,760 .................00999999. Total Authorized................................................................................................................................................................ ..1,443,670 .............0 .............0 .....943,872 .....119,870 ....907,588 ......70,668 ....609,763 ................0 ...2,651,760 ...............0 ...............0 .......2,651,760 .................01999999. Total Authorized and Unauthorized.................................................................................................................................... ..1,443,670 .............0 .............0 .....943,872 .....119,870 ....907,588 ......70,668 ....609,763 ................0 ...2,651,760 ...............0 ...............0 .......2,651,760 .................09999999. Totals................................................................................................................................................................................ ..1,443,670 .............0 .............0 .....943,872 .....119,870 ....907,588 ......70,668 ....609,763 ................0 ...2,651,760 ...............0 ...............0 .......2,651,760 .................0
Note: Report the five largest provisional commission rates included in the cedant's reinsurance treaties. The commission rate to be reported is by contract with ceded premium in excess of $50,000.1 2 3
Commission CededName of Company Rate Premium
(1) ...................................................................................................................................... .................0.0 ...............0(2) ...................................................................................................................................... .................0.0 ...............0(3) ...................................................................................................................................... .................0.0 ...............0(4) ...................................................................................................................................... .................0.0 ...............0(5) ...................................................................................................................................... .................0.0 ...............0

Annual Statement for the year 2002 of the TWIN CITY FIRE INSURANCE COMPANY
41, 42, 43, 44
Sch. F-Pt. 4NONE
Sch. F-Pt. 5NONE
Sch. F-Pt. 6NONE
Sch. F-Pt. 7NONE

Annual Statement for the year 2002 of the TWIN CITY FIRE INSURANCE COMPANY
45
SCHEDULE F - PART 8Restatement of Balance Sheet to Identify Net Credit for Reinsurance
1 2 3As Reported Restatement Restated
(Net of Ceded) Adjustments (Gross of Ceded)
ASSETS (Page 2, Col. 3)
1. Cash and invested assets (Line 9)....................................................................................... ..........................376,827,458 ...........................................0 ..........................376,827,458
2. Agents' balances or uncollected premiums (Line 10)............................................................ ..............................2,616,975 ...........................................0 ..............................2,616,975
3. Funds held by or deposited with reinsured companies (Line 11)............................................ ...........................................0 ...........................................0 ...........................................0
4. Reinsurance recoverable on loss and loss adjustment expense payments (Line 14).............. ...........................................0 ...........................................0 ...........................................0
5. Other assets (Lines 12 and 13 and 15 through 25)............................................................... ............................17,855,799 ...........................................0 ............................17,855,799
6. Net amount recoverable from reinsurers.............................................................................. ...........................................0 .......................2,724,403,454 .......................2,724,403,454
7. Totals (Line 28)................................................................................................................... ..........................397,300,232 .......................2,724,403,454 .......................3,121,703,686
LIABILITIES (Page 3)
8. Losses and loss adjustment expenses (Lines 1 through 3)................................................... ..........................154,759,150 .......................2,041,997,657 .......................2,196,756,807
9. Taxes, expenses, and other obligations (Lines 4 through 8).................................................. ..............................7,060,745 ............................72,643,244 ............................79,703,989
10. Unearned premiums (Line 9)................................................................................................ ............................53,315,937 ..........................609,762,553 ..........................663,078,490
11. Advance premiums (Line 10)............................................................................................... ...........................................0 ...........................................0 ...........................................0
12. Dividends declared and unpaid (Line 11.1 and 11.2)............................................................. .................................383,385 ...........................................0 .................................383,385
13. Ceded reinsurance premiums payable (net of ceded commission) (Line 12).......................... ...........................................0 ...........................................0 ...........................................0
14. Funds held by company under reinsurance treaties (Line 13)................................................ ...........................................0 ...........................................0 ...........................................0
15. Amounts withheld or retained by company for account of others (Line 14)............................ ...........................................0 ...........................................0 ...........................................0
16. Provision for reinsurance (Line 16)....................................................................................... ...........................................0 ...........................................0 ...........................................0
17. Other liabilities (Lines 15 and 17 through 23)........................................................................ ...........................................0 ...........................................0 ...........................................0
18. Total liabilities (Line 26 minus Line 25)................................................................................. ..........................215,519,217 .......................2,724,403,453 .......................2,939,922,670
19. Surplus as regards policyholders (Line 35)........................................................................... ..........................181,781,015 ......................XXX................. ..........................181,781,015
20. Totals (Line 36)................................................................................................................... ..........................397,300,232 .......................2,724,403,453 .......................3,121,703,685
NOTE: Is the restatement of this exhibit the result of grossing up balances ceded to affiliates under 100 percent reinsurance or pooling arrangements?..Yes [ X ] No [ ]
If yes, give full explanation:
The company participates in an affiliated intercompany pooling arrangement, details of which are provided in the footnotes to the financial statements.

Annual Statement for the year 2002 of the TWIN CITY FIRE INSURANCE COMPANY
46, 47, 48
Sch. H-Pt. 1NONE
Sch. H-Pt. 2NONE
Sch. H-Pt. 3NONE
Sch. H-Pt. 4NONE
Sch. H-Pt. 5NONE

Annual Statement for the year 2002 of the TWIN CITY FIRE INSURANCE COMPANY
49
SCHEDULE P - ANALYSIS OF LOSSES AND LOSS EXPENSES
SCHEDULE P - PART 1 - SUMMARY($000 Omitted)
Premiums Earned Loss and Loss Expense Payments 12Years in Which 1 2 3 Defense and Cost Adjusting and Other 10 11 Number
Premiums Loss Payments Containment Payments Payments ofWere 4 5 6 7 8 9 Salvage Total Claims
Earned and Direct Direct Direct Direct and Net Paid Reported-Losses Were and Net and and and Subrogation (Cols. 4 - 5 + Direct and
Incurred Assumed Ceded (Cols. 1 - 2) Assumed Ceded Assumed Ceded Assumed Ceded Received 6 - 7 + 8 - 9) Assumed1. Prior........ .........XXX...... .........XXX...... .........XXX...... ..........4,002 ..........2,879 ..........1,067 .............730 .............102 ................3 .............(11) ............1,558 ......XXX.......2. 1993........ .........104,235 ..........25,704 ..........78,530 ........52,431 ..........8,963 ..........4,106 .............461 ..........3,444 ..............38 ..........1,505 ..........50,520 ......XXX.......3. 1994........ ..........97,113 ..........14,638 ..........82,475 ........55,296 ..........6,466 ..........4,487 .............411 ..........3,518 ..............38 ..........1,607 ..........56,386 ......XXX.......4. 1995........ ..........95,153 ..........10,248 ..........84,905 ........52,135 ..........5,088 ..........4,258 .............266 ..........3,706 ..............54 ..........1,643 ..........54,691 ......XXX.......5. 1996........ ..........95,339 ............9,728 ..........85,611 ........54,729 ..........4,974 ..........4,373 .............224 ..........3,844 ..............83 ..........1,723 ..........57,665 ......XXX.......6. 1997........ ..........94,841 ............9,328 ..........85,514 ........50,336 ..........3,723 ..........4,534 .............237 ..........3,679 ..............82 ..........1,931 ..........54,507 ......XXX.......7. 1998........ ..........93,723 ............7,265 ..........86,458 ........54,665 ..........3,227 ..........4,328 .............170 ..........4,665 ..............63 ..........2,045 ..........60,199 ......XXX.......8. 1999........ ..........97,063 ............8,658 ..........88,405 ........57,193 ..........5,742 ..........4,301 .............299 ..........4,752 ..............60 ..........2,285 ..........60,144 ......XXX.......9. 2000........ .........108,143 ..........12,604 ..........95,539 ........53,233 ..........4,805 ..........3,607 .............338 ..........4,829 ..............43 ..........2,323 ..........56,484 ......XXX.......
10. 2001........ .........119,873 ..........26,749 ..........93,124 ........52,391 ..........8,599 ..........2,462 .............344 ..........4,568 ..............30 ..........2,175 ..........50,447 ......XXX.......11. 2002........ .........136,288 ..........21,112 .........115,176 ........29,931 ..........3,391 .............933 ..............67 ..........3,364 ................0 ..........1,224 ..........30,770 ......XXX.......12. Totals...... .........XXX...... .........XXX...... .........XXX...... ......516,345 ........57,858 ........38,455 ..........3,547 ........40,470 .............494 ........18,450 .........533,372 ......XXX.......
Adjusting and Other 23 24 25Losses Unpaid Defense and Cost Containment Unpaid Unpaid Total
Case Basis Bulk + IBNR Case Basis Bulk + IBNR 21 22 Net Number of13 14 15 16 17 18 19 20 Salvage Losses Claims
Direct Direct Direct Direct Direct and and Outstanding-and and and and and Subrogation Expenses Direct and
Assumed Ceded Assumed Ceded Assumed Ceded Assumed Ceded Assumed Ceded Anticipated Unpaid Assumed1. Prior..... .......21,035 .......12,891 .......18,618 .......11,466 .........2,141 .........1,729 .........2,421 .........2,085 ............332 ..............10 ..............29 ..........16,365 ......XXX......2. 1993.... .........1,756 ............385 ............813 ............266 ............115 ..............30 ..............63 ..............29 ..............98 ..............12 ..............15 ............2,121 ......XXX......3. 1994.... .........1,750 ............359 .........1,681 ............275 ..............93 ................7 ..............78 ..............16 ............110 ..............11 ..............23 ............3,045 ......XXX......4. 1995.... .........2,489 ............525 .........1,584 ............205 ............140 ..............14 ..............83 ..............17 ............120 ................9 ..............41 ............3,645 ......XXX......5. 1996.... .........2,491 ............175 .........1,807 ..............90 ............198 ................9 ..............94 ................7 ............159 ..............21 ..............61 ............4,447 ......XXX......6. 1997.... .........3,878 ............223 .........2,115 ............238 ............363 ..............22 ............152 ..............17 ............210 ..............20 ............141 ............6,199 ......XXX......7. 1998.... .........5,026 ............241 .........2,843 ............118 ............609 ..............39 ............150 .............(31) ............391 ..............22 ............217 ............8,630 ......XXX......8. 1999.... .........8,173 .........2,155 .........3,275 ............270 .........1,024 ..............75 ............185 .............(22) ............531 ..............26 ............393 ..........10,684 ......XXX......9. 2000.... .......11,314 ............935 .........5,192 ............648 .........1,564 ............155 ............519 ............101 ............834 ..............33 ............566 ..........17,552 ......XXX......
10. 2001.... .......18,839 .........5,470 .......21,232 .........5,383 .........2,406 ............360 .........2,604 .........1,014 .........1,399 ..............41 ............908 ..........34,212 ......XXX......11. 2002.... .......18,429 .........1,378 .......26,783 .........3,062 .........2,478 ............288 .........3,308 .........1,349 .........2,936 ................0 .........2,008 ..........47,858 ......XXX......12. Totals.. .......95,181 .......24,739 .......85,944 .......22,022 .......11,131 .........2,727 .........9,657 .........4,580 .........7,120 ............205 .........4,401 .........154,759 ......XXX......
34Total Losses and Loss and Loss Expense Percentage Nontabular Net Balance Sheet
Loss Expenses Incurred (Incurred/Premiums Earned) Discount Reserves after Discount26 27 28 29 30 31 32 33 Inter-Company 35 36
Direct Direct Pooling Lossand and Loss Participation Losses Expenses
Assumed Ceded Net Assumed Ceded Net Loss Expense Percentage Unpaid Unpaid1. Prior.. ........XXX........ .........XXX....... .........XXX....... .........XXX....... .........XXX....... .........XXX....... ....................0 ....................0 ........XXX........ ............15,295 .............1,0702. 1993. ............62,825 ............10,184 ............52,641 ...............60.3 ...............39.6 ...............67.0 ....................0 ....................0 ...............1.50 .............1,917 ................2043. 1994. ............67,014 .............7,583 ............59,431 ...............69.0 ...............51.8 ...............72.1 ....................0 ....................0 ...............1.50 .............2,797 ................2484. 1995. ............64,514 .............6,178 ............58,336 ...............67.8 ...............60.3 ...............68.7 ....................0 ....................0 ...............1.50 .............3,343 ................3025. 1996. ............67,696 .............5,583 ............62,113 ...............71.0 ...............57.4 ...............72.6 ....................0 ....................0 ...............1.50 .............4,032 ................4156. 1997. ............65,268 .............4,561 ............60,707 ...............68.8 ...............48.9 ...............71.0 ....................0 ....................0 ...............1.50 .............5,532 ................6677. 1998. ............72,677 .............3,848 ............68,829 ...............77.5 ...............53.0 ...............79.6 ....................0 ....................0 ...............1.50 .............7,510 .............1,1218. 1999. ............79,434 .............8,606 ............70,829 ...............81.8 ...............99.4 ...............80.1 ....................0 ....................0 ...............1.50 .............9,024 .............1,6619. 2000. ............81,093 .............7,057 ............74,035 ...............75.0 ...............56.0 ...............77.5 ....................0 ....................0 ...............1.50 ............14,923 .............2,629
10. 2001. ..........105,901 ............21,241 ............84,659 ...............88.3 ...............79.4 ...............90.9 ....................0 ....................0 ...............1.50 ............29,219 .............4,99311. 2002. ............88,163 .............9,535 ............78,628 ...............64.7 ...............45.2 ...............68.3 ....................0 ....................0 ...............1.50 ............40,773 .............7,08512. Totals ........XXX........ ........XXX........ ........XXX........ ........XXX........ ........XXX........ ........XXX........ ....................0 ....................0 ........XXX........ ..........134,364 ............20,395Note: Parts 2 and 4 are gross of all discounting, including tabular discounting. Part 1 is gross of only nontabular discounting, which is reported in Columns 32 and 33 of Part 1. The tabular discount, if any, is reported in the Notes to Financial Statements which will reconcile Part 1 with Parts 2 and 4.

Annual Statement for the year 2002 of the TWIN CITY FIRE INSURANCE COMPANY
50
SCHEDULE P - PART 2 - SUMMARYIncurred Net Losses and Defense and Cost Containment Expenses Reported at Year End ($000 omitted) DEVELOPMENT
1 2 3 4 5 6 7 8 9 10 11 12Years inWhich
Losses Were One TwoIncurred 1993 1994 1995 1996 1997 1998 1999 2000 2001 2002 Year Year
1. Prior..... .........86,866 .........88,662 .........89,005 .......102,813 .......101,921 .......100,909 .........99,333 .........98,575 .........85,446 .........85,084 .............(362) ........(13,491)
2. 1993.... .........52,965 .........51,583 .........51,740 .........51,150 .........50,807 .........50,594 .........50,993 .........50,478 .........49,932 .........49,471 .............(461) ..........(1,006)
3. 1994.... ........XXX...... .........57,258 .........58,555 .........58,791 .........58,280 .........57,700 .........57,499 .........56,727 .........56,159 .........56,136 ..............(23) .............(591)
4. 1995.... ........XXX...... ........XXX...... .........59,395 .........57,942 .........57,565 .........56,877 .........55,437 .........54,986 .........54,753 .........54,898 ..............145 ..............(87)
5. 1996.... ........XXX...... ........XXX...... ........XXX...... .........60,812 .........61,457 .........60,716 .........60,035 .........58,541 .........58,230 .........58,485 ..............255 ..............(56)
6. 1997.... ........XXX...... ........XXX...... ........XXX...... ........XXX...... .........59,105 .........58,330 .........57,079 .........56,049 .........56,638 .........57,366 ..............727 ...........1,316
7. 1998.... ........XXX...... ........XXX...... ........XXX...... ........XXX...... ........XXX...... .........60,825 .........61,337 .........62,265 .........63,387 .........64,207 ..............820 ...........1,941
8. 1999.... ........XXX...... ........XXX...... ........XXX...... ........XXX...... ........XXX...... ........XXX...... .........62,769 .........63,823 .........64,612 .........66,023 ...........1,412 ...........2,200
9. 2000.... ........XXX...... ........XXX...... ........XXX...... ........XXX...... ........XXX...... ........XXX...... ........XXX...... .........64,946 .........66,563 .........68,714 ...........2,150 ...........3,767
10. 2001.... ........XXX...... ........XXX...... ........XXX...... ........XXX...... ........XXX...... ........XXX...... ........XXX...... ........XXX...... .........79,447 .........79,058 .............(389) ........XXX......
11. 2002.... ........XXX...... ........XXX...... ........XXX...... ........XXX...... ........XXX...... ........XXX...... ........XXX...... ........XXX...... ........XXX...... .........72,383 ........XXX...... ........XXX......
12. Totals..... ...........4,274 ..........(6,006)
SCHEDULE P - PART 3 - SUMMARYCumulative Paid Net Losses and Defense and Cost Containment Expenses Reported at Year End ($000 omitted) 11 12
1 2 3 4 5 6 7 8 9 10 Number ofNumber of Claims
Years in Claims ClosedWhich Closed With Without
Losses Were Loss LossIncurred 1993 1994 1995 1996 1997 1998 1999 2000 2001 2002 Payment Payment
1. Prior..... ........000....... .........20,291 .........33,818 .........42,437 .........48,897 .........53,772 .........58,178 .........61,473 .........65,146 .........66,606 ........XXX...... ........XXX......
2. 1993.... .........17,320 .........29,940 .........36,766 .........40,517 .........42,965 .........44,539 .........45,613 .........46,256 .........46,726 .........47,114 ........XXX...... ........XXX......
3. 1994.... ........XXX...... .........21,253 .........35,925 .........42,433 .........46,426 .........49,082 .........50,916 .........51,749 .........52,421 .........52,907 ........XXX...... ........XXX......
4. 1995.... ........XXX...... ........XXX...... .........21,321 .........34,319 .........40,802 .........45,136 .........47,788 .........49,373 .........50,367 .........51,039 ........XXX...... ........XXX......
5. 1996.... ........XXX...... ........XXX...... ........XXX...... .........23,581 .........37,373 .........44,194 .........48,361 .........50,955 .........52,737 .........53,905 ........XXX...... ........XXX......
6. 1997.... ........XXX...... ........XXX...... ........XXX...... ........XXX...... .........21,283 .........34,169 .........40,951 .........45,525 .........48,853 .........50,910 ........XXX...... ........XXX......
7. 1998.... ........XXX...... ........XXX...... ........XXX...... ........XXX...... ........XXX...... .........24,049 .........38,588 .........46,644 .........52,167 .........55,596 ........XXX...... ........XXX......
8. 1999.... ........XXX...... ........XXX...... ........XXX...... ........XXX...... ........XXX...... ........XXX...... .........25,308 .........41,260 .........49,528 .........55,453 ........XXX...... ........XXX......
9. 2000.... ........XXX...... ........XXX...... ........XXX...... ........XXX...... ........XXX...... ........XXX...... ........XXX...... .........26,527 .........43,207 .........51,697 ........XXX...... ........XXX......
10. 2001.... ........XXX...... ........XXX...... ........XXX...... ........XXX...... ........XXX...... ........XXX...... ........XXX...... ........XXX...... .........28,910 .........45,909 ........XXX...... ........XXX......
11. 2002.... ........XXX...... ........XXX...... ........XXX...... ........XXX...... ........XXX...... ........XXX...... ........XXX...... ........XXX...... ........XXX...... .........27,406 ........XXX...... ........XXX......
SCHEDULE P - PART 4 - SUMMARYBulk and IBNR Reserves on Net Losses and Defense and Cost Containment Expenses Reported at Year End ($000 omitted)
1 2 3 4 5 6 7 8 9 10Years inWhich
Losses WereIncurred 1993 1994 1995 1996 1997 1998 1999 2000 2001 2002
1. Prior......... .............35,583 .............30,636 .............25,468 .............35,074 .............31,190 .............26,944 .............22,852 .............18,713 ...............9,011 ...............7,488
2. 1993....... .............19,095 .............10,066 ...............6,097 ...............3,930 ...............3,086 ...............2,234 ...............2,079 ...............1,946 ...............1,256 ..................580
3. 1994....... ..........XXX........ .............17,947 ...............9,927 ...............6,482 ...............5,079 ...............3,490 ...............3,070 ...............2,404 ...............1,618 ...............1,468
4. 1995....... ..........XXX........ ..........XXX........ .............19,922 .............10,448 ...............7,401 ...............4,717 ...............3,048 ...............2,533 ...............1,821 ...............1,446
5. 1996....... ..........XXX........ ..........XXX........ ..........XXX........ .............18,958 .............11,503 ...............6,717 ...............5,104 ...............3,222 ...............2,128 ...............1,803
6. 1997....... ..........XXX........ ..........XXX........ ..........XXX........ ..........XXX........ .............19,087 .............11,487 ...............6,438 ...............3,789 ...............2,514 ...............2,013
7. 1998....... ..........XXX........ ..........XXX........ ..........XXX........ ..........XXX........ ..........XXX........ .............18,004 ...............9,167 ...............5,242 ...............3,490 ...............2,906
8. 1999....... ..........XXX........ ..........XXX........ ..........XXX........ ..........XXX........ ..........XXX........ ..........XXX........ .............17,298 ...............8,704 ...............4,489 ...............3,212
9. 2000....... ..........XXX........ ..........XXX........ ..........XXX........ ..........XXX........ ..........XXX........ ..........XXX........ ..........XXX........ .............20,363 ...............9,641 ...............4,962
10. 2001....... ..........XXX........ ..........XXX........ ..........XXX........ ..........XXX........ ..........XXX........ ..........XXX........ ..........XXX........ ..........XXX........ .............30,720 .............17,439
11. 2002....... ..........XXX........ ..........XXX........ ..........XXX........ ..........XXX........ ..........XXX........ ..........XXX........ ..........XXX........ ..........XXX........ ..........XXX........ .............25,680

Annual Statement for the year 2002 of the TWIN CITY FIRE INSURANCE COMPANY
51
SCHEDULE P - PART 1A - HOMEOWNERS/FARMOWNERS($000 omitted)
Premiums Earned Loss and Loss Expense Payments 12Years in Which 1 2 3 Defense and Cost Adjusting and Other 10 11 Number
Premiums Loss Payments Containment Payments Payments ofWere 4 5 6 7 8 9 Salvage Total Claims
Earned and Direct Direct Direct Direct and Net Paid Reported-Losses Were and Net and and and Subrogation (Cols. 4 - 5 + Direct and
Incurred Assumed Ceded (Cols. 1 - 2) Assumed Ceded Assumed Ceded Assumed Ceded Received 6 - 7 + 8 - 9) Assumed1. Prior....... .........XXX....... .........XXX....... .........XXX....... ................8 ................0 ................2 ................0 ................1 ................0 ................0 .................11 ......XXX.......2. 1993....... .............5,339 ................341 .............4,998 ..........3,385 ..............14 .............175 ................3 .............305 ................0 ..............27 .............3,847 ..........1,6903. 1994....... .............5,742 ................350 .............5,391 ..........3,943 ..............18 .............191 ................1 .............294 ................0 ..............62 .............4,410 ..........1,9014. 1995....... .............6,222 ................271 .............5,951 ..........4,101 ..............18 .............191 ................1 .............326 ................0 ..............65 .............4,599 ..........1,8575. 1996....... .............6,661 ................362 .............6,298 ..........5,603 ..............13 .............283 ................1 .............376 ................0 ..............61 .............6,249 ..........2,4246. 1997....... .............7,040 ................478 .............6,562 ..........3,816 ..............13 .............210 ................1 .............328 ................0 ..............66 .............4,340 ..........1,6467. 1998....... .............7,345 ................530 .............6,815 ..........4,207 ..............19 .............175 ................0 .............469 ................0 ..............61 .............4,832 ..........1,7828. 1999....... .............7,865 ................561 .............7,304 ..........4,554 ..............56 .............193 ................3 .............504 ................0 ..............70 .............5,193 ..........1,8719. 2000....... .............8,467 ................576 .............7,891 ..........4,731 ..............58 .............246 ................1 .............536 ................0 ..............62 .............5,454 ..........1,815
10. 2001....... .............8,912 ................734 .............8,178 ..........5,138 ..............64 .............303 ................1 .............505 ................0 ..............54 .............5,881 ..........1,88511. 2002....... .............9,706 ................630 .............9,076 ..........3,549 ..............31 .............166 ................0 .............294 ................0 ..............15 .............3,977 ..........1,60312. Totals..... .........XXX....... .........XXX....... .........XXX....... ........43,036 .............303 ..........2,134 ..............11 ..........3,937 ................0 .............545 ...........48,793 ......XXX.......
Adjusting and Other 23 24 25Losses Unpaid Defense and Cost Containment Unpaid Unpaid Total
Case Basis Bulk + IBNR Case Basis Bulk + IBNR 21 22 Net Number of13 14 15 16 17 18 19 20 Salvage Losses Claims
Direct Direct Direct Direct Direct and and Outstanding-and and and and and Subrogation Expenses Direct and
Assumed Ceded Assumed Ceded Assumed Ceded Assumed Ceded Assumed Ceded Anticipated Unpaid Assumed1. Prior..... ..............10 .............(13) ................0 ................0 ................0 ................0 ..............(0) ..............(0) ................0 ................0 ................0 ..................24 ..............142. 1993.... ................3 ................0 ................1 ................0 ................0 ................0 ................0 ................0 ................1 ................0 ................0 ....................5 ................63. 1994.... ................6 ................0 ..............(1) ................0 ................0 ................0 ..............(0) ..............(0) ................1 ................0 ................0 ....................7 ................84. 1995.... ................9 ................0 ..............(1) ................0 ................1 ................0 ..............(0) ..............(0) ................2 ................0 ................1 ..................11 ..............105. 1996.... ..............17 ................0 .............(12) ................0 ................4 ................0 ..............(2) ..............(0) ................3 ................0 ................1 ....................9 ..............146. 1997.... ..............28 ................0 .............(13) ..............(0) ................2 ................0 ................0 ................0 ................6 ................0 ................3 ..................23 ..............107. 1998.... ..............27 ................0 ..............(5) ................0 ................6 ................0 ..............(1) ..............(0) ..............15 ................0 ................8 ..................42 ................98. 1999.... ..............72 ................6 ..............(0) ................0 ................2 ................0 ..............(0) ..............(0) ..............21 ................0 ..............17 ..................88 ..............109. 2000.... ............145 ................1 ..............(1) ................0 ................5 ................0 ..............(0) ..............(0) ..............49 ................0 ..............32 ................198 ..............15
10. 2001.... ............307 ................6 ..............32 ................1 ..............12 ................0 ................1 ................0 ..............81 ................0 ..............58 ................427 ..............2111. 2002.... .........1,075 ..............10 ............795 ................6 ..............66 ................1 ..............22 ................0 ............182 ................0 ..............85 .............2,122 ............14912. Totals.. .........1,699 ................9 ............795 ................7 ..............99 ................2 ..............19 ................0 ............361 ................0 ............206 .............2,956 ............266
34Total Losses and Loss and Loss Expense Percentage Nontabular Net Balance Sheet
Loss Expenses Incurred (Incurred/Premiums Earned) Discount Inter- Reserves after Discount26 27 28 29 30 31 32 33 Company 35 36
Direct Direct Pooling Lossand and Loss Participation Losses Expenses
Assumed Ceded Net Assumed Ceded Net Loss Expense Percentage Unpaid Unpaid1. Prior.. ........XXX........ ........XXX........ ........XXX........ ........XXX........ ........XXX........ ........XXX........ ....................0 ....................0 ........XXX........ ..................24 ....................12. 1993. .............3,869 ..................17 .............3,852 ...............72.5 .................5.1 ...............77.1 ....................0 ....................0 ...............1.50 ....................4 ....................13. 1994. .............4,435 ..................18 .............4,417 ...............77.2 .................5.2 ...............81.9 ....................0 ....................0 ...............1.50 ....................5 ....................14. 1995. .............4,629 ..................19 .............4,610 ...............74.4 .................7.0 ...............77.5 ....................0 ....................0 ...............1.50 ....................8 ....................25. 1996. .............6,271 ..................14 .............6,257 ...............94.1 .................3.7 ...............99.3 ....................0 ....................0 ...............1.50 ....................4 ....................56. 1997. .............4,376 ..................13 .............4,363 ...............62.2 .................2.8 ...............66.5 ....................0 ....................0 ...............1.50 ..................15 ....................87. 1998. .............4,893 ..................19 .............4,874 ...............66.6 .................3.7 ...............71.5 ....................0 ....................0 ...............1.50 ..................22 ..................208. 1999. .............5,346 ..................65 .............5,281 ...............68.0 ...............11.6 ...............72.3 ....................0 ....................0 ...............1.50 ..................66 ..................229. 2000. .............5,712 ..................60 .............5,652 ...............67.5 ...............10.5 ...............71.6 ....................0 ....................0 ...............1.50 ................143 ..................54
10. 2001. .............6,379 ..................71 .............6,308 ...............71.6 .................9.7 ...............77.1 ....................0 ....................0 ...............1.50 ................333 ..................9411. 2002. .............6,148 ..................49 .............6,100 ...............63.3 .................7.8 ...............67.2 ....................0 ....................0 ...............1.50 .............1,853 ................26912. Totals ........XXX........ ........XXX........ ........XXX........ ........XXX........ ........XXX........ ........XXX........ ....................0 ....................0 ........XXX........ .............2,478 ................477

Annual Statement for the year 2002 of the TWIN CITY FIRE INSURANCE COMPANY
52
SCHEDULE P - PART 1B - PRIVATE PASSENGER AUTO LIABILITY/MEDICAL($000 omitted)
Premiums Earned Loss and Loss Expense Payments 12Years in Which 1 2 3 Defense and Cost Adjusting and Other 10 11 Number
Premiums Loss Payments Containment Payments Payments ofWere 4 5 6 7 8 9 Salvage Total Claims
Earned and Direct Direct Direct Direct and Net Paid Reported-Losses Were and Net and and and Subrogation (Cols. 4 - 5 + Direct and
Incurred Assumed Ceded (Cols. 1 - 2) Assumed Ceded Assumed Ceded Assumed Ceded Received 6 - 7 + 8 - 9) Assumed1. Prior....... .........XXX....... .........XXX....... .........XXX....... ................9 .............(19) ................3 ...............(0) ................8 ................0 ................0 .................39 ......XXX.......2. 1993....... ...........12,631 ................169 ...........12,462 ..........9,975 ..............74 .............436 ................1 .............837 ................0 .............155 ...........11,173 ..........2,7003. 1994....... ...........13,133 ................123 ...........13,011 ........10,763 ..............99 .............480 ................2 .............801 ................0 .............162 ...........11,941 ..........2,8134. 1995....... ...........13,596 ................175 ...........13,421 ........10,200 .............101 .............502 ................1 .............754 ................0 .............143 ...........11,354 ..........2,6955. 1996....... ...........14,597 ................107 ...........14,490 ........10,072 ..............29 .............596 ................0 .............677 ................0 .............147 ...........11,315 ..........2,6646. 1997....... ...........15,343 .................83 ...........15,260 ..........9,781 ..............30 .............726 ................0 .............665 ................0 .............168 ...........11,141 ..........2,6037. 1998....... ...........15,325 .................79 ...........15,246 ..........9,670 ..............26 .............697 ................0 .............865 ................0 .............183 ...........11,207 ..........2,7788. 1999....... ...........15,201 ................306 ...........14,894 ........10,125 .............344 .............656 ..............36 .............878 ................0 .............197 ...........11,278 ..........3,2869. 2000....... ...........16,257 ................666 ...........15,591 ........10,276 .............450 .............509 ..............51 .............951 ................0 .............202 ...........11,235 ..........3,602
10. 2001....... ...........17,469 ................652 ...........16,817 ..........9,223 .............315 .............302 ..............27 ..........1,000 ................0 .............160 ...........10,185 ..........3,56311. 2002....... ...........19,090 ................653 ...........18,438 ..........5,699 .............145 .............128 ................8 .............849 ................0 ..............76 .............6,523 ..........3,40112. Totals..... .........XXX....... .........XXX....... .........XXX....... ........95,792 ..........1,595 ..........5,034 .............126 ..........8,285 ................0 ..........1,593 .........107,391 ......XXX.......
Adjusting and Other 23 24 25Losses Unpaid Defense and Cost Containment Unpaid Unpaid Total
Case Basis Bulk + IBNR Case Basis Bulk + IBNR 21 22 Net Number of13 14 15 16 17 18 19 20 Salvage Losses Claims
Direct Direct Direct Direct Direct and and Outstanding-and and and and and Subrogation Expenses Direct and
Assumed Ceded Assumed Ceded Assumed Ceded Assumed Ceded Assumed Ceded Anticipated Unpaid Assumed1. Prior..... ..............76 ..............10 ............132 ................0 ................5 ................0 ................2 ................0 ..............22 ................0 ................5 ................229 ..............322. 1993.... ..............15 ................0 ..............18 ................0 ................2 ................0 ................1 ................0 ................7 ................0 ................2 ..................43 ................93. 1994.... ..............31 ................0 ..............19 ................0 ................4 ................0 ................1 ................0 ................8 ................0 ................2 ..................63 ..............124. 1995.... ..............28 ................0 ..............20 ................0 ................6 ................0 ................2 ................0 ..............10 ................0 ................3 ..................67 ..............135. 1996.... ..............67 ................0 ..............26 ................0 ..............13 ................0 ................3 ................0 ..............15 ................0 ................4 ................125 ..............146. 1997.... ............115 ................0 ..............26 ................0 ..............34 ................0 ................4 ................0 ..............21 ................0 ................8 ................201 ..............157. 1998.... ............272 ..............(0) ..............26 ................0 ..............77 ................0 ................4 ................0 ..............34 ................0 ..............14 ................414 ..............208. 1999.... ............756 ..............25 ..............72 ................0 ............165 ................0 ..............10 ................0 ..............58 ................0 ..............28 .............1,036 ..............409. 2000.... .........1,573 ..............73 ............139 ................0 ............311 ................0 ..............17 ................0 ..............97 ................0 ..............60 .............2,064 ..............78
10. 2001.... .........2,640 ..............76 ............984 ................1 ............447 ................1 ..............90 ................0 ............175 ................0 ............112 .............4,258 ............15311. 2002.... .........4,789 ............129 .........3,807 ................1 ............606 ................2 ............224 ................0 ............505 ................0 ............197 .............9,799 ............81912. Totals.. .......10,362 ............312 .........5,271 ................3 .........1,670 ................3 ............358 ................0 ............954 ................0 ............433 ...........18,297 .........1,205
34Total Losses and Loss and Loss Expense Percentage Nontabular Net Balance Sheet
Loss Expenses Incurred (Incurred/Premiums Earned) Discount Inter- Reserves after Discount26 27 28 29 30 31 32 33 Company 35 36
Direct Direct Pooling Lossand and Loss Participation Losses Expenses
Assumed Ceded Net Assumed Ceded Net Loss Expense Percentage Unpaid Unpaid1. Prior.. ........XXX........ ........XXX........ ........XXX........ ........XXX........ ........XXX........ ........XXX........ ....................0 ....................0 ........XXX........ ................199 ..................302. 1993. ............11,291 ..................75 ............11,216 ...............89.4 ...............44.5 ...............90.0 ....................0 ....................0 ...............1.50 ..................33 ..................103. 1994. ............12,105 ................101 ............12,004 ...............92.2 ...............82.8 ...............92.3 ....................0 ....................0 ...............1.50 ..................50 ..................134. 1995. ............11,523 ................102 ............11,421 ...............84.8 ...............58.2 ...............85.1 ....................0 ....................0 ...............1.50 ..................48 ..................185. 1996. ............11,470 ..................30 ............11,440 ...............78.6 ...............27.8 ...............79.0 ....................0 ....................0 ...............1.50 ..................93 ..................316. 1997. ............11,372 ..................30 ............11,341 ...............74.1 ...............36.5 ...............74.3 ....................0 ....................0 ...............1.50 ................141 ..................597. 1998. ............11,646 ..................26 ............11,620 ...............76.0 ...............33.0 ...............76.2 ....................0 ....................0 ...............1.50 ................298 ................1168. 1999. ............12,720 ................406 ............12,314 ...............83.7 .............132.4 ...............82.7 ....................0 ....................0 ...............1.50 ................803 ................2339. 2000. ............13,873 ................575 ............13,299 ...............85.3 ...............86.3 ...............85.3 ....................0 ....................0 ...............1.50 .............1,640 ................424
10. 2001. ............14,862 ................419 ............14,443 ...............85.1 ...............64.3 ...............85.9 ....................0 ....................0 ...............1.50 .............3,547 ................71111. 2002. ............16,607 ................285 ............16,322 ...............87.0 ...............43.6 ...............88.5 ....................0 ....................0 ...............1.50 .............8,466 .............1,33412. Totals ........XXX........ ........XXX........ ........XXX........ ........XXX........ ........XXX........ ........XXX........ ....................0 ....................0 ........XXX........ ............15,318 .............2,979

Annual Statement for the year 2002 of the TWIN CITY FIRE INSURANCE COMPANY
53
SCHEDULE P - PART 1C - COMMERCIAL AUTO/TRUCK LIABILITY/MEDICAL($000 omitted)
Premiums Earned Loss and Loss Expense Payments 12Years in Which 1 2 3 Defense and Cost Adjusting and Other 10 11 Number
Premiums Loss Payments Containment Payments Payments ofWere 4 5 6 7 8 9 Salvage Total Claims
Earned and Direct Direct Direct Direct and Net Paid Reported-Losses Were and Net and and and Subrogation (Cols. 4 - 5 + Direct and
Incurred Assumed Ceded (Cols. 1 - 2) Assumed Ceded Assumed Ceded Assumed Ceded Received 6 - 7 + 8 - 9) Assumed1. Prior....... .........XXX....... .........XXX....... .........XXX....... ..............44 ..............12 ................6 ................2 ................4 ................0 ...............(0) .................40 ......XXX.......2. 1993....... .............6,286 ................447 .............5,839 ..........3,742 .............309 .............234 ..............17 .............296 ................5 ..............21 .............3,940 .............6973. 1994....... .............6,288 ................358 .............5,929 ..........3,791 .............221 .............259 ..............18 .............284 ................5 ..............17 .............4,089 .............7024. 1995....... .............5,833 ................163 .............5,670 ..........3,498 .............121 .............263 ................9 .............247 ................2 ..............23 .............3,875 .............6575. 1996....... .............5,498 ................177 .............5,321 ..........3,546 .............152 .............277 ..............15 .............263 ................0 ..............23 .............3,920 .............6616. 1997....... .............5,176 ................166 .............5,011 ..........3,131 .............189 .............311 ..............20 .............296 ................0 ..............22 .............3,528 .............6457. 1998....... .............5,115 ................234 .............4,881 ..........3,759 .............338 .............350 ..............26 .............357 ................0 ..............27 .............4,103 .............7188. 1999....... .............6,362 ................402 .............5,961 ..........4,189 .............288 .............437 ..............27 .............354 ................0 ..............24 .............4,665 .............7419. 2000....... .............7,084 ................352 .............6,731 ..........3,566 .............201 .............310 ..............19 .............346 ................0 ..............22 .............4,001 .............700
10. 2001....... .............7,738 ................359 .............7,379 ..........2,574 ..............52 .............187 ................4 .............321 ................0 ..............20 .............3,026 .............60411. 2002....... .............7,827 ................439 .............7,388 ..........1,054 ..............13 ..............67 ................0 .............221 ................0 ..............12 .............1,329 .............50812. Totals..... .........XXX....... .........XXX....... .........XXX....... ........32,893 ..........1,896 ..........2,701 .............158 ..........2,988 ..............12 .............210 ...........36,516 ......XXX.......
Adjusting and Other 23 24 25Losses Unpaid Defense and Cost Containment Unpaid Unpaid Total
Case Basis Bulk + IBNR Case Basis Bulk + IBNR 21 22 Net Number of13 14 15 16 17 18 19 20 Salvage Losses Claims
Direct Direct Direct Direct Direct and and Outstanding-and and and and and Subrogation Expenses Direct and
Assumed Ceded Assumed Ceded Assumed Ceded Assumed Ceded Assumed Ceded Anticipated Unpaid Assumed1. Prior..... ............133 ..............46 ...........(212) ................8 ................2 ................0 ................3 ................1 ................7 ................0 ................0 ...............(122) ..............152. 1993.... ................4 ................1 ................8 ................1 ................0 ................0 ................1 ................0 ................3 ................0 ................0 ..................15 ................53. 1994.... ..............29 ................7 ................9 ................1 ................1 ................0 ................1 ................0 ................3 ................0 ................0 ..................35 ................54. 1995.... ..............56 ................2 ................5 ................0 ................2 ................0 ................1 ................0 ................4 ................0 ................0 ..................65 ................55. 1996.... ............104 ................1 ................2 ................0 ................4 ................0 ................1 ................0 ................6 ................0 ................0 ................115 ................66. 1997.... ............167 ................8 ..............13 ................1 ................7 ................0 ................2 ................0 ................8 ................0 ................1 ................187 ................77. 1998.... ............299 ..............29 ................7 ................2 ..............18 ................1 ................6 ................1 ..............12 ................0 ................1 ................310 ................98. 1999.... ............636 ............144 ..............49 ..............10 ..............49 ................2 ..............17 ................3 ..............21 ................0 ................3 ................614 ..............139. 2000.... .........1,029 ..............85 ............129 ..............29 ..............86 ................3 ..............29 ................5 ..............42 ................0 ................5 .............1,194 ..............22
10. 2001.... .........1,251 ..............21 ............563 ..............73 ............135 ................4 ..............76 ..............14 ..............88 ................0 ................7 .............2,001 ..............3411. 2002.... .........1,177 ..............35 .........1,933 ............135 ..............73 ................2 ............192 ..............35 ............214 ................0 ..............15 .............3,381 ............11412. Totals.. .........4,886 ............380 .........2,504 ............260 ............377 ..............12 ............328 ..............60 ............410 ................0 ..............32 .............7,794 ............236
34Total Losses and Loss and Loss Expense Percentage Nontabular Net Balance Sheet
Loss Expenses Incurred (Incurred/Premiums Earned) Discount Inter- Reserves after Discount26 27 28 29 30 31 32 33 Company 35 36
Direct Direct Pooling Lossand and Loss Participation Losses Expenses
Assumed Ceded Net Assumed Ceded Net Loss Expense Percentage Unpaid Unpaid1. Prior.. ........XXX........ ........XXX........ ........XXX........ ........XXX........ ........XXX........ ........XXX........ ....................0 ....................0 ........XXX........ ...............(133) ..................112. 1993. .............4,288 ................333 .............3,954 ...............68.2 ...............74.6 ...............67.7 ....................0 ....................0 ...............1.50 ..................11 ....................43. 1994. .............4,377 ................253 .............4,124 ...............69.6 ...............70.5 ...............69.6 ....................0 ....................0 ...............1.50 ..................30 ....................54. 1995. .............4,076 ................135 .............3,940 ...............69.9 ...............83.0 ...............69.5 ....................0 ....................0 ...............1.50 ..................58 ....................75. 1996. .............4,203 ................168 .............4,034 ...............76.4 ...............95.1 ...............75.8 ....................0 ....................0 ...............1.50 ................104 ..................116. 1997. .............3,935 ................219 .............3,715 ...............76.0 .............132.5 ...............74.2 ....................0 ....................0 ...............1.50 ................170 ..................177. 1998. .............4,809 ................397 .............4,412 ...............94.0 .............169.4 ...............90.4 ....................0 ....................0 ...............1.50 ................275 ..................358. 1999. .............5,753 ................473 .............5,279 ...............90.4 .............117.9 ...............88.6 ....................0 ....................0 ...............1.50 ................532 ..................829. 2000. .............5,537 ................342 .............5,195 ...............78.2 ...............97.2 ...............77.2 ....................0 ....................0 ...............1.50 .............1,045 ................150
10. 2001. .............5,194 ................167 .............5,028 ...............67.1 ...............46.5 ...............68.1 ....................0 ....................0 ...............1.50 .............1,720 ................28111. 2002. .............4,931 ................222 .............4,709 ...............63.0 ...............50.5 ...............63.7 ....................0 ....................0 ...............1.50 .............2,939 ................44212. Totals ........XXX........ ........XXX........ ........XXX........ ........XXX........ ........XXX........ ........XXX........ ....................0 ....................0 ........XXX........ .............6,750 .............1,044

Annual Statement for the year 2002 of the TWIN CITY FIRE INSURANCE COMPANY
54
SCHEDULE P - PART 1D - WORKERS' COMPENSATION($000 omitted)
Premiums Earned Loss and Loss Expense Payments 12Years in Which 1 2 3 Defense and Cost Adjusting and Other 10 11 Number
Premiums Loss Payments Containment Payments Payments ofWere 4 5 6 7 8 9 Salvage Total Claims
Earned and Direct Direct Direct Direct and Net Paid Reported-Losses Were and Net and and and Subrogation (Cols. 4 - 5 + Direct and
Incurred Assumed Ceded (Cols. 1 - 2) Assumed Ceded Assumed Ceded Assumed Ceded Received 6 - 7 + 8 - 9) Assumed1. Prior....... .........XXX....... .........XXX....... .........XXX....... ..........1,240 .............453 ..............84 ..............18 ..............64 ................3 ................5 ................914 ......XXX.......2. 1993....... ...........27,851 .............7,568 ...........20,283 ........12,436 ..........3,895 .............759 .............222 .............772 ..............32 ..............96 .............9,818 ..........1,8753. 1994....... ...........23,777 .............5,064 ...........18,713 ........11,833 ..........2,845 .............807 .............190 .............885 ..............33 .............138 ...........10,456 ..........1,8854. 1995....... ...........21,953 .............3,202 ...........18,751 ........10,305 ..........1,595 .............766 .............126 .............991 ..............52 .............156 ...........10,288 ..........1,8855. 1996....... ...........20,075 .............2,312 ...........17,763 ..........9,385 ..........1,126 .............699 ..............78 ..........1,012 ..............83 .............155 .............9,811 ..........1,8176. 1997....... ...........17,897 .............1,562 ...........16,334 ..........9,277 .............882 .............723 ..............53 .............936 ..............82 .............194 .............9,919 ..........1,9497. 1998....... ...........17,772 .............1,107 ...........16,665 ..........9,280 .............601 .............839 ..............40 .............963 ..............63 .............129 ...........10,378 ..........2,0698. 1999....... ...........16,284 .............1,183 ...........15,101 ..........8,089 .............641 .............771 ..............40 .............918 ..............60 .............105 .............9,037 ..........1,7669. 2000....... ...........16,187 .............1,255 ...........14,932 ..........6,258 .............609 .............640 ..............48 .............789 ..............43 ..............54 .............6,987 ..........1,547
10. 2001....... ...........17,367 .............1,222 ...........16,145 ..........4,433 .............305 .............442 ..............19 .............645 ..............30 ..............18 .............5,166 ..........1,48311. 2002....... ...........21,907 .............1,848 ...........20,059 ..........1,966 .............136 .............170 ................8 .............384 ................0 ................2 .............2,376 ..........1,37412. Totals..... .........XXX....... .........XXX....... .........XXX....... ........84,501 ........13,086 ..........6,700 .............842 ..........8,358 .............481 ..........1,053 ...........85,150 ......XXX.......
Adjusting and Other 23 24 25Losses Unpaid Defense and Cost Containment Unpaid Unpaid Total
Case Basis Bulk + IBNR Case Basis Bulk + IBNR 21 22 Net Number of13 14 15 16 17 18 19 20 Salvage Losses Claims
Direct Direct Direct Direct Direct and and Outstanding-and and and and and Subrogation Expenses Direct and
Assumed Ceded Assumed Ceded Assumed Ceded Assumed Ceded Assumed Ceded Anticipated Unpaid Assumed1. Prior..... .........9,663 .........2,902 .........7,488 .........2,231 ............388 ..............75 ............433 ............161 ............225 ..............10 ..............10 ...........12,818 ............1002. 1993.... .........1,297 ............232 ............400 ............154 ..............60 ................9 ..............24 ................7 ..............63 ..............12 ................4 .............1,429 ..............103. 1994.... .........1,024 ............224 ............891 ............114 ..............44 ................1 ..............54 ..............11 ..............67 ..............11 ................8 .............1,718 ..............134. 1995.... .........1,307 ............338 ............820 ............106 ..............58 ................2 ..............50 ..............10 ..............63 ................9 ..............16 .............1,834 ..............155. 1996.... .........1,258 ............128 ............740 ..............16 ..............63 ..............(3) ..............45 ................5 ..............78 ..............21 ..............26 .............2,016 ..............146. 1997.... .........1,778 ............173 ............858 ............169 ............108 ................7 ..............51 ..............10 ..............88 ..............20 ..............62 .............2,503 ..............257. 1998.... .........1,964 ............127 .........1,232 ..............40 ............123 ..............(5) ..............82 ................9 ............128 ..............22 ..............79 .............3,337 ..............288. 1999.... .........2,627 ............126 ............935 ..............90 ............199 ................1 ..............72 ................9 ............188 ..............26 ............126 .............3,769 ..............379. 2000.... .........2,885 ............275 .........1,004 ..............59 ............249 ..............(4) ..............98 ..............10 ............293 ..............33 ............150 .............4,156 ..............50
10. 2001.... .........3,768 ............193 .........7,632 .........3,022 ............450 ..............71 ............687 ............250 ............462 ..............41 ............175 .............9,422 ..............9011. 2002.... .........4,189 ............346 .........6,476 ............495 ............309 .............(16) ............433 ..............68 ............607 ................0 ............192 ...........11,121 ............28612. Totals.. .......31,760 .........5,064 .......28,476 .........6,496 .........2,051 ............138 .........2,030 ............551 .........2,262 ............205 ............847 ...........54,125 ............668
34Total Losses and Loss and Loss Expense Percentage Nontabular Net Balance Sheet
Loss Expenses Incurred (Incurred/Premiums Earned) Discount Inter- Reserves after Discount26 27 28 29 30 31 32 33 Company 35 36
Direct Direct Pooling Lossand and Loss Participation Losses Expenses
Assumed Ceded Net Assumed Ceded Net Loss Expense Percentage Unpaid Unpaid1. Prior.. ........XXX........ ........XXX........ ........XXX........ ........XXX........ ........XXX........ ........XXX........ ....................0 ....................0 ........XXX........ ............12,019 ................7992. 1993. ............15,811 .............4,564 ............11,247 ...............56.8 ...............60.3 ...............55.5 ....................0 ....................0 ...............1.50 .............1,311 ................1183. 1994. ............15,605 .............3,430 ............12,175 ...............65.6 ...............67.7 ...............65.1 ....................0 ....................0 ...............1.50 .............1,576 ................1424. 1995. ............14,360 .............2,237 ............12,123 ...............65.4 ...............69.9 ...............64.7 ....................0 ....................0 ...............1.50 .............1,684 ................1505. 1996. ............13,280 .............1,453 ............11,827 ...............66.2 ...............62.8 ...............66.6 ....................0 ....................0 ...............1.50 .............1,853 ................1636. 1997. ............13,819 .............1,396 ............12,423 ...............77.2 ...............89.4 ...............76.1 ....................0 ....................0 ...............1.50 .............2,294 ................2107. 1998. ............14,611 ................896 ............13,715 ...............82.2 ...............81.0 ...............82.3 ....................0 ....................0 ...............1.50 .............3,030 ................3078. 1999. ............13,800 ................994 ............12,806 ...............84.7 ...............84.0 ...............84.8 ....................0 ....................0 ...............1.50 .............3,346 ................4239. 2000. ............12,215 .............1,072 ............11,143 ...............75.5 ...............85.5 ...............74.6 ....................0 ....................0 ...............1.50 .............3,555 ................601
10. 2001. ............18,519 .............3,931 ............14,588 .............106.6 .............321.7 ...............90.4 ....................0 ....................0 ...............1.50 .............8,184 .............1,23811. 2002. ............14,533 .............1,037 ............13,497 ...............66.3 ...............56.1 ...............67.3 ....................0 ....................0 ...............1.50 .............9,825 .............1,29612. Totals ........XXX........ ........XXX........ ........XXX........ ........XXX........ ........XXX........ ........XXX........ ....................0 ....................0 ........XXX........ ............48,676 .............5,449

Annual Statement for the year 2002 of the TWIN CITY FIRE INSURANCE COMPANY
55
SCHEDULE P - PART 1E - COMMERCIAL MULTIPLE PERIL($000 omitted)
Premiums Earned Loss and Loss Expense Payments 12Years in Which 1 2 3 Defense and Cost Adjusting and Other 10 11 Number
Premiums Loss Payments Containment Payments Payments ofWere 4 5 6 7 8 9 Salvage Total Claims
Earned and Direct Direct Direct Direct and Net Paid Reported-Losses Were and Net and and and Subrogation (Cols. 4 - 5 + Direct and
Incurred Assumed Ceded (Cols. 1 - 2) Assumed Ceded Assumed Ceded Assumed Ceded Received 6 - 7 + 8 - 9) Assumed1. Prior....... .........XXX....... .........XXX....... .........XXX....... .............168 .............144 .............150 .............255 ................2 ................0 ..............22 ................(80) ......XXX.......2. 1993....... ...........11,755 .............1,289 ...........10,466 ..........6,610 .............657 ..........1,019 ..............24 .............372 ................0 .............148 .............7,319 ..........1,1003. 1994....... ...........13,277 .............1,562 ...........11,716 ..........6,906 .............385 ..........1,114 ..............12 .............397 ................0 .............198 .............8,019 ..........1,2794. 1995....... ...........14,344 .............1,739 ...........12,605 ..........6,605 .............335 ..........1,150 ..............14 .............486 ................0 .............190 .............7,893 ..........1,2765. 1996....... ...........14,281 .............1,530 ...........12,751 ..........8,239 .............951 ..........1,095 ..............42 .............550 ................0 .............224 .............8,890 ..........1,2926. 1997....... ...........14,328 .............1,380 ...........12,948 ..........7,001 .............485 ..........1,130 ..............34 .............539 ................0 .............311 .............8,152 ..........1,2177. 1998....... ...........14,855 .............1,350 ...........13,505 ..........8,119 .............500 .............914 ..............17 .............775 ................0 .............295 .............9,291 ..........1,4398. 1999....... ...........15,930 .............1,481 ...........14,449 ..........8,576 .............697 .............899 ..............18 .............829 ................0 .............310 .............9,588 ..........1,5979. 2000....... ...........17,888 .............1,575 ...........16,312 ..........7,768 .............593 .............633 ..............18 .............826 ................0 .............225 .............8,616 ..........1,676
10. 2001....... ...........19,763 .............2,050 ...........17,713 ..........8,511 ..........1,716 .............393 ..............30 .............692 ................0 .............182 .............7,850 ..........1,58911. 2002....... ...........22,563 .............2,008 ...........20,555 ..........3,918 .............275 ..............85 ................2 .............391 ................0 ..............93 .............4,116 ..........1,21012. Totals..... .........XXX....... .........XXX....... .........XXX....... ........72,419 ..........6,738 ..........8,581 .............466 ..........5,858 ................0 ..........2,197 ...........79,655 ......XXX.......
Adjusting and Other 23 24 25Losses Unpaid Defense and Cost Containment Unpaid Unpaid Total
Case Basis Bulk + IBNR Case Basis Bulk + IBNR 21 22 Net Number of13 14 15 16 17 18 19 20 Salvage Losses Claims
Direct Direct Direct Direct Direct and and Outstanding-and and and and and Subrogation Expenses Direct and
Assumed Ceded Assumed Ceded Assumed Ceded Assumed Ceded Assumed Ceded Anticipated Unpaid Assumed1. Prior..... ............443 ............197 ..............67 ..............10 ..............35 ................3 ..............13 ................3 ..............24 ................0 ................1 ................369 ..............432. 1993.... ..............53 ................6 ................3 ................0 ..............13 ................1 ................1 ................0 ..............10 ................0 ................1 ..................72 ..............103. 1994.... ............107 ................0 ................4 ................0 ..............21 ................2 ................2 ................0 ..............13 ................0 ................3 ................144 ..............114. 1995.... ............116 ................0 ..............(3) ..............(0) ..............37 ................3 ................3 ................1 ..............17 ................0 ................7 ................165 ..............135. 1996.... ............215 ..............38 ..............(6) ..............(1) ..............50 ................4 ................4 ................1 ..............24 ................0 ..............12 ................246 ..............156. 1997.... ............343 ................3 .............(15) ..............(2) ............110 ................8 ................9 ................2 ..............36 ................0 ..............40 ................471 ..............167. 1998.... ............567 ..............24 ..............32 ................1 ............184 ..............14 ..............15 ................4 ..............52 ................0 ..............68 ................807 ..............238. 1999.... .........1,144 ..............43 ..............38 ................2 ............351 ..............27 ..............28 ................7 ..............89 ................0 ............156 .............1,572 ..............379. 2000.... .........1,483 ..............65 ............491 ..............11 ............474 ..............36 ............115 ..............27 ............150 ................0 ............191 .............2,573 ..............51
10. 2001.... .........2,847 .........1,019 .........2,919 ............546 ............683 ..............52 ............478 ............113 ............305 ................0 ............302 .............5,502 ..............7911. 2002.... .........2,896 ............162 .........2,397 ..............62 ............685 ..............52 ............355 ..............84 ............823 ................0 ............388 .............6,794 ............24612. Totals.. .......10,213 .........1,556 .........5,926 ............631 .........2,642 ............201 .........1,023 ............243 .........1,543 ................0 .........1,169 ...........18,716 ............544
34Total Losses and Loss and Loss Expense Percentage Nontabular Net Balance Sheet
Loss Expenses Incurred (Incurred/Premiums Earned) Discount Inter- Reserves after Discount26 27 28 29 30 31 32 33 Company 35 36
Direct Direct Pooling Lossand and Loss Participation Losses Expenses
Assumed Ceded Net Assumed Ceded Net Loss Expense Percentage Unpaid Unpaid1. Prior.. ........XXX........ ........XXX........ ........XXX........ ........XXX........ ........XXX........ ........XXX........ ....................0 ....................0 ........XXX........ ................303 ..................672. 1993. .............8,080 ................688 .............7,392 ...............68.7 ...............53.4 ...............70.6 ....................0 ....................0 ...............1.50 ..................50 ..................233. 1994. .............8,562 ................399 .............8,163 ...............64.5 ...............25.6 ...............69.7 ....................0 ....................0 ...............1.50 ................110 ..................334. 1995. .............8,410 ................352 .............8,058 ...............58.6 ...............20.2 ...............63.9 ....................0 ....................0 ...............1.50 ................112 ..................535. 1996. ............10,171 .............1,035 .............9,136 ...............71.2 ...............67.6 ...............71.7 ....................0 ....................0 ...............1.50 ................172 ..................746. 1997. .............9,153 ................530 .............8,624 ...............63.9 ...............38.4 ...............66.6 ....................0 ....................0 ...............1.50 ................327 ................1447. 1998. ............10,658 ................560 ............10,098 ...............71.7 ...............41.5 ...............74.8 ....................0 ....................0 ...............1.50 ................574 ................2338. 1999. ............11,954 ................794 ............11,160 ...............75.0 ...............53.6 ...............77.2 ....................0 ....................0 ...............1.50 .............1,137 ................4359. 2000. ............11,940 ................751 ............11,189 ...............66.7 ...............47.7 ...............68.6 ....................0 ....................0 ...............1.50 .............1,898 ................675
10. 2001. ............16,828 .............3,476 ............13,352 ...............85.1 .............169.5 ...............75.4 ....................0 ....................0 ...............1.50 .............4,201 .............1,30111. 2002. ............11,549 ................638 ............10,910 ...............51.2 ...............31.8 ...............53.1 ....................0 ....................0 ...............1.50 .............5,068 .............1,72612. Totals ........XXX........ ........XXX........ ........XXX........ ........XXX........ ........XXX........ ........XXX........ ....................0 ....................0 ........XXX........ ............13,952 .............4,764

Annual Statement for the year 2002 of the TWIN CITY FIRE INSURANCE COMPANY
56
SCHEDULE P - PART 1F - SECTION 1 - MEDICAL MALPRACTICE - OCCURRENCE($000 omitted)
Premiums Earned Loss and Loss Expense Payments 12Years in Which 1 2 3 Defense and Cost Adjusting and Other 10 11 Number
Premiums Loss Payments Containment Payments Payments ofWere 4 5 6 7 8 9 Salvage Total Claims
Earned and Direct Direct Direct Direct and Net Paid Reported-Losses Were and Net and and and Subrogation (Cols. 4 - 5 + Direct and
Incurred Assumed Ceded (Cols. 1 - 2) Assumed Ceded Assumed Ceded Assumed Ceded Received 6 - 7 + 8 - 9) Assumed1. Prior....... .........XXX....... .........XXX....... .........XXX....... ..............10 ...............(0) ................3 ................0 ................2 ................0 ................0 .................16 ......XXX.......2. 1993....... .................21 ...................6 .................15 ................6 ................3 ................1 ...............(0) ..............13 ................0 ................0 .................18 ................23. 1994....... .................27 ...................4 .................24 ................2 ................1 ................1 ................0 ..............11 ................0 ................0 .................12 ................04. 1995....... ...................5 ...................7 ..................(2) ................2 ................2 ................2 ................0 ..............10 ................0 ................0 .................12 ................05. 1996....... .................13 ...................9 ...................4 ...............(1) ................0 ...............(2) ................0 ................6 ................0 ................0 ...................4 ................06. 1997....... ...................8 ...................7 ...................1 ................2 ................1 ................1 ................0 ................0 ................0 ................0 ...................2 ................17. 1998....... ...................1 ................(27) .................29 ................3 ................0 ................2 ................0 ................0 ................0 ................0 ...................5 ................08. 1999....... ..................(1) ..................(8) ...................8 ................2 ...............(0) ................2 ...............(0) ................0 ................0 ................0 ...................5 ................09. 2000....... ...................0 ...................0 ...................0 ................1 ................0 ................0 ................0 ................0 ................0 ................0 ...................2 ................0
10. 2001....... ...................0 .................33 ................(33) ................0 ...............(0) ................0 ...............(0) ...............(0) ................0 ................0 ...................0 ................011. 2002....... ...................0 ...................0 ...................0 ................0 ................0 ................0 ................0 ................0 ................0 ................0 ...................0 ................112. Totals..... .........XXX....... .........XXX....... .........XXX....... ..............29 ................7 ..............11 ................0 ..............43 ................0 ................0 .................76 ......XXX.......
Adjusting and Other 23 24 25Losses Unpaid Defense and Cost Containment Unpaid Unpaid Total
Case Basis Bulk + IBNR Case Basis Bulk + IBNR 21 22 Net Number of13 14 15 16 17 18 19 20 Salvage Losses Claims
Direct Direct Direct Direct Direct and and Outstanding-and and and and and Subrogation Expenses Direct and
Assumed Ceded Assumed Ceded Assumed Ceded Assumed Ceded Assumed Ceded Anticipated Unpaid Assumed1. Prior..... ..............14 .............(15) ................4 ................0 ..............13 ................2 ................6 ................0 ..............(1) ................0 ................0 ..................50 ................02. 1993.... ................0 ................4 ................0 ................0 ................0 ................0 ................0 ................0 ................0 ................0 ................0 ...................(4) ................03. 1994.... ................0 ................0 ................0 ................0 ................0 ................0 ................0 ................0 ................0 ................0 ................0 ....................0 ................04. 1995.... ................0 ................0 ................0 ................0 ................0 ................0 ................0 ................0 ..............(0) ................0 ................0 ....................0 ................05. 1996.... ................0 ................0 ................0 ................0 ................0 ................0 ................0 ................0 ..............(0) ................0 ................0 ...................(0) ................06. 1997.... ................0 ................0 ................0 ................0 ................0 ................0 ................0 ................0 ................0 ................0 ................0 ....................0 ................07. 1998.... ................4 ................0 ................0 ................0 ................0 ................0 ................0 ................0 ..............(0) ................0 ................0 ....................5 ................08. 1999.... ................4 ................0 ................0 ................0 ................1 ................0 ................1 ................0 ..............(0) ................0 ................0 ....................6 ................09. 2000.... ................0 ..............(0) ................1 ................0 ................1 ................0 ................1 ................0 ..............(0) ................0 ................0 ....................3 ................0
10. 2001.... ................5 ................0 ................1 ................0 ................4 ................0 ................4 ................0 ................0 ................0 ................0 ..................13 ................011. 2002.... ................0 ................0 ................3 ................0 ................1 ................0 ................1 ................0 ................0 ................0 ................0 ....................5 ................012. Totals.. ..............27 .............(11) ................8 ................0 ..............21 ................3 ..............15 ................0 ..............(1) ................0 ................0 ..................78 ................1
34Total Losses and Loss and Loss Expense Percentage Nontabular Net Balance Sheet
Loss Expenses Incurred (Incurred/Premiums Earned) Discount Inter- Reserves after Discount26 27 28 29 30 31 32 33 Company 35 36
Direct Direct Pooling Lossand and Loss Participation Losses Expenses
Assumed Ceded Net Assumed Ceded Net Loss Expense Percentage Unpaid Unpaid1. Prior.. ........XXX........ ........XXX........ ........XXX........ ........XXX........ ........XXX........ ........XXX........ ....................0 ....................0 ........XXX........ ..................34 ..................172. 1993. ..................21 ....................7 ..................14 .............101.1 .............119.0 ...............93.9 ....................0 ....................0 ...............1.50 ...................(4) ....................03. 1994. ..................14 ....................2 ..................12 ...............50.1 ...............42.3 ...............51.3 ....................0 ....................0 ...............1.50 ...................(0) ....................04. 1995. ..................14 ....................2 ..................12 .............255.2 ...............26.7 ............(606.7) ....................0 ....................0 ...............1.50 ....................0 ....................05. 1996. ....................4 ....................0 ....................4 ...............31.5 .................0.0 ...............93.9 ....................0 ....................0 ...............1.50 ...................(0) ...................(0)6. 1997. ....................3 ....................1 ....................3 ...............40.9 .................8.1 .............433.0 ....................0 ....................0 ...............1.50 ....................0 ....................07. 1998. ..................10 ....................0 ..................10 .............725.3 ................(0.6) ...............34.9 ....................0 ....................0 ...............1.50 ....................4 ....................18. 1999. ..................11 ....................0 ..................11 .........(1,348.7) ................(1.5) .............138.8 ....................0 ....................0 ...............1.50 ....................4 ....................29. 2000. ....................4 ....................0 ....................4 ..........4,213.8 .................0.0 ..........4,093.0 ....................0 ....................0 ...............1.50 ....................1 ....................2
10. 2001. ..................14 ....................0 ..................14 ........46,763.6 .................1.4 ..............(40.9) ....................0 ....................0 ...............1.50 ....................6 ....................811. 2002. ....................6 ....................0 ....................5 ........18,697.4 .................0.0 ........18,246.2 ....................0 ....................0 ...............1.50 ....................3 ....................212. Totals ........XXX........ ........XXX........ ........XXX........ ........XXX........ ........XXX........ ........XXX........ ....................0 ....................0 ........XXX........ ..................46 ..................32

Annual Statement for the year 2002 of the TWIN CITY FIRE INSURANCE COMPANY
57
SCHEDULE P - PART 1F - SECTION 2 - MEDICAL MALPRACTICE - CLAIMS-MADE($000 omitted)
Premiums Earned Loss and Loss Expense Payments 12Years in Which 1 2 3 Defense and Cost Adjusting and Other 10 11 Number
Premiums Loss Payments Containment Payments Payments ofWere 4 5 6 7 8 9 Salvage Total Claims
Earned and Direct Direct Direct Direct and Net Paid Reported-Losses Were and Net and and and Subrogation (Cols. 4 - 5 + Direct and
Incurred Assumed Ceded (Cols. 1 - 2) Assumed Ceded Assumed Ceded Assumed Ceded Received 6 - 7 + 8 - 9) Assumed1. Prior....... .........XXX....... .........XXX....... .........XXX....... ................0 ................0 ................0 ................0 ................0 ................0 ................0 ...................1 ......XXX.......2. 1993....... ................286 ...................1 ................285 .............104 ................0 ..............46 ...............(1) ................8 ................0 ................0 ................158 ..............133. 1994....... ................267 ...................1 ................266 ..............95 ................0 ..............42 ................0 ................7 ................0 ................0 ................144 ................74. 1995....... ................245 ...................1 ................245 ..............89 ................0 ..............38 ...............(0) ................8 ................0 ................0 ................135 ................65. 1996....... ................236 ...................0 ................236 .............125 ...............(4) ..............45 ...............(1) ..............10 ................0 ................0 ................184 ................56. 1997....... ................227 ...................0 ................227 ..............68 ...............(2) ..............33 ...............(1) ................9 ................0 ................0 ................112 ................47. 1998....... ................167 ...................0 ................167 ..............87 ................5 ..............38 ................2 ................7 ................0 ................0 ................124 ................28. 1999....... ...................8 ..................(8) .................16 ................4 ................0 ................6 ................1 ................5 ................0 ................0 .................14 ................09. 2000....... ...................0 ...................0 ...................0 ................0 ................0 ................0 ................0 ................2 ................0 ................0 ...................2 ................0
10. 2001....... ...................0 ...................0 ...................0 ................0 ................0 ................0 ................0 ................1 ................0 ................0 ...................1 ................011. 2002....... ...................0 ...................0 ...................0 ................0 ................0 ................0 ................0 ................0 ................0 ................0 ...................0 ................012. Totals..... .........XXX....... .........XXX....... .........XXX....... .............571 ................0 .............247 ................0 ..............57 ................0 ................0 ................875 ......XXX.......
Adjusting and Other 23 24 25Losses Unpaid Defense and Cost Containment Unpaid Unpaid Total
Case Basis Bulk + IBNR Case Basis Bulk + IBNR 21 22 Net Number of13 14 15 16 17 18 19 20 Salvage Losses Claims
Direct Direct Direct Direct Direct and and Outstanding-and and and and and Subrogation Expenses Direct and
Assumed Ceded Assumed Ceded Assumed Ceded Assumed Ceded Assumed Ceded Anticipated Unpaid Assumed1. Prior..... ................2 ................0 ................4 ................0 ................1 ................0 ................0 ................0 ..............(1) ................0 ................0 ....................6 ................02. 1993.... ................2 ................0 ................0 ................0 ................1 ................0 ................0 ................0 ..............(0) ................0 ................0 ....................2 ................03. 1994.... ................0 ................0 ..............11 ................0 ................1 ................0 ................1 ................0 ..............(1) ................0 ................0 ..................13 ................04. 1995.... ................7 ................0 ..............20 ................0 ................3 ................0 ................2 ................0 ..............(1) ................0 ................0 ..................31 ................05. 1996.... ..............12 ................0 ..............32 ................0 ................5 ................0 ................3 ................0 ..............(2) ................0 ................0 ..................51 ................06. 1997.... ..............11 ................0 ..............30 ................0 ................6 ................0 ................4 ................0 ..............(2) ................0 ................0 ..................48 ................07. 1998.... ..............19 ................0 ..............77 ................0 ..............10 ................0 ................7 ................0 ..............(3) ................0 ................0 ................111 ................08. 1999.... ................2 ................0 ..............20 ................0 ................2 ................0 ................2 ................0 ..............(5) ................0 ................0 ..................21 ................09. 2000.... ................0 ................0 ................0 ................0 ................0 ................0 ................0 ................0 ................0 ................0 ................0 ....................0 ................0
10. 2001.... ................0 ................0 ................0 ................0 ................0 ................0 ................0 ................0 ................0 ................0 ................0 ....................0 ................011. 2002.... ................1 .............(33) ................0 ................0 ................0 ................0 ................0 ................0 ................0 ................0 ................0 ..................34 ................012. Totals.. ..............56 .............(33) ............193 ................0 ..............29 ................0 ..............19 ................0 .............(14) ................0 ................0 ................317 ................1
34Total Losses and Loss and Loss Expense Percentage Nontabular Net Balance Sheet
Loss Expenses Incurred (Incurred/Premiums Earned) Discount Inter- Reserves after Discount26 27 28 29 30 31 32 33 Company 35 36
Direct Direct Pooling Lossand and Loss Participation Losses Expenses
Assumed Ceded Net Assumed Ceded Net Loss Expense Percentage Unpaid Unpaid1. Prior.. ........XXX........ ........XXX........ ........XXX........ ........XXX........ ........XXX........ ........XXX........ ....................0 ....................0 ........XXX........ ....................6 ....................02. 1993. ................160 ...................(1) ................160 ...............55.9 ..............(98.7) ...............56.2 ....................0 ....................0 ...............1.50 ....................2 ....................13. 1994. ................156 ....................0 ................156 ...............58.6 .................0.0 ...............58.8 ....................0 ....................0 ...............1.50 ..................11 ....................24. 1995. ................166 ...................(0) ................166 ...............67.6 ..............(33.9) ...............67.9 ....................0 ....................0 ...............1.50 ..................27 ....................45. 1996. ................230 ...................(5) ................235 ...............97.4 .................0.0 ...............99.3 ....................0 ....................0 ...............1.50 ..................44 ....................76. 1997. ................158 ...................(3) ................160 ...............69.4 .................0.0 ...............70.5 ....................0 ....................0 ...............1.50 ..................41 ....................77. 1998. ................242 ....................7 ................235 .............144.8 ..........7,873.1 .............140.6 ....................0 ....................0 ...............1.50 ..................96 ..................158. 1999. ..................36 ....................1 ..................35 .............430.9 ................(8.8) .............215.1 ....................0 ....................0 ...............1.50 ..................21 ....................09. 2000. ....................2 ....................0 ....................2 .................0.0 .................0.0 .................0.0 ....................0 ....................0 ...............1.50 ....................0 ....................0
10. 2001. ....................1 ....................0 ....................1 .................0.0 .................0.0 .................0.0 ....................0 ....................0 ...............1.50 ....................0 ....................011. 2002. ....................1 .................(33) ..................34 .................0.0 .................0.0 .................0.0 ....................0 ....................0 ...............1.50 ..................34 ....................012. Totals ........XXX........ ........XXX........ ........XXX........ ........XXX........ ........XXX........ ........XXX........ ....................0 ....................0 ........XXX........ ................282 ..................34

Annual Statement for the year 2002 of the TWIN CITY FIRE INSURANCE COMPANY
58
SCHEDULE P - PART 1G - SPECIAL LIABILITY(OCEAN MARINE, AIRCRAFT (ALL PERILS), BOILER AND MACHINERY)
($000 omitted)Premiums Earned Loss and Loss Expense Payments 12
Years in Which 1 2 3 Defense and Cost Adjusting and Other 10 11 NumberPremiums Loss Payments Containment Payments Payments of
Were 4 5 6 7 8 9 Salvage Total ClaimsEarned and Direct Direct Direct Direct and Net Paid Reported-
Losses Were and Net and and and Subrogation (Cols. 4 - 5 + Direct andIncurred Assumed Ceded (Cols. 1 - 2) Assumed Ceded Assumed Ceded Assumed Ceded Received 6 - 7 + 8 - 9) Assumed
1. Prior....... .........XXX....... .........XXX....... .........XXX....... ................5 ................1 ................4 ................0 ...............(0) ................0 ................0 ...................8 ......XXX.......2. 1993....... .............1,153 ................453 ................700 .............661 .............355 ..............39 ..............11 ..............15 ................0 ..............26 ................348 ......XXX.......3. 1994....... ................888 ................258 ................630 .............532 .............237 ..............27 ................2 ..............11 ................0 ..............16 ................331 ......XXX.......4. 1995....... .............1,124 ................379 ................744 .............538 .............216 ..............50 ..............15 ..............10 ................0 ..............16 ................366 ......XXX.......5. 1996....... .............1,541 ................648 ................893 .............703 .............297 ..............74 ..............21 ................9 ................0 ..............15 ................469 ......XXX.......6. 1997....... .............1,999 ................951 .............1,048 .............914 .............413 .............100 ..............47 ..............11 ................0 ..............20 ................566 ......XXX.......7. 1998....... .............1,810 ................808 .............1,002 ..........1,224 .............533 .............105 ..............44 ..............19 ................0 ..............19 ................771 ......XXX.......8. 1999....... .............1,804 ................764 .............1,040 .............994 .............435 ..............83 ..............40 ..............10 ................0 ..............24 ................613 ......XXX.......9. 2000....... .............1,917 ................867 .............1,050 .............962 .............472 ..............85 ..............44 ...............(1) ................0 ..............17 ................531 ......XXX.......
10. 2001....... .............2,073 .............1,089 ................984 .............905 .............556 ..............60 ..............34 ...............(1) ................0 ..............11 ................374 ......XXX.......11. 2002....... .............3,024 .............1,693 .............1,332 .............619 .............415 ..............27 ..............16 ...............(1) ................0 ................1 ................214 ......XXX.......12. Totals..... .........XXX....... .........XXX....... .........XXX....... ..........8,057 ..........3,930 .............655 .............273 ..............83 ................0 .............164 .............4,592 ......XXX.......
Adjusting and Other 23 24 25Losses Unpaid Defense and Cost Containment Unpaid Unpaid Total
Case Basis Bulk + IBNR Case Basis Bulk + IBNR 21 22 Net Number of13 14 15 16 17 18 19 20 Salvage Losses Claims
Direct Direct Direct Direct Direct and and Outstanding-and and and and and Subrogation Expenses Direct and
Assumed Ceded Assumed Ceded Assumed Ceded Assumed Ceded Assumed Ceded Anticipated Unpaid Assumed1. Prior..... ..............27 .............(10) ..............14 ................1 ..............(1) ..............(1) ..............(0) ..............(0) ................0 ................0 ................0 ..................49 ................02. 1993.... ................3 ................0 ................2 ................0 ................1 ................1 ................0 ................0 ................0 ................0 ................0 ....................5 ................03. 1994.... ................4 ................0 ................4 ................0 ................2 ................1 ................0 ................0 ................0 ................0 ................0 ....................7 ................04. 1995.... ................6 ................0 ................3 ................0 ................6 ................5 ................0 ................0 ................0 ................0 ................0 ....................9 ................05. 1996.... ..............13 ................1 ..............(2) ..............(0) ................9 ................8 ................0 ................0 ................0 ................0 ................0 ..................11 ................06. 1997.... ..............32 ................8 ................1 ................0 ..............11 ................9 ................0 ................0 ................0 ................0 ................0 ..................26 ................07. 1998.... ..............52 ................6 ................2 ................0 ..............29 ..............25 ................0 ................0 ................0 ................0 ................0 ..................52 ................08. 1999.... ............106 ............123 ................6 ................3 ..............33 ..............29 ................0 ................0 ................0 ................0 ................1 ...................(9) ................09. 2000.... ............153 ..............69 ..............16 ................5 ..............56 ..............48 ................0 ................0 ................2 ................0 ................6 ................105 ................0
10. 2001.... .........1,085 .........1,037 ..............89 ..............78 ..............73 ..............63 ................0 ................0 ................6 ................0 ..............14 ..................75 ................011. 2002.... ............532 ............316 ..............97 ..............17 ..............69 ..............60 ................0 ................0 ................6 ................0 ..............21 ................312 ................212. Totals.. .........2,014 .........1,550 ............230 ............106 ............288 ............248 ................1 ................1 ..............14 ................0 ..............42 ................642 ................4
34Total Losses and Loss and Loss Expense Percentage Nontabular Net Balance Sheet
Loss Expenses Incurred (Incurred/Premiums Earned) Discount Reserves after Discount26 27 28 29 30 31 32 33 Inter-Company 35 36
Direct Direct Pooling Lossand and Loss Participation Losses Expenses
Assumed Ceded Net Assumed Ceded Net Loss Expense Percentage Unpaid Unpaid1. Prior.. ........XXX........ ........XXX........ ........XXX........ ........XXX........ ........XXX........ ........XXX........ ....................0 ....................0 ........XXX........ ..................49 ...................(0)2. 1993. ................722 ................368 ................354 ...............62.6 ...............81.2 ...............50.5 ....................0 ....................0 ...............1.50 ....................5 ....................03. 1994. ................579 ................241 ................338 ...............65.2 ...............93.2 ...............53.7 ....................0 ....................0 ...............1.50 ....................7 ....................04. 1995. ................612 ................237 ................375 ...............54.5 ...............62.6 ...............50.4 ....................0 ....................0 ...............1.50 ....................8 ....................15. 1996. ................806 ................326 ................480 ...............52.3 ...............50.3 ...............53.7 ....................0 ....................0 ...............1.50 ..................10 ....................16. 1997. .............1,069 ................476 ................592 ...............53.5 ...............50.1 ...............56.5 ....................0 ....................0 ...............1.50 ..................25 ....................17. 1998. .............1,432 ................609 ................823 ...............79.1 ...............75.3 ...............82.2 ....................0 ....................0 ...............1.50 ..................48 ....................48. 1999. .............1,234 ................629 ................604 ...............68.4 ...............82.4 ...............58.1 ....................0 ....................0 ...............1.50 .................(14) ....................59. 2000. .............1,273 ................637 ................635 ...............66.4 ...............73.5 ...............60.5 ....................0 ....................0 ...............1.50 ..................95 ..................10
10. 2001. .............2,217 .............1,768 ................450 .............107.0 .............162.3 ...............45.7 ....................0 ....................0 ...............1.50 ..................59 ..................1611. 2002. .............1,349 ................824 ................525 ...............44.6 ...............48.7 ...............39.4 ....................0 ....................0 ...............1.50 ................296 ..................1512. Totals ........XXX........ ........XXX........ ........XXX........ ........XXX........ ........XXX........ ........XXX........ ....................0 ....................0 ........XXX........ ................588 ..................54

Annual Statement for the year 2002 of the TWIN CITY FIRE INSURANCE COMPANY
59
SCHEDULE P - PART 1H - SECTION 1 - OTHER LIABILITY - OCCURRENCE($000 omitted)
Premiums Earned Loss and Loss Expense Payments 12Years in Which 1 2 3 Defense and Cost Adjusting and Other 10 11 Number
Premiums Loss Payments Containment Payments Payments ofWere 4 5 6 7 8 9 Salvage Total Claims
Earned and Direct Direct Direct Direct and Net Paid Reported-Losses Were and Net and and and Subrogation (Cols. 4 - 5 + Direct and
Incurred Assumed Ceded (Cols. 1 - 2) Assumed Ceded Assumed Ceded Assumed Ceded Received 6 - 7 + 8 - 9) Assumed1. Prior....... .........XXX....... .........XXX....... .........XXX....... ..........1,445 ..........1,337 .............438 .............207 ................8 ................0 .............(25) ................347 ......XXX.......2. 1993....... .............5,439 ................542 .............4,896 ..........1,749 .............101 .............753 ..............42 .............194 ................0 ................1 .............2,554 .............2323. 1994....... .............5,973 ................520 .............5,453 ..........2,517 ..............52 .............743 ..............16 .............198 ................0 ..............11 .............3,391 .............2544. 1995....... .............5,701 ................520 .............5,181 ..........2,157 ..............64 .............710 ..............11 .............208 ................0 ................8 .............3,001 .............2415. 1996....... .............5,458 ................526 .............4,932 ..........2,437 .............158 .............735 ..............13 .............238 ................0 ................0 .............3,239 .............2306. 1997....... .............6,142 ................614 .............5,528 ..........2,713 .............294 .............686 ..............33 .............220 ................0 ................2 .............3,292 .............2077. 1998....... .............6,174 ................926 .............5,248 ..........2,783 .............420 .............580 .............(16) .............278 ................0 ................3 .............3,237 .............1868. 1999....... .............5,205 ................805 .............4,400 ..........2,401 .............732 .............490 ..............16 .............270 ................0 ................0 .............2,413 .............1809. 2000....... .............5,096 .............1,348 .............3,748 ..........1,431 .............392 .............281 ..............16 .............245 ................0 ................0 .............1,549 .............189
10. 2001....... .............5,344 .............5,771 ..............(427) .............602 .............118 ..............82 ................2 .............206 ................0 ................0 ................771 .............13311. 2002....... .............5,517 .............1,631 .............3,886 .............125 ..............19 ..............19 ................1 .............152 ................0 ................0 ................277 ..............6812. Totals..... .........XXX....... .........XXX....... .........XXX....... ........20,363 ..........3,688 ..........5,518 .............343 ..........2,219 ................0 ................0 ...........24,070 ......XXX.......
Adjusting and Other 23 24 25Losses Unpaid Defense and Cost Containment Unpaid Unpaid Total
Case Basis Bulk + IBNR Case Basis Bulk + IBNR 21 22 Net Number of13 14 15 16 17 18 19 20 Salvage Losses Claims
Direct Direct Direct Direct Direct and and Outstanding-and and and and and Subrogation Expenses Direct and
Assumed Ceded Assumed Ceded Assumed Ceded Assumed Ceded Assumed Ceded Anticipated Unpaid Assumed1. Prior..... .........8,151 .........7,641 .........8,675 .........6,943 .........1,736 .........1,700 .........1,788 .........1,756 ..............25 ................0 ................0 .............2,335 ..............702. 1993.... ............132 ..............83 ............299 ..............80 ..............35 ..............18 ..............31 ..............19 ................6 ................0 ................0 ................302 ................33. 1994.... ............162 ..............14 ............593 ..............89 ..............18 ................3 ..............15 ................3 ................7 ................0 ................0 ................684 ................34. 1995.... ............215 ..............25 ............577 ..............99 ..............25 ................5 ..............19 ................6 ................8 ................0 ................0 ................709 ................55. 1996.... ............331 ................3 ............788 ..............78 ..............42 ................1 ..............26 ................1 ..............12 ................0 ................0 .............1,117 ................36. 1997.... ............362 ..............13 ............832 ..............89 ..............69 ................3 ..............44 ................3 ..............17 ................0 ................0 .............1,217 ................47. 1998.... ............493 .............(23) ............931 ..............54 ............125 ..............(5) ..............70 ..............(5) ..............97 ................0 ................0 .............1,696 ................78. 1999.... ............723 ..............89 .........1,397 ..............86 ............207 ..............20 ............136 ..............21 ..............86 ................0 ................0 .............2,333 ................89. 2000.... ............952 ............130 .........2,014 ............125 ............245 ..............29 ............172 ..............30 ............105 ................0 ................1 .............3,172 ..............17
10. 2001.... ............720 ..............95 .........3,566 ............296 ............226 ..............21 ............205 ..............22 ............121 ................0 ................1 .............4,405 ..............1311. 2002.... ............402 ..............69 .........3,159 ..............67 ............233 ..............15 ............239 ..............16 ............181 ................0 ................1 .............4,047 ..............1912. Totals.. .......12,643 .........8,140 .......22,832 .........8,006 .........2,960 .........1,810 .........2,745 .........1,872 ............663 ................0 ................3 ...........22,017 ............154
34Total Losses and Loss and Loss Expense Percentage Nontabular Net Balance Sheet
Loss Expenses Incurred (Incurred/Premiums Earned) Discount Inter- Reserves after Discount26 27 28 29 30 31 32 33 Company 35 36
Direct Direct Pooling Lossand and Loss Participation Losses Expenses
Assumed Ceded Net Assumed Ceded Net Loss Expense Percentage Unpaid Unpaid1. Prior.. ........XXX........ ........XXX........ ........XXX........ ........XXX........ ........XXX........ ........XXX........ ....................0 ....................0 ........XXX........ .............2,242 ..................932. 1993. .............3,200 ................344 .............2,856 ...............58.8 ...............63.5 ...............58.3 ....................0 ....................0 ...............1.50 ................267 ..................343. 1994. .............4,253 ................178 .............4,075 ...............71.2 ...............34.3 ...............74.7 ....................0 ....................0 ...............1.50 ................651 ..................334. 1995. .............3,920 ................211 .............3,710 ...............68.8 ...............40.5 ...............71.6 ....................0 ....................0 ...............1.50 ................668 ..................415. 1996. .............4,609 ................253 .............4,356 ...............84.4 ...............48.1 ...............88.3 ....................0 ....................0 ...............1.50 .............1,039 ..................786. 1997. .............4,945 ................436 .............4,509 ...............80.5 ...............71.0 ...............81.6 ....................0 ....................0 ...............1.50 .............1,092 ................1257. 1998. .............5,358 ................425 .............4,933 ...............86.8 ...............45.9 ...............94.0 ....................0 ....................0 ...............1.50 .............1,394 ................3028. 1999. .............5,709 ................964 .............4,746 .............109.7 .............119.8 .............107.9 ....................0 ....................0 ...............1.50 .............1,945 ................3889. 2000. .............5,444 ................723 .............4,722 .............106.8 ...............53.6 .............126.0 ....................0 ....................0 ...............1.50 .............2,710 ................462
10. 2001. .............5,729 ................554 .............5,175 .............107.2 .................9.6 .........(1,212.5) ....................0 ....................0 ...............1.50 .............3,896 ................50911. 2002. .............4,511 ................187 .............4,324 ...............81.8 ...............11.5 .............111.3 ....................0 ....................0 ...............1.50 .............3,426 ................62212. Totals ........XXX........ ........XXX........ ........XXX........ ........XXX........ ........XXX........ ........XXX........ ....................0 ....................0 ........XXX........ ............19,329 .............2,688

Annual Statement for the year 2002 of the TWIN CITY FIRE INSURANCE COMPANY
60
SCHEDULE P - PART 1H - SECTION 2 - OTHER LIABILITY - CLAIMS-MADE($000 omitted)
Premiums Earned Loss and Loss Expense Payments 12Years in Which 1 2 3 Defense and Cost Adjusting and Other 10 11 Number
Premiums Loss Payments Containment Payments Payments ofWere 4 5 6 7 8 9 Salvage Total Claims
Earned and Direct Direct Direct Direct and Net Paid Reported-Losses Were and Net and and and Subrogation (Cols. 4 - 5 + Direct and
Incurred Assumed Ceded (Cols. 1 - 2) Assumed Ceded Assumed Ceded Assumed Ceded Received 6 - 7 + 8 - 9) Assumed1. Prior....... .........XXX....... .........XXX....... .........XXX....... ................0 ................0 ...............(0) ................0 ................0 ................0 ................0 ..................(0) ......XXX.......2. 1993....... ................318 .................39 ................279 .............296 ...............(1) ..............88 ................4 ..............17 ................0 ................0 ................397 ..............253. 1994....... ................669 .................49 ................620 .............297 ..............12 ..............70 ...............(0) ..............19 ................0 ................0 ................375 ..............214. 1995....... ................733 .................46 ................687 .............249 ...............(4) ..............87 ................4 ..............16 ................0 ................0 ................353 ..............185. 1996....... ................685 .................65 ................620 .............192 ..............23 ..............71 ................1 ..............17 ................0 ................0 ................257 ..............126. 1997....... ................747 .................76 ................671 .............321 ..............33 .............106 ................6 ..............21 ................0 ................0 ................409 ..............147. 1998....... ................805 .................96 ................709 .............348 ..............55 .............226 ..............32 ..............22 ................0 ................0 ................509 ..............168. 1999....... ................901 ................116 ................785 .............389 ..............37 .............234 ..............33 ..............29 ................0 ................0 ................582 ..............139. 2000....... .............2,614 .............1,174 .............1,440 .............593 .............138 .............309 ..............86 ..............52 ................0 ................0 ................730 ..............10
10. 2001....... .............4,615 .............2,852 .............1,762 .............398 .............174 .............264 .............152 ..............65 ................0 ................0 ................402 ................311. 2002....... .............6,185 .............3,654 .............2,532 .............123 ..............71 ..............45 ..............20 ..............69 ................0 ................0 ................147 ................112. Totals..... .........XXX....... .........XXX....... .........XXX....... ..........3,206 .............537 ..........1,500 .............336 .............327 ................0 ................1 .............4,161 ......XXX.......
Adjusting and Other 23 24 25Losses Unpaid Defense and Cost Containment Unpaid Unpaid Total
Case Basis Bulk + IBNR Case Basis Bulk + IBNR 21 22 Net Number of13 14 15 16 17 18 19 20 Salvage Losses Claims
Direct Direct Direct Direct Direct and and Outstanding-and and and and and Subrogation Expenses Direct and
Assumed Ceded Assumed Ceded Assumed Ceded Assumed Ceded Assumed Ceded Anticipated Unpaid Assumed1. Prior..... ................3 ..............(0) ..............(0) ..............(0) ..............(0) ..............(0) ..............(0) ..............(0) ................3 ................0 ................0 ....................6 ................12. 1993.... ................1 ................0 ..............(0) ..............(0) ..............(0) ..............(0) ................0 ................0 ................1 ................0 ................0 ....................2 ................03. 1994.... ................7 ................0 ................1 ................0 ..............(1) ..............(1) ..............(0) ..............(0) ................1 ................0 ................0 ....................8 ................04. 1995.... ..............19 ................4 ................1 ................1 ..............(3) ..............(2) ..............(0) ..............(0) ................2 ................0 ................0 ..................17 ................05. 1996.... ..............22 ................2 ..............(0) ..............(0) ..............(5) ..............(3) ................0 ................0 ................3 ................0 ................0 ..................22 ................06. 1997.... ..............27 ................5 ................2 ................1 .............(14) ..............(9) ..............(2) ..............(1) ................5 ................0 ................0 ..................22 ................07. 1998.... ..............24 ................7 ..............57 ..............37 ................8 ................5 .............(66) .............(44) ................8 ................0 ................0 ..................27 ................28. 1999.... ..............96 ..............18 ............144 ............110 .............(13) ..............(8) ...........(108) .............(71) ..............12 ................0 ................0 ..................82 ................19. 2000.... ............291 ............108 ............547 ............395 ................4 ................2 ..............31 ..............20 ..............18 ................0 ................0 ................364 ................1
10. 2001.... ............815 ............547 .........1,572 ............991 ..............89 ..............52 ............746 ............494 ..............28 ................0 ................0 .............1,167 ................111. 2002.... ............255 ............124 .........2,620 .........1,420 ............190 ............112 .........1,598 .........1,058 ..............52 ................0 ................0 .............2,001 ................012. Totals.. .........1,562 ............814 .........4,944 .........2,955 ............253 ............149 .........2,199 .........1,455 ............134 ................0 ................0 .............3,718 ................7
34Total Losses and Loss and Loss Expense Percentage Nontabular Net Balance Sheet
Loss Expenses Incurred (Incurred/Premiums Earned) Discount Inter- Reserves after Discount26 27 28 29 30 31 32 33 Company 35 36
Direct Direct Pooling Lossand and Loss Participation Losses Expenses
Assumed Ceded Net Assumed Ceded Net Loss Expense Percentage Unpaid Unpaid1. Prior.. ........XXX........ ........XXX........ ........XXX........ ........XXX........ ........XXX........ ........XXX........ ....................0 ....................0 ........XXX........ ....................3 ....................32. 1993. ................403 ....................3 ................400 .............126.8 .................7.4 .............143.4 ....................0 ....................0 ...............1.50 ....................1 ....................13. 1994. ................394 ..................11 ................383 ...............58.9 ...............22.2 ...............61.7 ....................0 ....................0 ...............1.50 ....................8 ....................14. 1995. ................371 ....................2 ................369 ...............50.7 .................4.6 ...............53.8 ....................0 ....................0 ...............1.50 ..................16 ....................15. 1996. ................301 ..................22 ................279 ...............43.9 ...............33.4 ...............45.1 ....................0 ....................0 ...............1.50 ..................20 ....................16. 1997. ................466 ..................35 ................431 ...............62.4 ...............46.3 ...............64.2 ....................0 ....................0 ...............1.50 ..................23 ...................(1)7. 1998. ................628 ..................92 ................536 ...............78.0 ...............95.3 ...............75.6 ....................0 ....................0 ...............1.50 ..................38 .................(11)8. 1999. ................783 ................119 ................664 ...............87.0 .............102.8 ...............84.6 ....................0 ....................0 ...............1.50 ................111 .................(30)9. 2000. .............1,843 ................750 .............1,094 ...............70.5 ...............63.8 ...............76.0 ....................0 ....................0 ...............1.50 ................334 ..................30
10. 2001. .............3,978 .............2,409 .............1,569 ...............86.2 ...............84.5 ...............89.0 ....................0 ....................0 ...............1.50 ................850 ................31711. 2002. .............4,953 .............2,805 .............2,148 ...............80.1 ...............76.8 ...............84.9 ....................0 ....................0 ...............1.50 .............1,331 ................67012. Totals ........XXX........ ........XXX........ ........XXX........ ........XXX........ ........XXX........ ........XXX........ ....................0 ....................0 ........XXX........ .............2,736 ................982

Annual Statement for the year 2002 of the TWIN CITY FIRE INSURANCE COMPANY
61
SCHEDULE P - PART 1I - SPECIAL PROPERTY (FIRE, ALLIED LINES, INLAND MARINE,EARTHQUAKE, BURGLARY AND THEFT)
($000 omitted)Premiums Earned Loss and Loss Expense Payments 12
Years in Which 1 2 3 Defense and Cost Adjusting and Other 10 11 NumberPremiums Loss Payments Containment Payments Payments of
Were 4 5 6 7 8 9 Salvage Total ClaimsEarned and Direct Direct Direct Direct and Net Paid Reported-
Losses Were and Net and and and Subrogation (Cols. 4 - 5 + Direct andIncurred Assumed Ceded (Cols. 1 - 2) Assumed Ceded Assumed Ceded Assumed Ceded Received 6 - 7 + 8 - 9) Assumed
1. Prior....... ........XXX........ ........XXX........ ........XXX........ .............343 .............200 .............113 ..............23 ..............42 ................0 ..............13 ................275 ......XXX.......2. 2001..... ...........13,307 .............4,377 .............8,930 ..........8,361 ..........4,267 .............185 ..............51 .............184 ................0 ..............78 .............4,412 ......XXX.......3. 2002..... ...........16,737 .............6,914 .............9,823 ..........4,449 ..........2,033 ..............97 ................7 .............146 ................0 ..............38 .............2,652 ......XXX.......4. Totals..... ........XXX........ ........XXX........ ........XXX........ ........13,153 ..........6,500 .............395 ..............81 .............372 ................0 .............129 .............7,338 ......XXX.......
Adjusting and Other 23 24 25Losses Unpaid Defense and Cost Containment Unpaid Unpaid Total
Case Basis Bulk + IBNR Case Basis Bulk + IBNR 21 22 Net Number of13 14 15 16 17 18 19 20 Salvage Losses Claims
Direct Direct Direct Direct Direct and and Outstanding-and and and and and Subrogation Expenses Direct and
Assumed Ceded Assumed Ceded Assumed Ceded Assumed Ceded Assumed Ceded Anticipated Unpaid Assumed1. Prior..... ............883 ............474 ...........(135) .............(87) ................1 ................1 ..............12 ..............11 ..............69 ................0 ..............71 ................433 ..............322. 2001... .........1,389 ............855 ............206 ..............65 ..............15 ................9 ............124 ............111 ..............57 ................0 ..............33 ................752 ................43. 2002... ............936 ............125 .........2,361 ............765 ..............10 ................6 ..............81 ..............73 ............153 ................0 ..............54 .............2,573 ..............244. Totals.. .........3,209 .........1,454 .........2,433 ............743 ..............27 ..............15 ............217 ............195 ............279 ................0 ............158 .............3,758 ..............59
34Total Losses and Loss and Loss Expense Percentage Nontabular Net Balance Sheet
Loss Expenses Incurred (Incurred/Premiums Earned) Discount Reserves after Discount26 27 28 29 30 31 32 33 Inter-Company 35 36
Direct Direct Pooling Lossand and Loss Participation Losses Expenses
Assumed Ceded Net Assumed Ceded Net Loss Expense Percentage Unpaid Unpaid1. Prior.. ........XXX........ ........XXX........ ........XXX........ ........XXX........ ........XXX........ ........XXX........ ....................0 ....................0 ........XXX........ ................362 ..................712. 2001 ............10,522 .............5,359 .............5,164 ...............79.1 .............122.4 ...............57.8 ....................0 ....................0 ...............1.50 ................676 ..................763. 2002 .............8,233 .............3,009 .............5,225 ...............49.2 ...............43.5 ...............53.2 ....................0 ....................0 ...............1.50 .............2,408 ................1664. Totals ........XXX........ ........XXX........ ........XXX........ ........XXX........ ........XXX........ ........XXX........ ....................0 ....................0 ........XXX........ .............3,445 ................313

Annual Statement for the year 2002 of the TWIN CITY FIRE INSURANCE COMPANY
62
SCHEDULE P - PART 1J - AUTO PHYSICAL DAMAGE($000 omitted)
Premiums Earned Loss and Loss Expense Payments 12Years in Which 1 2 3 Defense and Cost Adjusting and Other 10 11 Number
Premiums Loss Payments Containment Payments Payments ofWere 4 5 6 7 8 9 Salvage Total Claims
Earned and Direct Direct Direct Direct and Net Paid Reported-Losses Were and Net and and and Subrogation (Cols. 4 - 5 + Direct and
Incurred Assumed Ceded (Cols. 1 - 2) Assumed Ceded Assumed Ceded Assumed Ceded Received 6 - 7 + 8 - 9) Assumed1. Prior....... ........XXX........ ........XXX........ ........XXX........ .............(41) ...............(2) ..............18 ................1 ..............53 ................0 ..............92 .................29 ......XXX......2. 2001..... ...........13,201 ................511 ...........12,690 ..........8,316 .............285 .............142 ................7 .............844 ................0 ..........1,621 ............9,010 .........6,5053. 2002..... ...........14,482 ................486 ...........13,995 ..........7,763 .............181 .............114 ................4 .............794 ................0 .............985 ............8,487 .........6,1304. Totals..... ........XXX........ ........XXX........ ........XXX........ ........16,038 .............464 .............274 ..............12 ..........1,690 ................0 ..........2,698 ..........17,526 ......XXX......
Adjusting and Other 23 24 25Losses Unpaid Defense and Cost Containment Unpaid Unpaid Total
Case Basis Bulk + IBNR Case Basis Bulk + IBNR 21 22 Net Number of13 14 15 16 17 18 19 20 Salvage Losses Claims
Direct Direct Direct Direct Direct and and Outstanding-and and and and and Subrogation Expenses Direct and
Assumed Ceded Assumed Ceded Assumed Ceded Assumed Ceded Assumed Ceded Anticipated Unpaid Assumed1. Prior... ..............46 ................5 .............(70) ................2 ..............10 ................0 ..............(1) ..............(0) ............144 ................0 ............106 ................121 ............4332. 2001.. ..............16 ................4 ..............14 ................4 ................4 ................0 ..............23 ................1 ..............44 ................0 ............150 ..................91 ................73. 2002.. ............882 ..............22 ............120 ..............18 ..............38 ................1 ..............10 ................1 ............155 ................0 ............978 .............1,163 ............3474. Totals. ............943 ..............31 ..............64 ..............24 ..............52 ................2 ..............32 ................2 ............343 ................0 .........1,234 .............1,375 ............787
34Total Losses and Loss and Loss Expense Percentage Nontabular Net Balance Sheet
Loss Expenses Incurred (Incurred/Premiums Earned) Discount Reserves after Discount26 27 28 29 30 31 32 33 Inter-Company 35 36
Direct Direct Pooling Lossand and Loss Participation Losses Expenses
Assumed Ceded Net Assumed Ceded Net Loss Expense Percentage Unpaid Unpaid1. Prior.. ........XXX........ ........XXX........ ........XXX........ ........XXX........ ........XXX........ ........XXX........ ....................0 ....................0 ........XXX........ .................(32) ................1532. 2001 .............9,402 ................301 .............9,101 ...............71.2 ...............58.9 ...............71.7 ....................0 ....................0 ...............1.50 ..................21 ..................703. 2002 .............9,875 ................226 .............9,649 ...............68.2 ...............46.4 ...............68.9 ....................0 ....................0 ...............1.50 ................962 ................2004. Totals ........XXX........ ........XXX........ ........XXX........ ........XXX........ ........XXX........ ........XXX........ ....................0 ....................0 ........XXX........ ................951 ................424

Annual Statement for the year 2002 of the TWIN CITY FIRE INSURANCE COMPANY
63
SCHEDULE P - PART 1K - FIDELITY/SURETY($000 omitted)
Premiums Earned Loss and Loss Expense Payments 12Years in Which 1 2 3 Defense and Cost Adjusting and Other 10 11 Number
Premiums Loss Payments Containment Payments Payments ofWere 4 5 6 7 8 9 Salvage Total Claims
Earned and Direct Direct Direct Direct and Net Paid Reported-Losses Were and Net and and and Subrogation (Cols. 4 - 5 + Direct and
Incurred Assumed Ceded (Cols. 1 - 2) Assumed Ceded Assumed Ceded Assumed Ceded Received 6 - 7 + 8 - 9) Assumed1. Prior....... ........XXX........ ........XXX........ ........XXX........ .............235 ..............58 ..............64 ..............14 ..............21 ................0 ..............80 ................248 ......XXX.......2. 2001..... .............2,320 ................349 .............1,971 .............522 ..............30 ..............59 ..............16 ..............28 ................0 ..............30 ................563 ......XXX.......3. 2002..... .............2,477 ................281 .............2,196 .............322 ..............41 ................8 ................0 ..............14 ................0 ................2 ................302 ......XXX.......4. Totals..... ........XXX........ ........XXX........ ........XXX........ ..........1,079 .............130 .............131 ..............31 ..............63 ................0 .............112 .............1,114 ......XXX.......
Adjusting and Other 23 24 25Losses Unpaid Defense and Cost Containment Unpaid Unpaid Total
Case Basis Bulk + IBNR Case Basis Bulk + IBNR 21 22 Net Number of13 14 15 16 17 18 19 20 Salvage Losses Claims
Direct Direct Direct Direct Direct and and Outstanding-and and and and and Subrogation Expenses Direct and
Assumed Ceded Assumed Ceded Assumed Ceded Assumed Ceded Assumed Ceded Anticipated Unpaid Assumed1. Prior..... ............404 ............107 .............(63) ..............(1) ............118 ..............59 ................6 ................2 ..............48 ................0 ............141 ................346 ................72. 2001... ............759 ............567 ..............60 ..............15 ............156 ..............87 ..............15 ................5 ..............14 ................0 ..............56 ................331 ................83. 2002... ............306 ..............53 ............457 ..............39 ..............95 ..............53 ..............36 ..............12 ..............21 ................0 ..............78 ................758 ..............164. Totals.. .........1,469 ............727 ............455 ..............53 ............369 ............199 ..............57 ..............19 ..............83 ................0 ............275 .............1,435 ..............30
34Total Losses and Loss and Loss Expense Percentage Nontabular Net Balance Sheet
Loss Expenses Incurred (Incurred/Premiums Earned) Discount Reserves after Discount26 27 28 29 30 31 32 33 Inter-Company 35 36
Direct Direct Pooling Lossand and Loss Participation Losses Expenses
Assumed Ceded Net Assumed Ceded Net Loss Expense Percentage Unpaid Unpaid1. Prior.. ........XXX........ ........XXX........ ........XXX........ ........XXX........ ........XXX........ ........XXX........ ....................0 ....................0 ........XXX........ ................235 ................1112. 2001 .............1,614 ................720 ................894 ...............69.6 .............206.4 ...............45.3 ....................0 ....................0 ...............1.50 ................238 ..................933. 2002 .............1,260 ................199 .............1,061 ...............50.9 ...............70.9 ...............48.3 ....................0 ....................0 ...............1.50 ................671 ..................874. Totals ........XXX........ ........XXX........ ........XXX........ ........XXX........ ........XXX........ ........XXX........ ....................0 ....................0 ........XXX........ .............1,144 ................291

Annual Statement for the year 2002 of the TWIN CITY FIRE INSURANCE COMPANY
64
SCHEDULE P - PART 1L - OTHER (INCLUDING CREDIT, ACCIDENT AND HEALTH)($000 omitted)
Premiums Earned Loss and Loss Expense Payments 12Years in Which 1 2 3 Defense and Cost Adjusting and Other 10 11 Number
Premiums Loss Payments Containment Payments Payments ofWere 4 5 6 7 8 9 Salvage Total Claims
Earned and Direct Direct Direct Direct and Net Paid Reported-Losses Were and Net and and and Subrogation (Cols. 4 - 5 + Direct and
Incurred Assumed Ceded (Cols. 1 - 2) Assumed Ceded Assumed Ceded Assumed Ceded Received 6 - 7 + 8 - 9) Assumed1. Prior....... ........XXX........ ........XXX........ ........XXX........ ................0 ................0 ................0 ................0 ................0 ................0 ................0 ...................0 ......XXX.......2. 2001..... ...................4 ...................0 ...................4 ................0 ................0 ................0 ................0 ................0 ................0 ................0 ...................0 ......XXX.......3. 2002..... ...................0 ...................0 ...................0 ................0 ................0 ................0 ................0 ................0 ................0 ................0 ...................0 ......XXX.......4. Totals..... ........XXX........ ........XXX........ ........XXX........ ................0 ................0 ................0 ................0 ................0 ................0 ................0 ...................0 ......XXX.......
Adjusting and Other 23 24 25Losses Unpaid Defense and Cost Containment Unpaid Unpaid Total
Case Basis Bulk + IBNR Case Basis Bulk + IBNR 21 22 Net Number of13 14 15 16 17 18 19 20 Salvage Losses Claims
Direct Direct Direct Direct Direct and and Outstanding-and and and and and Subrogation Expenses Direct and
Assumed Ceded Assumed Ceded Assumed Ceded Assumed Ceded Assumed Ceded Anticipated Unpaid Assumed1. Prior..... ................0 ................0 ................6 ................0 ................0 ................0 ................2 ................0 ................0 ................0 ................0 ....................7 ................02. 2001... ................0 ................0 ................5 ................0 ................0 ................0 ................2 ................0 ................0 ................0 ................0 ....................6 ................03. 2002... ................0 ................0 ................0 ................0 ................0 ................0 ................0 ................0 ................0 ................0 ................0 ....................0 ................04. Totals.. ................0 ................0 ..............10 ................0 ................0 ................0 ................4 ................0 ................0 ................0 ................0 ..................14 ................0
34Total Losses and Loss and Loss Expense Percentage Nontabular Net Balance Sheet
Loss Expenses Incurred (Incurred/Premiums Earned) Discount Reserves after Discount26 27 28 29 30 31 32 33 Inter-Company 35 36
Direct Direct Pooling Lossand and Loss Participation Losses Expenses
Assumed Ceded Net Assumed Ceded Net Loss Expense Percentage Unpaid Unpaid1. Prior.. ........XXX........ ........XXX........ ........XXX........ ........XXX........ ........XXX........ ........XXX........ ....................0 ....................0 ........XXX........ ....................6 ....................22. 2001 ....................6 ....................0 ....................6 .............176.1 .................0.0 .............176.1 ....................0 ....................0 ...............1.50 ....................5 ....................23. 2002 ....................0 ....................0 ....................0 .................0.0 .................0.0 .................0.0 ....................0 ....................0 ...............1.50 ....................0 ....................04. Totals ........XXX........ ........XXX........ ........XXX........ ........XXX........ ........XXX........ ........XXX........ ....................0 ....................0 ........XXX........ ..................10 ....................4

Annual Statement for the year 2002 of the TWIN CITY FIRE INSURANCE COMPANY
65
SCHEDULE P - PART 1M - INTERNATIONAL($000 omitted)
Premiums Earned Loss and Loss Expense Payments 12Years in Which 1 2 3 Defense and Cost Adjusting and Other 10 11 Number
Premiums Loss Payments Containment Payments Payments ofWere 4 5 6 7 8 9 Salvage Total Claims
Earned and Direct Direct Direct Direct and Net Paid Reported-Losses Were and Net and and and Subrogation (Cols. 4 - 5 + Direct and
Incurred Assumed Ceded (Cols. 1 - 2) Assumed Ceded Assumed Ceded Assumed Ceded Received 6 - 7 + 8 - 9) Assumed1. Prior....... .........XXX....... .........XXX....... .........XXX....... ................3 ................4 ................0 ................0 ................0 ................0 ................0 ..................(1) ......XXX.......2. 1993....... .............1,252 .................21 .............1,231 .............619 ..............20 ................3 ................0 ................5 ................0 ................0 ................607 ......XXX.......3. 1994....... .............1,394 .................75 .............1,319 .............509 .............(18) ................4 ................0 ................8 ................0 ................0 ................539 ......XXX.......4. 1995....... .............1,186 ...................2 .............1,184 .............549 ................2 ................1 ................0 ................9 ................0 ................0 ................557 ......XXX.......5. 1996....... .............1,066 ...................5 .............1,061 .............535 ................2 ................2 ................0 ................3 ................0 ................0 ................538 ......XXX.......6. 1997....... .............1,118 ...................5 .............1,113 .............573 ................1 ................2 ................0 ................6 ................0 ................0 ................580 ......XXX.......7. 1998....... .............1,029 ...................6 .............1,023 ..........1,260 ..............17 ................6 ...............(0) ................8 ................0 ................0 .............1,257 ......XXX.......8. 1999....... .............1,163 .................19 .............1,144 .............698 ................2 ................2 ................0 ..............11 ................0 ................0 ................709 ......XXX.......9. 2000....... .............1,163 .................74 .............1,089 .............512 ................2 ................2 ................0 ..............17 ................0 ................0 ................528 ......XXX.......
10. 2001....... ................995 ................317 ................678 .............539 ................0 ................3 ................0 ..............15 ................0 ................0 ................557 ......XXX.......11. 2002....... ................680 .................12 ................669 ..............67 ................0 ................1 ................0 ................3 ................0 ................0 .................70 ......XXX.......12. Totals..... .........XXX....... .........XXX....... .........XXX....... ..........5,863 ..............32 ..............24 ................0 ..............84 ................0 ................0 .............5,940 ......XXX.......
Adjusting and Other 23 24 25Losses Unpaid Defense and Cost Containment Unpaid Unpaid Total
Case Basis Bulk + IBNR Case Basis Bulk + IBNR 21 22 Net Number of13 14 15 16 17 18 19 20 Salvage Losses Claims
Direct Direct Direct Direct Direct and and Outstanding-and and and and and Subrogation Expenses Direct and
Assumed Ceded Assumed Ceded Assumed Ceded Assumed Ceded Assumed Ceded Anticipated Unpaid Assumed1. Prior..... .............(33) .............(65) ............254 ............254 ................0 ................0 ................0 ................0 ................0 ................0 ................0 ..................31 ................02. 1993.... ..............57 ..............45 ..............27 ..............27 ................0 ................0 ................0 ................0 ................0 ................0 ................0 ..................12 ................03. 1994.... ..............28 ..............13 ..............72 ..............72 ................0 ................0 ................0 ................0 ................0 ................0 ................0 ..................15 ................04. 1995.... ..............18 ................0 ................0 ................0 ................0 ................0 ................0 ................0 ................0 ................0 ................0 ..................18 ................05. 1996.... ..............16 ................0 ................1 ................1 ................0 ................0 ................0 ................0 ................0 ................0 ................0 ..................16 ................06. 1997.... ..............26 ................0 ................0 ................0 ................0 ................0 ................0 ................0 ................0 ................0 ................0 ..................26 ................07. 1998.... ..............35 ................1 ................0 ................0 ................0 ................0 ................2 ................0 ................0 ................0 ................0 ..................35 ................08. 1999.... ..............83 ..............10 ................0 ................0 ................0 ................0 ................1 ................0 ................0 ................0 ................0 ..................73 ................09. 2000.... ............220 ................0 ..............10 ................0 ................0 ................0 ................1 ................0 ................0 ................0 ................0 ................232 ................0
10. 2001.... ............203 ................0 ..............46 ................0 ................0 ................0 ................6 ................0 ................0 ................0 ................0 ................255 ................011. 2002.... ..............37 ................0 ............190 ................0 ................1 ................0 ................9 ................0 ................0 ................0 ................0 ................237 ................012. Totals.. ............689 ................5 ............600 ............354 ................1 ................0 ..............19 ................0 ................1 ................0 ................0 ................951 ................0
34Total Losses and Loss and Loss Expense Percentage Nontabular Net Balance Sheet
Loss Expenses Incurred (Incurred/Premiums Earned) Discount Reserves after Discount26 27 28 29 30 31 32 33 Inter-Company 35 36
Direct Direct Pooling Lossand and Loss Participation Losses Expenses
Assumed Ceded Net Assumed Ceded Net Loss Expense Percentage Unpaid Unpaid1. Prior.. ........XXX........ ........XXX........ ........XXX........ ........XXX........ ........XXX........ ........XXX........ ....................0 ....................0 ........XXX........ ..................31 ....................02. 1993. ................711 ..................92 ................619 ...............56.8 .............445.2 ...............50.3 ....................0 ....................0 ...............1.50 ..................12 ....................03. 1994. ................621 ..................67 ................554 ...............44.5 ...............89.2 ...............42.0 ....................0 ....................0 ...............1.50 ..................15 ....................04. 1995. ................577 ....................2 ................575 ...............48.7 .............100.6 ...............48.6 ....................0 ....................0 ...............1.50 ..................18 ....................05. 1996. ................556 ....................3 ................554 ...............52.2 ...............49.6 ...............52.2 ....................0 ....................0 ...............1.50 ..................16 ....................06. 1997. ................608 ....................1 ................606 ...............54.3 ...............24.3 ...............54.5 ....................0 ....................0 ...............1.50 ..................26 ....................07. 1998. .............1,310 ..................18 .............1,292 .............127.3 .............307.1 .............126.3 ....................0 ....................0 ...............1.50 ..................33 ....................28. 1999. ................794 ..................12 ................782 ...............68.3 ...............61.7 ...............68.4 ....................0 ....................0 ...............1.50 ..................73 ....................19. 2000. ................762 ....................2 ................760 ...............65.6 .................3.0 ...............69.8 ....................0 ....................0 ...............1.50 ................231 ....................1
10. 2001. ................812 ....................0 ................812 ...............81.7 .................0.0 .............119.8 ....................0 ....................0 ...............1.50 ................249 ....................611. 2002. ................307 ....................0 ................307 ...............45.1 .................0.0 ...............45.9 ....................0 ....................0 ...............1.50 ................227 ..................1012. Totals ........XXX........ ........XXX........ ........XXX........ ........XXX........ ........XXX........ ........XXX........ ....................0 ....................0 ........XXX........ ................930 ..................21

Annual Statement for the year 2002 of the TWIN CITY FIRE INSURANCE COMPANY
66
SCHEDULE P - PART 1N - REINSURANCENONPROPORTIONAL ASSUMED PROPERTY ($000 omitted)
Premiums Earned Loss and Loss Expense Payments 12Years in Which 1 2 3 Defense and Cost Adjusting and Other 10 11 Number
Premiums Loss Payments Containment Payments Payments ofWere 4 5 6 7 8 9 Salvage Total Claims
Earned and Direct Direct Direct Direct and Net Paid Reported-Losses Were and Net and and and Subrogation (Cols. 4 - 5 + Direct and
Incurred Assumed Ceded (Cols. 1 - 2) Assumed Ceded Assumed Ceded Assumed Ceded Received 6 - 7 + 8 - 9) Assumed1. Prior........ ........XXX........ ........XXX........ ........XXX........ ................8 ................0 ................0 ................0 ................0 ................0 ................0 ...................8 ......XXX......2. 1993........ .............1,830 ..................(8) .............1,838 .............603 ...............(4) ................2 ................0 ................5 ................0 ................0 ...............615 ......XXX......3. 1994........ .............1,823 .................15 .............1,808 .............927 ................5 ...............(0) ................0 ................5 ................0 ................0 ...............926 ......XXX......4. 1995........ .............2,189 ................225 .............1,964 .............882 ................0 ................0 ................0 ................5 ................0 ................0 ...............887 ......XXX......5. 1996........ .............1,952 ................347 .............1,605 .............830 ...............(1) ................0 ................0 ................7 ................0 ................0 ...............838 ......XXX......6. 1997........ .............1,781 ................298 .............1,483 .............813 ...............(3) ................2 ................0 ..............13 ................0 ................0 ...............830 ......XXX......7. 1998........ .............1,331 ..................(1) .............1,331 ..........1,569 .............368 ................0 ................0 ..............14 ................0 ................0 ............1,215 ......XXX......8. 1999........ .............1,788 ................292 .............1,496 ..........2,138 .............399 ..............13 ................0 ..............18 ................0 ................0 ............1,770 ......XXX......9. 2000........ .............2,704 ................715 .............1,989 ..........1,711 ..............70 ..............54 ................0 ..............24 ................0 ................0 ............1,720 ......XXX......
10. 2001........ .............3,623 .............1,416 .............2,207 ..........2,646 .............717 ..............24 ................0 ..............19 ................0 ................0 ............1,973 ......XXX......11. 2002........ .............3,721 ................471 .............3,250 .............264 ..............34 ................3 ................0 ..............15 ................0 ................0 ...............249 ......XXX......12. Totals...... .........XXX....... .........XXX....... .........XXX....... ........12,390 ..........1,585 ..............98 ................0 .............127 ................0 ................0 ..........11,029 ......XXX......
Adjusting and Other 23 24 25Losses Unpaid Defense and Cost Containment Unpaid Unpaid Total
Case Basis Bulk + IBNR Case Basis Bulk + IBNR 21 22 Net Number of13 14 15 16 17 18 19 20 Salvage Losses Claims
Direct Direct Direct Direct Direct and and Outstanding-and and and and and Subrogation Expenses Direct and
Assumed Ceded Assumed Ceded Assumed Ceded Assumed Ceded Assumed Ceded Anticipated Unpaid Assumed1. Prior..... ...............19 .................0 .................0 .................0 .................0 .................0 .................0 .................0 .................0 .................0 .................0 ...................19 ......XXX.......2. 1993.... .................8 .................0 .................0 .................0 .................0 .................0 .................0 .................0 .................0 .................0 .................0 .....................8 ......XXX.......3. 1994.... .............(26) .................4 .................0 .................0 ...............(0) .................0 .................0 .................0 .................0 .................0 .................0 ..................(30) ......XXX.......4. 1995.... ...............44 .................0 .................0 .................0 .................0 .................0 .................0 .................0 .................0 .................0 .................0 ...................44 ......XXX.......5. 1996.... .............(35) .................0 .................0 .................0 .................0 .................0 .................0 .................0 .................0 .................0 .................0 ..................(34) ......XXX.......6. 1997.... .............120 .................0 .................0 .................0 .................0 .................0 .................0 .................0 .................0 .................0 .................0 .................120 ......XXX.......7. 1998.... ...............28 ...............12 .................0 .................0 .................0 .................0 .................0 .................0 .................0 .................0 .................0 ...................16 ......XXX.......8. 1999.... .............374 .............525 ...............36 .................0 .................1 .................0 .................0 .................0 .................0 .................0 .................0 ................(114) ......XXX.......9. 2000.... .............505 ...............16 ...............38 .................0 .................6 .................0 .................0 .................0 .................0 .................0 .................0 .................533 ......XXX.......10. 2001.... ..........1,478 .............849 ..........2,072 .............312 .................9 .................0 .................0 .................0 .................1 .................0 .................0 ..............2,399 ......XXX.......11. 2002.... .............360 .................9 ..........1,079 .................3 .................9 .................0 .................0 .................0 .................3 .................0 .................0 ..............1,439 ......XXX.......12. Totals.. ..........2,878 ..........1,414 ..........3,224 .............316 ...............24 .................0 .................0 .................0 .................5 .................0 .................0 ..............4,401 ......XXX.......
34Total Losses and Loss and Loss Expense Percentage Nontabular Net Balance Sheet
Loss Expenses Incurred (Incurred/Premiums Earned) Discount Reserves after Discount26 27 28 29 30 31 32 33 Inter-Company 35 36
Direct Direct Pooling Lossand and Loss Participation Losses Expenses
Assumed Ceded Net Assumed Ceded Net Loss Expense Percentage Unpaid Unpaid1. Prior.. ........XXX........ ........XXX........ ........XXX........ ........XXX........ ........XXX........ ........XXX........ ....................0 ....................0 ........XXX........ ..................19 ....................02. 1993. ................619 ...................(4) ................623 ...............33.8 ...............51.4 ...............33.9 ....................0 ....................0 ...............1.50 ....................8 ....................03. 1994. ................905 ....................9 ................896 ...............49.6 ...............61.6 ...............49.5 ....................0 ....................0 ...............1.50 .................(30) ....................04. 1995. ................931 ....................0 ................931 ...............42.5 .................0.0 ...............47.4 ....................0 ....................0 ...............1.50 ..................44 ....................05. 1996. ................803 ...................(1) ................804 ...............41.1 ................(0.3) ...............50.1 ....................0 ....................0 ...............1.50 .................(35) ....................06. 1997. ................948 ...................(3) ................951 ...............53.2 ................(1.0) ...............64.1 ....................0 ....................0 ...............1.50 ................120 ....................07. 1998. .............1,611 ................381 .............1,231 .............121.1 .......(57,665.8) ...............92.4 ....................0 ....................0 ...............1.50 ..................16 ....................08. 1999. .............2,580 ................924 .............1,656 .............144.3 .............316.3 .............110.7 ....................0 ....................0 ...............1.50 ...............(115) ....................19. 2000. .............2,339 ..................86 .............2,253 ...............86.5 ...............12.0 .............113.2 ....................0 ....................0 ...............1.50 ................527 ....................6
10. 2001. .............6,250 .............1,878 .............4,372 .............172.5 .............132.7 .............198.1 ....................0 ....................0 ...............1.50 .............2,390 ....................911. 2002. .............1,733 ..................46 .............1,688 ...............46.6 .................9.7 ...............51.9 ....................0 ....................0 ...............1.50 .............1,427 ..................1212. Totals ........XXX........ ........XXX........ ........XXX........ ........XXX........ ........XXX........ ........XXX........ ....................0 ....................0 ........XXX........ .............4,372 ..................29

Annual Statement for the year 2002 of the TWIN CITY FIRE INSURANCE COMPANY
67
SCHEDULE P - PART 1O - REINSURANCENONPROPORTIONAL ASSUMED LIABILITY ($000 omitted)
Premiums Earned Loss and Loss Expense Payments 12Years in Which 1 2 3 Defense and Cost Adjusting and Other 10 11 Number
Premiums Loss Payments Containment Payments Payments ofWere 4 5 6 7 8 9 Salvage Total Claims
Earned and Direct Direct Direct Direct and Net Paid Reported-Losses Were and Net and and and Subrogation (Cols. 4 - 5 + Direct and
Incurred Assumed Ceded (Cols. 1 - 2) Assumed Ceded Assumed Ceded Assumed Ceded Received 6 - 7 + 8 - 9) Assumed1. Prior........ ........XXX........ ........XXX........ ........XXX........ .............773 .............763 ................0 ................0 ................1 ................0 ................0 .................10 ......XXX......2. 1993........ ................884 ..................(1) ................884 .............741 ................4 ................1 ................0 ................4 ................0 ................0 ...............741 ......XXX......3. 1994........ .............1,177 ..................(7) .............1,184 .............664 ................0 ...............(0) ................0 ................4 ................0 ................0 ...............668 ......XXX......4. 1995........ .............1,486 ................(26) .............1,512 .............805 .............(16) ................0 ................0 ................6 ................0 ................0 ...............827 ......XXX......5. 1996........ .............2,499 ................(10) .............2,508 .............688 ...............(1) ................1 ................0 ................8 ................0 ................0 ...............699 ......XXX......6. 1997........ .............1,988 ...................9 .............1,979 ..........1,035 ...............(0) ................3 ................0 ..............18 ................0 ................0 ............1,057 ......XXX......7. 1998........ .............2,255 .................17 .............2,238 ..........1,211 .............(11) ...............(0) ................0 ..............18 ................0 ................0 ............1,240 ......XXX......8. 1999........ .............2,290 ................433 .............1,856 ..........1,218 ...............(8) ................0 ................0 ..............19 ................0 ................0 ............1,244 ......XXX......9. 2000........ .............2,360 ...................6 .............2,353 .............631 ...............(5) ................0 ................0 ..............15 ................0 ................0 ...............651 ......XXX......
10. 2001........ .............2,244 .............3,706 ............(1,462) .............161 ...............(2) ................0 ................0 ..............14 ................0 ................0 ...............177 ......XXX......11. 2002........ .............1,411 ................111 .............1,300 ................3 ...............(6) ...............(0) ................0 ..............10 ................0 ................0 .................19 ......XXX......12. Totals...... .........XXX....... .........XXX....... .........XXX....... ..........7,930 .............718 ................5 ................0 .............117 ................0 ................0 ............7,333 ......XXX......
Adjusting and Other 23 24 25Losses Unpaid Defense and Cost Containment Unpaid Unpaid Total
Case Basis Bulk + IBNR Case Basis Bulk + IBNR 21 22 Net Number of13 14 15 16 17 18 19 20 Salvage Losses Claims
Direct Direct Direct Direct Direct and and Outstanding-and and and and and Subrogation Expenses Direct and
Assumed Ceded Assumed Ceded Assumed Ceded Assumed Ceded Assumed Ceded Anticipated Unpaid Assumed1. Prior..... ..........1,107 ..........1,025 ..........1,787 ..........1,754 .................0 .................0 .................0 .................0 .................1 .................0 .................0 .................116 ......XXX.......2. 1993.... .............128 .................0 ...............23 .................0 .................0 .................0 .................0 .................0 .................0 .................0 .................0 .................151 ......XXX.......3. 1994.... .............231 .................0 ...............38 .................0 ...............(0) .................0 .................0 .................0 .................0 .................0 .................0 .................269 ......XXX.......4. 1995.... .............323 .................0 .............102 .................0 .................0 .................0 .................0 .................0 .................0 .................0 .................0 .................425 ......XXX.......5. 1996.... .............433 .................0 .............164 .................0 .................0 .................0 .................0 .................0 .................1 .................0 .................0 .................598 ......XXX.......6. 1997.... .............690 ...............(0) .............274 .................0 .................0 .................0 .................0 .................0 .................1 .................0 .................0 .................965 ......XXX.......7. 1998.... ..........1,087 ...............(0) .............393 .................0 ...............(0) .................0 .................0 .................0 .................1 .................0 .................0 ..............1,482 ......XXX.......8. 1999.... ..........1,168 .............746 .............546 .................0 .................0 .................0 .................0 .................0 .................2 .................0 .................0 .................971 ......XXX.......9. 2000.... ..........1,467 ...............59 .............523 .................0 .................0 .................0 .................0 .................0 .................4 .................0 .................0 ..............1,935 ......XXX.......10. 2001.... ..........1,446 .............184 ..........1,075 .................0 .................0 .................0 .................0 .................0 .................9 .................0 .................0 ..............2,346 ......XXX.......11. 2002.... .............546 ...............(3) .............825 .................0 .................0 .................0 .................0 .................0 ...............23 .................0 .................0 ..............1,397 ......XXX.......12. Totals.. ..........8,627 ..........2,011 ..........5,749 ..........1,754 .................1 .................0 .................0 .................0 ...............43 .................0 .................0 ............10,654 ......XXX.......
34Total Losses and Loss and Loss Expense Percentage Nontabular Net Balance Sheet
Loss Expenses Incurred (Incurred/Premiums Earned) Discount Reserves after Discount26 27 28 29 30 31 32 33 Inter-Company 35 36
Direct Direct Pooling Lossand and Loss Participation Losses Expenses
Assumed Ceded Net Assumed Ceded Net Loss Expense Percentage Unpaid Unpaid1. Prior.. ........XXX........ ........XXX........ ........XXX........ ........XXX........ ........XXX........ ........XXX........ ....................0 ....................0 ........XXX........ ................115 ....................12. 1993. ................896 ....................4 ................892 .............101.4 ............(655.0) .............100.9 ....................0 ....................0 ...............1.50 ................150 ....................03. 1994. ................937 ....................0 ................937 ...............79.6 .................0.0 ...............79.1 ....................0 ....................0 ...............1.50 ................269 ....................04. 1995. .............1,236 .................(16) .............1,252 ...............83.2 ...............61.8 ...............82.8 ....................0 ....................0 ...............1.50 ................425 ....................05. 1996. .............1,295 ...................(1) .............1,296 ...............51.8 ...............14.6 ...............51.7 ....................0 ....................0 ...............1.50 ................597 ....................16. 1997. .............2,022 ...................(0) .............2,022 .............101.7 ................(0.5) .............102.2 ....................0 ....................0 ...............1.50 ................964 ....................17. 1998. .............2,711 .................(11) .............2,722 .............120.2 ..............(65.3) .............121.6 ....................0 ....................0 ...............1.50 .............1,480 ....................18. 1999. .............2,953 ................738 .............2,216 .............129.0 .............170.3 .............119.3 ....................0 ....................0 ...............1.50 ................969 ....................39. 2000. .............2,640 ..................54 .............2,586 .............111.9 .............863.8 .............109.9 ....................0 ....................0 ...............1.50 .............1,930 ....................4
10. 2001. .............2,705 ................183 .............2,523 .............120.5 .................4.9 ............(172.5) ....................0 ....................0 ...............1.50 .............2,337 ....................911. 2002. .............1,407 ...................(9) .............1,416 ...............99.7 ................(8.1) .............108.9 ....................0 ....................0 ...............1.50 .............1,374 ..................2312. Totals ........XXX........ ........XXX........ ........XXX........ ........XXX........ ........XXX........ ........XXX........ ....................0 ....................0 ........XXX........ ............10,610 ..................44

Annual Statement for the year 2002 of the TWIN CITY FIRE INSURANCE COMPANY
68
SCHEDULE P - PART 1P - REINSURANCENONPROPORTIONAL ASSUMED FINANCIAL LINES ($000 omitted)
Premiums Earned Loss and Loss Expense Payments 12Years in Which 1 2 3 Defense and Cost Adjusting and Other 10 11 Number
Premiums Loss Payments Containment Payments Payments ofWere 4 5 6 7 8 9 Salvage Total Claims
Earned and Direct Direct Direct Direct and Net Paid Reported-Losses Were and Net and and and Subrogation (Cols. 4 - 5 + Direct and
Incurred Assumed Ceded (Cols. 1 - 2) Assumed Ceded Assumed Ceded Assumed Ceded Received 6 - 7 + 8 - 9) Assumed1. Prior........ ........XXX........ ........XXX........ ........XXX........ ................0 ................0 ................0 ................0 ................0 ................0 ................0 ...................0 ......XXX......2. 1993........ ...................0 ...................0 ...................0 ................1 ................0 ................0 ................0 ................0 ................0 ................0 ...................1 ......XXX......3. 1994........ ...................0 ...................0 ...................0 ..............10 ................0 ................0 ................0 ...............(0) ................0 ................0 .................10 ......XXX......4. 1995........ ...................6 ...................0 ...................6 ...............(1) ...............(0) ................0 ................0 ...............(0) ................0 ................0 .................(1) ......XXX......5. 1996........ ...................6 ...................0 ...................6 ................3 ...............(1) ................0 ................0 ................0 ................0 ................0 ...................4 ......XXX......6. 1997........ ...................6 ...................0 ...................6 ..............38 ...............(5) ................0 ................0 ................0 ................0 ................0 .................44 ......XXX......7. 1998........ .................10 ...................0 .................10 .............184 ...............(0) ................0 ................0 ................0 ................0 ................0 ...............185 ......XXX......8. 1999........ ................100 ..................(2) ................102 .............228 ................0 ................0 ................0 ................1 ................0 ................0 ...............229 ......XXX......9. 2000........ ................181 ...................8 ................173 .............406 ................0 ................0 ................0 ................2 ................0 ................0 ...............408 ......XXX......
10. 2001........ ................149 ...................4 ................145 ..............19 ................0 ................0 ................0 ................1 ................0 ................0 .................21 ......XXX......11. 2002........ .................67 ...................8 .................59 ................0 ................0 ................0 ................0 ................0 ................0 ................0 ...................1 ......XXX......12. Totals...... .........XXX....... .........XXX....... .........XXX....... .............889 ...............(7) ................0 ................0 ................5 ................0 ................0 ...............901 ......XXX......
Adjusting and Other 23 24 25Losses Unpaid Defense and Cost Containment Unpaid Unpaid Total
Case Basis Bulk + IBNR Case Basis Bulk + IBNR 21 22 Net Number of13 14 15 16 17 18 19 20 Salvage Losses Claims
Direct Direct Direct Direct Direct and and Outstanding-and and and and and Subrogation Expenses Direct and
Assumed Ceded Assumed Ceded Assumed Ceded Assumed Ceded Assumed Ceded Anticipated Unpaid Assumed1. Prior..... .................0 .................0 .................0 .................0 .................0 .................0 .................0 .................0 .................0 .................0 .................0 .....................0 ......XXX.......2. 1993.... .................8 .................0 .................0 .................0 .................0 .................0 .................0 .................0 .................0 .................0 .................0 .....................8 ......XXX.......3. 1994.... .................6 .................0 .................0 .................0 .................0 .................0 .................0 .................0 .................0 .................0 .................0 .....................6 ......XXX.......4. 1995.... .................1 .................0 .................0 .................0 .................0 .................0 .................0 .................0 .................0 .................0 .................0 .....................1 ......XXX.......5. 1996.... .................3 ...............(0) .................0 .................0 .................0 .................0 .................0 .................0 .................0 .................0 .................0 .....................3 ......XXX.......6. 1997.... ...............57 ...............(1) .................0 .................0 .................0 .................0 .................0 .................0 .................0 .................0 .................0 ...................57 ......XXX.......7. 1998.... ...............32 ...............(2) .................0 .................0 .................0 .................0 .................0 .................0 .................0 .................0 .................0 ...................34 ......XXX.......8. 1999.... ...............46 .................0 .................0 .................0 .................0 .................0 .................0 .................0 .................0 .................0 .................0 ...................46 ......XXX.......9. 2000.... .............173 .................0 .................0 .................0 .................0 .................0 .................0 .................0 .................0 .................0 .................0 .................173 ......XXX.......10. 2001.... ...............39 .................0 .................0 .............(27) .................0 .................0 .................0 .................0 .................0 .................0 .................0 ...................66 ......XXX.......11. 2002.... .................2 .................0 ...............56 ...............27 .................0 .................0 .................0 .................0 .................0 .................0 .................0 ...................31 ......XXX.......12. Totals.. .............366 ...............(3) ...............56 .................0 .................0 .................0 .................0 .................0 .................0 .................0 .................0 .................425 ......XXX.......
34Total Losses and Loss and Loss Expense Percentage Nontabular Net Balance Sheet
Loss Expenses Incurred (Incurred/Premiums Earned) Discount Reserves after Discount26 27 28 29 30 31 32 33 Inter-Company 35 36
Direct Direct Pooling Lossand and Loss Participation Losses Expenses
Assumed Ceded Net Assumed Ceded Net Loss Expense Percentage Unpaid Unpaid1. Prior.. ........XXX........ ........XXX........ ........XXX........ ........XXX........ ........XXX........ ........XXX........ ....................0 ....................0 ........XXX........ ....................0 ....................02. 1993. ....................9 ....................0 ....................9 .................0.0 .................0.0 .................0.0 ....................0 ....................0 ...............1.50 ....................8 ....................03. 1994. ..................16 ....................0 ..................16 .................0.0 .................0.0 .................0.0 ....................0 ....................0 ...............1.50 ....................6 ....................04. 1995. ....................0 ...................(0) ....................1 .................4.7 .................0.0 .................8.9 ....................0 ....................0 ...............1.50 ....................1 ....................05. 1996. ....................6 ...................(1) ....................7 .............104.6 .................0.0 .............114.2 ....................0 ....................0 ...............1.50 ....................3 ....................06. 1997. ..................95 ...................(6) ................101 ..........1,610.3 .................0.0 ..........1,712.6 ....................0 ....................0 ...............1.50 ..................57 ....................07. 1998. ................216 ...................(3) ................219 ..........2,108.2 .........(2,434.6) ..........2,155.2 ....................0 ....................0 ...............1.50 ..................34 ....................08. 1999. ................275 ....................0 ................275 .............274.8 .................0.0 .............270.5 ....................0 ....................0 ...............1.50 ..................46 ....................09. 2000. ................581 ....................0 ................581 .............321.5 .................0.0 .............336.1 ....................0 ....................0 ...............1.50 ................173 ....................0
10. 2001. ..................60 .................(27) ..................86 ...............40.1 ............(617.8) ...............59.6 ....................0 ....................0 ...............1.50 ..................66 ....................011. 2002. ..................58 ..................27 ..................31 ...............86.3 .............349.2 ...............52.7 ....................0 ....................0 ...............1.50 ..................31 ....................012. Totals ........XXX........ ........XXX........ ........XXX........ ........XXX........ ........XXX........ ........XXX........ ....................0 ....................0 ........XXX........ ................425 ....................0

Annual Statement for the year 2002 of the TWIN CITY FIRE INSURANCE COMPANY
69
SCHEDULE P - PART 1R - SECTION 1 - PRODUCTS LIABILITY - OCCURRENCE($000 omitted)
Premiums Earned Loss and Loss Expense Payments 12Years in Which 1 2 3 Defense and Cost Adjusting and Other 10 11 Number
Premiums Loss Payments Containment Payments Payments ofWere 4 5 6 7 8 9 Salvage Total Claims
Earned and Direct Direct Direct Direct and Net Paid Reported-Losses Were and Net and and and Subrogation (Cols. 4 - 5 + Direct and
Incurred Assumed Ceded (Cols. 1 - 2) Assumed Ceded Assumed Ceded Assumed Ceded Received 6 - 7 + 8 - 9) Assumed1. Prior....... .........XXX....... .........XXX....... .........XXX....... .............290 .............184 .............377 .............247 ................1 ................0 ...............(0) ................237 ......XXX.......2. 1993....... ................701 ................136 ................565 .............345 ..............99 ..............96 ..............17 ..............34 ................0 ................8 ................360 ..............123. 1994....... ................856 .................23 ................834 .............243 ..............14 .............113 ................0 ..............28 ................0 ................1 ................369 ..............114. 1995....... ................968 .................29 ................939 .............232 ..............43 ..............62 ................4 ..............32 ................0 ................0 ................279 ..............105. 1996....... ................953 .................82 ................870 .............270 ..............50 ..............77 ..............22 ..............37 ................0 ................0 ................312 ..............126. 1997....... ................489 .................82 ................407 .............315 ..............20 ..............67 ................9 ..............30 ................0 ................0 ................383 ..............127. 1998....... ................649 ................120 ................529 .............127 ................5 ..............48 ................5 ..............37 ................0 ................0 ................203 ..............138. 1999....... ................659 ................120 ................540 ..............53 ..............26 ..............45 ..............13 ..............31 ................0 ................0 .................89 ..............139. 2000....... ................994 ................127 ................867 .............110 ..............26 ..............52 ................9 ..............28 ................0 ................0 ................155 ..............15
10. 2001....... ................717 .............1,298 ..............(581) ..............39 ................3 ..............15 ................2 ..............27 ................0 ................0 .................76 ..............1311. 2002....... ................860 ................270 ................589 ..............11 ................2 ................1 ................1 ..............22 ................0 ................0 .................31 ................812. Totals..... .........XXX....... .........XXX....... .........XXX....... ..........2,033 .............470 .............953 .............328 .............306 ................0 ................9 .............2,493 ......XXX.......
Adjusting and Other 23 24 25Losses Unpaid Defense and Cost Containment Unpaid Unpaid Total
Case Basis Bulk + IBNR Case Basis Bulk + IBNR 21 22 Net Number of13 14 15 16 17 18 19 20 Salvage Losses Claims
Direct Direct Direct Direct Direct and and Outstanding-and and and and and Subrogation Expenses Direct and
Assumed Ceded Assumed Ceded Assumed Ceded Assumed Ceded Assumed Ceded Anticipated Unpaid Assumed1. Prior..... .........1,356 .........1,183 ............410 ............271 .............(39) .............(49) ............177 ............164 ................3 ................0 ................0 ................339 ..............282. 1993.... ..............28 ..............15 ..............40 ................4 ................1 ..............(1) ................4 ................2 ................1 ................0 ................0 ..................53 ................13. 1994.... ..............20 ................0 ..............48 ................0 ................3 ..............(0) ................4 ................0 ................1 ................0 ................0 ..................76 ................14. 1995.... ..............12 ................0 ..............51 ................0 ................4 ..............(0) ................6 ................0 ................1 ................0 ................0 ..................73 ................15. 1996.... ..............14 ................4 ..............98 ................1 ................9 ..............(0) ..............14 ................1 ................1 ................0 ................0 ................130 ................16. 1997.... ..............24 ................5 ............168 ................2 ..............25 ..............(0) ..............38 ................1 ................2 ................0 ................0 ................249 ................17. 1998.... ..............40 ..............19 ............128 ................5 ..............17 ..............(1) ..............28 ................3 ................3 ................0 ................0 ................190 ................18. 1999.... ..............79 ..............40 ............131 ..............11 ................8 ..............(2) ..............20 ................6 ................4 ................0 ................0 ................188 ................19. 2000.... ..............68 ..............19 ............293 ................7 ..............26 ..............(1) ..............42 ................3 ................5 ................0 ................0 ................405 ................1
10. 2001.... ..............71 ..............18 ............382 ................6 ..............96 ..............(1) ............145 ................2 ................7 ................0 ................0 ................676 ................111. 2002.... ..............39 ..............15 ............379 ................5 ..............66 ..............(1) ............101 ................2 ..............12 ................0 ................0 ................576 ................212. Totals.. .........1,751 .........1,319 .........2,128 ............312 ............215 .............(55) ............580 ............183 ..............40 ................0 ................0 .............2,954 ..............37
34Total Losses and Loss and Loss Expense Percentage Nontabular Net Balance Sheet
Loss Expenses Incurred (Incurred/Premiums Earned) Discount Inter- Reserves after Discount26 27 28 29 30 31 32 33 Company 35 36
Direct Direct Pooling Lossand and Loss Participation Losses Expenses
Assumed Ceded Net Assumed Ceded Net Loss Expense Percentage Unpaid Unpaid1. Prior.. ........XXX........ ........XXX........ ........XXX........ ........XXX........ ........XXX........ ........XXX........ ....................0 ....................0 ........XXX........ ................312 ..................262. 1993. ................549 ................136 ................413 ...............78.2 ...............99.7 ...............73.0 ....................0 ....................0 ...............1.50 ..................49 ....................43. 1994. ................459 ..................14 ................444 ...............53.5 ...............62.3 ...............53.3 ....................0 ....................0 ...............1.50 ..................68 ....................84. 1995. ................400 ..................47 ................352 ...............41.3 .............160.0 ...............37.5 ....................0 ....................0 ...............1.50 ..................62 ..................115. 1996. ................520 ..................78 ................442 ...............54.5 ...............94.3 ...............50.8 ....................0 ....................0 ...............1.50 ................106 ..................236. 1997. ................668 ..................36 ................632 .............136.7 ...............44.0 .............155.2 ....................0 ....................0 ...............1.50 ................185 ..................647. 1998. ................428 ..................35 ................392 ...............65.9 ...............29.5 ...............74.2 ....................0 ....................0 ...............1.50 ................144 ..................468. 1999. ................372 ..................95 ................277 ...............56.4 ...............79.3 ...............51.3 ....................0 ....................0 ...............1.50 ................159 ..................299. 2000. ................623 ..................64 ................560 ...............62.7 ...............50.1 ...............64.6 ....................0 ....................0 ...............1.50 ................334 ..................71
10. 2001. ................783 ..................30 ................752 .............109.2 .................2.3 ............(129.4) ....................0 ....................0 ...............1.50 ................429 ................24711. 2002. ................631 ..................24 ................607 ...............73.4 .................8.9 .............103.0 ....................0 ....................0 ...............1.50 ................399 ................17712. Totals ........XXX........ ........XXX........ ........XXX........ ........XXX........ ........XXX........ ........XXX........ ....................0 ....................0 ........XXX........ .............2,248 ................706

Annual Statement for the year 2002 of the TWIN CITY FIRE INSURANCE COMPANY
70
SCHEDULE P - PART 1R - SECTION 2 - PRODUCTS LIABILITY - CLAIMS-MADE($000 omitted)
Premiums Earned Loss and Loss Expense Payments 12Years in Which 1 2 3 Defense and Cost Adjusting and Other 10 11 Number
Premiums Loss Payments Containment Payments Payments ofWere 4 5 6 7 8 9 Salvage Total Claims
Earned and Direct Direct Direct Direct and Net Paid Reported-Losses Were and Net and and and Subrogation (Cols. 4 - 5 + Direct and
Incurred Assumed Ceded (Cols. 1 - 2) Assumed Ceded Assumed Ceded Assumed Ceded Received 6 - 7 + 8 - 9) Assumed1. Prior....... .........XXX....... .........XXX....... .........XXX....... ................0 ................0 ................0 ...............(0) ................0 ................0 ................0 ...................0 ......XXX.......2. 1993....... .................29 ...................2 .................28 ..............17 ................0 ................1 ................0 ................1 ................0 ................0 .................19 ................03. 1994....... .................44 ...................2 .................42 ..............43 ..............60 ................7 ................1 ................2 ................0 ................0 ..................(9) ................04. 1995....... .................44 ...................3 .................40 ................3 ................0 ................0 ...............(0) ................1 ................0 ................0 ...................5 ................05. 1996....... .................45 ...................3 .................42 ................6 ................0 ................1 ................0 ................0 ................0 ................0 ...................8 ................06. 1997....... .................45 ...................5 .................40 ................8 .............(30) ................4 ...............(0) ................0 ................0 ................0 .................42 ................07. 1998....... .................45 ...................8 .................38 ................0 ................0 ................5 ................0 ................5 ................0 ................0 .................10 ................08. 1999....... .................37 ...................6 .................31 ................5 ................0 ................6 ................0 ................1 ................0 ................0 .................11 ................09. 2000....... .................32 ...................5 .................27 ................9 ................3 ................6 ................1 ................1 ................0 ................0 .................11 ................0
10. 2001....... .................33 ...................7 .................25 ................2 ................0 ................0 ................0 ................1 ................0 ................0 ...................3 ................011. 2002....... .................33 ...................5 .................28 ................0 ...............(0) ................0 ...............(0) ................2 ................0 ................0 ...................2 ................012. Totals..... .........XXX....... .........XXX....... .........XXX....... ..............93 ..............33 ..............31 ................1 ..............13 ................0 ................0 ................102 ......XXX.......
Adjusting and Other 23 24 25Losses Unpaid Defense and Cost Containment Unpaid Unpaid Total
Case Basis Bulk + IBNR Case Basis Bulk + IBNR 21 22 Net Number of13 14 15 16 17 18 19 20 Salvage Losses Claims
Direct Direct Direct Direct Direct and and Outstanding-and and and and and Subrogation Expenses Direct and
Assumed Ceded Assumed Ceded Assumed Ceded Assumed Ceded Assumed Ceded Anticipated Unpaid Assumed1. Prior..... ................0 ................0 ................0 ................0 ................0 ................0 ................0 ................0 ................0 ................0 ................0 ....................0 ................02. 1993.... ................0 ................0 ................0 ................0 ................0 ................0 ................0 ................0 ................0 ................0 ................0 ....................0 ................03. 1994.... ................0 ................0 ................0 ................0 ................0 ................0 ................0 ................0 ................0 ................0 ................0 ....................0 ................04. 1995.... ..............15 ................0 ................0 ................0 ................0 ................0 ................0 ................0 ................0 ................0 ................0 ..................15 ................05. 1996.... ................0 ................0 ................0 ................0 ................0 ................0 ................0 ................0 ................0 ................0 ................0 ....................0 ................06. 1997.... ................0 ................0 ................0 ................0 ................0 ................0 ................0 ................0 ................0 ................0 ................0 ....................0 ................07. 1998.... ................0 ................0 ................0 ................0 ................0 ................0 ................0 ................0 ................0 ................0 ................0 ....................0 ................08. 1999.... ................4 ................0 ................1 ................0 ................0 ................0 ................0 ................0 ................0 ................0 ................0 ....................5 ................09. 2000.... ................5 ................0 ................1 ................0 ..............19 ................0 ................1 ................0 ................0 ................0 ................0 ..................25 ................0
10. 2001.... ................0 ................0 ..............14 ................0 ................6 ................0 ................2 ................0 ................0 ................0 ................0 ..................21 ................011. 2002.... ................3 ..............(0) ..............31 ................1 ..............27 ................0 ................8 ................1 ................0 ................0 ................0 ..................68 ................012. Totals.. ..............27 ..............(0) ..............46 ................2 ..............51 ................0 ..............11 ................1 ................1 ................0 ................0 ................134 ................0
34Total Losses and Loss and Loss Expense Percentage Nontabular Net Balance Sheet
Loss Expenses Incurred (Incurred/Premiums Earned) Discount Inter- Reserves after Discount26 27 28 29 30 31 32 33 Company 35 36
Direct Direct Pooling Lossand and Loss Participation Losses Expenses
Assumed Ceded Net Assumed Ceded Net Loss Expense Percentage Unpaid Unpaid1. Prior.. ........XXX........ ........XXX........ ........XXX........ ........XXX........ ........XXX........ ........XXX........ ....................0 ....................0 ........XXX........ ....................0 ....................02. 1993. ..................20 ....................0 ..................19 ...............67.4 ...............21.9 ...............70.0 ....................0 ....................0 ...............1.50 ....................0 ....................03. 1994. ..................52 ..................61 ...................(9) .............118.8 ..........3,662.9 ..............(21.9) ....................0 ....................0 ...............1.50 ....................0 ....................04. 1995. ..................19 ...................(0) ..................20 ...............44.0 ..............(13.2) ...............48.6 ....................0 ....................0 ...............1.50 ..................15 ....................05. 1996. ....................8 ....................0 ....................8 ...............17.1 .................0.0 ...............18.3 ....................0 ....................0 ...............1.50 ....................0 ....................06. 1997. ..................12 .................(30) ..................42 ...............26.2 ............(649.5) .............103.5 ....................0 ....................0 ...............1.50 ....................0 ....................07. 1998. ..................11 ....................0 ..................11 ...............23.3 .................0.0 ...............28.0 ....................0 ....................0 ...............1.50 ....................0 ....................08. 1999. ..................16 ....................0 ..................16 ...............42.5 .................3.0 ...............49.8 ....................0 ....................0 ...............1.50 ....................5 ....................09. 2000. ..................41 ....................5 ..................37 .............128.2 ...............93.1 .............134.6 ....................0 ....................0 ...............1.50 ....................5 ..................20
10. 2001. ..................25 ....................0 ..................24 ...............76.0 .................6.1 ...............96.6 ....................0 ....................0 ...............1.50 ..................14 ....................811. 2002. ..................71 ....................1 ..................70 .............214.6 ...............27.5 .............249.1 ....................0 ....................0 ...............1.50 ..................33 ..................3512. Totals ........XXX........ ........XXX........ ........XXX........ ........XXX........ ........XXX........ ........XXX........ ....................0 ....................0 ........XXX........ ..................71 ..................63

Annual Statement for the year 2002 of the TWIN CITY FIRE INSURANCE COMPANY
71
SCHEDULE P - PART 1S - FINANCIAL GUARANTY/MORTGAGE GUARANTY($000 omitted)
Premiums Earned Loss and Loss Expense Payments 12Years in Which 1 2 3 Defense and Cost Adjusting and Other 10 11 Number
Premiums Loss Payments Containment Payments Payments ofWere 4 5 6 7 8 9 Salvage Total Claims
Earned and Direct Direct Direct Direct and Net Paid Reported-Losses Were and Net and and and Subrogation (Cols. 4 - 5 + Direct and
Incurred Assumed Ceded (Cols. 1 - 2) Assumed Ceded Assumed Ceded Assumed Ceded Received 6 - 7 + 8 - 9) Assumed1. Prior....... ........XXX........ ........XXX........ ........XXX........ ................0 ................0 ................0 ................0 ................0 ................0 ................0 ...................0 ......XXX.......2. 2001..... ...................0 ...................0 ...................0 ................0 ................0 ................0 ................0 ................0 ................0 ................0 ...................0 ......XXX.......3. 2002..... ...................0 ...................0 ...................0 ................0 ................0 ................0 ................0 ................0 ................0 ................0 ...................0 ......XXX.......4. Totals..... ........XXX........ ........XXX........ ........XXX........ ................0 ................0 ................0 ................0 ................0 ................0 ................0 ...................0 ......XXX.......
Adjusting and Other 23 24 25Losses Unpaid Defense and Cost Containment Unpaid Unpaid Total
Case Basis Bulk + IBNR Case Basis Bulk + IBNR 21 22 Net Number of13 14 15 16 17 18 19 20 Salvage Losses Claims
Direct Direct Direct Direct Direct and and Outstanding-and and and and and Subrogation Expenses Direct and
Assumed Ceded Assumed Ceded Assumed Ceded Assumed Ceded Assumed Ceded Anticipated Unpaid Assumed1. Prior..... ................0 ................0 ................0 ................0 ................0 ................0 ................0 ................0 ................0 ................0 ................0 ....................0 ................02. 2001... ................0 ................0 ................0 ................0 ................0 ................0 ................0 ................0 ................0 ................0 ................0 ....................0 ................03. 2002... ................0 ................0 ................0 ................0 ................0 ................0 ................0 ................0 ................0 ................0 ................0 ....................0 ................04. Totals.. ................0 ................0 ................0 ................0 ................0 ................0 ................0 ................0 ................0 ................0 ................0 ....................0 ................0
34Total Losses and Loss and Loss Expense Percentage Nontabular Net Balance Sheet
Loss Expenses Incurred (Incurred/Premiums Earned) Discount Reserves after Discount26 27 28 29 30 31 32 33 Inter-Company 35 36
Direct Direct Pooling Lossand and Loss Participation Losses Expenses
Assumed Ceded Net Assumed Ceded Net Loss Expense Percentage Unpaid Unpaid1. Prior.. ........XXX........ ........XXX........ ........XXX........ ........XXX........ ........XXX........ ........XXX........ ....................0 ....................0 ........XXX........ ....................0 ....................02. 2001 ....................0 ....................0 ....................0 .................0.0 .................0.0 .................0.0 ....................0 ....................0 ...............0.00 ....................0 ....................03. 2002 ....................0 ....................0 ....................0 .................0.0 .................0.0 .................0.0 ....................0 ....................0 ...............0.00 ....................0 ....................04. Totals ........XXX........ ........XXX........ ........XXX........ ........XXX........ ........XXX........ ........XXX........ ....................0 ....................0 ........XXX........ ....................0 ....................0
NONE

Annual Statement for the year 2002 of the TWIN CITY FIRE INSURANCE COMPANY
72
SCHEDULE P - PART 2A - HOMEOWNERS/FARMOWNERSIncurred Net Losses and Defense and Cost Containment Expenses Reported at Year End ($000 omitted) Development
Years in 1 2 3 4 5 6 7 8 9 10 11 12Which
Losses Were One TwoIncurred 1993 1994 1995 1996 1997 1998 1999 2000 2001 2002 Year Year
1. Prior..... ..............622 ..............588 ..............570 ..............645 ..............683 ..............704 ..............656 ..............638 ..............642 ..............655 ................12 ................162. 1993.... ...........3,484 ...........3,504 ...........3,501 ...........3,539 ...........3,548 ...........3,565 ...........3,548 ...........3,541 ...........3,543 ...........3,547 .................4 .................63. 1994.... .......XXX....... ...........4,349 ...........4,107 ...........4,163 ...........4,134 ...........4,185 ...........4,117 ...........4,110 ...........4,114 ...........4,122 .................8 ................124. 1995.... .......XXX....... .......XXX....... ...........4,238 ...........4,293 ...........4,314 ...........4,337 ...........4,290 ...........4,260 ...........4,276 ...........4,282 .................6 ................225. 1996.... .......XXX....... .......XXX....... .......XXX....... ...........5,940 ...........5,930 ...........5,955 ...........5,918 ...........5,900 ...........5,876 ...........5,878 .................2 ..............(22)6. 1997.... .......XXX....... .......XXX....... .......XXX....... .......XXX....... ...........4,141 ...........4,134 ...........4,034 ...........4,017 ...........4,021 ...........4,029 .................8 ................127. 1998.... .......XXX....... .......XXX....... .......XXX....... .......XXX....... .......XXX....... ...........4,139 ...........4,347 ...........4,467 ...........4,369 ...........4,390 ................21 ..............(77)8. 1999.... .......XXX....... .......XXX....... .......XXX....... .......XXX....... .......XXX....... .......XXX....... ...........4,849 ...........4,912 ...........4,753 ...........4,756 .................3 .............(156)9. 2000.... .......XXX....... .......XXX....... .......XXX....... .......XXX....... .......XXX....... .......XXX....... .......XXX....... ...........4,863 ...........5,022 ...........5,066 ................44 ..............204
10. 2001.... .......XXX....... .......XXX....... .......XXX....... .......XXX....... .......XXX....... .......XXX....... .......XXX....... .......XXX....... ...........5,575 ...........5,722 ..............147 .......XXX.......11. 2002.... .......XXX....... .......XXX....... .......XXX....... .......XXX....... .......XXX....... .......XXX....... .......XXX....... .......XXX....... .......XXX....... ...........5,623 .......XXX....... .......XXX.......
12. Totals ..............255 ................17
SCHEDULE P - PART 2B - PRIVATE PASSENGER AUTO LIABILITY/MEDICAL1. Prior..... ...........6,273 ...........5,878 ...........5,710 ...........5,639 ...........5,630 ...........5,592 ...........5,578 ...........5,726 ...........5,781 ...........5,804 ................23 ................782. 1993.... .........10,449 .........10,381 .........10,443 .........10,443 .........10,411 .........10,390 .........10,383 .........10,432 .........10,364 .........10,371 .................7 ..............(61)3. 1994.... .......XXX....... .........10,845 .........11,170 .........11,206 .........11,254 .........11,246 .........11,209 .........11,250 .........11,234 .........11,196 ..............(38) ..............(54)4. 1995.... .......XXX....... .......XXX....... .........10,782 .........10,760 .........10,868 .........10,829 .........10,769 .........10,727 .........10,720 .........10,657 ..............(63) ..............(71)5. 1996.... .......XXX....... .......XXX....... .......XXX....... .........11,158 .........11,204 .........11,044 .........10,910 .........10,781 .........10,792 .........10,747 ..............(45) ..............(34)6. 1997.... .......XXX....... .......XXX....... .......XXX....... .......XXX....... .........11,031 .........10,976 .........10,872 .........10,629 .........10,711 .........10,655 ..............(55) ................267. 1998.... .......XXX....... .......XXX....... .......XXX....... .......XXX....... .......XXX....... .........10,638 .........10,657 .........10,717 .........10,683 .........10,721 ................38 .................48. 1999.... .......XXX....... .......XXX....... .......XXX....... .......XXX....... .......XXX....... .......XXX....... .........11,459 .........11,381 .........11,319 .........11,378 ................59 ................(2)9. 2000.... .......XXX....... .......XXX....... .......XXX....... .......XXX....... .......XXX....... .......XXX....... .......XXX....... .........11,907 .........11,999 .........12,250 ..............251 ..............343
10. 2001.... .......XXX....... .......XXX....... .......XXX....... .......XXX....... .......XXX....... .......XXX....... .......XXX....... .......XXX....... .........13,163 .........13,267 ..............105 .......XXX.......11. 2002.... .......XXX....... .......XXX....... .......XXX....... .......XXX....... .......XXX....... .......XXX....... .......XXX....... .......XXX....... .......XXX....... .........14,969 .......XXX....... .......XXX.......
12. Totals ..............281 ..............230
SCHEDULE P - PART 2C - COMMERCIAL AUTO/TRUCK LIABILITY/MEDICAL1. Prior..... ...........5,656 ...........5,518 ...........5,426 ...........5,491 ...........5,490 ...........5,410 ...........5,164 ...........5,166 ...........5,082 ...........5,004 ..............(78) .............(162)2. 1993.... ...........4,067 ...........3,941 ...........3,873 ...........3,813 ...........3,807 ...........3,758 ...........3,683 ...........3,661 ...........3,665 ...........3,661 ................(4) .................13. 1994.... .......XXX....... ...........4,215 ...........4,278 ...........4,216 ...........4,106 ...........4,014 ...........3,897 ...........3,865 ...........3,832 ...........3,841 .................9 ..............(24)4. 1995.... .......XXX....... .......XXX....... ...........3,996 ...........4,004 ...........3,873 ...........3,762 ...........3,713 ...........3,700 ...........3,697 ...........3,691 ................(5) ................(8)5. 1996.... .......XXX....... .......XXX....... .......XXX....... ...........4,222 ...........4,153 ...........3,941 ...........3,814 ...........3,805 ...........3,716 ...........3,766 ................50 ..............(39)6. 1997.... .......XXX....... .......XXX....... .......XXX....... .......XXX....... ...........3,425 ...........3,301 ...........3,370 ...........3,343 ...........3,337 ...........3,412 ................74 ................697. 1998.... .......XXX....... .......XXX....... .......XXX....... .......XXX....... .......XXX....... ...........3,610 ...........3,726 ...........3,828 ...........3,934 ...........4,043 ..............109 ..............2158. 1999.... .......XXX....... .......XXX....... .......XXX....... .......XXX....... .......XXX....... .......XXX....... ...........4,652 ...........4,656 ...........4,744 ...........4,904 ..............160 ..............2479. 2000.... .......XXX....... .......XXX....... .......XXX....... .......XXX....... .......XXX....... .......XXX....... .......XXX....... ...........4,845 ...........4,807 ...........4,807 ................(0) ..............(38)
10. 2001.... .......XXX....... .......XXX....... .......XXX....... .......XXX....... .......XXX....... .......XXX....... .......XXX....... .......XXX....... ...........4,694 ...........4,619 ..............(75) .......XXX.......11. 2002.... .......XXX....... .......XXX....... .......XXX....... .......XXX....... .......XXX....... .......XXX....... .......XXX....... .......XXX....... .......XXX....... ...........4,273 .......XXX....... .......XXX.......
12. Totals ..............239 ..............261
SCHEDULE P - PART 2D - WORKERS' COMPENSATION1. Prior..... .........34,171 .........36,502 .........37,492 .........39,618 .........39,408 .........39,356 .........39,228 .........39,208 .........37,582 .........37,780 ..............197 ..........(1,428)2. 1993.... .........13,168 .........12,271 .........12,178 .........11,525 .........11,339 .........10,931 .........11,049 .........11,168 .........11,038 .........10,780 .............(258) .............(388)3. 1994.... .......XXX....... .........11,282 .........11,689 .........11,682 .........11,746 .........11,542 .........11,593 .........11,567 .........11,507 .........11,550 ................43 ..............(17)4. 1995.... .......XXX....... .......XXX....... .........12,181 .........11,726 .........11,540 .........11,365 .........11,403 .........11,424 .........11,416 .........11,455 ................39 ................315. 1996.... .......XXX....... .......XXX....... .......XXX....... .........11,258 .........11,265 .........11,137 .........11,097 .........10,945 .........11,000 .........11,113 ..............112 ..............1686. 1997.... .......XXX....... .......XXX....... .......XXX....... .......XXX....... .........11,578 .........11,535 .........11,436 .........11,412 .........11,591 .........11,947 ..............356 ..............5357. 1998.... .......XXX....... .......XXX....... .......XXX....... .......XXX....... .......XXX....... .........12,039 .........11,852 .........11,935 .........12,900 .........13,058 ..............158 ...........1,1228. 1999.... .......XXX....... .......XXX....... .......XXX....... .......XXX....... .......XXX....... .......XXX....... .........10,584 .........10,677 .........11,661 .........12,176 ..............516 ...........1,4999. 2000.... .......XXX....... .......XXX....... .......XXX....... .......XXX....... .......XXX....... .......XXX....... .......XXX....... ...........9,176 .........10,062 .........10,403 ..............341 ...........1,227
10. 2001.... .......XXX....... .......XXX....... .......XXX....... .......XXX....... .......XXX....... .......XXX....... .......XXX....... .......XXX....... .........13,128 .........13,847 ..............719 .......XXX.......11. 2002.... .......XXX....... .......XXX....... .......XXX....... .......XXX....... .......XXX....... .......XXX....... .......XXX....... .......XXX....... .......XXX....... .........12,561 .......XXX....... .......XXX.......
12. Totals ...........2,224 ...........2,750
SCHEDULE P - PART 2E - COMMERCIAL MULTIPLE PERIL1. Prior..... ...........8,907 ...........9,484 ...........8,854 ...........8,981 ...........9,018 ...........9,009 ...........9,111 ...........8,990 ...........8,386 ...........8,133 .............(253) .............(857)2. 1993.... ...........7,405 ...........6,799 ...........6,729 ...........7,108 ...........7,006 ...........7,258 ...........7,227 ...........7,130 ...........6,991 ...........7,010 ................19 .............(121)3. 1994.... .......XXX....... ...........8,508 ...........8,552 ...........8,292 ...........8,251 ...........8,135 ...........7,843 ...........7,847 ...........7,656 ...........7,753 ................97 ..............(93)4. 1995.... .......XXX....... .......XXX....... ...........8,901 ...........8,435 ...........8,389 ...........8,270 ...........7,888 ...........7,732 ...........7,532 ...........7,555 ................23 .............(177)5. 1996.... .......XXX....... .......XXX....... .......XXX....... ...........9,674 ...........9,085 ...........9,093 ...........8,855 ...........8,545 ...........8,400 ...........8,562 ..............162 ................176. 1997.... .......XXX....... .......XXX....... .......XXX....... .......XXX....... ...........8,431 ...........8,455 ...........8,485 ...........7,940 ...........7,879 ...........8,048 ..............169 ..............1087. 1998.... .......XXX....... .......XXX....... .......XXX....... .......XXX....... .......XXX....... ...........9,428 ...........9,536 ...........9,383 ...........9,155 ...........9,271 ..............116 .............(112)8. 1999.... .......XXX....... .......XXX....... .......XXX....... .......XXX....... .......XXX....... .......XXX....... .........10,403 .........10,465 ...........9,928 .........10,242 ..............314 .............(223)9. 2000.... .......XXX....... .......XXX....... .......XXX....... .......XXX....... .......XXX....... .......XXX....... .......XXX....... ...........9,844 .........10,140 .........10,213 ................73 ..............369
10. 2001.... .......XXX....... .......XXX....... .......XXX....... .......XXX....... .......XXX....... .......XXX....... .......XXX....... .......XXX....... .........12,187 .........12,355 ..............168 .......XXX.......11. 2002.... .......XXX....... .......XXX....... .......XXX....... .......XXX....... .......XXX....... .......XXX....... .......XXX....... .......XXX....... .......XXX....... ...........9,697 .......XXX....... .......XXX.......
12. Totals ..............887 ..........(1,090)

Annual Statement for the year 2002 of the TWIN CITY FIRE INSURANCE COMPANY
73
SCHEDULE P - PART 2F - SECTION 1 - MEDICAL MALPRACTICE - OCCURRENCEIncurred Net Losses and Defense and Cost Containment Expenses Reported at Year End ($000 omitted) Development
Years in 1 2 3 4 5 6 7 8 9 10 11 12Which
Losses Were One TwoIncurred 1993 1994 1995 1996 1997 1998 1999 2000 2001 2002 Year Year
1. Prior..... ..............696 ..............553 ..............525 ..............514 ..............548 ..............647 ..............724 ..............733 ..............738 ..............717 ..............(21) ..............(16)2. 1993.... ................58 .................6 .................8 .................5 .................5 .................6 .................2 .................1 .................1 .................1 ................(0) ................(1)3. 1994.... .......XXX....... .................0 .................0 .................6 .................1 .................3 .................2 .................1 .................1 .................1 ................(0) ................(0)4. 1995.... .......XXX....... .......XXX....... .................1 .................0 .................6 .................4 .................5 .................3 .................3 .................3 ................(1) ................(0)5. 1996.... .......XXX....... .......XXX....... .......XXX....... .................2 .................4 .................5 .................4 ................(2) ................(1) ................(2) ................(1) ................(1)6. 1997.... .......XXX....... .......XXX....... .......XXX....... .......XXX....... .................2 ................12 .................7 .................3 .................3 .................3 ................(0) ................(1)7. 1998.... .......XXX....... .......XXX....... .......XXX....... .......XXX....... .......XXX....... ................41 ................10 .................9 ................11 ................10 ................(1) .................18. 1999.... .......XXX....... .......XXX....... .......XXX....... .......XXX....... .......XXX....... .......XXX....... .................7 .................1 .................2 ................11 .................8 ................109. 2000.... .......XXX....... .......XXX....... .......XXX....... .......XXX....... .......XXX....... .......XXX....... .......XXX....... .................2 .................2 .................4 .................3 .................2
10. 2001.... .......XXX....... .......XXX....... .......XXX....... .......XXX....... .......XXX....... .......XXX....... .......XXX....... .......XXX....... .................1 ................14 ................13 .......XXX.......11. 2002.... .......XXX....... .......XXX....... .......XXX....... .......XXX....... .......XXX....... .......XXX....... .......XXX....... .......XXX....... .......XXX....... .................5 .......XXX....... .......XXX.......
12. Totals ................(1) ................(5)
SCHEDULE P - PART 2F - SECTION 2 - MEDICAL MALPRACTICE - CLAIMS-MADE1. Prior..... ..............368 ..............356 ..............333 ..............371 ..............443 ..............424 ..............368 ..............400 ..............378 ..............366 ..............(12) ..............(34)2. 1993.... ..............212 ..............159 ..............162 ..............146 ..............177 ..............164 ..............156 ..............160 ..............156 ..............153 ................(3) ................(7)3. 1994.... .......XXX....... ..............188 ..............186 ..............189 ..............189 ..............180 ..............165 ..............154 ..............152 ..............150 ................(1) ................(3)4. 1995.... .......XXX....... .......XXX....... ..............203 ..............182 ..............182 ..............178 ..............165 ..............158 ..............156 ..............159 .................3 .................15. 1996.... .......XXX....... .......XXX....... .......XXX....... ..............207 ..............214 ..............265 ..............236 ..............220 ..............216 ..............226 ................10 .................76. 1997.... .......XXX....... .......XXX....... .......XXX....... .......XXX....... ..............186 ..............193 ..............184 ..............153 ..............154 ..............154 .................0 .................17. 1998.... .......XXX....... .......XXX....... .......XXX....... .......XXX....... .......XXX....... ..............187 ..............194 ..............220 ..............224 ..............231 .................7 ................118. 1999.... .......XXX....... .......XXX....... .......XXX....... .......XXX....... .......XXX....... .......XXX....... ................44 ................40 ................38 ................34 ................(4) ................(6)9. 2000.... .......XXX....... .......XXX....... .......XXX....... .......XXX....... .......XXX....... .......XXX....... .......XXX....... 0................... .................0 .................0 ................(0) .................0
10. 2001.... .......XXX....... .......XXX....... .......XXX....... .......XXX....... .......XXX....... .......XXX....... .......XXX....... .......XXX....... .................0 .................0 .................0 .......XXX.......11. 2002.... .......XXX....... .......XXX....... .......XXX....... .......XXX....... .......XXX....... .......XXX....... .......XXX....... .......XXX....... .......XXX....... ................34 .......XXX....... .......XXX.......
12. Totals .................0 ..............(32)
SCHEDULE P - PART 2G - SPECIAL LIABILITY (OCEAN MARINE, AIRCRAFT (ALL PERILS), BOILER & MACHINERY)
1. Prior..... ..............364 ..............242 ..............278 ..............232 ..............293 ..............285 ..............344 ..............331 ..............317 ..............331 ................14 ................(0)2. 1993.... ..............301 ..............285 ..............356 ..............349 ..............350 ..............346 ..............349 ..............344 ..............338 ..............339 .................0 ................(5)3. 1994.... .......XXX....... ..............357 ..............335 ..............337 ..............341 ..............339 ..............337 ..............330 ..............326 ..............327 .................1 ................(3)4. 1995.... .......XXX....... .......XXX....... ..............372 ..............346 ..............366 ..............360 ..............368 ..............367 ..............365 ..............365 ................(0) ................(2)5. 1996.... .......XXX....... .......XXX....... .......XXX....... ..............531 ..............442 ..............433 ..............463 ..............467 ..............471 ..............471 ................(0) .................46. 1997.... .......XXX....... .......XXX....... .......XXX....... .......XXX....... ..............529 ..............531 ..............559 ..............589 ..............586 ..............581 ................(6) ................(8)7. 1998.... .......XXX....... .......XXX....... .......XXX....... .......XXX....... .......XXX....... ..............611 ..............768 ..............798 ..............818 ..............804 ..............(14) .................78. 1999.... .......XXX....... .......XXX....... .......XXX....... .......XXX....... .......XXX....... .......XXX....... ..............546 ..............600 ..............597 ..............594 ................(3) ................(6)9. 2000.... .......XXX....... .......XXX....... .......XXX....... .......XXX....... .......XXX....... .......XXX....... .......XXX....... ..............438 ..............612 ..............634 ................22 ..............197
10. 2001.... .......XXX....... .......XXX....... .......XXX....... .......XXX....... .......XXX....... .......XXX....... .......XXX....... .......XXX....... ..............404 ..............444 ................41 .......XXX.......11. 2002.... .......XXX....... .......XXX....... .......XXX....... .......XXX....... .......XXX....... .......XXX....... .......XXX....... .......XXX....... .......XXX....... ..............521 .......XXX....... .......XXX.......
12. Totals ................56 ..............183
SCHEDULE P - PART 2H - SECTION 1 - OTHER LIABILITY - OCCURRENCE1. Prior..... .........21,335 .........20,819 .........21,286 .........23,730 .........23,709 .........23,680 .........23,833 .........23,601 .........18,278 .........18,144 .............(135) ..........(5,458)2. 1993.... ...........3,545 ...........3,274 ...........3,277 ...........3,004 ...........3,101 ...........3,128 ...........3,076 ...........2,986 ...........2,953 ...........2,656 .............(297) .............(330)3. 1994.... .......XXX....... ...........3,810 ...........4,271 ...........4,187 ...........4,136 ...........4,163 ...........4,531 ...........4,018 ...........3,949 ...........3,870 ..............(79) .............(148)4. 1995.... .......XXX....... .......XXX....... ...........3,818 ...........3,789 ...........4,066 ...........4,056 ...........3,701 ...........3,643 ...........3,609 ...........3,493 .............(116) .............(150)5. 1996.... .......XXX....... .......XXX....... .......XXX....... ...........3,689 ...........3,940 ...........3,904 ...........4,197 ...........4,021 ...........3,972 ...........4,106 ..............134 ................856. 1997.... .......XXX....... .......XXX....... .......XXX....... .......XXX....... ...........5,133 ...........4,865 ...........4,313 ...........4,063 ...........4,317 ...........4,271 ..............(46) ..............2087. 1998.... .......XXX....... .......XXX....... .......XXX....... .......XXX....... .......XXX....... ...........4,568 ...........3,813 ...........3,850 ...........4,182 ...........4,558 ..............375 ..............7088. 1999.... .......XXX....... .......XXX....... .......XXX....... .......XXX....... .......XXX....... .......XXX....... ...........3,995 ...........4,122 ...........4,222 ...........4,391 ..............169 ..............2699. 2000.... .......XXX....... .......XXX....... .......XXX....... .......XXX....... .......XXX....... .......XXX....... .......XXX....... ...........4,402 ...........4,252 ...........4,372 ..............119 ..............(30)
10. 2001.... .......XXX....... .......XXX....... .......XXX....... .......XXX....... .......XXX....... .......XXX....... .......XXX....... .......XXX....... ...........4,665 ...........4,848 ..............183 .......XXX.......11. 2002.... .......XXX....... .......XXX....... .......XXX....... .......XXX....... .......XXX....... .......XXX....... .......XXX....... .......XXX....... .......XXX....... ...........3,991 .......XXX....... .......XXX.......
12. Totals ..............308 ..........(4,846)
SCHEDULE P - PART 2H - SECTION 2 - OTHER LIABILITY - CLAIMS-MADE1. Prior..... ..............195 ..............225 ..............252 ..............294 ..............372 ..............421 ..............308 ..............306 ..............306 ..............305 ................(1) ................(0)2. 1993.... ..............152 ..............305 ..............356 ..............368 ..............460 ..............436 ..............389 ..............388 ..............384 ..............382 ................(3) ................(6)3. 1994.... .......XXX....... ..............658 ..............461 ..............407 ..............457 ..............431 ..............361 ..............360 ..............363 ..............363 ................(0) .................34. 1995.... .......XXX....... .......XXX....... ..............651 ..............463 ..............446 ..............373 ..............336 ..............348 ..............355 ..............351 ................(4) .................35. 1996.... .......XXX....... .......XXX....... .......XXX....... ..............572 ..............419 ..............278 ..............248 ..............250 ..............260 ..............259 ................(1) .................96. 1997.... .......XXX....... .......XXX....... .......XXX....... .......XXX....... ..............501 ..............465 ..............348 ..............407 ..............409 ..............405 ................(5) ................(3)7. 1998.... .......XXX....... .......XXX....... .......XXX....... .......XXX....... .......XXX....... ..............409 ..............551 ..............519 ..............529 ..............505 ..............(24) ..............(13)8. 1999.... .......XXX....... .......XXX....... .......XXX....... .......XXX....... .......XXX....... .......XXX....... ..............615 ..............588 ..............615 ..............623 .................8 ................359. 2000.... .......XXX....... .......XXX....... .......XXX....... .......XXX....... .......XXX....... .......XXX....... .......XXX....... ..............946 ..............885 ...........1,024 ..............139 ................77
10. 2001.... .......XXX....... .......XXX....... .......XXX....... .......XXX....... .......XXX....... .......XXX....... .......XXX....... .......XXX....... ...........1,533 ...........1,475 ..............(58) .......XXX.......11. 2002.... .......XXX....... .......XXX....... .......XXX....... .......XXX....... .......XXX....... .......XXX....... .......XXX....... .......XXX....... .......XXX....... ...........2,028 .......XXX....... .......XXX.......
12. Totals ................53 ..............106

Annual Statement for the year 2002 of the TWIN CITY FIRE INSURANCE COMPANY
74
SCHEDULE P - PART 2I - SPECIAL PROPERTY (FIRE, ALLIED LINES, INLAND MARINE,EARTHQUAKE, BURGLARY AND THEFT)
Incurred Net Losses and Defense and Cost Containment Expenses Reported at Year End ($000 omitted) Development1 2 3 4 5 6 7 8 9 10 11 12
Years inWhich
Losses Were One TwoIncurred 1993 1994 1995 1996 1997 1998 1999 2000 2001 2002 Year Year
1. Prior..... ......XXX........ ......XXX........ ......XXX........ ......XXX........ ......XXX........ ......XXX........ ......XXX........ ...........2,337 ...........2,481 ...........2,321 .............(160) ..............(16)2. 2001.... ......XXX........ ......XXX........ ......XXX........ ......XXX........ ......XXX........ ......XXX........ ......XXX........ ......XXX........ ...........4,965 ...........4,922 ..............(42) ......XXX........3. 2002.... ......XXX........ ......XXX........ ......XXX........ ......XXX........ ......XXX........ ......XXX........ ......XXX........ ......XXX........ ......XXX........ ...........4,926 ......XXX........ ......XXX........
4. Totals .............(202) ..............(16)
SCHEDULE P - PART 2J - AUTO PHYSICAL DAMAGE1. Prior..... ......XXX........ ......XXX........ ......XXX........ ......XXX........ ......XXX........ ......XXX........ ......XXX........ ...........1,004 ..............517 ..............473 ..............(44) .............(531)2. 2001.... ......XXX........ ......XXX........ ......XXX........ ......XXX........ ......XXX........ ......XXX........ ......XXX........ ......XXX........ ...........8,928 ...........8,214 .............(715) ......XXX........3. 2002.... ......XXX........ ......XXX........ ......XXX........ ......XXX........ ......XXX........ ......XXX........ ......XXX........ ......XXX........ ......XXX........ ...........8,700 ......XXX........ ......XXX........
4. Totals .............(759) .............(531)
SCHEDULE P - PART 2K - FIDELITY/SURETY1. Prior..... ......XXX........ ......XXX........ ......XXX........ ......XXX........ ......XXX........ ......XXX........ ......XXX........ ...........1,105 ...........1,026 ...........1,163 ..............137 ................582. 2001.... ......XXX........ ......XXX........ ......XXX........ ......XXX........ ......XXX........ ......XXX........ ......XXX........ ......XXX........ ..............941 ..............851 ..............(90) ......XXX........3. 2002.... ......XXX........ ......XXX........ ......XXX........ ......XXX........ ......XXX........ ......XXX........ ......XXX........ ......XXX........ ......XXX........ ...........1,026 ......XXX........ ......XXX........
4. Totals ................47 ................58
SCHEDULE P - PART 2L - OTHER (INCLUDING CREDIT, ACCIDENT AND HEALTH)1. Prior..... ......XXX........ ......XXX........ ......XXX........ ......XXX........ ......XXX........ ......XXX........ ......XXX........ .................7 .................4 .................7 .................4 .................02. 2001.... ......XXX........ ......XXX........ ......XXX........ ......XXX........ ......XXX........ ......XXX........ ......XXX........ ......XXX........ .................5 .................6 .................1 ......XXX........3. 2002.... ......XXX........ ......XXX........ ......XXX........ ......XXX........ ......XXX........ ......XXX........ ......XXX........ ......XXX........ ......XXX........ .................0 ......XXX........ ......XXX........
4. Totals .................5 .................0
SCHEDULE P - PART 2M - INTERNATIONAL1. Prior..... ..............744 ...........1,116 ...........1,015 ...........1,324 ...........1,302 ...........1,205 ...........1,048 ..............949 ..............881 ..............879 ................(2) ..............(70)2. 1993.... ..............296 ..............707 ..............711 ..............704 ..............759 ..............674 ..............687 ..............694 ..............614 ..............614 ................(0) ..............(80)3. 1994.... ......XXX........ ..............379 ..............537 ..............689 ..............807 ..............672 ..............661 ..............649 ..............543 ..............546 .................3 .............(103)4. 1995.... ......XXX........ ......XXX........ ..............640 ..............857 ..............636 ..............600 ..............568 ..............555 ..............559 ..............566 .................6 ................105. 1996.... ......XXX........ ......XXX........ ......XXX........ ..............285 ..............575 ..............647 ..............596 ..............562 ..............555 ..............551 ................(3) ..............(11)6. 1997.... ......XXX........ ......XXX........ ......XXX........ ......XXX........ ..............390 ..............674 ..............663 ..............609 ..............598 ..............600 .................2 ................(9)7. 1998.... ......XXX........ ......XXX........ ......XXX........ ......XXX........ ......XXX........ ..............590 ...........1,140 ...........1,189 ...........1,283 ...........1,284 .................1 ................958. 1999.... ......XXX........ ......XXX........ ......XXX........ ......XXX........ ......XXX........ ......XXX........ ..............401 ..............731 ..............754 ..............771 ................17 ................409. 2000.... ......XXX........ ......XXX........ ......XXX........ ......XXX........ ......XXX........ ......XXX........ ......XXX........ ..............501 ..............674 ..............743 ................69 ..............242
10. 2001.... ......XXX........ ......XXX........ ......XXX........ ......XXX........ ......XXX........ ......XXX........ ......XXX........ ......XXX........ ..............612 ..............797 ..............185 ......XXX........11. 2002.... ......XXX........ ......XXX........ ......XXX........ ......XXX........ ......XXX........ ......XXX........ ......XXX........ ......XXX........ ......XXX........ ..............304 ......XXX........ ......XXX........
12. Totals ..............277 ..............114

Annual Statement for the year 2002 of the TWIN CITY FIRE INSURANCE COMPANY
75
SCHEDULE P - PART 2N - REINSURANCENONPROPORTIONAL ASSUMED PROPERTY
Incurred Net Losses and Defense and Cost Containment Expenses Reported at Year End ($000 omitted) Development1 2 3 4 5 6 7 8 9 10 11 12
Years inWhich
Losses Were One TwoIncurred 1993 1994 1995 1996 1997 1998 1999 2000 2001 2002 Year Year
1. Prior..... ..............426 ..............643 ..............550 ..............494 ..............464 ..............461 ..............449 ..............495 ..............556 ..............566 ................10 ................712. 1993.... ..............838 ..............685 ..............651 ..............677 ..............658 ..............637 ..............629 ..............617 ..............616 ..............617 .................1 ................(0)3. 1994.... .......XXX....... ...........1,175 ...........1,042 ..............949 ..............930 ..............937 ..............937 ..............938 ..............939 ..............891 ..............(48) ..............(47)4. 1995.... .......XXX....... .......XXX....... ...........1,091 ...........1,078 ..............945 ..............951 ..............952 ..............914 ..............913 ..............926 ................13 ................125. 1996.... .......XXX....... .......XXX....... .......XXX....... ...........1,029 ...........1,039 ..............978 ..............978 ..............864 ..............847 ..............796 ..............(51) ..............(68)6. 1997.... .......XXX....... .......XXX....... .......XXX....... .......XXX....... ...........1,150 ..............960 ..............960 ..............836 ..............853 ..............938 ................85 ..............1017. 1998.... .......XXX....... .......XXX....... .......XXX....... .......XXX....... .......XXX....... ...........1,130 ...........1,362 ...........1,404 ...........1,374 ...........1,216 .............(158) .............(188)8. 1999.... .......XXX....... .......XXX....... .......XXX....... .......XXX....... .......XXX....... .......XXX....... ...........1,187 ...........1,271 ...........1,602 ...........1,637 ................35 ..............3679. 2000.... .......XXX....... .......XXX....... .......XXX....... .......XXX....... .......XXX....... .......XXX....... .......XXX....... ...........1,685 ...........2,116 ...........2,228 ..............112 ..............544
10. 2001.... .......XXX....... .......XXX....... .......XXX....... .......XXX....... .......XXX....... .......XXX....... .......XXX....... .......XXX....... ...........4,189 ...........4,352 ..............163 .......XXX.......11. 2002.... .......XXX....... .......XXX....... .......XXX....... .......XXX....... .......XXX....... .......XXX....... .......XXX....... .......XXX....... .......XXX....... ...........1,670 .......XXX....... .......XXX.......
12. Totals ..............161 ..............792
SCHEDULE P - PART 2O - REINSURANCENONPROPORTIONAL ASSUMED LIABILITY
1. Prior..... ...........1,650 ...........1,298 ...........1,404 ...........9,071 ...........8,396 ...........7,396 ...........6,212 ...........5,688 ...........1,835 ...........1,777 ..............(59) ..........(3,911)2. 1993.... ..............958 ..............909 ..............988 ...........1,038 ..............858 ..............857 ...........1,336 ..............892 ..............881 ..............888 .................6 ................(5)3. 1994.... .......XXX....... ...........1,146 ...........1,110 ...........1,336 ..............966 ..............966 ..............917 ..............892 ..............892 ..............932 ................40 ................404. 1995.... .......XXX....... .......XXX....... ...........1,652 ...........1,361 ...........1,249 ...........1,246 ...........1,189 ...........1,150 ...........1,202 ...........1,246 ................44 ................965. 1996.... .......XXX....... .......XXX....... .......XXX....... ...........1,738 ...........2,005 ...........2,054 ...........1,796 ...........1,292 ...........1,243 ...........1,287 ................45 ................(5)6. 1997.... .......XXX....... .......XXX....... .......XXX....... .......XXX....... ...........1,888 ...........1,898 ...........1,526 ...........1,775 ...........1,924 ...........2,003 ................79 ..............2277. 1998.... .......XXX....... .......XXX....... .......XXX....... .......XXX....... .......XXX....... ...........2,265 ...........1,989 ...........2,414 ...........2,525 ...........2,702 ..............178 ..............2888. 1999.... .......XXX....... .......XXX....... .......XXX....... .......XXX....... .......XXX....... .......XXX....... ...........1,697 ...........1,984 ...........2,132 ...........2,194 ................62 ..............2109. 2000.... .......XXX....... .......XXX....... .......XXX....... .......XXX....... .......XXX....... .......XXX....... .......XXX....... ...........2,182 ...........2,182 ...........2,567 ..............385 ..............385
10. 2001.... .......XXX....... .......XXX....... .......XXX....... .......XXX....... .......XXX....... .......XXX....... .......XXX....... .......XXX....... ...........2,052 ...........2,500 ..............448 .......XXX.......11. 2002.... .......XXX....... .......XXX....... .......XXX....... .......XXX....... .......XXX....... .......XXX....... .......XXX....... .......XXX....... .......XXX....... ...........1,383 .......XXX....... .......XXX.......
12. Totals ...........1,228 ..........(2,673)
SCHEDULE P - PART 2P - REINSURANCENONPROPORTIONAL ASSUMED FINANCIAL LINES
1. Prior..... .................0 .................0 .................0 .................0 .................0 .................0 .................0 .................0 .................0 .................0 .................0 .................02. 1993.... .................0 .................0 .................0 .................0 .................0 .................0 .................8 .................6 .................6 .................9 .................3 .................33. 1994.... .......XXX....... .................0 .................0 ................(0) ................(0) ................(0) ................17 ................13 ................15 ................16 .................1 .................34. 1995.... .......XXX....... .......XXX....... .................0 .................0 .................0 .................3 .................5 .................3 .................1 .................1 ................(0) ................(2)5. 1996.... .......XXX....... .......XXX....... .......XXX....... .................0 .................0 .................3 .................9 .................7 .................7 .................7 ................(0) ................(1)6. 1997.... .......XXX....... .......XXX....... .......XXX....... .......XXX....... .................1 .................3 ................40 ................49 ................63 ..............101 ................38 ................527. 1998.... .......XXX....... .......XXX....... .......XXX....... .......XXX....... .......XXX....... .................6 ..............172 ..............205 ..............212 ..............219 .................6 ................138. 1999.... .......XXX....... .......XXX....... .......XXX....... .......XXX....... .......XXX....... .......XXX....... ................90 ..............203 ..............264 ..............274 ................10 ................719. 2000.... .......XXX....... .......XXX....... .......XXX....... .......XXX....... .......XXX....... .......XXX....... .......XXX....... ..............267 ..............414 ..............579 ..............165 ..............312
10. 2001.... .......XXX....... .......XXX....... .......XXX....... .......XXX....... .......XXX....... .......XXX....... .......XXX....... .......XXX....... ................83 ................85 .................2 .......XXX.......11. 2002.... .......XXX....... .......XXX....... .......XXX....... .......XXX....... .......XXX....... .......XXX....... .......XXX....... .......XXX....... .......XXX....... ................31 .......XXX....... .......XXX.......
12. Totals ..............224 ..............452

Annual Statement for the year 2002 of the TWIN CITY FIRE INSURANCE COMPANY
76
SCHEDULE P - PART 2R-SECTION 1 - PRODUCTS LIABILITY - OCCURRENCEIncurred Net Losses and Defense and Cost Containment Expenses Reported at Year End ($000 omitted) Development
1 2 3 4 5 6 7 8 9 10 11 12Years inWhich
Losses Were One TwoIncurred 1993 1994 1995 1996 1997 1998 1999 2000 2001 2002 Year Year
1. Prior..... ...........4,580 ...........4,605 ...........4,651 ...........5,817 ...........5,515 ...........5,680 ...........5,601 ...........5,628 ...........4,048 ...........4,000 ..............(48) ..........(1,628)2. 1993.... ..............358 ..............360 ..............433 ..............354 ..............298 ..............365 ..............361 ..............386 ..............326 ..............378 ................53 ................(8)3. 1994.... .......XXX....... ..............608 ..............682 ..............816 ..............659 ..............566 ..............441 ..............447 ..............354 ..............416 ................62 ..............(31)4. 1995.... .......XXX....... .......XXX....... ..............683 ..............643 ..............507 ..............429 ..............288 ..............316 ..............283 ..............319 ................36 .................35. 1996.... .......XXX....... .......XXX....... .......XXX....... ..............663 ..............573 ..............372 ..............364 ..............411 ..............405 ..............404 ................(2) ................(7)6. 1997.... .......XXX....... .......XXX....... .......XXX....... .......XXX....... ..............213 ..............393 ..............539 ..............556 ..............517 ..............600 ................83 ................447. 1998.... .......XXX....... .......XXX....... .......XXX....... .......XXX....... .......XXX....... ..............253 ..............431 ..............382 ..............323 ..............353 ................30 ..............(29)8. 1999.... .......XXX....... .......XXX....... .......XXX....... .......XXX....... .......XXX....... .......XXX....... ..............495 ..............314 ..............149 ..............242 ................93 ..............(72)9. 2000.... .......XXX....... .......XXX....... .......XXX....... .......XXX....... .......XXX....... .......XXX....... .......XXX....... ..............527 ..............273 ..............526 ..............253 ................(0)
10. 2001.... .......XXX....... .......XXX....... .......XXX....... .......XXX....... .......XXX....... .......XXX....... .......XXX....... .......XXX....... ...........2,229 ..............718 ..........(1,511) .......XXX.......11. 2002.... .......XXX....... .......XXX....... .......XXX....... .......XXX....... .......XXX....... .......XXX....... .......XXX....... .......XXX....... .......XXX....... ..............573 .......XXX....... .......XXX.......
12. Totals .............(950) ..........(1,729)
SCHEDULE P - PART 2R-SECTION 2 - PRODUCTS LIABILITY - CLAIMS-MADE1. Prior..... .................4 .................2 .................5 .................5 .................5 .................8 .................4 ................11 .................2 .................3 .................0 ................(8)2. 1993.... ................12 ................26 ................22 ................19 ................19 ................20 ................19 ................19 ................19 ................18 ................(0) ................(0)3. 1994.... .......XXX....... .................9 ................36 ................35 ................36 ................19 ................19 .................4 ..............(11) ..............(11) .................0 ..............(15)4. 1995.... .......XXX....... .......XXX....... ................13 .................9 .................9 .................7 .................7 .................8 ................15 ................19 .................4 ................115. 1996.... .......XXX....... .......XXX....... .......XXX....... .................5 ................27 ................35 ................13 ................11 .................7 .................7 .................0 ................(4)6. 1997.... .......XXX....... .......XXX....... .......XXX....... .......XXX....... ................71 ................46 ................30 ................46 ................41 ................41 .................0 ................(5)7. 1998.... .......XXX....... .......XXX....... .......XXX....... .......XXX....... .......XXX....... ................26 ................23 ................15 .................8 .................6 ................(2) ................(9)8. 1999.... .......XXX....... .......XXX....... .......XXX....... .......XXX....... .......XXX....... .......XXX....... ................53 ................31 ................15 ................15 ................(0) ..............(16)9. 2000.... .......XXX....... .......XXX....... .......XXX....... .......XXX....... .......XXX....... .......XXX....... .......XXX....... ................36 ................28 ................36 .................8 ................(1)
10. 2001.... .......XXX....... .......XXX....... .......XXX....... .......XXX....... .......XXX....... .......XXX....... .......XXX....... .......XXX....... ................93 ................23 ..............(70) .......XXX.......11. 2002.... .......XXX....... .......XXX....... .......XXX....... .......XXX....... .......XXX....... .......XXX....... .......XXX....... .......XXX....... .......XXX....... ................68 .......XXX....... .......XXX.......
12. Totals ..............(61) ..............(46)
SCHEDULE P - PART 2S - FINANCIAL GUARANTY/MORTGAGE GUARANTY1. Prior..... .......XXX....... .......XXX....... .......XXX....... .......XXX....... .......XXX....... .......XXX....... .......XXX....... .................0 .................0 .................0 .................0 .................02. 2001.... .......XXX....... .......XXX....... .......XXX....... .......XXX....... .......XXX....... .......XXX....... .......XXX....... .......XXX....... .................0 .................0 .................0 .......XXX.......3. 2002.... .......XXX....... .......XXX....... .......XXX....... .......XXX....... .......XXX....... .......XXX....... .......XXX....... .......XXX....... .......XXX....... .................0 .......XXX....... .......XXX.......
4. Totals .................0 .................0NONE

Annual Statement for the year 2002 of the TWIN CITY FIRE INSURANCE COMPANY
77
SCHEDULE P - PART 3A - HOMEOWNERS/FARMOWNERSCumulative Paid Net Losses and Defense and Cost Containment Expenses Reported at Year End ($000 omitted) 11 12
1 2 3 4 5 6 7 8 9 10 Number of Number ofYears in Claims ClaimsWhich Closed Closed
Losses Were With Loss Without LossIncurred 1993 1994 1995 1996 1997 1998 1999 2000 2001 2002 Payment Payment
1. Prior..... ........000....... ..............242 ..............383 ..............494 ..............541 ..............567 ..............602 ..............611 ..............620 ..............630 ................24 ................152. 1993.... ...........2,480 ...........3,238 ...........3,383 ...........3,447 ...........3,482 ...........3,523 ...........3,532 ...........3,537 ...........3,540 ...........3,543 ...........1,274 ..............4103. 1994.... .......XXX....... ...........3,118 ...........3,852 ...........3,988 ...........4,029 ...........4,073 ...........4,088 ...........4,098 ...........4,107 ...........4,116 ...........1,400 ..............4934. 1995.... .......XXX....... .......XXX....... ...........2,852 ...........3,957 ...........4,107 ...........4,192 ...........4,231 ...........4,250 ...........4,261 ...........4,273 ...........1,318 ..............5295. 1996.... .......XXX....... .......XXX....... .......XXX....... ...........4,477 ...........5,586 ...........5,709 ...........5,796 ...........5,830 ...........5,861 ...........5,872 ...........1,779 ..............6316. 1997.... .......XXX....... .......XXX....... .......XXX....... .......XXX....... ...........2,858 ...........3,718 ...........3,834 ...........3,927 ...........3,975 ...........4,012 ...........1,168 ..............4697. 1998.... .......XXX....... .......XXX....... .......XXX....... .......XXX....... .......XXX....... ...........3,111 ...........4,067 ...........4,233 ...........4,307 ...........4,363 ...........1,265 ..............5088. 1999.... .......XXX....... .......XXX....... .......XXX....... .......XXX....... .......XXX....... .......XXX....... ...........3,515 ...........4,427 ...........4,611 ...........4,688 ...........1,305 ..............5569. 2000.... .......XXX....... .......XXX....... .......XXX....... .......XXX....... .......XXX....... .......XXX....... .......XXX....... ...........3,364 ...........4,710 ...........4,918 ...........1,291 ..............508
10. 2001.... .......XXX....... .......XXX....... .......XXX....... .......XXX....... .......XXX....... .......XXX....... .......XXX....... .......XXX....... ...........4,014 ...........5,376 ...........1,338 ..............52611. 2002.... .......XXX....... .......XXX....... .......XXX....... .......XXX....... .......XXX....... .......XXX....... .......XXX....... .......XXX....... .......XXX....... ...........3,683 ...........1,004 ..............450
SCHEDULE P - PART 3B - PRIVATE PASSENGER AUTO LIABILITY/MEDICAL1. Prior..... ........000....... ...........2,981 ...........4,322 ...........4,867 ...........5,203 ...........5,339 ...........5,393 ...........5,486 ...........5,567 ...........5,597 ..............188 ................562. 1993.... ...........3,410 ...........7,167 ...........8,932 ...........9,659 .........10,048 .........10,199 .........10,275 .........10,310 .........10,326 .........10,336 ...........2,087 ..............6033. 1994.... .......XXX....... ...........3,855 ...........7,867 ...........9,505 .........10,389 .........10,767 .........11,002 .........11,093 .........11,139 .........11,141 ...........2,189 ..............6114. 1995.... .......XXX....... .......XXX....... ...........3,940 ...........7,470 ...........9,248 ...........9,990 .........10,384 .........10,504 .........10,592 .........10,601 ...........2,091 ..............5905. 1996.... .......XXX....... .......XXX....... .......XXX....... ...........3,908 ...........7,581 ...........9,150 ...........9,955 .........10,348 .........10,559 .........10,638 ...........2,049 ..............6016. 1997.... .......XXX....... .......XXX....... .......XXX....... .......XXX....... ...........4,014 ...........7,378 ...........8,938 ...........9,782 .........10,287 .........10,476 ...........1,982 ..............6067. 1998.... .......XXX....... .......XXX....... .......XXX....... .......XXX....... .......XXX....... ...........3,918 ...........7,334 ...........8,953 ...........9,875 .........10,341 ...........2,077 ..............6818. 1999.... .......XXX....... .......XXX....... .......XXX....... .......XXX....... .......XXX....... .......XXX....... ...........4,008 ...........7,618 ...........9,363 .........10,400 ...........2,330 ..............9169. 2000.... .......XXX....... .......XXX....... .......XXX....... .......XXX....... .......XXX....... .......XXX....... .......XXX....... ...........4,490 ...........8,456 .........10,284 ...........2,469 ...........1,054
10. 2001.... .......XXX....... .......XXX....... .......XXX....... .......XXX....... .......XXX....... .......XXX....... .......XXX....... .......XXX....... ...........4,790 ...........9,185 ...........2,463 ..............94611. 2002.... .......XXX....... .......XXX....... .......XXX....... .......XXX....... .......XXX....... .......XXX....... .......XXX....... .......XXX....... .......XXX....... ...........5,674 ...........1,789 ..............793
SCHEDULE P - PART 3C - COMMERCIAL AUTO/TRUCK LIABILITY/MEDICAL1. Prior..... ........000....... ...........2,340 ...........3,661 ...........4,348 ...........4,691 ...........4,860 ...........4,958 ...........5,037 ...........5,097 ...........5,133 ................69 ................392. 1993.... ..............798 ...........1,773 ...........2,599 ...........3,061 ...........3,372 ...........3,545 ...........3,594 ...........3,629 ...........3,643 ...........3,650 ..............500 ..............1923. 1994.... .......XXX....... ..............858 ...........2,027 ...........2,774 ...........3,203 ...........3,513 ...........3,667 ...........3,726 ...........3,779 ...........3,810 ..............513 ..............1844. 1995.... .......XXX....... .......XXX....... ..............842 ...........1,781 ...........2,480 ...........3,047 ...........3,321 ...........3,470 ...........3,575 ...........3,631 ..............472 ..............1805. 1996.... .......XXX....... .......XXX....... .......XXX....... ..............939 ...........1,859 ...........2,631 ...........3,090 ...........3,423 ...........3,578 ...........3,657 ..............474 ..............1826. 1997.... .......XXX....... .......XXX....... .......XXX....... .......XXX....... ..............777 ...........1,533 ...........2,178 ...........2,610 ...........3,011 ...........3,233 ..............456 ..............1827. 1998.... .......XXX....... .......XXX....... .......XXX....... .......XXX....... .......XXX....... ..............871 ...........1,830 ...........2,713 ...........3,329 ...........3,746 ..............497 ..............2118. 1999.... .......XXX....... .......XXX....... .......XXX....... .......XXX....... .......XXX....... .......XXX....... ...........1,414 ...........2,615 ...........3,596 ...........4,311 ..............498 ..............2309. 2000.... .......XXX....... .......XXX....... .......XXX....... .......XXX....... .......XXX....... .......XXX....... .......XXX....... ...........1,486 ...........2,801 ...........3,655 ..............452 ..............226
10. 2001.... .......XXX....... .......XXX....... .......XXX....... .......XXX....... .......XXX....... .......XXX....... .......XXX....... .......XXX....... ...........1,503 ...........2,706 ..............370 ..............20111. 2002.... .......XXX....... .......XXX....... .......XXX....... .......XXX....... .......XXX....... .......XXX....... .......XXX....... .......XXX....... .......XXX....... ...........1,107 ..............241 ..............153
SCHEDULE P - PART 3D - WORKERS' COMPENSATION1. Prior..... ........000....... ...........6,551 .........11,352 .........14,331 .........16,506 .........18,162 .........19,667 .........20,854 .........21,888 .........22,741 ..............432 ..............1492. 1993.... ...........1,603 ...........4,415 ...........6,282 ...........7,267 ...........7,865 ...........8,330 ...........8,639 ...........8,830 ...........8,965 ...........9,078 ...........1,714 ..............1513. 1994.... .......XXX....... ...........2,097 ...........5,357 ...........6,938 ...........7,945 ...........8,592 ...........9,015 ...........9,284 ...........9,463 ...........9,604 ...........1,669 ..............2034. 1995.... .......XXX....... .......XXX....... ...........2,334 ...........5,047 ...........6,634 ...........7,706 ...........8,382 ...........8,834 ...........9,157 ...........9,350 ...........1,645 ..............2255. 1996.... .......XXX....... .......XXX....... .......XXX....... ...........2,243 ...........4,958 ...........6,608 ...........7,600 ...........8,218 ...........8,603 ...........8,881 ...........1,598 ..............2056. 1997.... .......XXX....... .......XXX....... .......XXX....... .......XXX....... ...........2,336 ...........5,171 ...........6,901 ...........7,915 ...........8,567 ...........9,065 ...........1,660 ..............2647. 1998.... .......XXX....... .......XXX....... .......XXX....... .......XXX....... .......XXX....... ...........2,585 ...........5,608 ...........7,472 ...........8,675 ...........9,478 ...........1,672 ..............3698. 1999.... .......XXX....... .......XXX....... .......XXX....... .......XXX....... .......XXX....... .......XXX....... ...........2,318 ...........5,089 ...........6,889 ...........8,179 ...........1,365 ..............3649. 2000.... .......XXX....... .......XXX....... .......XXX....... .......XXX....... .......XXX....... .......XXX....... .......XXX....... ...........1,827 ...........4,436 ...........6,241 ...........1,105 ..............392
10. 2001.... .......XXX....... .......XXX....... .......XXX....... .......XXX....... .......XXX....... .......XXX....... .......XXX....... .......XXX....... ...........1,892 ...........4,551 ..............990 ..............40311. 2002.... .......XXX....... .......XXX....... .......XXX....... .......XXX....... .......XXX....... .......XXX....... .......XXX....... .......XXX....... .......XXX....... ...........1,992 ..............710 ..............377
SCHEDULE P - PART 3E - COMMERCIAL MULTIPLE PERIL1. Prior..... ........000....... ...........2,634 ...........4,330 ...........5,396 ...........6,192 ...........6,563 ...........7,048 ...........7,358 ...........7,869 ...........7,787 ..............107 ..............1232. 1993.... ...........2,607 ...........4,185 ...........5,066 ...........5,615 ...........6,028 ...........6,389 ...........6,579 ...........6,692 ...........6,890 ...........6,947 ..............714 ..............3763. 1994.... .......XXX....... ...........3,060 ...........4,876 ...........5,771 ...........6,376 ...........6,862 ...........7,207 ...........7,418 ...........7,512 ...........7,622 ..............797 ..............4714. 1995.... .......XXX....... .......XXX....... ...........2,983 ...........4,750 ...........5,660 ...........6,344 ...........6,790 ...........7,147 ...........7,294 ...........7,407 ..............782 ..............4815. 1996.... .......XXX....... .......XXX....... .......XXX....... ...........3,493 ...........5,423 ...........6,384 ...........7,057 ...........7,538 ...........7,934 ...........8,340 ..............799 ..............4786. 1997.... .......XXX....... .......XXX....... .......XXX....... .......XXX....... ...........2,888 ...........4,764 ...........5,721 ...........6,461 ...........7,096 ...........7,613 ..............768 ..............4337. 1998.... .......XXX....... .......XXX....... .......XXX....... .......XXX....... .......XXX....... ...........3,796 ...........6,021 ...........7,025 ...........7,848 ...........8,516 ..............902 ..............5148. 1999.... .......XXX....... .......XXX....... .......XXX....... .......XXX....... .......XXX....... .......XXX....... ...........3,849 ...........6,379 ...........7,583 ...........8,759 ..............975 ..............5869. 2000.... .......XXX....... .......XXX....... .......XXX....... .......XXX....... .......XXX....... .......XXX....... .......XXX....... ...........4,104 ...........6,561 ...........7,790 ..............996 ..............629
10. 2001.... .......XXX....... .......XXX....... .......XXX....... .......XXX....... .......XXX....... .......XXX....... .......XXX....... .......XXX....... ...........4,769 ...........7,158 ..............926 ..............58411. 2002.... .......XXX....... .......XXX....... .......XXX....... .......XXX....... .......XXX....... .......XXX....... .......XXX....... .......XXX....... .......XXX....... ...........3,726 ..............580 ..............385

Annual Statement for the year 2002 of the TWIN CITY FIRE INSURANCE COMPANY
78
SCHEDULE P - PART 3F - SECTION 1 - MEDICAL MALPRACTICE - OCCURRENCECumulative Paid Net Losses and Defense and Cost Containment Expenses Reported at Year End ($000 omitted) 11 12
1 2 3 4 5 6 7 8 9 10 Number of Number ofYears in Claims ClaimsWhich Closed Closed
Losses Were With Loss Without LossIncurred 1993 1994 1995 1996 1997 1998 1999 2000 2001 2002 Payment Payment
1. Prior..... ........000....... ................85 ..............215 ..............278 ..............323 ..............524 ..............621 ..............649 ..............653 ..............666 .................1 .................82. 1993.... .................0 .................0 .................7 .................4 .................4 .................5 .................5 .................5 .................5 .................5 ................(0) .................23. 1994.... .......XXX....... .................0 .................0 .................0 .................0 .................2 .................2 .................1 .................1 .................1 ................(0) .................04. 1995.... .......XXX....... .......XXX....... .................0 .................0 .................2 .................2 .................2 .................2 .................2 .................2 .................0 .................05. 1996.... .......XXX....... .......XXX....... .......XXX....... .................0 .................1 ................(2) ................(2) ................(2) ................(2) ................(2) .................0 .................06. 1997.... .......XXX....... .......XXX....... .......XXX....... .......XXX....... .................1 .................3 .................3 .................2 .................2 .................2 .................0 .................17. 1998.... .......XXX....... .......XXX....... .......XXX....... .......XXX....... .......XXX....... .................1 .................1 .................4 .................5 .................5 .................0 .................08. 1999.... .......XXX....... .......XXX....... .......XXX....... .......XXX....... .......XXX....... .......XXX....... .................1 .................1 .................1 .................5 .................0 .................09. 2000.... .......XXX....... .......XXX....... .......XXX....... .......XXX....... .......XXX....... .......XXX....... .......XXX....... .................1 .................2 .................2 .................0 .................0
10. 2001.... .......XXX....... .......XXX....... .......XXX....... .......XXX....... .......XXX....... .......XXX....... .......XXX....... .......XXX....... .................0 .................0 .................0 .................011. 2002.... .......XXX....... .......XXX....... .......XXX....... .......XXX....... .......XXX....... .......XXX....... .......XXX....... .......XXX....... .......XXX....... .................0 .................0 .................0
SCHEDULE P - PART 3F - SECTION 2 - MEDICAL MALPRACTICE - CLAIMS-MADE1. Prior..... ........000....... ..............108 ..............176 ..............227 ..............278 ..............313 ..............326 ..............356 ..............358 ..............359 .................4 ................112. 1993.... .................5 ................18 ................52 ................75 ..............107 ..............119 ..............137 ..............146 ..............150 ..............150 .................7 .................63. 1994.... .......XXX....... .................6 ................23 ................52 ................79 ..............109 ..............133 ..............135 ..............137 ..............137 .................2 .................54. 1995.... .......XXX....... .......XXX....... .................7 ................20 ................40 ................84 ..............106 ..............117 ..............125 ..............128 .................2 .................45. 1996.... .......XXX....... .......XXX....... .......XXX....... .................6 ................32 ................76 ..............121 ..............143 ..............151 ..............174 .................1 .................36. 1997.... .......XXX....... .......XXX....... .......XXX....... .......XXX....... .................2 ................11 ................43 ................71 ..............100 ..............104 .................1 .................37. 1998.... .......XXX....... .......XXX....... .......XXX....... .......XXX....... .......XXX....... ................10 ................26 ................49 ................79 ..............117 .................1 .................28. 1999.... .......XXX....... .......XXX....... .......XXX....... .......XXX....... .......XXX....... .......XXX....... .................1 .................5 .................7 .................8 .................0 .................09. 2000.... .......XXX....... .......XXX....... .......XXX....... .......XXX....... .......XXX....... .......XXX....... .......XXX....... ................(0) .................0 .................0 .................0 .................0
10. 2001.... .......XXX....... .......XXX....... .......XXX....... .......XXX....... .......XXX....... .......XXX....... .......XXX....... .......XXX....... .................0 .................0 .................0 .................011. 2002.... .......XXX....... .......XXX....... .......XXX....... .......XXX....... .......XXX....... .......XXX....... .......XXX....... .......XXX....... .......XXX....... .................0 .................0 .................0
SCHEDULE P - PART 3G - SPECIAL LIABILITY (OCEAN MARINE,AIRCRAFT (ALL PERILS), BOILER AND MACHINERY)
1. Prior..... ........000....... ................82 ..............163 ..............208 ..............227 ..............214 ..............258 ..............273 ..............274 ..............282 .......XXX....... .......XXX.......2. 1993.... ................93 ..............216 ..............284 ..............310 ..............327 ..............333 ..............335 ..............338 ..............333 ..............333 .......XXX....... .......XXX.......3. 1994.... .......XXX....... ................77 ..............223 ..............281 ..............306 ..............316 ..............321 ..............323 ..............317 ..............320 .......XXX....... .......XXX.......4. 1995.... .......XXX....... .......XXX....... ................95 ..............228 ..............284 ..............330 ..............340 ..............353 ..............355 ..............356 .......XXX....... .......XXX.......5. 1996.... .......XXX....... .......XXX....... .......XXX....... ..............147 ..............297 ..............346 ..............387 ..............442 ..............449 ..............460 .......XXX....... .......XXX.......6. 1997.... .......XXX....... .......XXX....... .......XXX....... .......XXX....... ..............174 ..............366 ..............435 ..............524 ..............547 ..............555 .......XXX....... .......XXX.......7. 1998.... .......XXX....... .......XXX....... .......XXX....... .......XXX....... .......XXX....... ..............271 ..............548 ..............675 ..............733 ..............752 .......XXX....... .......XXX.......8. 1999.... .......XXX....... .......XXX....... .......XXX....... .......XXX....... .......XXX....... .......XXX....... ..............255 ..............462 ..............575 ..............603 .......XXX....... .......XXX.......9. 2000.... .......XXX....... .......XXX....... .......XXX....... .......XXX....... .......XXX....... .......XXX....... .......XXX....... ..............187 ..............445 ..............532 .......XXX....... .......XXX.......
10. 2001.... .......XXX....... .......XXX....... .......XXX....... .......XXX....... .......XXX....... .......XXX....... .......XXX....... .......XXX....... ..............187 ..............375 .......XXX....... .......XXX.......11. 2002.... .......XXX....... .......XXX....... .......XXX....... .......XXX....... .......XXX....... .......XXX....... .......XXX....... .......XXX....... .......XXX....... ..............215 .......XXX....... .......XXX.......
SCHEDULE P - PART 3H - SECTION 1 - OTHER LIABILITY - OCCURRENCE1. Prior..... ........000....... ...........3,262 ...........5,996 ...........8,229 .........10,207 .........11,785 .........13,469 .........14,556 .........15,495 .........15,834 ..............107 ..............2512. 1993.... ..............103 ..............405 ..............867 ...........1,371 ...........1,722 ...........1,867 ...........2,100 ...........2,213 ...........2,282 ...........2,360 ................95 ..............1343. 1994.... .......XXX....... ..............126 ..............785 ...........1,279 ...........1,796 ...........2,242 ...........2,689 ...........2,922 ...........3,096 ...........3,192 ................97 ..............1544. 1995.... .......XXX....... .......XXX....... ..............155 ..............441 ..............873 ...........1,451 ...........2,083 ...........2,424 ...........2,657 ...........2,792 ................95 ..............1415. 1996.... .......XXX....... .......XXX....... .......XXX....... ................41 ..............473 ...........1,198 ...........1,901 ...........2,318 ...........2,691 ...........3,001 ..............102 ..............1256. 1997.... .......XXX....... .......XXX....... .......XXX....... .......XXX....... ..............147 ..............547 ...........1,380 ...........2,130 ...........2,752 ...........3,071 ................89 ..............1147. 1998.... .......XXX....... .......XXX....... .......XXX....... .......XXX....... .......XXX....... ................29 ..............498 ...........1,464 ...........2,439 ...........2,959 ................75 ..............1048. 1999.... .......XXX....... .......XXX....... .......XXX....... .......XXX....... .......XXX....... .......XXX....... ..............202 ..............673 ...........1,486 ...........2,143 ................71 ..............1019. 2000.... .......XXX....... .......XXX....... .......XXX....... .......XXX....... .......XXX....... .......XXX....... .......XXX....... ..............172 ..............555 ...........1,304 ................66 ..............105
10. 2001.... .......XXX....... .......XXX....... .......XXX....... .......XXX....... .......XXX....... .......XXX....... .......XXX....... .......XXX....... ..............160 ..............564 ................42 ................7811. 2002.... .......XXX....... .......XXX....... .......XXX....... .......XXX....... .......XXX....... .......XXX....... .......XXX....... .......XXX....... .......XXX....... ..............124 ................15 ................34
SCHEDULE P - PART 3H - SECTION 2 - OTHER LIABILITY - CLAIMS-MADE1. Prior..... ........000....... ................97 ..............177 ..............212 ..............270 ..............290 ..............298 ..............301 ..............302 ..............302 .................4 ................112. 1993.... ................20 ..............125 ..............184 ..............238 ..............349 ..............361 ..............369 ..............379 ..............380 ..............381 ................11 ................143. 1994.... .......XXX....... ................34 ..............133 ..............223 ..............281 ..............318 ..............335 ..............342 ..............353 ..............356 .................9 ................124. 1995.... .......XXX....... .......XXX....... ................38 ..............120 ..............192 ..............261 ..............283 ..............315 ..............325 ..............336 .................7 ................115. 1996.... .......XXX....... .......XXX....... .......XXX....... ................26 ................73 ..............141 ..............183 ..............210 ..............230 ..............240 .................4 .................86. 1997.... .......XXX....... .......XXX....... .......XXX....... .......XXX....... ................24 ..............138 ..............212 ..............314 ..............346 ..............388 .................5 .................97. 1998.... .......XXX....... .......XXX....... .......XXX....... .......XXX....... .......XXX....... ................64 ..............252 ..............382 ..............456 ..............486 .................4 ................108. 1999.... .......XXX....... .......XXX....... .......XXX....... .......XXX....... .......XXX....... .......XXX....... ................71 ..............265 ..............454 ..............553 .................5 .................79. 2000.... .......XXX....... .......XXX....... .......XXX....... .......XXX....... .......XXX....... .......XXX....... .......XXX....... ................69 ..............381 ..............678 .................3 .................6
10. 2001.... .......XXX....... .......XXX....... .......XXX....... .......XXX....... .......XXX....... .......XXX....... .......XXX....... .......XXX....... ................86 ..............337 .................1 .................211. 2002.... .......XXX....... .......XXX....... .......XXX....... .......XXX....... .......XXX....... .......XXX....... .......XXX....... .......XXX....... .......XXX....... ................78 .................0 .................0

Annual Statement for the year 2002 of the TWIN CITY FIRE INSURANCE COMPANY
79
SCHEDULE P - PART 3I - SPECIAL PROPERTY (FIRE, ALLIED LINES, INLAND MARINE,EARTHQUAKE, BURGLARY AND THEFT)
Cumulative Paid Net Losses and Defense and Containment Expenses Reported at Year End ($000 omitted) 11 121 2 3 4 5 6 7 8 9 10 Number of Number of
Years in Claims ClaimsWhich Closed Closed
Losses Were With Loss Without LossIncurred 1993 1994 1995 1996 1997 1998 1999 2000 2001 2002 Payment Payment
1. Prior..... .......XXX....... .......XXX....... .......XXX....... .......XXX....... .......XXX....... .......XXX....... .......XXX....... ........000....... ...........1,724 ...........1,958 .......XXX....... .......XXX.......2. 2001.... .......XXX....... .......XXX....... .......XXX....... .......XXX....... .......XXX....... .......XXX....... .......XXX....... .......XXX....... ...........2,889 ...........4,227 .......XXX....... .......XXX.......3. 2002.... .......XXX....... .......XXX....... .......XXX....... .......XXX....... .......XXX....... .......XXX....... .......XXX....... .......XXX....... .......XXX....... ...........2,506 .......XXX....... .......XXX.......
SCHEDULE P - PART 3J - AUTO PHYSICAL DAMAGE1. Prior..... .......XXX....... .......XXX....... .......XXX....... .......XXX....... .......XXX....... .......XXX....... .......XXX....... ........000....... ..............520 ..............496 ..............(20) ................272. 2001.... .......XXX....... .......XXX....... .......XXX....... .......XXX....... .......XXX....... .......XXX....... .......XXX....... .......XXX....... ...........7,596 ...........8,166 ...........5,388 ...........1,1093. 2002.... .......XXX....... .......XXX....... .......XXX....... .......XXX....... .......XXX....... .......XXX....... .......XXX....... .......XXX....... .......XXX....... ...........7,692 ...........4,696 ...........1,087
SCHEDULE P - PART 3K - FIDELITY/SURETY1. Prior..... .......XXX....... .......XXX....... .......XXX....... .......XXX....... .......XXX....... .......XXX....... .......XXX....... ........000....... ..............637 ..............865 .......XXX....... .......XXX.......2. 2001.... .......XXX....... .......XXX....... .......XXX....... .......XXX....... .......XXX....... .......XXX....... .......XXX....... .......XXX....... ..............191 ..............535 .......XXX....... .......XXX.......3. 2002.... .......XXX....... .......XXX....... .......XXX....... .......XXX....... .......XXX....... .......XXX....... .......XXX....... .......XXX....... .......XXX....... ..............289 .......XXX....... .......XXX.......
SCHEDULE P - PART 3L - OTHER (INCLUDING CREDIT, ACCIDENT AND HEALTH)1. Prior..... .......XXX....... .......XXX....... .......XXX....... .......XXX....... .......XXX....... .......XXX....... .......XXX....... ........000....... .................0 .................0 .......XXX....... .......XXX.......2. 2001.... .......XXX....... .......XXX....... .......XXX....... .......XXX....... .......XXX....... .......XXX....... .......XXX....... .......XXX....... .................0 .................0 .......XXX....... .......XXX.......3. 2002.... .......XXX....... .......XXX....... .......XXX....... .......XXX....... .......XXX....... .......XXX....... .......XXX....... .......XXX....... .......XXX....... .................0 .......XXX....... .......XXX.......
NONE
SCHEDULE P - PART 3M - INTERNATIONAL1. Prior..... ........000....... ..............435 ..............635 ..............663 ..............758 ..............775 ..............811 ..............836 ..............849 ..............848 .......XXX....... .......XXX.......2. 1993.... ................(2) ..............290 ..............445 ..............514 ..............549 ..............561 ..............581 ..............594 ..............603 ..............602 .......XXX....... .......XXX.......3. 1994.... .......XXX....... ................97 ..............299 ..............447 ..............501 ..............517 ..............530 ..............529 ..............529 ..............531 .......XXX....... .......XXX.......4. 1995.... .......XXX....... .......XXX....... ................65 ..............332 ..............467 ..............496 ..............524 ..............534 ..............539 ..............548 .......XXX....... .......XXX.......5. 1996.... .......XXX....... .......XXX....... .......XXX....... ..............108 ..............360 ..............477 ..............515 ..............528 ..............532 ..............535 .......XXX....... .......XXX.......6. 1997.... .......XXX....... .......XXX....... .......XXX....... .......XXX....... ..............148 ..............377 ..............518 ..............572 ..............570 ..............574 .......XXX....... .......XXX.......7. 1998.... .......XXX....... .......XXX....... .......XXX....... .......XXX....... .......XXX....... ..............350 ..............986 ...........1,137 ...........1,244 ...........1,249 .......XXX....... .......XXX.......8. 1999.... .......XXX....... .......XXX....... .......XXX....... .......XXX....... .......XXX....... .......XXX....... ..............170 ..............575 ..............656 ..............698 .......XXX....... .......XXX.......9. 2000.... .......XXX....... .......XXX....... .......XXX....... .......XXX....... .......XXX....... .......XXX....... .......XXX....... ..............123 ..............424 ..............511 .......XXX....... .......XXX.......
10. 2001.... .......XXX....... .......XXX....... .......XXX....... .......XXX....... .......XXX....... .......XXX....... .......XXX....... .......XXX....... ..............179 ..............542 .......XXX....... .......XXX.......11. 2002.... .......XXX....... .......XXX....... .......XXX....... .......XXX....... .......XXX....... .......XXX....... .......XXX....... .......XXX....... .......XXX....... ................68 .......XXX....... .......XXX.......

Annual Statement for the year 2002 of the TWIN CITY FIRE INSURANCE COMPANY
80
SCHEDULE P - PART 3N - REINSURANCENONPROPORTIONAL ASSUMED PROPERTY
Cumulative Paid Net Losses and Defense and Cost Containment Expenses Reported at Year End ($000 omitted) 11 121 2 3 4 5 6 7 8 9 10 Number of Number of
Years in Claims ClaimsWhich Closed Closed
Losses Were With Loss Without LossIncurred 1993 1994 1995 1996 1997 1998 1999 2000 2001 2002 Payment Payment
1. Prior..... .......000........ ..............204 ..............324 ..............377 ..............381 ..............398 ..............409 ..............457 ..............539 ..............547 .......XXX....... .......XXX.......2. 1993.... ..............138 ..............383 ..............537 ..............579 ..............592 ..............596 ..............601 ..............608 ..............610 ..............609 .......XXX....... .......XXX.......3. 1994.... .......XXX....... ..............326 ..............690 ..............823 ..............844 ..............879 ..............891 ..............907 ..............914 ..............921 .......XXX....... .......XXX.......4. 1995.... .......XXX....... .......XXX....... ..............255 ..............687 ..............796 ..............842 ..............874 ..............876 ..............880 ..............882 .......XXX....... .......XXX.......5. 1996.... .......XXX....... .......XXX....... .......XXX....... ..............219 ..............614 ..............816 ..............806 ..............818 ..............821 ..............831 .......XXX....... .......XXX.......6. 1997.... .......XXX....... .......XXX....... .......XXX....... .......XXX....... ..............298 ..............618 ..............729 ..............776 ..............802 ..............817 .......XXX....... .......XXX.......7. 1998.... .......XXX....... .......XXX....... .......XXX....... .......XXX....... .......XXX....... ..............609 ..............961 ...........1,163 ...........1,182 ...........1,201 .......XXX....... .......XXX.......8. 1999.... .......XXX....... .......XXX....... .......XXX....... .......XXX....... .......XXX....... .......XXX....... ..............237 ...........1,143 ...........1,516 ...........1,751 .......XXX....... .......XXX.......9. 2000.... .......XXX....... .......XXX....... .......XXX....... .......XXX....... .......XXX....... .......XXX....... .......XXX....... ..............403 ...........1,340 ...........1,696 .......XXX....... .......XXX.......
10. 2001.... .......XXX....... .......XXX....... .......XXX....... .......XXX....... .......XXX....... .......XXX....... .......XXX....... .......XXX....... ..............608 ...........1,953 .......XXX....... .......XXX.......11. 2002.... .......XXX....... .......XXX....... .......XXX....... .......XXX....... .......XXX....... .......XXX....... .......XXX....... .......XXX....... .......XXX....... ..............233 .......XXX....... .......XXX.......
SCHEDULE P - PART 3O - REINSURANCENONPROPORTIONAL ASSUMED LIABILITY
1. Prior..... .......000........ ..............195 ..............387 ..............513 ..............634 ..............778 ..............835 ..............880 ...........1,652 ...........1,662 .......XXX....... .......XXX.......2. 1993.... ................12 ................92 ..............172 ..............283 ..............362 ..............452 ..............576 ..............659 ..............678 ..............737 .......XXX....... .......XXX.......3. 1994.... .......XXX....... .................9 ................68 ..............189 ..............284 ..............376 ..............489 ..............561 ..............617 ..............663 .......XXX....... .......XXX.......4. 1995.... .......XXX....... .......XXX....... ................16 ..............120 ..............316 ..............481 ..............599 ..............669 ..............715 ..............821 .......XXX....... .......XXX.......5. 1996.... .......XXX....... .......XXX....... .......XXX....... .............(100) ................89 ..............198 ..............354 ..............478 ..............588 ..............691 .......XXX....... .......XXX.......6. 1997.... .......XXX....... .......XXX....... .......XXX....... .......XXX....... ................84 ..............219 ..............414 ..............609 ..............869 ...........1,038 .......XXX....... .......XXX.......7. 1998.... .......XXX....... .......XXX....... .......XXX....... .......XXX....... .......XXX....... ..............(17) ..............211 ..............498 ..............907 ...........1,222 .......XXX....... .......XXX.......8. 1999.... .......XXX....... .......XXX....... .......XXX....... .......XXX....... .......XXX....... .......XXX....... ..............140 ..............530 ..............876 ...........1,226 .......XXX....... .......XXX.......9. 2000.... .......XXX....... .......XXX....... .......XXX....... .......XXX....... .......XXX....... .......XXX....... .......XXX....... ................18 ..............213 ..............637 .......XXX....... .......XXX.......
10. 2001.... .......XXX....... .......XXX....... .......XXX....... .......XXX....... .......XXX....... .......XXX....... .......XXX....... .......XXX....... ................21 ..............163 .......XXX....... .......XXX.......11. 2002.... .......XXX....... .......XXX....... .......XXX....... .......XXX....... .......XXX....... .......XXX....... .......XXX....... .......XXX....... .......XXX....... .................9 .......XXX....... .......XXX.......
SCHEDULE P - PART 3P - REINSURANCENONPROPORTIONAL ASSUMED FINANCIAL LINES
1. Prior..... .......000........ .................0 .................0 .................0 .................0 .................0 .................0 .................0 .................0 .................0 .......XXX....... .......XXX.......2. 1993.... .................0 .................0 .................0 .................0 .................0 .................0 .................0 .................0 .................0 .................1 .......XXX....... .......XXX.......3. 1994.... .......XXX....... .................0 .................0 ................(0) ................(0) ................(0) .................1 .................2 .................7 ................10 .......XXX....... .......XXX.......4. 1995.... .......XXX....... .......XXX....... .................0 .................0 .................0 .................0 .................1 .................2 ................(0) ................(1) .......XXX....... .......XXX.......5. 1996.... .......XXX....... .......XXX....... .......XXX....... .................0 .................0 .................0 .................2 .................4 .................4 .................4 .......XXX....... .......XXX.......6. 1997.... .......XXX....... .......XXX....... .......XXX....... .......XXX....... .................1 .................1 .................7 ................22 ................37 ................44 .......XXX....... .......XXX.......7. 1998.... .......XXX....... .......XXX....... .......XXX....... .......XXX....... .......XXX....... ................(0) ................89 ..............159 ..............182 ..............185 .......XXX....... .......XXX.......8. 1999.... .......XXX....... .......XXX....... .......XXX....... .......XXX....... .......XXX....... .......XXX....... ................21 ..............144 ..............208 ..............228 .......XXX....... .......XXX.......9. 2000.... .......XXX....... .......XXX....... .......XXX....... .......XXX....... .......XXX....... .......XXX....... .......XXX....... ................44 ..............257 ..............406 .......XXX....... .......XXX.......
10. 2001.... .......XXX....... .......XXX....... .......XXX....... .......XXX....... .......XXX....... .......XXX....... .......XXX....... .......XXX....... .................1 ................19 .......XXX....... .......XXX.......11. 2002.... .......XXX....... .......XXX....... .......XXX....... .......XXX....... .......XXX....... .......XXX....... .......XXX....... .......XXX....... .......XXX....... .................0 .......XXX....... .......XXX.......

Annual Statement for the year 2002 of the TWIN CITY FIRE INSURANCE COMPANY
81
SCHEDULE P - PART 3R-SECTION 1 - PRODUCTS LIABILITY - OCCURRENCE Cumulative Paid Net Losses and Defense and Cost Containment Expenses Reported at Year End ($000 omitted) 11 12
1 2 3 4 5 6 7 8 9 10 Number of Number ofYears in Claims ClaimsWhich Closed Closed
Losses Were With Loss Without LossIncurred 1993 1994 1995 1996 1997 1998 1999 2000 2001 2002 Payment Payment
1. Prior..... ........000....... ..............649 ...........1,250 ...........1,849 ...........2,143 ...........2,667 ...........2,931 ...........3,189 ...........3,428 ...........3,664 ................24 ................732. 1993.... ................14 ................38 ................95 ..............155 ..............182 ..............235 ..............268 ..............295 ..............303 ..............326 .................5 .................63. 1994.... .......XXX....... ................35 ................84 ..............113 ..............181 ..............281 ..............297 ..............303 ..............320 ..............341 .................4 .................74. 1995.... .......XXX....... .......XXX....... ................57 ................80 ................89 ..............158 ..............195 ..............212 ..............229 ..............247 .................4 .................65. 1996.... .......XXX....... .......XXX....... .......XXX....... ................85 ..............109 ..............220 ..............239 ..............260 ..............280 ..............275 .................6 .................66. 1997.... .......XXX....... .......XXX....... .......XXX....... .......XXX....... ................11 ..............193 ..............240 ..............278 ..............312 ..............353 .................5 .................77. 1998.... .......XXX....... .......XXX....... .......XXX....... .......XXX....... .......XXX....... ..............(13) ................45 ..............115 ..............148 ..............166 .................6 .................78. 1999.... .......XXX....... .......XXX....... .......XXX....... .......XXX....... .......XXX....... .......XXX....... ..............(34) ..............(20) .................3 ................58 .................5 .................79. 2000.... .......XXX....... .......XXX....... .......XXX....... .......XXX....... .......XXX....... .......XXX....... .......XXX....... ................22 ................74 ..............126 .................5 .................8
10. 2001.... .......XXX....... .......XXX....... .......XXX....... .......XXX....... .......XXX....... .......XXX....... .......XXX....... .......XXX....... ................22 ................49 .................3 .................911. 2002.... .......XXX....... .......XXX....... .......XXX....... .......XXX....... .......XXX....... .......XXX....... .......XXX....... .......XXX....... .......XXX....... .................9 .................2 .................4
SCHEDULE P - PART 3R-SECTION 2 - PRODUCTS LIABILITY- CLAIMS-MADE1. Prior..... ........000....... .................1 .................5 .................5 .................5 .................5 .................4 .................2 .................2 .................3 .................0 .................02. 1993.... .................0 ................16 ................16 ................19 ................19 ................19 ................19 ................19 ................19 ................18 .................0 .................03. 1994.... .......XXX....... .................0 ................34 ................34 ................34 ................18 ................19 ..............(11) ..............(11) ..............(11) .................0 .................04. 1995.... .......XXX....... .......XXX....... .................0 .................0 .................0 .................0 .................4 .................4 .................4 .................4 .................0 .................05. 1996.... .......XXX....... .......XXX....... .......XXX....... .................0 .................6 .................7 .................7 .................7 .................7 .................7 .................0 .................06. 1997.... .......XXX....... .......XXX....... .......XXX....... .......XXX....... .................0 .................2 ................10 ................40 ................41 ................41 .................0 .................07. 1998.... .......XXX....... .......XXX....... .......XXX....... .......XXX....... .......XXX....... .................0 .................0 .................1 .................6 .................6 .................0 .................08. 1999.... .......XXX....... .......XXX....... .......XXX....... .......XXX....... .......XXX....... .......XXX....... .................0 .................5 .................7 ................10 .................0 .................09. 2000.... .......XXX....... .......XXX....... .......XXX....... .......XXX....... .......XXX....... .......XXX....... .......XXX....... ................(0) .................3 ................11 .................0 .................0
10. 2001.... .......XXX....... .......XXX....... .......XXX....... .......XXX....... .......XXX....... .......XXX....... .......XXX....... .......XXX....... .................0 .................2 .................0 .................011. 2002.... .......XXX....... .......XXX....... .......XXX....... .......XXX....... .......XXX....... .......XXX....... .......XXX....... .......XXX....... .......XXX....... .................1 .................0 .................0
SCHEDULE P - PART 3S - FINANCIAL GUARANTY/MORTGAGE GUARANTY1. Prior..... .......XXX....... .......XXX....... .......XXX....... .......XXX....... .......XXX....... .......XXX....... .......XXX....... ........000....... .................0 .................0 .......XXX....... .......XXX.......2. 2001.... .......XXX....... .......XXX....... .......XXX....... .......XXX....... .......XXX....... .......XXX....... .......XXX....... .......XXX....... .................0 .................0 .......XXX....... .......XXX.......3. 2002.... .......XXX....... .......XXX....... .......XXX....... .......XXX....... .......XXX....... .......XXX....... .......XXX....... .......XXX....... .......XXX....... .................0 .......XXX....... .......XXX.......
NONE

Annual Statement for the year 2002 of the TWIN CITY FIRE INSURANCE COMPANY
82
SCHEDULE P - PART 4A - HOMEOWNERS/FARMOWNERSBulk and IBNR Reserves on Net Losses and Defense and Cost Containment Expenses Reported at Year End ($000 omitted)
1 2 3 4 5 6 7 8 9 10Years in Which Losses Were
Incurred 1993 1994 1995 1996 1997 1998 1999 2000 2001 20021. Prior.............. .................132 ...................30 .....................2 ...................21 ...................47 ...................73 .....................9 ....................(3) ....................(6) .....................02. 1993............ .................214 ...................61 .....................5 .....................1 ...................14 .....................8 .....................1 ....................(1) .....................0 .....................13. 1994............ ........XXX......... .................268 ...................23 ...................15 .....................9 ...................64 .....................0 ....................(5) ....................(2) ....................(1)4. 1995............ ........XXX......... ........XXX......... .................278 ...................20 ...................23 ...................46 .....................5 ..................(22) ....................(3) ....................(1)5. 1996............ ........XXX......... ........XXX......... ........XXX......... .................411 ...................78 ...................63 ....................(2) .....................3 ..................(17) ..................(14)6. 1997............ ........XXX......... ........XXX......... ........XXX......... ........XXX......... .................404 .................164 .....................8 ....................(9) ..................(16) ..................(13)7. 1998............ ........XXX......... ........XXX......... ........XXX......... ........XXX......... ........XXX......... .................167 ...................56 .................116 ..................(12) ....................(6)8. 1999............ ........XXX......... ........XXX......... ........XXX......... ........XXX......... ........XXX......... ........XXX......... .................427 .................230 ....................(3) ....................(0)9. 2000............ ........XXX......... ........XXX......... ........XXX......... ........XXX......... ........XXX......... ........XXX......... ........XXX......... .................344 ...................26 ....................(1)
10. 2001............ ........XXX......... ........XXX......... ........XXX......... ........XXX......... ........XXX......... ........XXX......... ........XXX......... ........XXX......... .................534 ...................3211. 2002............ ........XXX......... ........XXX......... ........XXX......... ........XXX......... ........XXX......... ........XXX......... ........XXX......... ........XXX......... ........XXX......... .................810
SCHEDULE P - PART 4B - PRIVATE PASSENGER AUTO LIABILITY/MEDICAL1. Prior.............. ...............1,219 .................215 ..................(31) ..................(10) ..................(22) .....................3 ...................11 .................117 .................114 .................1352. 1993............ ...............2,571 .................627 .................103 .....................5 ..................(30) .....................2 .....................3 ...................67 .....................4 ...................193. 1994............ ........XXX......... ...............2,495 .................645 ...................10 ..................(36) ...................41 .....................3 ...................60 ...................44 ...................204. 1995............ ........XXX......... ........XXX......... ...............2,457 .................496 ...................81 ...................82 .....................3 ...................48 ...................56 ...................225. 1996............ ........XXX......... ........XXX......... ........XXX......... ...............2,764 ...............1,016 .................311 .................126 ...................27 ...................43 ...................296. 1997............ ........XXX......... ........XXX......... ........XXX......... ........XXX......... ...............2,962 .................980 .................418 ...................31 ...................57 ...................317. 1998............ ........XXX......... ........XXX......... ........XXX......... ........XXX......... ........XXX......... ...............2,570 .................475 .................200 ...................65 ...................318. 1999............ ........XXX......... ........XXX......... ........XXX......... ........XXX......... ........XXX......... ........XXX......... ...............2,779 .................950 .................261 ...................819. 2000............ ........XXX......... ........XXX......... ........XXX......... ........XXX......... ........XXX......... ........XXX......... ........XXX......... ...............2,889 .................605 .................156
10. 2001............ ........XXX......... ........XXX......... ........XXX......... ........XXX......... ........XXX......... ........XXX......... ........XXX......... ........XXX......... ...............3,348 ...............1,07211. 2002............ ........XXX......... ........XXX......... ........XXX......... ........XXX......... ........XXX......... ........XXX......... ........XXX......... ........XXX......... ........XXX......... ...............4,030
SCHEDULE P - PART 4C - COMMERCIAL AUTO/TRUCK LIABILITY/MEDICAL1. Prior.............. ...............1,563 .................654 .................344 .................422 .................425 .................332 ...................32 ...................40 ..................(91) ................(218)2. 1993............ ...............1,797 .................855 .................410 .................210 .................150 ...................96 ...................24 .....................6 .....................6 .....................83. 1994............ ........XXX......... ...............1,879 .................990 .................586 .................363 .................202 ...................84 ...................48 .....................3 .....................94. 1995............ ........XXX......... ........XXX......... ...............1,848 .................956 .................514 .................217 ...................86 ...................67 .....................3 .....................55. 1996............ ........XXX......... ........XXX......... ........XXX......... ...............1,884 ...............1,014 .................508 .................209 .................136 .....................1 .....................36. 1997............ ........XXX......... ........XXX......... ........XXX......... ........XXX......... ...............1,409 .................669 .................414 .................187 .....................2 ...................137. 1998............ ........XXX......... ........XXX......... ........XXX......... ........XXX......... ........XXX......... ...............1,424 .................648 .................114 ...................28 ...................108. 1999............ ........XXX......... ........XXX......... ........XXX......... ........XXX......... ........XXX......... ........XXX......... ...............1,862 .................650 .................105 ...................539. 2000............ ........XXX......... ........XXX......... ........XXX......... ........XXX......... ........XXX......... ........XXX......... ........XXX......... ...............2,110 .................714 .................124
10. 2001............ ........XXX......... ........XXX......... ........XXX......... ........XXX......... ........XXX......... ........XXX......... ........XXX......... ........XXX......... ...............1,936 .................55211. 2002............ ........XXX......... ........XXX......... ........XXX......... ........XXX......... ........XXX......... ........XXX......... ........XXX......... ........XXX......... ........XXX......... ...............1,954
SCHEDULE P - PART 4D - WORKERS' COMPENSATION1. Prior.............. ...............8,884 .............10,292 ...............9,361 ...............9,748 ...............9,079 ...............8,720 ...............8,084 ...............7,795 ...............6,056 ...............5,5292. 1993............ ...............6,869 ...............4,215 ...............3,010 ...............1,862 ...............1,521 .................786 ...............1,024 .................938 .................659 .................2633. 1994............ ........XXX......... ...............4,514 ...............2,439 ...............1,838 ...............1,461 ...............1,124 ...............1,104 ...............1,073 .................869 .................8194. 1995............ ........XXX......... ........XXX......... ...............4,733 ...............2,600 ...............1,820 ...............1,310 ...............1,184 ...............1,138 .................858 .................7555. 1996............ ........XXX......... ........XXX......... ........XXX......... ...............4,222 ...............2,265 ...............1,672 ...............1,464 ...............1,238 .................863 .................7646. 1997............ ........XXX......... ........XXX......... ........XXX......... ........XXX......... ...............4,145 ...............2,544 ...............1,679 ...............1,392 .................959 .................7297. 1998............ ........XXX......... ........XXX......... ........XXX......... ........XXX......... ........XXX......... ...............4,843 ...............2,420 ...............1,629 ...............1,657 ...............1,2658. 1999............ ........XXX......... ........XXX......... ........XXX......... ........XXX......... ........XXX......... ........XXX......... ...............3,662 ...............1,948 ...............1,510 .................9089. 2000............ ........XXX......... ........XXX......... ........XXX......... ........XXX......... ........XXX......... ........XXX......... ........XXX......... ...............3,928 ...............2,603 ...............1,033
10. 2001............ ........XXX......... ........XXX......... ........XXX......... ........XXX......... ........XXX......... ........XXX......... ........XXX......... ........XXX......... ...............7,304 ...............5,04711. 2002............ ........XXX......... ........XXX......... ........XXX......... ........XXX......... ........XXX......... ........XXX......... ........XXX......... ........XXX......... ........XXX......... ...............6,346
SCHEDULE P - PART 4E - COMMERCIAL MULTIPLE PERIL1. Prior.............. ...............4,187 ...............3,181 ...............1,743 ...............1,556 ...............1,513 ...............1,639 ...............1,368 .................892 ...................81 ...................672. 1993............ ...............2,524 .................865 .................131 .................269 .................192 .................173 .................114 .................135 ...................12 .....................33. 1994............ ........XXX......... ...............3,018 ...............2,033 .................932 .................741 .................493 .................159 .................168 ..................(30) .....................54. 1995............ ........XXX......... ........XXX......... ...............3,643 ...............1,825 ...............1,243 .................816 .................334 .................165 ..................(35) ....................(1)5. 1996............ ........XXX......... ........XXX......... ........XXX......... ...............3,194 ...............1,766 .................971 .................721 .................277 ...................72 ....................(2)6. 1997............ ........XXX......... ........XXX......... ........XXX......... ........XXX......... ...............2,857 ...............1,628 ...............1,153 .................341 ...................49 ....................(6)7. 1998............ ........XXX......... ........XXX......... ........XXX......... ........XXX......... ........XXX......... ...............1,959 ...............1,324 .................681 .................114 ...................428. 1999............ ........XXX......... ........XXX......... ........XXX......... ........XXX......... ........XXX......... ........XXX......... ...............2,723 ...............1,857 .................440 ...................589. 2000............ ........XXX......... ........XXX......... ........XXX......... ........XXX......... ........XXX......... ........XXX......... ........XXX......... ...............2,611 ...............1,472 .................568
10. 2001............ ........XXX......... ........XXX......... ........XXX......... ........XXX......... ........XXX......... ........XXX......... ........XXX......... ........XXX......... ...............4,502 ...............2,73711. 2002............ ........XXX......... ........XXX......... ........XXX......... ........XXX......... ........XXX......... ........XXX......... ........XXX......... ........XXX......... ........XXX......... ...............2,605

Annual Statement for the year 2002 of the TWIN CITY FIRE INSURANCE COMPANY
83
SCHEDULE P - PART 4F - SECTION 1 - MEDICAL MALPRACTICE - OCCURRENCEBulk and IBNR Reserves on Net Losses and Defense and Cost Containment Expenses Reported at Year End ($000 omitted)
1 2 3 4 5 6 7 8 9 10Years in Which Losses Were
Incurred 1993 1994 1995 1996 1997 1998 1999 2000 2001 20021. Prior.............. .................240 .................125 ...................55 .................108 ...................92 ...................10 ...................24 ...................28 ...................18 ...................102. 1993............ ...................37 .....................2 .....................1 .....................1 .....................1 .....................1 .....................0 .....................1 .....................0 .....................03. 1994............ ........XXX......... .....................0 .....................0 .....................5 .....................0 .....................0 .....................0 .....................0 .....................0 .....................04. 1995............ ........XXX......... ........XXX......... .....................0 .....................0 .....................1 .....................1 .....................0 .....................0 .....................1 .....................05. 1996............ ........XXX......... ........XXX......... ........XXX......... .....................1 .....................3 .....................5 .....................4 .....................1 .....................1 .....................06. 1997............ ........XXX......... ........XXX......... ........XXX......... ........XXX......... .....................1 .....................6 .....................2 .....................1 .....................1 .....................07. 1998............ ........XXX......... ........XXX......... ........XXX......... ........XXX......... ........XXX......... ...................26 .....................3 .....................4 .....................0 .....................08. 1999............ ........XXX......... ........XXX......... ........XXX......... ........XXX......... ........XXX......... ........XXX......... .....................2 .....................0 .....................0 .....................19. 2000............ ........XXX......... ........XXX......... ........XXX......... ........XXX......... ........XXX......... ........XXX......... ........XXX......... .....................0 .....................0 .....................2
10. 2001............ ........XXX......... ........XXX......... ........XXX......... ........XXX......... ........XXX......... ........XXX......... ........XXX......... ........XXX......... .....................0 .....................511. 2002............ ........XXX......... ........XXX......... ........XXX......... ........XXX......... ........XXX......... ........XXX......... ........XXX......... ........XXX......... ........XXX......... .....................4
SCHEDULE P - PART 4F - SECTION 2 - MEDICAL MALPRACTICE - CLAIMS-MADE1. Prior.............. .................188 .................103 ...................62 ...................10 ...................24 ...................14 .....................1 .....................1 ...................15 .....................42. 1993............ .................148 ...................85 ...................58 ...................21 ...................22 ...................12 .....................1 .....................3 .....................0 .....................03. 1994............ ........XXX......... .................126 ...................91 ...................67 ...................30 ...................11 .....................7 .....................7 .....................9 ...................124. 1995............ ........XXX......... ........XXX......... .................106 ...................78 ...................50 ...................21 ...................12 ...................13 ...................17 ...................215. 1996............ ........XXX......... ........XXX......... ........XXX......... .................105 ...................11 ...................44 ...................32 ...................30 ...................28 ...................356. 1997............ ........XXX......... ........XXX......... ........XXX......... ........XXX......... .................105 ...................83 ...................51 ...................32 ...................25 ...................347. 1998............ ........XXX......... ........XXX......... ........XXX......... ........XXX......... ........XXX......... .................113 ...................81 ...................86 ...................72 ...................848. 1999............ ........XXX......... ........XXX......... ........XXX......... ........XXX......... ........XXX......... ........XXX......... .....................6 ...................25 ...................22 ...................229. 2000............ ........XXX......... ........XXX......... ........XXX......... ........XXX......... ........XXX......... ........XXX......... ........XXX......... ....................(0) .....................0 .....................0
10. 2001............ ........XXX......... ........XXX......... ........XXX......... ........XXX......... ........XXX......... ........XXX......... ........XXX......... ........XXX......... .....................0 .....................011. 2002............ ........XXX......... ........XXX......... ........XXX......... ........XXX......... ........XXX......... ........XXX......... ........XXX......... ........XXX......... ........XXX......... .....................0
SCHEDULE P - PART 4G - SPECIAL LIABILITY (OCEAN MARINE,AIRCRAFT (ALL PERILS), BOILER AND MACHINERY)
1. Prior.............. ...................27 ...................22 ...................25 ..................(38) ...................13 ...................27 ...................30 ...................17 .....................5 ...................122. 1993............ ...................80 ...................29 ...................10 .....................3 .....................2 .....................1 .....................4 .....................1 .....................1 .....................23. 1994............ ........XXX......... ...................89 ...................25 ...................14 .....................4 .....................1 .....................3 ....................(1) .....................2 .....................34. 1995............ ........XXX......... ........XXX......... .................150 ...................53 ...................15 .....................2 .....................2 ....................(0) .....................2 .....................25. 1996............ ........XXX......... ........XXX......... ........XXX......... .................201 ...................76 ...................14 .....................3 ..................(18) .....................1 ....................(2)6. 1997............ ........XXX......... ........XXX......... ........XXX......... ........XXX......... .................135 ...................60 ...................12 ..................(19) .....................1 .....................07. 1998............ ........XXX......... ........XXX......... ........XXX......... ........XXX......... ........XXX......... .................130 ...................65 .....................2 .....................3 .....................18. 1999............ ........XXX......... ........XXX......... ........XXX......... ........XXX......... ........XXX......... ........XXX......... .................107 ..................(28) ...................12 .....................39. 2000............ ........XXX......... ........XXX......... ........XXX......... ........XXX......... ........XXX......... ........XXX......... ........XXX......... ...................94 ...................27 ...................11
10. 2001............ ........XXX......... ........XXX......... ........XXX......... ........XXX......... ........XXX......... ........XXX......... ........XXX......... ........XXX......... ...................44 ...................1111. 2002............ ........XXX......... ........XXX......... ........XXX......... ........XXX......... ........XXX......... ........XXX......... ........XXX......... ........XXX......... ........XXX......... ...................80
SCHEDULE P - PART 4H - SECTION 1 - OTHER LIABILITY - OCCURRENCE1. Prior.............. .............15,363 .............12,946 .............11,561 .............12,848 .............10,939 ...............9,289 ...............8,126 ...............6,146 ...............2,428 ...............1,7642. 1993............ ...............2,744 ...............2,036 ...............1,488 .................965 .................729 .................887 .................692 .................605 .................509 .................2313. 1994............ ........XXX......... ...............2,707 ...............2,130 ...............1,678 ...............1,347 ...............1,124 ...............1,299 .................735 .................615 .................5154. 1995............ ........XXX......... ........XXX......... ...............3,120 ...............2,476 ...............2,177 ...............1,611 ...............1,069 .................887 .................679 .................4915. 1996............ ........XXX......... ........XXX......... ........XXX......... ...............2,877 ...............2,436 ...............1,478 ...............1,349 ...............1,061 .................758 .................7366. 1997............ ........XXX......... ........XXX......... ........XXX......... ........XXX......... ...............4,169 ...............3,387 ...............1,676 ...............1,105 .................949 .................7857. 1998............ ........XXX......... ........XXX......... ........XXX......... ........XXX......... ........XXX......... ...............3,712 ...............2,080 ...............1,155 .................774 .................9538. 1999............ ........XXX......... ........XXX......... ........XXX......... ........XXX......... ........XXX......... ........XXX......... ...............2,803 ...............2,562 ...............1,839 ...............1,4269. 2000............ ........XXX......... ........XXX......... ........XXX......... ........XXX......... ........XXX......... ........XXX......... ........XXX......... ...............3,489 ...............2,688 ...............2,030
10. 2001............ ........XXX......... ........XXX......... ........XXX......... ........XXX......... ........XXX......... ........XXX......... ........XXX......... ........XXX......... ...............3,780 ...............3,45411. 2002............ ........XXX......... ........XXX......... ........XXX......... ........XXX......... ........XXX......... ........XXX......... ........XXX......... ........XXX......... ........XXX......... ...............3,315
SCHEDULE P - PART 4H - SECTION 2 - OTHER LIABILITY - CLAIMS-MADE1. Prior.............. .....................1 ...................26 ...................19 ...................31 ...................78 .................119 .....................6 .....................1 .....................0 ....................(0)2. 1993............ .....................7 ...................88 ...................55 ...................53 ...................80 ...................61 .....................8 .....................5 .....................3 ....................(0)3. 1994............ ........XXX......... .................476 .................206 .................104 .................120 ...................82 .....................9 .....................3 .....................3 .....................04. 1995............ ........XXX......... ........XXX......... .................495 .................202 .................152 ...................69 ...................12 .....................5 .....................1 .....................05. 1996............ ........XXX......... ........XXX......... ........XXX......... .................451 .................272 ...................90 ...................20 .....................9 .....................2 ....................(0)6. 1997............ ........XXX......... ........XXX......... ........XXX......... ........XXX......... .................384 .................249 ...................52 ...................28 .....................9 .....................07. 1998............ ........XXX......... ........XXX......... ........XXX......... ........XXX......... ........XXX......... .................237 .................176 ...................64 ...................25 ....................(2)8. 1999............ ........XXX......... ........XXX......... ........XXX......... ........XXX......... ........XXX......... ........XXX......... .................407 .................160 ...................35 ....................(3)9. 2000............ ........XXX......... ........XXX......... ........XXX......... ........XXX......... ........XXX......... ........XXX......... ........XXX......... .................717 .................323 .................162
10. 2001............ ........XXX......... ........XXX......... ........XXX......... ........XXX......... ........XXX......... ........XXX......... ........XXX......... ........XXX......... ...............1,250 .................83411. 2002............ ........XXX......... ........XXX......... ........XXX......... ........XXX......... ........XXX......... ........XXX......... ........XXX......... ........XXX......... ........XXX......... ...............1,741

Annual Statement for the year 2002 of the TWIN CITY FIRE INSURANCE COMPANY
84
SCHEDULE P - PART 4I - SPECIAL PROPERTY (FIRE, ALLIED LINES, INLAND MARINE,EARTHQUAKE, BURGLARY AND THEFT)
Bulk and IBNR Reserves on Net Losses and Defense and Cost Containment Expenses Reported at Year End ($000 omitted)Years in Which 1 2 3 4 5 6 7 8 9 10 Losses Were
Incurred 1993 1994 1995 1996 1997 1998 1999 2000 2001 20021. Prior.............. ........XXX......... ........XXX......... ........XXX......... ........XXX......... ........XXX......... ........XXX......... ........XXX......... .................563 ...................19 ..................(47)2. 2001............ ........XXX......... ........XXX......... ........XXX......... ........XXX......... ........XXX......... ........XXX......... ........XXX......... ........XXX......... .................955 .................1543. 2002............ ........XXX......... ........XXX......... ........XXX......... ........XXX......... ........XXX......... ........XXX......... ........XXX......... ........XXX......... ........XXX......... ...............1,605
SCHEDULE P - PART 4J - AUTO PHYSICAL DAMAGE1. Prior.............. ........XXX......... ........XXX......... ........XXX......... ........XXX......... ........XXX......... ........XXX......... ........XXX......... .................202 ................(133) ..................(73)2. 2001............ ........XXX......... ........XXX......... ........XXX......... ........XXX......... ........XXX......... ........XXX......... ........XXX......... ........XXX......... .................310 ...................323. 2002............ ........XXX......... ........XXX......... ........XXX......... ........XXX......... ........XXX......... ........XXX......... ........XXX......... ........XXX......... ........XXX......... .................111
SCHEDULE P - PART 4K - FIDELITY/SURETY1. Prior.............. ........XXX......... ........XXX......... ........XXX......... ........XXX......... ........XXX......... ........XXX......... ........XXX......... .................671 ..................(38) ..................(58)2. 2001............ ........XXX......... ........XXX......... ........XXX......... ........XXX......... ........XXX......... ........XXX......... ........XXX......... ........XXX......... .................539 ...................553. 2002............ ........XXX......... ........XXX......... ........XXX......... ........XXX......... ........XXX......... ........XXX......... ........XXX......... ........XXX......... ........XXX......... .................442
SCHEDULE P - PART 4L - OTHER (INCLUDING CREDIT, ACCIDENT AND HEALTH)1. Prior.............. ........XXX......... ........XXX......... ........XXX......... ........XXX......... ........XXX......... ........XXX......... ........XXX......... .....................7 .....................4 .....................72. 2001............ ........XXX......... ........XXX......... ........XXX......... ........XXX......... ........XXX......... ........XXX......... ........XXX......... ........XXX......... .....................5 .....................63. 2002............ ........XXX......... ........XXX......... ........XXX......... ........XXX......... ........XXX......... ........XXX......... ........XXX......... ........XXX......... ........XXX......... .....................0
SCHEDULE P - PART 4M - INTERNATIONAL1. Prior.............. .................218 .................119 ..................(36) ...................99 .................220 .................103 ...................99 ...................69 .....................0 .....................02. 1993............ .................241 .................300 .................173 ...................69 .................131 ...................43 ...................44 ...................44 .....................0 .....................03. 1994............ ........XXX......... .................220 .................139 ...................99 .................229 ...................91 ...................93 ...................95 .....................0 .....................04. 1995............ ........XXX......... ........XXX......... .................464 .................384 ...................63 ...................14 ...................14 .....................1 .....................0 .....................05. 1996............ ........XXX......... ........XXX......... ........XXX......... ...................63 ...................78 ...................50 ...................25 .....................2 .....................0 .....................06. 1997............ ........XXX......... ........XXX......... ........XXX......... ........XXX......... .................114 .................170 ...................83 .....................0 .....................1 .....................07. 1998............ ........XXX......... ........XXX......... ........XXX......... ........XXX......... ........XXX......... ...................52 ...................46 .....................5 .....................2 .....................28. 1999............ ........XXX......... ........XXX......... ........XXX......... ........XXX......... ........XXX......... ........XXX......... ...................57 ...................32 ...................11 .....................19. 2000............ ........XXX......... ........XXX......... ........XXX......... ........XXX......... ........XXX......... ........XXX......... ........XXX......... .................222 ...................33 ...................12
10. 2001............ ........XXX......... ........XXX......... ........XXX......... ........XXX......... ........XXX......... ........XXX......... ........XXX......... ........XXX......... .................254 ...................5211. 2002............ ........XXX......... ........XXX......... ........XXX......... ........XXX......... ........XXX......... ........XXX......... ........XXX......... ........XXX......... ........XXX......... .................199

Annual Statement for the year 2002 of the TWIN CITY FIRE INSURANCE COMPANY
85
SCHEDULE P - PART 4N - REINSURANCENONPROPORTIONAL ASSUMED PROPERTY
Bulk and IBNR Reserves on Net Losses and Defense and Cost Containment Expenses Reported at Year End ($000 omitted)1 2 3 4 5 6 7 8 9 10
Years in Which Losses Were
Incurred 1993 1994 1995 1996 1997 1998 1999 2000 2001 20021. Prior.............. ...................83 .....................0 .....................0 .....................0 .....................5 .....................0 .....................0 .....................0 .....................0 .....................02. 1993............ .................465 ...................88 .....................0 .....................0 ...................12 .....................2 ...................12 .....................0 .....................0 .....................03. 1994............ ........XXX......... .................443 ...................79 .....................0 ...................23 .....................5 .....................0 .....................0 .....................0 .....................04. 1995............ ........XXX......... ........XXX......... .................444 .................108 .................105 .....................9 ...................31 .....................0 .....................0 .....................05. 1996............ ........XXX......... ........XXX......... ........XXX......... .................393 .................268 ...................41 .................116 .....................0 .....................0 .....................06. 1997............ ........XXX......... ........XXX......... ........XXX......... ........XXX......... .................345 .................105 .................147 .....................2 .....................0 .....................07. 1998............ ........XXX......... ........XXX......... ........XXX......... ........XXX......... ........XXX......... .................136 ...................48 ...................16 ...................10 .....................08. 1999............ ........XXX......... ........XXX......... ........XXX......... ........XXX......... ........XXX......... ........XXX......... .................510 ................(393) ...................11 ...................369. 2000............ ........XXX......... ........XXX......... ........XXX......... ........XXX......... ........XXX......... ........XXX......... ........XXX......... .................479 ...................90 ...................37
10. 2001............ ........XXX......... ........XXX......... ........XXX......... ........XXX......... ........XXX......... ........XXX......... ........XXX......... ........XXX......... ...............2,124 ...............1,76011. 2002............ ........XXX......... ........XXX......... ........XXX......... ........XXX......... ........XXX......... ........XXX......... ........XXX......... ........XXX......... ........XXX......... ...............1,075
SCHEDULE P - PART 4O - REINSURANCENONPROPORTIONAL ASSUMED LIABILITY
1. Prior.............. .................827 .................647 .................579 ...............7,692 ...............6,683 ...............4,611 ...............3,335 ...............2,143 .................119 ...................332. 1993............ .................836 .................597 .................499 .................398 .................274 .................132 ...................58 ...................77 ...................66 ...................233. 1994............ ........XXX......... .................875 .................762 .................609 .................451 ...................87 .................168 ...................97 ...................97 ...................384. 1995............ ........XXX......... ........XXX......... ...............1,219 .................767 .................630 .................300 .................195 .................156 .................213 .................1025. 1996............ ........XXX......... ........XXX......... ........XXX......... ...............1,421 ...............1,615 ...............1,145 .................891 .................350 .................309 .................1646. 1997............ ........XXX......... ........XXX......... ........XXX......... ........XXX......... .................660 ...............1,034 .................384 .................486 .................377 .................2747. 1998............ ........XXX......... ........XXX......... ........XXX......... ........XXX......... ........XXX......... ...............1,641 ...............1,296 .................871 .................644 .................3938. 1999............ ........XXX......... ........XXX......... ........XXX......... ........XXX......... ........XXX......... ........XXX......... .................782 .................463 .................193 .................5469. 2000............ ........XXX......... ........XXX......... ........XXX......... ........XXX......... ........XXX......... ........XXX......... ........XXX......... ...............1,528 .................859 .................523
10. 2001............ ........XXX......... ........XXX......... ........XXX......... ........XXX......... ........XXX......... ........XXX......... ........XXX......... ........XXX......... ...............1,552 ...............1,07511. 2002............ ........XXX......... ........XXX......... ........XXX......... ........XXX......... ........XXX......... ........XXX......... ........XXX......... ........XXX......... ........XXX......... .................825
SCHEDULE P - PART 4P - REINSURANCENONPROPORTIONAL ASSUMED FINANCIAL LINES
1. Prior.............. .....................0 .....................0 .....................0 .....................0 .....................0 .....................0 .....................0 .....................0 .....................0 .....................02. 1993............ .....................0 .....................0 .....................0 .....................0 .....................0 .....................0 .....................0 .....................0 .....................0 .....................03. 1994............ ........XXX......... .....................0 .....................0 .....................0 .....................0 .....................0 .....................0 .....................0 .....................0 .....................04. 1995............ ........XXX......... ........XXX......... .....................0 .....................0 .....................0 .....................3 .....................0 .....................0 .....................0 .....................05. 1996............ ........XXX......... ........XXX......... ........XXX......... .....................0 .....................0 .....................3 .....................0 .....................0 .....................0 .....................06. 1997............ ........XXX......... ........XXX......... ........XXX......... ........XXX......... .....................0 .....................2 .....................0 .....................0 .....................0 .....................07. 1998............ ........XXX......... ........XXX......... ........XXX......... ........XXX......... ........XXX......... .....................6 .....................0 .....................1 .....................0 .....................08. 1999............ ........XXX......... ........XXX......... ........XXX......... ........XXX......... ........XXX......... ........XXX......... .....................9 .....................2 .....................0 .....................09. 2000............ ........XXX......... ........XXX......... ........XXX......... ........XXX......... ........XXX......... ........XXX......... ........XXX......... .....................7 .....................0 .....................0
10. 2001............ ........XXX......... ........XXX......... ........XXX......... ........XXX......... ........XXX......... ........XXX......... ........XXX......... ........XXX......... ...................67 ...................2711. 2002............ ........XXX......... ........XXX......... ........XXX......... ........XXX......... ........XXX......... ........XXX......... ........XXX......... ........XXX......... ........XXX......... ...................29

Annual Statement for the year 2002 of the TWIN CITY FIRE INSURANCE COMPANY
86
SCHEDULE P - PART 4R-SECTION 1 - PRODUCTS LIABILITY - OCCURRENCEBulk and IBNR Reserves on Net Losses and Defense and Cost Containment Expenses Reported at Year End ($000 omitted)
1 2 3 4 5 6 7 8 9 10Years in Which Losses Were
Incurred 1993 1994 1995 1996 1997 1998 1999 2000 2001 20021. Prior.............. ...............2,530 ...............2,240 ...............1,856 ...............2,678 ...............2,159 ...............2,014 ...............1,680 ...............1,485 .................275 .................1522. 1993............ .................287 .................224 .................216 ...................83 ...................32 ...................51 ...................52 ...................73 .....................8 ...................383. 1994............ ........XXX......... .................492 .................449 .................522 .................383 .................170 .................102 .................116 ...................24 ...................524. 1995............ ........XXX......... ........XXX......... .................496 .................451 .................375 .................115 ...................52 ...................89 ...................44 ...................575. 1996............ ........XXX......... ........XXX......... ........XXX......... .................444 .................429 .................175 ...................85 .................116 ...................98 .................1106. 1997............ ........XXX......... ........XXX......... ........XXX......... ........XXX......... .................179 .................124 .................206 .................209 .................134 .................2047. 1998............ ........XXX......... ........XXX......... ........XXX......... ........XXX......... ........XXX......... .................211 .................266 .................200 .................151 .................1498. 1999............ ........XXX......... ........XXX......... ........XXX......... ........XXX......... ........XXX......... ........XXX......... .................438 .................268 .................101 .................1359. 2000............ ........XXX......... ........XXX......... ........XXX......... ........XXX......... ........XXX......... ........XXX......... ........XXX......... .................464 .................142 .................325
10. 2001............ ........XXX......... ........XXX......... ........XXX......... ........XXX......... ........XXX......... ........XXX......... ........XXX......... ........XXX......... ...............2,157 .................51911. 2002............ ........XXX......... ........XXX......... ........XXX......... ........XXX......... ........XXX......... ........XXX......... ........XXX......... ........XXX......... ........XXX......... .................473
SCHEDULE P - PART 4R-SECTION 2 - PRODUCTS LIABILITY - CLAIMS-MADE1. Prior.............. .....................7 .....................0 .....................0 .....................0 .....................0 .....................3 .....................0 .....................0 .....................0 .....................02. 1993............ ...................10 .....................9 .....................4 .....................0 .....................0 .....................1 .....................0 .....................0 .....................0 .....................03. 1994............ ........XXX......... .....................7 .....................0 .....................0 .....................1 .....................2 .....................0 ...................15 .....................0 .....................04. 1995............ ........XXX......... ........XXX......... .....................8 .....................3 .....................5 .....................1 ....................(0) .....................0 .....................0 .....................05. 1996............ ........XXX......... ........XXX......... ........XXX......... .....................5 ...................18 ...................23 .....................6 .....................4 .....................0 .....................06. 1997............ ........XXX......... ........XXX......... ........XXX......... ........XXX......... ...................66 ...................35 ...................15 .....................5 ....................(0) .....................07. 1998............ ........XXX......... ........XXX......... ........XXX......... ........XXX......... ........XXX......... ...................22 ...................14 ...................10 .....................0 .....................08. 1999............ ........XXX......... ........XXX......... ........XXX......... ........XXX......... ........XXX......... ........XXX......... ...................46 ...................19 .....................0 .....................19. 2000............ ........XXX......... ........XXX......... ........XXX......... ........XXX......... ........XXX......... ........XXX......... ........XXX......... ...................26 .....................5 .....................2
10. 2001............ ........XXX......... ........XXX......... ........XXX......... ........XXX......... ........XXX......... ........XXX......... ........XXX......... ........XXX......... ...................59 ...................1511. 2002............ ........XXX......... ........XXX......... ........XXX......... ........XXX......... ........XXX......... ........XXX......... ........XXX......... ........XXX......... ........XXX......... ...................37
SCHEDULE P - PART 4S - FINANCIAL GUARANTY/MORTGAGE GUARANTY1. Prior.............. ........XXX......... ........XXX......... ........XXX......... ........XXX......... ........XXX......... ........XXX......... ........XXX......... .....................0 .....................0 .....................02. 2001............ ........XXX......... ........XXX......... ........XXX......... ........XXX......... ........XXX......... ........XXX......... ........XXX......... ........XXX......... .....................0 .....................03. 2002............ ........XXX......... ........XXX......... ........XXX......... ........XXX......... ........XXX......... ........XXX......... ........XXX......... ........XXX......... ........XXX......... .....................0
NONE

Annual Statement for the year 2002 of the TWIN CITY FIRE INSURANCE COMPANY
87
SCHEDULE P - PART 5A - HOMEOWNERS/FARMOWNERSSECTION 1
Cumulative Number of Claims Closed with Loss Payment Direct and Assumed at Year EndYears in Which 1 2 3 4 5 6 7 8 9 10
Premiums Were Earnedand Losses Were Incurred 1993 1994 1995 1996 1997 1998 1999 2000 2001 2002
1. Prior.................... ................221 ..................13 ....................4 ....................2 ....................1 ....................1 ....................1 ....................0 ....................1 ....................1
2. 1993.................. .............1,118 .............1,264 .............1,270 .............1,273 .............1,273 .............1,274 .............1,274 .............1,274 .............1,274 .............1,274
3. 1994.................. ........XXX........ .............1,203 .............1,390 .............1,398 .............1,399 .............1,399 .............1,400 .............1,400 .............1,400 .............1,400
4. 1995.................. ........XXX........ ........XXX........ .............1,095 .............1,308 .............1,315 .............1,316 .............1,318 .............1,318 .............1,318 .............1,318
5. 1996.................. ........XXX........ ........XXX........ ........XXX........ .............1,546 .............1,769 .............1,776 .............1,777 .............1,779 .............1,779 .............1,779
6. 1997.................. ........XXX........ ........XXX........ ........XXX........ ........XXX........ .............1,005 .............1,159 .............1,164 .............1,167 .............1,167 .............1,168
7. 1998.................. ........XXX........ ........XXX........ ........XXX........ ........XXX........ ........XXX........ .............1,092 .............1,255 .............1,263 .............1,265 .............1,265
8. 1999.................. ........XXX........ ........XXX........ ........XXX........ ........XXX........ ........XXX........ ........XXX........ .............1,139 .............1,296 .............1,304 .............1,305
9. 2000.................. ........XXX........ ........XXX........ ........XXX........ ........XXX........ ........XXX........ ........XXX........ ........XXX........ .............1,028 .............1,285 .............1,291
10. 2001.................. ........XXX........ ........XXX........ ........XXX........ ........XXX........ ........XXX........ ........XXX........ ........XXX........ ........XXX........ .............1,176 .............1,338
11. 2002.................. ........XXX........ ........XXX........ ........XXX........ ........XXX........ ........XXX........ ........XXX........ ........XXX........ ........XXX........ ........XXX........ .............1,004
SECTION 2Number of Claims Outstanding Direct and Assumed at Year End
Years in Which 1 2 3 4 5 6 7 8 9 10 Premiums Were Earned
and Losses Were Incurred 1993 1994 1995 1996 1997 1998 1999 2000 2001 2002
1. Prior.................... ..................31 ..................22 ..................20 ..................18 ..................17 ..................16 ..................15 ..................16 ..................15 ..................14
2. 1993.................. ................124 ..................15 ..................10 ....................9 ....................8 ....................7 ....................7 ....................7 ....................6 ....................6
3. 1994.................. ........XXX........ ................178 ..................16 ..................11 ..................10 ....................9 ....................9 ....................8 ....................8 ....................8
4. 1995.................. ........XXX........ ........XXX........ ................187 ..................18 ..................13 ..................12 ..................11 ..................10 ..................10 ..................10
5. 1996.................. ........XXX........ ........XXX........ ........XXX........ ................199 ..................21 ..................17 ..................16 ..................15 ..................14 ..................14
6. 1997.................. ........XXX........ ........XXX........ ........XXX........ ........XXX........ ................140 ..................17 ..................14 ..................11 ..................10 ..................10
7. 1998.................. ........XXX........ ........XXX........ ........XXX........ ........XXX........ ........XXX........ ................146 ..................17 ..................11 ....................9 ....................9
8. 1999.................. ........XXX........ ........XXX........ ........XXX........ ........XXX........ ........XXX........ ........XXX........ ................149 ..................17 ..................12 ..................10
9. 2000.................. ........XXX........ ........XXX........ ........XXX........ ........XXX........ ........XXX........ ........XXX........ ........XXX........ ................184 ..................19 ..................15
10. 2001.................. ........XXX........ ........XXX........ ........XXX........ ........XXX........ ........XXX........ ........XXX........ ........XXX........ ........XXX........ ................120 ..................21
11. 2002.................. ........XXX........ ........XXX........ ........XXX........ ........XXX........ ........XXX........ ........XXX........ ........XXX........ ........XXX........ ........XXX........ ................149
SECTION 3Cumulative Number of Claims Reported Direct and Assumed at Year End
Years in Which 1 2 3 4 5 6 7 8 9 10 Premiums Were Earned
and Losses Were Incurred 1993 1994 1995 1996 1997 1998 1999 2000 2001 2002
1. Prior.................... ................122 ..................10 ....................4 ....................2 ....................2 ....................1 ....................0 ....................1 ....................0 ....................1
2. 1993.................. .............1,598 .............1,681 .............1,686 .............1,688 .............1,689 .............1,690 .............1,690 .............1,690 .............1,690 .............1,690
3. 1994.................. ........XXX........ .............1,810 .............1,890 .............1,896 .............1,899 .............1,899 .............1,900 .............1,900 .............1,900 .............1,901
4. 1995.................. ........XXX........ ........XXX........ .............1,741 .............1,847 .............1,853 .............1,855 .............1,856 .............1,857 .............1,857 .............1,857
5. 1996.................. ........XXX........ ........XXX........ ........XXX........ .............2,288 .............2,413 .............2,419 .............2,422 .............2,422 .............2,423 .............2,424
6. 1997.................. ........XXX........ ........XXX........ ........XXX........ ........XXX........ .............1,557 .............1,637 .............1,642 .............1,645 .............1,646 .............1,646
7. 1998.................. ........XXX........ ........XXX........ ........XXX........ ........XXX........ ........XXX........ .............1,688 .............1,773 .............1,779 .............1,781 .............1,782
8. 1999.................. ........XXX........ ........XXX........ ........XXX........ ........XXX........ ........XXX........ ........XXX........ .............1,784 .............1,863 .............1,869 .............1,871
9. 2000.................. ........XXX........ ........XXX........ ........XXX........ ........XXX........ ........XXX........ ........XXX........ ........XXX........ .............1,655 .............1,808 .............1,815
10. 2001.................. ........XXX........ ........XXX........ ........XXX........ ........XXX........ ........XXX........ ........XXX........ ........XXX........ ........XXX........ .............1,770 .............1,885
11. 2002.................. ........XXX........ ........XXX........ ........XXX........ ........XXX........ ........XXX........ ........XXX........ ........XXX........ ........XXX........ ........XXX........ .............1,603

Annual Statement for the year 2002 of the TWIN CITY FIRE INSURANCE COMPANY
88
SCHEDULE P - PART 5B - PRIVATE PASSENGER AUTO LIABILITY/MEDICALSECTION 1
Cumulative Number of Claims Closed with Loss Payment Direct and Assumed at Year EndYears in Which 1 2 3 4 5 6 7 8 9 10
Premiums Were Earnedand Losses Were Incurred 1993 1994 1995 1996 1997 1998 1999 2000 2001 2002
1. Prior.................... ................687 ................123 ..................40 ..................14 ....................7 ....................2 ....................2 ....................0 ....................0 ....................0
2. 1993.................. .............1,362 .............1,950 .............2,047 .............2,073 .............2,081 .............2,085 .............2,087 .............2,088 .............2,088 .............2,087
3. 1994.................. ........XXX........ .............1,465 .............2,060 .............2,147 .............2,173 .............2,182 .............2,187 .............2,189 .............2,189 .............2,189
4. 1995.................. ........XXX........ ........XXX........ .............1,413 .............1,971 .............2,056 .............2,076 .............2,087 .............2,091 .............2,091 .............2,091
5. 1996.................. ........XXX........ ........XXX........ ........XXX........ .............1,378 .............1,931 .............2,009 .............2,036 .............2,046 .............2,049 .............2,049
6. 1997.................. ........XXX........ ........XXX........ ........XXX........ ........XXX........ .............1,343 .............1,859 .............1,945 .............1,970 .............1,980 .............1,982
7. 1998.................. ........XXX........ ........XXX........ ........XXX........ ........XXX........ ........XXX........ .............1,376 .............1,945 .............2,039 .............2,066 .............2,077
8. 1999.................. ........XXX........ ........XXX........ ........XXX........ ........XXX........ ........XXX........ ........XXX........ .............1,536 .............2,200 .............2,300 .............2,330
9. 2000.................. ........XXX........ ........XXX........ ........XXX........ ........XXX........ ........XXX........ ........XXX........ ........XXX........ .............1,668 .............2,368 .............2,469
10. 2001.................. ........XXX........ ........XXX........ ........XXX........ ........XXX........ ........XXX........ ........XXX........ ........XXX........ ........XXX........ .............1,673 .............2,463
11. 2002.................. ........XXX........ ........XXX........ ........XXX........ ........XXX........ ........XXX........ ........XXX........ ........XXX........ ........XXX........ ........XXX........ .............1,789
SECTION 2Number of Claims Outstanding Direct and Assumed at Year End
Years in Which 1 2 3 4 5 6 7 8 9 10 Premiums Were Earned
and Losses Were Incurred 1993 1994 1995 1996 1997 1998 1999 2000 2001 2002
1. Prior.................... ................228 ................114 ..................71 ..................53 ..................43 ..................39 ..................37 ..................35 ..................33 ..................32
2. 1993.................. ................601 ................135 ..................56 ..................32 ..................20 ..................15 ..................13 ..................11 ..................10 ....................9
3. 1994.................. ........XXX........ ................610 ................128 ..................59 ..................34 ..................24 ..................18 ..................15 ..................13 ..................12
4. 1995.................. ........XXX........ ........XXX........ ................586 ................124 ..................54 ..................35 ..................23 ..................17 ..................15 ..................13
5. 1996.................. ........XXX........ ........XXX........ ........XXX........ ................610 ................123 ..................58 ..................33 ..................21 ..................15 ..................14
6. 1997.................. ........XXX........ ........XXX........ ........XXX........ ........XXX........ ................598 ................129 ..................59 ..................32 ..................20 ..................15
7. 1998.................. ........XXX........ ........XXX........ ........XXX........ ........XXX........ ........XXX........ ................644 ................146 ..................62 ..................34 ..................20
8. 1999.................. ........XXX........ ........XXX........ ........XXX........ ........XXX........ ........XXX........ ........XXX........ ................785 ................156 ..................70 ..................40
9. 2000.................. ........XXX........ ........XXX........ ........XXX........ ........XXX........ ........XXX........ ........XXX........ ........XXX........ ................773 ................165 ..................78
10. 2001.................. ........XXX........ ........XXX........ ........XXX........ ........XXX........ ........XXX........ ........XXX........ ........XXX........ ........XXX........ ................871 ................153
11. 2002.................. ........XXX........ ........XXX........ ........XXX........ ........XXX........ ........XXX........ ........XXX........ ........XXX........ ........XXX........ ........XXX........ ................819
SECTION 3Cumulative Number of Claims Reported Direct and Assumed at Year End
Years in Which 1 2 3 4 5 6 7 8 9 10 Premiums Were Earned
and Losses Were Incurred 1993 1994 1995 1996 1997 1998 1999 2000 2001 2002
1. Prior.................... ................310 ..................30 ..................11 ....................3 ....................1 ....................0 ....................0 ....................0 ....................0 ....................0
2. 1993.................. .............2,417 .............2,658 .............2,687 .............2,696 .............2,698 .............2,699 .............2,700 .............2,700 .............2,700 .............2,700
3. 1994.................. ........XXX........ .............2,542 .............2,773 .............2,801 .............2,809 .............2,811 .............2,812 .............2,812 .............2,813 .............2,813
4. 1995.................. ........XXX........ ........XXX........ .............2,460 .............2,661 .............2,685 .............2,692 .............2,694 .............2,695 .............2,695 .............2,695
5. 1996.................. ........XXX........ ........XXX........ ........XXX........ .............2,457 .............2,633 .............2,654 .............2,661 .............2,663 .............2,664 .............2,664
6. 1997.................. ........XXX........ ........XXX........ ........XXX........ ........XXX........ .............2,419 .............2,572 .............2,595 .............2,600 .............2,602 .............2,603
7. 1998.................. ........XXX........ ........XXX........ ........XXX........ ........XXX........ ........XXX........ .............2,564 .............2,748 .............2,769 .............2,776 .............2,778
8. 1999.................. ........XXX........ ........XXX........ ........XXX........ ........XXX........ ........XXX........ ........XXX........ .............3,057 .............3,255 .............3,278 .............3,286
9. 2000.................. ........XXX........ ........XXX........ ........XXX........ ........XXX........ ........XXX........ ........XXX........ ........XXX........ .............3,346 .............3,575 .............3,602
10. 2001.................. ........XXX........ ........XXX........ ........XXX........ ........XXX........ ........XXX........ ........XXX........ ........XXX........ ........XXX........ .............3,291 .............3,563
11. 2002.................. ........XXX........ ........XXX........ ........XXX........ ........XXX........ ........XXX........ ........XXX........ ........XXX........ ........XXX........ ........XXX........ .............3,401

Annual Statement for the year 2002 of the TWIN CITY FIRE INSURANCE COMPANY
89
SCHEDULE P - PART 5C - COMMERCIAL AUTO/TRUCK LIABILITY/MEDICALSECTION 1
Cumulative Number of Claims Closed with Loss Payment Direct and Assumed at Year EndYears in Which 1 2 3 4 5 6 7 8 9 10
Premiums Were Earnedand Losses Were Incurred 1993 1994 1995 1996 1997 1998 1999 2000 2001 2002
1. Prior.................... ................195 ..................39 ..................16 ....................6 ....................4 ....................1 ....................1 ....................1 ....................0 ....................0
2. 1993.................. ................356 ................468 ................488 ................495 ................498 ................499 ................500 ................500 ................500 ................500
3. 1994.................. ........XXX........ ................370 ................480 ................500 ................508 ................511 ................512 ................513 ................513 ................513
4. 1995.................. ........XXX........ ........XXX........ ................335 ................442 ................459 ................466 ................469 ................471 ................472 ................472
5. 1996.................. ........XXX........ ........XXX........ ........XXX........ ................339 ................444 ................462 ................468 ................472 ................473 ................474
6. 1997.................. ........XXX........ ........XXX........ ........XXX........ ........XXX........ ................329 ................429 ................443 ................450 ................454 ................456
7. 1998.................. ........XXX........ ........XXX........ ........XXX........ ........XXX........ ........XXX........ ................353 ................464 ................483 ................493 ................497
8. 1999.................. ........XXX........ ........XXX........ ........XXX........ ........XXX........ ........XXX........ ........XXX........ ................352 ................464 ................487 ................498
9. 2000.................. ........XXX........ ........XXX........ ........XXX........ ........XXX........ ........XXX........ ........XXX........ ........XXX........ ................320 ................430 ................452
10. 2001.................. ........XXX........ ........XXX........ ........XXX........ ........XXX........ ........XXX........ ........XXX........ ........XXX........ ........XXX........ ................279 ................370
11. 2002.................. ........XXX........ ........XXX........ ........XXX........ ........XXX........ ........XXX........ ........XXX........ ........XXX........ ........XXX........ ........XXX........ ................241
SECTION 2Number of Claims Outstanding Direct and Assumed at Year End
Years in Which 1 2 3 4 5 6 7 8 9 10 Premiums Were Earned
and Losses Were Incurred 1993 1994 1995 1996 1997 1998 1999 2000 2001 2002
1. Prior.................... ..................94 ..................54 ..................35 ..................26 ..................22 ..................19 ..................18 ..................17 ..................16 ..................15
2. 1993.................. ................130 ..................35 ..................20 ..................13 ..................10 ....................8 ....................6 ....................6 ....................6 ....................5
3. 1994.................. ........XXX........ ................125 ..................36 ..................21 ..................13 ....................9 ....................7 ....................6 ....................5 ....................5
4. 1995.................. ........XXX........ ........XXX........ ................116 ..................33 ..................19 ..................13 ....................9 ....................7 ....................6 ....................5
5. 1996.................. ........XXX........ ........XXX........ ........XXX........ ................124 ..................37 ..................21 ..................13 ....................9 ....................7 ....................6
6. 1997.................. ........XXX........ ........XXX........ ........XXX........ ........XXX........ ................119 ..................37 ..................22 ..................14 ..................10 ....................7
7. 1998.................. ........XXX........ ........XXX........ ........XXX........ ........XXX........ ........XXX........ ................145 ..................43 ..................25 ..................15 ....................9
8. 1999.................. ........XXX........ ........XXX........ ........XXX........ ........XXX........ ........XXX........ ........XXX........ ................146 ..................46 ..................25 ..................13
9. 2000.................. ........XXX........ ........XXX........ ........XXX........ ........XXX........ ........XXX........ ........XXX........ ........XXX........ ................137 ..................42 ..................22
10. 2001.................. ........XXX........ ........XXX........ ........XXX........ ........XXX........ ........XXX........ ........XXX........ ........XXX........ ........XXX........ ................114 ..................34
11. 2002.................. ........XXX........ ........XXX........ ........XXX........ ........XXX........ ........XXX........ ........XXX........ ........XXX........ ........XXX........ ........XXX........ ................114
SECTION 3Cumulative Number of Claims Reported Direct and Assumed at Year End
Years in Which 1 2 3 4 5 6 7 8 9 10 Premiums Were Earned
and Losses Were Incurred 1993 1994 1995 1996 1997 1998 1999 2000 2001 2002
1. Prior.................... ................116 ..................11 ....................5 ....................2 ....................1 ....................6 ....................3 ....................0 ....................0 ....................1
2. 1993.................. ................627 ................682 ................690 ................693 ................694 ................697 ................697 ................697 ................697 ................697
3. 1994.................. ........XXX........ ................630 ................687 ................696 ................699 ................701 ................702 ................702 ................702 ................702
4. 1995.................. ........XXX........ ........XXX........ ................582 ................643 ................651 ................656 ................656 ................657 ................657 ................657
5. 1996.................. ........XXX........ ........XXX........ ........XXX........ ................595 ................649 ................658 ................660 ................661 ................661 ................661
6. 1997.................. ........XXX........ ........XXX........ ........XXX........ ........XXX........ ................580 ................636 ................640 ................643 ................644 ................645
7. 1998.................. ........XXX........ ........XXX........ ........XXX........ ........XXX........ ........XXX........ ................650 ................705 ................713 ................716 ................718
8. 1999.................. ........XXX........ ........XXX........ ........XXX........ ........XXX........ ........XXX........ ........XXX........ ................661 ................725 ................735 ................741
9. 2000.................. ........XXX........ ........XXX........ ........XXX........ ........XXX........ ........XXX........ ........XXX........ ........XXX........ ................628 ................690 ................700
10. 2001.................. ........XXX........ ........XXX........ ........XXX........ ........XXX........ ........XXX........ ........XXX........ ........XXX........ ........XXX........ ................560 ................604
11. 2002.................. ........XXX........ ........XXX........ ........XXX........ ........XXX........ ........XXX........ ........XXX........ ........XXX........ ........XXX........ ........XXX........ ................508

Annual Statement for the year 2002 of the TWIN CITY FIRE INSURANCE COMPANY
90
SCHEDULE P - PART 5D - WORKERS' COMPENSATIONSECTION 1
Cumulative Number of Claims Closed with Loss Payment Direct and Assumed at Year EndYears in Which 1 2 3 4 5 6 7 8 9 10
Premiums Were Earnedand Losses Were Incurred 1993 1994 1995 1996 1997 1998 1999 2000 2001 2002
1. Prior.................... ................813 ................141 ..................63 ..................53 ..................46 ..................49 ..................29 ..................21 ..................17 ..................15
2. 1993.................. .............1,188 .............1,603 .............1,648 .............1,678 .............1,694 .............1,703 .............1,709 .............1,712 .............1,713 .............1,714
3. 1994.................. ........XXX........ .............1,065 .............1,543 .............1,608 .............1,640 .............1,655 .............1,663 .............1,666 .............1,668 .............1,669
4. 1995.................. ........XXX........ ........XXX........ .............1,165 .............1,532 .............1,597 .............1,625 .............1,636 .............1,641 .............1,644 .............1,645
5. 1996.................. ........XXX........ ........XXX........ ........XXX........ .............1,155 .............1,496 .............1,557 .............1,578 .............1,588 .............1,593 .............1,598
6. 1997.................. ........XXX........ ........XXX........ ........XXX........ ........XXX........ .............1,157 .............1,563 .............1,625 .............1,644 .............1,654 .............1,660
7. 1998.................. ........XXX........ ........XXX........ ........XXX........ ........XXX........ ........XXX........ .............1,191 .............1,567 .............1,630 .............1,659 .............1,672
8. 1999.................. ........XXX........ ........XXX........ ........XXX........ ........XXX........ ........XXX........ ........XXX........ ................953 .............1,278 .............1,339 .............1,365
9. 2000.................. ........XXX........ ........XXX........ ........XXX........ ........XXX........ ........XXX........ ........XXX........ ........XXX........ ................701 .............1,048 .............1,105
10. 2001.................. ........XXX........ ........XXX........ ........XXX........ ........XXX........ ........XXX........ ........XXX........ ........XXX........ ........XXX........ ................683 ................990
11. 2002.................. ........XXX........ ........XXX........ ........XXX........ ........XXX........ ........XXX........ ........XXX........ ........XXX........ ........XXX........ ........XXX........ ................710
SECTION 2Number of Claims Outstanding Direct and Assumed at Year End
Years in Which 1 2 3 4 5 6 7 8 9 10 Premiums Were Earned
and Losses Were Incurred 1993 1994 1995 1996 1997 1998 1999 2000 2001 2002
1. Prior.................... ................391 ................262 ................217 ................186 ................151 ................132 ................115 ................106 ................100 ................100
2. 1993.................. ................279 ................100 ..................62 ..................41 ..................28 ..................20 ..................15 ..................12 ..................11 ..................10
3. 1994.................. ........XXX........ ................279 ................107 ..................65 ..................38 ..................25 ..................17 ..................14 ..................13 ..................13
4. 1995.................. ........XXX........ ........XXX........ ................256 ................105 ..................56 ..................33 ..................22 ..................18 ..................15 ..................15
5. 1996.................. ........XXX........ ........XXX........ ........XXX........ ................265 ..................99 ..................53 ..................33 ..................24 ..................19 ..................14
6. 1997.................. ........XXX........ ........XXX........ ........XXX........ ........XXX........ ................315 ................115 ..................58 ..................40 ..................32 ..................25
7. 1998.................. ........XXX........ ........XXX........ ........XXX........ ........XXX........ ........XXX........ ................320 ................119 ..................64 ..................44 ..................28
8. 1999.................. ........XXX........ ........XXX........ ........XXX........ ........XXX........ ........XXX........ ........XXX........ ................278 ................106 ..................61 ..................37
9. 2000.................. ........XXX........ ........XXX........ ........XXX........ ........XXX........ ........XXX........ ........XXX........ ........XXX........ ................285 ..................99 ..................50
10. 2001.................. ........XXX........ ........XXX........ ........XXX........ ........XXX........ ........XXX........ ........XXX........ ........XXX........ ........XXX........ ................309 ..................90
11. 2002.................. ........XXX........ ........XXX........ ........XXX........ ........XXX........ ........XXX........ ........XXX........ ........XXX........ ........XXX........ ........XXX........ ................286
SECTION 3Cumulative Number of Claims Reported Direct and Assumed at Year End
Years in Which 1 2 3 4 5 6 7 8 9 10 Premiums Were Earned
and Losses Were Incurred 1993 1994 1995 1996 1997 1998 1999 2000 2001 2002
1. Prior.................... ................530 ..................30 ..................23 ..................26 ..................20 ..................79 ..................37 ..................12 ..................12 ..................17
2. 1993.................. .............1,548 .............1,821 .............1,834 .............1,846 .............1,851 .............1,860 .............1,869 .............1,870 .............1,872 .............1,875
3. 1994.................. ........XXX........ .............1,441 .............1,790 .............1,817 .............1,826 .............1,867 .............1,880 .............1,882 .............1,883 .............1,885
4. 1995.................. ........XXX........ ........XXX........ .............1,545 .............1,797 .............1,817 .............1,865 .............1,875 .............1,877 .............1,884 .............1,885
5. 1996.................. ........XXX........ ........XXX........ ........XXX........ .............1,548 .............1,751 .............1,798 .............1,804 .............1,806 .............1,813 .............1,817
6. 1997.................. ........XXX........ ........XXX........ ........XXX........ ........XXX........ .............1,684 .............1,919 .............1,934 .............1,939 .............1,944 .............1,949
7. 1998.................. ........XXX........ ........XXX........ ........XXX........ ........XXX........ ........XXX........ .............1,731 .............2,002 .............2,026 .............2,054 .............2,069
8. 1999.................. ........XXX........ ........XXX........ ........XXX........ ........XXX........ ........XXX........ ........XXX........ .............1,508 .............1,713 .............1,747 .............1,766
9. 2000.................. ........XXX........ ........XXX........ ........XXX........ ........XXX........ ........XXX........ ........XXX........ ........XXX........ .............1,354 .............1,526 .............1,547
10. 2001.................. ........XXX........ ........XXX........ ........XXX........ ........XXX........ ........XXX........ ........XXX........ ........XXX........ ........XXX........ .............1,375 .............1,483
11. 2002.................. ........XXX........ ........XXX........ ........XXX........ ........XXX........ ........XXX........ ........XXX........ ........XXX........ ........XXX........ ........XXX........ .............1,374

Annual Statement for the year 2002 of the TWIN CITY FIRE INSURANCE COMPANY
91
SCHEDULE P - PART 5E - COMMERCIAL MULTIPLE PERILSECTION 1
Cumulative Number of Claims Closed with Loss Payment Direct and Assumed at Year EndYears in Which 1 2 3 4 5 6 7 8 9 10
Premiums Were Earnedand Losses Were Incurred 1993 1994 1995 1996 1997 1998 1999 2000 2001 2002
1. Prior.................... ................207 ..................45 ..................21 ..................11 ....................9 ....................8 ....................4 ....................3 ....................3 ....................2
2. 1993.................. ................507 ................668 ................691 ................701 ................706 ................710 ................712 ................713 ................714 ................714
3. 1994.................. ........XXX........ ................557 ................745 ................770 ................782 ................789 ................792 ................794 ................795 ................797
4. 1995.................. ........XXX........ ........XXX........ ................549 ................731 ................759 ................770 ................776 ................780 ................781 ................782
5. 1996.................. ........XXX........ ........XXX........ ........XXX........ ................577 ................751 ................777 ................788 ................794 ................797 ................799
6. 1997.................. ........XXX........ ........XXX........ ........XXX........ ........XXX........ ................534 ................721 ................746 ................757 ................764 ................768
7. 1998.................. ........XXX........ ........XXX........ ........XXX........ ........XXX........ ........XXX........ ................631 ................847 ................878 ................893 ................902
8. 1999.................. ........XXX........ ........XXX........ ........XXX........ ........XXX........ ........XXX........ ........XXX........ ................681 ................924 ................958 ................975
9. 2000.................. ........XXX........ ........XXX........ ........XXX........ ........XXX........ ........XXX........ ........XXX........ ........XXX........ ................701 ................961 ................996
10. 2001.................. ........XXX........ ........XXX........ ........XXX........ ........XXX........ ........XXX........ ........XXX........ ........XXX........ ........XXX........ ................698 ................926
11. 2002.................. ........XXX........ ........XXX........ ........XXX........ ........XXX........ ........XXX........ ........XXX........ ........XXX........ ........XXX........ ........XXX........ ................580
SECTION 2Number of Claims Outstanding Direct and Assumed at Year End
Years in Which 1 2 3 4 5 6 7 8 9 10 Premiums Were Earned
and Losses Were Incurred 1993 1994 1995 1996 1997 1998 1999 2000 2001 2002
1. Prior.................... ................168 ................123 ..................99 ..................84 ..................68 ..................58 ..................52 ..................48 ..................45 ..................43
2. 1993.................. ................177 ..................58 ..................38 ..................29 ..................22 ..................16 ..................13 ..................11 ..................10 ..................10
3. 1994.................. ........XXX........ ................216 ..................62 ..................43 ..................32 ..................23 ..................17 ..................14 ..................13 ..................11
4. 1995.................. ........XXX........ ........XXX........ ................212 ..................66 ..................45 ..................32 ..................23 ..................18 ..................15 ..................13
5. 1996.................. ........XXX........ ........XXX........ ........XXX........ ................201 ..................64 ..................43 ..................31 ..................22 ..................17 ..................15
6. 1997.................. ........XXX........ ........XXX........ ........XXX........ ........XXX........ ................212 ..................65 ..................44 ..................31 ..................21 ..................16
7. 1998.................. ........XXX........ ........XXX........ ........XXX........ ........XXX........ ........XXX........ ................256 ..................76 ..................50 ..................35 ..................23
8. 1999.................. ........XXX........ ........XXX........ ........XXX........ ........XXX........ ........XXX........ ........XXX........ ................297 ..................86 ..................55 ..................37
9. 2000.................. ........XXX........ ........XXX........ ........XXX........ ........XXX........ ........XXX........ ........XXX........ ........XXX........ ................303 ..................84 ..................51
10. 2001.................. ........XXX........ ........XXX........ ........XXX........ ........XXX........ ........XXX........ ........XXX........ ........XXX........ ........XXX........ ................284 ..................79
11. 2002.................. ........XXX........ ........XXX........ ........XXX........ ........XXX........ ........XXX........ ........XXX........ ........XXX........ ........XXX........ ........XXX........ ................246
SECTION 3Cumulative Number of Claims Reported Direct and Assumed at Year End
Years in Which 1 2 3 4 5 6 7 8 9 10 Premiums Were Earned
and Losses Were Incurred 1993 1994 1995 1996 1997 1998 1999 2000 2001 2002
1. Prior.................... ................280 ..................39 ..................21 ..................14 ....................8 ....................8 ....................4 ....................4 ....................4 ....................4
2. 1993.................. ................927 .............1,061 .............1,082 .............1,091 .............1,095 .............1,097 .............1,098 .............1,099 .............1,099 .............1,100
3. 1994.................. ........XXX........ .............1,083 .............1,233 .............1,258 .............1,268 .............1,273 .............1,274 .............1,276 .............1,278 .............1,279
4. 1995.................. ........XXX........ ........XXX........ .............1,083 .............1,232 .............1,257 .............1,267 .............1,271 .............1,273 .............1,275 .............1,276
5. 1996.................. ........XXX........ ........XXX........ ........XXX........ .............1,100 .............1,248 .............1,272 .............1,283 .............1,287 .............1,290 .............1,292
6. 1997.................. ........XXX........ ........XXX........ ........XXX........ ........XXX........ .............1,028 .............1,173 .............1,199 .............1,209 .............1,213 .............1,217
7. 1998.................. ........XXX........ ........XXX........ ........XXX........ ........XXX........ ........XXX........ .............1,221 .............1,387 .............1,417 .............1,432 .............1,439
8. 1999.................. ........XXX........ ........XXX........ ........XXX........ ........XXX........ ........XXX........ ........XXX........ .............1,364 .............1,547 .............1,581 .............1,597
9. 2000.................. ........XXX........ ........XXX........ ........XXX........ ........XXX........ ........XXX........ ........XXX........ ........XXX........ .............1,419 .............1,639 .............1,676
10. 2001.................. ........XXX........ ........XXX........ ........XXX........ ........XXX........ ........XXX........ ........XXX........ ........XXX........ ........XXX........ .............1,417 .............1,589
11. 2002.................. ........XXX........ ........XXX........ ........XXX........ ........XXX........ ........XXX........ ........XXX........ ........XXX........ ........XXX........ ........XXX........ .............1,210

Annual Statement for the year 2002 of the TWIN CITY FIRE INSURANCE COMPANY
92
SCHEDULE P - PART 5F - MEDICAL MALPRACTICE - OCCURRENCESECTION 1A
Cumulative Number of Claims Closed with Loss Payment Direct and Assumed at Year EndYears in Which 1 2 3 4 5 6 7 8 9 10
Premiums Were Earnedand Losses Were Incurred 1993 1994 1995 1996 1997 1998 1999 2000 2001 2002
1. Prior.................... ....................1 ...................(1) ....................0 ....................0 ....................0 ....................0 ....................0 ....................0 ....................0 ....................0
2. 1993.................. ....................0 ....................0 ...................(0) ...................(0) ...................(0) ...................(0) ....................0 ....................0 ....................0 ...................(0)
3. 1994.................. ........XXX........ ...................(0) ...................(0) ...................(0) ...................(0) ...................(0) ...................(0) ...................(0) ...................(0) ...................(0)
4. 1995.................. ........XXX........ ........XXX........ ....................0 ....................0 ....................0 ....................0 ....................0 ....................0 ....................0 ....................0
5. 1996.................. ........XXX........ ........XXX........ ........XXX........ ....................0 ....................0 ....................1 ....................0 ....................0 ....................0 ....................0
6. 1997.................. ........XXX........ ........XXX........ ........XXX........ ........XXX........ ....................0 ....................0 ....................0 ....................0 ....................0 ....................0
7. 1998.................. ........XXX........ ........XXX........ ........XXX........ ........XXX........ ........XXX........ ....................0 ....................0 ....................0 ....................0 ....................0
8. 1999.................. ........XXX........ ........XXX........ ........XXX........ ........XXX........ ........XXX........ ........XXX........ ....................0 ....................0 ....................0 ....................0
9. 2000.................. ........XXX........ ........XXX........ ........XXX........ ........XXX........ ........XXX........ ........XXX........ ........XXX........ ....................0 ....................0 ....................0
10. 2001.................. ........XXX........ ........XXX........ ........XXX........ ........XXX........ ........XXX........ ........XXX........ ........XXX........ ........XXX........ ....................0 ....................0
11. 2002.................. ........XXX........ ........XXX........ ........XXX........ ........XXX........ ........XXX........ ........XXX........ ........XXX........ ........XXX........ ........XXX........ ....................0
SECTION 2ANumber of Claims Outstanding Direct and Assumed at Year End
Years in Which 1 2 3 4 5 6 7 8 9 10 Premiums Were Earned
and Losses Were Incurred 1993 1994 1995 1996 1997 1998 1999 2000 2001 2002
1. Prior.................... ....................6 ....................4 ....................4 ....................1 ....................1 ....................1 ....................1 ....................1 ....................0 ....................0
2. 1993.................. ....................1 ....................0 ....................0 ....................0 ....................0 ....................0 ....................0 ....................0 ....................0 ....................0
3. 1994.................. ........XXX........ ....................0 ....................0 ....................0 ....................0 ....................0 ....................0 ....................0 ....................0 ....................0
4. 1995.................. ........XXX........ ........XXX........ ....................0 ....................0 ....................0 ....................0 ....................0 ....................0 ....................0 ....................0
5. 1996.................. ........XXX........ ........XXX........ ........XXX........ ....................0 ....................0 ....................0 ....................0 ....................0 ....................0 ....................0
6. 1997.................. ........XXX........ ........XXX........ ........XXX........ ........XXX........ ....................0 ....................0 ....................0 ....................0 ....................0 ....................0
7. 1998.................. ........XXX........ ........XXX........ ........XXX........ ........XXX........ ........XXX........ ....................0 ....................0 ....................0 ....................0 ....................0
8. 1999.................. ........XXX........ ........XXX........ ........XXX........ ........XXX........ ........XXX........ ........XXX........ ....................0 ....................0 ....................0 ....................0
9. 2000.................. ........XXX........ ........XXX........ ........XXX........ ........XXX........ ........XXX........ ........XXX........ ........XXX........ ....................0 ....................0 ....................0
10. 2001.................. ........XXX........ ........XXX........ ........XXX........ ........XXX........ ........XXX........ ........XXX........ ........XXX........ ........XXX........ ....................0 ....................0
11. 2002.................. ........XXX........ ........XXX........ ........XXX........ ........XXX........ ........XXX........ ........XXX........ ........XXX........ ........XXX........ ........XXX........ ....................0
SECTION 3ACumulative Number of Claims Reported Direct and Assumed at Year End
Years in Which 1 2 3 4 5 6 7 8 9 10 Premiums Were Earned
and Losses Were Incurred 1993 1994 1995 1996 1997 1998 1999 2000 2001 2002
1. Prior.................... ....................4 ....................1 ....................0 ....................0 ....................0 ....................4 ...................(2) ....................0 ....................0 ....................0
2. 1993.................. ....................1 ....................1 ....................1 ....................1 ....................1 ....................2 ....................2 ....................2 ....................2 ....................2
3. 1994.................. ........XXX........ ...................(0) ....................0 ....................0 ....................0 ....................0 ....................0 ....................0 ....................0 ....................0
4. 1995.................. ........XXX........ ........XXX........ ....................0 ....................0 ....................0 ....................0 ....................0 ....................0 ....................0 ....................0
5. 1996.................. ........XXX........ ........XXX........ ........XXX........ ....................0 ....................0 ....................1 ....................0 ....................0 ....................0 ....................0
6. 1997.................. ........XXX........ ........XXX........ ........XXX........ ........XXX........ ....................0 ....................1 ....................1 ....................1 ....................1 ....................1
7. 1998.................. ........XXX........ ........XXX........ ........XXX........ ........XXX........ ........XXX........ ....................0 ....................0 ....................0 ....................0 ....................0
8. 1999.................. ........XXX........ ........XXX........ ........XXX........ ........XXX........ ........XXX........ ........XXX........ ....................0 ....................0 ....................0 ....................0
9. 2000.................. ........XXX........ ........XXX........ ........XXX........ ........XXX........ ........XXX........ ........XXX........ ........XXX........ ....................0 ....................0 ....................0
10. 2001.................. ........XXX........ ........XXX........ ........XXX........ ........XXX........ ........XXX........ ........XXX........ ........XXX........ ........XXX........ ....................0 ....................0
11. 2002.................. ........XXX........ ........XXX........ ........XXX........ ........XXX........ ........XXX........ ........XXX........ ........XXX........ ........XXX........ ........XXX........ ....................1

Annual Statement for the year 2002 of the TWIN CITY FIRE INSURANCE COMPANY
93
SCHEDULE P - PART 5F - MEDICAL MALPRACTICE - CLAIMS-MADESECTION 1B
Cumulative Number of Claims Closed with Loss Payment Direct and Assumed at Year EndYears in Which 1 2 3 4 5 6 7 8 9 10
Premiums Were Earnedand Losses Were Incurred 1993 1994 1995 1996 1997 1998 1999 2000 2001 2002
1. Prior.................... ....................2 ...................(0) ....................1 ....................1 ....................1 ....................1 ....................1 ....................0 ....................0 ....................0
2. 1993.................. ....................1 ....................6 ....................6 ....................7 ....................7 ....................7 ....................7 ....................7 ....................7 ....................7
3. 1994.................. ........XXX........ ....................0 ....................1 ....................1 ....................1 ....................2 ....................2 ....................2 ....................2 ....................2
4. 1995.................. ........XXX........ ........XXX........ ....................0 ....................1 ....................1 ....................1 ....................2 ....................2 ....................2 ....................2
5. 1996.................. ........XXX........ ........XXX........ ........XXX........ ....................0 ....................1 ....................1 ....................1 ....................1 ....................1 ....................1
6. 1997.................. ........XXX........ ........XXX........ ........XXX........ ........XXX........ ....................0 ....................1 ....................1 ....................1 ....................1 ....................1
7. 1998.................. ........XXX........ ........XXX........ ........XXX........ ........XXX........ ........XXX........ ....................0 ....................0 ....................1 ....................1 ....................1
8. 1999.................. ........XXX........ ........XXX........ ........XXX........ ........XXX........ ........XXX........ ........XXX........ ....................0 ....................0 ....................0 ....................0
9. 2000.................. ........XXX........ ........XXX........ ........XXX........ ........XXX........ ........XXX........ ........XXX........ ........XXX........ ....................0 ....................0 ....................0
10. 2001.................. ........XXX........ ........XXX........ ........XXX........ ........XXX........ ........XXX........ ........XXX........ ........XXX........ ........XXX........ ....................0 ....................0
11. 2002.................. ........XXX........ ........XXX........ ........XXX........ ........XXX........ ........XXX........ ........XXX........ ........XXX........ ........XXX........ ........XXX........ ....................0
SECTION 2BNumber of Claims Outstanding Direct and Assumed at Year End
Years in Which 1 2 3 4 5 6 7 8 9 10 Premiums Were Earned
and Losses Were Incurred 1993 1994 1995 1996 1997 1998 1999 2000 2001 2002
1. Prior.................... ..................10 ..................10 ....................9 ....................6 ....................4 ....................3 ....................1 ....................1 ....................1 ....................0
2. 1993.................. ....................6 ....................3 ....................2 ....................2 ....................1 ....................1 ....................1 ....................0 ....................0 ....................0
3. 1994.................. ........XXX........ ....................2 ....................2 ....................2 ....................2 ....................1 ....................1 ....................0 ....................0 ....................0
4. 1995.................. ........XXX........ ........XXX........ ....................2 ....................2 ....................2 ....................2 ....................1 ....................1 ....................0 ....................0
5. 1996.................. ........XXX........ ........XXX........ ........XXX........ ....................1 ....................1 ....................1 ....................1 ....................1 ....................0 ....................0
6. 1997.................. ........XXX........ ........XXX........ ........XXX........ ........XXX........ ....................1 ....................2 ....................1 ....................0 ....................0 ....................0
7. 1998.................. ........XXX........ ........XXX........ ........XXX........ ........XXX........ ........XXX........ ....................1 ....................0 ....................0 ....................0 ....................0
8. 1999.................. ........XXX........ ........XXX........ ........XXX........ ........XXX........ ........XXX........ ........XXX........ ....................0 ....................0 ....................0 ....................0
9. 2000.................. ........XXX........ ........XXX........ ........XXX........ ........XXX........ ........XXX........ ........XXX........ ........XXX........ ....................0 ....................0 ....................0
10. 2001.................. ........XXX........ ........XXX........ ........XXX........ ........XXX........ ........XXX........ ........XXX........ ........XXX........ ........XXX........ ....................0 ....................0
11. 2002.................. ........XXX........ ........XXX........ ........XXX........ ........XXX........ ........XXX........ ........XXX........ ........XXX........ ........XXX........ ........XXX........ ....................0
SECTION 3BCumulative Number of Claims Reported Direct and Assumed at Year End
Years in Which 1 2 3 4 5 6 7 8 9 10 Premiums Were Earned
and Losses Were Incurred 1993 1994 1995 1996 1997 1998 1999 2000 2001 2002
1. Prior.................... ....................0 ....................2 ....................1 ....................0 ....................0 ....................0 ...................(0) ....................0 ....................0 ....................0
2. 1993.................. ....................8 ..................11 ..................13 ..................13 ..................13 ..................13 ..................13 ..................13 ..................13 ..................13
3. 1994.................. ........XXX........ ....................3 ....................5 ....................6 ....................7 ....................7 ....................7 ....................7 ....................7 ....................7
4. 1995.................. ........XXX........ ........XXX........ ....................3 ....................5 ....................6 ....................6 ....................6 ....................6 ....................6 ....................6
5. 1996.................. ........XXX........ ........XXX........ ........XXX........ ....................2 ....................4 ....................5 ....................5 ....................5 ....................5 ....................5
6. 1997.................. ........XXX........ ........XXX........ ........XXX........ ........XXX........ ....................2 ....................4 ....................4 ....................4 ....................4 ....................4
7. 1998.................. ........XXX........ ........XXX........ ........XXX........ ........XXX........ ........XXX........ ....................2 ....................2 ....................2 ....................2 ....................2
8. 1999.................. ........XXX........ ........XXX........ ........XXX........ ........XXX........ ........XXX........ ........XXX........ ....................0 ....................0 ....................0 ....................0
9. 2000.................. ........XXX........ ........XXX........ ........XXX........ ........XXX........ ........XXX........ ........XXX........ ........XXX........ ....................0 ....................0 ....................0
10. 2001.................. ........XXX........ ........XXX........ ........XXX........ ........XXX........ ........XXX........ ........XXX........ ........XXX........ ........XXX........ ....................0 ....................0
11. 2002.................. ........XXX........ ........XXX........ ........XXX........ ........XXX........ ........XXX........ ........XXX........ ........XXX........ ........XXX........ ........XXX........ ....................0

Annual Statement for the year 2002 of the TWIN CITY FIRE INSURANCE COMPANY
94
SCHEDULE P - PART 5H - OTHER LIABILITY - OCCURRENCESECTION 1A
Cumulative Number of Claims Closed with Loss Payment Direct and Assumed at Year EndYears in Which 1 2 3 4 5 6 7 8 9 10
Premiums Were Earnedand Losses Were Incurred 1993 1994 1995 1996 1997 1998 1999 2000 2001 2002
1. Prior.................... ..................55 ..................29 ..................15 ..................12 ....................9 ..................10 ....................9 ....................8 ..................12 ....................4
2. 1993.................. ..................57 ..................78 ..................86 ..................89 ..................91 ..................93 ..................95 ..................95 ..................95 ..................95
3. 1994.................. ........XXX........ ..................60 ..................84 ..................88 ..................92 ..................93 ..................96 ..................96 ..................97 ..................97
4. 1995.................. ........XXX........ ........XXX........ ..................59 ..................82 ..................89 ..................91 ..................92 ..................94 ..................95 ..................95
5. 1996.................. ........XXX........ ........XXX........ ........XXX........ ..................68 ..................91 ..................95 ..................99 ................100 ................101 ................102
6. 1997.................. ........XXX........ ........XXX........ ........XXX........ ........XXX........ ..................62 ..................80 ..................83 ..................86 ..................88 ..................89
7. 1998.................. ........XXX........ ........XXX........ ........XXX........ ........XXX........ ........XXX........ ..................52 ..................66 ..................72 ..................73 ..................75
8. 1999.................. ........XXX........ ........XXX........ ........XXX........ ........XXX........ ........XXX........ ........XXX........ ..................52 ..................66 ..................69 ..................71
9. 2000.................. ........XXX........ ........XXX........ ........XXX........ ........XXX........ ........XXX........ ........XXX........ ........XXX........ ..................46 ..................65 ..................66
10. 2001.................. ........XXX........ ........XXX........ ........XXX........ ........XXX........ ........XXX........ ........XXX........ ........XXX........ ........XXX........ ..................33 ..................42
11. 2002.................. ........XXX........ ........XXX........ ........XXX........ ........XXX........ ........XXX........ ........XXX........ ........XXX........ ........XXX........ ........XXX........ ..................15
SECTION 2ANumber of Claims Outstanding Direct and Assumed at Year End
Years in Which 1 2 3 4 5 6 7 8 9 10 Premiums Were Earned
and Losses Were Incurred 1993 1994 1995 1996 1997 1998 1999 2000 2001 2002
1. Prior.................... ................216 ................183 ................153 ................125 ................114 ................103 ..................94 ..................84 ..................70 ..................70
2. 1993.................. ..................44 ..................26 ..................18 ..................14 ..................10 ....................6 ....................4 ....................4 ....................3 ....................3
3. 1994.................. ........XXX........ ..................49 ..................26 ..................22 ..................16 ..................10 ....................6 ....................5 ....................4 ....................3
4. 1995.................. ........XXX........ ........XXX........ ..................47 ..................24 ..................19 ..................12 ....................9 ....................8 ....................6 ....................5
5. 1996.................. ........XXX........ ........XXX........ ........XXX........ ..................43 ..................21 ..................17 ..................11 ....................7 ....................5 ....................3
6. 1997.................. ........XXX........ ........XXX........ ........XXX........ ........XXX........ ..................37 ..................19 ..................14 ..................10 ....................6 ....................4
7. 1998.................. ........XXX........ ........XXX........ ........XXX........ ........XXX........ ........XXX........ ..................34 ..................18 ..................12 ..................10 ....................7
8. 1999.................. ........XXX........ ........XXX........ ........XXX........ ........XXX........ ........XXX........ ........XXX........ ..................33 ..................18 ..................12 ....................8
9. 2000.................. ........XXX........ ........XXX........ ........XXX........ ........XXX........ ........XXX........ ........XXX........ ........XXX........ ..................41 ..................23 ..................17
10. 2001.................. ........XXX........ ........XXX........ ........XXX........ ........XXX........ ........XXX........ ........XXX........ ........XXX........ ........XXX........ ..................24 ..................13
11. 2002.................. ........XXX........ ........XXX........ ........XXX........ ........XXX........ ........XXX........ ........XXX........ ........XXX........ ........XXX........ ........XXX........ ..................19
SECTION 3ACumulative Number of Claims Reported Direct and Assumed at Year End
Years in Which 1 2 3 4 5 6 7 8 9 10 Premiums Were Earned
and Losses Were Incurred 1993 1994 1995 1996 1997 1998 1999 2000 2001 2002
1. Prior.................... ................115 ..................44 ..................37 ..................25 ..................19 ..................33 ..................16 ..................11 ..................10 ..................10
2. 1993.................. ................166 ................203 ................220 ................225 ................229 ................231 ................231 ................231 ................232 ................232
3. 1994.................. ........XXX........ ................176 ................226 ................239 ................249 ................252 ................252 ................253 ................254 ................254
4. 1995.................. ........XXX........ ........XXX........ ................179 ................218 ................229 ................235 ................236 ................239 ................240 ................241
5. 1996.................. ........XXX........ ........XXX........ ........XXX........ ................182 ................220 ................230 ................228 ................225 ................229 ................230
6. 1997.................. ........XXX........ ........XXX........ ........XXX........ ........XXX........ ................162 ................192 ................200 ................203 ................205 ................207
7. 1998.................. ........XXX........ ........XXX........ ........XXX........ ........XXX........ ........XXX........ ................149 ................172 ................180 ................184 ................186
8. 1999.................. ........XXX........ ........XXX........ ........XXX........ ........XXX........ ........XXX........ ........XXX........ ................144 ................169 ................176 ................180
9. 2000.................. ........XXX........ ........XXX........ ........XXX........ ........XXX........ ........XXX........ ........XXX........ ........XXX........ ................149 ................180 ................189
10. 2001.................. ........XXX........ ........XXX........ ........XXX........ ........XXX........ ........XXX........ ........XXX........ ........XXX........ ........XXX........ ................111 ................133
11. 2002.................. ........XXX........ ........XXX........ ........XXX........ ........XXX........ ........XXX........ ........XXX........ ........XXX........ ........XXX........ ........XXX........ ..................68

Annual Statement for the year 2002 of the TWIN CITY FIRE INSURANCE COMPANY
95
SCHEDULE P - PART 5H - OTHER LIABILITY - CLAIMS-MADESECTION 1B
Cumulative Number of Claims Closed with Loss Payment Direct and Assumed at Year EndYears in Which 1 2 3 4 5 6 7 8 9 10
Premiums Were Earnedand Losses Were Incurred 1993 1994 1995 1996 1997 1998 1999 2000 2001 2002
1. Prior.................... ....................3 ....................1 ....................1 ....................1 ....................1 ....................0 ....................0 ....................0 ....................0 ...................(0)
2. 1993.................. ....................5 ....................9 ..................10 ..................11 ..................11 ..................11 ..................11 ..................11 ..................11 ..................11
3. 1994.................. ........XXX........ ....................4 ....................7 ....................8 ....................8 ....................9 ....................9 ....................9 ....................9 ....................9
4. 1995.................. ........XXX........ ........XXX........ ....................3 ....................5 ....................6 ....................6 ....................6 ....................7 ....................7 ....................7
5. 1996.................. ........XXX........ ........XXX........ ........XXX........ ....................2 ....................3 ....................3 ....................4 ....................4 ....................4 ....................4
6. 1997.................. ........XXX........ ........XXX........ ........XXX........ ........XXX........ ....................2 ....................3 ....................4 ....................5 ....................5 ....................5
7. 1998.................. ........XXX........ ........XXX........ ........XXX........ ........XXX........ ........XXX........ ....................2 ....................3 ....................4 ....................4 ....................4
8. 1999.................. ........XXX........ ........XXX........ ........XXX........ ........XXX........ ........XXX........ ........XXX........ ....................2 ....................3 ....................4 ....................5
9. 2000.................. ........XXX........ ........XXX........ ........XXX........ ........XXX........ ........XXX........ ........XXX........ ........XXX........ ....................1 ....................2 ....................3
10. 2001.................. ........XXX........ ........XXX........ ........XXX........ ........XXX........ ........XXX........ ........XXX........ ........XXX........ ........XXX........ ....................0 ....................1
11. 2002.................. ........XXX........ ........XXX........ ........XXX........ ........XXX........ ........XXX........ ........XXX........ ........XXX........ ........XXX........ ........XXX........ ....................0
SECTION 2BNumber of Claims Outstanding Direct and Assumed at Year End
Years in Which 1 2 3 4 5 6 7 8 9 10 Premiums Were Earned
and Losses Were Incurred 1993 1994 1995 1996 1997 1998 1999 2000 2001 2002
1. Prior.................... ....................9 ....................7 ....................5 ....................4 ....................3 ....................3 ....................2 ....................2 ....................1 ....................1
2. 1993.................. ....................5 ....................3 ....................2 ....................1 ....................1 ....................0 ....................0 ....................0 ....................0 ....................0
3. 1994.................. ........XXX........ ....................3 ....................2 ....................2 ....................1 ....................1 ....................0 ....................0 ....................0 ....................0
4. 1995.................. ........XXX........ ........XXX........ ....................2 ....................2 ....................1 ....................1 ....................1 ....................0 ....................0 ....................0
5. 1996.................. ........XXX........ ........XXX........ ........XXX........ ....................1 ....................1 ....................1 ....................1 ....................0 ....................0 ....................0
6. 1997.................. ........XXX........ ........XXX........ ........XXX........ ........XXX........ ....................2 ....................2 ....................1 ....................1 ....................0 ....................0
7. 1998.................. ........XXX........ ........XXX........ ........XXX........ ........XXX........ ........XXX........ ....................2 ....................3 ....................2 ....................2 ....................2
8. 1999.................. ........XXX........ ........XXX........ ........XXX........ ........XXX........ ........XXX........ ........XXX........ ....................2 ....................2 ....................2 ....................1
9. 2000.................. ........XXX........ ........XXX........ ........XXX........ ........XXX........ ........XXX........ ........XXX........ ........XXX........ ....................2 ....................2 ....................1
10. 2001.................. ........XXX........ ........XXX........ ........XXX........ ........XXX........ ........XXX........ ........XXX........ ........XXX........ ........XXX........ ....................1 ....................1
11. 2002.................. ........XXX........ ........XXX........ ........XXX........ ........XXX........ ........XXX........ ........XXX........ ........XXX........ ........XXX........ ........XXX........ ....................0
SECTION 3BCumulative Number of Claims Reported Direct and Assumed at Year End
Years in Which 1 2 3 4 5 6 7 8 9 10 Premiums Were Earned
and Losses Were Incurred 1993 1994 1995 1996 1997 1998 1999 2000 2001 2002
1. Prior.................... ....................4 ....................2 ....................1 ....................1 ....................2 ....................0 ....................0 ....................0 ....................0 ....................0
2. 1993.................. ..................16 ..................23 ..................24 ..................24 ..................25 ..................25 ..................25 ..................25 ..................25 ..................25
3. 1994.................. ........XXX........ ..................10 ..................18 ..................20 ..................20 ..................20 ..................21 ..................21 ..................21 ..................21
4. 1995.................. ........XXX........ ........XXX........ ....................9 ..................15 ..................16 ..................17 ..................17 ..................18 ..................18 ..................18
5. 1996.................. ........XXX........ ........XXX........ ........XXX........ ....................6 ..................10 ..................11 ..................11 ..................12 ..................12 ..................12
6. 1997.................. ........XXX........ ........XXX........ ........XXX........ ........XXX........ ....................6 ..................11 ..................12 ..................13 ..................14 ..................14
7. 1998.................. ........XXX........ ........XXX........ ........XXX........ ........XXX........ ........XXX........ ....................7 ..................13 ..................14 ..................16 ..................16
8. 1999.................. ........XXX........ ........XXX........ ........XXX........ ........XXX........ ........XXX........ ........XXX........ ....................7 ..................11 ..................12 ..................13
9. 2000.................. ........XXX........ ........XXX........ ........XXX........ ........XXX........ ........XXX........ ........XXX........ ........XXX........ ....................5 ....................9 ..................10
10. 2001.................. ........XXX........ ........XXX........ ........XXX........ ........XXX........ ........XXX........ ........XXX........ ........XXX........ ........XXX........ ....................2 ....................3
11. 2002.................. ........XXX........ ........XXX........ ........XXX........ ........XXX........ ........XXX........ ........XXX........ ........XXX........ ........XXX........ ........XXX........ ....................1

Annual Statement for the year 2002 of the TWIN CITY FIRE INSURANCE COMPANY
96
SCHEDULE P - PART 5R - PRODUCTS LIABILITY - OCCURRENCESECTION 1A
Cumulative Number of Claims Closed with Loss Payment Direct and Assumed at Year EndYears in Which 1 2 3 4 5 6 7 8 9 10
Premiums Were Earnedand Losses Were Incurred 1993 1994 1995 1996 1997 1998 1999 2000 2001 2002
1. Prior.................... ....................9 ....................4 ....................4 ....................4 ....................3 ....................3 ....................2 ....................2 ....................1 ....................1
2. 1993.................. ....................2 ....................3 ....................4 ....................4 ....................4 ....................4 ....................5 ....................5 ....................5 ....................5
3. 1994.................. ........XXX........ ....................2 ....................2 ....................3 ....................3 ....................3 ....................4 ....................4 ....................4 ....................4
4. 1995.................. ........XXX........ ........XXX........ ....................2 ....................2 ....................3 ....................3 ....................3 ....................3 ....................3 ....................4
5. 1996.................. ........XXX........ ........XXX........ ........XXX........ ....................2 ....................5 ....................5 ....................5 ....................5 ....................6 ....................6
6. 1997.................. ........XXX........ ........XXX........ ........XXX........ ........XXX........ ....................3 ....................4 ....................4 ....................5 ....................5 ....................5
7. 1998.................. ........XXX........ ........XXX........ ........XXX........ ........XXX........ ........XXX........ ....................4 ....................5 ....................5 ....................5 ....................6
8. 1999.................. ........XXX........ ........XXX........ ........XXX........ ........XXX........ ........XXX........ ........XXX........ ....................3 ....................5 ....................5 ....................5
9. 2000.................. ........XXX........ ........XXX........ ........XXX........ ........XXX........ ........XXX........ ........XXX........ ........XXX........ ....................4 ....................5 ....................5
10. 2001.................. ........XXX........ ........XXX........ ........XXX........ ........XXX........ ........XXX........ ........XXX........ ........XXX........ ........XXX........ ....................3 ....................3
11. 2002.................. ........XXX........ ........XXX........ ........XXX........ ........XXX........ ........XXX........ ........XXX........ ........XXX........ ........XXX........ ........XXX........ ....................2
SECTION 2ANumber of Claims Outstanding Direct and Assumed at Year End
Years in Which 1 2 3 4 5 6 7 8 9 10 Premiums Were Earned
and Losses Were Incurred 1993 1994 1995 1996 1997 1998 1999 2000 2001 2002
1. Prior.................... ..................51 ..................49 ..................45 ..................41 ..................35 ..................34 ..................30 ..................27 ..................26 ..................28
2. 1993.................. ....................2 ....................1 ....................1 ....................1 ....................1 ....................1 ....................1 ....................1 ....................0 ....................1
3. 1994.................. ........XXX........ ....................2 ....................1 ....................1 ....................1 ....................1 ....................1 ....................1 ....................0 ....................1
4. 1995.................. ........XXX........ ........XXX........ ....................2 ....................1 ....................1 ....................1 ....................1 ....................1 ....................1 ....................1
5. 1996.................. ........XXX........ ........XXX........ ........XXX........ ....................2 ....................1 ....................1 ....................1 ....................1 ....................1 ....................1
6. 1997.................. ........XXX........ ........XXX........ ........XXX........ ........XXX........ ....................2 ....................1 ....................1 ....................1 ....................1 ....................1
7. 1998.................. ........XXX........ ........XXX........ ........XXX........ ........XXX........ ........XXX........ ....................3 ....................1 ....................1 ....................1 ....................1
8. 1999.................. ........XXX........ ........XXX........ ........XXX........ ........XXX........ ........XXX........ ........XXX........ ....................3 ....................1 ....................1 ....................1
9. 2000.................. ........XXX........ ........XXX........ ........XXX........ ........XXX........ ........XXX........ ........XXX........ ........XXX........ ....................3 ....................1 ....................1
10. 2001.................. ........XXX........ ........XXX........ ........XXX........ ........XXX........ ........XXX........ ........XXX........ ........XXX........ ........XXX........ ....................3 ....................1
11. 2002.................. ........XXX........ ........XXX........ ........XXX........ ........XXX........ ........XXX........ ........XXX........ ........XXX........ ........XXX........ ........XXX........ ....................2
SECTION 3ACumulative Number of Claims Reported Direct and Assumed at Year End
Years in Which 1 2 3 4 5 6 7 8 9 10 Premiums Were Earned
and Losses Were Incurred 1993 1994 1995 1996 1997 1998 1999 2000 2001 2002
1. Prior.................... ................237 ..................10 ..................12 ..................13 ....................9 ....................8 ....................6 ....................6 ....................5 ....................5
2. 1993.................. ....................7 ....................8 ....................9 ..................10 ..................10 ..................11 ..................11 ..................11 ..................11 ..................12
3. 1994.................. ........XXX........ ....................6 ....................8 ....................9 ..................10 ..................10 ..................11 ..................11 ..................11 ..................11
4. 1995.................. ........XXX........ ........XXX........ ....................6 ....................8 ....................8 ....................9 ....................9 ....................9 ..................10 ..................10
5. 1996.................. ........XXX........ ........XXX........ ........XXX........ ....................7 ..................10 ..................11 ..................12 ..................12 ..................12 ..................12
6. 1997.................. ........XXX........ ........XXX........ ........XXX........ ........XXX........ ....................7 ..................10 ..................11 ..................12 ..................12 ..................12
7. 1998.................. ........XXX........ ........XXX........ ........XXX........ ........XXX........ ........XXX........ ....................9 ..................11 ..................12 ..................13 ..................13
8. 1999.................. ........XXX........ ........XXX........ ........XXX........ ........XXX........ ........XXX........ ........XXX........ ....................9 ..................12 ..................13 ..................13
9. 2000.................. ........XXX........ ........XXX........ ........XXX........ ........XXX........ ........XXX........ ........XXX........ ........XXX........ ..................10 ..................13 ..................15
10. 2001.................. ........XXX........ ........XXX........ ........XXX........ ........XXX........ ........XXX........ ........XXX........ ........XXX........ ........XXX........ ..................10 ..................13
11. 2002.................. ........XXX........ ........XXX........ ........XXX........ ........XXX........ ........XXX........ ........XXX........ ........XXX........ ........XXX........ ........XXX........ ....................8

Annual Statement for the year 2002 of the TWIN CITY FIRE INSURANCE COMPANY
97
SCHEDULE P - PART 5R - PRODUCTS LIABILITY - CLAIMS-MADESECTION 1B
Cumulative Number of Claims Closed with Loss Payment Direct and Assumed at Year EndYears in Which 1 2 3 4 5 6 7 8 9 10
Premiums Were Earnedand Losses Were Incurred 1993 1994 1995 1996 1997 1998 1999 2000 2001 2002
1. Prior.................... ....................0 ....................0 ...................(0) ...................(0) ....................0 ....................0 ....................0 ....................0 ....................0 ....................0
2. 1993.................. ....................0 ....................0 ....................0 ....................0 ....................0 ....................0 ....................0 ....................0 ....................0 ....................0
3. 1994.................. ........XXX........ ....................0 ....................0 ....................0 ....................0 ....................0 ....................0 ....................0 ....................0 ....................0
4. 1995.................. ........XXX........ ........XXX........ ....................0 ....................0 ....................0 ....................0 ....................0 ....................0 ....................0 ....................0
5. 1996.................. ........XXX........ ........XXX........ ........XXX........ ....................0 ....................0 ...................(0) ....................0 ....................0 ....................0 ....................0
6. 1997.................. ........XXX........ ........XXX........ ........XXX........ ........XXX........ ....................0 ....................0 ....................0 ....................0 ....................0 ....................0
7. 1998.................. ........XXX........ ........XXX........ ........XXX........ ........XXX........ ........XXX........ ....................0 ....................0 ....................0 ....................0 ....................0
8. 1999.................. ........XXX........ ........XXX........ ........XXX........ ........XXX........ ........XXX........ ........XXX........ ....................0 ....................0 ....................0 ....................0
9. 2000.................. ........XXX........ ........XXX........ ........XXX........ ........XXX........ ........XXX........ ........XXX........ ........XXX........ ....................0 ....................0 ....................0
10. 2001.................. ........XXX........ ........XXX........ ........XXX........ ........XXX........ ........XXX........ ........XXX........ ........XXX........ ........XXX........ ....................0 ....................0
11. 2002.................. ........XXX........ ........XXX........ ........XXX........ ........XXX........ ........XXX........ ........XXX........ ........XXX........ ........XXX........ ........XXX........ ....................0
SECTION 2BNumber of Claims Outstanding Direct and Assumed at Year End
Years in Which 1 2 3 4 5 6 7 8 9 10 Premiums Were Earned
and Losses Were Incurred 1993 1994 1995 1996 1997 1998 1999 2000 2001 2002
1. Prior.................... ....................0 ....................0 ....................0 ....................0 ....................0 ....................0 ....................0 ....................0 ....................0 ....................0
2. 1993.................. ....................0 ....................0 ....................0 ....................0 ....................0 ....................0 ....................0 ....................0 ....................0 ....................0
3. 1994.................. ........XXX........ ....................0 ....................0 ....................0 ....................0 ....................0 ....................0 ....................0 ....................0 ....................0
4. 1995.................. ........XXX........ ........XXX........ ....................0 ....................0 ....................0 ....................0 ....................0 ....................0 ....................0 ....................0
5. 1996.................. ........XXX........ ........XXX........ ........XXX........ ....................0 ....................0 ....................0 ....................0 ....................0 ....................0 ....................0
6. 1997.................. ........XXX........ ........XXX........ ........XXX........ ........XXX........ ....................0 ....................0 ....................0 ....................0 ....................0 ....................0
7. 1998.................. ........XXX........ ........XXX........ ........XXX........ ........XXX........ ........XXX........ ....................0 ....................0 ....................0 ....................0 ....................0
8. 1999.................. ........XXX........ ........XXX........ ........XXX........ ........XXX........ ........XXX........ ........XXX........ ....................0 ....................0 ....................0 ....................0
9. 2000.................. ........XXX........ ........XXX........ ........XXX........ ........XXX........ ........XXX........ ........XXX........ ........XXX........ ....................0 ....................0 ....................0
10. 2001.................. ........XXX........ ........XXX........ ........XXX........ ........XXX........ ........XXX........ ........XXX........ ........XXX........ ........XXX........ ....................0 ....................0
11. 2002.................. ........XXX........ ........XXX........ ........XXX........ ........XXX........ ........XXX........ ........XXX........ ........XXX........ ........XXX........ ........XXX........ ....................0
SECTION 3BCumulative Number of Claims Reported Direct and Assumed at Year End
Years in Which 1 2 3 4 5 6 7 8 9 10 Premiums Were Earned
and Losses Were Incurred 1993 1994 1995 1996 1997 1998 1999 2000 2001 2002
1. Prior.................... ....................0 ....................0 ....................0 ....................0 ...................(0) ....................0 ....................0 ....................0 ....................0 ....................0
2. 1993.................. ....................0 ....................0 ....................0 ....................0 ....................0 ....................0 ....................0 ....................0 ....................0 ....................0
3. 1994.................. ........XXX........ ....................0 ....................0 ....................0 ....................0 ....................0 ....................0 ....................0 ....................0 ....................0
4. 1995.................. ........XXX........ ........XXX........ ....................0 ....................0 ....................0 ....................0 ....................0 ....................0 ....................0 ....................0
5. 1996.................. ........XXX........ ........XXX........ ........XXX........ ....................0 ....................0 ....................0 ....................0 ....................0 ....................0 ....................0
6. 1997.................. ........XXX........ ........XXX........ ........XXX........ ........XXX........ ....................0 ....................0 ....................0 ....................0 ....................0 ....................0
7. 1998.................. ........XXX........ ........XXX........ ........XXX........ ........XXX........ ........XXX........ ....................0 ....................0 ....................0 ....................0 ....................0
8. 1999.................. ........XXX........ ........XXX........ ........XXX........ ........XXX........ ........XXX........ ........XXX........ ....................0 ....................0 ....................0 ....................0
9. 2000.................. ........XXX........ ........XXX........ ........XXX........ ........XXX........ ........XXX........ ........XXX........ ........XXX........ ....................0 ....................0 ....................0
10. 2001.................. ........XXX........ ........XXX........ ........XXX........ ........XXX........ ........XXX........ ........XXX........ ........XXX........ ........XXX........ ....................0 ....................0
11. 2002.................. ........XXX........ ........XXX........ ........XXX........ ........XXX........ ........XXX........ ........XXX........ ........XXX........ ........XXX........ ........XXX........ ....................0

Annual Statement for the year 2002 of the TWIN CITY FIRE INSURANCE COMPANY
98
SCHEDULE P - PART 6C - COMMERCIAL AUTO/TRUCK LIABILITY/MEDICALSECTION 1
Cumulative Premiums Earned Direct and Assumed at Year End ($000 omitted) 11Years in Which Premiums 1 2 3 4 5 6 7 8 9 10 Current YearWere Earned and Losses Premiums
Were Incurred 1993 1994 1995 1996 1997 1998 1999 2000 2001 2002 Earned1. Prior................................................. ...............222 .................47 .................19 .................15 .................32 ................(11) .................53 ................(20) .................17 ...................3 ...................32. 1993................................................ ............6,064 ............6,335 ............6,320 ............6,330 ............6,333 ............6,334 ............6,340 ............6,342 ............6,350 ............6,355 ...................43. 1994................................................ .........XXX...... ............5,972 ............6,037 ............6,016 ............6,019 ............6,022 ............6,029 ............6,032 ............6,039 ............6,040 ...................14. 1995................................................ .........XXX...... .........XXX...... ............5,774 ............5,854 ............5,814 ............5,816 ............5,825 ............5,825 ............5,832 ............5,830 ..................(2)5. 1996................................................ .........XXX...... .........XXX...... .........XXX...... ............5,414 ............5,467 ............5,443 ............5,450 ............5,447 ............5,454 ............5,455 ...................16. 1997................................................ .........XXX...... .........XXX...... .........XXX...... .........XXX...... ............5,126 ............5,182 ............5,163 ............5,162 ............5,167 ............5,170 ...................37. 1998................................................ .........XXX...... .........XXX...... .........XXX...... .........XXX...... .........XXX...... ............5,087 ............5,131 ............5,119 ............5,122 ............5,125 ...................38. 1999................................................ .........XXX...... .........XXX...... .........XXX...... .........XXX...... .........XXX...... .........XXX...... ............6,256 ............6,582 ............6,586 ............6,591 ...................49. 2000................................................ .........XXX...... .........XXX...... .........XXX...... .........XXX...... .........XXX...... .........XXX...... .........XXX...... ............6,787 ............7,093 ............7,094 ...................110. 2001................................................ .........XXX...... .........XXX...... .........XXX...... .........XXX...... .........XXX...... .........XXX...... .........XXX...... .........XXX...... ............7,375 ............7,734 ...............35811. 2002................................................ .........XXX...... .........XXX...... .........XXX...... .........XXX...... .........XXX...... .........XXX...... .........XXX...... .........XXX...... .........XXX...... ............7,450 ............7,45012. Total................................................. .........XXX...... .........XXX...... .........XXX...... .........XXX...... .........XXX...... .........XXX...... .........XXX...... .........XXX...... .........XXX...... .........XXX...... ............7,82713. Earned Premiums (Sch. P-Pt 1)...... ............6,286 ............6,288 ............5,833 ............5,498 ............5,176 ............5,115 ............6,362 ............7,084 ............7,738 ............7,827 ...........XXX....
SECTION 2Cumulative Premiums Earned Ceded at Year End ($000 omitted) 11
Years in Which Premiums 1 2 3 4 5 6 7 8 9 10 Current YearWere Earned and Losses Premiums
Were Incurred 1993 1994 1995 1996 1997 1998 1999 2000 2001 2002 Earned1. Prior................................................. ..................(0) ..................(5) ..................(2) ...................0 ...................8 ..................(0) ...................3 ...................0 ...................0 ...................0 ...................02. 1993................................................ ...............615 ...............612 ...............606 ...............606 ...............611 ...............611 ...............611 ...............611 ...............611 ...............611 ...................03. 1994................................................ .........XXX...... ...............365 ...............360 ...............359 ...............363 ...............362 ...............362 ...............362 ...............362 ...............362 ...................04. 1995................................................ .........XXX...... .........XXX...... ...............174 ...............173 ...............172 ...............171 ...............171 ...............171 ...............171 ...............171 ...................05. 1996................................................ .........XXX...... .........XXX...... .........XXX...... ...............179 ...............178 ...............178 ...............178 ...............178 ...............178 ...............178 ...................06. 1997................................................ .........XXX...... .........XXX...... .........XXX...... .........XXX...... ...............151 ...............151 ...............151 ...............151 ...............151 ...............151 ...................07. 1998................................................ .........XXX...... .........XXX...... .........XXX...... .........XXX...... .........XXX...... ...............236 ...............236 ...............236 ...............239 ...............239 ...................08. 1999................................................ .........XXX...... .........XXX...... .........XXX...... .........XXX...... .........XXX...... .........XXX...... ...............399 ...............399 ...............403 ...............404 ...................19. 2000................................................ .........XXX...... .........XXX...... .........XXX...... .........XXX...... .........XXX...... .........XXX...... .........XXX...... ...............351 ...............353 ...............357 ...................410. 2001................................................ .........XXX...... .........XXX...... .........XXX...... .........XXX...... .........XXX...... .........XXX...... .........XXX...... .........XXX...... ...............350 ...............354 ...................311. 2002................................................ .........XXX...... .........XXX...... .........XXX...... .........XXX...... .........XXX...... .........XXX...... .........XXX...... .........XXX...... .........XXX...... ...............431 ...............43112. Total................................................. .........XXX...... .........XXX...... .........XXX...... .........XXX...... .........XXX...... .........XXX...... .........XXX...... .........XXX...... .........XXX...... .........XXX...... ...............43913. Earned Premiums (Sch. P-Pt 1)...... ...............447 ...............358 ...............163 ...............177 ...............166 ...............234 ...............402 ...............352 ...............359 ...............439 ...........XXX....
SCHEDULE P - PART 6D - WORKERS' COMPENSATIONSECTION 1
Cumulative Premiums Earned Direct and Assumed at Year End ($000 omitted) 11Years in Which Premiums 1 2 3 4 5 6 7 8 9 10 Current YearWere Earned and Losses Premiums
Were Incurred 1993 1994 1995 1996 1997 1998 1999 2000 2001 2002 Earned1. Prior................................................. ............4,229 ...............873 ..............(158) ...............327 ................(14) ...............144 .................91 .................27 ................(45) .................31 .................312. 1993................................................ ..........23,808 ..........25,359 ..........25,682 ..........25,542 ..........25,543 ..........25,676 ..........25,726 ..........25,786 ..........25,787 ..........25,816 .................293. 1994................................................ .........XXX...... ..........21,727 ..........23,408 ..........23,385 ..........23,466 ..........23,493 ..........23,545 ..........23,595 ..........23,593 ..........23,588 ..................(5)4. 1995................................................ .........XXX...... .........XXX...... ..........20,555 ..........21,622 ..........21,643 ..........21,569 ..........21,636 ..........21,672 ..........21,635 ..........21,635 ...................15. 1996................................................ .........XXX...... .........XXX...... .........XXX...... ..........18,844 ..........19,595 ..........19,564 ..........19,634 ..........19,668 ..........19,613 ..........19,564 ................(49)6. 1997................................................ .........XXX...... .........XXX...... .........XXX...... .........XXX...... ..........17,055 ..........17,934 ..........18,017 ..........18,044 ..........17,983 ..........17,884 ................(98)7. 1998................................................ .........XXX...... .........XXX...... .........XXX...... .........XXX...... .........XXX...... ..........16,693 ..........17,141 ..........17,145 ..........17,077 ..........17,056 ................(21)8. 1999................................................ .........XXX...... .........XXX...... .........XXX...... .........XXX...... .........XXX...... .........XXX...... ..........15,424 ..........16,049 ..........16,002 ..........15,982 ................(20)9. 2000................................................ .........XXX...... .........XXX...... .........XXX...... .........XXX...... .........XXX...... .........XXX...... .........XXX...... ..........15,325 ..........15,923 ..........16,120 ...............19610. 2001................................................ .........XXX...... .........XXX...... .........XXX...... .........XXX...... .........XXX...... .........XXX...... .........XXX...... .........XXX...... ..........17,082 ..........17,854 ...............77211. 2002................................................ .........XXX...... .........XXX...... .........XXX...... .........XXX...... .........XXX...... .........XXX...... .........XXX...... .........XXX...... .........XXX...... ..........21,071 ..........21,07112. Total................................................. .........XXX...... .........XXX...... .........XXX...... .........XXX...... .........XXX...... .........XXX...... .........XXX...... .........XXX...... .........XXX...... .........XXX...... ..........21,90713. Earned Premiums (Sch. P-Pt 1)...... ..........27,851 ..........23,777 ..........21,953 ..........20,075 ..........17,897 ..........17,772 ..........16,284 ..........16,187 ..........17,367 ..........21,907 ...........XXX....
SECTION 2Cumulative Premiums Earned Ceded at Year End ($000 omitted) 11
Years in Which Premiums 1 2 3 4 5 6 7 8 9 10 Current YearWere Earned and Losses Premiums
Were Incurred 1993 1994 1995 1996 1997 1998 1999 2000 2001 2002 Earned1. Prior................................................. ................(56) ................(86) ................(47) .................15 ...................4 ..................(3) ..................(3) ...................5 ..................(1) ...................1 ...................12. 1993................................................ ............7,624 ............7,605 ............7,570 ............7,571 ............7,566 ............7,565 ............7,565 ............7,565 ............7,565 ............7,566 ...................13. 1994................................................ .........XXX...... ............5,168 ............5,145 ............5,150 ............5,148 ............5,145 ............5,144 ............5,144 ............5,145 ............5,145 ...................04. 1995................................................ .........XXX...... .........XXX...... ............3,302 ............3,308 ............3,308 ............3,303 ............3,302 ............3,300 ............3,301 ............3,301 ..................(0)5. 1996................................................ .........XXX...... .........XXX...... .........XXX...... ............2,284 ............2,284 ............2,282 ............2,283 ............2,281 ............2,281 ............2,281 ..................(0)6. 1997................................................ .........XXX...... .........XXX...... .........XXX...... .........XXX...... ............1,567 ............1,568 ............1,575 ............1,574 ............1,573 ............1,573 ..................(0)7. 1998................................................ .........XXX...... .........XXX...... .........XXX...... .........XXX...... .........XXX...... ............1,119 ............1,124 ............1,124 ............1,123 ............1,124 ...................18. 1999................................................ .........XXX...... .........XXX...... .........XXX...... .........XXX...... .........XXX...... .........XXX...... ............1,176 ............1,176 ............1,184 ............1,184 ...................19. 2000................................................ .........XXX...... .........XXX...... .........XXX...... .........XXX...... .........XXX...... .........XXX...... .........XXX...... ............1,256 ............1,264 ............1,267 ...................410. 2001................................................ .........XXX...... .........XXX...... .........XXX...... .........XXX...... .........XXX...... .........XXX...... .........XXX...... .........XXX...... ............1,206 ............1,210 ...................411. 2002................................................ .........XXX...... .........XXX...... .........XXX...... .........XXX...... .........XXX...... .........XXX...... .........XXX...... .........XXX...... .........XXX...... ............1,837 ............1,83712. Total................................................. .........XXX...... .........XXX...... .........XXX...... .........XXX...... .........XXX...... .........XXX...... .........XXX...... .........XXX...... .........XXX...... .........XXX...... ............1,84813. Earned Premiums (Sch. P-Pt 1)...... ............7,568 ............5,064 ............3,202 ............2,312 ............1,562 ............1,107 ............1,183 ............1,255 ............1,222 ............1,848 ...........XXX....

Annual Statement for the year 2002 of the TWIN CITY FIRE INSURANCE COMPANY
99
SCHEDULE P - PART 6E - COMMERCIAL MULTIPLE PERILSECTION 1
Cumulative Premiums Earned Direct and Assumed at Year End ($000 omitted) 11Years in Which Premiums 1 2 3 4 5 6 7 8 9 10 Current YearWere Earned and Losses Premiums
Were Incurred 1993 1994 1995 1996 1997 1998 1999 2000 2001 2002 Earned1. Prior................................................. ................(32) ..................(3) ..................(4) ..................(3) ..................(1) ..................(1) ...................2 ...................2 ...................3 ...................3 ...................32. 1993................................................ ..........11,787 ..........11,788 ..........11,788 ..........11,791 ..........11,787 ..........11,786 ..........11,785 ..........11,786 ..........11,786 ..........11,790 ...................43. 1994................................................ .........XXX...... ..........13,279 ..........13,280 ..........13,274 ..........13,266 ..........13,264 ..........13,264 ..........13,264 ..........13,264 ..........13,265 ...................14. 1995................................................ .........XXX...... .........XXX...... ..........14,347 ..........14,339 ..........14,321 ..........14,316 ..........14,314 ..........14,314 ..........14,313 ..........14,313 ..................(0)5. 1996................................................ .........XXX...... .........XXX...... .........XXX...... ..........14,295 ..........14,284 ..........14,267 ..........14,259 ..........14,260 ..........14,259 ..........14,259 ..................(0)6. 1997................................................ .........XXX...... .........XXX...... .........XXX...... .........XXX...... ..........14,370 ..........14,356 ..........14,344 ..........14,343 ..........14,343 ..........14,343 ..................(0)7. 1998................................................ .........XXX...... .........XXX...... .........XXX...... .........XXX...... .........XXX...... ..........14,895 ..........14,889 ..........14,894 ..........14,894 ..........14,892 ..................(2)8. 1999................................................ .........XXX...... .........XXX...... .........XXX...... .........XXX...... .........XXX...... .........XXX...... ..........15,956 ..........15,963 ..........15,970 ..........15,963 ..................(7)9. 2000................................................ .........XXX...... .........XXX...... .........XXX...... .........XXX...... .........XXX...... .........XXX...... .........XXX...... ..........17,874 ..........17,880 ..........17,868 ................(12)10. 2001................................................ .........XXX...... .........XXX...... .........XXX...... .........XXX...... .........XXX...... .........XXX...... .........XXX...... .........XXX...... ..........19,748 ..........19,741 ..................(7)11. 2002................................................ .........XXX...... .........XXX...... .........XXX...... .........XXX...... .........XXX...... .........XXX...... .........XXX...... .........XXX...... .........XXX...... ..........22,584 ..........22,58412. Total................................................. .........XXX...... .........XXX...... .........XXX...... .........XXX...... .........XXX...... .........XXX...... .........XXX...... .........XXX...... .........XXX...... .........XXX...... ..........22,56313. Earned Premiums (Sch. P-Pt 1)...... ..........11,755 ..........13,277 ..........14,344 ..........14,281 ..........14,328 ..........14,855 ..........15,930 ..........17,888 ..........19,763 ..........22,563 ...........XXX....
SECTION 2Cumulative Premiums Earned Ceded at Year End ($000 omitted) 11
Years in Which Premiums 1 2 3 4 5 6 7 8 9 10 Current YearWere Earned and Losses Premiums
Were Incurred 1993 1994 1995 1996 1997 1998 1999 2000 2001 2002 Earned1. Prior................................................. ..................(0) ...................7 ...................2 ..................(2) ...................0 ...................0 ...................0 ...................0 ...................0 ...................0 ...................02. 1993................................................ ............1,289 ............1,296 ............1,303 ............1,304 ............1,305 ............1,306 ............1,306 ............1,306 ............1,306 ............1,306 ...................03. 1994................................................ .........XXX...... ............1,549 ............1,554 ............1,557 ............1,561 ............1,561 ............1,553 ............1,553 ............1,553 ............1,553 ...................04. 1995................................................ .........XXX...... .........XXX...... ............1,725 ............1,727 ............1,732 ............1,734 ............1,727 ............1,727 ............1,727 ............1,727 ...................05. 1996................................................ .........XXX...... .........XXX...... .........XXX...... ............1,526 ............1,529 ............1,533 ............1,535 ............1,535 ............1,535 ............1,535 ..................(0)6. 1997................................................ .........XXX...... .........XXX...... .........XXX...... .........XXX...... ............1,365 ............1,368 ............1,373 ............1,375 ............1,374 ............1,374 ...................07. 1998................................................ .........XXX...... .........XXX...... .........XXX...... .........XXX...... .........XXX...... ............1,342 ............1,346 ............1,352 ............1,352 ............1,353 ...................18. 1999................................................ .........XXX...... .........XXX...... .........XXX...... .........XXX...... .........XXX...... .........XXX...... ............1,485 ............1,488 ............1,497 ............1,498 ...................19. 2000................................................ .........XXX...... .........XXX...... .........XXX...... .........XXX...... .........XXX...... .........XXX...... .........XXX...... ............1,563 ............1,571 ............1,579 ...................710. 2001................................................ .........XXX...... .........XXX...... .........XXX...... .........XXX...... .........XXX...... .........XXX...... .........XXX...... .........XXX...... ............2,035 ............2,042 ...................711. 2002................................................ .........XXX...... .........XXX...... .........XXX...... .........XXX...... .........XXX...... .........XXX...... .........XXX...... .........XXX...... .........XXX...... ............1,990 ............1,99012. Total................................................. .........XXX...... .........XXX...... .........XXX...... .........XXX...... .........XXX...... .........XXX...... .........XXX...... .........XXX...... .........XXX...... .........XXX...... ............2,00813. Earned Premiums (Sch. P-Pt 1)...... ............1,289 ............1,562 ............1,739 ............1,530 ............1,380 ............1,350 ............1,481 ............1,575 ............2,050 ............2,008 ...........XXX....
SCHEDULE P - PART 6H - OTHER LIABILITY - OCCURRENCESECTION 1A
Cumulative Premiums Earned Direct and Assumed at Year End ($000 omitted) 11Years in Which Premiums 1 2 3 4 5 6 7 8 9 10 Current YearWere Earned and Losses Premiums
Were Incurred 1993 1994 1995 1996 1997 1998 1999 2000 2001 2002 Earned1. Prior................................................. ...............261 ...............347 ...............282 ................(59) .................19 ..............(439) .................78 .................38 ................(33) ..................(9) ..................(9)2. 1993................................................ ............5,741 ............5,799 ............5,841 ............5,849 ............5,838 ............5,944 ............5,985 ............5,981 ............5,985 ............5,987 ...................13. 1994................................................ .........XXX...... ............5,956 ............6,044 ............6,122 ............6,097 ............6,178 ............6,226 ............6,223 ............6,230 ............6,219 ................(11)4. 1995................................................ .........XXX...... .........XXX...... ............5,679 ............5,772 ............5,784 ............5,898 ............5,955 ............5,956 ............5,961 ............5,945 ................(17)5. 1996................................................ .........XXX...... .........XXX...... .........XXX...... ............5,339 ............5,458 ............5,562 ............5,628 ............5,645 ............5,661 ............5,642 ................(19)6. 1997................................................ .........XXX...... .........XXX...... .........XXX...... .........XXX...... ............6,028 ............6,122 ............6,182 ............6,217 ............6,246 ............6,233 ................(13)7. 1998................................................ .........XXX...... .........XXX...... .........XXX...... .........XXX...... .........XXX...... ............6,115 ............6,201 ............6,244 ............6,332 ............6,332 ..................(0)8. 1999................................................ .........XXX...... .........XXX...... .........XXX...... .........XXX...... .........XXX...... .........XXX...... ............4,768 ............4,790 ............4,958 ............4,997 .................409. 2000................................................ .........XXX...... .........XXX...... .........XXX...... .........XXX...... .........XXX...... .........XXX...... .........XXX...... ............4,945 ............5,039 ............5,045 ...................610. 2001................................................ .........XXX...... .........XXX...... .........XXX...... .........XXX...... .........XXX...... .........XXX...... .........XXX...... .........XXX...... ............4,967 ............4,966 ..................(1)11. 2002................................................ .........XXX...... .........XXX...... .........XXX...... .........XXX...... .........XXX...... .........XXX...... .........XXX...... .........XXX...... .........XXX...... ............5,541 ............5,54112. Total................................................. .........XXX...... .........XXX...... .........XXX...... .........XXX...... .........XXX...... .........XXX...... .........XXX...... .........XXX...... .........XXX...... .........XXX...... ............5,51713. Earned Premiums (Sch. P-Pt 1)...... ............5,439 ............5,973 ............5,701 ............5,458 ............6,142 ............6,174 ............5,205 ............5,096 ............5,344 ............5,517 ...........XXX....
SECTION 2ACumulative Premiums Earned Ceded at Year End ($000 omitted) 11
Years in Which Premiums 1 2 3 4 5 6 7 8 9 10 Current YearWere Earned and Losses Premiums
Were Incurred 1993 1994 1995 1996 1997 1998 1999 2000 2001 2002 Earned1. Prior................................................. ................(33) .................15 ................(13) ................(20) ................(22) ................(34) ................(10) ................(16) ................(15) ..................(6) ..................(6)2. 1993................................................ ...............575 ...............576 ...............579 ...............579 ...............580 ...............577 ...............577 ...............577 ...............577 ...............571 ..................(6)3. 1994................................................ .........XXX...... ...............499 ...............500 ...............499 ...............500 ...............498 ...............499 ...............499 ...............499 ...............496 ..................(3)4. 1995................................................ .........XXX...... .........XXX...... ...............534 ...............533 ...............534 ...............531 ...............533 ...............533 ...............533 ...............529 ..................(3)5. 1996................................................ .........XXX...... .........XXX...... .........XXX...... ...............548 ...............549 ...............547 ...............548 ...............548 ...............549 ...............548 ..................(1)6. 1997................................................ .........XXX...... .........XXX...... .........XXX...... .........XXX...... ...............633 ...............632 ...............634 ...............637 ...............643 ...............642 ..................(1)7. 1998................................................ .........XXX...... .........XXX...... .........XXX...... .........XXX...... .........XXX...... ...............969 ...............970 ...............980 ...............996 ...............997 ...................18. 1999................................................ .........XXX...... .........XXX...... .........XXX...... .........XXX...... .........XXX...... .........XXX...... ...............808 ...............815 ...............825 ...............829 ...................49. 2000................................................ .........XXX...... .........XXX...... .........XXX...... .........XXX...... .........XXX...... .........XXX...... .........XXX...... ............1,344 ............1,344 ............1,348 ...................410. 2001................................................ .........XXX...... .........XXX...... .........XXX...... .........XXX...... .........XXX...... .........XXX...... .........XXX...... .........XXX...... ............5,753 ............5,755 ...................211. 2002................................................ .........XXX...... .........XXX...... .........XXX...... .........XXX...... .........XXX...... .........XXX...... .........XXX...... .........XXX...... .........XXX...... ............1,642 ............1,64212. Total................................................. .........XXX...... .........XXX...... .........XXX...... .........XXX...... .........XXX...... .........XXX...... .........XXX...... .........XXX...... .........XXX...... .........XXX...... ............1,63113. Earned Premiums (Sch. P-Pt 1)...... ...............542 ...............520 ...............520 ...............526 ...............614 ...............926 ...............805 ............1,348 ............5,771 ............1,631 ...........XXX....

Annual Statement for the year 2002 of the TWIN CITY FIRE INSURANCE COMPANY
100
SCHEDULE P - PART 6H - OTHER LIABILITY - CLAIMS-MADESECTION 1B
Cumulative Premiums Earned Direct and Assumed at Year End ($000 omitted) 11Years in Which Premiums 1 2 3 4 5 6 7 8 9 10 Current YearWere Earned and Losses Premiums
Were Incurred 1993 1994 1995 1996 1997 1998 1999 2000 2001 2002 Earned1. Prior................................................. ...................5 ...................3 ...................2 ...................1 ...................1 ..................(0) ...................0 ...................0 ...................0 ...................0 ...................02. 1993................................................ ...............312 ...............313 ...............314 ...............314 ...............315 ...............315 ...............315 ...............315 ...............315 ...............315 ...................03. 1994................................................ .........XXX...... ...............667 ...............668 ...............668 ...............668 ...............668 ...............667 ...............668 ...............668 ...............668 ...................04. 1995................................................ .........XXX...... .........XXX...... ...............731 ...............731 ...............731 ...............733 ...............732 ...............733 ...............733 ...............733 ...................05. 1996................................................ .........XXX...... .........XXX...... .........XXX...... ...............684 ...............684 ...............687 ...............686 ...............686 ...............687 ...............687 ...................06. 1997................................................ .........XXX...... .........XXX...... .........XXX...... .........XXX...... ...............745 ...............746 ...............748 ...............749 ...............750 ...............750 ...................07. 1998................................................ .........XXX...... .........XXX...... .........XXX...... .........XXX...... .........XXX...... ...............800 ...............802 ...............807 ...............811 ...............811 ...................08. 1999................................................ .........XXX...... .........XXX...... .........XXX...... .........XXX...... .........XXX...... .........XXX...... ...............899 ...............903 ...............915 ...............915 ...................09. 2000................................................ .........XXX...... .........XXX...... .........XXX...... .........XXX...... .........XXX...... .........XXX...... .........XXX...... ............2,603 ............2,612 ............2,748 ...............13610. 2001................................................ .........XXX...... .........XXX...... .........XXX...... .........XXX...... .........XXX...... .........XXX...... .........XXX...... .........XXX...... ............4,587 ............4,723 ...............13611. 2002................................................ .........XXX...... .........XXX...... .........XXX...... .........XXX...... .........XXX...... .........XXX...... .........XXX...... .........XXX...... .........XXX...... ............5,912 ............5,91212. Total................................................. .........XXX...... .........XXX...... .........XXX...... .........XXX...... .........XXX...... .........XXX...... .........XXX...... .........XXX...... .........XXX...... .........XXX...... ............6,18513. Earned Premiums (Sch. P-Pt 1)...... ...............318 ...............669 ...............733 ...............685 ...............747 ...............805 ...............901 ............2,614 ............4,615 ............6,185 ...........XXX....
SECTION 2BCumulative Premiums Earned Ceded at Year End ($000 omitted) 11
Years in Which Premiums 1 2 3 4 5 6 7 8 9 10 Current YearWere Earned and Losses Premiums
Were Incurred 1993 1994 1995 1996 1997 1998 1999 2000 2001 2002 Earned1. Prior................................................. ...................3 ...................2 ...................1 ...................0 ...................0 ...................0 ...................0 ...................0 ...................0 ...................0 ...................02. 1993................................................ .................36 .................36 .................36 .................36 .................36 .................36 .................36 .................36 .................36 .................36 ...................03. 1994................................................ .........XXX...... .................48 .................48 .................48 .................48 .................48 .................48 .................48 .................48 .................48 ...................04. 1995................................................ .........XXX...... .........XXX...... .................45 .................45 .................45 .................45 .................45 .................45 .................45 .................45 ...................05. 1996................................................ .........XXX...... .........XXX...... .........XXX...... .................65 .................65 .................65 .................65 .................65 .................66 .................66 ...................06. 1997................................................ .........XXX...... .........XXX...... .........XXX...... .........XXX...... .................76 .................76 .................76 .................77 .................77 .................77 ...................07. 1998................................................ .........XXX...... .........XXX...... .........XXX...... .........XXX...... .........XXX...... .................96 .................97 ...............102 ...............102 ...............102 ...................08. 1999................................................ .........XXX...... .........XXX...... .........XXX...... .........XXX...... .........XXX...... .........XXX...... ...............115 ...............119 ...............124 ...............124 ...................09. 2000................................................ .........XXX...... .........XXX...... .........XXX...... .........XXX...... .........XXX...... .........XXX...... .........XXX...... ............1,165 ............1,169 ............1,244 .................7510. 2001................................................ .........XXX...... .........XXX...... .........XXX...... .........XXX...... .........XXX...... .........XXX...... .........XXX...... .........XXX...... ............2,842 ............2,917 .................7511. 2002................................................ .........XXX...... .........XXX...... .........XXX...... .........XXX...... .........XXX...... .........XXX...... .........XXX...... .........XXX...... .........XXX...... ............3,504 ............3,50412. Total................................................. .........XXX...... .........XXX...... .........XXX...... .........XXX...... .........XXX...... .........XXX...... .........XXX...... .........XXX...... .........XXX...... .........XXX...... ............3,65413. Earned Premiums (Sch. P-Pt 1)...... .................39 .................49 .................46 .................65 .................76 .................96 ...............116 ............1,174 ............2,852 ............3,654 ...........XXX....
SCHEDULE P - PART 6M - INTERNATIONALSECTION 1
Cumulative Premiums Earned Direct and Assumed at Year End ($000 omitted) 11Years in Which Premiums 1 2 3 4 5 6 7 8 9 10 Current YearWere Earned and Losses Premiums
Were Incurred 1993 1994 1995 1996 1997 1998 1999 2000 2001 2002 Earned1. Prior................................................. .................78 .................44 .................17 ...................3 ..................(1) ..................(1) ...................1 ...................0 ...................0 ...................0 ...................02. 1993................................................ ............1,174 ............1,209 ............1,226 ............1,229 ............1,235 ............1,235 ............1,235 ............1,235 ............1,235 ............1,236 ...................03. 1994................................................ .........XXX...... ............1,315 ............1,324 ............1,331 ............1,334 ............1,335 ............1,335 ............1,335 ............1,335 ............1,336 ...................04. 1995................................................ .........XXX...... .........XXX...... ............1,144 ............1,150 ............1,156 ............1,158 ............1,157 ............1,157 ............1,158 ............1,158 ...................05. 1996................................................ .........XXX...... .........XXX...... .........XXX...... ............1,046 ............1,052 ............1,052 ............1,053 ............1,053 ............1,053 ............1,053 ...................06. 1997................................................ .........XXX...... .........XXX...... .........XXX...... .........XXX...... ............1,100 ............1,099 ............1,107 ............1,107 ............1,107 ............1,107 ...................07. 1998................................................ .........XXX...... .........XXX...... .........XXX...... .........XXX...... .........XXX...... ............1,027 ............1,033 ............1,033 ............1,033 ............1,033 ...................08. 1999................................................ .........XXX...... .........XXX...... .........XXX...... .........XXX...... .........XXX...... .........XXX...... ............1,147 ............1,147 ............1,147 ............1,147 ...................09. 2000................................................ .........XXX...... .........XXX...... .........XXX...... .........XXX...... .........XXX...... .........XXX...... .........XXX...... ............1,162 ............1,162 ............1,162 ...................010. 2001................................................ .........XXX...... .........XXX...... .........XXX...... .........XXX...... .........XXX...... .........XXX...... .........XXX...... .........XXX...... ...............994 ...............994 ...................011. 2002................................................ .........XXX...... .........XXX...... .........XXX...... .........XXX...... .........XXX...... .........XXX...... .........XXX...... .........XXX...... .........XXX...... ...............680 ...............68012. Total................................................. .........XXX...... .........XXX...... .........XXX...... .........XXX...... .........XXX...... .........XXX...... .........XXX...... .........XXX...... .........XXX...... .........XXX...... ...............68013. Earned Premiums (Sch. P-Pt 1)...... ............1,252 ............1,394 ............1,186 ............1,066 ............1,118 ............1,029 ............1,163 ............1,163 ...............995 ...............680 ...........XXX....
SECTION 2Cumulative Premiums Earned Ceded at Year End ($000 omitted) 11
Years in Which Premiums 1 2 3 4 5 6 7 8 9 10 Current YearWere Earned and Losses Premiums
Were Incurred 1993 1994 1995 1996 1997 1998 1999 2000 2001 2002 Earned1. Prior................................................. ...................2 ...................4 ..................(0) ...................2 ..................(2) ...................0 ...................0 ...................0 ...................0 ...................0 ...................02. 1993................................................ .................19 .................22 .................22 .................22 .................22 .................22 .................22 .................22 .................22 .................22 ...................03. 1994................................................ .........XXX...... .................67 .................67 .................67 .................67 .................67 .................67 .................67 .................67 .................67 ...................04. 1995................................................ .........XXX...... .........XXX...... ...................2 ...................2 ...................2 ...................2 ...................2 ...................2 ...................2 ...................2 ...................05. 1996................................................ .........XXX...... .........XXX...... .........XXX...... ...................3 ...................3 ...................3 ...................3 ...................3 ...................3 ...................3 ...................06. 1997................................................ .........XXX...... .........XXX...... .........XXX...... .........XXX...... ...................7 ...................7 ...................7 ...................7 ...................7 ...................7 ...................07. 1998................................................ .........XXX...... .........XXX...... .........XXX...... .........XXX...... .........XXX...... ...................6 ...................6 ...................6 ...................6 ...................6 ...................08. 1999................................................ .........XXX...... .........XXX...... .........XXX...... .........XXX...... .........XXX...... .........XXX...... .................19 .................19 .................19 .................19 ...................09. 2000................................................ .........XXX...... .........XXX...... .........XXX...... .........XXX...... .........XXX...... .........XXX...... .........XXX...... .................74 .................74 .................74 ...................010. 2001................................................ .........XXX...... .........XXX...... .........XXX...... .........XXX...... .........XXX...... .........XXX...... .........XXX...... .........XXX...... ...............317 ...............317 ...................011. 2002................................................ .........XXX...... .........XXX...... .........XXX...... .........XXX...... .........XXX...... .........XXX...... .........XXX...... .........XXX...... .........XXX...... .................12 .................1212. Total................................................. .........XXX...... .........XXX...... .........XXX...... .........XXX...... .........XXX...... .........XXX...... .........XXX...... .........XXX...... .........XXX...... .........XXX...... .................1213. Earned Premiums (Sch. P-Pt 1)...... .................21 .................75 ...................2 ...................5 ...................5 ...................6 .................19 .................74 ...............317 .................12 ...........XXX....

Annual Statement for the year 2002 of the TWIN CITY FIRE INSURANCE COMPANY
101
SCHEDULE P - PART 6N - REINSURANCENONPROPORTIONAL ASSUMED PROPERTY
SECTION 1Cumulative Premiums Earned Direct and Assumed at Year End ($000 omitted) 11
Years in Which Premiums 1 2 3 4 5 6 7 8 9 10 Current YearWere Earned and Losses Premiums
Were Incurred 1993 1994 1995 1996 1997 1998 1999 2000 2001 2002 Earned1. Prior................................ ...............12 ...............10 ...............10 .................0 ................(0) .................0 .................0 .................0 .................0 .................0 .................02. 1993............................... ..........1,820 ..........1,820 ..........1,831 ..........1,838 ..........1,838 ..........1,838 ..........1,838 ..........1,838 ..........1,838 ..........1,838 .................03. 1994............................... .........XXX.... ..........1,823 ..........1,835 ..........1,841 ..........1,844 ..........1,845 ..........1,845 ..........1,845 ..........1,845 ..........1,845 .................04. 1995............................... .........XXX.... .........XXX.... ..........2,166 ..........2,166 ..........2,184 ..........2,189 ..........2,192 ..........2,192 ..........2,192 ..........2,192 .................05. 1996............................... .........XXX.... .........XXX.... .........XXX.... ..........1,940 ..........1,955 ..........1,971 ..........1,975 ..........1,975 ..........1,975 ..........1,975 .................06. 1997............................... .........XXX.... .........XXX.... .........XXX.... .........XXX.... ..........1,744 ..........1,756 ..........1,763 ..........1,763 ..........1,763 ..........1,763 .................07. 1998............................... .........XXX.... .........XXX.... .........XXX.... .........XXX.... .........XXX.... ..........1,298 ..........1,304 ..........1,304 ..........1,304 ..........1,304 .................08. 1999............................... .........XXX.... .........XXX.... .........XXX.... .........XXX.... .........XXX.... .........XXX.... ..........1,767 ..........1,767 ..........1,767 ..........1,767 ................(0)9. 2000............................... .........XXX.... .........XXX.... .........XXX.... .........XXX.... .........XXX.... .........XXX.... .........XXX.... ..........2,704 ..........2,704 ..........2,704 ................(0)
10. 2001............................... .........XXX.... .........XXX.... .........XXX.... .........XXX.... .........XXX.... .........XXX.... .........XXX.... .........XXX.... ..........3,623 ..........3,623 ................(0)11. 2002............................... .........XXX.... .........XXX.... .........XXX.... .........XXX.... .........XXX.... .........XXX.... .........XXX.... .........XXX.... .........XXX.... ..........3,721 ..........3,72112. Total................................ .........XXX.... .........XXX.... .........XXX.... .........XXX.... .........XXX.... .........XXX.... .........XXX.... .........XXX.... .........XXX.... .........XXX.... ..........3,72113. Earned Premiums (P-Pt.1) ..........1,830 ..........1,823 ..........2,189 ..........1,952 ..........1,781 ..........1,331 ..........1,788 ..........2,704 ..........3,623 ..........3,721 .........XXX....
SECTION 2Cumulative Premiums Earned Ceded at Year End ($000 omitted) 11
Years in Which Premiums 1 2 3 4 5 6 7 8 9 10 Current YearWere Earned and Losses Premiums
Were Incurred 1993 1994 1995 1996 1997 1998 1999 2000 2001 2002 Earned1. Prior................................ ................(3) ................(4) ................(4) .................0 .................1 .................0 .................0 .................0 .................0 .................0 .................02. 1993............................... ................(5) ................(5) ................(5) ................(5) ................(4) ................(4) ................(4) ................(4) ................(4) ................(4) .................03. 1994............................... .........XXX.... ...............15 ...............15 ...............15 ...............16 ...............16 ...............16 ...............16 ...............16 ...............16 .................04. 1995............................... .........XXX.... .........XXX.... .............225 .............225 .............227 .............227 .............227 .............227 .............227 .............227 .................05. 1996............................... .........XXX.... .........XXX.... .........XXX.... .............348 .............349 .............353 .............353 .............353 .............353 .............353 .................06. 1997............................... .........XXX.... .........XXX.... .........XXX.... .........XXX.... .............293 .............296 .............296 .............296 .............296 .............296 .................07. 1998............................... .........XXX.... .........XXX.... .........XXX.... .........XXX.... .........XXX.... ................(8) ................(8) ................(8) ................(8) ................(8) .................08. 1999............................... .........XXX.... .........XXX.... .........XXX.... .........XXX.... .........XXX.... .........XXX.... .............292 .............292 .............292 .............292 .................09. 2000............................... .........XXX.... .........XXX.... .........XXX.... .........XXX.... .........XXX.... .........XXX.... .........XXX.... .............715 .............715 .............715 .................0
10. 2001............................... .........XXX.... .........XXX.... .........XXX.... .........XXX.... .........XXX.... .........XXX.... .........XXX.... .........XXX.... ..........1,416 ..........1,416 .................011. 2002............................... .........XXX.... .........XXX.... .........XXX.... .........XXX.... .........XXX.... .........XXX.... .........XXX.... .........XXX.... .........XXX.... .............471 .............47112. Total................................ .........XXX.... .........XXX.... .........XXX.... .........XXX.... .........XXX.... .........XXX.... .........XXX.... .........XXX.... .........XXX.... .........XXX.... .............47113. Earned Premiums (P-Pt.1) ................(8) ...............15 .............225 .............347 .............298 ................(1) .............292 .............715 ..........1,416 .............471 .........XXX....
SCHEDULE P - PART 6O - REINSURANCE
NONPROPORTIONAL ASSUMED LIABILITYSECTION 1
Cumulative Premiums Earned Direct and Assumed at Year End ($000 omitted) 11Years in Which Premiums 1 2 3 4 5 6 7 8 9 10 Current YearWere Earned and Losses Premiums
Were Incurred 1993 1994 1995 1996 1997 1998 1999 2000 2001 2002 Earned1. Prior................................ .................0 .................0 .................1 .................2 .................0 .................9 .................1 .................0 .................0 .................0 .................02. 1993............................... .............883 .............883 .............892 .............894 .............895 .............895 .............895 .............895 .............895 .............895 .................03. 1994............................... .........XXX.... ..........1,177 ..........1,185 ..........1,190 ..........1,191 ..........1,192 ..........1,193 ..........1,193 ..........1,193 ..........1,193 .................04. 1995............................... .........XXX.... .........XXX.... ..........1,324 ..........1,326 ..........1,333 ..........1,336 ..........1,337 ..........1,337 ..........1,337 ..........1,337 .................05. 1996............................... .........XXX.... .........XXX.... .........XXX.... ..........2,312 ..........2,319 ..........2,341 ..........2,342 ..........2,342 ..........2,342 ..........2,342 .................06. 1997............................... .........XXX.... .........XXX.... .........XXX.... .........XXX.... ..........1,972 ..........1,993 ..........2,009 ..........2,009 ..........2,009 ..........2,009 .................07. 1998............................... .........XXX.... .........XXX.... .........XXX.... .........XXX.... .........XXX.... ..........2,199 ..........2,215 ..........2,215 ..........2,215 ..........2,215 .................08. 1999............................... .........XXX.... .........XXX.... .........XXX.... .........XXX.... .........XXX.... .........XXX.... ..........2,253 ..........2,253 ..........2,253 ..........2,253 .................09. 2000............................... .........XXX.... .........XXX.... .........XXX.... .........XXX.... .........XXX.... .........XXX.... .........XXX.... ..........2,359 ..........2,360 ..........2,360 .................0
10. 2001............................... .........XXX.... .........XXX.... .........XXX.... .........XXX.... .........XXX.... .........XXX.... .........XXX.... .........XXX.... ..........2,244 ..........2,244 .................011. 2002............................... .........XXX.... .........XXX.... .........XXX.... .........XXX.... .........XXX.... .........XXX.... .........XXX.... .........XXX.... .........XXX.... ..........1,411 ..........1,41112. Total................................ .........XXX.... .........XXX.... .........XXX.... .........XXX.... .........XXX.... .........XXX.... .........XXX.... .........XXX.... .........XXX.... .........XXX.... ..........1,41113. Earned Premiums (P-Pt.1) .............884 ..........1,177 ..........1,486 ..........2,499 ..........1,988 ..........2,255 ..........2,290 ..........2,360 ..........2,244 ..........1,411 .........XXX....
SECTION 2Cumulative Premiums Earned Ceded at Year End ($000 omitted) 11
Years in Which Premiums 1 2 3 4 5 6 7 8 9 10 Current YearWere Earned and Losses Premiums
Were Incurred 1993 1994 1995 1996 1997 1998 1999 2000 2001 2002 Earned1. Prior................................ ................(0) .................0 .................0 .................0 .................0 .................0 .................0 .................0 .................0 .................0 .................02. 1993............................... ................(1) ................(1) ................(2) ................(2) ................(2) ................(2) ................(2) ................(2) ................(2) ................(2) .................03. 1994............................... .........XXX.... ................(7) ................(8) ................(8) ................(8) ................(8) ................(8) ................(8) ................(8) ................(8) .................04. 1995............................... .........XXX.... .........XXX.... ..............(24) ..............(24) ..............(24) ..............(24) ..............(24) ..............(24) ..............(24) ..............(24) .................05. 1996............................... .........XXX.... .........XXX.... .........XXX.... ..............(10) ..............(10) ..............(10) ..............(10) ..............(10) ..............(10) ..............(10) .................06. 1997............................... .........XXX.... .........XXX.... .........XXX.... .........XXX.... .................9 .................9 .................9 .................9 .................9 .................9 .................07. 1998............................... .........XXX.... .........XXX.... .........XXX.... .........XXX.... .........XXX.... ...............17 ...............17 ...............17 ...............17 ...............17 .................08. 1999............................... .........XXX.... .........XXX.... .........XXX.... .........XXX.... .........XXX.... .........XXX.... .............433 .............433 .............433 .............433 .................09. 2000............................... .........XXX.... .........XXX.... .........XXX.... .........XXX.... .........XXX.... .........XXX.... .........XXX.... .................6 .................6 .................6 .................0
10. 2001............................... .........XXX.... .........XXX.... .........XXX.... .........XXX.... .........XXX.... .........XXX.... .........XXX.... .........XXX.... ..........3,706 ..........3,706 .................011. 2002............................... .........XXX.... .........XXX.... .........XXX.... .........XXX.... .........XXX.... .........XXX.... .........XXX.... .........XXX.... .........XXX.... .............111 .............11112. Total................................ .........XXX.... .........XXX.... .........XXX.... .........XXX.... .........XXX.... .........XXX.... .........XXX.... .........XXX.... .........XXX.... .........XXX.... .............11113. Earned Premiums (P-Pt.1) ................(1) ................(7) ..............(26) ..............(10) .................9 ...............17 .............433 .................6 ..........3,706 .............111 .........XXX....

Annual Statement for the year 2002 of the TWIN CITY FIRE INSURANCE COMPANY
102
SCHEDULE P - PART 6R - PRODUCTS LIABILITY - OCCURRENCESECTION 1A
Cumulative Premiums Earned Direct and Assumed at Year End ($000 omitted) 11Years in Which Premiums 1 2 3 4 5 6 7 8 9 10 Current YearWere Earned and Losses Premiums
Were Incurred 1993 1994 1995 1996 1997 1998 1999 2000 2001 2002 Earned1. Prior................................................. ...............124 .................97 .................51 ...................9 ................(97) .................22 ................(10) .................74 .................18 ..................(0) ..................(0)2. 1993................................................ ...............577 ...............561 ...............564 ...............572 ...............616 ...............691 ...............679 ...............679 ...............679 ...............678 ..................(0)3. 1994................................................ .........XXX...... ...............783 ...............776 ...............773 ...............773 ...............773 ...............773 ...............773 ...............773 ...............773 ...................04. 1995................................................ .........XXX...... .........XXX...... ...............958 ...............956 ...............955 ...............955 ...............956 ...............955 ...............955 ...............954 ..................(1)5. 1996................................................ .........XXX...... .........XXX...... .........XXX...... ...............940 ...............940 ...............940 ...............939 ...............932 ...............932 ...............932 ..................(1)6. 1997................................................ .........XXX...... .........XXX...... .........XXX...... .........XXX...... ...............543 ...............544 ...............539 ...............525 ...............526 ...............526 ...................07. 1998................................................ .........XXX...... .........XXX...... .........XXX...... .........XXX...... .........XXX...... ...............552 ...............549 ...............547 ...............545 ...............545 ...................08. 1999................................................ .........XXX...... .........XXX...... .........XXX...... .........XXX...... .........XXX...... .........XXX...... ...............689 ...............695 ...............694 ...............697 ...................39. 2000................................................ .........XXX...... .........XXX...... .........XXX...... .........XXX...... .........XXX...... .........XXX...... .........XXX...... ...............937 ...............938 ...............941 ...................310. 2001................................................ .........XXX...... .........XXX...... .........XXX...... .........XXX...... .........XXX...... .........XXX...... .........XXX...... .........XXX...... ...............701 ...............701 ...................011. 2002................................................ .........XXX...... .........XXX...... .........XXX...... .........XXX...... .........XXX...... .........XXX...... .........XXX...... .........XXX...... .........XXX...... ...............855 ...............85512. Total................................................. .........XXX...... .........XXX...... .........XXX...... .........XXX...... .........XXX...... .........XXX...... .........XXX...... .........XXX...... .........XXX...... .........XXX...... ...............86013. Earned Premiums (Sch. P-Pt 1)...... ...............701 ...............856 ...............968 ...............953 ...............489 ...............649 ...............659 ...............994 ...............717 ...............860 ...........XXX....
SECTION 2ACumulative Premiums Earned Ceded at Year End ($000 omitted) 11
Years in Which Premiums 1 2 3 4 5 6 7 8 9 10 Current YearWere Earned and Losses Premiums
Were Incurred 1993 1994 1995 1996 1997 1998 1999 2000 2001 2002 Earned1. Prior................................................. .................24 .................11 ...................7 ..................(0) ..................(6) ..................(0) ..................(0) ...................0 ...................0 ...................0 ...................02. 1993................................................ ...............112 ...............112 ...............112 ...............112 ...............112 ...............112 ...............112 ...............112 ...............112 ...............113 ...................03. 1994................................................ .........XXX...... .................24 .................24 .................24 .................24 .................24 .................24 .................24 .................24 .................24 ...................04. 1995................................................ .........XXX...... .........XXX...... .................31 .................31 .................31 .................32 .................32 .................32 .................31 .................31 ...................05. 1996................................................ .........XXX...... .........XXX...... .........XXX...... .................82 .................82 .................83 .................83 .................83 .................83 .................83 ...................06. 1997................................................ .........XXX...... .........XXX...... .........XXX...... .........XXX...... .................88 .................89 .................89 .................89 .................90 .................90 ...................07. 1998................................................ .........XXX...... .........XXX...... .........XXX...... .........XXX...... .........XXX...... ...............118 ...............118 ...............119 ...............120 ...............120 ...................08. 1999................................................ .........XXX...... .........XXX...... .........XXX...... .........XXX...... .........XXX...... .........XXX...... ...............119 ...............120 ...............121 ...............121 ..................(0)9. 2000................................................ .........XXX...... .........XXX...... .........XXX...... .........XXX...... .........XXX...... .........XXX...... .........XXX...... ...............124 ...............125 ...............126 ...................110. 2001................................................ .........XXX...... .........XXX...... .........XXX...... .........XXX...... .........XXX...... .........XXX...... .........XXX...... .........XXX...... ............1,295 ............1,295 ...................111. 2002................................................ .........XXX...... .........XXX...... .........XXX...... .........XXX...... .........XXX...... .........XXX...... .........XXX...... .........XXX...... .........XXX...... ...............268 ...............26812. Total................................................. .........XXX...... .........XXX...... .........XXX...... .........XXX...... .........XXX...... .........XXX...... .........XXX...... .........XXX...... .........XXX...... .........XXX...... ...............27013. Earned Premiums (Sch. P-Pt 1)...... ...............136 .................23 .................29 .................82 .................82 ...............120 ...............120 ...............127 ............1,298 ...............270 ...........XXX....
SCHEDULE P - PART 6R - PRODUCTS LIABILITY - CLAIMS-MADESECTION 1B
Cumulative Premiums Earned Direct and Assumed at Year End ($000 omitted) 11Years in Which Premiums 1 2 3 4 5 6 7 8 9 10 Current YearWere Earned and Losses Premiums
Were Incurred 1993 1994 1995 1996 1997 1998 1999 2000 2001 2002 Earned1. Prior................................................. ...................1 ..................(0) ...................0 ...................0 ...................0 ...................0 ...................0 ...................0 ...................0 ...................0 ...................02. 1993................................................ .................28 .................28 .................29 .................29 .................29 .................29 .................29 .................29 .................29 .................29 ...................03. 1994................................................ .........XXX...... .................45 .................45 .................46 .................46 .................46 .................46 .................46 .................46 .................46 ...................04. 1995................................................ .........XXX...... .........XXX...... .................43 .................44 .................44 .................44 .................44 .................44 .................44 .................44 ...................05. 1996................................................ .........XXX...... .........XXX...... .........XXX...... .................42 .................43 .................45 .................45 .................45 .................45 .................45 ...................06. 1997................................................ .........XXX...... .........XXX...... .........XXX...... .........XXX...... .................44 .................46 .................46 .................46 .................46 .................46 ...................07. 1998................................................ .........XXX...... .........XXX...... .........XXX...... .........XXX...... .........XXX...... .................41 .................41 .................44 .................45 .................47 ...................28. 1999................................................ .........XXX...... .........XXX...... .........XXX...... .........XXX...... .........XXX...... .........XXX...... .................37 .................39 .................41 .................43 ...................29. 2000................................................ .........XXX...... .........XXX...... .........XXX...... .........XXX...... .........XXX...... .........XXX...... .........XXX...... .................27 .................28 .................28 ...................010. 2001................................................ .........XXX...... .........XXX...... .........XXX...... .........XXX...... .........XXX...... .........XXX...... .........XXX...... .........XXX...... .................28 .................28 ...................011. 2002................................................ .........XXX...... .........XXX...... .........XXX...... .........XXX...... .........XXX...... .........XXX...... .........XXX...... .........XXX...... .........XXX...... .................29 .................2912. Total................................................. .........XXX...... .........XXX...... .........XXX...... .........XXX...... .........XXX...... .........XXX...... .........XXX...... .........XXX...... .........XXX...... .........XXX...... .................3313. Earned Premiums (Sch. P-Pt 1)...... .................29 .................44 .................44 .................45 .................45 .................45 .................37 .................32 .................33 .................33 ...........XXX....
SECTION 2BCumulative Premiums Earned Ceded at Year End ($000 omitted) 11
Years in Which Premiums 1 2 3 4 5 6 7 8 9 10 Current YearWere Earned and Losses Premiums
Were Incurred 1993 1994 1995 1996 1997 1998 1999 2000 2001 2002 Earned1. Prior................................................. ...................0 ...................0 ...................0 ...................0 ...................0 ...................0 ...................0 ...................0 ...................0 ...................0 ...................02. 1993................................................ ...................1 ...................1 ...................2 ...................2 ...................2 ...................2 ...................2 ...................2 ...................2 ...................2 ...................03. 1994................................................ .........XXX...... ...................2 ...................2 ...................2 ...................2 ...................2 ...................2 ...................2 ...................2 ...................2 ...................04. 1995................................................ .........XXX...... .........XXX...... ...................3 ...................4 ...................4 ...................4 ...................4 ...................4 ...................4 ...................4 ...................05. 1996................................................ .........XXX...... .........XXX...... .........XXX...... ...................2 ...................2 ...................2 ...................2 ...................2 ...................2 ...................2 ...................06. 1997................................................ .........XXX...... .........XXX...... .........XXX...... .........XXX...... ...................5 ...................5 ...................5 ...................5 ...................5 ...................5 ...................07. 1998................................................ .........XXX...... .........XXX...... .........XXX...... .........XXX...... .........XXX...... ...................7 ...................7 ...................9 ...................9 .................10 ...................08. 1999................................................ .........XXX...... .........XXX...... .........XXX...... .........XXX...... .........XXX...... .........XXX...... ...................6 ...................8 ...................8 ...................8 ...................09. 2000................................................ .........XXX...... .........XXX...... .........XXX...... .........XXX...... .........XXX...... .........XXX...... .........XXX...... ...................1 ...................1 ...................2 ...................010. 2001................................................ .........XXX...... .........XXX...... .........XXX...... .........XXX...... .........XXX...... .........XXX...... .........XXX...... .........XXX...... ...................7 ...................7 ...................011. 2002................................................ .........XXX...... .........XXX...... .........XXX...... .........XXX...... .........XXX...... .........XXX...... .........XXX...... .........XXX...... .........XXX...... ...................5 ...................512. Total................................................. .........XXX...... .........XXX...... .........XXX...... .........XXX...... .........XXX...... .........XXX...... .........XXX...... .........XXX...... .........XXX...... .........XXX...... ...................513. Earned Premiums (Sch. P-Pt 1)...... ...................2 ...................2 ...................3 ...................3 ...................5 ...................8 ...................6 ...................5 ...................7 ...................5 ...........XXX....

Annual Statement for the year 2002 of the TWIN CITY FIRE INSURANCE COMPANY
103
SCHEDULE P - PART 7A - PRIMARY LOSS SENSITIVE CONTRACTS($000 Omitted)
SECTION 11 2 3 4 5 6
Net Lossesand Net
Expenses Loss Premiums LossTotal Net Unpaid on Sensitive Written on Sensitive
Losses and Loss as Total Net Loss asExpenses Sensitive Percentage Premiums Sensitive Percentage
Schedule P - Part 1 Unpaid Contracts of Total Written Contracts of Total1. Homeowners/farmowners...................................................... ...................2,956 ..........................0 .......................0.0 ...................9,667 ..........................0 .......................0.02. Private passenger auto liability/medical.................................. ..................18,297 ..........................0 .......................0.0 ..................18,646 ..........................0 .......................0.03. Commercial auto/truck liability/medical.................................. ...................7,794 ........................57 .......................0.7 ...................7,692 ........................93 .......................1.24. Workers' compensation......................................................... ..................54,125 ...................5,299 .......................9.8 ..................21,254 ......................876 .......................4.15. Commercial multiple peril...................................................... ..................18,716 ..........................4 .......................0.0 ..................22,391 ..........................7 .......................0.06. Medical malpractice - occurrence........................................... ........................78 ..........................0 .......................0.0 ..........................0 ..........................0 .......................0.07. Medical malpractice - claims-made........................................ ......................317 ..........................0 .......................0.0 ..........................0 ..........................0 .......................0.08. Special liability...................................................................... ......................642 ..........................0 .......................0.0 ...................1,476 ..........................0 .......................0.09. Other liability - occurrence..................................................... ..................22,017 ......................101 .......................0.5 ...................4,717 ........................35 .......................0.7
10. Other liability - claims-made................................................... ...................3,718 ..........................0 .......................0.0 ...................3,414 ..........................0 .......................0.011. Special property.................................................................... ...................3,758 .........................(0) ......................(0.0) ..................10,341 ..........................0 .......................0.012. Auto physical damage........................................................... ...................1,375 ..........................1 .......................0.1 ..................14,186 ..........................1 .......................0.013. Fidelity/surety........................................................................ ...................1,435 ..........................0 .......................0.0 ...................2,320 ..........................0 .......................0.014. Other.................................................................................... ........................14 ..........................0 .......................0.0 ..........................0 ..........................0 .......................0.015. International.......................................................................... ......................951 ..........................0 .......................0.0 ......................599 ..........................0 .......................0.016. Reinsurance - nonproportional assumed property................... ............XXX.......... ............XXX.......... ............XXX.......... ............XXX.......... ............XXX.......... ............XXX..........17. Reinsurance - nonproportional assumed liability..................... ............XXX.......... ............XXX.......... ............XXX.......... ............XXX.......... ............XXX.......... ............XXX..........18. Reinsurance - nonproportional assumed financial lines........... ............XXX.......... ............XXX.......... ............XXX.......... ............XXX.......... ............XXX.......... ............XXX..........19. Products liability - occurrence................................................ ...................2,954 ........................68 .......................2.3 ......................697 ..........................0 .......................0.020. Products liability - claims-made.............................................. ......................134 ........................44 .....................32.8 ........................29 ..........................1 .......................1.821. Financial guaranty/mortgage guaranty................................... ..........................0 ..........................0 .......................0.0 ..........................0 ..........................0 .......................0.022. Totals................................................................................... ................139,279 ...................5,572 .......................4.0 ................117,429 ...................1,012 .......................0.9
SECTION 2Incurred Losses and Defense and Cost Containment Expenses Reported at Year End ($000 omitted)
Years in Which 1 2 3 4 5 6 7 8 9 10Policies Were
Issued 1993 1994 1995 1996 1997 1998 1999 2000 2001 20021. Prior............. ............14,053 ............14,497 ............14,912 ............13,898 ............13,280 ............12,896 ............12,860 ............12,542 ............12,239 ............11,9112. 1993........... ..............1,995 ..............3,451 ..............3,490 ..............3,236 ..............3,352 ..............3,254 ..............3,177 ..............2,992 ..............2,969 ..............2,9263. 1994........... ........XXX......... ..............1,475 ..............2,917 ..............2,923 ..............2,833 ..............2,674 ..............2,555 ..............2,383 ..............2,229 ..............2,2334. 1995........... ........XXX......... ........XXX......... ..............1,214 ..............2,165 ..............2,214 ..............1,751 ..............1,584 ..............1,492 ..............1,433 ..............1,4265. 1996........... ........XXX......... ........XXX......... ........XXX......... ..............1,107 ..............1,796 ..............1,676 ..............1,460 ..............1,281 ..............1,212 ..............1,2356. 1997........... ........XXX......... ........XXX......... ........XXX......... ........XXX......... .................664 ..............1,246 ..............1,218 .................985 .................884 .................8597. 1998........... ........XXX......... ........XXX......... ........XXX......... ........XXX......... ........XXX......... .................677 .................920 .................542 .................489 .................5118. 1999........... ........XXX......... ........XXX......... ........XXX......... ........XXX......... ........XXX......... ........XXX......... .................312 .................482 .................460 .................4549. 2000........... ........XXX......... ........XXX......... ........XXX......... ........XXX......... ........XXX......... ........XXX......... ........XXX......... .................260 .................561 .................558
10. 2001........... ........XXX......... ........XXX......... ........XXX......... ........XXX......... ........XXX......... ........XXX......... ........XXX......... ........XXX......... .................300 .................46111. 2002........... ........XXX......... ........XXX......... ........XXX......... ........XXX......... ........XXX......... ........XXX......... ........XXX......... ........XXX......... ........XXX......... .................202
SECTION 3Bulk and Incurred But Not Reported Reserves for Losses and Defense and Cost Containment Expenses at Year End ($000 omitted)
Years in Which 1 2 3 4 5 6 7 8 9 10Policies Were
Issued 1993 1994 1995 1996 1997 1998 1999 2000 2001 20021. Prior............. ..............6,165 ..............5,770 ..............5,168 ..............4,370 ..............3,303 ..............2,486 ..............2,276 ..............1,821 ..............1,383 ..............1,2402. 1993........... .................883 .................952 .................641 .................468 .................511 .................378 .................297 .................228 .................140 ...................823. 1994........... ........XXX......... .................649 .................858 .................792 .................611 .................435 .................318 .................254 .................160 ...................854. 1995........... ........XXX......... ........XXX......... .................533 .................903 .................790 .................342 .................202 .................156 ...................95 ...................535. 1996........... ........XXX......... ........XXX......... ........XXX......... .................516 .................629 .................473 .................278 .................215 .................115 ...................696. 1997........... ........XXX......... ........XXX......... ........XXX......... ........XXX......... .................234 .................377 .................335 .................210 .................107 ...................617. 1998........... ........XXX......... ........XXX......... ........XXX......... ........XXX......... ........XXX......... .................399 .................394 .................187 ...................82 ...................538. 1999........... ........XXX......... ........XXX......... ........XXX......... ........XXX......... ........XXX......... ........XXX......... .................133 .................192 ...................88 ...................339. 2000........... ........XXX......... ........XXX......... ........XXX......... ........XXX......... ........XXX......... ........XXX......... ........XXX......... .................101 .................130 ...................54
10. 2001........... ........XXX......... ........XXX......... ........XXX......... ........XXX......... ........XXX......... ........XXX......... ........XXX......... ........XXX......... ...................80 ...................6711. 2002........... ........XXX......... ........XXX......... ........XXX......... ........XXX......... ........XXX......... ........XXX......... ........XXX......... ........XXX......... ........XXX......... ...................36

Annual Statement for the year 2002 of the TWIN CITY FIRE INSURANCE COMPANY
104
SCHEDULE P - PART 7A - PRIMARY LOSS SENSITIVE CONTRACTS (continued)SECTION 4
Net Earned Premiums Reported at Year End ($000 omitted)Years in Which 1 2 3 4 5 6 7 8 9 10Policies Were
Issued 1993 1994 1995 1996 1997 1998 1999 2000 2001 20021. Prior............. ............17,603 ............17,762 ............17,542 ............17,462 ............17,291 ............17,431 ............17,359 ............17,565 ............17,478 ............17,5542. 1993........... ..............2,662 ..............5,227 ..............5,293 ..............5,321 ..............5,352 ..............5,301 ..............5,284 ..............5,669 ..............5,659 ..............5,6653. 1994........... ........XXX......... ..............2,242 ..............4,379 ..............4,311 ..............4,470 ..............4,429 ..............4,454 ..............4,511 ..............4,533 ..............4,5324. 1995........... ........XXX......... ........XXX......... ..............1,789 ..............3,336 ..............3,338 ..............3,105 ..............3,105 ..............3,430 ..............3,391 ..............3,3845. 1996........... ........XXX......... ........XXX......... ........XXX......... ..............1,620 ..............2,761 ..............3,053 ..............3,011 ..............2,994 ..............2,957 ..............2,8796. 1997........... ........XXX......... ........XXX......... ........XXX......... ........XXX......... .................711 ..............1,876 ..............1,866 ..............2,012 ..............1,962 ..............1,8647. 1998........... ........XXX......... ........XXX......... ........XXX......... ........XXX......... ........XXX......... .................878 ..............1,690 ..............1,553 ..............1,559 ..............1,5648. 1999........... ........XXX......... ........XXX......... ........XXX......... ........XXX......... ........XXX......... ........XXX......... .................690 .................525 .................503 .................5539. 2000........... ........XXX......... ........XXX......... ........XXX......... ........XXX......... ........XXX......... ........XXX......... ........XXX......... .................212 .................584 .................655
10. 2001........... ........XXX......... ........XXX......... ........XXX......... ........XXX......... ........XXX......... ........XXX......... ........XXX......... ........XXX......... .................347 .................68911. 2002........... ........XXX......... ........XXX......... ........XXX......... ........XXX......... ........XXX......... ........XXX......... ........XXX......... ........XXX......... ........XXX......... .................697
SECTION 5Net Reserve for Premium Adjustments and Accrued Retrospective Premiums at Year End ($000 omitted)
Years in Which 1 2 3 4 5 6 7 8 9 10Policies Were
Issued 1993 1994 1995 1996 1997 1998 1999 2000 2001 20021. Prior............. ..............4,150 ..............3,592 ..............2,730 ..............2,148 ..............1,771 ..............1,777 ..............1,392 ..............1,285 ..............1,052 ..............1,0412. 1993........... ................(354) ..................(67) .................477 .................150 ...................24 ..................(59) ................(120) .................218 .................210 .................2033. 1994........... ........XXX......... ................(179) .................211 .................413 .................379 .................251 .................240 .................270 .................255 .................2274. 1995........... ........XXX......... ........XXX......... .....................2 .................401 .................608 .................181 ...................90 .................383 .................323 .................2855. 1996........... ........XXX......... ........XXX......... ........XXX......... .................228 .................388 .................772 .................645 .................585 .................510 .................4286. 1997........... ........XXX......... ........XXX......... ........XXX......... ........XXX......... .....................5 .................410 .................494 .................570 .................480 .................3627. 1998........... ........XXX......... ........XXX......... ........XXX......... ........XXX......... ........XXX......... ..................(25) .................300 .................160 .................109 ...................708. 1999........... ........XXX......... ........XXX......... ........XXX......... ........XXX......... ........XXX......... ........XXX......... .................240 ................(268) ................(306) ................(328)9. 2000........... ........XXX......... ........XXX......... ........XXX......... ........XXX......... ........XXX......... ........XXX......... ........XXX......... ...................16 ...................23 ...................94
10. 2001........... ........XXX......... ........XXX......... ........XXX......... ........XXX......... ........XXX......... ........XXX......... ........XXX......... ........XXX......... ...................24 .................16511. 2002........... ........XXX......... ........XXX......... ........XXX......... ........XXX......... ........XXX......... ........XXX......... ........XXX......... ........XXX......... ........XXX......... .................197

Annual Statement for the year 2002 of the TWIN CITY FIRE INSURANCE COMPANY
105, 106
Sch. P-Pt. 7B-Sn. 1NONE
Sch. P-Pt. 7B-Sn. 2NONE
Sch. P-Pt. 7B-Sn. 3NONE
Sch. P-Pt. 7B-Sn. 4NONE
Sch. P-Pt. 7B-Sn. 5NONE
Sch. P-Pt. 7B-Sn. 6NONE
Sch. P-Pt. 7B-Sn. 7NONE

Annual Statement for the year 2002 of the TWIN CITY FIRE INSURANCE COMPANY
107
SCHEDULE P INTERROGATORIES1. What is the extended loss and expense reserve - direct and assumed - for the following classes? An example of an extended loss and expense reserve is the actuarial
reserve for the free-tail coverage arising upon death, disability or retirement in most medical malpractice policies. Such a liability is to be reported here even if it was not reported elsewhere in Schedule P, but otherwise reported as a liability item on Page 3. Show the full reserve amount, not just the change during the current year.
Years in Which Premiums 1 2 3Were Earned and Losses Medical Other Products
Were Incurred Malpractice Liability Liability1.01 Prior.................... ..................................1 ..................................0 ..................................01.02 1993.................... ..................................0 ..................................0 ..................................01.03 1994.................... ..................................0 ..................................0 ..................................01.04 1995.................... ..................................0 ..................................0 ..................................01.05 1996.................... ..................................0 ..................................0 ..................................01.06 1997.................... ..................................0 ..................................0 ..................................01.07 1998.................... ..................................1 ..................................2 ..................................01.08 1999.................... ..................................0 ..................................4 ..................................01.09 2000.................... ..................................0 ..................................8 ..................................01.10 2001.................... ..................................0 ..................................5 ..................................01.11 2002.................... ..................................0 ..................................2 ..................................01.12 Totals.................. ..................................2 ................................21 ..................................0
2. The definition of allocated loss adjustment expenses (ALAE) and, therefore, unallocated loss adjustment expenses (ULAE) was changed effective January 1, 1998. This change in definition applies to both paid and unpaid expenses. Are these expenses (now reported as "Defense and Cost Containment" and "Adjusting and Other")
reported in compliance with these definitions in this statement? Yes [ X ] No [ ]
3. The Adjusting and Other expense payments and reserves should be allocated to the years in which the losses were incurred based on the number of claims reported, closed and outstanding in those years. When allocating Adjusting and Other expense between companies in a group or a pool, the Adjusting and Other expense should be allocated in the same percentage used for the loss amounts and the claim counts. For reinsurers, Adjusting and Other expense assumed should be reported according to the reinsurance contract. For Adjusting and Other expense incurred by reinsurers, or in those situations where suitable claim count information is not
available, Adjusting and Other expense should be allocated by a reasonable method determined by the company and described in Interrogatory 7, below. Are they so reported in this statement? Yes [ X ] No [ ]
4. Do any lines in Schedule P include reserves which are reported gross of any discount to present value of future payments, but are reported net of such discounts on Page 10? Yes [ ] No [ X ]
If Yes, proper reporting must be made in the Notes to Financial Statements, as specified in the Instructions. Also, the discounts must be reported in Schedule P - Part 1, Columns 32 and 33.
Schedule P must be completed gross of non-tabular discounting. Work papers relating to discount calculations must be available for examination upon request.
Discounting is allowed only if expressly permitted by the state insurance department to which this Annual Statement is being filed.
5. What were the net premiums in force at the end of the year for: (in thousands of dollars) 5.1 Fidelity ..............................849 5.2 Surety ...........................1,698
6. Claim count information is reported (check one). 6.1 per claim .................X.................. If not the same in all years, explain in Interrogatory 7. 6.2 per claimant .....................................
7.1 The information provided in Schedule P will be used by many persons to estimate the adequacy of the current loss and expense reserves, among other things. Are there any especially significant events, coverage, retention or accounting changes which have occurred which must be considered when making such analyses? Yes [ X ] No [ ]
7.2 An extended statement may be attached. 1) For World Trade Center exposure, please see the Notes to the Financial Statements - Note 20(I)2) Please see the Notes to the Financial Statements - Note 29 for information regarding a transaction that occurred during 2002.3) Adjusting and Other Payments and Reserves have been distributed to Accident Year based on actual and projected claims opened, handled and closed. Distribution is done byinternal management lines. Estimates of per claim costs to open and handle are used as part of the distribution.

Annual Statement for the year 2002 of the TWIN CITY FIRE INSURANCE COMPANY
108
SCHEDULE T - EXHIBIT OF PREMIUMS WRITTENAllocated by States and Territories
1 Gross Premiums, Including Policy and 4 5 6 7 8 9Membership Fees, Less Return Premiums Dividends Paid Finance and Direct Premiums
and Premiums on Policies Not Taken or Credited Direct Losses Service Written forIs Insurer 2 3 to Policyholders Paid Charges Federal Pur-Licensed? Direct Premiums Direct Premiums on Direct (Deducting Direct Losses Direct Losses not Included chasing Groups
States, Etc. (Yes or No) Written Earned Business Salvage) Incurred Unpaid in Premiums (Incl. in Col. 2)1. Alabama............................AL ......YES...... ............17,599,486 ............16,061,562 .........148,752 ......4,885,094 ......7,517,700 ....16,797,311 .........134,727 .................2,9422. Alaska...............................AK ......YES...... ................475,058 ................305,893 .............9,337 ...........70,881 .........109,580 ......1,213,842 .............6,983 .................2,6703. Arizona..............................AZ ......YES...... ............17,145,564 ............16,285,033 .........633,239 ......8,172,332 ......8,526,110 ....17,790,371 .........173,559 .............419,3964. Arkansas...........................AR ......YES...... ..............6,778,900 ..............5,816,668 ...........30,787 ......2,369,813 ......1,976,861 ......5,440,939 ...........42,060 .................3,7715. California...........................CA ......YES...... ..........140,705,942 ..........126,859,389 .........667,051 ....37,548,718 ....84,945,322 ..163,471,802 .........382,098 ..........3,309,8956. Colorado...........................CO ......YES...... ............27,428,069 ............25,193,938 .........119,855 ......8,431,725 ......2,712,006 ....22,347,824 ...........99,859 ...............20,8787. Connecticut.......................CT ......YES...... ............85,363,232 ............81,753,042 .........162,173 ....33,378,973 ....39,501,962 ....95,627,323 .........888,929 .............605,4448. Delaware...........................DE ......YES...... ..............7,452,897 ..............6,819,977 ..........(16,968) ......3,906,433 ......4,255,654 ....11,683,167 ...........11,973 .................2,7659. District of Columbia...........DC ......YES...... ............19,752,978 ............18,256,227 .........268,004 ......4,890,394 ....17,548,365 ....28,848,921 ...........84,106 .................1,041
10. Florida................................FL ......YES...... ..........124,923,088 ..........121,671,319 ......2,529,336 ....58,672,470 ....64,471,920 ..142,558,165 .........550,438 ..........1,763,05911. Georgia.............................GA ......YES...... ............28,239,775 ............25,628,231 ...........71,329 ....15,244,135 ......3,731,453 ....29,648,628 .........190,966 ...............19,90512. Hawaii................................HI ......YES...... ................109,889 ..................97,467 ............(4,754) ...........73,864 ...........85,768 .........565,105 ....................9 .............169,51113. Idaho..................................ID ......YES...... ..............3,611,162 ..............2,908,083 ...........20,975 .........615,675 .........926,660 ......1,659,908 ...........27,486 .................2,48514. Illinois..................................IL ......YES...... ............63,511,250 ............54,463,691 .........320,601 ....16,916,446 ....23,878,851 ....72,176,107 .........116,903 .............118,72615. Indiana...............................IN ......YES...... ............19,983,104 ............17,348,974 ...........95,867 ....10,210,078 .........956,749 ....27,693,512 .........121,797 ...............12,23316. Iowa...................................IA ......YES...... ............11,727,100 ............11,074,840 ...........24,861 ......4,948,872 ......5,601,310 ....11,663,590 ...........32,053 ...............12,55417. Kansas..............................KS ......YES...... ............11,809,664 ............10,469,893 .........233,155 ......6,703,613 ......7,761,672 ....14,966,444 ...........50,499 .................7,02418. Kentucky...........................KY ......YES...... ..............6,016,301 ..............5,356,907 ..........(20,485) ......3,800,008 ........(534,852) ....20,033,558 ...........23,859 ...............11,30419. Louisiana...........................LA ......YES...... ..............8,678,088 ..............7,893,632 ............(5,221) ....14,524,249 ....13,839,509 ....14,315,443 ...........31,947 .............397,81420. Maine................................ME ......YES...... ..............2,676,735 ..............2,349,038 ...........20,203 ......1,939,290 ......2,723,163 ......2,322,753 ...........10,449 .................4,63721. Maryland...........................MD ......YES...... ............51,110,031 ............46,682,591 ...........98,986 ....15,041,650 ....14,763,473 ....51,234,515 .........142,014 ...............18,98722. Massachusetts..................MA ......YES...... ............40,365,697 ............34,366,466 ..........(67,600) ....15,144,003 ....18,104,242 ....43,977,579 .........179,676 ...............25,66223. Michigan............................MI ......YES...... ............27,250,357 ............25,032,694 ...........94,312 ......7,727,970 ......9,891,294 ....45,619,378 ...........83,837 ...............23,20024. Minnesota.........................MN ......YES...... ............17,755,635 ............16,621,150 .........253,768 ....12,222,378 ....13,291,111 ....23,495,662 .........114,461 ...............29,51725. Mississippi........................MS ......YES...... ..............3,882,307 ..............3,602,773 ...........40,898 ......3,099,265 .........266,724 ......6,881,087 ...........12,637 .................2,32326. Missouri............................MO ......YES...... ............15,058,622 ............13,493,338 .........278,078 ......7,674,916 ......6,380,927 ....22,455,916 .................(12) ...............26,13427. Montana............................MT ......YES...... ..............2,175,381 ..............2,045,110 ...........37,847 ......2,430,600 ......2,110,460 ......3,220,383 .............5,097 .................1,18228. Nebraska...........................NE ......YES...... ............10,458,722 ............10,071,416 .........125,638 ......5,490,594 ......5,442,396 ....11,647,337 ...........32,809 .................4,25329. Nevada.............................NV ......YES...... ............10,728,381 ..............9,787,480 ...........65,499 ......2,287,023 ......1,118,961 ......5,578,532 ...........55,771 ...............16,07230. New Hampshire.................NH ......YES...... ............11,077,611 ............10,837,592 ...........20,836 ......2,647,220 ......5,605,392 ......9,556,494 ...........28,573 .............227,04531. New Jersey........................NJ ......YES...... ............61,578,414 ............55,057,705 .........407,961 ....41,490,313 ....48,710,091 ....57,921,597 .........359,826 ...............83,35732. New Mexico......................NM ......YES...... ..............9,044,653 ..............8,790,251 ...........50,987 ......3,064,701 ......2,476,709 ......5,539,758 ...........87,399 .................6,66533. New York..........................NY ......YES...... ..........196,695,729 ..........183,294,504 .........533,784 ....81,702,912 ....86,389,863 ..285,622,051 .........916,454 ..........2,358,25234. North Carolina...................NC ......YES...... ............36,350,071 ............31,815,064 .........265,225 ....12,562,185 ....16,352,110 ....34,586,994 .........137,979 ...............14,68335. North Dakota.....................ND ......YES...... ................279,741 ................281,125 .............2,714 .........195,621 ..........(53,686) .........350,202 .............1,059 .................1,33636. Ohio..................................OH ......YES...... ............17,308,593 ............57,716,917 .........176,005 ....14,165,140 ....31,897,457 ....41,886,038 ...........11,838 ...............39,62737. Oklahoma..........................OK ......YES...... ............13,427,404 ............11,132,725 ...........67,193 ......4,174,286 .........246,558 ....15,211,805 ...........34,577 .................4,41738. Oregon..............................OR ......YES...... ............17,427,658 ............13,484,240 ..........(55,395) ......3,214,483 ......4,310,704 ......8,451,763 .........125,657 ...............33,70939. Pennsylvania.....................PA ......YES...... ............70,555,550 ............61,832,826 ........(479,593) ....29,412,319 ....49,677,235 ..103,072,710 .........406,395 .............177,46440. Rhode Island......................RI ......YES...... ..............6,178,905 ..............6,009,105 ...........40,080 ......6,630,781 ......8,035,256 ....18,080,119 ...........27,981 .................2,35341. South Carolina...................SC ......YES...... ............21,446,148 ............19,626,826 ..........(94,745) ......6,682,664 ......9,629,983 ....22,307,536 .........105,297 .................6,03542. South Dakota....................SD ......YES...... ..............2,644,865 ..............2,353,229 .............4,465 .........903,598 ......1,191,019 ......3,535,582 ...........18,420 .................2,11443. Tennessee........................TN ......YES...... ............19,581,403 ............18,093,195 .........159,666 ......6,757,896 ....13,756,153 ....34,742,984 ...........53,541 .................9,71444. Texas................................TX ......YES...... ............97,646,727 ............93,981,017 ...........33,787 ....38,092,171 ....28,535,184 ..184,699,290 .........432,991 .............467,74445. Utah..................................UT ......YES...... ..............6,771,797 ..............6,547,685 .............2,813 ......4,819,199 ......6,874,640 ......7,335,326 ...........22,677 .................2,51846. Vermont.............................VT ......YES...... ..............2,571,720 ..............2,108,240 ...........10,197 .........595,692 .........896,109 ......2,800,190 ...........15,762 ...............35,75447. Virginia..............................VA ......YES...... ............46,121,841 ............44,638,036 .........195,142 ....15,791,502 ....21,332,816 ....60,413,303 .........280,764 ...............21,31248. Washington......................WA ......YES...... ..............8,834,618 ..............8,631,930 .............4,625 ......3,988,202 ........(125,525) ....10,812,901 ...........20,102 ...............20,05249. West Virginia....................WV ......YES...... ................930,817 ................929,026 ..........(50,659) ......1,257,979 .....(1,727,124) ......2,184,808 ................590 .................7,90350. Wisconsin..........................WI ......YES...... ............13,677,780 ............12,562,499 .........407,339 ......6,594,317 ....10,711,832 ....24,816,029 ...........13,856 ...............31,86051. Wyoming..........................WY ......YES...... ................270,527 ................157,572 ........(513,702) ......1,938,914 .....(1,004,982) ......2,460,476 .............4,101 ....................20552. American Samoa...............AS ......NO........ ...........................0 ...........................0 ....................0 ...................0 ...................0 ...................0 ....................0 .......................053. Guam................................GU ......NO........ ...........................0 ...........................0 ....................0 ...................0 ...................0 ...................0 ....................0 .......................054. Puerto Rico.......................PR ......NO........ ...........................0 ...........................0 ....................0 ...................0 ...................0 ...................0 ....................0 .......................055. US Virgin Islands................VI ......NO........ ...........................0 ...........................0 ....................0 ...................0 ...................0 ...................0 ....................0 .......................056. Canada.............................CN ......NO........ ..................40,875 ..................40,875 ....................0 .............2,122 .............3,348 ................(31) ....................0 .......................057. Aggregate Other Alien........OT ......XXX...... ....................432,848 ....................498,308 ..............45,101 ...............1,040 ............(20,674) ...........136,761 ...................218 ...........................058. Totals..................................... (a)..........51 ..........1,443,669,710 ..........1,368,737,314 .........7,469,349 ....595,106,719 ....705,605,819 .1,851,459,788 .........6,713,047 ...........10,589,503
DETAILS OF WRITE-INS5701. Other Alien Grand Total.......... ......XXX...... ................432,848 ................498,308 ...........45,101 .............1,040 ..........(20,674) .........136,761 ................218 .......................05702. .............................................. ......XXX...... ...........................0 ...........................0 ....................0 ...................0 ...................0 ...................0 ....................0 .......................05703. .............................................. ......XXX...... ...........................0 ...........................0 ....................0 ...................0 ...................0 ...................0 ....................0 .......................05798. Summary of remaining write-
ins for Line 57 from overflowpage ......XXX...... ...............................0 ...............................0 .......................0 ......................0 ......................0 ......................0 .......................0 ...........................0
5799. Totals (Lines 5701 thru 5703 +Line 5798) (Line 57 above) ......XXX...... ....................432,848 ....................498,308 ..............45,101 ...............1,040 ............(20,674) ...........136,761 ...................218 ...........................0 Explanation of Basis of Allocation of Premiums by States, etc. LOCATION OF PROPERTY INSURED FOR ALL LINES OF BUSINESS - EXCEPTIONS: OCEAN MARINE - (other than port risk, builder's risk and syndicate business) - location where insurance was negotiated INLAND MARINE - (except location risks) - location of insured's premises or location where insurance was negotiated ACCIDENT AND HEALTH - location of insured; AUTOMOBILE - location of principal garage AIRCRAFT - location of home airport; FIDELITY - location of employer of insured SURETY - location of principal, obligee, court work contractors, lease, warehouse or employee
(a) Insert the number of yes responses except for Canada and Other Alien.

Annual Statement for the year 2002 of the TWIN CITY FIRE INSURANCE COMPANY
109
NORTH AMERICAN PROPERTY/CASUALTY OPERATIONS LIFE OPERATIONS INTERNATIONAL OPERATIONS
*Hartford Fire Insurance Company 06-0383750/NAIC #19682/CT Hartford Holdings, Inc. 22-3866674/DE *Hartford Fire Insurance Company 06-0383750 /NAIC #19682/CT (100% of common stock owned by The Hartford Financial Services Group, Inc. 13-3317783/DE) (100% of common stock owned by The Hartford Financial Services Group, Inc. 13-3317783/DE) (100% of common stock owned by The Hartford Financial Services Group, Inc. 13-3317783/DE) *Hartford Casualty Insurance Company 06-0294398/NAIC #29424/IN Hartford Life, Inc. 06-1470915/DE *Heritage Reinsurance Company, Ltd. (99.4% owned) 98-0188675 (Bermuda) *Hartford Life and Accident Insurance Company 06-0838648/NAIC #70815/CT *Excess Insurance Company, Limited (United Kingdom) Omni Insurance Group, Inc. 58-1680624/GA *Hartford Life Insurance Company, KK (Japan) *Omni Insurance Company 58-1408232/NAIC #39098/IL *Hart Life Insurance Company 22-1771521/NAIC #60348/CT The Hartford International Financial Services Group, Inc. 06-1132748/DE *Omni Indemnity Company 58-1189287/NAIC #34940/IL *American Maturity Life Insurance Company 06-1422508 /NAIC #81213/CT Omni General Agency, Inc. 74-2734608/TX Hartford Financial Services Life Insurance Company 06-1134817/CT *Hartford Life Insurance Company 06-0974148/NAIC #88072/CT *Hartford Underwriters Insurance Company 06-1222527 /NAIC #30104/CT *Hartford International Life Reassurance Corporation 06-1207332/NAIC #93505/CT Hartford Risk Management, Inc. (90% owned) 13-2765326/DE *Servus Life Insurance Company 13-6150240/NAIC #80586/CT *Hartford Life and Annuity Insurance Company 39-1052598/NAIC #71153/CT *Twin City Fire Insurance Company 06-0732738/NAIC #29459/IN *Hartford Life, Ltd. AA-3190021 (Bermuda) OTHER OPERATIONS OWNED BY THE HARTFORD FINANCIAL SERVICES GROUP, INC. Hopmeadow Holdings S.A. (.1% owned) (Argentina) Hartford Holdings, Inc. 22-3866674/DE *Hartford Insurance Company of Illinois 06-1010609/NAIC #38288/IL *Nutmeg Life Insurance Company / 06-1566092/NAIC #63444/IA The Hartford Investment Management Company 06-1472135/DE Hartford Investment Services, Inc. 06-0883503/CT *Hartford Lloyd’s Insurance Company 06-1007031/NAIC #38253/TX International Corporate Marketing Group, Inc. 22-3198854/CT The Evergreen Group, Inc. 13-3216939/NY Heritage Holdings, Inc. 06-1442285/CT Four Thirty Seven Land Company 13-2852356/DE (37.5% owned) Hartford Administrative Services Company 41-0679409/MN *First State Insurance Company 04-2198460 /NAIC #21822/CT Woodbury Financial Services, Inc. 41-0944586/MN *New England Insurance Company 04-2177185 /NAIC #21830/CT *Hartford Accident and Indemnity Company 06-0383030/NAIC #22357/CT *New England Reinsurance Corporation 06-1053492 /NAIC #41629/CT *Pacific Insurance Company, Limited 06-1401918/NAIC #10046/CT Planco, Inc. 23-2079123/PA *Heritage Reinsurance Company, Ltd. (.6% owned) 98-0188675 (Bermuda) Four Thirty Seven Land Company 13-2852356/DE (62.5% owned) Planco Financial Services, Inc. 23-2132791/PA Hartford Financial Services LLC 52-2137766/DE *New Ocean Insurance Co., Ltd. 98-0188674 (Bermuda) Specialty Risk Services, Inc. 06-1317292/DE HL Investment Advisors, LLC 06-1534085/CT Trumbull Finance, LLC 06-1521832/CT Hartford Investment Financial Services, LLC 06-1629808 HARCO Property Services, Inc. 06-1107677/CT Hartford Investments Canada Corp. 98-0219177 Hartford-Comprehensive Employee Benefit Service Company 06-1120503/CT HRA, Inc. 06-1185090/CT Hartford Equity Sales Company, Inc. 06-0896599/CT HRA Brokerage Services, Inc. 06-1126749/CT Hartford Securities Distribution Company 06-1408044/CT The Hartford Fidelity & Bonding Company 06-1493421/CT Hartford Life International Ltd. 06-1293360/CT Access Coverage Corp., Inc. 56-2160819/NC *Nutmeg Insurance Company 06-1032405/NAIC #39608/CT Hopmeadow Holdings S.A. (99.9% owned) (Argentina) (100% of common stock owned by The Hartford Holdings, Inc. 22-3866674/DE *Hartford Seguros De Retiro S.A., (Argentina) Hartford Management, Ltd. (Bermuda) *ICATU Hartford Seguros S.A., (47.5% owned) (Brazil) *Hartford Insurance Ltd. (Bermuda) *ICATU Hartford Administracao de Beneficios LTDA, (Brazil) *ICATU Hartford Fundo de Pensao, (Brazil HartRe Group, LLC 06-1032405/CT *ICATU Hartford Capitalizacao S.A. (Brazil) *Sentinel Insurance Company, Ltd. 06-1552103/NAIC #11000/CT *Brazilcap Capitalizacao S.A. (16.67% owned) (Brazil) *Fencourt Reinsurance Company, Ltd. 06-1323788 (Bermuda) *Fedcap Capitalizacao S.A. (24.5% owned) (Brazil) Trumbull Associates, LLC 06-1521834/CT Trumbull Recovery Services, Inc. 59-3021034/FL PPL Holdings, LLC 27-0008094/DE *Hartford Insurance Company of the Midwest 06-1008026/NAIC #37478/IN (100% of common stock owned by The Hartford Financial Services Group, Inc. 13-3317783/DE) *Hartford Insurance Company of the Southeast 06-1013048/NAIC #38261/FL (100% of common stock owned by The Hartford Financial Services Group, Inc. 13-3317783/DE) *Trumbull Insurance Company 06-1184984/NAIC #27120/CT (100% of common stock owned by The Hartford Financial Services Group, Inc. 13-3317783/DE) Hartford Technology Services Company, LLC 06-1552692/DE Horizon Management Group, LLC 06-1526449/DE *Property and Casualty Insurance Company of Hartford 06-1276326/NAIC #34690/IN (100% of common stock owned by The Hartford Financial Services Group, Inc. 13-3317783/DE) *denotes an insurance company
SCHEDULE Y – INFORMATION CONCERNING ACTIVITIES OF INSURER MEMBERS OF A HOLDING COMPANY GROUPPART 1 – ORGANIZATIONAL CHART

Annual Statement for the year 2002 of the TWIN CITY FIRE INSURANCE COMPANY
110
SCHEDULE Y (Continued) PART 2 - SUMMARY OF INSURER'S TRANSACTIONS WITH ANY AFFILIATES
1 2 3 4 5 6 7 8 9 10 11 12 13Income/
(Disbursements) Any Other ReinsurancePurchases, Sales Incurred in Material Activity Recoverable/or Exchanges of Connection with Management Income/ Not in the (Payable) on
Loans, Securities, Guarantees or Agreements (Disbursements) Ordinary Losses and/orNAIC Federal Names of Insurers Real Estate, Undertakings and Incurred under Course of the Reserve Credit
Company ID and Parent, Subsidiaries Shareholder Capital Mortgage Loans or for the Benefit Service Reinsurance Insurer's Taken/Code Number or Affiliates Dividends Contributions Other Investments of any Affiliate(s) Contracts Agreements * Business Totals (Liability)
Affiliated Transactions00000................. 13-3317783............. The Hartford Financial Services Grp., Inc............................. ...............223,545,030 ..............(465,125,628) ................................0 ................................0 ..............(180,971,512) ............................0 ....... ..............................0 ..............(422,552,110) ................................039608................. 06-1032405............. Nutmeg Insurance Company............................................... ................................0 .................(5,000,000) ................................0 ................................0 .................27,862,932 ............................0 ...*.. ..............................0 .................22,862,932 .................94,145,00019682................. 06-0383750............. Hartford Fire Insurance Company........................................ ...............141,711,249 ...............(39,551,908) ................................0 ................................0 ...............155,148,593 ............................0 ...*.. ..............................0 ...............257,307,934 ...............984,650,49222357................. 06-0383030............. Hartford Accident & Indemnity Company.............................. ..................2,957,157 ...............226,973,701 ................................0 ................................0 .................67,845,440 ............................0 ...*.. ..............................0 ...............297,776,298 ...........(3,808,798,000)10046................. 06-1401918............. Pacific Insurance Company, Limited.................................... .................(7,000,000) ................................0 ................................0 ................................0 ..................4,983,480 ............................0 ...*.. ..............................0 .................(2,016,520) ...............(16,698,000)11000................. 06-1552103............. Sentinel Insurance Company, Ltd........................................ ................................0 ................................0 ................................0 ................................0 .....................985,566 ............................0 ...*.. ..............................0 .....................985,566 ...............(35,731,000)29424................. 06-0294398............. Hartford Casualty Insurance Company................................. ...............(20,500,000) .................38,187,683 ................................0 ................................0 .................16,391,376 ............................0 ...*.. ..............................0 .................34,079,059 ...............555,302,00030104................. 06-1222527............. Hartford Underwriters Insurance Company........................... ...............(20,000,000) .................27,772,860 ................................0 ................................0 .................12,172,858 ............................0 ...*.. ..............................0 .................19,945,718 ...............829,009,00034690................. 06-1276326............. Property & Casualty Ins. Co. of Hartford.............................. ................................0 ..................3,471,608 ................................0 ................................0 ..................1,317,883 ............................0 ...*.. ..............................0 ..................4,789,491 ...............148,953,00027120................. 06-1184984............. Trumbull Insurance Company.............................................. ................................0 ..................3,471,608 ................................0 ................................0 ..................1,265,865 ............................0 ...*.. ..............................0 ..................4,737,473 .................13,238,00038261................. 06-1013048............. Hartford Insurance Co. of the Southeast.............................. ................................0 ..................3,471,608 ................................0 ................................0 ..................1,440,881 ............................0 ...*.. ..............................0 ..................4,912,489 .................44,102,00037478................. 06-1008026............. Hartford Insurance Co. of the Midwest................................. .................(2,500,000) ..................3,471,608 ................................0 ................................0 ..................5,159,753 ............................0 ...*.. ..............................0 ..................6,131,361 ............1,177,754,00029459................. 06-0732738............. Twin City Fire Insurance Company...................................... .................(5,000,000) .................10,414,823 ................................0 ................................0 ..................6,030,524 ............................0 ...*.. ..............................0 .................11,445,347 ............1,475,255,00038288................. 06-1010609............. Hartford Insurance Company of Illinois................................. ................................0 .................70,126,472 ................................0 ................................0 .................17,618,206 ............................0 ...*.. ..............................0 .................87,744,678 ...........(1,302,990,000)38253................. 06-1007031............. Hartford Lloyd's Insurance Company................................... ................................0 ................................0 ................................0 ................................0 .....................981,066 ............................0 ...*.. ..............................0 .....................981,066 .................79,654,00000000................. 06-1470915............. Hartford Life, Inc................................................................. .................80,400,000 ..............(160,000,000) ................................0 ................................0 ..............(122,571,814) ............................0 ....... ..............................0 ..............(202,171,814) ................................070815................. 06-0838648............. Hartford Life & Accident Insurance Co................................. ...............(59,900,000) ...............(83,093,732) ................................0 ................................0 .................30,810,287 ............................0 ....... ..............................0 ..............(112,183,445) ...............(58,000,493)00000................. 00-0000000............. Hartford Life Insurance Company, KK (Japan)..................... ................................0 .................74,297,623 ................................0 ................................0 ................................0 ............................0 ....... ..............................0 .................74,297,623 ................................060348................. 22-1771521............. Hart Life Insurance Company.............................................. ................................0 ................................0 ................................0 ................................0 .....................115,605 ............................0 ....... ..............................0 .....................115,605 ................................088072................. 06-0974148............. Hartford Life Insurance Company........................................ ................................0 ................................0 ................................0 ................................0 ..................7,168,566 ............................0 ....... ..............................0 ..................7,168,566 ..................1,837,00100000................. 06-1134817............. Hartford Financial Services Life Ins. Co............................... ................................0 ................................0 ................................0 ................................0 .........................7,783 ............................0 ....... ..............................0 .........................7,783 ................................071153................. 39-1052598............. Hartford Life & Annuity Insurance Company......................... ................................0 ...............235,000,000 ................................0 ................................0 ...............(85,125,130) ............................0 ....... ..............................0 ...............149,874,870 ................................000000................. 22-3198854............. International Corporate Marketing Group, Inc....................... ................................0 ................................0 ................................0 ................................0 .....................129,465 ............................0 ....... ..............................0 .....................129,465 ................................000000................. 13-3216939............. The Evergreen Group, Inc................................................... ................................0 ................................0 ................................0 ................................0 .......................49,522 ............................0 ....... ..............................0 .......................49,522 ................................000000................. 06-1293360............. Hartford Life International, Ltd.............................................. ...............(12,000,000) ................................0 ................................0 ................................0 ...............(11,146,400) ............................0 ....... ..............................0 ...............(23,146,400) ................................093505................. 06-1207332............. Hartford International Life Reassurance Corporation............ ................................0 ................................0 ................................0 ................................0 ..................4,178,348 ............................0 ....... ..............................0 ..................4,178,348 ................................000000................. AA-3190021............ Hartford Life, Ltd. (Bermuda)............................................... ................................0 ................................0 ................................0 ................................0 .................(2,066,246) ............................0 ....... ..............................0 .................(2,066,246) ................................000000................. 27-0008094............. PPL Holdings, LLC.............................................................. ................................0 ..................5,000,000 ................................0 ................................0 ....................(794,000) ............................0 ....... ..............................0 ..................4,206,000 ................................000000................. 22-3866674............. Hartford Holdings, Inc.......................................................... ..............(192,960,000) .................42,315,567 ................................0 ................................0 ................................0 ............................0 ....... ..............................0 ..............(150,644,433) ................................000000................. 06-1132748............. The Hartford International Financial Services Group, Inc...... ...............(13,253,437) ................................0 ................................0 ................................0 .................(9,611,765) ............................0 ....... ..............................0 ...............(22,865,202) ................................000000................. 98-0219177............. Hartford Investments Canada Corp...................................... ................................0 ................................0 ................................0 ................................0 ....................(741,529) ............................0 ....... ..............................0 ....................(741,529) ................................000000................. 00-0000000............. Hartford Insurance, Ltd. (Bermuda)..................................... ................................0 ................................0 ................................0 ................................0 ................................0 ............................0 ....... ..............................0 ................................0 ................................000000................. 58-1680624............. Omni Insurance Group, Inc.................................................. ................................0 ................................0 ................................0 ................................0 ....................(101,497) ............................0 ....... ..............................0 ....................(101,497) ................................039098................. 58-1408232............. Omni Insurance Company................................................... .....................250,000 ................................0 ................................0 ................................0 ..................6,482,654 ............................0 ....... ..............................0 ..................6,732,654 ...............(57,550,000)34940................. 58-1189287............. Omni Indemnity Company................................................... ................................0 ................................0 ................................0 ................................0 .................(7,696,769) ............................0 ....... ..............................0 .................(7,696,769) ................................000000................. 74-2734608............. Omni General Agency, Inc................................................... ....................(250,000) ................................0 ................................0 ................................0 .......................49,098 ............................0 ....... ..............................0 ....................(200,902) ................................000000................. 06-1472135............. The Hartford Investment Management Co............................ ................................0 ................................0 ................................0 ................................0 .................14,425,238 ............................0 ....... ..............................0 .................14,425,238 ................................000000................. 06-0883503............. Hartford Investment Services, Inc........................................ ................................0 ................................0 ................................0 ................................0 .....................104,178 ............................0 ....... ..............................0 .....................104,178 ................................000000................. 06-1442285............. Heritage Holdings, Inc......................................................... ................................0 ................................0 ................................0 ................................0 ................................0 ............................0 ....... ..............................0 ................................0 ................................000000................. 98-0188675............. Heritage Reinsurance Company, Ltd. (Bermuda).................. .................10,000,001 ................................0 ................................0 ................................0 ..................7,456,357 ............................0 ....... ..............................0 .................17,456,358 ...........(1,649,895,000)00000................. 00-0000000............. Excess Insurance Company, Limited (United Kingdom)........ ................................0 ................................0 ................................0 ................................0 ................................0 ............................0 ....... ..............................0 ................................0 .................37,008,00021822................. 04-2198460............. First State Insurance Company............................................ ................................0 ...............(30,961,734) ................................0 ................................0 ...............(30,781,206) ............................0 ...*.. ..............................0 ...............(61,742,940) ............1,421,734,00021830................. 04-2177185............. New England Insurance Company....................................... ................................0 .................15,480,867 ................................0 ................................0 ..................3,904,116 ............................0 ...*.. ..............................0 .................19,384,983 .................81,074,00041629................. 06-1053492............. New England Reinsurance Corporation................................ ................................0 .................15,480,867 ................................0 ................................0 ..................1,771,077 ............................0 ...*.. ..............................0 .................17,251,944 .................(5,642,000)00000................. 06-1107677............. HARCO Property Services, Inc............................................ .................(5,000,000) ................................0 ................................0 ................................0 .....................948,347 ............................0 ....... ..............................0 .................(4,051,653) ................................000000................. 13-2852356............. Four Thirty-Seven Land Company....................................... ................................0 ................................0 ................................0 ................................0 ............................288 ............................0 ....... ..............................0 ............................288 ................................000000................. 06-1185090............. HRA, Inc............................................................................. ................................0 ................................0 ................................0 ................................0 ....................(116,511) ............................0 ....... ..............................0 ....................(116,511) ................................0

Annual Statement for the year 2002 of the TWIN CITY FIRE INSURANCE COMPANY
110.1
SCHEDULE Y (Continued) PART 2 - SUMMARY OF INSURER'S TRANSACTIONS WITH ANY AFFILIATES
1 2 3 4 5 6 7 8 9 10 11 12 13Income/
(Disbursements) Any Other ReinsurancePurchases, Sales Incurred in Material Activity Recoverable/or Exchanges of Connection with Management Income/ Not in the (Payable) on
Loans, Securities, Guarantees or Agreements (Disbursements) Ordinary Losses and/orNAIC Federal Names of Insurers Real Estate, Undertakings and Incurred under Course of the Reserve Credit
Company ID and Parent, Subsidiaries Shareholder Capital Mortgage Loans or for the Benefit Service Reinsurance Insurer's Taken/Code Number or Affiliates Dividends Contributions Other Investments of any Affiliate(s) Contracts Agreements * Business Totals (Liability)
00000................. 06-1126749............. HRA Brokerage Services, Inc.............................................. ................................0 ................................0 ................................0 ................................0 .....................121,959 ............................0 ....... ..............................0 .....................121,959 ................................000000................. 06-1521834............. Trumbull Associates, LLC.................................................... ................................0 ................................0 ................................0 ................................0 .................(4,388,269) ............................0 ....... ..............................0 .................(4,388,269) ................................000000................. 06-1521832............. Trumbull Finance, LLC........................................................ ................................0 ................................0 ................................0 ................................0 .......................11,847 ............................0 ....... ..............................0 .......................11,847 ................................000000................. 06-1552692............. Hartford Technology Services Co., LLC............................... ................................0 ................................0 ................................0 ................................0 .......................37,585 ............................0 ....... ..............................0 .......................37,585 ................................000000................. 06-1526449............. Horizon Managment Group, LLC.......................................... ................................0 ................................0 ................................0 ................................0 ..................2,695,617 ............................0 ....... ..............................0 ..................2,695,617 ................................000000................. 13-2765326............. Hartford Risk Management, Inc........................................... ................................0 ................................0 ................................0 ................................0 ..................1,448,189 ............................0 ....... ..............................0 ..................1,448,189 ................................000000................. 59-3021034............. Trumbull Recovery Services, Inc......................................... ................................0 ................................0 ................................0 ................................0 ........................(9,093) ............................0 ....... ..............................0 ........................(9,093) ................................000000................. 06-1323788............. Fencourt Reinsurance Company, Ltd. (Bermuda)................. ................................0 ................................0 ................................0 ................................0 ..................1,006,579 ............................0 ....... ..............................0 ..................1,006,579 .................(8,411,000)00000................. 98-0188674............. New Ocean Insurance Company, Ltd (Bermuda).................. ................................0 ................................0 ................................0 ................................0 ....................(115,548) ............................0 ....... ..............................0 ....................(115,548) ................................000000................. 06-1120503............. Hartford-Comp. Employee Ben. Svc. Co.............................. ................................0 ................................0 ................................0 ................................0 .......................17,773 ............................0 ....... ..............................0 .......................17,773 ................................000000................. 06-0896599............. Hartford Equity Sales Co., Inc.............................................. ................................0 ................................0 ................................0 ................................0 .......................16,339 ............................0 ....... ..............................0 .......................16,339 ................................000000................. 06-1534085............. HL Investment Advisors, LLC.............................................. ................................0 ..................1,284,109 ................................0 ................................0 .................57,323,097 ............................0 ....... ..............................0 .................58,607,206 ................................000000................. 23-2079123............. Planco Incorporated............................................................ ................................0 ................................0 ................................0 ................................0 ..................1,086,513 ............................0 ....... ..............................0 ..................1,086,513 ................................000000................. 23-2132791............. Planco Financial Services, Inc............................................. ................................0 ................................0 ................................0 ................................0 .......................21,662 ............................0 ....... ..............................0 .......................21,662 ................................080586................. 13-6150240............. Servus Life Insurance Company.......................................... ................................0 ................................0 ................................0 ................................0 ................................0 ............................0 ....... ..............................0 ................................0 ................................063444................. 06-1566092............. Nutmeg Life Insurance Company......................................... ................................0 ................................0 ................................0 ................................0 .....................119,497 ............................0 ....... ..............................0 .....................119,497 ................................000000................. 06-1493421............. The Hartford Fidelity and Bonding Company........................ ................................0 ................................0 ................................0 ................................0 ..............................19 ............................0 ....... ..............................0 ..............................19 ................................000000................. 00-0000000............. Hartford Management, Ltd. (Bermuda)................................. ................................0 ................................0 ................................0 ................................0 ................................0 ............................0 ....... ..............................0 ................................0 ................................000000................. 06-1032405............. HartRe Group, LLC............................................................. ................................0 ................................0 ................................0 ................................0 ................................0 ............................0 ....... ..............................0 ................................0 ................................081213................. 06-1422508............. American Maturity Life Insurance Company......................... ................................0 ................................0 ................................0 ................................0 ................................0 ............................0 ....... ..............................0 ................................0 ................................000000................. 00-0000000............. Hopmeadow Holdings (Argentina)........................................ ................................0 ................................0 ................................0 ................................0 ................................0 ............................0 ....... ..............................0 ................................0 ................................000000................. 00-0000000............. Hartford Seguros De Retiro S.A., (Argentina)....................... ................................0 ................................0 ................................0 ................................0 ................................0 ............................0 ....... ..............................0 ................................0 ................................000000................. 00-0000000............. ICATU Hartford Seguros S.A., (Brazil)................................. ................................0 ................................0 ................................0 ................................0 ................................0 ............................0 ....... ..............................0 ................................0 ................................000000................. 00-0000000............. ICATU Hartford Administracao de Beneficios LTDA, (Brazil). ................................0 ................................0 ................................0 ................................0 ................................0 ............................0 ....... ..............................0 ................................0 ................................000000................. 00-0000000............. ICATU Hartford Fundo de Pensao, (Brazil)........................... ................................0 ................................0 ................................0 ................................0 ................................0 ............................0 ....... ..............................0 ................................0 ................................000000................. 00-0000000............. ICATU Hartford Capitalizacao S.A. (Brazil).......................... ................................0 ................................0 ................................0 ................................0 ................................0 ............................0 ....... ..............................0 ................................0 ................................000000................. 00-0000000............. Brazilcap Capitalizacao S.A. (Brazil).................................... ................................0 ................................0 ................................0 ................................0 ................................0 ............................0 ....... ..............................0 ................................0 ................................000000................. 00-0000000............. Fedcap Capitalizacao S.A. (Brazil)....................................... ................................0 ................................0 ................................0 ................................0 ................................0 ............................0 ....... ..............................0 ................................0 ................................000000................. 56-2160819............. Access Coverage Corp., Inc................................................ ................................0 ................................0 ................................0 ................................0 .................(1,987,505) ............................0 ....... ..............................0 .................(1,987,505) ................................000000................. 41-0679409............. Hartford Administrative Services Company.......................... .................(8,500,000) ................................0 ................................0 ................................0 .................(6,086,407) ............................0 ....... ..............................0 ...............(14,586,407) ................................000000................. 41-0944586............. Woodbury Financial Services, Inc........................................ ................................0 ................................0 ................................0 ................................0 .................(1,608,149) ............................0 ....... ..............................0 .................(1,608,149) ................................000000................. 52-2137766............. Hartford Financial Services, LLC.......................................... ...............(66,000,000) .......................12,000 ................................0 ................................0 ................................0 ............................0 ....... ..............................0 ...............(65,988,000) ................................000000................. 06-1629808............. Hartford Investment Financial Services, LLC........................ ................................0 ................................0 ................................0 ................................0 ................................0 ............................0 ....... ..............................0 ................................0 ................................000000................. 06-1317292............. Specialty Risk Services, Inc................................................. ...............(46,000,000) ................................0 ................................0 ................................0 ..................5,415,182 ............................0 ....... ..............................0 ...............(40,584,818) ................................000000................. 06-1408044............. Hartford Securities Distribution Company............................. ................................0 ..................7,500,000 ................................0 ................................0 ...........................(365) ............................0 ....... ..............................0 ..................7,499,635 ................................000000................. 00-0000000............. Hartford Bank, FSB (Federal).............................................. ................................0 ................................0 ................................0 ................................0 ....................(207,495) ............................0 ....... ..............................0 ....................(207,495) ................................0
9999999. Control Totals....................................................................................................... ...............................(0) ................................0 ................................0 ................................0 ................................0 ............................0 XXX ..............................0 ................................0 ................................0
Column 9 - See footnote #25 Intercompany Pooling Arrangements for the Hartford Fire Insurance Pooling percentages by individual company.
First State Insurance Group Pool: First State Insurance Company 98% New England Insurance Company 1% New England Reinsurance Company 1%

Annual Statement for the year 2002 of the TWIN CITY FIRE INSURANCE COMPANY
111
SUPPLEMENTAL EXHIBITS AND SCHEDULES INTERROGATORIESThe following supplemental reports are required to be filed as part of your statement filing. However, in the event that your company does not transact the type of business for which the special report must be filed, your response of NO to the specific interrogatory will be accepted in lieu of filing a "NONE" report and a bar code will be printed below. If the supplement is required of your company but is not being filed for whatever reason, enter SEE EXPLANATION and provide an explanation following the interrogatory questions.
MARCH FILING RESPONSES1. Will Supplement A to Schedule T (Medical Malpractice Supplement) be filed by March 1? YES2. Will Schedule SIS (Stockholder Information Supplement) be filed with the state of domicile by March 1? NO3. Will the Financial Guaranty Insurance Exhibit be filed March 1? NO4. Will the Medicare Supplement Insurance Experience Exhibit be filed with the state of domicile and the NAIC by March 1? NO5. Will an actuarial opinion by filed by March 1? YES6. Will the SVO Compliance Certification be filed by March 1? YES7. Will the Trusteed Surplus Statement be filed with the state of domicile and the NAIC by March 1? NO8. Will the Supplemental Compensation Exhibit be filed with the state of domicile by March 1? YES9. Will the Risk-Based Capital Report be filed with the NAIC by March 1? YES
10. Will the Risk-Based Capital Report be filed with the state of domicile, if required, by March 1? YES11. Will the Premiums Attributed to Protected Cells Exhibit be filed by March 1? NO
APRIL FILING12. Will the Insurance Expense Exhibit be filed with the state of domicile and the NAIC by April 1? YES13. Will Management's Discussion and Analysis be filed by April 1? YES14. Will the Credit Insurance Experience Exhibit be filed with the state of domicile and the NAIC by April 1? NO15. Will the Long-term Care Experience Reporting Forms be filed with the state of domicile and the NAIC by April 1? NO16. Will the Accident and Health Policy Experience Exhibit be filed by April 1? NO17. Will the Investment Risk Interrogatories be filed by April 1? YES
MAY FILING18. Will this company be included in a combined annual statement which is filed with the NAIC by May 1? YES
JUNE FILING19. Will an audited financial report be filed by June 1? YES
EXPLANATIONS:
BAR CODE:
*29459200242000000**29459200224000000* *29459200223000000**29459200236000000* *29459200233000000*
*29459200221000000*
*29459200249000000*
*29459200238500000*

Annual Statement for the year 2002 of the TWIN CITY FIRE INSURANCE COMPANY
112L, E01, E02, E03, E04, E05, E06, E07
Overflow Page for Write-Ins (Landscape)NONE
Sch. A-Pt. 1NONE
Sch. A-Pt. 2NONE
Sch. A-Pt. 3NONE
Sch. B-Pt. 1NONE
Sch. B-Pt. 2NONE
Sch. BA-Pt. 1NONE
Sch. BA-Pt. 2NONE

Annual Statement for the year 2002 of the TWIN CITY FIRE INSURANCE COMPANY
E08
SCHEDULE D - PART 1Showing all Long-Term BONDS Owned December 31 of Current Year
1 2 3 Interest 6 7 8 9 10 11 12 13 Interest 16 17 18 19 20 214 5 14 15 Amount of
Interest DueAmount Due and Accrued
Rate and Accrued December 31,Used December 31 Gross Increase Current Year, Effec-
to of Current Amount Increase (Decrease) on Bonds in tiveCUSIP Option Obtain Year on Received (Decrease) by Foreign Default as to NAIC RateIdentifi- Rate How Maturity Option Call Book/Adjusted Fair Fair Bonds not During by Exchange Principal or Desig- Date ofcation Description * of Paid Date Date Price Carrying Value Par Value Value Value Actual Cost in Default Year Adjustment Adjustment Interest nation Acquired Interest
U.S. Government - Issuer Obligations912828-AC-4.. U S A TREASURY............................................................. ........ .......4.375 MN... 05/15/2007 .................. ............ ...........3,188,908 ...........3,150,000 ......0.0000 ...........3,188,908 ...........3,193,066 ...........17,893 ...........68,906 ............(4,158) ....................0 ...................0 ......1 06/25/2002 .......4.060912827-4N-9.. U S A TREASURY NOTES................................................ ........ .......5.250 FA.... 08/15/2003 .................. ............ ................50,081 ................50,000 ..102.5000 ................51,250 ................50,531 ................992 .............2,625 ...............(125) ....................0 ...................0 ......1 02/17/1999 .......4.980912827-J7-8... U S A TREASURY NOTES................................................ ........ .......6.250 FA.... 02/15/2003 .................. ............ ..............135,116 ..............135,000 ..100.5940 ..............135,802 ..............139,208 .............3,187 .............8,438 ...............(928) ....................0 ...................0 ......1 02/10/1998 .......5.530912827-P8-9.. U S A TREASURY NOTES................................................ ........ .......7.250 MN... 05/15/2004 .................. ............ ..............101,075 ..............100,000 ..108.0310 ..............108,031 ..............102,781 ................941 .............7,250 ...............(729) ....................0 ...................0 ......1 07/19/2000 .......6.420
0199999. U.S. Government - Issuer Obligations................................................................................................................................ ...........3,475,180 ...........3,435,000 ....XXX...... ...........3,483,991 ...........3,485,587 ...........23,013 ...........87,219 ............(5,939) ....................0 ...................0 .XXX .....XXX..... ....XXX.....U.S. Government - Single Class Mortgage-Backed/Asset-Backed Securities36200R-YA-4. GNMA................................................................................ ........ .......6.500 MTLY 12/01/2031 .................. ............ ...........2,393,028 ...........2,351,138 ......0.0000 ...........2,393,028 ...........2,395,222 ...........12,735 ...........72,689 ............(2,194) ....................0 ...................0 ......1 06/11/2002 .......6.12036201M-EE-8. GNMA................................................................................ ........ .......7.000 MTLY 04/01/2032 .................. ............ ...........4,128,108 ...........4,034,176 ......0.0000 ...........4,128,108 ...........4,146,376 ...........23,533 .........184,320 ..........(18,268) ....................0 ...................0 ......1 04/05/2002 .......6.000
0299999. U.S. Government - Single Class Mortgage-Backed/Asset-Backed Securities................................................................... ...........6,521,136 ...........6,385,314 ....XXX...... ...........6,521,136 ...........6,541,598 ...........36,268 .........257,009 ..........(20,462) ....................0 ...................0 .XXX .....XXX..... ....XXX.....0399999. Total - U.S. Government..................................................................................................................................................... ...........9,996,315 ...........9,820,314 ....XXX...... .........10,005,127 .........10,027,185 ...........59,281 .........344,227 ..........(26,402) ....................0 ...................0 .XXX .....XXX..... ....XXX.....
States, Territories & Possessions (Direct and Guaranteed) - Issuer Obligations California130629-FZ-6.. CALIFORNIA GENERAL OBLIGATION UNREFUNDED BALANCE........ .......5.500 MS... 03/01/2007 .................. ............ ...........1,024,486 ...........1,025,000 ..105.4460 ...........1,080,822 ...........1,023,719 ...........18,792 ...........56,375 ................107 ....................0 ...................0 ..1PE 03/10/1994 .......5.510
California............................................................................................................................................................................. ...........1,024,486 ...........1,025,000 ....XXX...... ...........1,080,822 ...........1,023,719 ...........18,792 ...........56,375 ................107 ....................0 ...................0 .XXX .....XXX..... ....XXX..... Illinois452149-SY-4.. ILLINOIS GENERAL OBLIGATION................................... ........ .......4.600 JD.... 12/01/2005 .................. ............ ...........3,596,855 ...........3,750,000 ..104.5370 ...........3,920,138 ...........3,296,625 ...........14,375 .........172,500 ...........46,597 ....................0 ...................0 ..1PE 02/14/1995 .......6.150452151-BA-0.. ILLINOIS GENERAL OBLIGATION SER JULY 2002 MBIA........ .......5.100 JJ..... 07/01/2023 07/01/2012 100.000 ...........3,004,347 ...........3,000,000 ..102.3690 ...........3,071,070 ...........3,004,500 ...........76,500 ....................0 ...............(153) ....................0 ...................0 ..1PE 07/18/2002 .......5.080
Illinois.................................................................................................................................................................................. ...........6,601,202 ...........6,750,000 ....XXX...... ...........6,991,208 ...........6,301,125 ...........90,875 .........172,500 ...........46,445 ....................0 ...................0 .XXX .....XXX..... ....XXX..... Louisiana546415-DS-6.. LOUISIANA GENERAL OBLIGATION 1993B MBIA......... ........ .......5.625 FA.... 08/01/2013 .................. ............ ................76,647 ................75,000 ..117.0630 ................87,797 ................77,312 .............1,758 .............4,219 ...............(113) ....................0 ...................0 ..1PE 03/05/1996 .......5.350546415-NJ-5.. LOUISIANA GENERAL OBLIGATION 2000A FGIC......... ........ .......5.000 MN... 11/15/2016 11/15/2010 100.000 ...........1,006,400 ...........1,000,000 ..105.8640 ...........1,058,640 ...........1,007,590 .............6,389 ...........50,000 ...............(528) ....................0 ...................0 ..1PE 02/14/2001 .......4.900546415-NN-6. LOUISIANA GENERAL OBLIGATION 2000A FGIC......... ........ .......5.000 MN... 11/15/2020 11/15/2010 100.000 ...........5,101,223 ...........5,000,000 ..103.1480 ...........5,157,400 ...........5,103,000 .........156,944 ....................0 ............(1,777) ....................0 ...................0 ..1PE 11/01/2002 .......4.690546415-QM-5. LOUISIANA GENERAL OBLIGATION 2002A FGIC......... ........ .......5.000 AO.... 04/01/2018 04/01/2012 100.000 ...........5,040,319 ...........5,000,000 ..104.9240 ...........5,246,200 ...........5,043,100 ...........62,500 .........156,944 ............(2,781) ....................0 ...................0 ..1PE 02/21/2002 .......4.890546415-QR-4. LOUISIANA GENERAL OBLIGATION 2002A FGIC......... ........ .......5.000 AO.... 04/01/2022 .................. ............ ...........6,956,970 ...........7,000,000 ..102.0200 ...........7,141,400 ...........6,955,900 ...........87,500 .........219,722 .............1,070 ....................0 ...................0 ..1PE 02/21/2002 .......5.050546415-NM-8. LOUISIANA GENERAL OBLIGATION SER A FGIC......... ........ .......5.000 MN... 11/15/2019 .................. ............ ...........1,789,720 ...........1,800,000 ..103.8870 ...........1,869,966 ...........1,789,182 ...........11,500 ...........90,000 ................299 ....................0 ...................0 ..1PE 07/19/2001 .......5.050
Louisiana............................................................................................................................................................................. .........19,971,280 .........19,875,000 ....XXX...... .........20,561,403 .........19,976,084 .........326,591 .........520,885 ............(3,830) ....................0 ...................0 .XXX .....XXX..... ....XXX..... Massachusetts57582N-CB-9. MASSACHUSETTS GENERAL OBLIGATION 2002B FSA ........ .......5.250 MS... 03/01/2022 .................. ............ ...........4,987,777 ...........5,000,000 ..104.8320 ...........5,241,600 ...........4,987,500 ...........87,500 .........121,042 ................277 ....................0 ...................0 ..1PE 03/21/2002 .......5.270
Massachusetts.................................................................................................................................................................... ...........4,987,777 ...........5,000,000 ....XXX...... ...........5,241,600 ...........4,987,500 ...........87,500 .........121,042 ................277 ....................0 ...................0 .XXX .....XXX..... ....XXX..... Mississippi605629-AZ-7.. MISSISSIPPI CORR (EAST MS CORRECTIONAL FACL ATHY) AMBAC........ .......5.000 JJ..... 01/01/2018 .................. ............ ...........8,658,853 ...........8,810,000 ..103.4490 ...........9,113,857 ...........8,629,321 .........220,250 .........440,500 .............6,527 ....................0 ...................0 ..1PE 01/13/1998 .......5.170605575-UE-7.. MISSISSIPPI GENERAL OBLIGATION............................ ........ .......5.100 MN... 11/15/2010 .................. ............ ...........2,933,455 ...........3,000,000 ..112.0210 ...........3,360,630 ...........2,900,250 ...........19,550 .........153,000 .............6,612 ....................0 ...................0 ..1PE 04/24/1997 .......5.450605579-HB-0.. MISSISSIPPI GENERAL OBLIGATION FGIC.................. ........ .......4.250 MN... 11/01/2018 .................. ............ ...........2,439,065 ...........3,000,000 ....99.3000 ...........2,979,000 ...........2,377,500 ...........21,250 .........127,500 ...........20,568 ....................0 ...................0 ..1PE 10/19/1999 .......6.110605578-3K-7.. MISSISSIPPI GENERAL OBLIGATION PORT IMP SER 16 AMT........ .......5.000 MS... 09/01/2014 09/01/2008 100.000 ...........2,506,052 ...........2,500,000 ..104.6270 ...........2,615,675 ...........2,509,625 ...........41,667 .........125,000 ...............(905) ....................0 ...................0 ..1PE 09/10/1998 .......4.950605578-3L-5... MISSISSIPPI GENERAL OBLIGATION PORT IMP SER 16 AMT........ .......5.000 MS... 09/01/2015 .................. ............ ...........2,074,932 ...........2,075,000 ..104.0110 ...........2,158,228 ...........2,074,917 ...........34,583 .........103,750 ....................4 ....................0 ...................0 ..1PE 09/10/1998 .......5.000605579-W5-6. MISSISSIPPI GENERAL OBLIGATION RFDG................. ........ .......5.000 AO.... 10/01/2011 .................. ............ ...........5,362,038 ...........5,000,000 ..110.9170 ...........5,545,850 ...........5,401,050 ...........62,500 .........240,278 ..........(33,931) ....................0 ...................0 ..1PE 10/23/2001 .......4.010605579-4N-8.. MISSISSIPPI GENERAL OBLIGATION RFDG 2002A..... ........ .......5.500 JD.... 12/01/2017 .................. ............ ...........4,260,323 ...........4,000,000 ..114.7630 ...........4,590,520 ...........4,271,040 ...........18,333 .........183,944 ..........(10,717) ....................0 ...................0 ..1PE 01/09/2002 .......4.880605579-WB-3. MISSISSIPPI GENERAL OBLIGATION SER 2000........... ........ .......5.000 MN... 11/01/2019 .................. ............ ...........3,798,993 ...........4,000,000 ..104.0040 ...........4,160,160 ...........3,784,240 ...........33,333 .........200,000 .............7,141 ....................0 ...................0 ..1PE 11/02/2000 .......5.460
Mississippi........................................................................................................................................................................... .........32,033,710 .........32,385,000 ....XXX...... .........34,523,920 .........31,947,943 .........451,467 ......1,573,972 ............(4,701) ....................0 ...................0 .XXX .....XXX..... ....XXX..... New York649787-FK-9.. NEW YORK GENERAL OBLIGATION.............................. ........ .......5.250 MS... 03/01/2010 .................. ............ ...........4,907,711 ...........5,000,000 ..108.6600 ...........5,433,000 ...........4,856,450 ...........87,500 .........262,500 ...........10,229 ....................0 ...................0 ..1PE 04/23/1997 .......5.570
New York............................................................................................................................................................................. ...........4,907,711 ...........5,000,000 ....XXX...... ...........5,433,000 ...........4,856,450 ...........87,500 .........262,500 ...........10,229 ....................0 ...................0 .XXX .....XXX..... ....XXX..... Oregon68607H-NZ-5. OREGON DEPT ADMIN SVCS CERT OF PART RFDG 2002B MBIA........ .......5.250 MN... 05/01/2014 05/01/2012 100.000 ...........6,194,773 ...........5,850,000 ..110.8280 ...........6,483,438 ...........6,218,316 ...........51,188 .........204,750 ..........(23,543) ....................0 ...................0 ..1PE 02/27/2002 .......4.470
Oregon................................................................................................................................................................................. ...........6,194,773 ...........5,850,000 ....XXX...... ...........6,483,438 ...........6,218,316 ...........51,188 .........204,750 ..........(23,543) ....................0 ...................0 .XXX .....XXX..... ....XXX..... Texas882718-EP-0.. TEXAS GENERAL OBLIGATION COLLEGE STUDENT LOAN AMT........ .......5.600 FA.... 08/01/2007 .................. ............ ...........4,989,214 ...........5,045,000 ..107.6950 ...........5,433,213 ...........4,923,163 .........117,717 .........282,520 ...........10,327 ....................0 ...................0 ..1PE 05/01/1995 .......5.880
Texas................................................................................................................................................................................... ...........4,989,214 ...........5,045,000 ....XXX...... ...........5,433,213 ...........4,923,163 .........117,717 .........282,520 ...........10,327 ....................0 ...................0 .XXX .....XXX..... ....XXX.....Total States and US............................................................................................................................................................ .........80,710,152 .........80,930,000 ....XXX...... .........85,748,603 .........80,234,300 ......1,231,629 ......3,194,544 ...........35,311 ....................0 ...................0 .XXX .....XXX..... ....XXX.....
1199999. States, Territories & Possessions - Issuer Obligations....................................................................................................... .........80,710,152 .........80,930,000 ....XXX...... .........85,748,603 .........80,234,300 ......1,231,629 ......3,194,544 ...........35,311 ....................0 ...................0 .XXX .....XXX..... ....XXX.....1799999. Total - States, Territories & Possessions (Direct and Guaranteed).................................................................................... .........80,710,152 .........80,930,000 ....XXX...... .........85,748,603 .........80,234,300 ......1,231,629 ......3,194,544 ...........35,311 ....................0 ...................0 .XXX .....XXX..... ....XXX.....
Political Subdivisions of States, Territories & Possessions (Direct and Guaranteed) - Issuer Obligations

Annual Statement for the year 2002 of the TWIN CITY FIRE INSURANCE COMPANY
E08.1
SCHEDULE D - PART 1Showing all Long-Term BONDS Owned December 31 of Current Year
1 2 3 Interest 6 7 8 9 10 11 12 13 Interest 16 17 18 19 20 214 5 14 15 Amount of
Interest DueAmount Due and Accrued
Rate and Accrued December 31,Used December 31 Gross Increase Current Year, Effec-
to of Current Amount Increase (Decrease) on Bonds in tiveCUSIP Option Obtain Year on Received (Decrease) by Foreign Default as to NAIC RateIdentifi- Rate How Maturity Option Call Book/Adjusted Fair Fair Bonds not During by Exchange Principal or Desig- Date ofcation Description * of Paid Date Date Price Carrying Value Par Value Value Value Actual Cost in Default Year Adjustment Adjustment Interest nation Acquired Interest
Arizona590485-LY-2.. MESA AZ GENERAL OBLIGATION SERIES 1995 MBIA PREREFUNDED........ .......5.250 JJ..... 07/01/2009 07/01/2004 101.000 ...........7,000,000 ...........7,000,000 ..106.8140 ...........7,476,980 ...........6,973,750 .........183,750 .........367,500 ...........16,756 ....................0 ...................0 ......1 11/14/1995 .......5.780
Arizona................................................................................................................................................................................ ...........7,000,000 ...........7,000,000 ....XXX...... ...........7,476,980 ...........6,973,750 .........183,750 .........367,500 ...........16,756 ....................0 ...................0 .XXX .....XXX..... ....XXX..... California130629-FE-3.. CALIFORNIA ST GENERAL OBLIGATION PREREFUNDED........ .......5.500 MS... 03/01/2007 03/01/2004 102.000 ................15,000 ................15,000 ..107.0190 ................16,053 ................14,987 ................275 ................825 ....................0 ....................0 ...................0 ......1 05/19/1999 .......5.890
California............................................................................................................................................................................. ................15,000 ................15,000 ....XXX...... ................16,053 ................14,987 ................275 ................825 ....................0 ....................0 ...................0 .XXX .....XXX..... ....XXX..... Connecticut20772F-BP-4. CONNECTICUT GENERAL OBLIGATION BONDS 1993 SER E PREREFUNDED........ .......4.750 MS... 03/15/2007 03/15/2004 101.500 ................69,554 ................70,000 ..105.6890 ................73,982 ................66,963 ................979 .............3,325 .............1,158 ....................0 ...................0 ......1 09/01/2000 .......6.530
Connecticut......................................................................................................................................................................... ................69,554 ................70,000 ....XXX...... ................73,982 ................66,963 ................979 .............3,325 .............1,158 ....................0 ...................0 .XXX .....XXX..... ....XXX..... Indiana746180-5P-9.. PURDUE UNIVERSITY IN STUDENT FEE REV SER M PREREFUNDED........ .......5.900 JJ..... 07/01/2011 07/01/2006 101.000 ...........3,180,000 ...........3,180,000 ..114.0530 ...........3,626,885 ...........3,164,259 ...........93,810 .........187,620 ....................0 ....................0 ...................0 ......1 07/10/1996 .......6.080
Indiana................................................................................................................................................................................. ...........3,180,000 ...........3,180,000 ....XXX...... ...........3,626,885 ...........3,164,259 ...........93,810 .........187,620 ....................0 ....................0 ...................0 .XXX .....XXX..... ....XXX..... Kentucky491513-G5-0.. KENTUCKY PROPERTY & BUILDING COMM REV & RFDG PROJ 59 PREREFUNDED........ .......5.375 MN... 11/01/2009 11/01/2005 102.000 ...........2,230,000 ...........2,230,000 ..112.1770 ...........2,501,547 ...........2,203,017 ...........19,977 .........119,863 .............9,692 ....................0 ...................0 ......1 11/20/1995 .......5.980491513-G6-8.. KENTUCKY PROPERTY & BUILDING COMM REV & RFDG PROJ 59 PREREFUNDED........ .......5.375 MN... 11/01/2010 11/01/2005 102.000 ...........1,997,206 ...........2,000,000 ..112.1770 ...........2,243,540 ...........1,964,700 ...........17,917 .........107,500 ...........13,458 ....................0 ...................0 ......1 11/20/1995 .......6.090
Kentucky.............................................................................................................................................................................. ...........4,227,206 ...........4,230,000 ....XXX...... ...........4,745,087 ...........4,167,717 ...........37,894 .........227,363 ...........23,150 ....................0 ...................0 .XXX .....XXX..... ....XXX..... Louisiana270848-GP-3. EAST BATON ROUGE PARISH LA SALES TAX REVSER ST 1996 FGIC........ .......5.400 FA.... 02/01/2011 02/01/2006 101.500 ...........3,432,701 ...........3,345,000 ..106.8300 ...........3,573,464 ...........3,455,051 ...........75,263 .........180,630 ..........(11,013) ....................0 ...................0 ..1PE 12/01/2000 .......4.930270848-GQ-1. EAST BATON ROUGE PARISH LA SALES TAX REVSER ST 1996 FGIC........ .......5.400 FA.... 02/01/2012 02/01/2006 101.500 ...........3,650,270 ...........3,560,000 ..107.4970 ...........3,826,893 ...........3,672,211 ...........80,100 .........192,240 ..........(10,814) ....................0 ...................0 ..1PE 12/01/2000 .......4.960270848-GR-9. EAST BATON ROUGE PARISH LA SALES TAX REVSER ST 1996 FGIC........ .......5.400 FA.... 02/01/2013 02/01/2009 100.750 ...........3,858,964 ...........3,780,000 ..106.6490 ...........4,031,332 ...........3,873,026 ...........85,050 .........204,120 ............(6,935) ....................0 ...................0 ..1PE 12/01/2000 .......5.100270848-GS-7. EAST BATON ROUGE PARISH LA SALES TAX REVSER ST 1996 FGIC........ .......5.400 FA.... 02/01/2014 02/01/2012 100.000 ...........4,088,358 ...........4,015,000 ..106.2270 ...........4,265,014 ...........4,100,921 ...........90,338 .........216,810 ............(6,197) ....................0 ...................0 ..1PE 12/01/2000 .......5.150474176-ES-9.. JEFFERSON PARISH LA SALES TAX REV 2001 AMBAC........ .......5.250 JD.... 12/01/2014 12/01/2011 100.000 ...........2,171,335 ...........2,090,000 ..110.5780 ...........2,311,080 ...........2,178,762 .............9,144 .........109,725 ............(7,191) ....................0 ...................0 ..1PE 12/06/2001 .......4.710647634-5D-2.. NEW ORLEANS LA GENERAL OBLIGATION FGIC........ ........ .......5.500 JD.... 12/01/2018 .................. ............ ...........1,681,460 ...........1,650,000 ..114.4640 ...........1,888,656 ...........1,683,957 .............7,563 ...........90,750 ............(1,232) ....................0 ...................0 ..1PE 12/01/2000 .......5.320647634-YD-0.. NEW ORLEANS LA GENERAL OBLIGATION RFDG 1991 AMBAC........ .......0.000 MATR 09/01/2018 .................. ............ ..............881,270 ...........2,000,000 ....47.6150 ..............952,300 ..............855,900 ....................0 ....................0 ...........25,370 ....................0 ...................0 ..1PE 06/05/2002 .......5.240647634-5E-0.. NEW ORLEANS LA GENERAL OBLIGATION RFDG FGIC........ .......5.500 JD01 12/01/2021 .................. ............ ...........2,196,030 ...........2,000,000 ..112.5100 ...........2,250,200 ...........2,198,920 .............9,167 ...........55,000 ............(2,890) ....................0 ...................0 ..1PE 07/26/2002 .......4.690686662-F5-1.. ORLEANS PARISH LA SCH BRD G O FGIC.................... ........ .......0.000 MATR 02/01/2015 .................. ............ .........13,750,184 .........25,700,000 ....58.3190 .........14,987,983 .........11,923,515 ....................0 ....................0 .........901,255 ....................0 ...................0 ..1PE 12/01/2000 .......5.190825434-M4-2.. SHREVEPORT LA GENERAL OBLIGATION FGIC.......... ........ .......5.750 MN... 05/01/2017 .................. ............ ..............997,993 ...........1,000,000 ..110.6730 ...........1,106,730 ..............997,740 .............9,583 ...........57,500 ..................88 ....................0 ...................0 ..1PE 11/10/1999 .......5.770825434-M5-9.. SHREVEPORT LA GENERAL OBLIGATION FGIC.......... ........ .......5.800 MN... 05/01/2018 05/01/2009 100.000 ...........6,951,718 ...........6,800,000 ..110.5380 ...........7,516,584 ...........6,991,488 ...........65,733 .........394,400 ..........(19,634) ....................0 ...................0 ..1PE 12/01/2000 .......5.380825434-M6-7.. SHREVEPORT LA GENERAL OBLIGATION FGIC.......... ........ .......5.850 MN... 05/01/2019 05/01/2009 100.000 ...........7,351,490 ...........7,180,000 ..110.8160 ...........7,956,589 ...........7,396,405 ...........70,005 .........420,030 ..........(22,176) ....................0 ...................0 ..1PE 12/01/2000 .......5.400
Louisiana............................................................................................................................................................................. .........51,011,773 .........63,120,000 ....XXX...... .........54,666,825 .........49,327,896 .........501,945 ......1,921,205 .........838,633 ....................0 ...................0 .XXX .....XXX..... ....XXX..... Mississippi605578-Y3-1.. MISSISSIPPI GENERAL OBLIGATION PRE-REFUNDED........ .......5.000 JD.... 06/01/2016 06/01/2008 100.000 ..............988,541 ...........1,000,000 ..111.7460 ...........1,117,460 ..............984,830 .............4,167 ...........50,000 .............1,692 ....................0 ...................0 ......1 05/15/1998 .......5.250605575-6B-0.. MISSISSIPPI GENERAL OBLIGATION CAPITAL IMPROVEMENT SER B PREREFUNDED........ .......5.250 FA.... 08/01/2009 08/01/2005 100.000 ...........5,021,181 ...........5,080,000 ..109.1860 ...........5,546,649 ...........4,948,646 .........111,125 .........266,700 ...........20,567 ....................0 ...................0 ......1 11/01/1996 .......5.740
Mississippi........................................................................................................................................................................... ...........6,009,722 ...........6,080,000 ....XXX...... ...........6,664,109 ...........5,933,476 .........115,292 .........316,700 ...........22,259 ....................0 ...................0 .XXX .....XXX..... ....XXX..... Missouri467520-PN-6.. JACKSON CNTY MO SCHOOL DIST #7 GEN OBLIG RFDG 2002 FSA........ .......5.250 MS... 03/01/2017 03/01/2012 100.000 ...........3,795,413 ...........3,645,000 ..108.7320 ...........3,963,281 ...........3,802,136 .........111,628 ....................0 ............(6,723) ....................0 ...................0 ..1PE 06/14/2002 .......4.690
Missouri............................................................................................................................................................................... ...........3,795,413 ...........3,645,000 ....XXX...... ...........3,963,281 ...........3,802,136 .........111,628 ....................0 ............(6,723) ....................0 ...................0 .XXX .....XXX..... ....XXX..... Nevada181054-WR-4. CLARK CNTY NV SCHOOL DIST GENERAL OBLIGATION RFDG FGIC........ .......5.250 JD.... 06/01/2008 .................. ............ ...........2,984,948 ...........3,000,000 ..102.4430 ...........3,073,290 ...........2,970,000 ...........13,125 .........157,500 .............2,338 ....................0 ...................0 ..1PE 06/06/1995 .......5.360
Nevada................................................................................................................................................................................ ...........2,984,948 ...........3,000,000 ....XXX...... ...........3,073,290 ...........2,970,000 ...........13,125 .........157,500 .............2,338 ....................0 ...................0 .XXX .....XXX..... ....XXX..... New York59259N-DV-2. METROPOLITAN TRANSIT ATHY DEDICATED TAX FD 2000A FGIC PREREFUNDED........ .......5.875 AO.... 04/01/2020 04/01/2010 100.000 ...........3,750,377 ...........3,800,000 ..117.6970 ...........4,472,486 ...........3,744,672 ...........55,813 .........223,250 .............2,894 ....................0 ...................0 ......1 02/10/2000 .......6.100631655-LL-9... NASSAU CNTY NY GEN IMPROVEMENT GENERAL OBLIGATION SER Q FGIC........ .......5.200 FA.... 08/01/2008 .................. ............ ...........4,139,732 ...........4,165,000 ..107.7980 ...........4,489,787 ...........4,120,168 ...........90,242 .........216,580 .............3,794 ....................0 ...................0 ..1PE 03/01/1997 .......5.33063165N-AU-2. NASSAU CNTY NY GEN IMPROVEMENT GENERAL OBLIGATION SER R FGIC........ .......5.125 MN... 11/01/2010 .................. ............ ...........3,702,493 ...........3,780,000 ..107.4600 ...........4,061,988 ...........3,662,644 ...........32,288 .........193,725 .............7,748 ....................0 ...................0 ..1PE 03/01/1997 .......5.450649665-QL-3.. NEW YORK CITY NY G0 1997 SER D............................. ........ .......5.875 MN... 11/01/2011 .................. ............ ...........4,898,664 ...........5,000,000 ..107.7160 ...........5,385,800 ...........4,852,850 ...........48,958 .........293,750 .............8,409 ....................0 ...................0 ..1PE 08/08/1996 .......6.18064966A-MU-6. NEW YORK CITY NY GO 2001 SER A............................. ........ .......5.900 MN... 05/15/2021 .................. ............ ..............998,804 ...........1,000,000 ..106.1110 ...........1,061,110 ..............998,720 .............7,539 ...........59,000 ..................35 ....................0 ...................0 ..1PE 06/28/2000 .......5.910649659-GG-8. NEW YORK CITY NY GO SER B...................................... ........ .......5.650 FA.... 08/15/2017 .................. ............ ...........4,982,912 ...........5,000,000 ..104.2400 ...........5,212,000 ...........4,981,250 .........106,722 .........282,500 ................734 ....................0 ...................0 ..1PE 08/22/2000 .......5.680649716-DQ-7. NEW YORK CITY TRANSITIONAL FIN ATHY 1998C...... ........ .......5.250 MN... 05/01/2015 .................. ............ ...........3,939,134 ...........4,000,000 ..107.0130 ...........4,280,520 ...........3,928,000 ...........35,000 .........210,000 .............3,394 ....................0 ...................0 ..1PE 06/24/1999 .......5.420650013-AN-5.. NEW YORK THRUWAY ATHY HIGHWAY BRIDGE TRUST FUND 1994A AMBAC PREREFUNDED........ .......5.600 AO.... 04/01/2007 04/01/2004 102.000 ...........2,000,000 ...........2,000,000 ..107.3850 ...........2,147,700 ...........1,990,880 ...........28,000 .........112,000 ....................0 ....................0 ...................0 ......1 08/03/1994 .......6.030650013-QS-7. NEW YORK THRUWAY ATHY HIGHWAY BRIDGE TRUST FUND 2000A FSA_PREREFUNDED........ .......6.000 AO.... 04/01/2016 04/01/2010 101.000 ...........1,018,660 ...........1,000,000 ..119.3010 ...........1,193,010 ...........1,022,330 ...........15,000 ...........60,000 ............(1,247) ....................0 ...................0 ......1 03/06/2000 .......5.790650017-BW-5. NEW YORK THRUWAY ATHY SERVICE CONTRACT REV LOC HWY & BRDG_PREREFUNDED........ .......5.250 AO01 04/01/2013 04/01/2003 102.000 ...........3,100,000 ...........3,100,000 ..103.0070 ...........3,193,217 ...........2,981,239 ...........40,688 .........162,750 ...........84,080 ....................0 ...................0 ......1 02/09/1996 .....12.410650033-A7-8.. NEW YORK URBAN DEV CORP CORR CAP FACL REV SER 4 PREREFUNDED........ .......5.250 JJ..... 01/01/2008 01/01/2004 102.000 ...........5,179,929 ...........5,375,000 ......0.0000 ...........5,179,929 ...........4,961,770 .........141,094 .........282,188 ...........55,940 ....................0 ...................0 ....1Z 06/21/1996 .....11.130

Annual Statement for the year 2002 of the TWIN CITY FIRE INSURANCE COMPANY
E08.2
SCHEDULE D - PART 1Showing all Long-Term BONDS Owned December 31 of Current Year
1 2 3 Interest 6 7 8 9 10 11 12 13 Interest 16 17 18 19 20 214 5 14 15 Amount of
Interest DueAmount Due and Accrued
Rate and Accrued December 31,Used December 31 Gross Increase Current Year, Effec-
to of Current Amount Increase (Decrease) on Bonds in tiveCUSIP Option Obtain Year on Received (Decrease) by Foreign Default as to NAIC RateIdentifi- Rate How Maturity Option Call Book/Adjusted Fair Fair Bonds not During by Exchange Principal or Desig- Date ofcation Description * of Paid Date Date Price Carrying Value Par Value Value Value Actual Cost in Default Year Adjustment Adjustment Interest nation Acquired Interest
New York............................................................................................................................................................................. .........37,710,706 .........38,220,000 ....XXX...... .........40,677,547 .........37,244,523 .........601,342 ......2,095,743 .........165,781 ....................0 ...................0 .XXX .....XXX..... ....XXX..... North Carolina266777-Z2-0.. DURHAM NC GENERAL OBLIGATION............................ ........ .......5.400 MS... 03/01/2015 .................. ............ ................99,119 ..............100,000 ..111.2700 ..............111,270 ................98,986 .............1,800 .............5,400 ..................50 ....................0 ...................0 ..1PE 03/10/2000 .......5.500
North Carolina..................................................................................................................................................................... ................99,119 ..............100,000 ....XXX...... ..............111,270 ................98,986 .............1,800 .............5,400 ..................50 ....................0 ...................0 .XXX .....XXX..... ....XXX..... Tennessee499512-WF-4. KNOX COUNTY TENN GO............................................... ........ .......5.375 AO.... 04/01/2013 .................. ............ ..............978,784 ...........1,000,000 ..103.0100 ...........1,030,100 ..............970,210 ...........13,438 ...........53,750 .............1,493 ....................0 ...................0 ..1PE 03/27/1996 .......5.650
Tennessee........................................................................................................................................................................... ..............978,784 ...........1,000,000 ....XXX...... ...........1,030,100 ..............970,210 ...........13,438 ...........53,750 .............1,493 ....................0 ...................0 .XXX .....XXX..... ....XXX..... Texas366155-HU-6. GARLAND TX INDPT SCH DIST SER A PSF.................. ........ .......5.000 FA.... 02/15/2013 .................. ............ ...........2,176,221 ...........2,215,000 ..104.2020 ...........2,308,074 ...........2,162,881 ...........41,839 .........110,750 .............2,844 ....................0 ...................0 ..1PE 09/12/1997 .......5.220414152-LL-0... HARRIS CNTY TX HEALTH FACL DEV TEXAS CHILDRENS HOSP 95 ETM........ .......5.500 AO01 10/01/2013 .................. ............ ...........1,992,154 ...........2,000,000 ..111.2190 ...........2,224,380 ...........1,988,660 ...........27,500 .........110,000 ................591 ....................0 ...................0 ......1 01/31/1996 .......5.550414003-E5-8.. HARRIS CNTY TX ROAD AND REFUNDING SER 1993. ........ .......5.125 AO.... 10/01/2010 .................. ............ ...........2,539,764 ...........2,560,000 ..103.4270 ...........2,647,731 ...........2,524,416 ...........32,800 .........131,200 .............2,068 ....................0 ...................0 ..1PE 12/09/1993 .......5.250486062-2B-7.. KATY TX IND SCH DIST GEN OBLIG RFDG 2002A PSF ........ .......5.000 FA.... 02/15/2024 .................. ............ ...........1,998,002 ...........2,000,000 ..100.8170 ...........2,016,340 ...........1,998,000 ...........16,667 ....................0 ....................2 ....................0 ...................0 ..1PE 12/13/2002 .......5.010796253-KF-8.. SAN ANTONIO TEX ELEC & GAS PREREFUNDED....... ........ .......5.000 FA.... 02/01/2010 02/01/2004 102.000 ................24,961 ................25,000 ..106.0510 ................26,513 ................23,285 ................521 .............1,250 ................464 ....................0 ...................0 ......1 01/04/1999 .......6.960796253-TF-9.. SAN ANTONIO TEX ELEC & GAS PREREFUNDED....... ........ .......5.000 FA.... 02/01/2010 02/01/2004 102.000 ..............326,897 ..............340,000 ..106.0400 ..............360,536 ..............323,004 .............7,083 ....................0 .............3,892 ....................0 ...................0 ......1 10/09/2002 .....10.660
Texas................................................................................................................................................................................... ...........9,057,998 ...........9,140,000 ....XXX...... ...........9,583,574 ...........9,020,246 .........126,410 .........353,200 .............9,862 ....................0 ...................0 .XXX .....XXX..... ....XXX..... Wisconsin977123-JP-4.. WISCONSIN TRANSPORTATION REV SER 1996A FGIC PREREFUNDED........ .......5.500 JJ..... 07/01/2009 07/01/2006 100.000 ...........3,010,942 ...........3,030,000 ..111.7740 ...........3,386,752 ...........2,994,731 ...........83,325 .........166,650 .............4,245 ....................0 ...................0 ......1 06/04/1996 .......5.700
Wisconsin............................................................................................................................................................................ ...........3,010,942 ...........3,030,000 ....XXX...... ...........3,386,752 ...........2,994,731 ...........83,325 .........166,650 .............4,245 ....................0 ...................0 .XXX .....XXX..... ....XXX.....Total States and US............................................................................................................................................................ .......129,151,165 .......141,830,000 ....XXX...... .......139,095,736 .......126,749,880 ......1,885,012 ......5,856,780 ......1,079,001 ....................0 ...................0 .XXX .....XXX..... ....XXX.....
1899999. Political Subdivisions of States, Territories & Possessions - Issuer Obligations............................................................... .......129,151,165 .......141,830,000 ....XXX...... .......139,095,736 .......126,749,880 ......1,885,012 ......5,856,780 ......1,079,001 ....................0 ...................0 .XXX .....XXX..... ....XXX.....2499999. Total - Political Subdivisions of States, Territories & Possessions (Direct and Guaranteed)............................................. .......129,151,165 .......141,830,000 ....XXX...... .......139,095,736 .......126,749,880 ......1,885,012 ......5,856,780 ......1,079,001 ....................0 ...................0 .XXX .....XXX..... ....XXX.....
Special Revenue & Special Assessment Obligations and all Non-Guaranteed Obligations of Agencies and Authorities of Governments and Their Political Subdivisions - Issuer Obligations Arizona79575D-GS-3. SALT RIVER PROJECT AGRIC IMPT & PWR DIST ELEC SYS REV-REF-SER C........ .......5.000 JJ01. 01/01/2013 .................. ............ ...........3,756,428 ...........4,000,000 ..103.5520 ...........4,142,080 ...........3,650,400 .........100,000 .........200,000 ...........18,563 ....................0 ...................0 ..1PE 04/18/1996 .......5.840
Arizona................................................................................................................................................................................ ...........3,756,428 ...........4,000,000 ....XXX...... ...........4,142,080 ...........3,650,400 .........100,000 .........200,000 ...........18,563 ....................0 ...................0 .XXX .....XXX..... ....XXX..... California68428N-AH-3. ORANGE CNTY CA RECOVERY CERTS OF PARTICIPATION 1996A MBIA........ .......5.200 JJ..... 07/01/2004 .................. ............ ...........2,995,701 ...........3,000,000 ..105.8440 ...........3,175,320 ...........2,980,420 ...........78,000 .........156,000 .............2,684 ....................0 ...................0 ..1PE 06/06/1996 .......5.300786005-AL-2.. SACRAMENTO CA MUN UTIL DIST ELEC REV RFDG 1997L AMBAC........ .......5.200 JJ..... 07/01/2016 .................. ............ ...........3,943,141 ...........4,000,000 ..107.2880 ...........4,291,520 ...........3,930,000 .........104,000 .........208,000 .............2,813 ....................0 ...................0 ..1PE 10/14/1997 .......5.350786004-2X-8.. SACRAMENTO CA MUN UTIL DIST ELEC REV RFDG SER 1993D FSA........ .......5.300 MN... 11/15/2005 .................. ............ ...........2,906,595 ...........3,000,000 ..105.5320 ...........3,165,960 ...........2,722,950 ...........20,317 .........159,000 ...........28,710 ....................0 ...................0 ..1PE 01/13/1995 .......6.510
California............................................................................................................................................................................. ...........9,845,437 .........10,000,000 ....XXX...... .........10,632,800 ...........9,633,370 .........202,317 .........523,000 ...........34,207 ....................0 ...................0 .XXX .....XXX..... ....XXX..... Florida696550-CS-9.. PALM BEACH CNTY FL SCHOOL BD CERTS OF PART 97A MBIA........ .......5.150 FA.... 08/01/2013 .................. ............ ...........3,664,946 ...........3,680,000 ..106.3280 ...........3,912,870 ...........3,660,018 ...........78,967 .........189,520 .............1,044 ....................0 ...................0 ..1PE 09/19/1997 .......5.200
Florida................................................................................................................................................................................. ...........3,664,946 ...........3,680,000 ....XXX...... ...........3,912,870 ...........3,660,018 ...........78,967 .........189,520 .............1,044 ....................0 ...................0 .XXX .....XXX..... ....XXX..... Louisiana605468-BA-4.. MISSISSIPPI RIVER BRIDGE AUTH LA REV RFDG 2002 MBIA........ .......5.000 MN... 11/01/2012 .................. ............ ...........1,471,623 ...........1,325,000 ..110.7530 ...........1,467,477 ...........1,472,592 .............5,153 ....................0 ...............(969) ....................0 ...................0 ..1PE 11/15/2002 .......3.650295852-AT-4.. NEW ORLEANS LA EXHIB ATHY SPEC TAX ERNEST MORIAL 96C MBIA........ .......5.300 JJ..... 07/15/2012 07/15/2007 100.000 ...........4,055,698 ...........4,000,000 ..107.7370 ...........4,309,480 ...........4,077,400 ...........97,756 .........212,000 ..........(10,696) ....................0 ...................0 ..1PE 12/01/2000 .......4.950295852-AU-1.. NEW ORLEANS LA EXHIB ATHY SPEC TAX ERNEST MORIAL 96C MBIA........ .......5.400 JJ..... 07/15/2013 07/15/2007 100.000 ...........6,233,109 ...........6,160,000 ..108.0330 ...........6,654,833 ...........6,261,455 .........153,384 .........332,640 ..........(13,982) ....................0 ...................0 ..1PE 12/01/2000 .......5.100295852-BH-9.. NEW ORLEANS LA EXHIB ATHY SPEC TAX ERNEST MORIAL 96C MBIA........ .......5.400 JJ..... 07/15/2014 07/15/2007 100.000 ...........6,553,960 ...........6,490,000 ..107.7900 ...........6,995,571 ...........6,578,718 .........161,601 .........350,460 ..........(12,215) ....................0 ...................0 ..1PE 12/01/2000 .......5.150647719-JS-3.. NEW ORLEANS LA SEWERAGE SVC REV 2002 MBIA. ........ .......5.000 JD.... 06/01/2019 06/01/2013 100.000 ...........3,985,828 ...........3,850,000 ..104.4110 ...........4,019,824 ...........3,985,828 ...........16,042 ....................0 ....................0 ....................0 ...................0 ..1PE 12/19/2002 .......4.570926520-AA-5.. VIDALIA LA REV RFDG SER 1995 ALUMINUM CO AMERICA........ .......5.875 MS... 09/01/2013 09/01/2005 102.000 ...........5,289,675 ...........4,900,000 ..108.9070 ...........5,336,443 ...........5,307,043 ...........95,958 ....................0 ..........(17,368) ....................0 ...................0 ..1PE 11/01/2002 .......3.450
Louisiana............................................................................................................................................................................. .........27,589,894 .........26,725,000 ....XXX...... .........28,783,628 .........27,683,036 .........529,893 .........895,100 ..........(55,229) ....................0 ...................0 .XXX .....XXX..... ....XXX..... Massachusetts576004-AY-1.. MASSACHUSETTS SPECIAL OBLIGATION REV 1994 SER A_PREREFUNDED........ .......5.400 JD.... 06/01/2006 06/01/2004 101.000 ...........6,785,000 ...........6,785,000 ..106.5020 ...........7,226,161 ...........6,755,214 ...........30,533 .........366,390 ...........13,301 ....................0 ...................0 ......1 06/09/1994 .......5.950
Massachusetts.................................................................................................................................................................... ...........6,785,000 ...........6,785,000 ....XXX...... ...........7,226,161 ...........6,755,214 ...........30,533 .........366,390 ...........13,301 ....................0 ...................0 .XXX .....XXX..... ....XXX..... Mississippi186252-A*-3... CLEVELAND MS POLLUTION CONTROL REV 78 TRAVENOL LABS........ .......6.100 JJ..... 07/01/2008 .................. ............ ...........2,310,000 ...........2,310,000 ..100.0000 ...........2,310,000 ...........2,310,000 ...........70,455 .........141,215 ....................0 ....................0 ...................0 ..1PE 11/01/1996 .......6.100605629-AL-8.. WILKINSON CNTY MS IND DEV ATY CERT PART MS DEPT CORR 96A MBIA........ .......5.400 FA01 08/01/2011 .................. ............ ...........8,264,344 ...........8,290,000 ..108.2990 ...........8,977,987 ...........8,248,053 .........186,525 .........447,660 .............3,132 ....................0 ...................0 ..1PE 12/06/1996 .......5.460
Mississippi........................................................................................................................................................................... .........10,574,344 .........10,600,000 ....XXX...... .........11,287,987 .........10,558,053 .........256,980 .........588,875 .............3,132 ....................0 ...................0 .XXX .....XXX..... ....XXX..... New Jersey132813-EP-7.. CAMDEN CNTY NJ MUN UTIL ATHY SEW REV RFDG 1996 FGIC........ .......5.000 JJ..... 07/15/2009 .................. ............ ..............399,430 ..............400,000 ..108.0580 ..............432,232 ..............399,000 .............9,222 ...........20,000 ..................72 ....................0 ...................0 ..1PE 02/09/1996 .......5.030
New Jersey.......................................................................................................................................................................... ..............399,430 ..............400,000 ....XXX...... ..............432,232 ..............399,000 .............9,222 ...........20,000 ..................72 ....................0 ...................0 .XXX .....XXX..... ....XXX..... New York592597-U8-9.. METROPOLITAN TRANS ATHY NY SVC CONTRACT RFDG 2002A........ .......5.250 JJ..... 01/01/2023 .................. ............ ...........3,647,006 ...........3,665,000 ..104.0450 ...........3,813,249 ...........3,646,748 ...........98,344 ....................0 ................257 ....................0 ...................0 ..1PE 06/05/2002 .......5.290

Annual Statement for the year 2002 of the TWIN CITY FIRE INSURANCE COMPANY
E08.3
SCHEDULE D - PART 1Showing all Long-Term BONDS Owned December 31 of Current Year
1 2 3 Interest 6 7 8 9 10 11 12 13 Interest 16 17 18 19 20 214 5 14 15 Amount of
Interest DueAmount Due and Accrued
Rate and Accrued December 31,Used December 31 Gross Increase Current Year, Effec-
to of Current Amount Increase (Decrease) on Bonds in tiveCUSIP Option Obtain Year on Received (Decrease) by Foreign Default as to NAIC RateIdentifi- Rate How Maturity Option Call Book/Adjusted Fair Fair Bonds not During by Exchange Principal or Desig- Date ofcation Description * of Paid Date Date Price Carrying Value Par Value Value Value Actual Cost in Default Year Adjustment Adjustment Interest nation Acquired Interest
New York............................................................................................................................................................................. ...........3,647,006 ...........3,665,000 ....XXX...... ...........3,813,249 ...........3,646,748 ...........98,344 ....................0 ................257 ....................0 ...................0 .XXX .....XXX..... ....XXX..... North Carolina312805-BV-5.. FAYETTEVILLE NC PUBLIC WORKS COMM RFDG REV FGIC........ .......4.750 MS01 03/01/2014 .................. ............ ................91,940 ..............100,000 ..100.1490 ..............100,149 ................88,888 .............1,583 .............4,750 ................546 ....................0 ...................0 ..1PE 03/12/1996 .......5.790658196-TJ-9.. NORTH CAROLINA EASTERN MUNI PWR AGCY SYS REV 93D........ .......5.875 JJ..... 01/01/2014 .................. ............ ..............750,000 ..............750,000 ..102.7120 ..............770,340 ..............750,000 ...........22,031 ...........44,063 ....................0 ....................0 ...................0 ..2PE 04/20/2001 .......5.880
North Carolina..................................................................................................................................................................... ..............841,940 ..............850,000 ....XXX...... ..............870,489 ..............838,888 ...........23,615 ...........48,813 ................546 ....................0 ...................0 .XXX .....XXX..... ....XXX..... Oklahoma899652-DB-4.. TULSA OK IND DEV ATHY HOSP REV & RFDG ST JOHN MED CNTR 1996........ .......5.375 FA.... 02/15/2011 .................. ............ ..............493,680 ..............500,000 ..105.1910 ..............525,955 ..............490,185 ...........10,153 ...........26,875 ................601 ....................0 ...................0 ..1PE 03/07/1996 .......5.570
Oklahoma............................................................................................................................................................................ ..............493,680 ..............500,000 ....XXX...... ..............525,955 ..............490,185 ...........10,153 ...........26,875 ................601 ....................0 ...................0 .XXX .....XXX..... ....XXX..... Pennsylvania709144-DD-8. PENNSYLVANIA CERTIFICATES OF PARTICIPATION 1993A AMBAC........ .......5.400 JJ..... 07/01/2009 .................. ............ ...........2,983,011 ...........3,000,000 ..103.8070 ...........3,114,210 ...........2,970,000 ...........81,000 .........162,000 .............2,121 ....................0 ...................0 ..1PE 10/10/1995 .......5.500709193-HF-6.. PENNSYLVANIA INDUSTRIAL DEV ATHY ECON DEV REV 1994 AMBAC........ .......7.000 JJ..... 01/01/2007 .................. ............ ...........2,089,098 ...........2,000,000 ..117.7200 ...........2,354,400 ...........2,227,500 ...........70,000 .........140,000 ..........(19,298) ....................0 ...................0 ..1PE 04/28/1994 .......5.740
Pennsylvania....................................................................................................................................................................... ...........5,072,108 ...........5,000,000 ....XXX...... ...........5,468,610 ...........5,197,500 .........151,000 .........302,000 ..........(17,177) ....................0 ...................0 .XXX .....XXX..... ....XXX..... South Carolina396080-DR-1. GREENVILLE HOSPITAL SYS SC HOSP REV 1996A.... ........ .......5.700 MN... 05/01/2012 .................. ............ ...........2,267,236 ...........2,300,000 ..106.3700 ...........2,446,510 ...........2,252,459 ...........21,850 .........131,100 .............2,569 ....................0 ...................0 ..1PE 03/15/1996 .......5.900
South Carolina..................................................................................................................................................................... ...........2,267,236 ...........2,300,000 ....XXX...... ...........2,446,510 ...........2,252,459 ...........21,850 .........131,100 .............2,569 ....................0 ...................0 .XXX .....XXX..... ....XXX..... Texas442436-YY-1.. HOUSTON TX WATER & SEWER SYS REV RFDG JR LIEN 97D FGIC........ .......5.300 JD.... 12/01/2016 .................. ............ ...........4,975,378 ...........5,000,000 ..107.8590 ...........5,392,950 ...........4,969,900 ...........22,083 .........265,000 .............1,167 ....................0 ...................0 ..1PE 09/23/1997 .......5.350658546-PY-6.. NORTH CENTRAL TX HEALTH FACL DEV CRP HOSP REV BAYLOR HEALTH........ .......5.500 MN... 05/15/2014 .................. ............ ...........2,945,166 ...........3,000,000 ..105.3470 ...........3,160,410 ...........2,925,420 ...........21,083 .........165,000 .............3,345 ....................0 ...................0 ..1PE 12/19/1995 .......5.720796253-TX-0.. SAN ANTONIO TEX ELEC & GAS UNREFUNDED......... ........ .......5.000 FA.... 02/01/2010 .................. ............ ...........3,457,863 ...........3,635,000 ..104.0350 ...........3,781,672 ...........3,336,130 ...........75,729 .........181,757 ...........19,678 ....................0 ...................0 ..1PE 08/08/1995 .......5.850882854-CK-6.. TEXAS WATER DEV BD REVOLVING FD SR LIEN REV SER 1996A........ .......5.750 JJ..... 07/15/2015 .................. ............ ...........2,973,349 ...........3,000,000 ..110.6510 ...........3,319,530 ...........2,965,290 ...........79,542 .........172,500 .............1,408 ....................0 ...................0 ..1PE 03/20/1996 .......5.850
Texas................................................................................................................................................................................... .........14,351,756 .........14,635,000 ....XXX...... .........15,654,562 .........14,196,740 .........198,438 .........784,257 ...........25,597 ....................0 ...................0 .XXX .....XXX..... ....XXX..... Virginia927793-BT-5.. VIRGINIA TRANS BD REV RT 58 CORR SER C............. ........ .......5.125 MN... 05/15/2017 .................. ............ ...........4,878,242 ...........5,000,000 ..105.4990 ...........5,274,950 ...........4,852,600 ...........32,743 .........256,250 .............5,505 ....................0 ...................0 ..1PE 10/15/1997 .......5.370
Virginia................................................................................................................................................................................ ...........4,878,242 ...........5,000,000 ....XXX...... ...........5,274,950 ...........4,852,600 ...........32,743 .........256,250 .............5,505 ....................0 ...................0 .XXX .....XXX..... ....XXX..... Washington939827-UC-3. WASHINGTON PUBLIC POWER NUCLEAR PROJ #1 REV SER 93C RFDG........ .......5.375 JJ01. 07/01/2015 .................. ............ ...........2,818,666 ...........3,000,000 ..103.0640 ...........3,091,920 ...........2,752,620 ...........80,625 .........161,250 ...........11,036 ....................0 ...................0 ..1PE 11/01/1995 .......6.130939827-WE-7. WASHINGTON PUBLIC POWER NUCLEAR PROJ #1 RFDG REV 96A AMBAC........ .......5.700 JJ..... 07/01/2009 .................. ............ ...........3,978,332 ...........4,000,000 ..111.9880 ...........4,479,520 ...........3,963,840 .........114,000 .........228,000 .............2,675 ....................0 ...................0 ..1PE 09/12/1996 .......5.800
Washington......................................................................................................................................................................... ...........6,796,998 ...........7,000,000 ....XXX...... ...........7,571,440 ...........6,716,460 .........194,625 .........389,250 ...........13,711 ....................0 ...................0 .XXX .....XXX..... ....XXX..... West Virginia956540-KY-3.. WEST VIRGINIA SCH BLDG ATHY CAP IMP RFDG REV 97B FSA........ .......5.400 JJ..... 07/01/2017 07/01/2009 100.000 ...........8,509,031 ...........8,280,000 ..107.2890 ...........8,883,529 ...........8,539,164 .........223,560 .........447,120 ..........(29,270) ....................0 ...................0 ..1PE 12/20/2001 .......4.900
West Virginia....................................................................................................................................................................... ...........8,509,031 ...........8,280,000 ....XXX...... ...........8,883,529 ...........8,539,164 .........223,560 .........447,120 ..........(29,270) ....................0 ...................0 .XXX .....XXX..... ....XXX.....Total States and US............................................................................................................................................................ .......109,473,478 .......109,420,000 ....XXX...... .......116,927,052 .......109,069,835 ......2,162,238 ......5,168,549 ...........17,428 ....................0 ...................0 .XXX .....XXX..... ....XXX.....
2599999. Special Revenue & Assessment Obligations - Issuer Obligations..................................................................................... .......109,473,478 .......109,420,000 ....XXX...... .......116,927,052 .......109,069,835 ......2,162,238 ......5,168,549 ...........17,428 ....................0 ...................0 .XXX .....XXX..... ....XXX.....Special Revenue & Special Assessment Obligations and all Non-Guaranteed Obligations of Agencies and Authorities of Governments and Their Political Subdivisions - Single Class Mortgage-Backed/Asset-Backed Securities United States31368H-YA-5. FNMA................................................................................. ........ .......6.500 MTLY 03/01/2009 .................. ............ ..............853,232 ..............848,057 ......0.0000 ..............853,232 ..............858,317 .............4,594 ...........53,087 ............(1,095) ....................0 ...................0 ......1 12/14/1994 .......6.19031385E-WQ-8 FNMA................................................................................. ........ .......7.500 MTLY 07/01/2015 .................. ............ ..............810,126 ..............811,963 ......0.0000 ..............810,126 ..............810,187 .............5,075 ...........57,334 ................161 ....................0 ...................0 ......1 07/25/2000 .......7.60031391N-ES-6. FNMA................................................................................. ........ .......6.000 MTLY 11/01/2032 .................. ............ ...........2,825,135 ...........2,772,083 ......0.0000 ...........2,825,135 ...........2,826,225 ...........13,860 ...........13,860 ............(1,090) ....................0 ...................0 ......1 10/16/2002 .......5.570
U.S....................................................................................................................................................................................... ...........4,488,493 ...........4,432,103 ....XXX...... ...........4,488,493 ...........4,494,729 ...........23,529 .........124,281 ............(2,024) ....................0 ...................0 .XXX .....XXX..... ....XXX.....Total States and US............................................................................................................................................................ ...........4,488,493 ...........4,432,103 ....XXX...... ...........4,488,493 ...........4,494,729 ...........23,529 .........124,281 ............(2,024) ....................0 ...................0 .XXX .....XXX..... ....XXX.....
2699999. Special Revenue & Assessment Obligations - Single Class Mtg.-Backed/Asset-Backed Securities................................ ...........4,488,493 ...........4,432,103 ....XXX...... ...........4,488,493 ...........4,494,729 ...........23,529 .........124,281 ............(2,024) ....................0 ...................0 .XXX .....XXX..... ....XXX.....3199999. Total - Special Revenue & Special Assessment Obligations............................................................................................. .......113,961,970 .......113,852,103 ....XXX...... .......121,415,545 .......113,564,564 ......2,185,767 ......5,292,830 ...........15,403 ....................0 ...................0 .XXX .....XXX..... ....XXX.....
Public Utilities (Unaffiliated) - Issuer Obligations United States75953G-AC-7. RELIANT ENERGY INC (HOUSTON INDUSTRIES INC) ........ .......7.750 FA.... 02/15/2011 .................. ............ ...........4,205,500 ...........5,000,000 ....84.1100 ...........4,205,500 ...........4,983,700 .........146,389 .........387,500 ........(779,568) ....................0 ...................0 ......3 02/15/2001 .......7.800
United States....................................................................................................................................................................... ...........4,205,500 ...........5,000,000 ....XXX...... ...........4,205,500 ...........4,983,700 .........146,389 .........387,500 ........(779,568) ....................0 ...................0 .XXX .....XXX..... ....XXX.....3299999. Public Utilities (Unaffiliated) - Issuer Obligations................................................................................................................ ...........4,205,500 ...........5,000,000 ....XXX...... ...........4,205,500 ...........4,983,700 .........146,389 .........387,500 ........(779,568) ....................0 ...................0 .XXX .....XXX..... ....XXX.....3899999. Total - Public Utilities (Unaffiliated)..................................................................................................................................... ...........4,205,500 ...........5,000,000 ....XXX...... ...........4,205,500 ...........4,983,700 .........146,389 .........387,500 ........(779,568) ....................0 ...................0 .XXX .....XXX..... ....XXX.....
Industrial & Miscellaneous (Unaffiliated) - Issuer Obligations United States00209T-AA-3. AT&T BROADBAND.......................................................... ........ .......8.375 MS... 03/15/2013 .................. ............ ...........2,853,969 ...........3,170,000 ..113.0000 ...........3,582,100 ...........2,779,546 ...........31,711 ....................0 ............(1,774) ....................0 ...................0 ......2 10/20/2000 .......8.070001957-AV-1.. AT&T CORP...................................................................... ........ .......6.000 MS... 03/15/2009 .................. ............ ..............282,951 ..............315,000 ....98.8750 ..............311,456 ..............274,941 .............5,565 ...........18,900 .............3,841 ....................0 ...................0 ......2 10/20/2000 .......8.120

Annual Statement for the year 2002 of the TWIN CITY FIRE INSURANCE COMPANY
E08.4
SCHEDULE D - PART 1Showing all Long-Term BONDS Owned December 31 of Current Year
1 2 3 Interest 6 7 8 9 10 11 12 13 Interest 16 17 18 19 20 214 5 14 15 Amount of
Interest DueAmount Due and Accrued
Rate and Accrued December 31,Used December 31 Gross Increase Current Year, Effec-
to of Current Amount Increase (Decrease) on Bonds in tiveCUSIP Option Obtain Year on Received (Decrease) by Foreign Default as to NAIC RateIdentifi- Rate How Maturity Option Call Book/Adjusted Fair Fair Bonds not During by Exchange Principal or Desig- Date ofcation Description * of Paid Date Date Price Carrying Value Par Value Value Value Actual Cost in Default Year Adjustment Adjustment Interest nation Acquired Interest
001957-BJ-7.. AT&T CORP...................................................................... ........ .......6.500 MS... 03/15/2029 .................. ............ ...........2,769,695 ...........3,500,000 ..100.3130 ...........3,510,945 ...........2,754,115 ...........66,986 .........227,500 .............7,425 ....................0 ...................0 ..2PE 10/13/2000 .......8.500055450-AE-0.. BHP FINANCE USA LTD................................................... ........ .......6.750 MN... 11/01/2013 .................. ............ ..............201,030 ..............208,000 ..115.6250 ..............240,501 ..............200,256 .............2,340 ...........14,040 ................223 ....................0 ...................0 ..1PE 01/22/2001 .......7.200205363-AE-4.. COMPUTER SCIENCES CORP........................................ ........ .......7.375 JD.... 06/15/2011 .................. ............ ...........3,973,761 ...........4,000,000 ..114.6310 ...........4,585,240 ...........3,970,480 ...........13,111 .........295,000 .............1,729 ....................0 ...................0 ......1 06/08/2001 .......7.480224044-AX-5.. COX COMMUNICATIONS INC-CONVERT....................... ........ .......0.426 AO.... 04/19/2020 .................. ............ ..............891,606 ...........2,000,000 ....45.5000 ..............910,000 ..............832,500 .............1,704 .............8,518 ...........38,024 ....................0 ...................0 ......2 06/26/2001 .......5.390459200-AZ-4.. IBM CORP......................................................................... ........ .......4.250 MS... 09/15/2009 .................. ............ ...........4,959,115 ...........5,000,000 ..102.1060 ...........5,105,300 ...........4,957,500 ...........65,521 ....................0 .............1,615 ....................0 ...................0 ......1 09/05/2002 .......4.390530715-AJ-0.. LIBERTY MEDIA GROUP................................................. ........ .......8.250 FA.... 02/01/2030 .................. ............ ..............895,075 ...........1,000,000 ..105.1730 ...........1,051,730 ..............893,380 ...........34,375 ...........82,500 ................847 ....................0 ...................0 ......2 11/20/2000 .......9.320574599-AU-0.. MASCO CORP................................................................... ........ .......6.750 MS... 03/15/2006 .................. ............ ..............998,637 ...........1,000,000 ..107.9690 ...........1,079,690 ..............997,990 ...........19,875 ...........67,500 ................330 ....................0 ...................0 ......2 03/08/2001 .......6.800552953-AB-7.. MGM GRAND INC............................................................. ........ .......6.875 FA.... 02/06/2008 .................. ............ ................97,797 ..............100,000 ..102.2300 ..............102,230 ................96,423 .............2,769 .............6,875 ................344 ....................0 ...................0 ......3 06/23/1998 .......7.400
United States....................................................................................................................................................................... .........17,923,637 .........20,293,000 ....XXX...... .........20,479,191 .........17,757,131 .........243,957 .........720,833 ...........52,604 ....................0 ...................0 .XXX .....XXX..... ....XXX..... Foreign350259-AA-5.. FOSTER BREWING GROUP LTD.................................... ........ .......6.875 JD.... 06/15/2011 .................. ............ ..............499,176 ..............500,000 ..113.8130 ..............569,065 ..............499,070 .............1,528 ...........34,375 ..................57 ....................0 ...................0 ......2 06/12/2001 .......6.900002920-AB-2.. ABBEY NATIONAL PLC.................................................... ........ .......6.700 JD.... 06/29/2049 06/15/2008 100.000 ...........3,239,111 ...........3,000,000 ..106.8650 ...........3,205,950 ...........3,244,170 .............8,933 .........100,500 ............(5,059) ....................0 ...................0 ......1 11/07/2002 .......5.010411352-AA-5.. HANSON PLC.................................................................... ........ .......7.875 MS... 09/27/2010 .................. ............ ...........1,113,500 ...........1,000,000 ..113.5860 ...........1,135,859 ...........1,118,230 ...........20,563 ...........39,375 ............(4,730) ....................0 ...................0 ..2PE 07/30/2002 .......6.020
Foreign................................................................................................................................................................................ ...........4,851,787 ...........4,500,000 ....XXX...... ...........4,910,874 ...........4,861,470 ...........31,024 .........174,250 ............(9,732) ....................0 ...................0 .XXX .....XXX..... ....XXX.....3999999. Industrial & Miscellaneous (Unaffiliated) - Issuer Obligations............................................................................................. .........22,775,424 .........24,793,000 ....XXX...... .........25,390,065 .........22,618,601 .........274,980 .........895,083 ...........42,873 ....................0 ...................0 .XXX .....XXX..... ....XXX.....
Industrial & Miscellaneous (Unaffiliated) - Other Multi-Class Commercial Mortgage-Backed/Asset-Backed Securities United States130335-AW-2. CALIF INFRA & ECON DEV BANK SDG&E SER 1997-1 CL A6........ .......6.310 MJSD 09/25/2008 09/25/2006 100.000 ...........2,787,826 ...........2,750,000 ......0.0000 ...........2,787,826 ...........2,813,594 .............2,892 .........173,525 ..........(15,236) ....................0 ...................0 ......1 03/30/2001 .......5.660
United States....................................................................................................................................................................... ...........2,787,826 ...........2,750,000 ....XXX...... ...........2,787,826 ...........2,813,594 .............2,892 .........173,525 ..........(15,236) ....................0 ...................0 .XXX .....XXX..... ....XXX.....4499999. Industrial & Miscellaneous - Other Multi-Class Commercial Mtg.-Backed/Asset Backed Securities................................. ...........2,787,826 ...........2,750,000 ....XXX...... ...........2,787,826 ...........2,813,594 .............2,892 .........173,525 ..........(15,236) ....................0 ...................0 .XXX .....XXX..... ....XXX.....4599999. Total - Industrial & Miscellaneous (Unaffiliated).................................................................................................................. .........25,563,250 .........27,543,000 ....XXX...... .........28,177,891 .........25,432,195 .........277,872 ......1,068,608 ...........27,637 ....................0 ...................0 .XXX .....XXX..... ....XXX.....
Totals5499999. Total - Issuer Obligations.................................................................................................................................................... .......349,790,898 .......365,408,000 ....XXX...... .......374,850,948 .......347,141,903 ......5,723,261 ....15,589,675 .........389,105 ....................0 ...................0 .XXX .....XXX..... ....XXX.....5599999. Total - Single Class Mortgage-Backed/Asset-Backed Securities....................................................................................... .........11,009,629 .........10,817,417 ....XXX...... .........11,009,629 .........11,036,328 ...........59,797 .........381,289 ..........(22,487) ....................0 ...................0 .XXX .....XXX..... ....XXX.....5999999. Total - Other Multi-Class Commercial Mortgage-Backed/Asset-Backed Securities........................................................... ...........2,787,826 ...........2,750,000 ....XXX...... ...........2,787,826 ...........2,813,594 .............2,892 .........173,525 ..........(15,236) ....................0 ...................0 .XXX .....XXX..... ....XXX.....6099999. Grand Total - Bonds............................................................................................................................................................ .......363,588,352 .......378,975,417 ....XXX...... .......388,648,403 .......360,991,824 ......5,785,950 ....16,144,490 .........351,382 ....................0 ...................0 .XXX .....XXX..... ....XXX.....
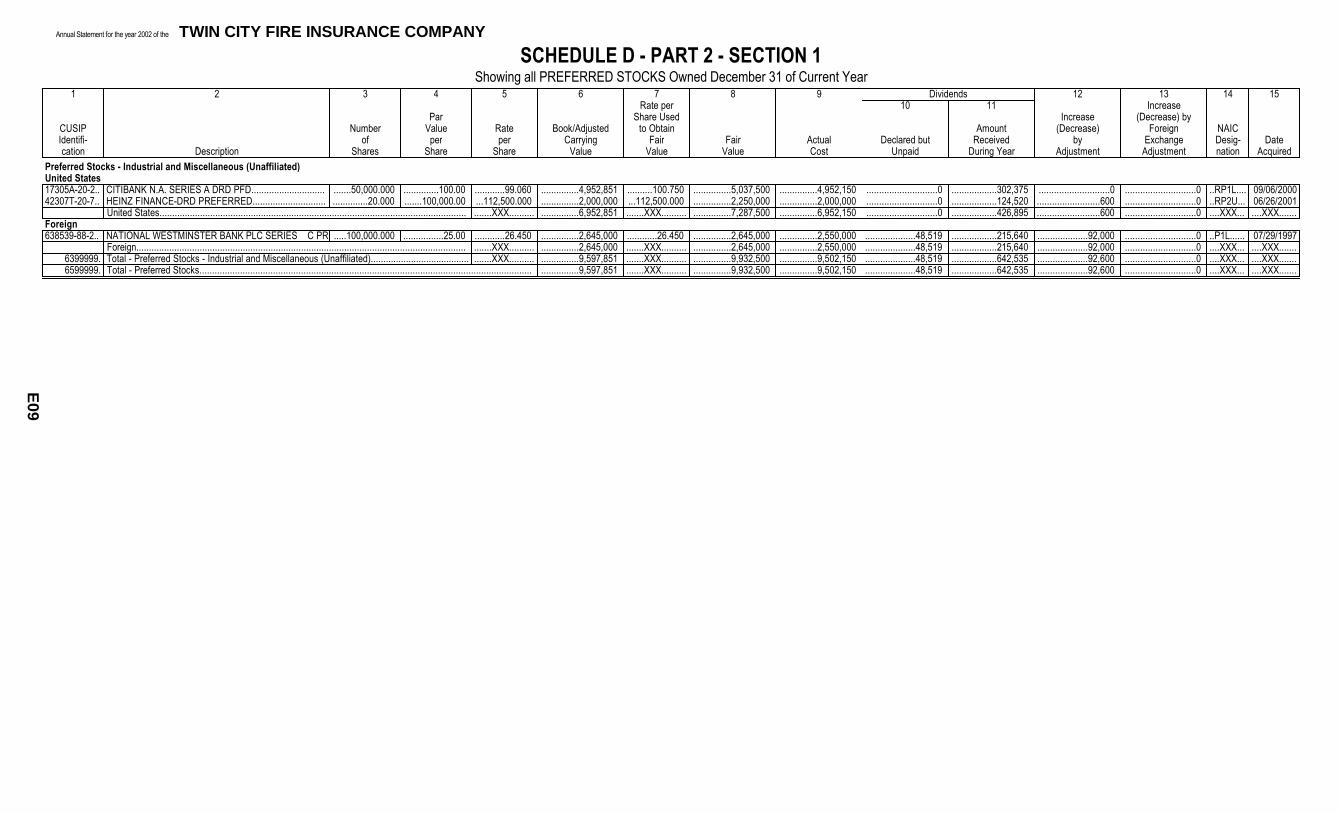
Annual Statement for the year 2002 of the TWIN CITY FIRE INSURANCE COMPANY
E09
SCHEDULE D - PART 2 - SECTION 1Showing all PREFERRED STOCKS Owned December 31 of Current Year
1 2 3 4 5 6 7 8 9 Dividends 12 13 14 15Rate per 10 11 Increase
Par Share Used Increase (Decrease) byCUSIP Number Value Rate Book/Adjusted to Obtain Amount (Decrease) Foreign NAICIdentifi- of per per Carrying Fair Fair Actual Declared but Received by Exchange Desig- Datecation Description Shares Share Share Value Value Value Cost Unpaid During Year Adjustment Adjustment nation Acquired
Preferred Stocks - Industrial and Miscellaneous (Unaffiliated)United States17305A-20-2.. CITIBANK N.A. SERIES A DRD PFD............................. .......50,000.000 ..............100.00 ............99.060 ...............4,952,851 ..........100.750 ...............5,037,500 ...............4,952,150 ............................0 ..................302,375 ............................0 ............................0 ..RP1L.... 09/06/200042307T-20-7.. HEINZ FINANCE-DRD PREFERRED............................. ..............20.000 .......100,000.00 ...112,500.000 ...............2,000,000 ...112,500.000 ...............2,250,000 ...............2,000,000 ............................0 ..................124,520 .........................600 ............................0 ..RP2U... 06/26/2001
United States......................................................................................................................... .......XXX.......... ...............6,952,851 .......XXX.......... ...............7,287,500 ...............6,952,150 ............................0 ..................426,895 .........................600 ............................0 ....XXX... ....XXX.......Foreign638539-88-2.. NATIONAL WESTMINSTER BANK PLC SERIES C PREFERRED STOCK (NOT DRD ELIGIBLE).....100,000.000 ................25.00 ............26.450 ...............2,645,000 ............26.450 ...............2,645,000 ...............2,550,000 ....................48,519 ..................215,640 ....................92,000 ............................0 ..P1L...... 07/29/1997
Foreign.................................................................................................................................. .......XXX.......... ...............2,645,000 .......XXX.......... ...............2,645,000 ...............2,550,000 ....................48,519 ..................215,640 ....................92,000 ............................0 ....XXX... ....XXX.......6399999. Total - Preferred Stocks - Industrial and Miscellaneous (Unaffiliated)....................................... .......XXX.......... ...............9,597,851 .......XXX.......... ...............9,932,500 ...............9,502,150 ....................48,519 ..................642,535 ....................92,600 ............................0 ....XXX... ....XXX.......6599999. Total - Preferred Stocks................................................................................................................................... ...............9,597,851 .......XXX.......... ...............9,932,500 ...............9,502,150 ....................48,519 ..................642,535 ....................92,600 ............................0 ....XXX... ....XXX.......

Annual Statement for the year 2002 of the TWIN CITY FIRE INSURANCE COMPANY
E10
SCHEDULE D - PART 2 - SECTION 2Showing all COMMON STOCKS Owned December 31 of Current Year
1 2 3 4 5 6 7 Dividends 10 11 12 13Rate per 8 9 Increase
Share Used Increase (Decrease)CUSIP Number Book/Adjusted to Obtain Amount (Decrease) by Foreign NAICIdentifi- of Carrying Fair Fair Actual Declared but Received by Exchange Designation Datecation Description Shares Value Value Value Cost Unpaid During Year Adjustment Adjustment (a) Acquired
Total - Preferred Stock from Section 1................................................................... ...............9,597,851 ...........XXX.............. ...............9,932,500 ...............9,502,150 ....................48,519 ..................642,535 ....................92,600 ............................0 ...........XXX........ ..........XXX.......7199999. Total - Preferred and Common Stock.................................................................... ...............9,597,851 ...........XXX.............. ...............9,932,500 ...............9,502,150 ....................48,519 ..................642,535 ....................92,600 ............................0 ...........XXX........ ..........XXX.......
(a) For all common stocks bearing the NAIC designation ''U''provide: the number of such issues...............0, the total $ value (included in Column 6) of all such issues $..............0.

Annual Statement for the year 2002 of the TWIN CITY FIRE INSURANCE COMPANY
E11
SCHEDULE D - PART 3Showing all Long-Term Bonds and Stocks ACQUIRED During Current Year
1 2 3 4 5 6 7 8Number Paid for
CUSIP Date of Shares Accrued InterestIdentification Description Acquired Name of Vendor of Stock Actual Cost Par Value and Dividends
Bonds - U.S. Government36200R-YA-4.............. GNMA 12/01/2031.......................................................................... ......06/11/2002.... UBS WARBURG LLC..................................................................... .................................................. ..................................3,310,938 ..................................3,250,000 .......................................11,14936201M-EE-8.............. GNMA 04/01/2032.......................................................................... ......04/05/2002.... GREENWICH CAPITAL MARKETS, INC........................................ .................................................. ..................................5,139,058 ..................................4,999,996 .......................................16,528912828-AC-4............... U S A TREASURY 05/15/2007........................................................ ......06/25/2002.... MIZUHO SECURITIES USA INC.................................................... .................................................. ..................................3,193,066 ..................................3,150,000 .......................................15,729
0399999. Total - Bonds - U.S. Government.................................................................................. ........................................................................................................................................................... ................................11,643,062 ................................11,399,996 .......................................43,406Bonds - States, Territories and Possessions Illinois452151-BA-0............... ILLINOIS GENERAL OBLIGATION SER JULY 2002 MBIA 07/01/2023......07/18/2002.... PAINE WEBBER JACKSON & CURTIS INC................................... .................................................. ..................................3,004,500 ..................................3,000,000 .......................................10,200
Illinois.......................................................................................................................... ........................................................................................................................................................... ..................................3,004,500 ..................................3,000,000 .......................................10,200 Louisiana546415-NN-6.............. LOUISIANA GENERAL OBLIGATION 2000A FGIC 11/15/2020....... ......11/01/2002.... PORTFOLIO TRANSFER............................................................... .................................................. ..................................5,103,000 ..................................5,000,000 .....................................115,278546415-QM-5.............. LOUISIANA GENERAL OBLIGATION 2002A FGIC 04/01/2018....... ......02/21/2002.... SALOMON SMITH BARNEY INC.................................................... .................................................. ..................................5,043,100 ..................................5,000,000 .......................................14,583546415-QR-4.............. LOUISIANA GENERAL OBLIGATION 2002A FGIC 04/01/2022....... ......02/21/2002.... SALOMON SMITH BARNEY INC.................................................... .................................................. ..................................6,955,900 ..................................7,000,000 .......................................20,417
Louisiana..................................................................................................................... ........................................................................................................................................................... ................................17,102,000 ................................17,000,000 .....................................150,278 Massachusetts57582N-CB-9.............. MASSACHUSETTS GENERAL OBLIGATION 2002B FSA 03/01/2022......03/21/2002.... GOLDMAN SACHS & CO............................................................... .................................................. ..................................4,987,500 ..................................5,000,000 ........................................9,479
Massachusetts............................................................................................................ ........................................................................................................................................................... ..................................4,987,500 ..................................5,000,000 ........................................9,479 Mississippi605579-4N-8............... MISSISSIPPI GENERAL OBLIGATION RFDG 2002A 12/01/2017.... ......01/09/2002.... SALOMON SMITH BARNEY INC.................................................... .................................................. ..................................4,271,040 ..................................4,000,000 ...............................................0
Mississippi................................................................................................................... ........................................................................................................................................................... ..................................4,271,040 ..................................4,000,000 ...............................................0 Oregon68607H-NZ-5.............. OREGON DEPT ADMIN SVCS CERT OF PART RFDG 2002B MBIA 05/01/2014......02/27/2002.... SALOMON SMITH BARNEY INC.................................................... .................................................. ..................................6,218,316 ..................................5,850,000 ........................................9,384
Oregon........................................................................................................................ ........................................................................................................................................................... ..................................6,218,316 ..................................5,850,000 ........................................9,384Total States and US..................................................................................................... ........................................................................................................................................................... ................................35,583,356 ................................34,850,000 .....................................179,341
1799999. Total - Bonds - States, Territories & Possessions.......................................................... ........................................................................................................................................................... ................................35,583,356 ................................34,850,000 .....................................179,341Bonds - Political Subdivisions of States Louisiana647634-YD-0............... NEW ORLEANS LA GENERAL OBLIGATION RFDG 1991 AMBAC 09/01/2018......06/05/2002.... MORGAN KEEGAN & CO INC........................................................ .................................................. .....................................855,900 ..................................2,000,000 ...............................................0647634-5E-0............... NEW ORLEANS LA GENERAL OBLIGATION RFDG FGIC 12/01/2021......07/26/2002.... WACHOVIA BANK OF NORTH CAROLINA N A............................. .................................................. ..................................2,198,920 ..................................2,000,000 .......................................18,333
Louisiana..................................................................................................................... ........................................................................................................................................................... ..................................3,054,820 ..................................4,000,000 .......................................18,333 Missouri467520-PN-6............... JACKSON CNTY MO SCHOOL DIST #7 GEN OBLIG RFDG 2002 FSA 03/01/2017......06/14/2002.... PIPER JAFFRAY & HOPWOOD INC.............................................. .................................................. ..................................3,802,136 ..................................3,645,000 .......................................12,758
Missouri...................................................................................................................... ........................................................................................................................................................... ..................................3,802,136 ..................................3,645,000 .......................................12,758 Texas486062-2B-7............... KATY TX IND SCH DIST GEN OBLIG RFDG 2002A PSF 02/15/2024......12/13/2002.... ABN AMRO INC............................................................................. .................................................. ..................................1,998,000 ..................................2,000,000 .......................................13,333796253-TF-9............... SAN ANTONIO TEX ELEC & GAS PREREFUNDED 02/01/2010..... ......10/09/2002.... CONVERSION................................................................................ .................................................. .....................................323,004 .....................................340,000 ........................................3,211
Texas.......................................................................................................................... ........................................................................................................................................................... ..................................2,321,004 ..................................2,340,000 .......................................16,544Total States and US..................................................................................................... ........................................................................................................................................................... ..................................9,177,960 ..................................9,985,000 .......................................47,635
2499999. Total - Bonds - Political Subdivision............................................................................... ........................................................................................................................................................... ..................................9,177,960 ..................................9,985,000 .......................................47,635Bonds - Special Revenue and Special Assessment Louisiana605468-BA-4............... MISSISSIPPI RIVER BRIDGE AUTH LA REV RFDG 2002 MBIA 11/01/2012......11/15/2002.... LEHMAN BROTHERS INC (NYC)................................................... .................................................. ..................................1,472,592 ..................................1,325,000 ...............................................0647719-JS-3............... NEW ORLEANS LA SEWERAGE SVC REV 2002 MBIA 06/01/2019 ......12/19/2002.... SALOMON SMITH BARNEY INC.................................................... .................................................. ..................................3,985,828 ..................................3,850,000 .......................................16,042926520-AA-5............... VIDALIA LA REV RFDG SER 1995 ALUMINUM CO AMERICA 09/01/2013......11/01/2002.... PORTFOLIO TRANSFER............................................................... .................................................. ..................................5,307,043 ..................................4,900,000 .......................................47,979
Louisiana..................................................................................................................... ........................................................................................................................................................... ................................10,765,463 ................................10,075,000 .......................................64,021 New York592597-U8-9............... METROPOLITAN TRANS ATHY NY SVC CONTRACT RFDG 2002A 01/01/2023......06/05/2002.... LEHMAN BROTHERS INC (NYC)................................................... .................................................. ..................................3,646,748 ..................................3,665,000 ...............................................0
New York.................................................................................................................... ........................................................................................................................................................... ..................................3,646,748 ..................................3,665,000 ...............................................0 United States31391N-ES-6.............. FNMA 11/01/2032........................................................................... ......10/16/2002.... FIRST BOSTON CORP (THE)........................................................ .................................................. ..................................2,854,688 ..................................2,800,000 ........................................6,067
U.S............................................................................................................................. ........................................................................................................................................................... ..................................2,854,688 ..................................2,800,000 ........................................6,067Total States and US..................................................................................................... ........................................................................................................................................................... ................................17,266,899 ................................16,540,000 .......................................70,088
3199999. Total - Bonds - Special Revenue & Special Assessments.............................................. ........................................................................................................................................................... ................................17,266,899 ................................16,540,000 .......................................70,088Bonds - Industrial and Miscellaneous

Annual Statement for the year 2002 of the TWIN CITY FIRE INSURANCE COMPANY
E11.1
SCHEDULE D - PART 3Showing all Long-Term Bonds and Stocks ACQUIRED During Current Year
1 2 3 4 5 6 7 8Number Paid for
CUSIP Date of Shares Accrued InterestIdentification Description Acquired Name of Vendor of Stock Actual Cost Par Value and Dividends
United States00209T-AA-3............... AT&T BROADBAND 03/15/2013..................................................... ......11/18/2002.... CONVERSION................................................................................ .................................................. ..................................2,856,172 ..................................3,170,476 ...............................................0459200-AZ-4............... IBM CORP 09/15/2009.................................................................... ......09/05/2002.... J P MORGAN SECURITIES INC..................................................... .................................................. ..................................4,957,500 ..................................5,000,000 ...............................................0
United States................................................................................................................ ........................................................................................................................................................... ..................................7,813,672 ..................................8,170,476 ...............................................0 Foreign002920-AB-2............... ABBEY NATIONAL PLC 06/29/2049................................................ ......11/07/2002.... GOLDMAN SACHS & CO............................................................... .................................................. ..................................3,244,170 ..................................3,000,000 .......................................82,633411352-AA-5............... HANSON PLC 09/27/2010.............................................................. ......07/30/2002.... J P MORGAN SECURITIES INC..................................................... .................................................. ..................................1,118,230 ..................................1,000,000 .......................................27,344
Foreign......................................................................................................................... ........................................................................................................................................................... ..................................4,362,400 ..................................4,000,000 .....................................109,9774599999. Total - Bonds - Industrial & Miscellaneous..................................................................... ........................................................................................................................................................... ................................12,176,072 ................................12,170,476 .....................................109,9776099997. Total - Bonds - Part 3.................................................................................................... ........................................................................................................................................................... ................................85,847,349 ................................84,945,472 .....................................450,4476099998. Total - Bonds - Summary Item from Part 5.................................................................... ........................................................................................................................................................... ..................................6,488,589 ..................................6,685,001 .......................................44,2506099999. Total - Bonds................................................................................................................ ........................................................................................................................................................... ................................92,335,938 ................................91,630,473 .....................................494,6977299999. Total - Bonds, Preferred and Common Stocks............................................................... ........................................................................................................................................................... ................................92,335,938 ..........................XXX................. .....................................494,697

Annual Statement for the year 2002 of the TWIN CITY FIRE INSURANCE COMPANY
E12
SCHEDULE D - PART 4Showing all Long-Term Bonds and Stocks SOLD, REDEEMED or Otherwise DISPOSED OF During Current Year
1 2 3 4 5 6 7 8 9 10 11 12 13 14 15 16Increase Foreign Interest
Book/Adjusted (Decrease) Exchange Realized Total on Bonds Dividends onCUSIP Number Carrying Value Increase by Foreign Gain Gain Gain Received StocksIdentifi- Disposal of Shares Par Actual at Disposal (Decrease) by Exchange (Loss) on (Loss) on (Loss) on During Receivedcation Description Date Name of Purchaser of Stock Consideration Value Cost Date Adjustment Adjustment Disposal Disposal Disposal Year During Year
Bonds - U.S. Government36200R-YA-4..... GNMA 12/01/2031.............................................. 12/01/2002 SCHEDULED REDEMPTION.............. .......................... ............898,862 ............898,862 ............915,716 ............898,862 ..........(16,854) ...................0 ...................0 ...................0 ...................0 ...........23,992 ......................36201M-EE-8.... GNMA 04/01/2032.............................................. 12/01/2002 SCHEDULED REDEMPTION.............. .......................... ............965,820 ............965,820 ............992,682 ............965,820 ..........(26,862) ...................0 ...................0 ...................0 ...................0 ...........38,954 ......................
0399999. Total - Bonds - U.S. Government...................................................................................................................................... .........1,864,682 .........1,864,682 .........1,908,398 .........1,864,682 ..........(43,716) ...................0 ...................0 ...................0 ...................0 ...........62,946 .......XXX........Bonds - States, Territories and Possessions Illinois452150-AP-0..... ILLINOIS GENERAL OBLIGATION FGIC 12/01/200911/01/2002 PORTFOLIO TRANSFER.................... .......................... .........5,428,550 .........5,000,000 .........4,877,650 .........4,926,853 .............6,936 ...................0 ...................0 .........501,697 .........501,697 .........234,896 ......................
Illinois............................................................................................................................................................................. .........5,428,550 .........5,000,000 .........4,877,650 .........4,926,853 .............6,936 ...................0 ...................0 .........501,697 .........501,697 .........234,896 .......XXX........ Michigan594610-PA-9..... MICHIGAN GENERAL OBLIGATION ENVIRON PROTECT PROG 11/01/201203/19/2002 LEHMAN BROTHERS INC (NYC)....... .......................... .........2,260,400 .........2,000,000 .........2,196,420 .........2,151,066 ............(2,378) ...................0 ...................0 .........109,334 .........109,334 ...........48,958 ......................
Michigan......................................................................................................................................................................... .........2,260,400 .........2,000,000 .........2,196,420 .........2,151,066 ............(2,378) ...................0 ...................0 .........109,334 .........109,334 ...........48,958 .......XXX........ Texas882716-TR-4..... TEXAS GENERAL OBLIGATION COLLEGE STUDENT LOAN AMT 08/01/200208/01/2002 MATURED.......................................... .......................... .........2,120,000 .........2,120,000 .........2,056,400 .........2,120,000 .............5,997 ...................0 ...................0 ...................0 ...................0 .........127,200 ......................
Texas.............................................................................................................................................................................. .........2,120,000 .........2,120,000 .........2,056,400 .........2,120,000 .............5,997 ...................0 ...................0 ...................0 ...................0 .........127,200 .......XXX........Total States and US......................................................................................................................................................... .........9,808,950 .........9,120,000 .........9,130,470 .........9,197,919 ...........10,555 ...................0 ...................0 .........611,031 .........611,031 .........411,054 .......XXX........
1799999. Total - Bonds - States, Territories & Possessions.............................................................................................................. .........9,808,950 .........9,120,000 .........9,130,470 .........9,197,919 ...........10,555 ...................0 ...................0 .........611,031 .........611,031 .........411,054 .......XXX........Bonds - Political Subdivisions of States Arizona040663-J8-0...... ARIZONA STATE UNIVERSITY REV RFDG SER A PREREFUNDED 07/01/201207/01/2002 CALLED FOR REDEMPTION.............. .......................... .........3,030,000 .........3,000,000 .........3,067,500 .........3,030,000 ...........14,347 ...................0 ...................0 ...................0 ...................0 .........172,500 ......................
Arizona........................................................................................................................................................................... .........3,030,000 .........3,000,000 .........3,067,500 .........3,030,000 ...........14,347 ...................0 ...................0 ...................0 ...................0 .........172,500 .......XXX........ Texas727193-R5-5...... PLANO TX IND SCH DIST PSFG 02/15/2002..... 02/15/2002 MATURED.......................................... .......................... .........3,690,000 .........3,690,000 .........2,547,207 .........3,690,000 ...........20,886 ...................0 ...................0 ...................0 ...................0 ...................0 ......................
Texas.............................................................................................................................................................................. .........3,690,000 .........3,690,000 .........2,547,207 .........3,690,000 ...........20,886 ...................0 ...................0 ...................0 ...................0 ...................0 .......XXX........Total States and US......................................................................................................................................................... .........6,720,000 .........6,690,000 .........5,614,707 .........6,720,000 ...........35,233 ...................0 ...................0 ...................0 ...................0 .........172,500 .......XXX........
2499999. Total - Bonds - Political Subdivisions................................................................................................................................. .........6,720,000 .........6,690,000 .........5,614,707 .........6,720,000 ...........35,233 ...................0 ...................0 ...................0 ...................0 .........172,500 .......XXX........Bonds - Special Revenue and Special Assessment Florida686509-F2-1...... ORLANDO FL UTIL COMM WATER AND ELEC SR LIEN REV 2001 10/01/202111/01/2002 PORTFOLIO TRANSFER.................... .......................... .........5,193,250 .........5,000,000 .........5,116,650 .........5,108,350 ............(6,920) ...................0 ...................0 ...........84,900 ...........84,900 .........263,229 ......................
Florida............................................................................................................................................................................. .........5,193,250 .........5,000,000 .........5,116,650 .........5,108,350 ............(6,920) ...................0 ...................0 ...........84,900 ...........84,900 .........263,229 .......XXX........ Louisiana070318-AF-7...... BASTROP LA IND DEV BD POL CONTRL REV INTERNATIONAL PAPER 03/01/200703/01/2002 CALLED FOR REDEMPTION.............. .......................... .......10,200,000 .......10,000,000 .......10,368,400 .......10,200,000 ..........(22,930) ...................0 ...................0 ...................0 ...................0 .........345,000 ......................450803-AA-9..... IBERIA PARISH LA IND DEV REV 77 CARBORUNDUM CO PJT ETM 11/01/200211/01/2002 MATURED.......................................... .......................... .........1,000,000 .........1,000,000 .........1,026,880 .........1,000,000 ..........(11,955) ...................0 ...................0 ...................0 ...................0 ...........59,500 ......................
Louisiana........................................................................................................................................................................ .......11,200,000 .......11,000,000 .......11,395,280 .......11,200,000 ..........(34,885) ...................0 ...................0 ...................0 ...................0 .........404,500 .......XXX........ Mississippi186252-A*-3...... CLEVELAND MS POLLUTION CONTROL REV 78 TRAVENOL LABS 07/01/200802/01/2002 SCHEDULED REDEMPTION.............. .......................... ............330,000 ............330,000 ............330,000 ............330,000 ...................0 ...................0 ...................0 ...................0 ...................0 ...................0 ......................
Mississippi...................................................................................................................................................................... ............330,000 ............330,000 ............330,000 ............330,000 ...................0 ...................0 ...................0 ...................0 ...................0 ...................0 .......XXX........ Nebraska210669-AR-8..... NEBRASKA PUB PWR DIST NUCLEAR REV 1968 01/01/200309/05/2002 Various................................................ .......................... ............290,000 ............290,000 ............265,350 ............290,000 .............1,445 ...................0 ...................0 ...................0 ...................0 ...........12,551 ......................
Nebraska........................................................................................................................................................................ ............290,000 ............290,000 ............265,350 ............290,000 .............1,445 ...................0 ...................0 ...................0 ...................0 ...........12,551 .......XXX........ New York649850-V4-3...... NEW YORK STATE ENVIR FACL CORP WTR POL CNT REVOLVING FD 97C 12/15/201104/03/2002 BEAR STEARNS & CO....................... .......................... .........3,801,767 .........3,650,000 .........3,622,333 .........3,629,615 ................459 ...................0 ...................0 .........172,152 .........172,152 ...........59,003 ......................
New York........................................................................................................................................................................ .........3,801,767 .........3,650,000 .........3,622,333 .........3,629,615 ................459 ...................0 ...................0 .........172,152 .........172,152 ...........59,003 .......XXX........ Pennsylvania717819-AZ-9...... PHILADELPHIA PA IND DEV ATLANTIC RICHFIELD SER A 04/01/200204/01/2002 MATURED.......................................... .......................... ............340,000 ............340,000 ............340,000 ............340,000 ...................0 ...................0 ...................0 ...................0 ...................0 .............9,775 ......................
Pennsylvania................................................................................................................................................................... ............340,000 ............340,000 ............340,000 ............340,000 ...................0 ...................0 ...................0 ...................0 ...................0 .............9,775 .......XXX........ Texas796253-TX-0...... SAN ANTONIO TEX ELEC & GAS UNREFUNDED 02/01/201010/09/2002 CONVERSION.................................... .......................... ............323,004 ............340,000 ............312,045 ............323,004 .............1,413 ...................0 ...................0 ...................0 ...................0 ...........20,204 ......................
Texas.............................................................................................................................................................................. ............323,004 ............340,000 ............312,045 ............323,004 .............1,413 ...................0 ...................0 ...................0 ...................0 ...........20,204 .......XXX........ United States31368H-YA-5..... FNMA 03/01/2009............................................... 12/01/2002 SCHEDULED REDEMPTION.............. .......................... ............407,969 ............407,969 ............412,905 ............407,969 ............(3,016) ...................0 ...................0 ...................0 ...................0 ...........16,053 ......................31385E-WQ-8.... FNMA 07/01/2015............................................... 12/01/2002 SCHEDULED REDEMPTION.............. .......................... ............678,622 ............678,622 ............677,138 ............678,622 .............1,669 ...................0 ...................0 ...................0 ...................0 ...........26,041 ......................31386S-PT-8..... FNMA 04/01/2016............................................... 03/13/2002 Various................................................ .......................... .........2,689,367 .........2,683,437 .........2,734,590 .........2,731,233 ............(2,403) ...................0 ...................0 ..........(41,866) ..........(41,866) ...........47,173 ......................

Annual Statement for the year 2002 of the TWIN CITY FIRE INSURANCE COMPANY
E12.1
SCHEDULE D - PART 4Showing all Long-Term Bonds and Stocks SOLD, REDEEMED or Otherwise DISPOSED OF During Current Year
1 2 3 4 5 6 7 8 9 10 11 12 13 14 15 16Increase Foreign Interest
Book/Adjusted (Decrease) Exchange Realized Total on Bonds Dividends onCUSIP Number Carrying Value Increase by Foreign Gain Gain Gain Received StocksIdentifi- Disposal of Shares Par Actual at Disposal (Decrease) by Exchange (Loss) on (Loss) on (Loss) on During Receivedcation Description Date Name of Purchaser of Stock Consideration Value Cost Date Adjustment Adjustment Disposal Disposal Disposal Year During Year
31391N-ES-6..... FNMA 11/01/2032............................................... 12/01/2002 SCHEDULED REDEMPTION.............. .......................... ..............27,917 ..............27,917 ..............28,462 ..............27,917 ..............(545) ...................0 ...................0 ...................0 ...................0 ................140 ...................... U.S................................................................................................................................................................................. .........3,803,875 .........3,797,945 .........3,853,095 .........3,845,741 ............(4,295) ...................0 ...................0 ..........(41,866) ..........(41,866) ...........89,407 .......XXX........Total States and US......................................................................................................................................................... .......25,281,896 .......24,747,945 .......25,234,753 .......25,066,710 ..........(42,783) ...................0 ...................0 .........215,186 .........215,186 .........858,669 .......XXX........
3199999. Total - Bonds - Special Revenue & Assessment................................................................................................................ .......25,281,896 .......24,747,945 .......25,234,753 .......25,066,710 ..........(42,783) ...................0 ...................0 .........215,186 .........215,186 .........858,669 .......XXX........Bonds - Industrial and Miscellaneous United States00209T-AA-3..... AT&T BROADBAND 03/15/2013......................... 11/29/2002 CALLED FOR REDEMPTION.............. .......................... ...................476 ...................476 ...................418 ...................428 ...................0 ...................0 ...................0 .................48 .................48 ...................0 ......................001957-AV-1..... AT&T CORP 03/15/2009..................................... 11/14/2002 CONVERSION.................................... .......................... .........2,855,698 .........3,185,000 .........2,779,964 .........2,855,698 ...........33,578 ...................0 ...................0 ...................0 ...................0 .........222,419 ......................68338W-AA-7.... ONYX ACCEPTANCE RESIDUAL FUNDING OWNER TRUST 2000-A 04/20/200403/20/2002 SCHEDULED REDEMPTION.............. .......................... ............938,776 ............938,776 ............938,776 ............938,776 ...................0 ...................0 ...................0 ...................0 ...................0 ...........17,149 ......................432848-AP-4..... PARK PLACE ENTERTAINMENT 06/01/2002..... 06/01/2002 MATURED.......................................... .......................... .........2,000,000 .........2,000,000 .........1,957,220 .........2,000,000 .............9,581 ...................0 ...................0 ...................0 ...................0 ...........73,750 ......................760972-2F-5...... RESIDENTIAL FUNDING MORTGAGE SECURITIES I INC SER 1998-S28 CL A6 11/01/202801/01/2002 Various................................................ .......................... ......................0 ......................0 ......................0 ..............10,072 ...........10,072 ...................0 ...................0 ..........(10,072) ..........(10,072) ................692 ......................
United States.................................................................................................................................................................. .........5,794,950 .........6,124,252 .........5,676,378 .........5,804,974 ...........53,231 ...................0 ...................0 ..........(10,024) ..........(10,024) .........314,010 .......XXX........4599999. Total - Bonds - Industrial & Miscellaneous......................................................................................................................... .........5,794,950 .........6,124,252 .........5,676,378 .........5,804,974 ...........53,231 ...................0 ...................0 ..........(10,024) ..........(10,024) .........314,010 .......XXX........6099997. Total - Bonds - Part 4....................................................................................................................................................... .......49,470,478 .......48,546,879 .......47,564,706 .......48,654,285 ...........12,520 ...................0 ...................0 .........816,193 .........816,193 ......1,819,179 .......XXX........6099998. Total - Bonds - Summary Item from Part 5........................................................................................................................ .........6,488,967 .........6,685,001 .........6,488,589 .........6,462,894 ..........(25,696) ...................0 ...................0 ...........26,072 ...........26,072 .........120,975 .......XXX........6099999. Total - Bonds.................................................................................................................................................................... .......55,959,445 .......55,231,880 .......54,053,295 .......55,117,179 ..........(13,176) ...................0 ...................0 .........842,265 .........842,265 ......1,940,154 .......XXX........
Common Stocks - Banks, Trust and Insurance CompaniesUnited States30303#-10-7...... FACILITY INSURANCE HOLDING CORPORATION02/15/2002 DIRECT WITH ISSUER....................... ........36,647.000 ......................0 ......................... ......................0 ......................0 ...................0 ...................0 ...................0 ...................0 ...................0 ...................... ...................0
United States.................................................................................................................................................................. ......................0 ............XXX....... ......................0 ......................0 ...................0 ...................0 ...................0 ...................0 ...................0 ........XXX........ ...................06799999. Total - Common Stocks - Banks, Trust & Insurance Companies........................................................................................ ......................0 ............XXX....... ......................0 ......................0 ...................0 ...................0 ...................0 ...................0 ...................0 ........XXX........ ...................07099997. Total - Common Stocks - Part 4........................................................................................................................................ ......................0 ............XXX....... ......................0 ......................0 ...................0 ...................0 ...................0 ...................0 ...................0 ........XXX........ ...................07099999. Total - Common Stocks.................................................................................................................................................... ......................0 ............XXX....... ......................0 ......................0 ...................0 ...................0 ...................0 ...................0 ...................0 ........XXX........ ...................07199999. Total - Preferred and Common Stocks.............................................................................................................................. ......................0 ............XXX....... ......................0 ......................0 ...................0 ...................0 ...................0 ...................0 ...................0 ........XXX........ ...................07299999. Total - Bonds, Preferred and Common Stocks................................................................................................................... .......55,959,445 ............XXX....... .......54,053,295 .......55,117,179 ..........(13,176) ...................0 ...................0 .........842,265 .........842,265 ......1,940,154 ...................0

Annual Statement for the year 2002 of the TWIN CITY FIRE INSURANCE COMPANY
E13
SCHEDULE D - PART 5Showing all Long-Term Bonds and Stocks ACQUIRED During Current Year and Fully DISPOSED OF During Current Year
1 2 3 4 5 6 7 8 9 10 11 12 13 14 15 16 17Par Value Increase Foreign(Bonds) Book/Adjusted Increase (Decrease) Exchange Realized Total Interest and Paid for
CUSIP or Number of Carrying Value (Decrease) by Foreign Gain Gain Gain Dividends AccruedIdentifi- Date Disposal Shares Actual at Disposal by Exchange (Loss) on (Loss) on (Loss) on Received Interest andcation Description Acquired Name of Vendor Date Name of Purchaser (Stocks) Cost Consideration Date Adjustment Adjustment Disposal Disposal Disposal During Year Dividends
Bonds - U.S. Government36213U-SE-1..... GNMA 10/01/2031.......................................... 06/11/2002 UBS WARBURG LLC........... 10/16/2002 Various................................. ........3,500,001 ........3,632,891 ........3,632,794 ........3,606,722 .......(26,169) ...............0 ...............0 ........26,072 .........26,072 .......87,533 .......12,931
0399999. Total - Bonds - U.S. Government......................................................................................................................................................... ........3,500,001 ........3,632,891 ........3,632,794 ........3,606,722 .......(26,169) ...............0 ...............0 ........26,072 .........26,072 .......87,533 .......12,931Bonds - Industrial and Miscellaneous United States00209U-AD-4..... AT&T CORP 03/15/2009................................. 11/14/2002 CONVERSION..................... 11/18/2002 CONVERSION..................... ........3,185,000 ........2,855,698 ........2,856,172 ........2,856,172 .............474 ...............0 ...............0 ................0 ..................0 .......33,443 .......31,319
United States..................................................................................................................................................................................... ........3,185,000 ........2,855,698 ........2,856,172 ........2,856,172 .............474 ...............0 ...............0 ................0 ..................0 .......33,443 .......31,3194599999. Total - Bonds - Industrial & Miscellaneous........................................................................................................................................... ........3,185,000 ........2,855,698 ........2,856,172 ........2,856,172 .............474 ...............0 ...............0 ................0 ..................0 .......33,443 .......31,3196099998. Total - Bonds...................................................................................................................................................................................... ........6,685,001 ........6,488,589 ........6,488,967 ........6,462,894 .......(25,695) ...............0 ...............0 ........26,072 .........26,072 .....120,975 .......44,2507299999. Total - Bonds, Preferred and Common Stocks..................................................................................................................................... .........XXX......... ........6,488,589 ........6,488,967 ........6,462,894 .......(25,695) ...............0 ...............0 ........26,072 .........26,072 .....120,975 .......44,250

Annual Statement for the year 2002 of the TWIN CITY FIRE INSURANCE COMPANY
E14, E15, E16, E17, E18, E19, E20, E21, E22
Sch. D-Pt. 6-Sn. 1
NONE Sch. D-Pt. 6-Sn. 2
NONE Sch. DA-Pt. 1
NONE Sch. DB-Pt. A-Sn. 1
NONE Sch. DB-Pt. A-Sn. 2
NONE Sch. DB-Pt. A-Sn. 3
NONE Sch. DB-Pt. B-Sn. 1
NONE Sch. DB-Pt. B-Sn. 2
NONE Sch. DB-Pt. B-Sn. 3
NONE Sch. DB-Pt. C-Sn. 1
NONE Sch. DB-Pt. C-Sn. 2
NONE Sch. DB-Pt. C-Sn. 3
NONE Sch. DB-Pt. D-Sn. 1
NONE Sch. DB-Pt. D-Sn. 2
NONE Sch. DB-Pt. D-Sn. 3
NONE Sch. DB-Pt. E-Sn. 1
NONE

Annual Statement for the year 2002 of the TWIN CITY FIRE INSURANCE COMPANY
E23
SCHEDULE DM For bonds and preferred stocks owned as of December 31, state the aggregate statement (admitted) value,
the aggregate fair value, and the aggregate difference, if any, between them. 1 2 3
Excess of Statement overStatement (Admitted) Fair Fair Value (-), or Fair
Value Value (a) Value over Statement (+)
1. Bonds............................................................................................. .......................................363,588,352 .......................................389,976,260 .........................................26,387,908
2. Preferred stocks............................................................................. ...........................................9,597,851 ...........................................9,932,500 ..............................................334,649
3. Totals............................................................................................. .......................................373,186,203 .......................................399,908,760 .........................................26,722,557
(a) Amortized or book values shall not be substituted for fair values. Describe the sources or methods utilized in determining the fair values.
Fair market values are determined using the values received from external price providers. Where external prices are unavailable, fair market values are determined by internal
analytical systems or broker quotes.

Annual Statement for the year 2002 of the TWIN CITY FIRE INSURANCE COMPANY
E24
SCHEDULE E - PART 1 - CASH1 2 3 4 5 6
Amount of Amount ofRate Interest Interest Accrued
of Received December 31 ofDepository Interest During Year Current Year Balance *
TOTALS OF DEPOSITORY BALANCES ON THE LAST DAY OF EACH MONTH DURING THE CURRENT YEAR 1. January................... .................14,167,133 4. April........................ .................14,619,334 7. July......................... ..................7,115,436 10. October................. .................10,853,7532. February................. .................22,771,041 5. May........................ .................17,890,727 8. August.................... .................14,674,827 11. November............. ..................7,595,8593. March..................... .................15,142,323 6. June....................... ..................3,380,851 9. September.............. ..................3,946,253 12. December............. ..................3,641,255
Open DepositoriesJP Morgan Chase Bank............................................ New York, New York................................................ ................0.000 ..........................0 ..........................0 .........................393 XXXJP Morgan Chase Bank(STIP).................................. New York, New York................................................ ................0.000 ...............263,863 ..........................0 ...............3,640,862 XXX0199999. Total - Open Depositories........................................................................................................... ..........XXX......... ...............263,863 ..........................0 ...............3,641,255 XXX0399999. Total Cash on Deposit................................................................................................................ ..........XXX......... ...............263,863 ..........................0 ...............3,641,255 XXX0599999. Total Cash................................................................................................................................. ..........XXX......... ...............263,863 ..........................0 ...............3,641,255 XXX

Annual Statement for the year 2002 of the TWIN CITY FIRE INSURANCE COMPANY
E25
SCHEDULE E - PART 2 - SPECIAL DEPOSITS1 2 3 4 5 6 7
Line Par or Book Statement FairNumber Type Description of Deposit Where Deposited and Purpose of Deposit Value Value (a) Value
SPECIAL DEPOSITS WHICH ARE NOT FOR THE BENEFIT OF ALL POLICYHOLDERS Arizona
AZ00001. ...............B................... MASSACHUSETTS SPECIAL OBLIGATION RE 5.4 576004AY1 6/1/2006................. BNY WESTERN TRUST COMPANY/AZ RSD WC.................................................. ...................................3,090,000 ...................................3,090,000 ...................................3,284,207AZ00002. ...............B................... U S A TREASURY 4.375 912828AC4 5/15/2007........................................................ BNY WESTERN TRUST COMPANY/AZ RSD WC.................................................. ...................................3,000,000 ...................................3,037,056 ...................................3,221,484AZ00003. ...............B................... MESA AZ GENERAL OBLIGATION SERIES 1 5.25 590485LY2 7/1/2009................... BNY WESTERN TRUST COMPANY/AZ RSD WC.................................................. ...................................7,000,000 ...................................7,000,000 ...................................7,485,100AZ00004. ...............B................... SALT RIVER PROJECT AGRIC IMPT & PWR 5 79575DGS3 1/1/2013...................... BNY WESTERN TRUST COMPANY/AZ RSD WC.................................................. ...................................4,000,000 ...................................3,756,428 ...................................4,142,080AZ99999. Arizona............................................................................................................................................................. ............................................................................................................................... .................................17,090,000 .................................16,883,484 .................................18,132,871
DelawareDE00001. ...............B................... NEW ORLEANS LA GENERAL OBLIGATION F 5.5 6476345D2 12/1/2018................ CHRISTIANA BANK & TRUST CO (DELAWARE)/DE RSD WC.............................. ......................................105,000 ......................................107,002 ......................................120,187DE99999. Delaware.......................................................................................................................................................... ............................................................................................................................... ......................................105,000 ......................................107,002 ......................................120,187
GeorgiaGA00001. ...............B................... NEW ORLEANS LA GENERAL OBLIGATION F 5.5 6476345D2 12/1/2018................ WACHOVIA BANK OF GEORGIA N A/GA RSD INCLUDES WC............................. ......................................135,000 ......................................137,574 ......................................154,526GA99999. Georgia............................................................................................................................................................ ............................................................................................................................... ......................................135,000 ......................................137,574 ......................................154,526
IdahoID00001. ...............B................... U S A TREASURY NOTES 6.25 912827J78 2/15/2003.............................................. WELLS FARGO BANK NORTHWEST NA/ID RSD WC........................................... ........................................20,000 ........................................20,017 ........................................20,119ID00002. ...............B................... U S A TREASURY NOTES 7.25 912827P89 5/15/2004.............................................. WELLS FARGO BANK NORTHWEST NA/ID RSD WC........................................... ........................................75,000 ........................................75,806 ........................................81,028ID00003. ...............B................... U S A TREASURY NOTES 5.25 9128274N9 8/15/2003.............................................. WELLS FARGO BANK NORTHWEST NA/ID RSD WC........................................... ........................................50,000 ........................................50,081 ........................................51,250ID99999. Idaho................................................................................................................................................................ ............................................................................................................................... ......................................145,000 ......................................145,904 ......................................152,397
LouisianaLA00001. ...............B................... LOUISIANA GENERAL OBLIGATION 1993B 5.625 546415DS6 8/1/2013.................. BANK ONE/LA RSD SRTY & FOREIGN INS CO..................................................... ........................................75,000 ........................................76,647 ........................................87,797LA99999. Louisiana.......................................................................................................................................................... ............................................................................................................................... ........................................75,000 ........................................76,647 ........................................87,797
MassachusettsMA00001. ...............B................... MASSACHUSETTS SPECIAL OBLIGATION RE 5.4 576004AY1 6/1/2006................. STATE STREET BANK AND TRUST COMPANY/MA RSD INCLUDES WC............ ......................................600,000 ......................................600,000 ......................................637,710MA99999. Massachusetts................................................................................................................................................. ............................................................................................................................... ......................................600,000 ......................................600,000 ......................................637,710
NevadaNV00001. ...............B................... CLARK CNTY NV SCHOOL DIST GENERAL O 5.25 181054WR4 6/1/2008............... NEVADA STATE DEPOSIT/NV RSD WC................................................................ ......................................100,000 ........................................99,498 ......................................102,443NV99999. Nevada............................................................................................................................................................. ............................................................................................................................... ......................................100,000 ........................................99,498 ......................................102,443
New MexicoNM00001. ...............B................... NEW ORLEANS LA GENERAL OBLIGATION F 5.5 6476345D2 12/1/2018................ WELLS FARGO/NM RSD....................................................................................... ......................................320,000 ......................................326,101 ......................................366,285NM99999. New Mexico...................................................................................................................................................... ............................................................................................................................... ......................................320,000 ......................................326,101 ......................................366,285
North CarolinaNC00001. ...............B................... FAYETTEVILLE NC PUBLIC WORKS COMM R 4.75 312805BV5 3/1/2014................ WACHOVIA BANK OF NORTH CAROLINA N A/NC RSD....................................... ......................................100,000 ........................................91,940 ......................................100,149NC00002. ...............B................... DURHAM NC GENERAL OBLIGATION 5.4 266777Z20 3/1/2015............................... WACHOVIA BANK OF NORTH CAROLINA N A/NC RSD....................................... ......................................100,000 ........................................99,119 ......................................111,270NC99999. North Carolina.................................................................................................................................................. ............................................................................................................................... ......................................200,000 ......................................191,059 ......................................211,419
OregonOR00001. ...............B................... CAMDEN CNTY NJ MUN UTIL ATHY SEW RE 5 132813EP7 7/15/2009................... U S BANK OF OREGON/OR RSD SRTY & WC...................................................... ........................................30,000 ........................................29,957 ........................................32,417OR00002. ...............B................... MASSACHUSETTS SPECIAL OBLIGATION RE 5.4 576004AY1 6/1/2006................. U S BANK OF OREGON/OR RSD SRTY & WC...................................................... ...................................1,520,000 ...................................1,520,000 ...................................1,615,532OR00003. ...............B................... SACRAMENTO CA MUN UTIL DIST ELEC RE 5.3 7860042X8 11/15/2005................ U S BANK OF OREGON/OR RSD SRTY & WC...................................................... ...................................3,000,000 ...................................2,906,595 ...................................3,165,960OR00004. ...............B................... WASHINGTON PUBLIC POWER NUCLEAR PRO 5.375 939827UC3 7/1/2015.......... U S BANK OF OREGON/OR RSD SRTY & WC...................................................... ...................................3,000,000 ...................................2,818,666 ...................................3,091,920OR99999. Oregon............................................................................................................................................................. ............................................................................................................................... ...................................7,550,000 ...................................7,275,218 ...................................7,905,829
VirginiaVA00001. ...............B................... NEW ORLEANS LA GENERAL OBLIGATION F 5.5 6476345D2 12/1/2018................ SUNTRUST BANK/VA RSD.................................................................................... ......................................200,000 ......................................203,813 ......................................228,928VA99999. Virginia............................................................................................................................................................. ............................................................................................................................... ......................................200,000 ......................................203,813 ......................................228,928XX99999. Total - All Special Deposits NOT Held for Benefit of all Policyholders, Claimants, & Creditors of the Company.... ............................................................................................................................... .................................26,520,000 .................................26,046,301 .................................28,100,392
SPECIAL DEPOSITS WHICH ARE FOR THE BENEFIT OF ALL POLICYHOLDERS Indiana
IN00001. ...............B................... NEW YORK GENERAL OBLIGATION 5.25 649787FK9 3/1/2010............................... BANK ONE/IN TO MEET OTHER ST REQ............................................................. ...................................1,100,000 ...................................1,079,696 ...................................1,195,260IN00002. ...............B................... CAMDEN CNTY NJ MUN UTIL ATHY SEW RE 5 132813EP7 7/15/2009................... BANK ONE/IN TO MEET OTHER ST REQ............................................................. ......................................220,000 ......................................219,687 ......................................237,728IN00003. ...............B................... NEW YORK THRUWAY ATHY HIGHWAY BRIDG 5.6 650013AN5 4/1/2007.............. BANK ONE/IN TO MEET OTHER ST REQ............................................................. ...................................2,000,000 ...................................2,000,000 ...................................2,149,620IN00004. ...............B................... KNOX COUNTY TENN GO 5.375 499512WF4 4/1/2013............................................ BANK ONE/IN TO MEET OTHER ST REQ............................................................. ......................................200,000 ......................................195,757 ......................................206,020IN00005. ...............B................... U S A TREASURY NOTES 6.25 912827J78 2/15/2003.............................................. BANK ONE/IN TO MEET OTHER ST REQ............................................................. ......................................110,000 ......................................110,094 ......................................110,653IN99999. Indiana............................................................................................................................................................. ............................................................................................................................... ...................................3,630,000 ...................................3,605,234 ...................................3,899,281ZZ99999. Total - All Special Deposits Held for Benefit of all Policyholders, Claimants, & Creditors of the Company............. ............................................................................................................................... ...................................3,630,000 ...................................3,605,234 ...................................3,899,281

Annual Statement for the year 2002 of the TWIN CITY FIRE INSURANCE COMPANY
E25.1
SCHEDULE E - PART 2 - SPECIAL DEPOSITS1 2 3 4 5 6 7
Line Par or Book Statement FairNumber Type Description of Deposit Where Deposited and Purpose of Deposit Value Value (a) Value
9999999. Totals................................................................................................................................................................ ............................................................................................................................... .................................30,150,000 .................................29,651,535 .................................31,999,673(a) Includes $..........0 cash and short-term investments as defined in SSAP No. 2 of the NAIC Accounting Practices and Procedures Manual.

*29459200247000100*NAIC Code 29459
TWIN CITY FIRE INSURANCE COMPANYSVO COMPLIANCE CERTIFICATION
The undersigned is an officer of the insurer responsible for reporting investments to the SVO and/or with making allfilings with appropriate state regulatory officials and the NAIC and is therefore required to be familiar with therequirements of such filings. The undersigned officer certifies that, to the best of his or her knowledge, information,and belief, all prices or NAIC designations for the securities reported in this statement have been obtained directlyfrom the SVO except as specifically identified below. The officer further certifies that, to the best of his or herknowledge, information, and belief, since the last filing of a quarterly or annual statement:
1. All securities previously valued by the insurer and identified by a Z suffix have now been submitted to theSVO for a valuation or disposed of by sale or otherwise with the result that all prices and NAIC Designationsreported in this statement have been provided by the SVO, except for provisionally exempt and newpurchases identified in Schedule D and DA with a Z suffix or items submitted but not yet processed by theSVO.
2. Any newly purchased securities now identified with a Z suffix, shall be submitted to the SVO within 120 daysof purchase.
3. All necessary information on securities which have been previously designated NR (not rated due to lack ofcurrent information) by the SVO have either been submitted to the SVO by the insurer for a valuation ordisposed of by the insurer.
4. All material issuer events (as defined below) have been reported to the SVO.A material issuer event is a generic or transaction specific credit event of which the insurer is currentlyaware, which by its nature would signify to a reasonably prudent insurer that a material change in the creditquality or price of the investment or security has occurred. As an illustration, and not by way of limitation, the following shall be deemed to constitute material issuerevents:
a. Recapitalizations or capital restructuring whether within or without Chapter 11 of the US BankruptcyCode;
b. Nonpayment, deferral, or payment in kind through waiver of any principal or contractual interestpayment;
c. Any change in the maturity of a security; d. Changes in the lender's collateral position, including releases of collateral, or the taking of a collateral
position whether by operation of negative pledge covenant or otherwise; e. Events of a like character or of a like effect, which would be considered material to an investment
professional.f. Exceptions:
Name of Investment Officer
Signature of Investment Officer
Title of Signatory
Date

*29459200244000100*IDENTIFICATION
I, Richard W. Palczynski, Group Senior Vice President and Chief Actuary, am an officer of the Hartford FireInsurance Company, parent company of the Twin City Fire Insurance Company. I am a member of theAmerican Academy of Actuaries and meet its qualification standards, and I am a Fellow of the CasualtyActuarial Society. I was appointed by the Board of Directors on May 17, 1999 to render this opinion.
SCOPE
I have examined the actuarial assumptions and methods used in determining reserves listed below, asshown in the Annual Statement of the Twin City Fire Insurance Company as prepared for filing with stateregulatory officials, as of December 31, 2002.
A.) Reserve for Unpaid Losses (Liabilities, Surplus and Other Funds page, Losses line); $ 134,364,316
B. Reserve for Unpaid Loss Adjustment Expenses (Liabilities, Surplus and Other Funds page, Loss adjustment expenses line); $ 20,394,834
C.) Reserve for Unpaid Losses - Direct and Assumed (Schedule P, Part 1, Totals from Cols. 13 and 15); $ 181,124,978
D.) Reserve for Unpaid Loss Adjustment Expenses – Direct and Assumed (Schedule P, Part 1, Totals from Cols. 17, 19, and 21); $ 27,906,841
E. The total claims made extended loss and expense reserve (Schedule P Interrogatories), whether reported in the loss reserves
or the unearned premium reserves: and $ 24,030
F. The Liabilities, Surplus and Other Funds page write-in item reserve, “Retroactive reinsurance reserve assumed”. $ 0
The reserves on which I am expressing an opinion reflect the following:
A. Anticipated net salvage and subrogation included as a reduction to loss reserves as reported inSchedule P, and on the Liabilities, Surplus and Other Funds page, Losses and Loss adjustmentexpenses lines; $4,400,985;
B. The discount included as a reduction to loss reserves and loss adjustment expense reserves asreported in Schedule P, and on the Liabilities, Surplus and Other Funds page, Losses and Lossadjustment expenses lines; non-tabular discount $ 0 and tabular discount $ 5,439,615;
ACTUARIAL OPINION

Page 2 Twin City Fire Insurance Company
C. The net reserves for loss and loss adjustment expense for the company’s share of voluntary andinvoluntary underwriting pools’ and associations’ unpaid losses and expenses that are included inreserves shown on the Liabilities, Surplus and Other Funds page, Losses and Loss adjustmentexpenses lines; $5,703,017;
D. The net reserves for losses and loss adjustment expenses that the company carries for Asbestosliabilities $199,514, and Environmental liabilities $ 42,043, that are included in the reserves on theLiabilities, Surplus, and Other Funds, Losses and Loss adjustment expenses lines, and disclosed inthe Notes to Financial Statements; and
E. In the total reserves for losses and loss adjustment expenses, the company reported extended lossand expense reserves, $ 24,030 that are reported in the Schedule P Interrogatories.
F. Effective, November 1, 2001 Hartford Fire Insurance Company entered into a reinsuranceagreement with Heritage Reinsurance Company Ltd. (“Heritage Re”), a 99.4% owned Bermudaaffiliate. The agreement ceded $694 million of loss and defense and cost containment reserves, ofwhich $537 million was for asbestos and environmental on business effective prior to January 1,1985 and $157 million was for certain other runoff business, to Heritage Re for $694 million inpremium consideration. As of December 2002 Hartford Fire ceded $716 million in reserves toHeritage Re. My evaluation of the net reserves in A. and B. above is also performed on a grossbasis with regard to this cession.
In forming my opinion on the loss and loss adjustment expense reserves, I relied upon data prepared bythe responsible officers or employees of the company or group to which it belongs. I evaluated that datafor reasonableness and consistency. I also reconciled that data to a composite Schedule P - Part 1comprising the total intercompany pool to which the Company belongs. In other respects, my examinationincluded such review of the actuarial assumptions and methods used and such tests of the calculations as Iconsidered necessary. Loss and Loss Adjustment Expense reserves have been tested using generallyaccepted actuarial methods. The methods used include incurred loss development, paid loss development,loss ratio techniques, and exposure based analyses. In the application of these methods, expected futuretrends are considered as well as historical trends.
Pools and Associations
The company participated in a number of voluntary and involuntary pooling arrangements. The bookedreserves and earned premiums for some pools reflect losses incurred and premiums earned by the poolsthrough various dates prior to year-end. The company practice is to record the loss and loss adjustmentexpense reserves reported to the company by the pools. The company has also recorded $ 0.3 million toaccount for the reporting lag from the National Workers Compensation pool. For all other pools, thecompany records the loss and loss adjustment expense reserves reported to it without accrual for anyreporting lag, since any such required accrual would be immaterial. Aggregate reserves held for all poolsby the Twin City Fire Insurance Company are $ 5,703,017. I have not independently evaluated thesereserves. For the purpose of this opinion I have relied upon The Actuarial Opinion of the National WorkersCompensation Reinsurance Pool as of September 30, 2002 submitted by their opining actuary.
ACTUARIAL OPINION

Page 3 Twin City Fire Insurance Company
Intercompany Pooling
The Company is part of an intercompany pooling agreement with other affiliates of Nutmeg InsuranceCompany and Hartford Fire Insurance Company. Premiums and losses are allocated to the Companybased on its assigned percentage of the total pool. Analysis of the reserve items identified above has beenperformed for all pool companies combined.
Reinsurance Collectibility
I have reviewed the ceded reinsurance provisions and their subsequent impact on the reserves of the TwinCity Fire Insurance Company. I have reviewed the financial position of our various reinsurers, and reservesare adjusted as warranted. As per Note #22 to the Financial Notes, the Insurance Group (each company’sparticipation can be calculated using the percentages shown in Note #25 of the Financial Notes) has writtenoff in the current year $ 0 in reinsurance balances due, which is reflected as $ 0 in losses incurred, $ 0 inloss adjustment expenses incurred, $ 0 in premiums earned, and $ 0 other. While the Twin City FireInsurance Company has procedures to identify financially troubled insurers, no representation is made withrespect to its ability to recover under its ceded reinsurance agreements.
Asbestos and Environmental Exposures
The combined net reserves for Asbestos and Environmental losses and loss adjustment expense that thecompany holds is $ 241,557. This amount is 1.50%, as per note #25 of the Financial Notes, of the totalreserves shown in note #29 of the Financial Notes. The reserves carried include a provision for asbestosand environmental impairment liability, which on a case basis for reported claims represents management’sestimate of exposure costs under current interpretation of the applicable laws. A reserve amount for policydefense costs to defend the Twin City Fire Insurance Company policies, as well as a reserve amount forclaims development and unreported claims have been established based on an exposure based analysis ofultimates along with a projection of a pure IBNR component. The Group completed an exposure basedanalysis of its pollution reserves on a gross basis in 2001. In June 2002, The Group also completed athorough evaluation of its runoff reserves held in Heritage Re for non-asbestos and non-pollution (All Other)claims. The latter study culminated in a Second Quarter 2002 reserve reclassification in Heritage Re of$540 million into asbestos and $60 million into pollution with an offsetting reduction of $600 million in the AllOther reserves. In addition, a full exposure analysis of The Group’s asbestos reserves is currentlyunderway with a completion target date in the second quarter of 2003. It is not possible at this time topredict the outcome of the pending study.
While the pending asbestos study will bring more certainty to The Group’s reserves, it should berecognized that the estimation of ultimate liabilities for asbestos claims is unusually difficult due tooutstanding issues such as whether coverage exists, the definition of occurrence, the determination ofultimate damages, and the allocation of such damages to financially responsible parties. Therefore, anyestimation of these liabilities is subject to significantly greater than normal variation and uncertainty. Referto note in Scope Section regarding our cession to Heritage Re relative to asbestos and environmentalreserves.
ACTUARIAL OPINION

Page 4 Twin City Fire Insurance Company
NAIC IRIS Ratios
The calculation of the NAIC IRIS tests (One-Year Reserve Development to Surplus, Two-Year ReserveDevelopment to Surplus, and Estimated Current Reserve Deficiency to Surplus), which are impacted by thereserves of the Twin City Fire Insurance Company, were completed. I find that each test is within theacceptable range as determined by the NAIC.
Disclosures of Items for Unearned Premiums Reserves for Long Duration Contracts
Total net unearned premium for the Twin City Fire Insurance Company as recorded on the Liabilities,Surplus and Other Funds page, line 9 of the Annual Statement is $ 53,315,935. The unearned premium forlong duration contracts (excluding financial guaranty contracts, mortgage guaranty policies and suretycontracts), to which this opinion applies, is $ 387,624 representing 0.7% of the total unearned premium forthe Company. The reasonableness of this component of the unearned premium is not material to theCompany. By extension, the amounts related to the provision for investment income and to the reduction inprojected losses and expenses for subrogation and salvage, reinsurance, credits for deductibles andself-insured retentions, and other statutory approved credits are not material.
Financial and Retroactive Reinsurance
The Twin City Fire Insurance Company did not have any financial reinsurance arrangements that impactedloss reserves during the year. The Twin City Fire Insurance Company did not participate in any retroactivereinsurance during the year.
September 11 Terrorist Attack
As a result of the September 11 terrorist attack, the Hartford Insurance Group recorded a loss amounting to$647 million, before tax and net of reinsurance related to property and casualty operations. Eachcompany’s participation can be calculated using the percentages shown in Note #25 of the Financial Notes. Coverages were related to property, business interruption, workers’ compensation, and other liabilityexposures, including those underwritten by the Hartford Insurance Group’s assumed reinsurance operation. The Hartford Insurance Group based the loss estimate upon a review of insured exposures using a varietyof assumptions and actuarial techniques, including estimated amounts for unknown and unreportedpolicyholder losses and costs incurred in settling claims. Also included was an estimate of amountsrecoverable under the Hartford Insurance Group’s ceded reinsurance programs, including the cost ofadditional reinsurance premiums. As a result of the uncertainties involved in the estimation process, finalclaims settlement may vary from present estimates. World Trade Center losses have developed well withinoriginal reserved amounts. However, there is and there will continue to be significant uncertainty aroundthese World Trade Center losses, particularly with regard to inhalation claims and around OBI, due to thethree year statute of limitation in New York.
ACTUARIAL OPINION

Page 5 Twin City Fire Insurance Company
OPINION
In my opinion, the amounts carried in the above Scope Section on account of the items identified:
A. meet the requirements of the insurance laws of Indiana
B. are computed in accordance with accepted loss reserving standards and principles
C. make a reasonable provision in the aggregate for all unpaid loss and loss adjustment expenseobligations of the company under the terms of its policies and agreements.
An actuarial report and any underlying actuarial workpapers supporting the findings expressed in thisStatement of Actuarial Opinion will be retained for a period of seven years in the administrative offices ofthe Twin City Fire Insurance Company and will be available for regulatory examination.
_______________________________________ Richard W. Palczynski Group Senior Vice President and Chief Actuary The Hartford Hartford Plaza Hartford, CT 06115 (860) - 547-5420
Date: ________________
ACTUARIAL OPINION

Supplement for the year 2002 of TWIN CITY FIRE INSURANCE COMPANY
SUPA1
*29459200245000000*
Designate the type of health care SUPPLEMENT "A" TO SCHEDULE Tproviders reported on this page. EXHIBIT OF MEDICAL MALPRACTICE PREMIUMS WRITTENPhysicians - Including Surgeons and Osteopaths ALLOCATED BY STATES AND TERRITORIES
1 2 Direct Losses Paid 5 Direct Losses Unpaid 83 4 6 7 Direct
LossesIncurred
Direct Direct Number Direct Number ButPremiums Premiums of Losses Amount of Not
States, Etc. Written Earned Amount Claims Incurred Reported Claims Reported1. Alabama..............................AL ........................0 ........................0 ........................0 ........................0 ........................0 ........................0 ........................0 ........................02. Alaska.................................AK ........................0 ........................0 ........................0 ........................0 ........................0 ........................0 ........................0 ........................03. Arizona................................AZ ........................0 ........................0 ........................0 ........................0 ........................0 ........................0 ........................0 ........................04. Arkansas.............................AR ........................0 ........................0 ........................0 ........................0 ........................0 ........................0 ........................0 ........................05. California.............................CA ........................0 ........................0 ........................0 ........................0 ........................0 ........................0 ........................0 ........................06. Colorado.............................CO ........................0 ........................0 ........................0 ........................0 ........................0 ........................0 ........................0 ........................07. Connecticut.........................CT ........................0 ........................0 ........................0 ........................0 ........................0 ........................0 ........................0 ........................08. Delaware.............................DE ........................0 ........................0 ........................0 ........................0 ........................0 ........................0 ........................0 ........................09. District of Columbia.............DC ........................0 ........................0 ........................0 ........................0 ........................0 ........................0 ........................0 ........................0
10. Florida.................................FL ........................0 ........................0 ........................0 ........................0 ........................0 ........................0 ........................0 ........................011. Georgia...............................GA ........................0 ........................0 ........................0 ........................0 ........................0 ........................0 ........................0 ........................012. Hawaii..................................HI ........................0 ........................0 ........................0 ........................0 ........................0 ........................0 ........................0 ........................013. Idaho....................................ID ........................0 ........................0 ........................0 ........................0 ........................0 ........................0 ........................0 ........................014. Illinois...................................IL ........................0 ........................0 ........................0 ........................0 ........................0 ........................0 ........................0 ........................015. Indiana.................................IN ........................0 ........................0 ........................0 ........................0 ........................0 ........................0 ........................0 ........................016. Iowa.....................................IA ........................0 ........................0 ........................0 ........................0 ........................0 ........................0 ........................0 ........................017. Kansas................................KS ........................0 ........................0 ........................0 ........................0 ........................0 ........................0 ........................0 ........................018. Kentucky.............................KY ........................0 ........................0 ........................0 ........................0 ........................0 ........................0 ........................0 ........................019. Louisiana.............................LA ........................0 ........................0 ........................0 ........................0 ........................0 ........................0 ........................0 ........................020. Maine.................................ME ........................0 ........................0 ........................0 ........................0 ........................0 ........................0 ........................0 ........................021. Maryland............................MD ........................0 ........................0 ........................0 ........................0 ........................0 ........................0 ........................0 ........................022. Massachusetts....................MA ........................0 ........................0 ........................0 ........................0 ........................0 ........................0 ........................0 ........................023. Michigan..............................MI ........................0 ........................0 ........................0 ........................0 ........................0 ........................0 ........................0 ........................024. Minnesota...........................MN ........................0 ........................0 ........................0 ........................0 ........................0 ........................0 ........................0 ........................025. Mississippi..........................MS ........................0 ........................0 ........................0 ........................0 ........................0 ........................0 ........................0 ........................026. Missouri..............................MO ........................0 ........................0 ........................0 ........................0 ........................0 ........................0 ........................0 ........................027. Montana..............................MT ........................0 ........................0 ........................0 ........................0 ........................0 ........................0 ........................0 ........................028. Nebraska............................NE ........................0 ........................0 ........................0 ........................0 ........................0 ........................0 ........................0 ........................029. Nevada...............................NV ........................0 ........................0 ........................0 ........................0 ........................0 ........................0 ........................0 ........................030. New Hampshire..................NH ........................0 ........................0 ........................0 ........................0 ........................0 ........................0 ........................0 ........................031. New Jersey..........................NJ ........................0 ........................0 ........................0 ........................0 ........................0 ........................0 ........................0 ........................032. New Mexico........................NM ........................0 ........................0 ........................0 ........................0 ........................0 ........................0 ........................0 ........................033. New York............................NY ........................0 ........................0 ........................0 ........................0 ........................0 ........................0 ........................0 ........................034. North Carolina.....................NC ........................0 ........................0 ........................0 ........................0 ........................0 ........................0 ........................0 ........................035. North Dakota.......................ND ........................0 ........................0 ........................0 ........................0 ........................0 ........................0 ........................0 ........................036. Ohio....................................OH ........................0 ........................0 ........................0 ........................0 ........................0 ........................0 ........................0 ........................037. Oklahoma...........................OK ........................0 ........................0 ........................0 ........................0 ........................0 ........................0 ........................0 ........................038. Oregon...............................OR ........................0 ........................0 ........................0 ........................0 ........................0 ........................0 ........................0 ........................039. Pennsylvania.......................PA ........................0 ........................0 ........................0 ........................0 ........................0 ........................0 ........................0 ........................040. Rhode Island........................RI ........................0 ........................0 ........................0 ........................0 ........................0 ........................0 ........................0 ........................041. South Carolina.....................SC ........................0 ........................0 ........................0 ........................0 ........................0 ........................0 ........................0 ........................042. South Dakota......................SD ........................0 ........................0 ........................0 ........................0 ........................0 ........................0 ........................0 ........................043. Tennessee..........................TN ........................0 ........................0 ........................0 ........................0 ........................0 ........................0 ........................0 ........................044. Texas..................................TX ........................0 ........................0 ........................0 ........................0 ........................0 ........................0 ........................0 ........................045. Utah....................................UT ........................0 ........................0 ........................0 ........................0 ........................0 ........................0 ........................0 ........................046. Vermont...............................VT ........................0 ........................0 ........................0 ........................0 ........................0 ........................0 ........................0 ........................047. Virginia................................VA ........................0 ........................0 ........................0 ........................0 ........................0 ........................0 ........................0 ........................048. Washington........................WA ........................0 ........................0 ........................0 ........................0 ........................0 ........................0 ........................0 ........................049. West Virginia......................WV ........................0 ........................0 ........................0 ........................0 ........................0 ........................0 ........................0 ........................050. Wisconsin............................WI ........................0 ........................0 ........................0 ........................0 ........................0 ........................0 ........................0 ........................051. Wyoming............................WY ........................0 ........................0 ........................0 ........................0 ........................0 ........................0 ........................0 ........................052. American Samoa.................AS ........................0 ........................0 ........................0 ........................0 ........................0 ........................0 ........................0 ........................053. Guam.................................GU ........................0 ........................0 ........................0 ........................0 ........................0 ........................0 ........................0 ........................054. Puerto Rico.........................PR ........................0 ........................0 ........................0 ........................0 ........................0 ........................0 ........................0 ........................055. US Virgin Islands..................VI ........................0 ........................0 ........................0 ........................0 ........................0 ........................0 ........................0 ........................056. Canada...............................CN ........................0 ........................0 ........................0 ........................0 ........................0 ........................0 ........................0 ........................057. Aggregate Other Alien.........OT ........................0 ........................0 ........................0 ........................0 ........................0 ........................0 ........................0 ........................058. Totals...................................... ........................0 ........................0 ........................0 ........................0 ........................0 ........................0 ........................0 ........................0
DETAILS OF WRITE-INS5701. ................................................ ........................0 ........................0 ........................0 ........................0 ........................0 ........................0 ........................0 ........................05702. ................................................ ........................0 ........................0 ........................0 ........................0 ........................0 ........................0 ........................0 ........................05703. ................................................ ........................0 ........................0 ........................0 ........................0 ........................0 ........................0 ........................0 ........................05798. Summary of remaining write-ins for
Line 57 from overflow page...... ........................0 ........................0 ........................0 ........................0 ........................0 ........................0 ........................0 ........................05799. Totals (Lines 5701 thru 5703 +
5798) (Line 57 above).............. ........................0 ........................0 ........................0 ........................0 ........................0 ........................0 ........................0 ........................0
NONE

Supplement for the year 2002 of TWIN CITY FIRE INSURANCE COMPANY
SUPA2
*29459200245000100*
Designate the type of health care SUPPLEMENT "A" TO SCHEDULE Tproviders reported on this page. EXHIBIT OF MEDICAL MALPRACTICE PREMIUMS WRITTENHospitals ALLOCATED BY STATES AND TERRITORIES
1 2 Direct Losses Paid 5 Direct Losses Unpaid 83 4 6 7 Direct
LossesIncurred
Direct Direct Number Direct Number ButPremiums Premiums of Losses Amount of Not
States, Etc. Written Earned Amount Claims Incurred Reported Claims Reported1. Alabama..............................AL ........................0 ........................0 ........................0 ........................0 ........................0 ........................0 ........................0 ........................02. Alaska.................................AK ........................0 ........................0 ........................0 ........................0 ........................0 ........................0 ........................0 ........................03. Arizona................................AZ ........................0 ........................0 ........................0 ........................0 ........................0 ........................0 ........................0 ........................04. Arkansas.............................AR ........................0 ........................0 ........................0 ........................0 ........................0 ........................0 ........................0 ........................05. California.............................CA ........................0 ........................0 ........................0 ........................0 ........................0 ........................0 ........................0 ........................06. Colorado.............................CO ........................0 ........................0 ........................0 ........................0 ........................0 ........................0 ........................0 ........................07. Connecticut.........................CT ........................0 ........................0 ........................0 ........................0 ........................0 ........................0 ........................2 ........................08. Delaware.............................DE ........................0 ........................0 ........................0 ........................0 ........................0 ........................0 ........................0 ........................09. District of Columbia.............DC ........................0 ........................0 ........................0 ........................0 ........................0 ........................0 ........................0 ........................0
10. Florida.................................FL ........................0 ........................0 ........................0 ........................0 ........................0 ........................0 ........................0 ........................011. Georgia...............................GA ........................0 ........................0 ........................0 ........................0 ........................0 ........................0 ........................0 ........................012. Hawaii..................................HI ........................0 ........................0 ........................0 ........................0 ........................0 ........................0 ........................0 ........................013. Idaho....................................ID ........................0 ........................0 ........................0 ........................0 ........................0 ........................0 ........................0 ........................014. Illinois...................................IL ........................0 ........................0 ........................0 ........................0 ........................0 ........................0 ........................0 ........................015. Indiana.................................IN ........................0 ........................0 ........................0 ........................0 ........................0 ........................0 ........................0 ........................016. Iowa.....................................IA ........................0 ........................0 ........................0 ........................0 ........................0 ........................0 ........................0 ........................017. Kansas................................KS ........................0 ........................0 ........................0 ........................0 ........................0 ........................0 ........................0 ........................018. Kentucky.............................KY ........................0 ........................0 ........................0 ........................0 ........................0 ........................0 ........................0 ........................019. Louisiana.............................LA ........................0 ........................0 ........................0 ........................0 ........................0 ........................0 ........................0 ........................020. Maine.................................ME ........................0 ........................0 ........................0 ........................0 ........................0 ........................0 ........................0 ........................021. Maryland............................MD ........................0 ........................0 ........................0 ........................0 ........................0 ........................0 ........................0 ........................022. Massachusetts....................MA ........................0 ........................0 ........................0 ........................0 ........................0 ........................0 ........................0 ........................023. Michigan..............................MI ........................0 ........................0 ........................0 ........................0 ........................0 ........................0 ........................0 ........................024. Minnesota...........................MN ........................0 ........................0 ........................0 ........................0 ........................0 ........................0 ........................0 ........................025. Mississippi..........................MS ........................0 ........................0 ........................0 ........................0 ........................0 ........................0 ........................0 ........................026. Missouri..............................MO ........................0 ........................0 ........................0 ........................0 ........................0 ........................0 ........................0 ........................027. Montana..............................MT ........................0 ........................0 ........................0 ........................0 ........................0 ........................0 ........................0 ........................028. Nebraska............................NE ........................0 ........................0 ........................0 ........................0 ........................0 ........................0 ........................0 ........................029. Nevada...............................NV ........................0 ........................0 ........................0 ........................0 ........................0 ........................0 ........................0 ........................030. New Hampshire..................NH ........................0 ........................0 ........................0 ........................0 ........................0 ........................0 ........................0 ........................031. New Jersey..........................NJ ........................0 ........................0 ........................0 ........................0 ........................0 ........................0 ........................0 ........................032. New Mexico........................NM ........................0 ........................0 ........................0 ........................0 ........................0 ........................0 ........................0 ........................033. New York............................NY ........................0 ........................0 ........................0 ........................0 ........................0 ........................0 ........................0 ........................034. North Carolina.....................NC ........................0 ........................0 ........................0 ........................0 ...............48,000 ........................0 ........................0 .............693,45635. North Dakota.......................ND ........................0 ........................0 ........................0 ........................0 ........................0 ........................0 ........................0 ........................036. Ohio....................................OH ........................0 ........................0 ........................0 ........................0 ........................0 ........................0 ........................0 ........................037. Oklahoma...........................OK ........................0 ........................0 ........................0 ........................0 ........................0 ........................0 ........................0 ........................038. Oregon...............................OR ........................0 ........................0 ........................0 ........................0 ........................0 ........................0 ........................0 ........................039. Pennsylvania.......................PA ........................0 ........................0 ........................0 ........................0 ........................0 ........................0 ........................0 ........................040. Rhode Island........................RI ........................0 ........................0 ........................0 ........................0 ........................0 ........................0 ........................0 ........................041. South Carolina.....................SC ........................0 ........................0 ........................0 ........................0 ........................0 ........................0 ........................0 ........................042. South Dakota......................SD ........................0 ........................0 ........................0 ........................0 ........................0 ........................0 ........................0 ........................043. Tennessee..........................TN ........................0 ........................0 ........................0 ........................0 ........................0 ........................0 ........................0 ........................044. Texas..................................TX ........................0 ........................0 ........................0 ........................0 ........................0 ........................0 ........................0 ........................045. Utah....................................UT ........................0 ........................0 ........................0 ........................0 ........................0 ........................0 ........................0 ........................046. Vermont...............................VT ........................0 ........................0 ........................0 ........................0 ........................0 ........................0 ........................0 ........................047. Virginia................................VA ........................0 ........................0 ........................0 ........................0 ........................0 ........................0 ........................0 ........................048. Washington........................WA ........................0 ........................0 ........................0 ........................0 ........................0 ........................0 ........................0 ........................049. West Virginia......................WV ........................0 ........................0 ........................0 ........................0 ........................0 ........................0 ........................0 ........................050. Wisconsin............................WI ........................0 ........................0 ........................0 ........................0 ........................0 ........................0 ........................0 ........................051. Wyoming............................WY ........................0 ........................0 ........................0 ........................0 ........................0 ........................0 ........................0 ........................052. American Samoa.................AS ........................0 ........................0 ........................0 ........................0 ........................0 ........................0 ........................0 ........................053. Guam.................................GU ........................0 ........................0 ........................0 ........................0 ........................0 ........................0 ........................0 ........................054. Puerto Rico.........................PR ........................0 ........................0 ........................0 ........................0 ........................0 ........................0 ........................0 ........................055. US Virgin Islands..................VI ........................0 ........................0 ........................0 ........................0 ........................0 ........................0 ........................0 ........................056. Canada...............................CN ........................0 ........................0 ........................0 ........................0 ........................0 ........................0 ........................0 ........................057. Aggregate Other Alien.........OT ........................0 ........................0 ........................0 ........................0 ........................0 ........................0 ........................0 ........................058. Totals...................................... ........................0 ........................0 ........................0 ........................0 ...............48,000 ........................0 ........................2 .............693,456
DETAILS OF WRITE-INS5701. ................................................ ........................0 ........................0 ........................0 ........................0 ........................0 ........................0 ........................0 ........................05702. ................................................ ........................0 ........................0 ........................0 ........................0 ........................0 ........................0 ........................0 ........................05703. ................................................ ........................0 ........................0 ........................0 ........................0 ........................0 ........................0 ........................0 ........................05798. Summary of remaining write-ins for
Line 57 from overflow page...... ........................0 ........................0 ........................0 ........................0 ........................0 ........................0 ........................0 ........................05799. Totals (Lines 5701 thru 5703 +
5798) (Line 57 above).............. ........................0 ........................0 ........................0 ........................0 ........................0 ........................0 ........................0 ........................0

Supplement for the year 2002 of TWIN CITY FIRE INSURANCE COMPANY
SUPA3
*29459200245000100*
Designate the type of health care SUPPLEMENT "A" TO SCHEDULE Tproviders reported on this page. EXHIBIT OF MEDICAL MALPRACTICE PREMIUMS WRITTENOther Health Care Professionals, Including Dentists ALLOCATED BY STATES AND TERRITORIES
1 2 Direct Losses Paid 5 Direct Losses Unpaid 83 4 6 7 Direct
LossesIncurred
Direct Direct Number Direct Number ButPremiums Premiums of Losses Amount of Not
States, Etc. Written Earned Amount Claims Incurred Reported Claims Reported1. Alabama..............................AL ........................0 ........................0 ........................0 ........................0 ........................0 ........................0 ........................0 ........................02. Alaska.................................AK ........................0 ........................0 ........................0 ........................0 ........................0 ........................0 ........................0 ........................03. Arizona................................AZ ........................0 ........................0 ........................0 ........................0 ........................0 ........................0 ........................0 ........................04. Arkansas.............................AR ........................0 ........................0 ........................0 ........................0 ........................0 ........................0 ........................0 ........................05. California.............................CA ........................0 ........................0 ........................0 ........................0 ........................0 ........................0 ........................0 ........................06. Colorado.............................CO ........................0 ........................0 ........................0 ........................0 ........................0 ........................0 ........................0 ........................07. Connecticut.........................CT ........................0 ........................0 ........................0 ........................0 ........................0 ........................0 ........................0 ........................08. Delaware.............................DE ........................0 ........................0 ........................0 ........................0 ........................0 ........................0 ........................0 ........................09. District of Columbia.............DC ........................0 ........................0 ........................0 ........................0 ........................0 ........................0 ........................0 ........................0
10. Florida.................................FL ........................0 ........................0 ........................0 ........................0 ........................0 ........................0 ........................0 ........................011. Georgia...............................GA ........................0 ........................0 ........................0 ........................0 ........................0 ........................0 ........................0 ........................012. Hawaii..................................HI ........................0 ........................0 ........................0 ........................0 ........................0 ........................0 ........................0 ........................013. Idaho....................................ID ........................0 ........................0 ........................0 ........................0 ........................0 ........................0 ........................0 ........................014. Illinois...................................IL ........................0 ........................0 ........................0 ........................0 ........................0 ........................0 ........................0 ........................015. Indiana.................................IN ........................0 ........................0 ........................0 ........................0 ........................0 ........................0 ........................0 ........................016. Iowa.....................................IA ........................0 ........................0 ........................0 ........................0 ........................0 ........................0 ........................0 ........................017. Kansas................................KS ........................0 ........................0 ........................0 ........................0 ........................0 ........................0 ........................0 ........................018. Kentucky.............................KY ........................0 ........................0 ........................0 ........................0 ................(4,031) ........................0 ........................0 ................(4,165)19. Louisiana.............................LA ........................0 ........................0 ........................0 ........................0 ........................0 ........................0 ........................0 ........................020. Maine.................................ME ........................0 ........................0 ........................0 ........................0 ........................0 ........................0 ........................0 ........................021. Maryland............................MD ........................0 ........................0 ........................0 ........................0 ........................0 ........................0 ........................0 ........................022. Massachusetts....................MA ........................0 ........................0 ........................0 ........................0 ........................0 ........................0 ........................0 ........................023. Michigan..............................MI ........................0 ........................0 ........................0 ........................0 ........................0 ........................0 ........................0 ........................024. Minnesota...........................MN ........................0 ........................0 ........................0 ........................0 ........................0 ........................0 ........................0 ........................025. Mississippi..........................MS ........................0 ........................0 ........................0 ........................0 ........................0 ........................0 ........................0 ........................026. Missouri..............................MO ........................0 ........................0 ........................0 ........................0 ............(258,673) ........................0 ........................0 ............(273,459)27. Montana..............................MT ........................0 ........................0 ........................0 ........................0 ........................0 ........................0 ........................0 ........................028. Nebraska............................NE ........................0 ........................0 ........................0 ........................0 ........................0 ........................0 ........................0 ........................029. Nevada...............................NV ........................0 ........................0 ........................0 ........................0 ........................0 ........................0 ........................0 ........................030. New Hampshire..................NH ........................0 ........................0 ........................0 ........................0 ........................0 ........................0 ........................0 ........................031. New Jersey..........................NJ ........................0 ........................0 ........................0 ........................0 ........................0 ........................0 ........................0 ........................032. New Mexico........................NM ........................0 ........................0 ........................0 ........................0 ........................0 ........................0 ........................0 ........................033. New York............................NY ........................0 ........................0 ...............90,000 ......................26 ............(230,001) .............284,924 ........................3 ........................034. North Carolina.....................NC ........................0 ........................0 ........................0 ........................0 ........................0 ........................0 ........................0 ........................035. North Dakota.......................ND ........................0 ........................0 ........................0 ........................0 ........................0 ........................0 ........................0 ........................036. Ohio....................................OH ........................0 ........................0 ........................0 ........................0 ........................0 ........................0 ........................0 ........................037. Oklahoma...........................OK ........................0 ........................0 ........................0 ........................0 ........................0 ........................0 ........................0 ........................038. Oregon...............................OR ........................0 ........................0 ........................0 ........................0 ........................0 ........................0 ........................0 ........................039. Pennsylvania.......................PA ........................0 ........................0 ........................0 ........................0 ........................0 ........................0 ........................0 ........................040. Rhode Island........................RI ........................0 ........................0 ........................0 ........................0 ........................0 ........................0 ........................0 ........................041. South Carolina.....................SC ........................0 ........................0 ........................0 ........................0 ........................0 ........................0 ........................0 ........................042. South Dakota......................SD ........................0 ........................0 ........................0 ........................0 ........................0 ........................0 ........................0 ........................043. Tennessee..........................TN ........................0 ........................0 ........................0 ........................0 ........................0 ........................0 ........................0 ........................044. Texas..................................TX ........................0 ........................0 ........................0 ........................0 .............241,588 ........................0 ........................0 ..............(69,050)45. Utah....................................UT ........................0 ........................0 ........................0 ........................0 ........................0 ........................0 ........................0 ........................046. Vermont...............................VT ........................0 ........................0 ........................0 ........................0 ........................0 ........................0 ........................0 ........................047. Virginia................................VA ........................0 ........................0 ........................0 ........................0 ........................0 ........................0 ........................0 ........................048. Washington........................WA ........................0 ........................0 ........................0 ........................0 ........................0 ........................0 ........................0 ........................049. West Virginia......................WV ........................0 ........................0 ........................0 ........................0 ........................0 ........................0 ........................0 ........................050. Wisconsin............................WI ........................0 ........................0 ........................0 ........................0 ........................0 ........................0 ........................0 ........................051. Wyoming............................WY ........................0 ........................0 ........................0 ........................0 ........................0 ........................0 ........................0 ........................052. American Samoa.................AS ........................0 ........................0 ........................0 ........................0 ........................0 ........................0 ........................0 ........................053. Guam.................................GU ........................0 ........................0 ........................0 ........................0 ........................0 ........................0 ........................0 ........................054. Puerto Rico.........................PR ........................0 ........................0 ........................0 ........................0 ........................0 ........................0 ........................0 ........................055. US Virgin Islands..................VI ........................0 ........................0 ........................0 ........................0 ........................0 ........................0 ........................0 ........................056. Canada...............................CN ........................0 ........................0 ........................0 ........................0 ........................0 ........................0 ........................0 ........................057. Aggregate Other Alien.........OT ........................0 ........................0 ........................0 ........................0 ........................0 ........................0 ........................0 ........................058. Totals...................................... ........................0 ........................0 ...............90,000 ......................26 ............(251,117) .............284,924 ........................3 ............(346,674)
DETAILS OF WRITE-INS5701. ................................................ ........................0 ........................0 ........................0 ........................0 ........................0 ........................0 ........................0 ........................05702. ................................................ ........................0 ........................0 ........................0 ........................0 ........................0 ........................0 ........................0 ........................05703. ................................................ ........................0 ........................0 ........................0 ........................0 ........................0 ........................0 ........................0 ........................05798. Summary of remaining write-ins for
Line 57 from overflow page...... ........................0 ........................0 ........................0 ........................0 ........................0 ........................0 ........................0 ........................05799. Totals (Lines 5701 thru 5703 +
5798) (Line 57 above).............. ........................0 ........................0 ........................0 ........................0 ........................0 ........................0 ........................0 ........................0

Supplement for the year 2002 of TWIN CITY FIRE INSURANCE COMPANY
SUPA4
*29459200245000100*
Designate the type of health care SUPPLEMENT "A" TO SCHEDULE Tproviders reported on this page. EXHIBIT OF MEDICAL MALPRACTICE PREMIUMS WRITTENOther Health Care Facilities ALLOCATED BY STATES AND TERRITORIES
1 2 Direct Losses Paid 5 Direct Losses Unpaid 83 4 6 7 Direct
LossesIncurred
Direct Direct Number Direct Number ButPremiums Premiums of Losses Amount of Not
States, Etc. Written Earned Amount Claims Incurred Reported Claims Reported1. Alabama..............................AL ........................0 ........................0 ........................0 ........................0 ........................0 ........................0 ........................0 ........................02. Alaska.................................AK ........................0 ........................0 ........................0 ........................0 ........................0 ........................0 ........................0 ........................03. Arizona................................AZ ........................0 ........................0 ........................0 ........................0 ........................0 ........................0 ........................0 ........................04. Arkansas.............................AR ........................0 ........................0 ........................0 ........................0 ........................0 ........................0 ........................0 ........................05. California.............................CA ........................0 ........................0 ........................0 ........................0 ........................0 ........................0 ........................0 ........................06. Colorado.............................CO ........................0 ........................0 ........................0 ........................0 ........................0 ........................0 ........................0 ........................07. Connecticut.........................CT ........................0 ........................0 ........................0 ........................0 ........................0 ........................0 ........................0 ........................08. Delaware.............................DE ........................0 ........................0 ........................0 ........................0 ........................0 ........................0 ........................0 ........................09. District of Columbia.............DC ........................0 ........................0 ........................0 ........................0 ........................0 ........................0 ........................0 ........................0
10. Florida.................................FL ........................0 ........................0 ........................0 ........................0 ........................0 ........................0 ........................0 ........................011. Georgia...............................GA ........................0 ........................0 ........................0 ........................0 ........................0 ........................0 ........................0 ........................012. Hawaii..................................HI ........................0 ........................0 ........................0 ........................0 ........................0 ........................0 ........................0 ........................013. Idaho....................................ID ........................0 ........................0 ........................0 ........................0 ........................0 ........................0 ........................0 ........................014. Illinois...................................IL ........................0 ........................0 ........................0 ........................0 ........................0 ........................0 ........................0 ........................015. Indiana.................................IN ........................0 ........................0 ........................0 ........................0 ........................0 ........................0 ........................0 ........................016. Iowa.....................................IA ........................0 ........................0 ........................0 ........................0 ........................0 ........................0 ........................0 ........................017. Kansas................................KS ........................0 ........................0 ........................0 ........................0 ........................0 ........................0 ........................0 ........................018. Kentucky.............................KY ........................0 ........................0 ........................0 ........................0 ....................114 ........................0 ........................0 ....................11419. Louisiana.............................LA ........................0 ........................0 ........................0 ........................0 ........................0 ........................0 ........................0 ........................020. Maine.................................ME ........................0 ........................0 ........................0 ........................0 ........................0 ........................0 ........................0 ........................021. Maryland............................MD ........................0 ........................0 ........................0 ........................0 ........................0 ........................0 ........................0 ........................022. Massachusetts....................MA ........................0 ........................0 ........................0 ........................0 ........................0 ........................0 ........................0 ........................023. Michigan..............................MI ........................0 ........................0 ........................0 ........................0 ........................0 ........................0 ........................0 ........................024. Minnesota...........................MN ........................0 ........................0 ........................0 ........................0 ........................0 ........................0 ........................0 ........................025. Mississippi..........................MS ........................0 ........................0 ........................0 ........................0 ........................0 ........................0 ........................0 ........................026. Missouri..............................MO ........................0 ........................0 ........................0 ........................0 .................2,148 ........................0 ........................0 .................2,14827. Montana..............................MT ........................0 ........................0 ........................0 ........................0 ........................0 ........................0 ........................0 ........................028. Nebraska............................NE ........................0 ........................0 ........................0 ........................0 ........................0 ........................0 ........................0 ........................029. Nevada...............................NV ........................0 ........................0 ........................0 ........................0 ........................0 ........................0 ........................0 ........................030. New Hampshire..................NH ........................0 ........................0 ........................0 ........................0 ........................0 ........................0 ........................0 ........................031. New Jersey..........................NJ ........................0 ........................0 ........................0 ........................0 ........................0 ........................0 ........................0 ........................032. New Mexico........................NM ........................0 ........................0 ........................0 ........................0 ........................0 ........................0 ........................0 ........................033. New York............................NY ........................0 ........................0 ........................0 ........................0 ........................0 ........................0 ........................0 ........................034. North Carolina.....................NC ........................0 ........................0 ........................0 ........................0 ........................0 ........................0 ........................0 ........................035. North Dakota.......................ND ........................0 ........................0 ........................0 ........................0 ........................0 ........................0 ........................0 ........................036. Ohio....................................OH ........................0 ........................0 ........................0 ........................0 ........................0 ........................0 ........................0 ........................037. Oklahoma...........................OK ........................0 ........................0 ........................0 ........................0 ........................0 ........................0 ........................0 ........................038. Oregon...............................OR ........................0 ........................0 ........................0 ........................0 ........................0 ........................0 ........................0 ........................039. Pennsylvania.......................PA ........................0 ........................0 ........................0 ........................0 ........................0 ........................0 ........................0 ........................040. Rhode Island........................RI ........................0 ........................0 ........................0 ........................0 ........................0 ........................0 ........................0 ........................041. South Carolina.....................SC ........................0 ........................0 ........................0 ........................0 ........................0 ........................0 ........................0 ........................042. South Dakota......................SD ........................0 ........................0 ........................0 ........................0 ........................0 ........................0 ........................0 ........................043. Tennessee..........................TN ........................0 ........................0 ........................0 ........................0 ........................0 ........................0 ........................0 ........................044. Texas..................................TX ........................0 ........................0 ........................0 ........................0 ........................0 ........................0 ........................0 ........................045. Utah....................................UT ........................0 ........................0 ........................0 ........................0 ........................0 ........................0 ........................0 ........................046. Vermont...............................VT ........................0 ........................0 ........................0 ........................0 ........................0 ........................0 ........................0 ........................047. Virginia................................VA ........................0 ........................0 ........................0 ........................0 ........................0 ........................0 ........................0 ........................048. Washington........................WA ........................0 ........................0 ........................0 ........................0 ........................0 ........................0 ........................0 ........................049. West Virginia......................WV ........................0 ........................0 ........................0 ........................0 ........................0 ........................0 ........................0 ........................050. Wisconsin............................WI ........................0 ........................0 ........................0 ........................0 ........................0 ........................0 ........................0 ........................051. Wyoming............................WY ........................0 ........................0 ........................0 ........................0 ........................0 ........................0 ........................0 ........................052. American Samoa.................AS ........................0 ........................0 ........................0 ........................0 ........................0 ........................0 ........................0 ........................053. Guam.................................GU ........................0 ........................0 ........................0 ........................0 ........................0 ........................0 ........................0 ........................054. Puerto Rico.........................PR ........................0 ........................0 ........................0 ........................0 ........................0 ........................0 ........................0 ........................055. US Virgin Islands..................VI ........................0 ........................0 ........................0 ........................0 ........................0 ........................0 ........................0 ........................056. Canada...............................CN ........................0 ........................0 ........................0 ........................0 ........................0 ........................0 ........................0 ........................057. Aggregate Other Alien.........OT ........................0 ........................0 ........................0 ........................0 ........................0 ........................0 ........................0 ........................058. Totals...................................... ........................0 ........................0 ........................0 ........................0 .................2,262 ........................0 ........................0 .................2,262
DETAILS OF WRITE-INS5701. ................................................ ........................0 ........................0 ........................0 ........................0 ........................0 ........................0 ........................0 ........................05702. ................................................ ........................0 ........................0 ........................0 ........................0 ........................0 ........................0 ........................0 ........................05703. ................................................ ........................0 ........................0 ........................0 ........................0 ........................0 ........................0 ........................0 ........................05798. Summary of remaining write-ins for
Line 57 from overflow page...... ........................0 ........................0 ........................0 ........................0 ........................0 ........................0 ........................0 ........................05799. Totals (Lines 5701 thru 5703 +
5798) (Line 57 above).............. ........................0 ........................0 ........................0 ........................0 ........................0 ........................0 ........................0 ........................0

Supplement for the year 2002 of TWIN CITY FIRE INSURANCE COMPANY
SUPA5, SUPA6
Supp. A to Sch. T-Medical Malpractice Policies Effective Prior to 1/1/76NONE
Supp. A to Sch. T-Overflow PageNONE