ubs outlook 2016
TRANSCRIPT
UBS House ViewYear Ahead 2016
Chief Investment Office WMDecember 2015

UBS House View – Year Ahead 20162
Foreword
Dear reader,
Welcome to our UBS House View: Year Ahead 2016.
I n this, and in the accompanying Years Ahead publication, the global CIO team sets out our views on 2016 and beyond.
2015 was a year of big moves – from the removal of the Swiss franc floor, to the crisis in Greece, and equity market volatility in the third quarter. We face a world in transition – from drivers of growth in China and the emerging markets, to political structures in Europe, and the future of global monetary intervention. In such a world, we can expect more surprises. So, as we look to the year ahead, we seek to be as creative and thoughtful as possible in our analysis of the future.
This year we also present our most comprehen-sive digital offering ever: ubs.com/houseview hosts all of our Year Ahead 2016 related con-tent, available across platforms, including mobile and tablet. We are also introducing a “My House View” feature, allowing you to compare your portfolio to the UBS House View, and to find the most personally relevant parts of our compre-hensive investment content.
We hope you find our new digital experience useful and engaging, and that this UBS House View: Year Ahead 2016 helps guide you, and your portfolio, successfully through our “world in transition.”
Mark HaefeleGlobal Chief Investment OfficerUBS Wealth Management
Jürg ZeltnerPresidentUBS Wealth Management

UBS House View:Year Ahead 2016This report has been prepared by UBS AG, UBS Switzerland AG and UBS Financial Services Inc. (”UBS FS”).
Editor-in-chiefKiran Ganesh
Product ManagementJoscelin Tosoni
EditorPatricia FletcherAndrew DeBoo
Design concept Rodrigo Jiménez
LayoutRodrigo JiménezLinda Sutter
Desktop publishingWerner KuonenMargrit OppligerElena VendraminettoCognizant Group
IllustrationsRodrigo Jiménez
Cover & 3D ArtKatlego Phatlane
PhotosGian Marco Castelberg, ZurichVernon Leow, Vital Images SingaporeGeorge Stilabower, New York
Picturesgettyimages.comistockphoto.com
Editorial deadline24 November 2015
LanguagesPublished in English, German, Italian, French, Spanish, Portuguese, Russian, Chinese (traditional and simplified) and Japanese.
Order or subscribeAs a UBS client you can subscribe to the printed version of UBS House View: Year Ahead 2016 via your client advisor or via the Printed & Branded Products mailbox: [email protected].
Electronic subscription is also available via Investment Views on the UBS e-banking platform.
SAP-Nr. 84536E-1501
Impressum
ab
We select the most pertinent analysis and insights to your portfolio. Tailored reading for you.
My House View
We are launching an interactive filter that compares your portfolio to the UBS House View and retrieves the most relevant investment content. Specific to your situation.
See ubs.com/myhouseview for further information.

Contents
06 World in transition
12 2015 in review and a look ahead
14 Six questions for 2016
21 Global economic outlook
23 US23 Europe23 APAC24 Emerging markets24 Switzerland
25 Turning forecasts into investments
28 Global tactical positioning
30 Equities30 Global32 US33 Eurozone34 Emerging markets35 Japan36 UK37 Switzerland38 APAC
39 Bonds
44 Alternatives
47 Currencies
50 Commodities
52 Real Estate
54 Disclaimer

UBS House View – Year Ahead 20166
World in transition
Mark Haefele Global Chief Investment Officer
2015 was a year in which major developed equity markets rallied 20%, dived 20%, and rose back again. How did you navigate the big waves? In such a market, even some of the world’s most respected fund managers tumbled into double-digit negative performance.
Almost every month brought “surprises.” Many things outside of our 2015 base case came to pass:• The Swiss National Bank abandoned its 1.20 currency floor against the euro.• Far more Eurozone government bonds traded with yields in negative territory.• The second quarter saw a rapid bond market sell-off.• The Chinese equity bubble just kept inflating – until it didn’t anymore.• Greece got close to leaving the Eurozone.• China abruptly moved toward allowing the yuan to float freely.• Volatility spiked to its highest levels since 2008.• Many thought Chinese growth was falling uncontrollably.• Emerging market currencies had a deep sell-off.• The oil market has still not cleared.• The Fed appeared to add global growth concerns as a reason not to move
interest rates.
All that considered, at the time of writing, our global model portfolios are in positive territory year-to-date, with most delivering performance within range of our long-term capital market assumptions.
Getting the big things rightSurprises cannot be avoided – and that is the art and science of building a robust portfolio. First and foremost, a robust portfolio focuses on getting the bigger things right: strategic asset allocation and risk management.
In part, this means: Accepting the un-expected. At the start of 2015, the Swiss National Bank’s decision to re-move its currency cap against the euro came against our forecasts: we held an underweight position in the Swiss franc. However, our principle to limit the scale of tactical positions reduced the portfolio impact. Furthermore, our strategic decision to hedge portfolios against currency risk limited volatility for Swiss investors.
Staying true to your investment prin-ciples. Through August, the relatively muted performance of high quality bonds proved frustrating against the backdrop of plunging equity markets. While we hold an underweight in high grade bonds, they still have a role in diversifying our strategic portfolios. This principle of diversifying again began helping performance by September.
Working your process. With the sharp drop in equities through August and September, we re-examined our assumptions on the state of global growth, and concluded that “staying the course” through the volatility made sense. Working through an investment process fights the behav-ioral biases that often destroy perfor-mance.
A world in transitionFor me, some of the most interesting things about 2016 are the transitions.The US faces a transition away from

ubs.com/houseview 7
an era of zero interest rates/zero infla-tion, and we will learn the identity of Barack Obama’s successor.
With the constitutionality of European quantitative easing settled, Europe continues to transition as a political and economic bloc, which brings new challenges at every turn.
China is transitioning both from a manufacturing-led to a consumer-led eco nomy, and from a state-directed, to a free market. Both shifts will create uncertainty over China’s growth path and the outlook for capital flows.
Other emerging markets will need to find new growth drivers, and will likely be pressured by US interest rate hikes.
Investment viewWe enter the year positioned with an investment view based on several predictions:• A modest acceleration in global
growth will happen in 2016.• 2015 did not mark the peak of the
cycle for risky assets.• China can both slow quickly, and
avoid a hard landing.• We might be close to the bottom of
the EM and commodity downturn.• Inflation will return, but not with
destructive force.• The political elections will cause lots
of drama but less tragedy in 2016.
Our key tactical positions for the year ahead include an overweight position in equities relative to high grade bonds, a regional preference for Euro-zone and Japanese equities, and an overweight position in EUR high yield and US investment grade credit.
I wish you a healthy, successful, and interesting year ahead.
2015“Rights and wrongs”
Right
• US dollar vs euro: The Euro-pean Central Bank extended its easing program, sending the EUR to a decade-low.
• British pound vs Australian dollar. The GBP continued its appreciation in 2015, while the AUD suffered from weak Chinese commodity demand.
• Overweight equities: An overweight position in equities has been painful at times but, at the time of writing, has proved the right call for the year; global equities are up 2%.
Wrong
• Overweight Swiss equities suffered after the sudden strengthening of the Swiss franc affected the outlook for exporters.
• Underweight Swiss franc was caught on the wrong side of the Swiss National Bank’s decision to stop intervening to weaken the franc.
• Overweight US high yield credit fell short of expecta-tions amid concern about the financial health of US-based oil drillers.
2016 Ups or downs?
UpEquitiesGlobal growthInflationUS interest ratesOil
DownGovernment bondsEuro interest rates
MixedThe US dollarThe euro
Same againVolatility
World in transition

UBS House View – Year Ahead 20168
Regional introductions
US Europe
Mike Ryan Chief Investment StrategistWealth Management Americas
Themis Themistocleous Head of European Investment Office
European investors have had another memorable year in 2015, but not necessarily for the right reasons. Volatility, uncertainty and political upheaval made the investment landscape difficult.
Those who kept their money close to home would have been pleased with the rally in the first quarter, but that home bias would have proved costly in 3Q and 4Q. The threat of Grexit caused markets to sell off sharply. Concerns about China brought European markets down again. This showed the need to be prepared for the unexpected and to diversify, both across regions and asset classes.
Looking to 2016, many clients I speak to still have a lot of cash in their portfolios, perhaps scarred by the 2015 vola tility. But the 2015 experience taught us – with Euro-pean equities up around 15% – to take a position and stay invested. Large cash holdings have proven a costly investment, and this is likely to remain the case in 2016.
We still expect risky assets to outperform in 2016. We like Europe given the economic recovery, the ECB’s readiness to loosen monetary conditions if need be, and attractive valu-ation of asset classes such as equities and high yield bonds.Eurozone equities should go on benefiting from the Euro-pean economic recovery, weak euro and operational gear-ing, and with earnings now starting to rise from a cyclical low, upside potential is significant. Likewise, high yield issu-ers could ride the recovery and benefit from the low cost of borrowing.
Risks are still there. The global economic recovery is fragile, and political turmoil in Europe – Grexit, Brexit or something else – is always possible, so investors will need to stay alert and diversified.
US investors who stuck to familiar asset classes fared better in recent years. In 2013 and 2014, a standard 60/40 mix of US stocks and bonds handily beat a portfolio that included “diversifying” assets like international stocks, credit, com-modities or alternatives. We expected that to change in 2015, and in some ways it did. But when the lights go out, we’ll likely look back on this year as one in which dollar strength eroded returns on unhedged international invest-ments, in which the downside risks we thought relegated to the commodities portion of the portfolio unexpectedly leaked into other areas like credit.
In truth, investment returns were lackluster. Including FX-hedged international equities would have improved overall portfolio returns, but not enough to align them with our long-term estimates.
Thankfully, large swings in currency levels or commodity prices have diminished impacts over time, and we expect a more stable US dollar and commodity prices in 2016. In the US, we focus on those sectors leveraged to the ongoing US economic expansion that generally have favorable earn-ings momentum, and/or trade at compelling attractive valu-ations. We also still favor small caps over large and mid caps. In fixed income, we still prefer investment grade US corporate bonds. IG bonds feature wider spreads than they have for several years, and therefore already reflect the risks inherent in the credit cycle. The asset class remains an important portfolio diversifier during periods of increased volatility and sell-off in risk assets.
In 2015, stingy markets offered no magic formula for beat-ing benchmarks. We look to the year ahead with optimism, but investors will need to keep return expectations con-tained, raise their tolerance for volatility, and stay selective.

ubs.com/houseview 9
Regional introductions
APAC
Min Lan Tan Head of APAC Investment Office
Asian investors began 2015 with a robust equity market, which kept capital outflows contained. Then the Chinese equity bubble burst, and China shifted its forex regime. Spooked investors feared a 1997 redux as currencies crum-bled and regional financial conditions tightened, but this wave also passed.
Asia’s growth should moderate in 2016. While capacity overhangs remain, and the region’s credit cycle is mature, regional credit markets and external accounts show limited evidence of stress. Regional policy rates can still decline, and low commodity prices and spare capacity should restrain inflation. China’s shift toward services from manufacturing should continue, benefiting internet, insurance, healthcare and tourism segments.
Ample domestic liquidity and intensified policy support should prevent a hard landing in China, keeping regional sentiment afloat, despite an impending Fed rate hike and US dollar strength. We thus view South Asian currencies, such as the Malaysian ringgit and the Indonesian rupiah, with caution. While higher oil prices should boost Malay-sia’s prospects, a gradual lift will keep inflation expecta-tions anchored regionally.
South Asia is particularly exposed to the credit slowdown, but we expect expansive policy to cushion gradual credit cycle deflation. We are also optimistic on the momentum of regional reforms, particularly in Singapore, India and China; valuations in India reflect this, China and Singapore less so.
Asian equities could rerate, given improving cash flow generation and a sequential recovery in earnings, driven by greater capital discipline and improved return on assets. This also bodes well for Asian credit, though more limited returns compared to equities are likely.
Despite strong performance in April, investors in emerging markets have had another lackluster year. Concerns about a slowdown in China and weak commodity prices led to poor returns. Policy missteps in countries such as Brazil and Russia compounded investors’ woes. Thus EM equities, cur-rencies, and local currency government bonds performed poorly, though investors holding hard currency corporate and sovereign bonds in a diversified portfolio could smooth this roughness somewhat.
Entering 4Q, EM assets rallied strongly from their lows. Catalysts include that China shows signs of stabilizing, leading indicators in several EM are improving, the Fed has held off interest rate hikes, and monetary policy in Europe and Japan is dovish. Low valuations and very nega-tive sentiment toward EM, reflected in light positioning by institutional investors, may have left room for markets to rebound.
Investors need patience. They should watch China, given its link to other EM and commodities. A moderate and con-trolled slowdown would alleviate fears of a rapid drop of the yuan, a weighty tail risk for EM currencies. Also, while the abundance of liquidity supports emerging markets, low global interest rates may be suggesting something perni-cious about global growth.
Nevertheless, though EM bulls may need to bide their time, we believe a more balanced stance, with a neutral rather than an underweight position in EM equities in global port-folios, is appropriate.
Perhaps today more than ever, we note the heterogeneity of EM. As was the case with hard-currency bonds in 2015, investors who diversify carefully across EM assets and geographies can improve their returns next year.
Emerging markets
Jorge Mariscal Head of EM Investment Office

UBS House View – Year Ahead 201610
Switzerland
UHNW individuals have advantages over other types of investors – they can tolerate illiquidity, allocate globally, and do not face agency issues as do professional money managers. These advantages created investment oppor-tunities this year, and the pattern for next year looks similar.
Central banks kept yields low again in 2015. Particularly useful was UHNW investors’ tolerance for illiquidity, as they generated additional yield both by investing in US and European senior loans, and by harvesting the even larger illiquidity premium in private assets.
UHNW investors also utilized their unconstrained global investment mandate to good effect in 2015. Cross equity-market hedging is an example. When substantial issuance of structured products in Asia distorted equity option mar-kets, some unconstrained UHNW investors capitalized by hedging global portfolios using relatively inexpensive Asian equity market puts. During the market sell-off in 2H 2015, these UHNW investors made a handsome profit.
We believe UHNW investors will go on enjoying investment advantages over their professional and retail counterparts in 2016. As major financial institutions are constrained in risk taking by tighter regulations, this creates elevated risk premiums that flexible UHNW investors can harvest. If diverging central bank policy creates financial market volatility which triggers risk aversion in professional inves-tors, this is another opportunity for unconstrained UHNW investors. And the long-term view in oncology, where science is striding toward cures for cancer, is yet another opportunity well suited to UHNW individuals.
When the Swiss National Bank (SNB) abandoned its CHF minimum exchange rate against the EUR on January 15, 2015, many Swiss investors learned the hard way how a strong home bias can hurt an investment portfolio. The Swiss equity market lost some 14% in the two days there-after, while US and European equities went on rising. Hold-ing a globally diversified portfolio, while hedging currency risks – which we believe is key for successful long-term portfolio management – would have been wiser.
The next challenge was negative money market and bond yields. With the SNB pushing three-month Libor rates to –0.75%, the whole CHF government benchmark yield curve up to 10 years and more moved into negative terri-tory. Conservative fixed income investors may be faced with this low or even negative yield environment for some time as the ECB continues pushing down rates through its QE program.
So where can Swiss investors turn? If risk tolerance allows, we still advise a portion of equities, broadly diversified across global markets. We should see decent earnings growth as the underlying economic recovery in Europe and the US continues, and the slowdown in EM growth transi-tions into a gradual re-acceleration. Within Swiss equities we like the mid-cap segment for its strong balance sheets and superior organic growth. We also highlight those divi-dend-paying Swiss stocks with potential for income tax-free distributions. Alternative asset classes also present an opportunity to avoid negative bond yields. Hedge funds in particular have proven a reliable source of yields, while showing good portfolio diversification characteristics.
As we also expect next year to be challenging, Swiss inves-tors in particular should be aware of the benefits a globally diversified and currency-hedged portfolio offers.
Ultra High Net Worth
Simon Smiles Head of UHNW & Alternatives
Daniel Kalt Head of Swiss Investment Office
Regional introductions

1 EUR02015
66.6%
Bondsdisappoint
2016 Bondreturns
€60bn€60bn
1929 1987 20082011 2015
3Q Equities
?
Emergingmarkets
Greatest2016 risk
sub-6%>60%
100mOlympic
gold
75%Usain Bolt
Prior12 months
June 2015
1 Fr.2015
BondBond
BondBond
BondBond
Bondmarkets
2016Commodities
2016
44%Germany
England
6%
EuropeanFootball
Champion
60%
HillaryClinton
No or littleimpact
Businessimpact
0-5%
Return forbalancedportfolios
High or veryhigh impact
Little tono impact.
China hardlanding
CNY3%
20
2015 2016
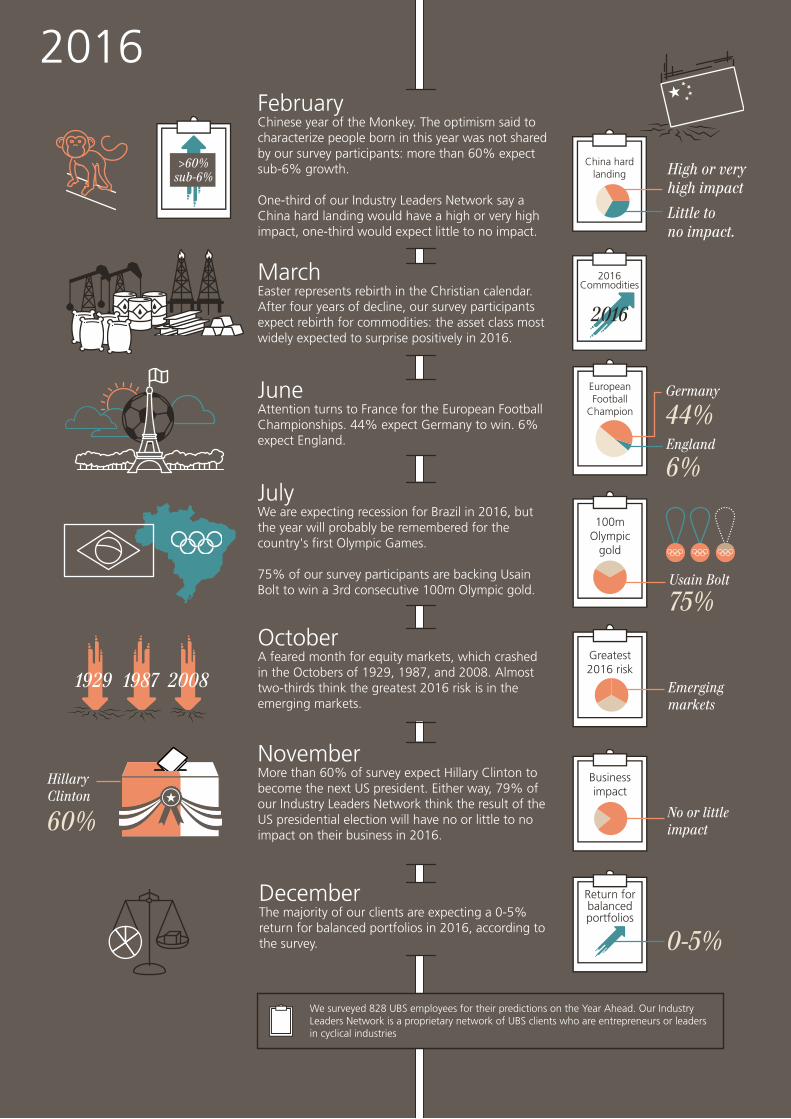
We surveyed 828 UBS employees for their predictions on the Year Ahead. Our Industry Leaders Network is a proprietary network of UBS clients who are entrepreneurs or leaders in cyclical industries
FebruaryChinese year of the Monkey. The optimism said to characterize people born in this year was not shared by our survey participants: more than 60% expect sub-6% growth.
One-third of our Industry Leaders Network say a China hard landing would have a high or very high impact, one-third would expect little to no impact.
MarchEaster represents rebirth in the Christian calendar. After four years of decline, our survey participants expect rebirth for commodities: the asset class most widely expected to surprise positively in 2016.
NovemberMore than 60% of survey expect Hillary Clinton to become the next US president. Either way, 79% of our Industry Leaders Network think the result of the US presidential election will have no or little to no impact on their business in 2016.
October A feared month for equity markets, which crashed in the Octobers of 1929, 1987, and 2008. Almost two-thirds think the greatest 2016 risk is in the emerging markets.
JuneAttention turns to France for the European Football Championships. 44% expect Germany to win. 6% expect England.
JulyWe are expecting recession for Brazil in 2016, but the year will probably be remembered for the country's first Olympic Games.
75% of our survey participants are backing Usain Bolt to win a 3rd consecutive 100m Olympic gold.
DecemberThe majority of our clients are expecting a 0-5% return for balanced portfolios in 2016, according to the survey.
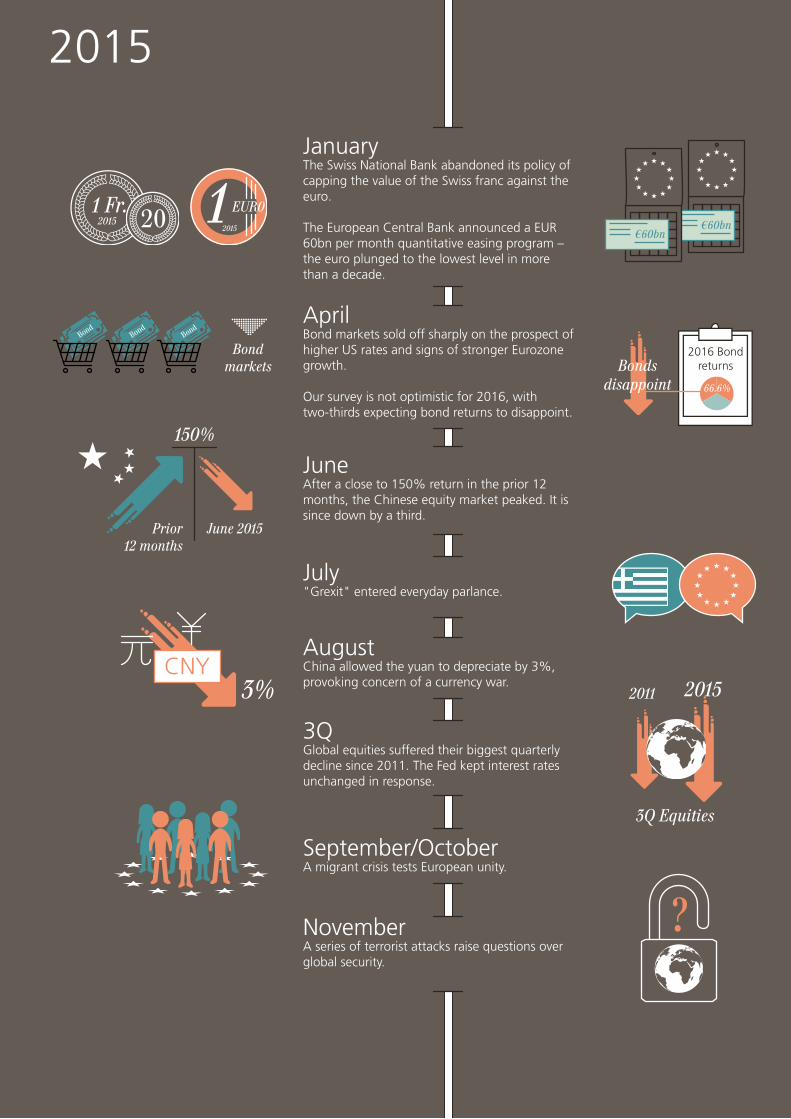
JanuaryThe Swiss National Bank abandoned its policy of capping the value of the Swiss franc against the euro.
The European Central Bank announced a EUR 60bn per month quantitative easing program – the euro plunged to the lowest level in more than a decade.
NovemberA series of terrorist attacks raise questions over global security.
September/OctoberA migrant crisis tests European unity.
3QGlobal equities suffered their biggest quarterly decline since 2011. The Fed kept interest rates unchanged in response.
July "Grexit" entered everyday parlance.
JuneAfter a close to 150% return in the prior 12 months, the Chinese equity market peaked. It is since down by a third.
AprilBond markets sold off sharply on the prospect of higher US rates and signs of stronger Eurozone growth.
Our survey is not optimistic for 2016, with two-thirds expecting bond returns to disappoint.
AugustChina allowed the yuan to depreciate by 3%, provoking concern of a currency war.
150%
1 EUR02015
66.6%
Bondsdisappoint
2016 Bondreturns
€60bn€60bn
1929 1987 20082011 2015
3Q Equities
?
Emergingmarkets
Greatest2016 risk
sub-6%>60%
100mOlympic
gold
75%Usain Bolt
Prior12 months
June 2015
1 Fr.2015
BondBond
BondBond
BondBond
Bondmarkets
2016Commodities
2016
44%Germany
England
6%
EuropeanFootball
Champion
60%
HillaryClinton
No or littleimpact
Businessimpact
0-5%
Return forbalancedportfolios
High or veryhigh impact
Little tono impact.
China hardlanding
CNY3%
20
2015 2016
We surveyed 828 UBS employees for their predictions on the Year Ahead. Our Industry Leaders Network is a proprietary network of UBS clients who are entrepreneurs or leaders in cyclical industries
FebruaryChinese year of the Monkey. The optimism said to characterize people born in this year was not shared by our survey participants: more than 60% expect sub-6% growth.
One-third of our Industry Leaders Network say a China hard landing would have a high or very high impact, one-third would expect little to no impact.
MarchEaster represents rebirth in the Christian calendar. After four years of decline, our survey participants expect rebirth for commodities: the asset class most widely expected to surprise positively in 2016.
NovemberMore than 60% of survey expect Hillary Clinton to become the next US president. Either way, 79% of our Industry Leaders Network think the result of the US presidential election will have no or little to no impact on their business in 2016.
October A feared month for equity markets, which crashed in the Octobers of 1929, 1987, and 2008. Almost two-thirds think the greatest 2016 risk is in the emerging markets.
JuneAttention turns to France for the European Football Championships. 44% expect Germany to win. 6% expect England.
JulyWe are expecting recession for Brazil in 2016, but the year will probably be remembered for the country's first Olympic Games.
75% of our survey participants are backing Usain Bolt to win a 3rd consecutive 100m Olympic gold.
DecemberThe majority of our clients are expecting a 0-5% return for balanced portfolios in 2016, according to the survey.
JanuaryThe Swiss National Bank abandoned its policy of capping the value of the Swiss franc against the euro.
The European Central Bank announced a EUR 60bn per month quantitative easing program – the euro plunged to the lowest level in more than a decade.
NovemberA series of terrorist attacks raise questions over global security.
September/OctoberA migrant crisis tests European unity.
3QGlobal equities suffered their biggest quarterly decline since 2011. The Fed kept interest rates unchanged in response.
July "Grexit" entered everyday parlance.
JuneAfter a close to 150% return in the prior 12 months, the Chinese equity market peaked. It is since down by a third.
AprilBond markets sold off sharply on the prospect of higher US rates and signs of stronger Eurozone growth.
Our survey is not optimistic for 2016, with two-thirds expecting bond returns to disappoint.
AugustChina allowed the yuan to depreciate by 3%, provoking concern of a currency war.
150%

UBS House View – Year Ahead 201614
Six questions for 2016
To invest successfully in our world in tran-sition, it is important to ask the right ques-tions. Here, we try and identify “6 for 2016”: six of the key questions, the answers to which could define the out-come for financial markets next year.
Kiran Ganesh, Editor-in-chiefChristopher Swann, cross-asset strategist
ubs.com/houseview 15
1
Did 2015 mark the peak of the cycle for risky assets?
As we enter 2016, global equities and high yield credit remain below their peaks reached in 2015. Are we merely part way through a correction, or did this year mark the year of transition from bull to bear?
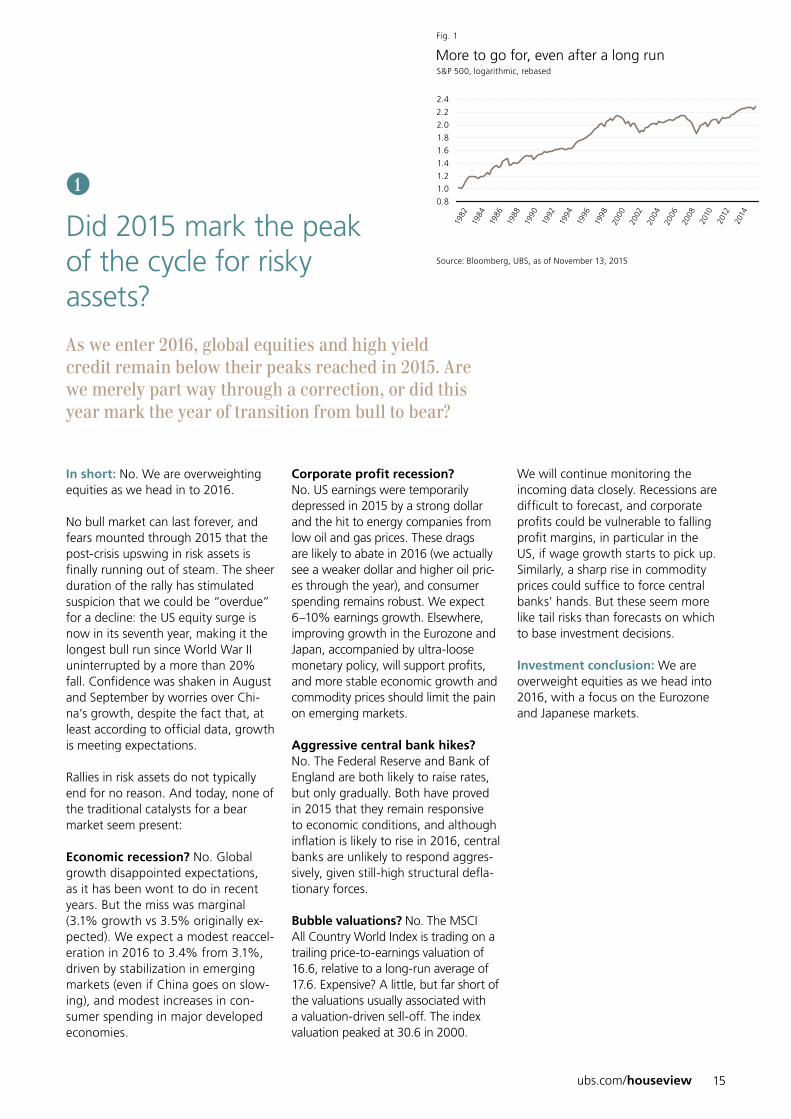
In short: No. We are overweighting equities as we head in to 2016.
No bull market can last forever, and fears mounted through 2015 that the post-crisis upswing in risk assets is finally running out of steam. The sheer duration of the rally has stimulated suspicion that we could be “overdue” for a decline: the US equity surge is now in its seventh year, making it the longest bull run since World War II uninterrupted by a more than 20% fall. Confidence was shaken in August and September by worries over Chi-na’s growth, despite the fact that, at least according to official data, growth is meeting expectations.
Rallies in risk assets do not typically end for no reason. And today, none of the traditional catalysts for a bear market seem present:
Economic recession? No. Global growth disappointed expectations, as it has been wont to do in recent years. But the miss was marginal (3.1% growth vs 3.5% originally ex-pected). We expect a modest reaccel-eration in 2016 to 3.4% from 3.1%, driven by stabilization in emerging markets (even if China goes on slow-ing), and modest increases in con-sumer spending in major developed economies.
Corporate profit recession? No. US earnings were temporarily depressed in 2015 by a strong dollar and the hit to energy companies from low oil and gas prices. These drags are likely to abate in 2016 (we actually see a weaker dollar and higher oil pric-es through the year), and consumer spending remains robust. We expect 6–10% earnings growth. Elsewhere, improving growth in the Eurozone and Japan, accompanied by ultra-loose monetary policy, will support profits, and more stable economic growth and commodity prices should limit the pain on emerging markets.
Aggressive central bank hikes? No. The Federal Reserve and Bank of England are both likely to raise rates, but only gradually. Both have proved in 2015 that they remain responsive to economic conditions, and although inflation is likely to rise in 2016, central banks are unlikely to respond aggres-sively, given still-high structural defla-tionary forces.
Bubble valuations? No. The MSCI All Country World Index is trading on a trailing price-to-earnings valuation of 16.6, relative to a long-run average of 17.6. Expensive? A little, but far short of the valuations usually associated with a valuation-driven sell-off. The index valuation peaked at 30.6 in 2000.
We will continue monitoring the incoming data closely. Recessions are difficult to forecast, and corporate profits could be vulnerable to falling profit margins, in particular in the US, if wage growth starts to pick up. Similarly, a sharp rise in commodity prices could suffice to force central banks’ hands. But these seem more like tail risks than forecasts on which to base investment decisions.
Investment conclusion: We are overweight equities as we head into 2016, with a focus on the Eurozone and Japanese markets.
Source: Bloomberg, UBS, as of November 13, 2015
More to go for, even aer a long runS&P 500, logarithmic, rebased
1.6
1.2
1.8
1.4
2.4
2.2
2.0
0.8
1.0
Fig. 1
2010
2008
2012
2014
1988
1990
1984
1986
1982
2004
2006
1996
1998
2000
2002
1992
1994
UBS House View – Year Ahead 201616
Six questions for 2016
Where do we stand on monetary policy?
Monetary policy seems set to diverge. The Fed is expected to tighten, while the ECB and Bank of Japan are on course to ease policy further. Where do we stand in the monetary policy cycle?
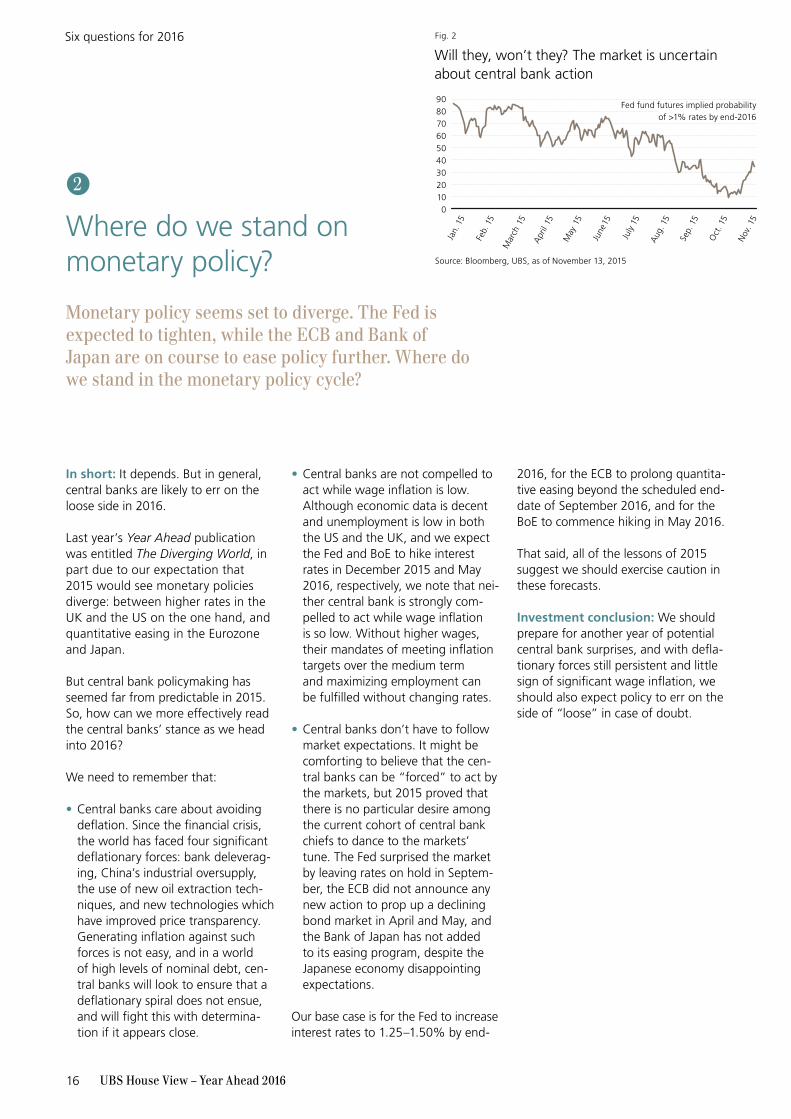
In short: It depends. But in general, central banks are likely to err on the loose side in 2016.
Last year’s Year Ahead publication was entitled The Diverging World, in part due to our expectation that 2015 would see monetary policies diverge: between higher rates in the UK and the US on the one hand, and quantitative easing in the Eurozone and Japan.
But central bank policymaking has seemed far from predictable in 2015. So, how can we more effectively read the central banks’ stance as we head into 2016?
We need to remember that:
• Central banks care about avoiding deflation. Since the financial crisis, the world has faced four significant deflationary forces: bank deleverag-ing, China’s industrial oversupply, the use of new oil extraction tech-niques, and new technologies which have improved price transparency. Generating inflation against such forces is not easy, and in a world of high levels of nominal debt, cen-tral banks will look to ensure that a deflationary spiral does not ensue, and will fight this with determina-tion if it appears close.
• Central banks are not compelled to act while wage inflation is low. Although economic data is decent and unemployment is low in both the US and the UK, and we expect the Fed and BoE to hike interest rates in December 2015 and May 2016, respectively, we note that nei-ther central bank is strongly com-pelled to act while wage inflation is so low. Without higher wages, their mandates of meeting inflation targets over the medium term and maximizing employment can be fulfilled without changing rates.
• Central banks don’t have to follow market expectations. It might be comforting to believe that the cen-tral banks can be “forced” to act by the markets, but 2015 proved that there is no particular desire among the current cohort of central bank chiefs to dance to the markets’ tune. The Fed surprised the market by leaving rates on hold in Septem-ber, the ECB did not announce any new action to prop up a declining bond market in April and May, and the Bank of Japan has not added to its easing program, despite the Japanese economy disappointing expectations.
Our base case is for the Fed to increase interest rates to 1.25–1.50% by end-
2016, for the ECB to prolong quantita-tive easing beyond the scheduled end-date of September 2016, and for the BoE to commence hiking in May 2016.
That said, all of the lessons of 2015 suggest we should exercise caution in these forecasts.
Investment conclusion: We should prepare for another year of potential central bank surprises, and with defla-tionary forces still persistent and little sign of significant wage inflation, we should also expect policy to err on the side of “loose” in case of doubt.
2
Source: Bloomberg, UBS, as of November 13, 2015
Will they, won’t they? The market is uncertain about central bank action
50
30
60
40
908070
01020
Fig. 2
Apr
il 15
May
15
Feb.
15
Mar
ch 1
5
Jan.
15
Aug
. 15
Sep.
15
Oct
. 15
Nov
. 15
June
15
July
15
Fed fund futures implied probabilityof >1% rates by end-2016
ubs.com/houseview 17
Can China control its slowdown?
A disorderly crisis in China is not our base case, but ranks as one of the most serious potential tail risks to financial markets in 2016. In the first year of its 13th Five-Year Plan, can China control its slowdown?
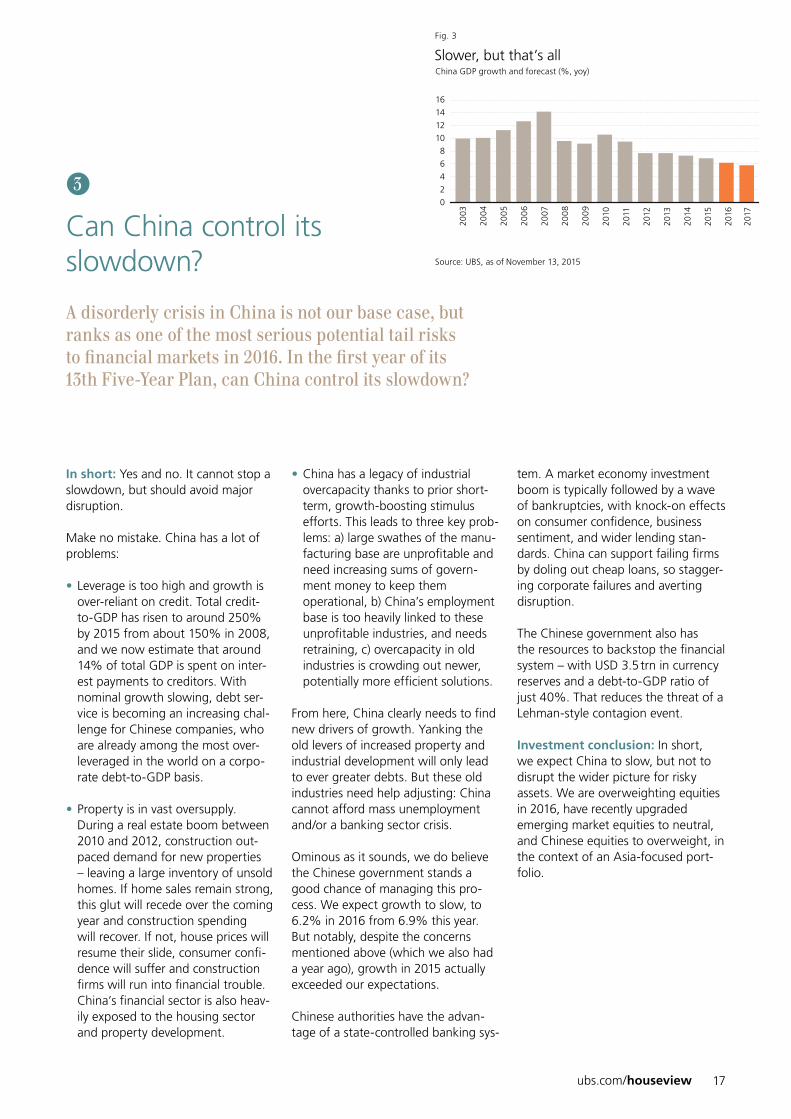
In short: Yes and no. It cannot stop a slowdown, but should avoid major disruption.
Make no mistake. China has a lot of problems:
• Leverage is too high and growth is over-reliant on credit. Total credit-to-GDP has risen to around 250% by 2015 from about 150% in 2008, and we now estimate that around 14% of total GDP is spent on inter-est payments to creditors. With nominal growth slowing, debt ser-vice is becoming an increasing chal-lenge for Chinese companies, who are already among the most over-leveraged in the world on a corpo-rate debt-to-GDP basis.
• Property is in vast oversupply. During a real estate boom between 2010 and 2012, construction out-paced demand for new properties – leaving a large inventory of unsold homes. If home sales remain strong, this glut will recede over the coming year and construction spending will recover. If not, house prices will resume their slide, consumer confi-dence will suffer and construction firms will run into financial trouble. China’s financial sector is also heav-ily exposed to the housing sector and property development.
• China has a legacy of industrial overcapacity thanks to prior short-term, growth-boosting stimulus efforts. This leads to three key prob-lems: a) large swathes of the manu-facturing base are unprofitable and need increasing sums of govern-ment money to keep them operational, b) China’s employment base is too heavily linked to these unprofitable industries, and needs retraining, c) overcapacity in old industries is crowding out newer, potentially more efficient solutions.
From here, China clearly needs to find new drivers of growth. Yanking the old levers of increased property and industrial development will only lead to ever greater debts. But these old industries need help adjusting: China cannot afford mass unemployment and/or a banking sector crisis.
Ominous as it sounds, we do believe the Chinese government stands a good chance of managing this pro-cess. We expect growth to slow, to 6.2% in 2016 from 6.9% this year. But notably, despite the concerns mentioned above (which we also had a year ago), growth in 2015 actually exceeded our expectations.
Chinese authorities have the advan-tage of a state-controlled banking sys-
tem. A market economy investment boom is typically followed by a wave of bankruptcies, with knock-on effects on consumer confidence, business sentiment, and wider lending stan-dards. China can support failing firms by doling out cheap loans, so stagger-ing corporate failures and averting disruption.
The Chinese government also has the resources to backstop the financial system – with USD 3.5 trn in currency reserves and a debt-to-GDP ratio of just 40%. That reduces the threat of a Lehman-style contagion event.
Investment conclusion: In short, we expect China to slow, but not to disrupt the wider picture for risky assets. We are overweighting equities in 2016, have recently upgraded emerging market equities to neutral, and Chinese equities to overweight, in the context of an Asia-focused port-folio.
3
Source: UBS, as of November 13, 2015
Slower, but that’s allChina GDP growth and forecast (%, yoy)
8
10
4
12
6
16
14
0
2
Fig. 3
2003
200
4
200
5
200
6
2007
200
8
200
9
2010
2011
2012
2013
2015
2014
2016
2017

UBS House View – Year Ahead 201618
Six questions for 2016
Are we close to the bottom in the EM/commodity downturn?
Consistently underperforming developed markets and with Brazil and Russia in deep recessions, gloom at times pervaded EM in 2015. Commodities have plumbed multi-year lows. Is this the dark before the dawn?
In short: Yes. But the emerging mar-ket hype is unlikely to return.
EM have lost much of their shine since 2010. Equities there have lagged developed markets by almost 60% over that period, and GDP growth has more than halved since. A combination of waning investor enthusiasm and cash outflows by residents means that EM are set for their first net capital outflow in 27 years in 2015, according to the Insti-tute for International Finance.
With China slowing, commodity prices tumbling, and political and economic crises in Russia and Brazil, EM equity valuations have been left close to their lowest level since 2008, and the extreme currency weakness through 2015 has signifi-cantly improved external competi-tiveness.
Whether 2016 truly marks a turning point will depend on several factors.
• China avoiding a hard landing: If China’s government engineers a gradual slowdown, EM confidence overall will benefit. China accounts for 24% of the MSCI EM Index. It is also the top export destination for Brazil and Malaysia, and the
second-largest customer for Russian companies.
• A return to profit growth: EM corporate profits have contracted by 26% since 2011 in US dollar terms and 2% in local currency terms. In the tough market conditions of re-cent years, many firms have focused on preserving market share, rather than maintaining earnings or profit margins. A pickup in earnings and margins would provide solid evi-dence that the worst is over for EM investors.
• Moderate tightening by the Fed-eral Reserve: A rapid accumulation of debt has made EM firms more vulnerable to rises in US interest rates. The International Monetary Fund calculates this load has now risen to USD 18 trn, four times its level in 2004.
• A steadying of commodity prices: While top EM, including net importers like China and India, benefit from lower commodity prices, many developing countries are highly reliant on raw materials exports. The likes of Brazil, Russia, Indonesia and South Africa have been harmed by tumbling com-modity prices.
All of the above are consistent with our base case. We expect a slow-down, but not a hard landing, in Chi-na. We expect 2–6% profit growth for EM companies. The Fed is likely to remain cautious, and we believe com-modity prices will move higher, over-all, through 2016. This suggests that the worst is probably over.
Challenges still remain though, not least the need to find new drivers of growth and deleverage the private sector. So while the worst for EM has probably passed, we do not expect the exuberance of the mid-2000s’ hype over the BRICs – Brazil, Russia, India and China – to return.
Investment conclusion: We recently upgraded our stance on EM equities from underweight to neutral, to reflect the more favorable outlook.
4
Source: Bloomberg, UBS, as of November 13, 2015
The dark before the dawn?MSCI EM vs MSCI World performance (rebased)
–30
–50
–20
–40
0
–10
–70
–60
Fig. 4
2010 2011 2012 2013 2014
ubs.com/houseview 19
Is 2016 the year inflation returns?
Bank deleveraging, commodity crashes, technolog-ical change, oversupply, secular stagnation… Pick your reason, but inflation has been absent since the financial crisis, despite central banks’ efforts. Will inflation move higher next year?
In short: Probably. But it also prob-ably doesn’t matter.
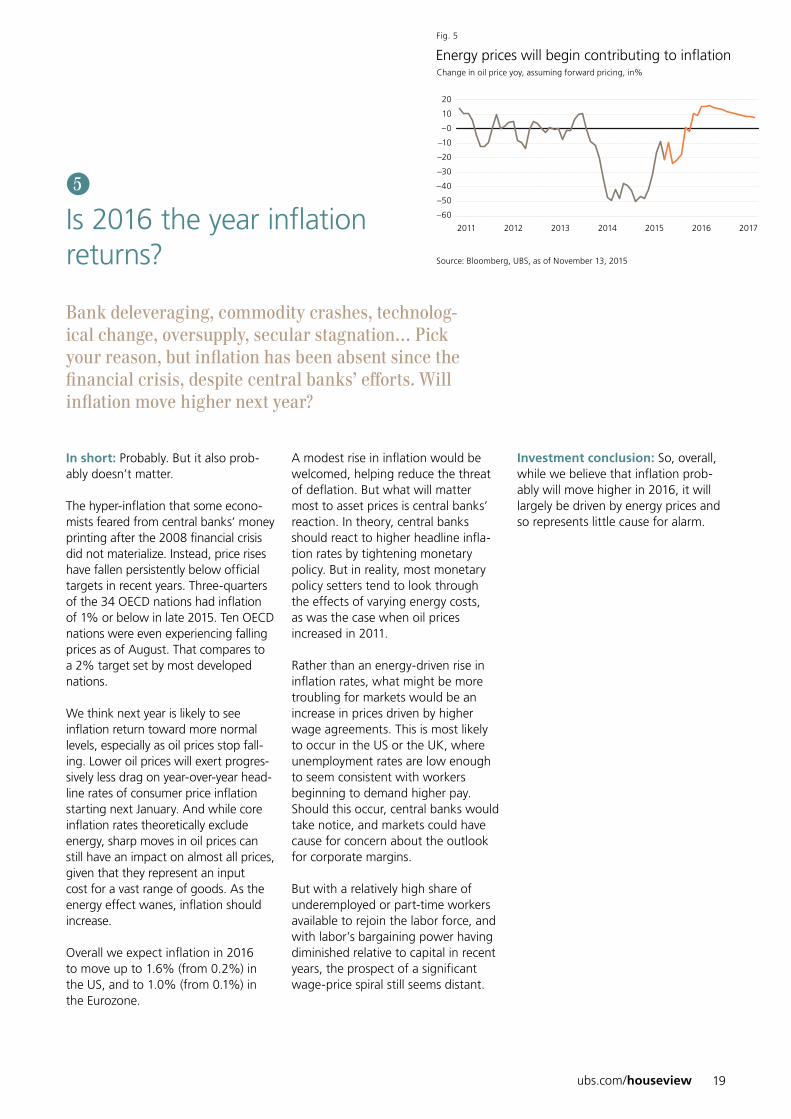
The hyper-inflation that some econo-mists feared from central banks’ money printing after the 2008 financial crisis did not materialize. Instead, price rises have fallen persistently below official targets in recent years. Three-quarters of the 34 OECD nations had inflation of 1% or below in late 2015. Ten OECD nations were even experiencing falling prices as of August. That compares to a 2% target set by most developed nations.
We think next year is likely to see inflation return toward more normal levels, especially as oil prices stop fall-ing. Lower oil prices will exert progres-sively less drag on year-over-year head-line rates of consumer price inflation starting next January. And while core inflation rates theoretically exclude energy, sharp moves in oil prices can still have an impact on almost all prices, given that they represent an input cost for a vast range of goods. As the energy effect wanes, inflation should increase.
Overall we expect inflation in 2016 to move up to 1.6% (from 0.2%) in the US, and to 1.0% (from 0.1%) in the Eurozone.
A modest rise in inflation would be welcomed, helping reduce the threat of deflation. But what will matter most to asset prices is central banks’ reaction. In theory, central banks should react to higher headline infla-tion rates by tightening monetary policy. But in reality, most monetary policy setters tend to look through the effects of varying energy costs, as was the case when oil prices increased in 2011.
Rather than an energy-driven rise in inflation rates, what might be more troubling for markets would be an increase in prices driven by higher wage agreements. This is most likely to occur in the US or the UK, where unemployment rates are low enough to seem consistent with workers beginning to demand higher pay. Should this occur, central banks would take notice, and markets could have cause for concern about the outlook for corporate margins.
But with a relatively high share of underemployed or part-time workers available to rejoin the labor force, and with labor’s bargaining power having diminished relative to capital in recent years, the prospect of a significant wage-price spiral still seems distant.
Investment conclusion: So, overall, while we believe that inflation prob-ably will move higher in 2016, it will largely be driven by energy prices and so represents little cause for alarm.
5
Source: Bloomberg, UBS, as of November 13, 2015
Energy prices will begin contributing to inflationChange in oil price yoy, assuming forward pricing, in%
–20
–40
–0
–10
–30
20
10
–60
–50
Fig. 5
2011 2012 2013 2014 2015 2016 2017
UBS House View – Year Ahead 201620
Six questions for 2016
Will politics affect markets in 2016?
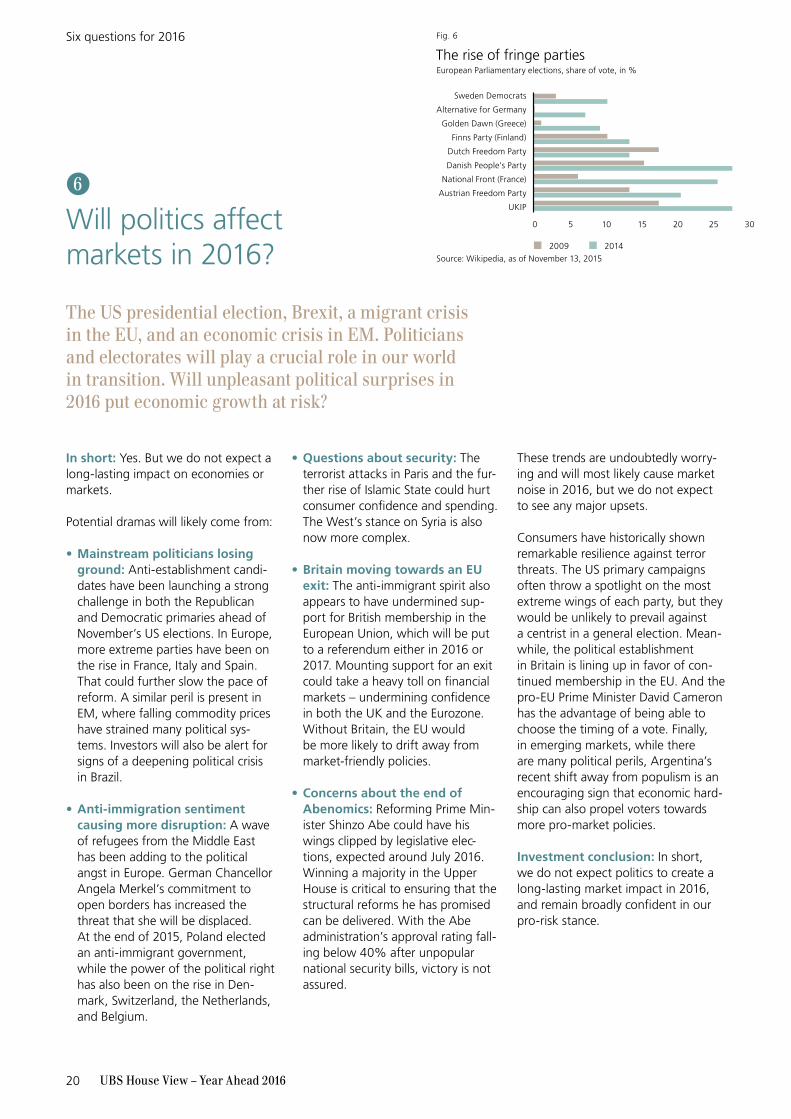
The US presidential election, Brexit, a migrant crisis in the EU, and an economic crisis in EM. Politicians and electorates will play a crucial role in our world in transition. Will unpleasant political surprises in 2016 put economic growth at risk?
In short: Yes. But we do not expect a long-lasting impact on economies or markets.
Potential dramas will likely come from:
• Mainstream politicians losing ground: Anti-establishment candi-dates have been launching a strong challenge in both the Republican and Democratic primaries ahead of November’s US elections. In Europe, more extreme parties have been on the rise in France, Italy and Spain. That could further slow the pace of reform. A similar peril is present in EM, where falling commodity prices have strained many political sys-tems. Investors will also be alert for signs of a deepening political crisis in Brazil.
• Anti-immigration sentiment causing more disruption: A wave of refugees from the Middle East has been adding to the political angst in Europe. German Chancellor Angela Merkel’s commitment to open borders has increased the threat that she will be displaced. At the end of 2015, Poland elected an anti-immigrant government, while the power of the political right has also been on the rise in Den-mark, Switzerland, the Netherlands, and Belgium.
• Questions about security: The terrorist attacks in Paris and the fur-ther rise of Islamic State could hurt consumer confidence and spending. The West’s stance on Syria is also now more complex.
• Britain moving towards an EU exit: The anti-immigrant spirit also appears to have undermined sup-port for British membership in the European Union, which will be put to a referendum either in 2016 or 2017. Mounting support for an exit could take a heavy toll on financial markets – undermining confidence in both the UK and the Eurozone. Without Britain, the EU would be more likely to drift away from market-friendly policies.
• Concerns about the end of Abenomics: Reforming Prime Min-ister Shinzo Abe could have his wings clipped by legislative elec-tions, expected around July 2016. Winning a majority in the Upper House is critical to ensuring that the structural reforms he has promised can be delivered. With the Abe administration’s approval rating fall-ing below 40% after unpopular national security bills, victory is not assured.
These trends are undoubtedly worry-ing and will most likely cause market noise in 2016, but we do not expect to see any major upsets.
Consumers have historically shown remarkable resilience against terror threats. The US primary campaigns often throw a spotlight on the most extreme wings of each party, but they would be unlikely to prevail against a centrist in a general election. Mean-while, the political establishment in Britain is lining up in favor of con-tinued membership in the EU. And the pro-EU Prime Minister David Cameron has the advantage of being able to choose the timing of a vote. Finally, in emerging markets, while there are many political perils, Argentina’s recent shift away from populism is an encouraging sign that economic hard-ship can also propel voters towards more pro-market policies.
Investment conclusion: In short, we do not expect politics to create a long-lasting market impact in 2016, and remain broadly confident in our pro-risk stance.
0 5 10 15 20 25 30
Source: Wikipedia, as of November 13, 2015
The rise of fringe partiesEuropean Parliamentary elections, share of vote, in %
2009 2014
Finns Party (Finland)
Danish People’s Party
Golden Dawn (Greece)
Dutch Freedom Party
Sweden Democrats
Alternative for Germany
Austrian Freedom Party
UKIP
National Front (France)
Fig. 6
6

ubs.com/houseview 21
Global economic outlook
We expect growth to pick up in 2016 after a dip in 2015. But our overall view of a world in transition trudging along at an ok but slow pace remains unaltered. We expect this to be the fourth year in the past five of precisely 3.4% growth.
Growth in unexpected places In a year when concerns over a “Grexit” and a “China hard landing” topped financial headlines, we note that both China’s and the Eurozone’s economies grew faster than originally expected in 2015.
China slowed, but our forecast of +6.8% growth proved marginally pes-simistic: we now think it will end the year at +6.9%. And Eurozone growth of +1.5% is likely to surpass our origi-nal projection of +1.2%.
The US disappointed expectations (+2.5% vs +2.9% expected), primarily due to harsh weather in 1Q. Growth for the remainder of the year has met our positive expectations.
Elsewhere, Japan disappointed greatly (+0.5% vs 1.2% expected), as the economy failed to gain steam after last year’s consumption tax hike, and India surpassed expectations, though the country’s new GDP calculation methodology makes comparison difficult.
The major shortfalls came in commod-ity-exporting emerging markets. Our forecast of close-to-zero growth in Russia and Brazil was instead met with deep recession in both countries; Russia is likely to contract by 3.7% and Brazil by 3.0%.
Brian Rose, US economist, Wealth Management AmericasRicardo Garcia, Head of Eurozone EconomicsPhilip Wyatt, Head of APAC EconomicsJorge Mariscal, Head of EM Investment OfficeDaniel Kalt, Chief Economist Switzerland
UBS House View – Year Ahead 201622
Global economic outlook
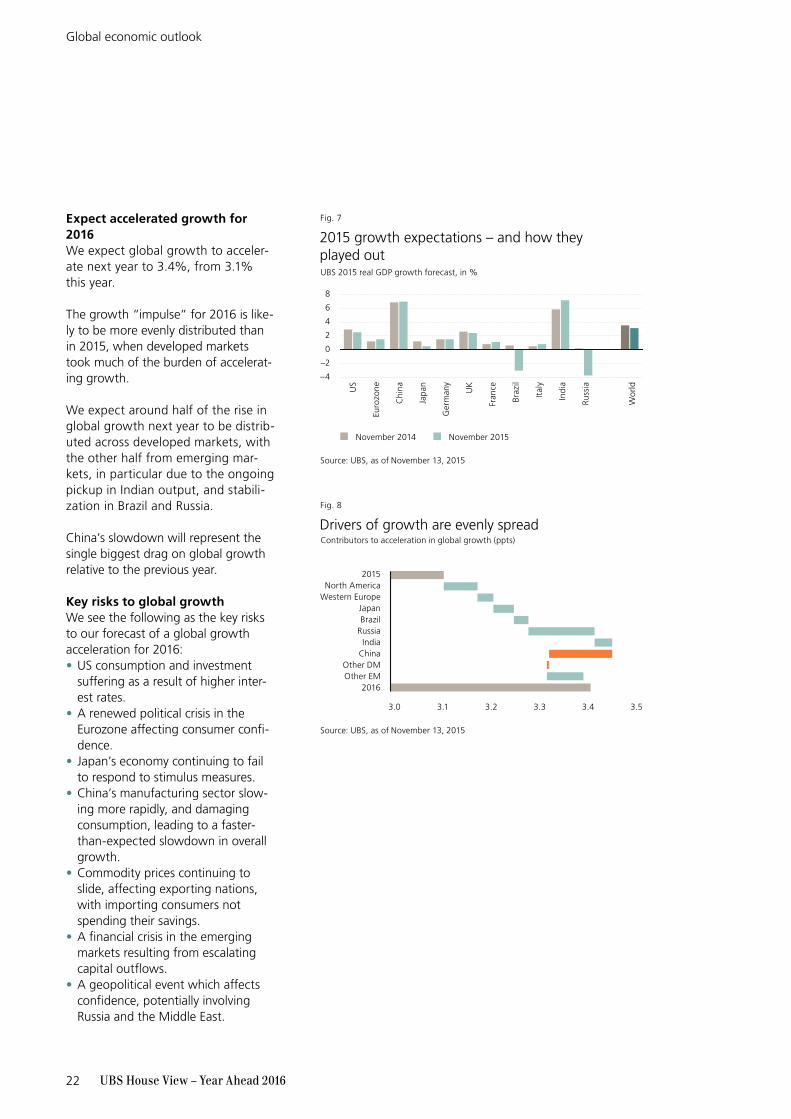
Expect accelerated growth for 2016We expect global growth to acceler-ate next year to 3.4%, from 3.1% this year.
The growth “impulse” for 2016 is like-ly to be more evenly distributed than in 2015, when developed markets took much of the burden of accelerat-ing growth.
We expect around half of the rise in global growth next year to be distrib-uted across developed markets, with the other half from emerging mar-kets, in particular due to the ongoing pickup in Indian output, and stabili-zation in Brazil and Russia.
China’s slowdown will represent the single biggest drag on global growth relative to the previous year.
Key risks to global growthWe see the following as the key risks to our forecast of a global growth acceleration for 2016:• US consumption and investment
suffering as a result of higher inter-est rates.
• A renewed political crisis in the Eurozone affecting consumer confi-dence.
• Japan’s economy continuing to fail to respond to stimulus measures.
• China’s manufacturing sector slow-ing more rapidly, and damaging consumption, leading to a faster-than-expected slowdown in overall growth.
• Commodity prices continuing to slide, affecting exporting nations, with importing consumers not spending their savings.
• A financial crisis in the emerging markets resulting from escalating capital outflows.
• A geopolitical event which affects confidence, potentially involving Russia and the Middle East.
Source: UBS, as of November 13, 2015
2015 growth expectations – and how they played outUBS 2015 real GDP growth forecast, in %
November 2014 November 2015
4
0
6
2
8
–4
–2
Fig. 7
US
Euro
zon
e
Chi
na
Jap
an
Ger
man
y
UK
Fran
ce
Braz
il
Ital
y
Indi
a
Russ
ia
Wo
rld
3.0 3.1 3.2 3.3 3.4 3.5
Source: UBS, as of November 13, 2015
Drivers of growth are evenly spreadContributors to acceleration in global growth (ppts)
Japan
RussiaIndia
China
Western Europe
Brazil
2015North America
Other DMOther EM
2016
Fig. 8
ubs.com/houseview 23
Regions
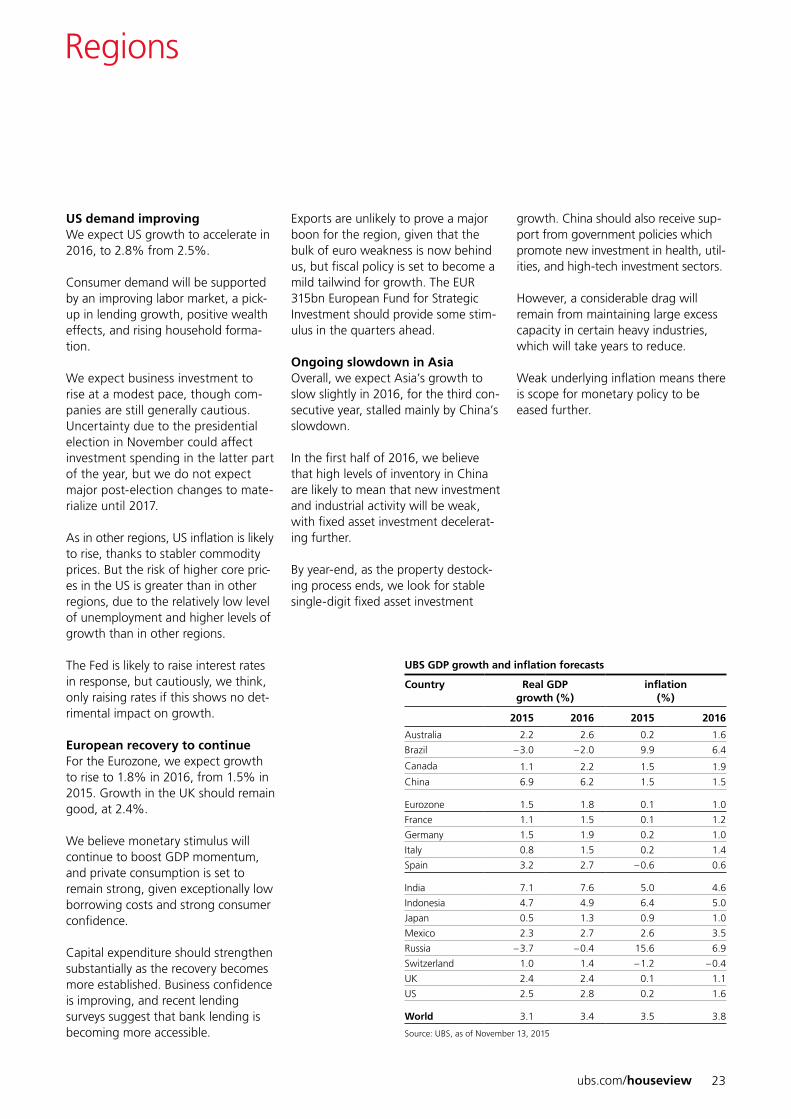
US demand improvingWe expect US growth to accelerate in 2016, to 2.8% from 2.5%.
Consumer demand will be supported by an improving labor market, a pick-up in lending growth, positive wealth effects, and rising household forma-tion.
We expect business investment to rise at a modest pace, though com-panies are still generally cautious. Uncertainty due to the presidential election in November could affect investment spending in the latter part of the year, but we do not expect major post-election changes to mate-rialize until 2017.
As in other regions, US inflation is likely to rise, thanks to stabler commodity prices. But the risk of higher core pric-es in the US is greater than in other regions, due to the relatively low level of unemployment and higher levels of growth than in other regions.
The Fed is likely to raise interest rates in response, but cautiously, we think, only raising rates if this shows no det-rimental impact on growth.
European recovery to continueFor the Eurozone, we expect growth to rise to 1.8% in 2016, from 1.5% in 2015. Growth in the UK should remain good, at 2.4%.
We believe monetary stimulus will continue to boost GDP momentum, and private consumption is set to remain strong, given exceptionally low borrowing costs and strong consumer confidence.
Capital expenditure should strengthen substantially as the recovery becomes more established. Business confidence is improving, and recent lending surveys suggest that bank lending is becoming more accessible.
Exports are unlikely to prove a major boon for the region, given that the bulk of euro weakness is now behind us, but fiscal policy is set to become a mild tailwind for growth. The EUR 315bn European Fund for Strategic Investment should provide some stim-ulus in the quarters ahead.
Ongoing slowdown in AsiaOverall, we expect Asia’s growth to slow slightly in 2016, for the third con-secutive year, stalled mainly by China’s slowdown.
In the first half of 2016, we believe that high levels of inventory in China are likely to mean that new investment and industrial activity will be weak, with fixed asset investment decelerat-ing further.
By year-end, as the property destock-ing process ends, we look for stable single-digit fixed asset investment
growth. China should also receive sup-port from government policies which promote new investment in health, util-ities, and high-tech investment sectors.
However, a considerable drag will remain from maintaining large excess capacity in certain heavy industries, which will take years to reduce.
Weak underlying inflation means there is scope for monetary policy to be eased further.
UBS GDP growth and inflation forecasts
Country Real GDP growth (%)
inflation(%)
2015 2016 2015 2016
Australia 2.2 2.6 0.2 1.6
Brazil – 3.0 – 2.0 9.9 6.4
Canada 1.1 2.2 1.5 1.9
China 6.9 6.2 1.5 1.5
Eurozone 1.5 1.8 0.1 1.0
France 1.1 1.5 0.1 1.2
Germany 1.5 1.9 0.2 1.0
Italy 0.8 1.5 0.2 1.4
Spain 3.2 2.7 – 0.6 0.6
India 7.1 7.6 5.0 4.6
Indonesia 4.7 4.9 6.4 5.0
Japan 0.5 1.3 0.9 1.0
Mexico 2.3 2.7 2.6 3.5
Russia – 3.7 – 0.4 15.6 6.9
Switzerland 1.0 1.4 – 1.2 – 0.4
UK 2.4 2.4 0.1 1.1
US 2.5 2.8 0.2 1.6
World 3.1 3.4 3.5 3.8
Source: UBS, as of November 13, 2015
UBS House View – Year Ahead 201624
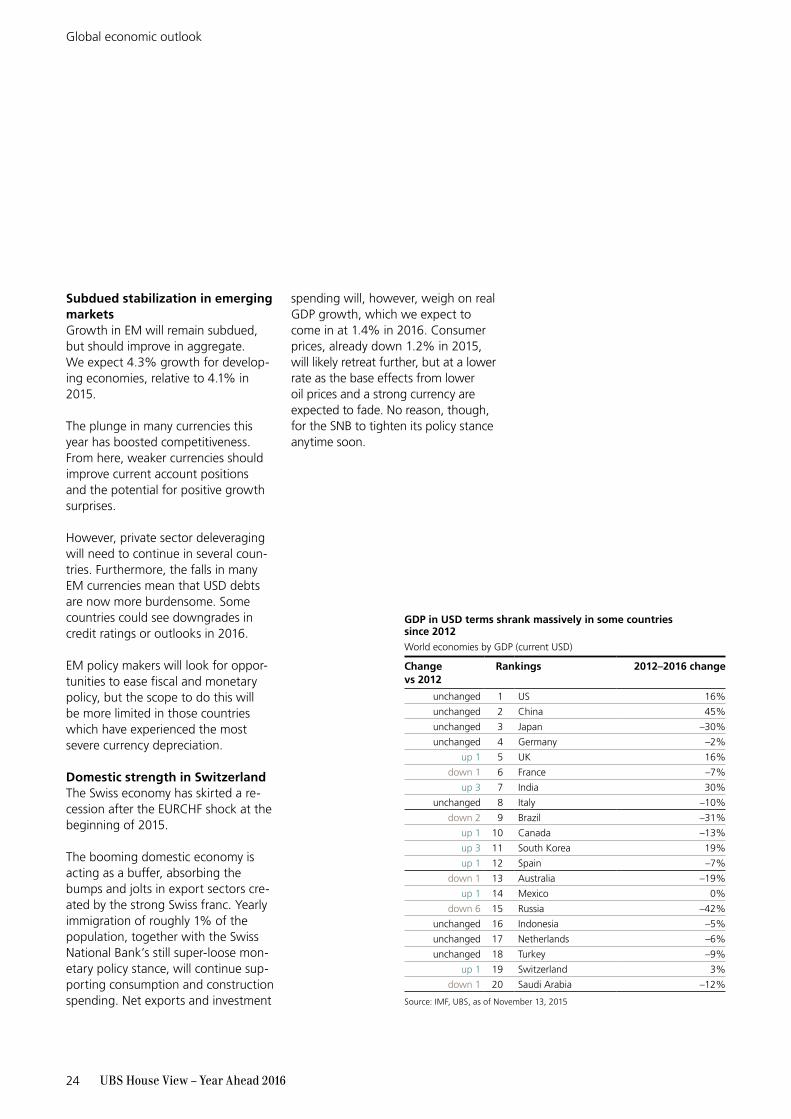
Subdued stabilization in emerging marketsGrowth in EM will remain subdued, but should improve in aggregate. We expect 4.3% growth for develop-ing economies, relative to 4.1% in 2015.
The plunge in many currencies this year has boosted competitiveness. From here, weaker currencies should improve current account positions and the potential for positive growth surprises.
However, private sector deleveraging will need to continue in several coun-tries. Furthermore, the falls in many EM currencies mean that USD debts are now more burdensome. Some countries could see downgrades in credit ratings or outlooks in 2016.
EM policy makers will look for oppor-tunities to ease fiscal and monetary policy, but the scope to do this will be more limited in those countries which have experienced the most severe currency depreciation.
Domestic strength in SwitzerlandThe Swiss economy has skirted a re-cession after the EURCHF shock at the beginning of 2015.
The booming domestic economy is acting as a buffer, absorbing the bumps and jolts in export sectors cre-ated by the strong Swiss franc. Yearly immigration of roughly 1% of the population, together with the Swiss National Bank’s still super-loose mon-etary policy stance, will continue sup-porting consumption and construction spending. Net exports and investment
spending will, however, weigh on real GDP growth, which we expect to come in at 1.4% in 2016. Consumer prices, already down 1.2% in 2015, will likely retreat further, but at a lower rate as the base effects from lower oil prices and a strong currency are expected to fade. No reason, though, for the SNB to tighten its policy stance anytime soon.
GDP in USD terms shrank massively in some countries since 2012 World economies by GDP (current USD)
Changevs 2012
Rankings 2012–2016 change
unchanged 1 US 16%
unchanged 2 China 45%
unchanged 3 Japan –30%
unchanged 4 Germany –2%
up 1 5 UK 16%
down 1 6 France –7%
up 3 7 India 30%
unchanged 8 Italy –10%
down 2 9 Brazil –31%
up 1 10 Canada –13%
up 3 11 South Korea 19%
up 1 12 Spain –7%
down 1 13 Australia –19%
up 1 14 Mexico 0%
down 6 15 Russia –42%
unchanged 16 Indonesia –5%
unchanged 17 Netherlands –6%
unchanged 18 Turkey –9%
up 1 19 Switzerland 3%
down 1 20 Saudi Arabia –12%
Source: IMF, UBS, as of November 13, 2015
Global economic outlook
ubs.com/houseview 25
Turning forecasts into investments
Whether investing for the long or the short term, we believe that a consistent approach helps deliver consistent perfor-mance. Here we summarize part of the investment philosophy that goes behind our tactical investment recommendations, from deciding to be “risk-on” or “risk-off” to selecting within specific asset classes.
Mads Pedersen, Head of Global Asset Allocation
Katarina Cohrs, TAA and Investment Methodology

UBS House View – Year Ahead 201626
Risk-on or risk-off?Deciding whether or not to take on risky assets such as equities and high yield can make a sizable difference in returns.
Our decision-making process is based on two pillars:
First, the quantitative aspect. This incorporates developments in both the global business cycle, and “price momentum.”
We generally believe that if both the trend and dynamics in global earnings and business activity are positive, we should be in a supportive environment for risky assets too. Fundamentally, equities represent a claim on future cash flows: if the trend of those cash flows is positive, the outlook for equi-ties should be positive too.
Meanwhile, over short-term horizons, markets often experience a trend phenomenon, i.e. if markets have been moving up, they are more likely to continue going up than go down. This can, in part, be attributed to the behavioral effect of “conservatism,” whereby people continue adhering to existing beliefs, rather than adjusting
fluidly to new information. As such, improvements in the fundamental outlook can take time to filter into prices.
Second, we analyze the implications of qualitative factors. These include such events as changes in central bank or government policy stances. In our world in transition, interventionist pol-icy is playing an active role in shaping financial market returns, sometimes for the positive and sometimes for the negative.
The market looks cheap. Time to buy?Not necessarily. Over a long time horizon, valuation is an important basis for investment decisions, and the longer that horizon, the more important valuation proves. However, over shorter time frames, such as our six-month tactical investment time horizon, valuation does not prove to be a particularly useful indicator of subsequent returns.
Markets which are cheap can often get cheaper still, if sentiment or busi-ness cycle dynamics are working against them. Emerging markets have been a good example of this over
recent years. Similarly, those markets which seem fully valued can maintain their value, or get even more costly, with the right support from the busi-ness cycle and sentiment. The US equity market in recent years is a case in point.
As such, while valuation is an impor-tant indicator for long-term strategic asset allocation decisions, it does not play a major role in our tactical invest-ment decision-making.
How to decide between equity regions?By buying an equity index, an investor buys a stake in the future profits of a variety of businesses. As such, much of our regional decision-making framework looks at the likely change in profits in different regions. We incorporate recent moves in curren-cies, which could indicate a change in the outlook for exporters; dynamics in manufacturing sentiment, which could indicate a change in local econ-omies; and both the growth and rate of change of corporate profitability itself. We also incorporate a “momen-tum” component, to account for changes in sentiment toward different markets.
Source: Shiller, UBS, as of November 13, 2015
Valuation not a major driver of short-term returns
Fig. 9
Subsequent 6-month total return vs trailing price-to-earnings ratio, S&P 500
–40
–30
–20
–10
0
10
20
30
40
0 10 20 30 40 50 60 70 80 90 100 110 120 130
Source: Thomson Reuters, UBS, as of November 13, 2015
Sometimes it’s better to look at reality than forecasts
80
40
60
100
0
20
Fig. 10
% of time analysts have forecastearnings to grow by more than
10% in the next 12 months
% of time earnings have grown by more than 10%
over 12-month period
IBES earnings estimates for MSCI US, monthly data since 1988
82%
43%
Turning forecasts into investments
ubs.com/houseview 27
We note that not all factors are of equal importance for each market. For instance, equity markets which are made up primarily of exporters, such as Switzerland, tend to be more heav-ily influenced by currency, and those which can be more trading-oriented, such as Japan, are more momentum-driven.
In addition, we consider extraordinary factors like changes in central bank policy, which have become increas-ingly important drivers of equity mar-ket returns in recent years.
How to know if yields are set to rise?Perhaps the most persistent source of frustration for investment forecast-ers in recent years has been the steady decline in government bond yields. Despite decent economic growth, falling unemployment, and markets which have generally been pro-risk, government bond yields have trended lower.
This shows us that there are more than economic fundamentals at work in the bond market. Our framework acknowledges the mix of fundamental and technical factors which drive the market, and combines technical factors, including investor sentiment, alongside more fundamental ones, such as trends in the business cycle.We cannot be sure precisely when yields are set to rise. But with a focus both on the technical factors and the fundamentals, we feel our framework should help us identify the forces at work in the market.
When is the time to take credit risk?As with other asset classes, we attempt to answer this question through a quantitative and qualitative approach.
Our quantitative approach looks at both the possible future direction of
spreads, and the compensation in vestors are currently receiving in exchange for default risk.
The spread models incorporate funda-mental macro-economic variables, indicators of global risk appetite, and country-specific indicators. Mean-while, the default rate model incorpo-rates fundamental factors for the first year, before assuming mean reversion through the business cycle.
On top of this, we assess qualitative factors, such as trends in new issuance (in which high levels of supply can actually be positive for asset classes like high yield, to the extent they in dicate positive sentiment and easy refinancing conditions), changes and trends in credit ratings, and assess-ments of liquidity, which is particularly important for high yield credit.
How to decide on the best currencies today?For most investors, we believe that their home currency is the best choice. We suggest they hedge the bulk of their portfolios into their domestic currency, due to the high volatility of currency markets with no guarantee of long-term return. However, we also believe that, over a short-term hori-zon, currency markets may provide an opportunity to generate tactical per-formance.
Currencies are influenced by perhaps more factors than any other asset class. Ultimately, we believe that in the long run, currencies should revert toward their fundamental value. As such, our decision-making process includes estimating how over or un-der-valued currencies are, relative to long-term purchasing power parity or interest rate parity trends.
However, we note that deviations can take a long time to correct. Therefore, to complement our tactical decision-
making process, we also look at short-term factors. We monitor business cycle dynamics closely, since we be-lieve that currencies generally should strengthen when growth and real interest rates are high, and weaken when growth and real interest rates are low. It is also important to consid-er overall market volatility and posi-tioning. High interest rate currencies tend to be favored at times of low market volatility, and we need to con-sider the risk of such “carry trades” if positioning is stretched, or if volatility spikes.
When is the right time to buy commodities?For investors who consider commodi-ties as an asset class, we believe tacti-cal decisions should be made based on four factors. First, developments in the global business cycle, given that increased economic activity tends to imply increased commodity demand. Second, the performance of commod-ity-related equity markets, which has historically been shown to “lead” commodity markets, and can there-fore serve as a useful indicator. Third, “roll costs,” given that an upward or downward sloping curve can have an important bearing on total realized commodity returns. Finally, price momentum, given the tendency for commodity prices to move in long trends, or cycles, over time.
We exclude commodities from our long-term portfolios, due to their high level of volatility relative to long-term return prospects, and limited portfolio diversification benefits.
Turning forecasts into investments

UBS House View – Year Ahead 201628
Global tactical positioning
Our position for our world in transition is an overweight in equi-ties relative to bonds. With the global economy recovering from this year’s modest slowdown, corporate profitability on track, and interest rates likely generally low, our outlook for equities is positive. Our preferred regional markets are the Eurozone and Japan, while we are more cautious on UK equities.
Within bonds, we are overweight European high yield credit and short-dated USD investment grade credit, as both provide attractive carry and should be relatively immune from the US transition toward higher interest rates. We are underweight the safest high grade bonds.
Mads PedersenHead of Global Asset Allocation
Mark Andersen Head of Regional Asset Allocation
ubs.com/houseview 29
SAA
Switz
er-
Em
erg
ing
High
EM EM
Tot
al
Tot
al
US
Eur
ozon
e
UK
Ja
pan
la
nd
Mark
ets (E
M) Others
T
otal grade Corporate High yield sovereign corporate Total USD EUR GBP JPY CHF NOK CAD
Liqui
dity
Equ
ities
Bonds
Commodities Currencies
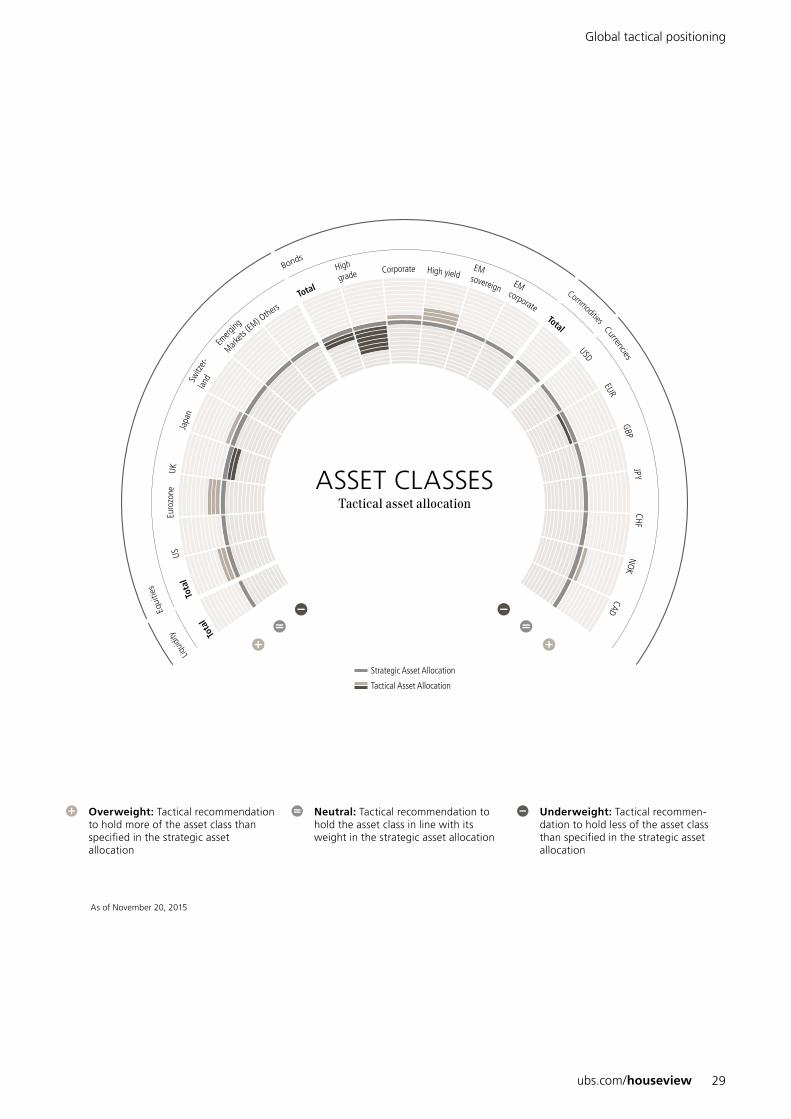
ASSET CLASSESTactical asset allocation
Strategic Asset Allocation
Tactical Asset Allocation
Global tactical positioning
Overweight: Tactical recommendation to hold more of the asset class than specified in the strategic asset allocation
Neutral: Tactical recommendation to hold the asset class in line with its weight in the strategic asset allocation
Underweight: Tactical recommen-dation to hold less of the asset class than specified in the strategic asset allocation
As of November 20, 2015

UBS House View – Year Ahead 201630
Equities
Markus Irngartinger, Head of Macro & Equities StrategyJeremy Zirin, Chief Equity strategist, Wealth Management AmericasDavid Lefkowitz, US Equity strategist, Wealth Management Americas
We are positive on the outlook for equities next year. Our preferred regional markets are the Euro-zone and Japan, which should benefit from rising earnings, low refinancing costs, and currencies which are weak on a trade-weighted basis.
GlobalPositive stance on global equities justified in a difficult yearThe first quarter of 2015 saw good performance from global equities, with the Eurozone leading the rally thanks to loose monetary policy. The markets stalled by 2Q, amid con-cerns about the potential impact on equities of higher yields following a sell- off in the bond market, though Japanese equities still performed well.
In 3Q, all global equity markets fell as concerns arose over the state of Chinese economic demand and the knock-on effect on commodity prices. Emerging market currencies and equity markets were most severely affected, and the materials and energy sectors fell sharply, dragging on de veloped market equity performance.
At the time of writing, 4Q has seen a sharp rally, with the worst perform-ing sectors in 3Q bouncing back.
Overall, we believe a positive stance on equities has been justified: presently, global equities are in positive territory for the year. But investors have needed discipline: with the exception of 2008 and 2011, this has been the weakest year for equity risk-adjusted returns in the past decade.
Positive on global equities for 2016Our outlook is positive for three reasons.
First, the global economy is likely to improve this year. Accelerating con-sumption in developed markets, and greater stability in the emerging mar-kets should allow companies to grow revenues more easily in 2016 than in 2015.
ubs.com/houseview 31
Second, while the Fed and Bank of England are both likely to increase in-terest rates, they will do so only grad-ually, keeping refinancing costs low. At a global level, monetary policy re-mains exceptionally loose, with the Bank of Japan and European Central Bank both engaging in quantitative easing programs.
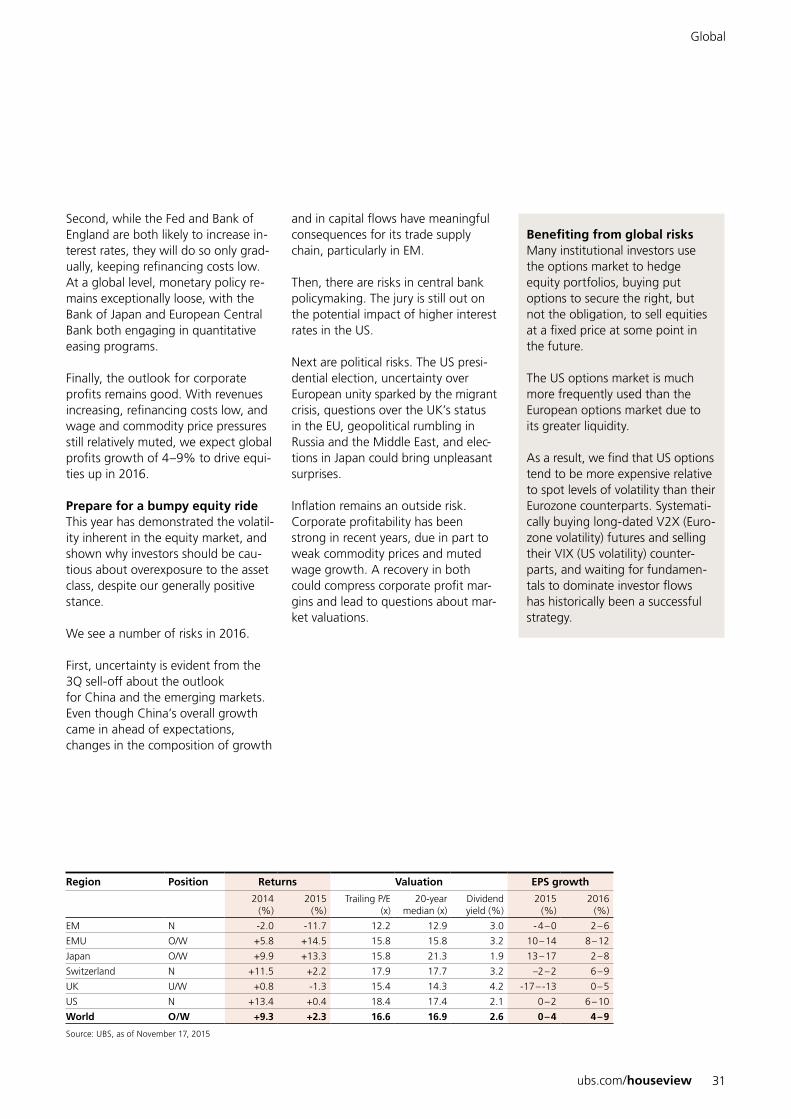
Finally, the outlook for corporate profits remains good. With revenues increasing, refinancing costs low, and wage and commodity price pressures still relatively muted, we expect global profits growth of 4–9% to drive equi-ties up in 2016.
Prepare for a bumpy equity ride This year has demonstrated the volatil-ity inherent in the equity market, and shown why investors should be cau-tious about overexposure to the asset class, despite our generally positive stance.
We see a number of risks in 2016.
First, uncertainty is evident from the 3Q sell-off about the outlook for China and the emerging markets. Even though China’s overall growth came in ahead of expectations, changes in the composition of growth
and in capital flows have meaningful consequences for its trade supply chain, particularly in EM.
Then, there are risks in central bank policymaking. The jury is still out on the potential impact of higher interest rates in the US.
Next are political risks. The US presi-dential election, uncertainty over European unity sparked by the migrant crisis, questions over the UK’s status in the EU, geopolitical rumbling in Russia and the Middle East, and elec-tions in Japan could bring unpleasant surprises.
Inflation remains an outside risk. Corporate profitability has been strong in recent years, due in part to weak commodity prices and muted wage growth. A recovery in both could compress corporate profit mar-gins and lead to questions about mar-ket valuations.
Benefiting from global risksMany institutional investors use the options market to hedge equity portfolios, buying put options to secure the right, but not the obligation, to sell equities at a fixed price at some point in the future.
The US options market is much more frequently used than the European options market due to its greater liquidity.
As a result, we find that US options tend to be more expensive relative to spot levels of volatility than their Eurozone counterparts. Systemati-cally buying long-dated V2X (Euro-zone volatility) futures and selling their VIX (US volatility) counter-parts, and waiting for fundamen-tals to dominate investor flows has historically been a successful strategy.
Global
Region Position Returns Valuation EPS growth
2014(%)
2015(%)
Trailing P/E (x)
20-year median (x)
Dividend yield (%)
2015(%)
2016(%)
EM N -2.0 -11.7 12.2 12.9 3.0 - 4 – 0 2 – 6
EMU O/W +5.8 +14.5 15.8 15.8 3.2 10 – 14 8 – 12
Japan O/W +9.9 +13.3 15.8 21.3 1.9 13 – 17 2 – 8
Switzerland N +11.5 +2.2 17.9 17.7 3.2 –2 – 2 6 – 9
UK U/W +0.8 -1.3 15.4 14.3 4.2 -17 – -13 0 – 5
US N +13.4 +0.4 18.4 17.4 2.1 0 – 2 6 – 10
World O/W +9.3 +2.3 16.6 16.9 2.6 0 – 4 4 – 9
Source: UBS, as of November 17, 2015
UBS House View – Year Ahead 201632
USNeutral
Flat, flat, down, up for US equities in 2015One might easily mistake a chart of the S&P 500 in 2015 for a map of the state of Florida. The market was broadly flat for the first half of the year, with weak earnings growth constraining upside, while generally decent economic growth and still-loose monetary policy protected against downside. This was followed by the biggest weekly sell-off in almost four years in August, on con-cerns about the potential impact of an economic slowdown in China. Following a sharp rally in October, at the time of writing the market is again close to all-time highs.
Consumer discretionary, technology, and healthcare have led the market, while commodity-exposed energy, materials, and utilities have dragged.
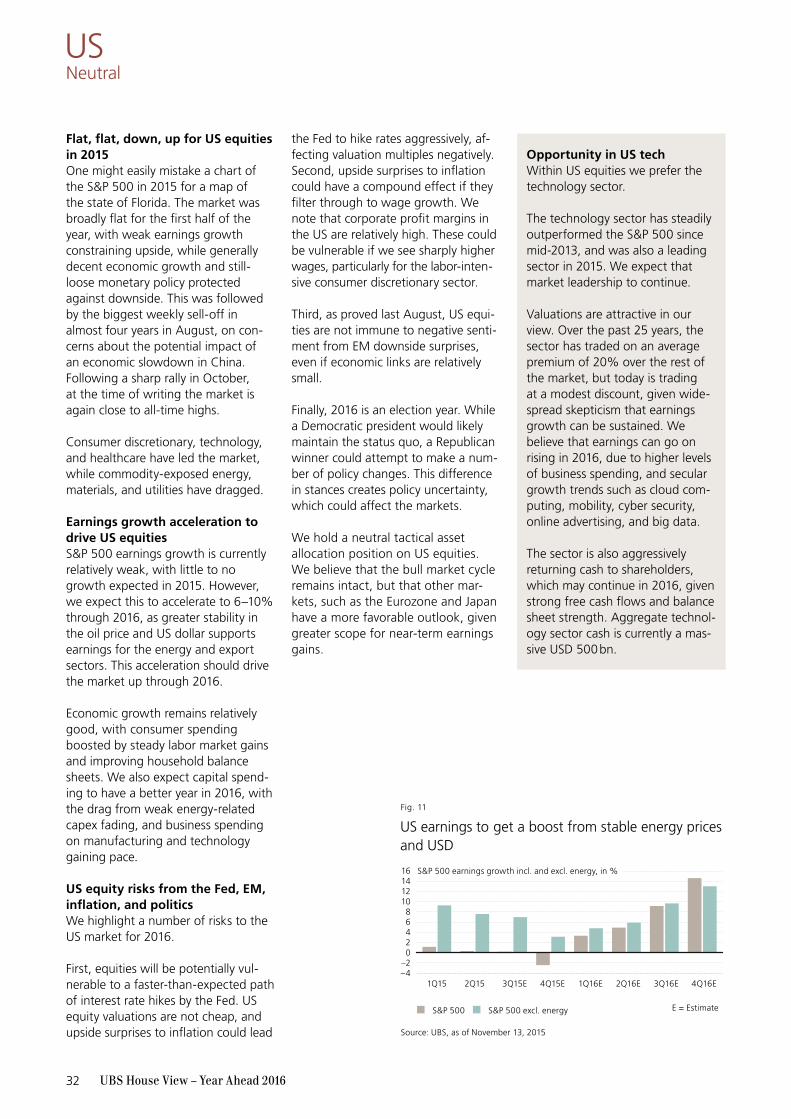
Earnings growth acceleration to drive US equitiesS&P 500 earnings growth is currently relatively weak, with little to no growth expected in 2015. However, we expect this to accelerate to 6–10% through 2016, as greater stability in the oil price and US dollar supports earnings for the energy and export sectors. This acceleration should drive the market up through 2016.
Economic growth remains relatively good, with consumer spending boosted by steady labor market gains and improving household balance sheets. We also expect capital spend-ing to have a better year in 2016, with the drag from weak energy-related capex fading, and business spending on manufacturing and technology gaining pace.
US equity risks from the Fed, EM, inflation, and politicsWe highlight a number of risks to the US market for 2016.
First, equities will be potentially vul-nerable to a faster-than-expected path of interest rate hikes by the Fed. US equity valuations are not cheap, and upside surprises to inflation could lead
the Fed to hike rates aggressively, af-fecting valuation multiples negatively.Second, upside surprises to inflation could have a compound effect if they filter through to wage growth. We note that corporate profit margins in the US are relatively high. These could be vulnerable if we see sharply higher wages, particularly for the labor- inten-sive consumer discretionary sector.
Third, as proved last August, US equi-ties are not immune to negative senti-ment from EM downside surprises, even if economic links are relatively small.
Finally, 2016 is an election year. While a Democratic president would likely maintain the status quo, a Republican winner could attempt to make a num-ber of policy changes. This difference in stances creates policy uncertainty, which could affect the markets.
We hold a neutral tactical asset allo cation position on US equities. We believe that the bull market cycle remains intact, but that other mar-kets, such as the Eurozone and Japan have a more favorable outlook, given greater scope for near-term earnings gains.
Opportunity in US techWithin US equities we prefer the technology sector.
The technology sector has steadily outperformed the S&P 500 since mid-2013, and was also a leading sector in 2015. We expect that market leadership to continue.
Valuations are attractive in our view. Over the past 25 years, the sector has traded on an average premium of 20% over the rest of the market, but today is trading at a modest discount, given wide-spread skepticism that earnings growth can be sustained. We believe that earnings can go on rising in 2016, due to higher levels of business spending, and secular growth trends such as cloud com-puting, mobility, cyber security, online advertising, and big data.
The sector is also aggressively returning cash to shareholders, which may continue in 2016, given strong free cash flows and balance sheet strength. Aggregate technol-ogy sector cash is currently a mas-sive USD 500 bn.
Source: UBS, as of November 13, 2015
US earnings to get a boost from stable energy prices and USD
4
810
6
0
12
2
1614
–4–2
Fig. 11
1Q15 2Q15 3Q15E 4Q15E 1Q16E 2Q16E 3Q16E 4Q16E
S&P 500 S&P 500 excl. energy E = Estimate
S&P 500 earnings growth incl. and excl. energy, in %
ubs.com/houseview 33
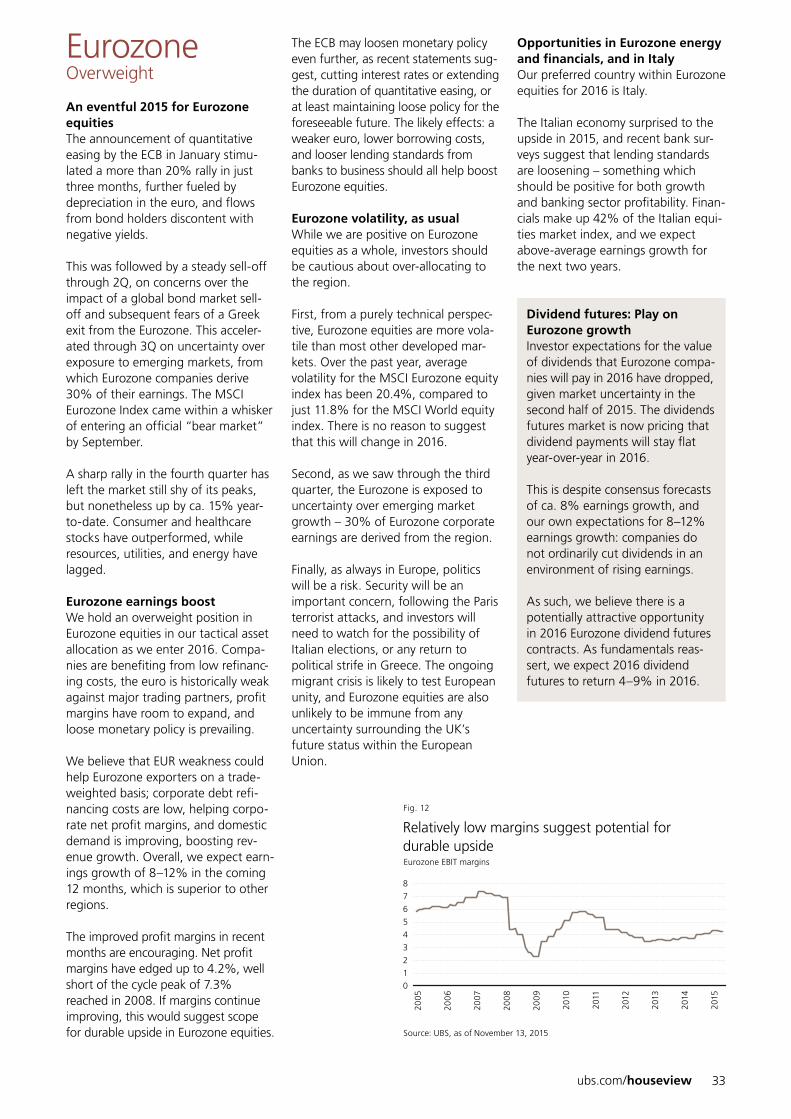
EurozoneOverweight
An eventful 2015 for Eurozone equitiesThe announcement of quantitative easing by the ECB in January stimu-lated a more than 20% rally in just three months, further fueled by depreciation in the euro, and flows from bond holders discontent with negative yields.
This was followed by a steady sell-off through 2Q, on concerns over the impact of a global bond market sell-off and subsequent fears of a Greek exit from the Eurozone. This acceler-ated through 3Q on uncertainty over exposure to emerging markets, from which Eurozone companies derive 30% of their earnings. The MSCI Eurozone Index came within a whisker of entering an official “bear market” by September.
A sharp rally in the fourth quarter has left the market still shy of its peaks, but nonetheless up by ca. 15% year-to-date. Consumer and healthcare stocks have outperformed, while resources, utilities, and energy have lagged.
Eurozone earnings boost We hold an overweight position in Eurozone equities in our tactical asset allocation as we enter 2016. Compa-nies are benefiting from low refinanc-ing costs, the euro is historically weak against major trading partners, profit margins have room to expand, and loose monetary policy is prevailing.
We believe that EUR weakness could help Eurozone exporters on a trade-weighted basis; corporate debt refi-nancing costs are low, helping corpo-rate net profit margins, and domestic demand is improving, boosting rev-enue growth. Overall, we expect earn-ings growth of 8–12% in the coming 12 months, which is superior to other regions.
The improved profit margins in recent months are encouraging. Net profit margins have edged up to 4.2%, well short of the cycle peak of 7.3% reached in 2008. If margins continue improving, this would suggest scope for durable upside in Eurozone equities.
The ECB may loosen monetary policy even further, as recent statements sug-gest, cutting interest rates or extending the duration of quantitative easing, or at least maintaining loose policy for the foreseeable future. The likely effects: a weaker euro, lower borrowing costs, and looser lending standards from banks to business should all help boost Eurozone equities.
Eurozone volatility, as usualWhile we are positive on Eurozone equities as a whole, investors should be cautious about over-allocating to the region.
First, from a purely technical perspec-tive, Eurozone equities are more vola-tile than most other developed mar-kets. Over the past year, average volatility for the MSCI Eurozone equity index has been 20.4%, compared to just 11.8% for the MSCI World equity index. There is no reason to suggest that this will change in 2016.
Second, as we saw through the third quarter, the Eurozone is exposed to uncertainty over emerging market growth – 30% of Eurozone corporate earnings are derived from the region.
Finally, as always in Europe, politics will be a risk. Security will be an important concern, following the Paris terrorist attacks, and investors will need to watch for the possibility of Italian elections, or any return to political strife in Greece. The ongoing migrant crisis is likely to test European unity, and Eurozone equities are also unlikely to be immune from any uncertainty surrounding the UK’s future status within the European Union.
Opportunities in Eurozone energy and financials, and in ItalyOur preferred country within Eurozone equities for 2016 is Italy.
The Italian economy surprised to the upside in 2015, and recent bank sur-veys suggest that lending standards are loosening – something which should be positive for both growth and banking sector profitability. Finan-cials make up 42% of the Italian equi-ties market index, and we expect above-average earnings growth for the next two years.
Dividend futures: Play on Eurozone growthInvestor expectations for the value of dividends that Eurozone compa-nies will pay in 2016 have dropped, given market uncertainty in the second half of 2015. The dividends futures market is now pricing that dividend payments will stay flat year-over-year in 2016.
This is despite consensus forecasts of ca. 8% earnings growth, and our own expectations for 8–12% earnings growth: companies do not ordinarily cut dividends in an environment of rising earnings.
As such, we believe there is a potentially attractive opportunity in 2016 Eurozone dividend futures contracts. As fundamentals reas-sert, we expect 2016 dividend futures to return 4–9% in 2016.
Source: UBS, as of November 13, 2015
Relatively low margins suggest potential for durable upsideEurozone EBIT margins
4
5
2
6
3
8
7
0
1
Fig. 12
200
5
200
6
2007
200
8
200
9
2010
2011
2012
2013
2014
2015
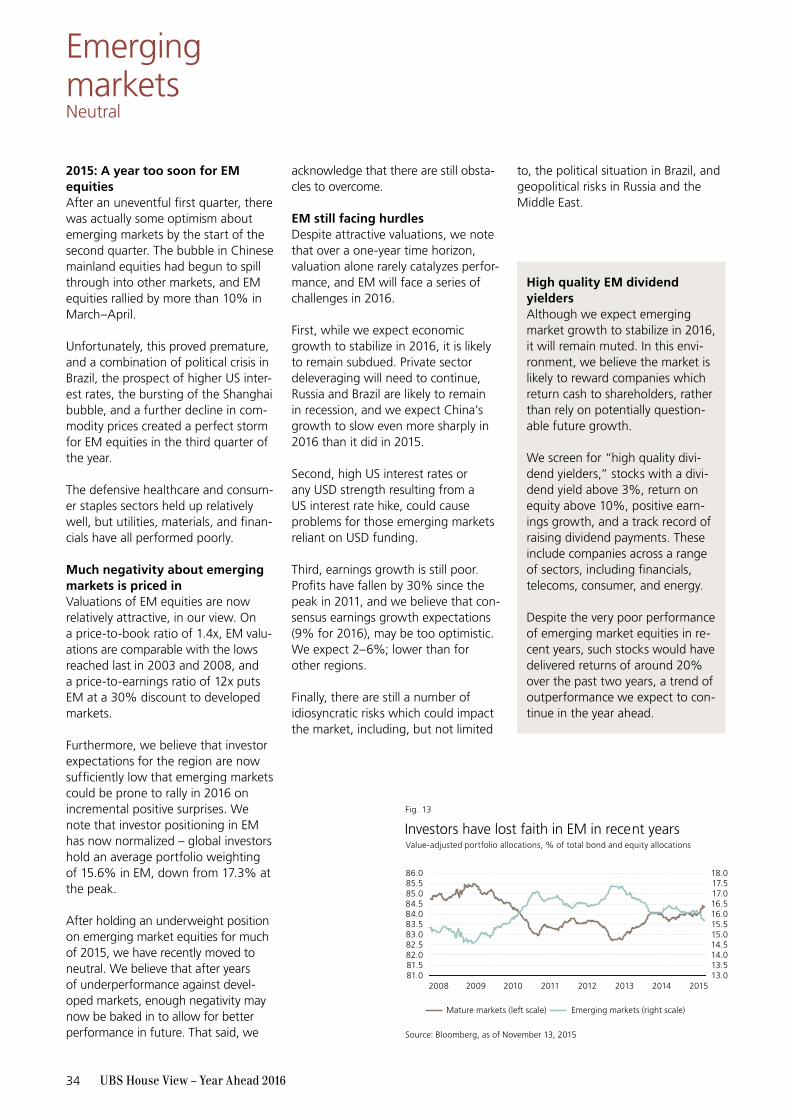
UBS House View – Year Ahead 201634
EmergingmarketsNeutral
2015: A year too soon for EM equitiesAfter an uneventful first quarter, there was actually some optimism about emerging markets by the start of the second quarter. The bubble in Chinese mainland equities had begun to spill through into other markets, and EM equities rallied by more than 10% in March–April.
Unfortunately, this proved premature, and a com bination of political crisis in Brazil, the prospect of higher US inter-est rates, the bursting of the Shanghai bubble, and a further decline in com-modity prices created a perfect storm for EM equities in the third quarter of the year.
The defensive healthcare and consum-er staples sectors held up relatively well, but utilities, materials, and finan-cials have all performed poorly.
Much negativity about emerging markets is priced inValuations of EM equities are now relatively attractive, in our view. On a price-to-book ratio of 1.4x, EM valu-ations are comparable with the lows reached last in 2003 and 2008, and a price-to-earnings ratio of 12x puts EM at a 30% discount to developed markets.
Furthermore, we believe that investor expectations for the region are now sufficiently low that emerging markets could be prone to rally in 2016 on incremental positive surprises. We note that investor positioning in EM has now normalized – global investors hold an average port folio weighting of 15.6% in EM, down from 17.3% at the peak.
After holding an underweight position on emerging market equities for much of 2015, we have recently moved to neutral. We believe that after years of underperformance against devel-oped markets, enough negativity may now be baked in to allow for better per formance in future. That said, we
acknowledge that there are still obsta-cles to overcome.
EM still facing hurdlesDespite attractive valuations, we note that over a one-year time horizon, valuation alone rarely catalyzes perfor-mance, and EM will face a series of challenges in 2016.
First, while we expect economic growth to stabilize in 2016, it is likely to remain subdued. Private sector deleveraging will need to continue, Russia and Brazil are likely to remain in recession, and we expect China’s growth to slow even more sharply in 2016 than it did in 2015.
Second, high US interest rates or any USD strength resulting from a US interest rate hike, could cause problems for those emerging markets reliant on USD funding.
Third, earnings growth is still poor. Profits have fallen by 30% since the peak in 2011, and we believe that con-sensus earnings growth expectations (9% for 2016), may be too optimistic. We expect 2–6%; lower than for other regions.
Finally, there are still a number of idiosyncratic risks which could impact the market, including, but not limited
to, the political situation in Brazil, and geopolitical risks in Russia and the Middle East.
High quality EM dividend yieldersAlthough we expect emerging market growth to stabilize in 2016, it will remain muted. In this envi-ronment, we believe the market is likely to reward companies which return cash to shareholders, rather than rely on potentially question-able future growth.
We screen for “high quality divi-dend yielders,” stocks with a divi-dend yield above 3%, return on equity above 10%, positive earn-ings growth, and a track record of raising dividend payments. These include companies across a range of sectors, including financials, telecoms, consumer, and energy.
Despite the very poor performance of emerging market equities in re-cent years, such stocks would have delivered returns of around 20% over the past two years, a trend of outperformance we expect to con-tinue in the year ahead.
Source: Bloomberg, as of November 13, 2015
Investors have lost faith in EM in recent years
83.0
84.084.5
83.5
82.0
85.0
82.5
86.085.5
81.081.5
15.0
16.016.5
15.5
14.0
17.0
14.5
18.017.5
13.013.5
Fig. 13
2008 2009 2010 2011 2012 2013 2014 2015
Mature markets (le scale) Emerging markets (right scale)
Value-adjusted portfolio allocations, % of total bond and equity allocations
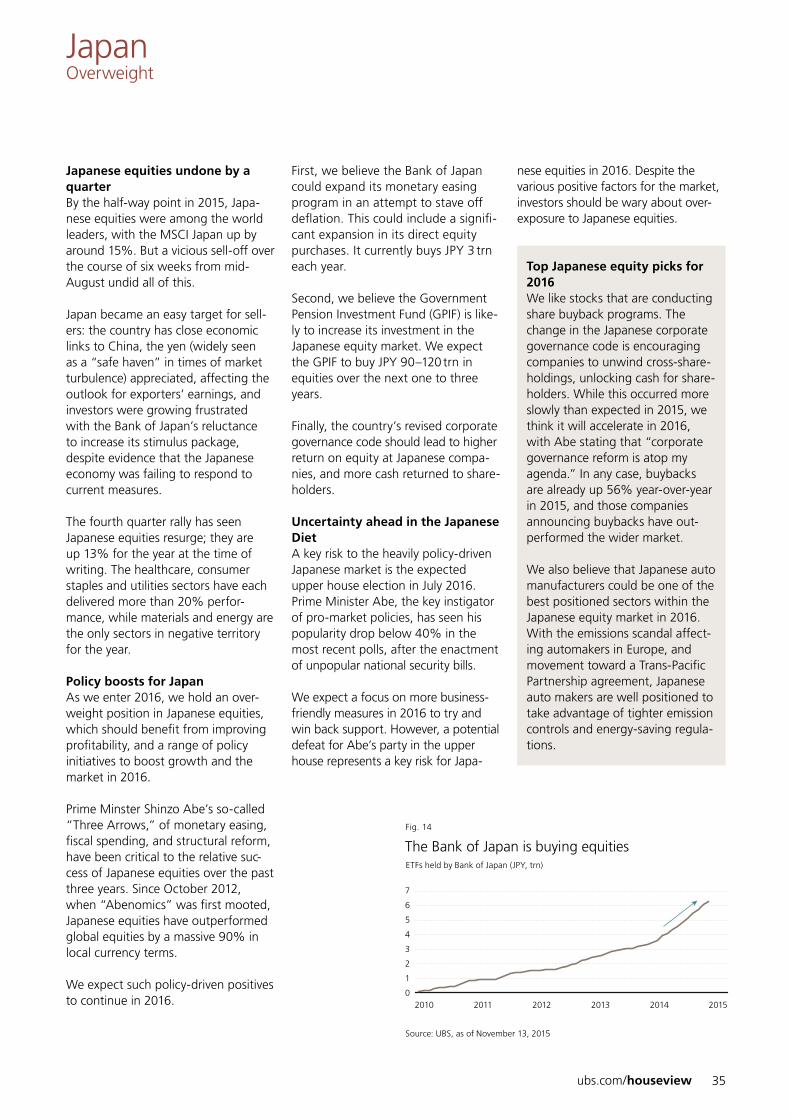
ubs.com/houseview 35
JapanOverweight
Japanese equities undone by a quarterBy the half-way point in 2015, Japa-nese equities were among the world leaders, with the MSCI Japan up by around 15%. But a vicious sell-off over the course of six weeks from mid- August undid all of this.
Japan became an easy target for sell-ers: the country has close economic links to China, the yen (widely seen as a “safe haven” in times of market turbulence) appreciated, affecting the outlook for exporters’ earnings, and investors were growing frustrated with the Bank of Japan’s reluctance to increase its stimulus package, despite evidence that the Japanese economy was failing to respond to current measures.
The fourth quarter rally has seen Japanese equities resurge; they are up 13% for the year at the time of writing. The healthcare, consumer staples and utilities sectors have each delivered more than 20% perfor-mance, while materials and energy are the only sectors in negative territory for the year.
Policy boosts for JapanAs we enter 2016, we hold an over-weight position in Japanese equities, which should benefit from improving profitability, and a range of policy initiatives to boost growth and the market in 2016.
Prime Minster Shinzo Abe’s so-called “Three Arrows,” of monetary easing, fiscal spending, and structural reform, have been critical to the relative suc-cess of Japanese equities over the past three years. Since October 2012, when “Abenomics” was first mooted, Japanese equities have outperformed global equities by a massive 90% in local currency terms.
We expect such policy-driven positives to continue in 2016.
First, we believe the Bank of Japan could expand its monetary easing program in an attempt to stave off deflation. This could include a signifi-cant expansion in its direct equity purchases. It currently buys JPY 3 trn each year.
Second, we believe the Government Pension Investment Fund (GPIF) is like-ly to increase its investment in the Japanese equity market. We expect the GPIF to buy JPY 90–120 trn in equities over the next one to three years.
Finally, the country’s revised corporate governance code should lead to higher return on equity at Japanese compa-nies, and more cash returned to share-holders.
Uncertainty ahead in the Japanese DietA key risk to the heavily policy-driven Japanese market is the expected upper house election in July 2016. Prime Minister Abe, the key instigator of pro-market policies, has seen his popularity drop below 40% in the most recent polls, after the enactment of unpopular national security bills.
We expect a focus on more business-friendly measures in 2016 to try and win back support. However, a potential defeat for Abe’s party in the upper house represents a key risk for Japa-
nese equities in 2016. Despite the various positive factors for the market, investors should be wary about over-exposure to Japanese equities.
Top Japanese equity picks for 2016We like stocks that are conducting share buyback programs. The change in the Japanese corporate governance code is encouraging companies to unwind cross-share-holdings, unlocking cash for share-holders. While this occurred more slowly than expected in 2015, we think it will accelerate in 2016, with Abe stating that “corporate governance reform is atop my agenda.” In any case, buybacks are already up 56% year-over-year in 2015, and those companies announcing buybacks have out-performed the wider market.
We also believe that Japanese auto manufacturers could be one of the best positioned sectors within the Japanese equity market in 2016. With the emissions scandal affect-ing automakers in Europe, and movement toward a Trans-Pacific Partnership agreement, Japanese auto makers are well positioned to take advantage of tighter emission controls and energy-saving regula-tions.
Source: UBS, as of November 13, 2015
2010 2011 2012 2013 2014 2015
The Bank of Japan is buying equitiesETFs held by Bank of Japan (JPY, trn)
4
5
2
6
3
7
0
1
Fig. 14
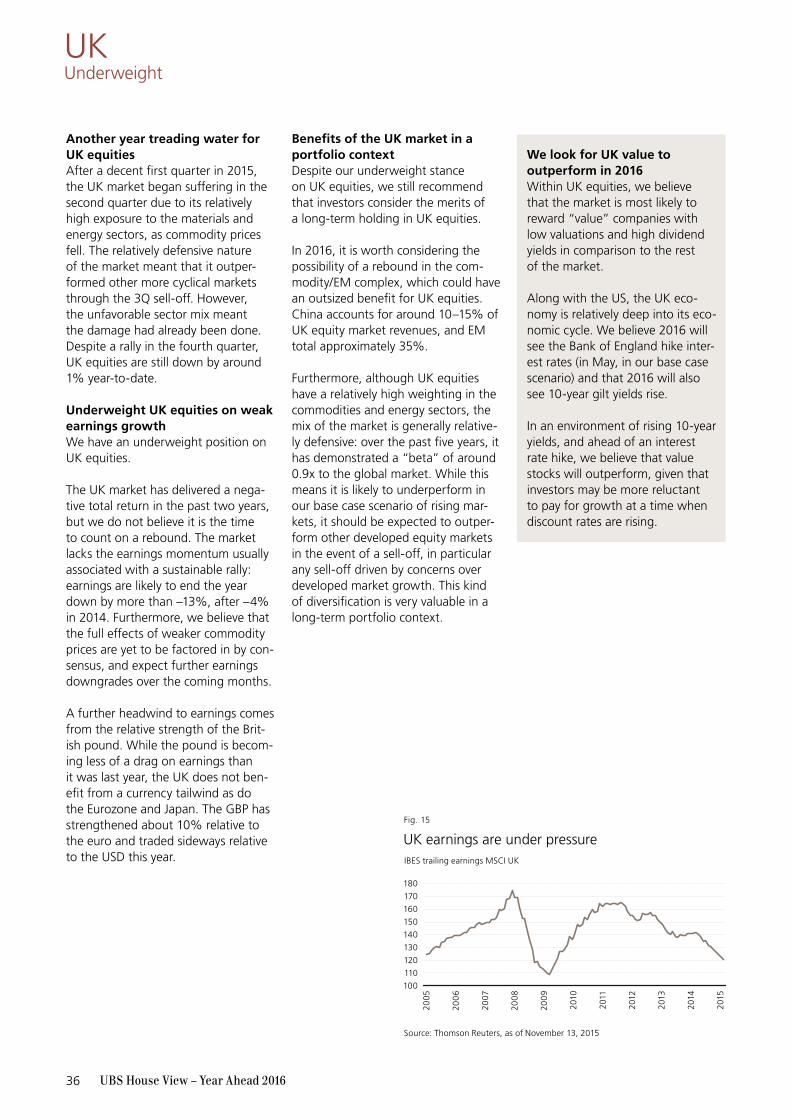
UBS House View – Year Ahead 201636
UKUnderweight
Another year treading water for UK equitiesAfter a decent first quarter in 2015, the UK market began suffering in the second quarter due to its relatively high exposure to the materials and energy sectors, as commodity prices fell. The relatively defensive nature of the market meant that it outper-formed other more cyclical markets through the 3Q sell-off. However, the unfavorable sector mix meant the damage had already been done. Despite a rally in the fourth quarter, UK equities are still down by around 1% year-to-date.
Underweight UK equities on weak earnings growth We have an underweight position on UK equities.
The UK market has delivered a nega-tive total return in the past two years, but we do not believe it is the time to count on a rebound. The market lacks the earnings momentum usually associated with a sustainable rally: earnings are likely to end the year down by more than –13%, after –4% in 2014. Furthermore, we believe that the full effects of weaker commodity prices are yet to be factored in by con-sensus, and expect further earnings downgrades over the coming months.
A further headwind to earnings comes from the relative strength of the Brit-ish pound. While the pound is becom-ing less of a drag on earnings than it was last year, the UK does not ben-efit from a currency tailwind as do the Eurozone and Japan. The GBP has strengthened about 10% relative to the euro and traded sideways relative to the USD this year.
Benefits of the UK market in a portfolio contextDespite our underweight stance on UK equities, we still recommend that investors consider the merits of a long-term holding in UK equities.
In 2016, it is worth considering the possibility of a rebound in the com-modity/EM complex, which could have an outsized benefit for UK equities. China accounts for around 10–15% of UK equity market revenues, and EM total approximately 35%.
Furthermore, although UK equities have a relatively high weighting in the commodities and energy sectors, the mix of the market is generally relative-ly defensive: over the past five years, it has demonstrated a “beta” of around 0.9x to the global market. While this means it is likely to underperform in our base case scenario of rising mar-kets, it should be expected to outper-form other developed equity markets in the event of a sell-off, in particular any sell-off driven by concerns over developed market growth. This kind of diversification is very valuable in a long-term portfolio context.
We look for UK value to outperform in 2016Within UK equities, we believe that the market is most likely to reward “value” companies with low valuations and high dividend yields in comparison to the rest of the market.
Along with the US, the UK eco-nomy is relatively deep into its eco-nomic cycle. We believe 2016 will see the Bank of England hike inter-est rates (in May, in our base case scenario) and that 2016 will also see 10-year gilt yields rise.
In an environment of rising 10-year yields, and ahead of an interest rate hike, we believe that value stocks will outperform, given that investors may be more reluctant to pay for growth at a time when discount rates are rising.
Source: Thomson Reuters, as of November 13, 2015
UK earnings are under pressureIBES trailing earnings MSCI UK
140
150
120
160
130
180
170
100
110
Fig. 15
200
5
200
6
2007
200
8
200
9
2010
2011
2012
2013
2014
2015
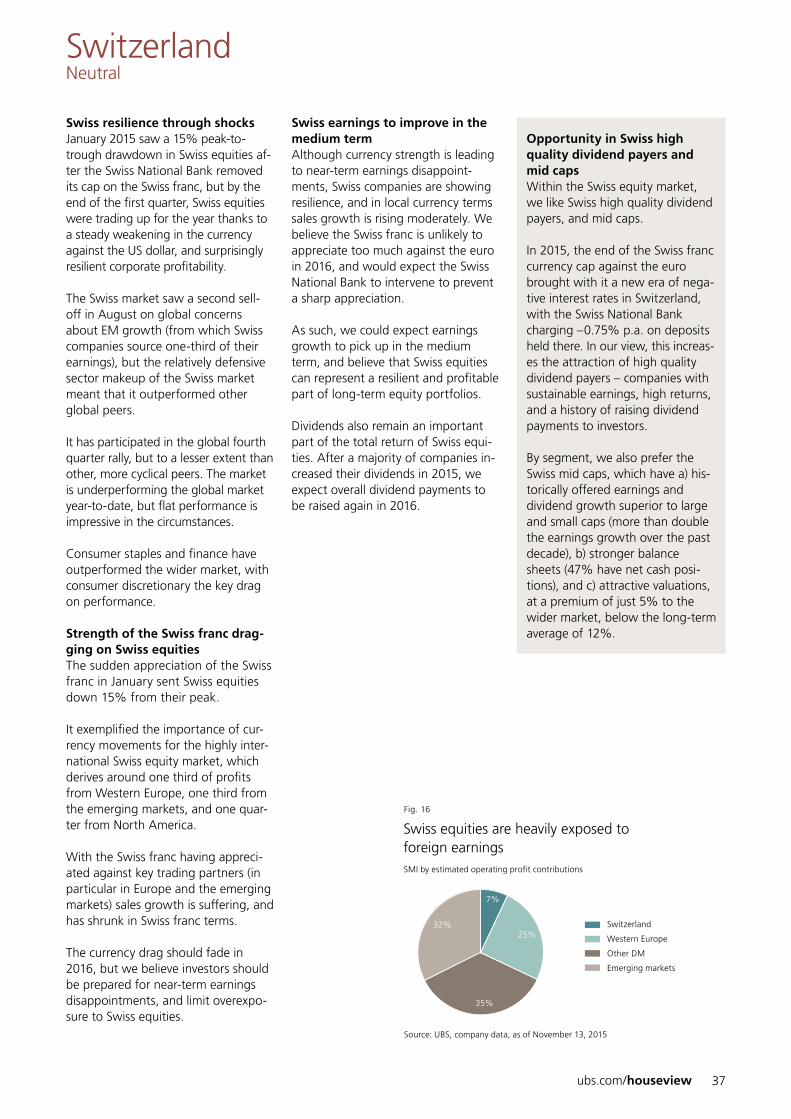
ubs.com/houseview 37
SwitzerlandNeutral
Swiss resilience through shocksJanuary 2015 saw a 15% peak-to-trough drawdown in Swiss equities af-ter the Swiss National Bank removed its cap on the Swiss franc, but by the end of the first quarter, Swiss equities were trading up for the year thanks to a steady weakening in the currency against the US dollar, and surprisingly resilient corporate profitability.
The Swiss market saw a second sell-off in August on global concerns about EM growth (from which Swiss companies source one-third of their earnings), but the relatively defensive sector makeup of the Swiss market meant that it outperformed other global peers.
It has participated in the global fourth quarter rally, but to a lesser extent than other, more cyclical peers. The market is underperforming the global market year-to-date, but flat performance is impressive in the circumstances.
Consumer staples and finance have outperformed the wider market, with consumer discretionary the key drag on performance.
Strength of the Swiss franc drag-ging on Swiss equitiesThe sudden appreciation of the Swiss franc in January sent Swiss equities down 15% from their peak.
It exemplified the importance of cur-rency movements for the highly inter-national Swiss equity market, which derives around one third of profits from Western Europe, one third from the emerging markets, and one quar-ter from North America.
With the Swiss franc having appreci-ated against key trading partners (in particular in Europe and the emerging markets) sales growth is suffering, and has shrunk in Swiss franc terms.
The currency drag should fade in 2016, but we believe investors should be prepared for near-term earnings disappointments, and limit overexpo-sure to Swiss equities.
Swiss earnings to improve in the medium termAlthough currency strength is leading to near-term earnings disappoint-ments, Swiss companies are showing resilience, and in local currency terms sales growth is rising moderately. We believe the Swiss franc is unlikely to appreciate too much against the euro in 2016, and would expect the Swiss National Bank to intervene to prevent a sharp appreciation.
As such, we could expect earnings growth to pick up in the medium term, and believe that Swiss equities can represent a resilient and profitable part of long-term equity portfolios.
Dividends also remain an important part of the total return of Swiss equi-ties. After a majority of companies in-creased their dividends in 2015, we expect overall dividend payments to be raised again in 2016.
Opportunity in Swiss high quality dividend payers and mid capsWithin the Swiss equity market, we like Swiss high quality dividend payers, and mid caps.
In 2015, the end of the Swiss franc currency cap against the euro brought with it a new era of nega-tive interest rates in Switzerland, with the Swiss National Bank charging –0.75% p.a. on deposits held there. In our view, this increas-es the attraction of high quality dividend payers – companies with sustainable earnings, high returns, and a history of raising dividend payments to investors.
By segment, we also prefer the Swiss mid caps, which have a) his-torically offered earnings and dividend growth superior to large and small caps (more than double the earnings growth over the past decade), b) stronger balance sheets (47% have net cash posi-tions), and c) attractive valuations, at a premium of just 5% to the wider market, below the long-term average of 12%.
Source: UBS, company data, as of November 13, 2015
Swiss equities are heavily exposed to foreign earnings
Fig. 16
SMI by estimated operating profit contributions
Switzerland
Western Europe
Other DM
Emerging markets
7%
25%
35%
32%
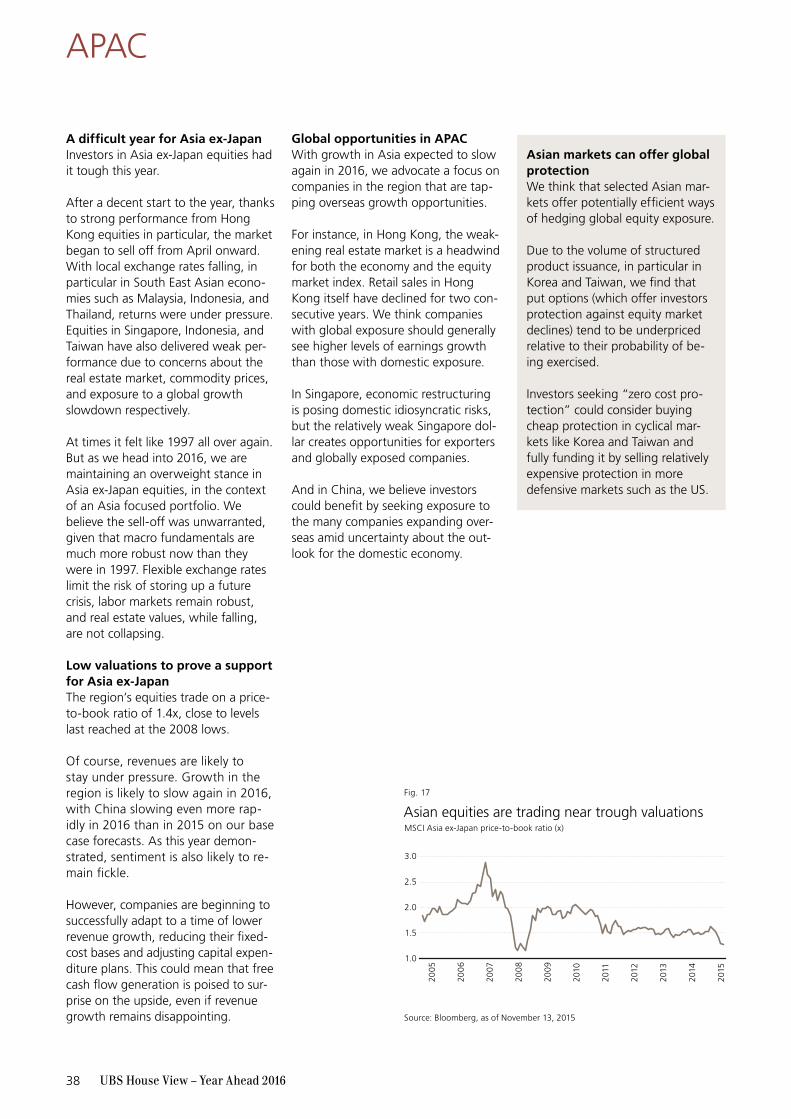
UBS House View – Year Ahead 201638
APAC
A difficult year for Asia ex-JapanInvestors in Asia ex-Japan equities had it tough this year.
After a decent start to the year, thanks to strong performance from Hong Kong equities in particular, the market began to sell off from April onward. With local exchange rates falling, in particular in South East Asian econo-mies such as Malaysia, Indonesia, and Thailand, returns were under pressure. Equities in Singapore, Indonesia, and Taiwan have also delivered weak per-formance due to concerns about the real estate market, commodity prices, and exposure to a global growth slowdown respectively.
At times it felt like 1997 all over again. But as we head into 2016, we are maintaining an overweight stance in Asia ex-Japan equities, in the context of an Asia focused portfolio. We believe the sell-off was unwarranted, given that macro fundamentals are much more robust now than they were in 1997. Flexible exchange rates limit the risk of storing up a future crisis, labor markets remain robust, and real estate values, while falling, are not collapsing.
Low valuations to prove a support for Asia ex-JapanThe region’s equities trade on a price-to-book ratio of 1.4x, close to levels last reached at the 2008 lows.
Of course, revenues are likely to stay under pressure. Growth in the region is likely to slow again in 2016, with China slowing even more rap-idly in 2016 than in 2015 on our base case forecasts. As this year demon-strated, sentiment is also likely to re-main fickle.
However, companies are beginning to successfully adapt to a time of lower revenue growth, reducing their fixed-cost bases and adjusting capital expen-diture plans. This could mean that free cash flow generation is poised to sur-prise on the upside, even if revenue growth remains disappointing.
Global opportunities in APACWith growth in Asia expected to slow again in 2016, we advocate a focus on companies in the region that are tap-ping overseas growth opportunities.
For instance, in Hong Kong, the weak-ening real estate market is a headwind for both the economy and the equity market index. Retail sales in Hong Kong itself have declined for two con-secutive years. We think companies with global exposure should generally see higher levels of earnings growth than those with domestic exposure.
In Singapore, economic restructuring is posing domestic idiosyncratic risks, but the relatively weak Singapore dol-lar creates opportunities for exporters and globally exposed companies.
And in China, we believe investors could benefit by seeking exposure to the many companies expanding over-seas amid uncertainty about the out-look for the domestic economy.
Asian markets can offer global protectionWe think that selected Asian mar-kets offer potentially efficient ways of hedging global equity exposure.
Due to the volume of structured product issuance, in particular in Korea and Taiwan, we find that put options (which offer investors protection against equity market declines) tend to be underpriced relative to their probability of be-ing exercised.
Investors seeking “zero cost pro-tection” could consider buying cheap protection in cyclical mar-kets like Korea and Taiwan and fully funding it by selling relatively expensive protection in more defensive markets such as the US.
Source: Bloomberg, as of November 13, 2015
Asian equities are trading near trough valuationsMSCI Asia ex-Japan price-to-book ratio (x)
2.0
2.5
3.0
1.0
1.5
Fig. 17
200
5
200
6
2007
200
8
200
9
2010
2011
2012
2013
2015
2014

ubs.com/houseview 39
Bonds
Carolina Moura-Alves, Head of Fixed Income StrategiesDouglas Rothstein, Head of Rates StrategiesPhilipp Schoettler, Head of DM Credit StrategiesMichael Bolliger, Head of EM Asset Allocation
As the world transitions to a moderately higher pace of growth, higher levels of inflation, and higher interest rates in the US, we expect bond yields to rise. In a difficult environment for bonds, we are underweight the asset class as a whole, but see opportunities within in European high yield credit, and short-dated investment grade credit.
2015 bond market review Investment grade bonds had a rela-tively volatile year in the Eurozone: strong 1Q performance was driven by the European Central Bank’s announce ment of quantitative easing and falling oil prices and inflation, but the weakest 2Q for the market since 1994 then followed. Performance in 3Q was weaker than might have been expected in a risk-averse market. US investment grade corporate bonds, in particular, faced technical head-winds from record net issuance, but signs of the US Federal Reserve delay-ing interest rate hikes buoyed prices through the latter part of the year. At this writing, returns are broadly flat in both USD and in EUR.
Meanwhile, it looks set to be a broadly flat year for US high yield credit returns too. Good performance in 1H, aided by a recovery in oil prices, turned weaker in 3Q, when falling energy prices and concerns about global growth affected economically-sensitive bonds. EUR-denominated high yield, with more limited energy exposure, has per-formed better.
Emerging market bonds have per-formed well against a backdrop of weakening growth in the region. Their relatively long duration has helped in a world still starved of yield, and default rates have remained contained.
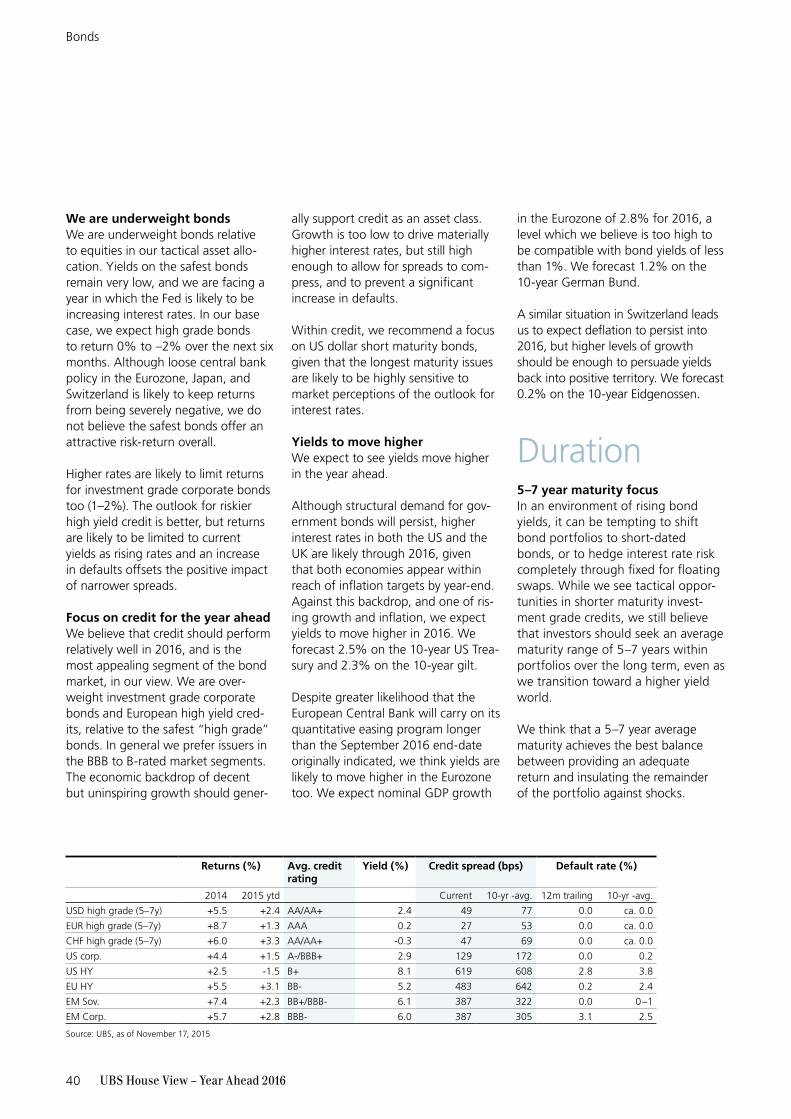
UBS House View – Year Ahead 201640
We are underweight bonds We are underweight bonds relative to equities in our tactical asset allo-cation. Yields on the safest bonds remain very low, and we are facing a year in which the Fed is likely to be increasing interest rates. In our base case, we expect high grade bonds to return 0% to –2% over the next six months. Although loose central bank policy in the Eurozone, Japan, and Switzerland is likely to keep returns from being severely negative, we do not believe the safest bonds offer an attractive risk-return overall.
Higher rates are likely to limit returns for investment grade corporate bonds too (1–2%). The outlook for riskier high yield credit is better, but returns are likely to be limited to current yields as rising rates and an increase in defaults offsets the positive impact of narrower spreads.
Focus on credit for the year aheadWe believe that credit should perform relatively well in 2016, and is the most appealing segment of the bond market, in our view. We are over-weight investment grade corporate bonds and European high yield cred-its, relative to the safest “high grade” bonds. In general we prefer issuers in the BBB to B-rated market segments.The economic backdrop of decent but uninspiring growth should gener-
ally support credit as an asset class. Growth is too low to drive materially higher interest rates, but still high enough to allow for spreads to com-press, and to prevent a significant increase in defaults.
Within credit, we recommend a focus on US dollar short maturity bonds, given that the longest maturity issues are likely to be highly sensitive to market perceptions of the outlook for interest rates.
Yields to move higherWe expect to see yields move higher in the year ahead.
Although structural demand for gov-ernment bonds will persist, higher interest rates in both the US and the UK are likely through 2016, given that both economies appear within reach of inflation targets by year-end. Against this backdrop, and one of ris-ing growth and inflation, we expect yields to move higher in 2016. We forecast 2.5% on the 10-year US Trea-sury and 2.3% on the 10-year gilt.
Despite greater likelihood that the European Central Bank will carry on its quantitative easing program longer than the September 2016 end-date originally indicated, we think yields are likely to move higher in the Eurozone too. We expect nominal GDP growth
in the Eurozone of 2.8% for 2016, a level which we believe is too high to be compatible with bond yields of less than 1%. We forecast 1.2% on the 10-year German Bund.
A similar situation in Switzerland leads us to expect deflation to persist into 2016, but higher levels of growth should be enough to persuade yields back into positive territory. We forecast 0.2% on the 10-year Eidgenossen.
Duration5–7 year maturity focusIn an environment of rising bond yields, it can be tempting to shift bond port folios to short-dated bonds, or to hedge interest rate risk completely through fixed for floating swaps. While we see tactical oppor-tunities in shorter maturity invest-ment grade credits, we still believe that investors should seek an average maturity range of 5–7 years within portfolios over the long term, even as we transition toward a higher yield world.
We think that a 5–7 year average maturity achieves the best balance between providing an adequate return and insulating the remainder of the portfolio against shocks.
Bonds
Returns (%) Avg. credit rating
Yield (%) Credit spread (bps) Default rate (%)
2014 2015 ytd Current 10-yr -avg. 12m trailing 10-yr -avg.
USD high grade (5–7y) +5.5 +2.4 AA/AA+ 2.4 49 77 0.0 ca. 0.0
EUR high grade (5–7y) +8.7 +1.3 AAA 0.2 27 53 0.0 ca. 0.0
CHF high grade (5–7y) +6.0 +3.3 AA/AA+ -0.3 47 69 0.0 ca. 0.0
US corp. +4.4 +1.5 A-/BBB+ 2.9 129 172 0.0 0.2
US HY +2.5 -1.5 B+ 8.1 619 608 2.8 3.8
EU HY +5.5 +3.1 BB- 5.2 483 642 0.2 2.4
EM Sov. +7.4 +2.3 BB+/BBB- 6.1 387 322 0.0 0 –1
EM Corp. +5.7 +2.8 BBB- 6.0 387 305 3.1 2.5
Source: UBS, as of November 17, 2015
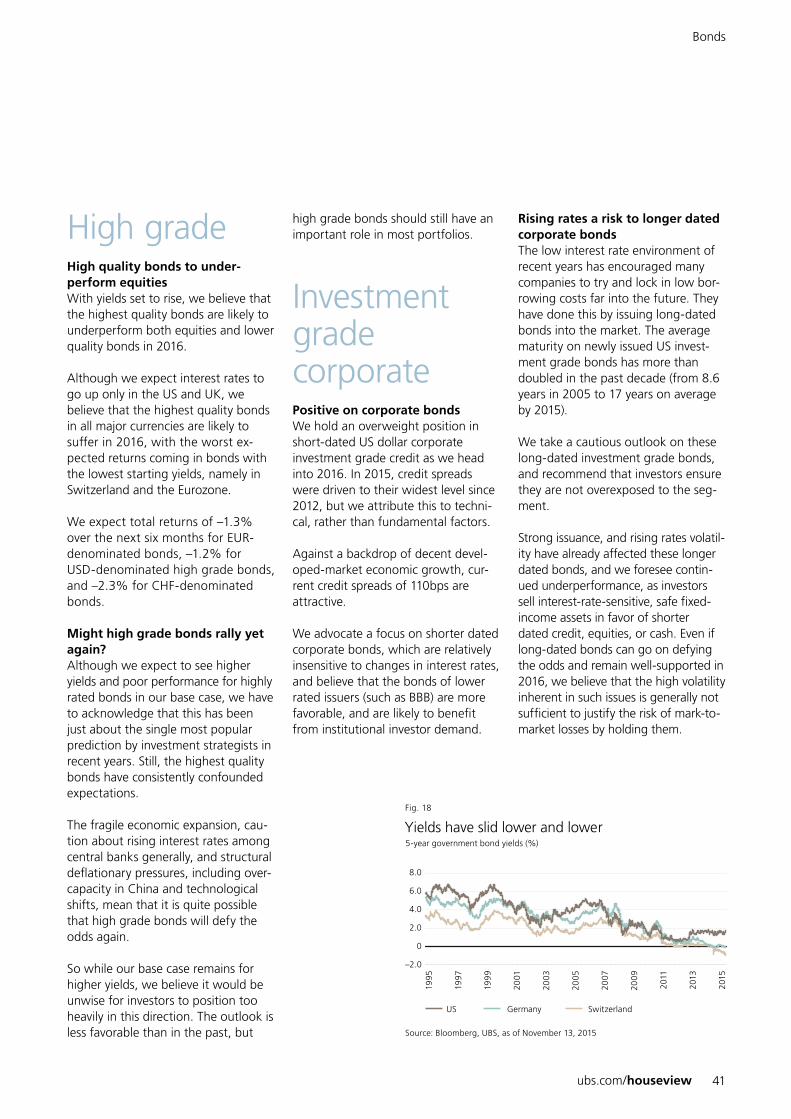
ubs.com/houseview 41
High gradeHigh quality bonds to under-perform equitiesWith yields set to rise, we believe that the highest quality bonds are likely to underperform both equities and lower quality bonds in 2016.
Although we expect interest rates to go up only in the US and UK, we believe that the highest quality bonds in all major currencies are likely to suffer in 2016, with the worst ex-pected returns coming in bonds with the lowest starting yields, namely in Switzerland and the Eurozone.
We expect total returns of –1.3% over the next six months for EUR- denominated bonds, –1.2% for USD-denominated high grade bonds, and –2.3% for CHF-denominated bonds.
Might high grade bonds rally yet again?Although we expect to see higher yields and poor performance for highly rated bonds in our base case, we have to acknowledge that this has been just about the single most popular prediction by investment strategists in recent years. Still, the highest quality bonds have consistently confounded expectations.
The fragile economic expansion, cau-tion about rising interest rates among central banks generally, and structural deflationary pressures, including over-capacity in China and technological shifts, mean that it is quite possible that high grade bonds will defy the odds again.
So while our base case remains for higher yields, we believe it would be unwise for investors to position too heavily in this direction. The outlook is less favorable than in the past, but
high grade bonds should still have an important role in most portfolios.
Investment grade corporatePositive on corporate bondsWe hold an overweight position in short-dated US dollar corporate investment grade credit as we head into 2016. In 2015, credit spreads were driven to their widest level since 2012, but we attribute this to techni-cal, rather than fundamental factors.
Against a backdrop of decent devel-oped-market economic growth, cur-rent credit spreads of 110bps are attractive.
We advocate a focus on shorter dated corporate bonds, which are relatively insensitive to changes in interest rates, and believe that the bonds of lower rated issuers (such as BBB) are more favorable, and are likely to benefit from institutional investor demand.
Rising rates a risk to longer dated corporate bondsThe low interest rate environment of recent years has encouraged many companies to try and lock in low bor-rowing costs far into the future. They have done this by issuing long-dated bonds into the market. The average maturity on newly issued US invest-ment grade bonds has more than doubled in the past decade (from 8.6 years in 2005 to 17 years on average by 2015).
We take a cautious outlook on these long-dated investment grade bonds, and recommend that investors ensure they are not overexposed to the seg-ment.
Strong issuance, and rising rates volatil-ity have already affected these longer dated bonds, and we foresee contin-ued underperformance, as investors sell interest-rate-sensitive, safe fixed-income assets in favor of shorter dated credit, equities, or cash. Even if long-dated bonds can go on defying the odds and remain well-supported in 2016, we believe that the high volatility inherent in such issues is generally not sufficient to justify the risk of mark-to-market losses by holding them.
Bonds
Source: Bloomberg, UBS, as of November 13, 2015
Yields have slid lower and lower5-year government bond yields (%)
2.0
US Germany Switzerland
4.0
6.0
8.0
–2.0
0
Fig. 18
1995
1997
199
9
2001
2003
200
5
2007
200
9
2011
2015
2013
UBS House View – Year Ahead 201642
High yieldOpportunity in European high yieldWe believe that high yield bonds in Europe hold appeal as we head into 2016. Total yields of around 5% are attractive in our view, and we expect total returns of 3% over the coming six months. Importantly, the credit cycle in Europe remains relatively immature. The region has been slow to recover from both the 2008 finan-cial crisis and the 2011 Eurozone crisis. While this has hurt corporate profit-ability, it is positive for bond holders, given that leverage has not increased as much as it has in other regions.
The European Central Bank is also likely to keep interest rates close to (or even below) zero for the foresee-able future, and economic growth is likely to accelerate again in 2016. Default rates for European high yield issuers are likely to remain below 2% over the next 12 months.
The coming high yield default cycle?While we believe most investors should maintain some strategic expo-sure to US high yield bonds, we believe that default rates are likely to rise in 2016, which could put some pressure on the asset class.
The US credit cycle is at a relatively mature stage. New bond issuance is being increasingly used for capital investment or for acquisitions. While
this is potentially good for overall economic growth, it tends to be bad for credit quality, as it increases corpo-rate leverage. Corporate leverage has risen from 3.2x net debt-to-EBITDA in 2010 to 4.9x this year.
This, along with the recent commod-ity price weakness depressing the cash flows of companies in extraction industries, make us expect to see US high yield default rates rising toward 4.5% over the next 12 months.
Source: Bank of America, UBS, as of November 13, 2015
US and Europe at different stages in the credit cycleHigh yield credit average net debt-to-EBITDA
1
2
4
3
6
5
0
Fig. 19
200
5
200
6
2007
200
8
200
9
2010
2011
2012
2013
2015
2014
US (excl. energy) Europe
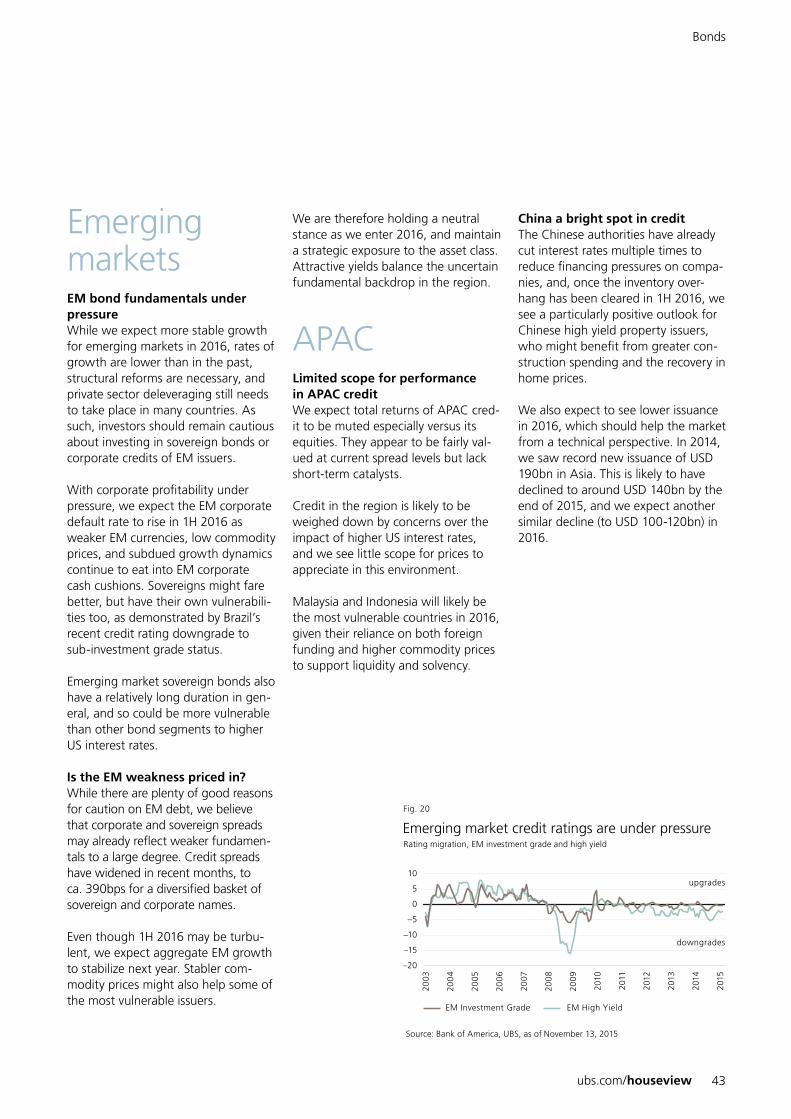
ubs.com/houseview 43
Emerging marketsEM bond fundamentals under pressureWhile we expect more stable growth for emerging markets in 2016, rates of growth are lower than in the past, structural reforms are necessary, and private sector deleveraging still needs to take place in many countries. As such, investors should remain cautious about investing in sovereign bonds or corporate credits of EM issuers.
With corporate profitability under pressure, we expect the EM corporate default rate to rise in 1H 2016 as weaker EM currencies, low commodity prices, and subdued growth dynamics continue to eat into EM corporate cash cushions. Sovereigns might fare better, but have their own vulnerabili-ties too, as demonstrated by Brazil’s recent credit rating downgrade to sub-investment grade status.
Emerging market sovereign bonds also have a relatively long duration in gen-eral, and so could be more vulnerable than other bond segments to higher US interest rates.
Is the EM weakness priced in?While there are plenty of good reasons for caution on EM debt, we believe that corporate and sovereign spreads may already reflect weaker fundamen-tals to a large degree. Credit spreads have widened in recent months, to ca. 390bps for a diversified basket of sovereign and corporate names.
Even though 1H 2016 may be turbu-lent, we expect aggregate EM growth to stabilize next year. Stabler com-modity prices might also help some of the most vulnerable issuers.
We are therefore holding a neutral stance as we enter 2016, and maintain a strategic exposure to the asset class. Attractive yields balance the uncertain fundamental backdrop in the region.
APACLimited scope for performance in APAC creditWe expect total returns of APAC cred-it to be muted especially versus its equities. They appear to be fairly val-ued at current spread levels but lack short-term catalysts.
Credit in the region is likely to be weighed down by concerns over the impact of higher US interest rates, and we see little scope for prices to appreciate in this environment.
Malaysia and Indonesia will likely be the most vulnerable countries in 2016, given their reliance on both foreign funding and higher commodity prices to support liquidity and solvency.
China a bright spot in creditThe Chinese authorities have already cut interest rates multiple times to reduce financing pressures on compa-nies, and, once the inventory over-hang has been cleared in 1H 2016, we see a particularly positive outlook for Chinese high yield property issuers, who might benefit from greater con-struction spending and the recovery in home prices.
We also expect to see lower issuance in 2016, which should help the market from a technical perspective. In 2014, we saw record new issuance of USD 190bn in Asia. This is likely to have declined to around USD 140bn by the end of 2015, and we expect another similar decline (to USD 100-120bn) in 2016.
Bonds
Source: Bank of America, UBS, as of November 13, 2015
Emerging market credit ratings are under pressureRating migration, EM investment grade and high yield
–15
–10
0
–5
10
5
–20
Fig. 20
200
5
200
4
2003
200
6
2007
200
8
200
9
2010
2011
2012
2013
2015
2014
EM Investment Grade EM High Yield
upgrades
downgrades

UBS House View – Year Ahead 201644
Alternatives
Simon Smiles, Head of UHNW & AlternativesAndrew Lee, Deputy Head of UHNW & AlternativesNils Beitlich, Head of FundsKarim Cherif, hedge fund strategist
As our world transitions toward one of lower return, alternative investments will play an increasingly important role in portfolios, in our view. For 2016, we think investors could benefit from diversifying assets in a well-balanced hedge fund portfolio across different strategies.
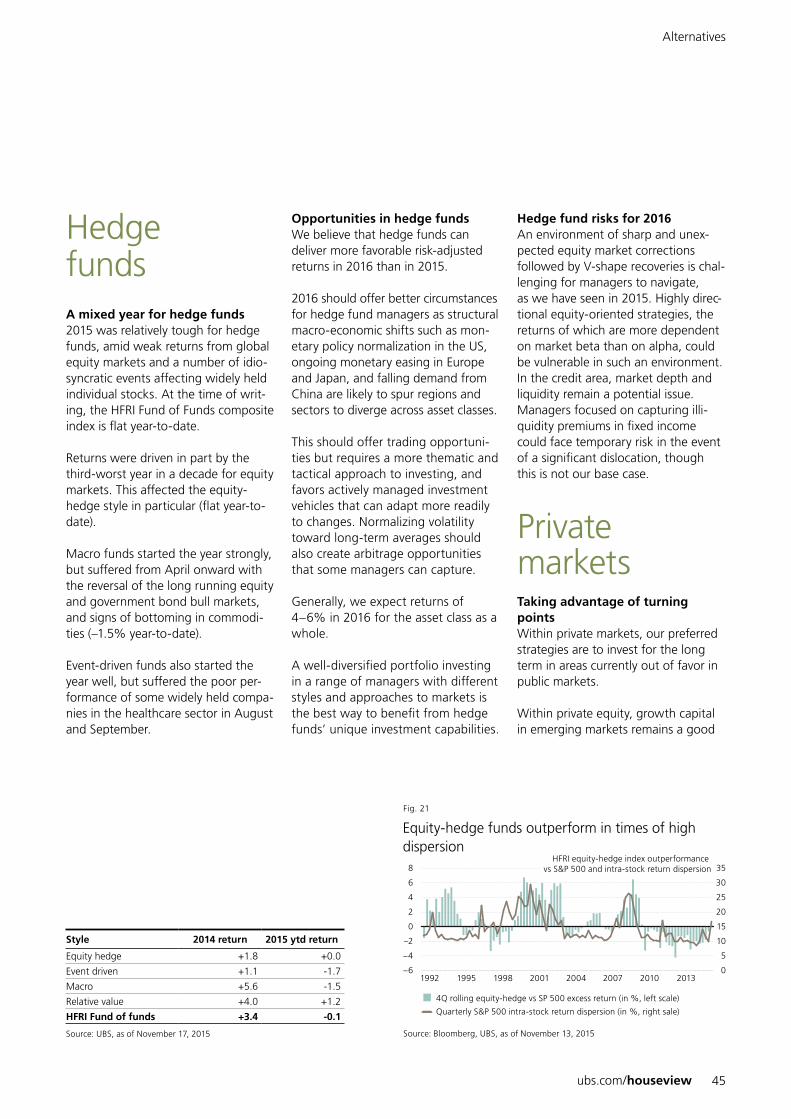
ubs.com/houseview 45
Alternatives
Hedgefunds A mixed year for hedge funds2015 was relatively tough for hedge funds, amid weak returns from global equity markets and a number of idio-syncratic events affecting widely held individual stocks. At the time of writ-ing, the HFRI Fund of Funds composite index is flat year-to-date.
Returns were driven in part by the third-worst year in a decade for equity markets. This affected the equity-hedge style in particular (flat year-to-date).
Macro funds started the year strongly, but suffered from April onward with the reversal of the long running equity and government bond bull markets, and signs of bottoming in commodi-ties (–1.5% year-to-date).
Event-driven funds also started the year well, but suffered the poor per-formance of some widely held compa-nies in the healthcare sector in August and September.
Opportunities in hedge funds We believe that hedge funds can deliver more favorable risk-adjusted returns in 2016 than in 2015.
2016 should offer better circumstances for hedge fund managers as structural macro-economic shifts such as mon-etary policy normalization in the US, ongoing monetary easing in Europe and Japan, and falling demand from China are likely to spur regions and sectors to diverge across asset classes.
This should offer trading opportuni-ties but requires a more thematic and tactical approach to investing, and favors actively managed investment vehicles that can adapt more readily to changes. Normalizing volatility toward long-term averages should also create arbitrage opportunities that some managers can capture.
Generally, we expect returns of 4–6% in 2016 for the asset class as a whole.
A well-diversified portfolio investing in a range of managers with different styles and approaches to markets is the best way to benefit from hedge funds’ unique investment capabilities.
Hedge fund risks for 2016An environment of sharp and unex-pected equity market corrections followed by V-shape recoveries is chal-lenging for managers to navigate, as we have seen in 2015. Highly direc-tional equity-oriented strategies, the returns of which are more dependent on market beta than on alpha, could be vulnerable in such an environment.In the credit area, market depth and liquidity remain a potential issue. Managers focused on capturing illi-quidity premiums in fixed income could face temporary risk in the event of a significant dislocation, though this is not our base case.
Privatemarkets Taking advantage of turning pointsWithin private markets, our preferred strategies are to invest for the long term in areas currently out of favor in public markets.
Within private equity, growth capital in emerging markets remains a good
Source: Bloomberg, UBS, as of November 13, 2015
Equity-hedge funds outperform in times of high dispersion
2
6
4
–2
0
8
–6
–4
20
30
25
10
15
35
0
5
Fig. 21
1992 19981995 2001 2004 2007 2010 2013
Quarterly S&P 500 intra-stock return dispersion (in %, right sale)
4Q rolling equity-hedge vs SP 500 excess return (in %, le scale)
HFRI equity-hedge index outperformance vs S&P 500 and intra-stock return dispersion
Style 2014 return 2015 ytd return
Equity hedge +1.8 +0.0
Event driven +1.1 -1.7
Macro +5.6 -1.5
Relative value +4.0 +1.2
HFRI Fund of funds +3.4 -0.1
Source: UBS, as of November 17, 2015
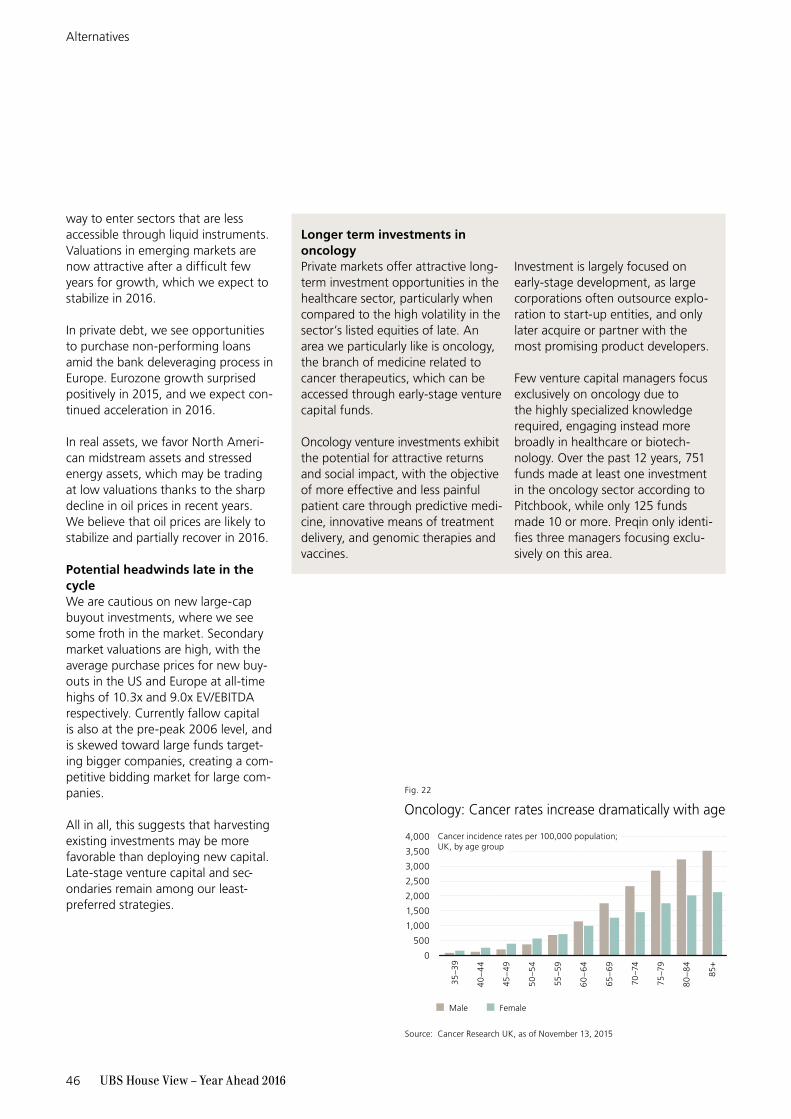
UBS House View – Year Ahead 201646
Longer term investments in oncologyPrivate markets offer attractive long-term investment opportunities in the healthcare sector, particularly when compared to the high volatility in the sector’s listed equities of late. An area we particularly like is oncology, the branch of medicine related to cancer therapeutics, which can be accessed through early-stage venture capital funds.
Oncology venture investments exhibit the potential for attractive returns and social impact, with the objective of more effective and less painful patient care through predictive medi-cine, innovative means of treatment delivery, and genomic therapies and vaccines.
Investment is largely focused on early-stage development, as large corporations often outsource explo-ration to start-up entities, and only later acquire or partner with the most promising product developers.
Few venture capital managers focus exclusively on oncology due to the highly specialized knowledge required, engaging instead more broadly in healthcare or biotech-nology. Over the past 12 years, 751 funds made at least one investment in the oncology sector according to Pitchbook, while only 125 funds made 10 or more. Preqin only identi-fies three managers focusing exclu-sively on this area.
way to enter sectors that are less accessible through liquid instruments. Valuations in emerging markets are now attractive after a difficult few years for growth, which we expect to stabilize in 2016.
In private debt, we see opportunities to purchase non-performing loans amid the bank deleveraging process in Europe. Eurozone growth surprised positively in 2015, and we expect con-tinued acceleration in 2016.
In real assets, we favor North Ameri-can midstream assets and stressed energy assets, which may be trading at low valuations thanks to the sharp decline in oil prices in recent years. We believe that oil prices are likely to stabilize and partially recover in 2016.
Potential headwinds late in the cycleWe are cautious on new large-cap buyout investments, where we see some froth in the market. Secondary market valuations are high, with the average purchase prices for new buy-outs in the US and Europe at all-time highs of 10.3x and 9.0x EV/EBITDA respectively. Currently fallow capital is also at the pre-peak 2006 level, and is skewed toward large funds target-ing bigger companies, creating a com-petitive bidding market for large com-panies.
All in all, this suggests that harvesting existing investments may be more favorable than deploying new capital. Late-stage venture capital and sec-ondaries remain among our least- preferred strategies.
2,000
1,000
3,000
2,500
1,500
3,500
4,000
0
500
Source: Cancer Research UK, as of November 13, 2015
Oncology: Cancer rates increase dramatically with age
Fig. 22
35–3
9
40
–4
4
45–
49
50
–54
55–5
9
60
–6
4
65–
69
70–7
4
75–7
9
80
–84
85+
Male Female
Cancer incidence rates per 100,000 population;UK, by age group
Alternatives

ubs.com/houseview 47
Currencies
Tom Flury, Head of FX StrategiesConstantin Bolz, FX strategist
The US dollar is likely to remain strong for much of 2016, with the Fed increasing interest rates, but may be nearing the end of its run. Meanwhile, we expect short-term weakness for the euro as the ECB extends its loose monetary policy. The Norwegian krone and Canadian dollar should perform well in 2016.
US dollar – close to the end of the road After a ca. 10% trade-weighted appreciation in 2015, the US dollar is at its strongest, on a trade-weighted basis, in more than a decade.
We believe that the strength of the US dollar will continue in 1H 2016. US unemployment is now sufficiently low that the Federal Reserve is likely to hike interest rates through 2016, while the ECB and Bank of Japan seem closer to easing than hiking.
That said, we believe that any appre-ciation surrounding initial interest rate hikes may conclude the USD’s run. The USD’s value looks stretched on a purchasing power parity basis (we think 1.25 against the euro is fair), and some Fed officials have expressed concern about the impact a strong dollar might have on exporters and inflation.
We forecast EURUSD to fall to 1.05 over the next three months, but rise back to 1.10 over the next 12 months.
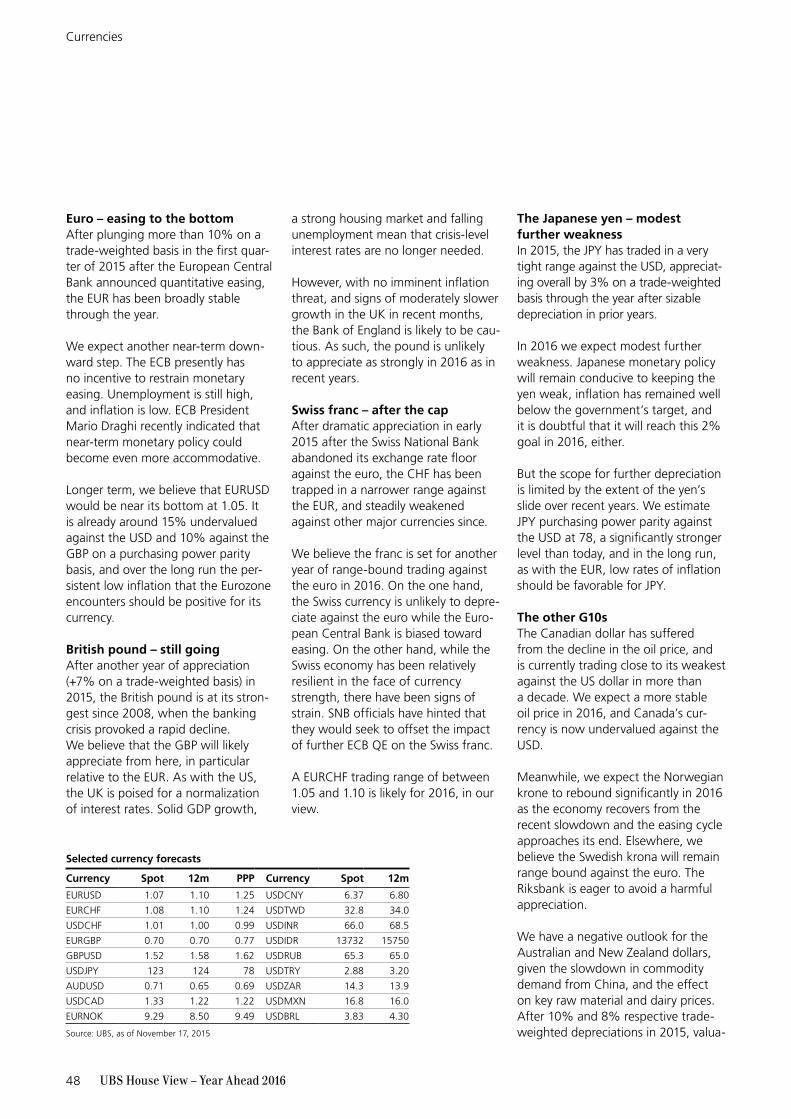
UBS House View – Year Ahead 201648
Currencies
Euro – easing to the bottomAfter plunging more than 10% on a trade-weighted basis in the first quar-ter of 2015 after the European Central Bank announced quantitative easing, the EUR has been broadly stable through the year.
We expect another near-term down-ward step. The ECB presently has no incentive to restrain monetary easing. Unemployment is still high, and inflation is low. ECB President Mario Draghi recently indicated that near-term monetary policy could become even more accommodative.
Longer term, we believe that EURUSD would be near its bottom at 1.05. It is already around 15% undervalued against the USD and 10% against the GBP on a purchasing power parity basis, and over the long run the per-sistent low inflation that the Eurozone encounters should be positive for its currency.
British pound – still goingAfter another year of appreciation (+7% on a trade-weighted basis) in 2015, the British pound is at its stron-gest since 2008, when the banking crisis provoked a rapid decline.We believe that the GBP will likely appreciate from here, in particular relative to the EUR. As with the US, the UK is poised for a normalization of interest rates. Solid GDP growth,
a strong housing market and falling unemployment mean that crisis-level interest rates are no longer needed.
However, with no imminent inflation threat, and signs of moderately slower growth in the UK in recent months, the Bank of England is likely to be cau-tious. As such, the pound is unlikely to appreciate as strongly in 2016 as in recent years.
Swiss franc – after the capAfter dramatic appreciation in early 2015 after the Swiss National Bank abandoned its exchange rate floor against the euro, the CHF has been trapped in a narrower range against the EUR, and steadily weakened against other major currencies since.
We believe the franc is set for another year of range-bound trading against the euro in 2016. On the one hand, the Swiss currency is unlikely to depre-ciate against the euro while the Euro-pean Central Bank is biased toward easing. On the other hand, while the Swiss economy has been relatively resilient in the face of currency strength, there have been signs of strain. SNB officials have hinted that they would seek to offset the impact of further ECB QE on the Swiss franc.
A EURCHF trading range of between 1.05 and 1.10 is likely for 2016, in our view.
The Japanese yen – modest further weaknessIn 2015, the JPY has traded in a very tight range against the USD, appreciat-ing overall by 3% on a trade-weighted basis through the year after sizable depreciation in prior years.
In 2016 we expect modest further weakness. Japanese monetary policy will remain conducive to keeping the yen weak, inflation has remained well below the government’s target, and it is doubtful that it will reach this 2% goal in 2016, either.
But the scope for further depreciation is limited by the extent of the yen’s slide over recent years. We estimate JPY purchasing power parity against the USD at 78, a significantly stronger level than today, and in the long run, as with the EUR, low rates of inflation should be favorable for JPY.
The other G10sThe Canadian dollar has suffered from the decline in the oil price, and is currently trading close to its weakest against the US dollar in more than a decade. We expect a more stable oil price in 2016, and Canada’s cur-rency is now undervalued against the USD.
Meanwhile, we expect the Norwegian krone to rebound significantly in 2016 as the economy recovers from the recent slowdown and the easing cycle approaches its end. Elsewhere, we believe the Swedish krona will remain range bound against the euro. The Riksbank is eager to avoid a harmful appreciation.
We have a negative outlook for the Australian and New Zealand dollars, given the slowdown in commodity demand from China, and the effect on key raw material and dairy prices. After 10% and 8% respective trade-weighted depreciations in 2015, valua-
Selected currency forecasts
Currency Spot 12m PPP Currency Spot 12m
EURUSD 1.07 1.10 1.25 USDCNY 6.37 6.80
EURCHF 1.08 1.10 1.24 USDTWD 32.8 34.0
USDCHF 1.01 1.00 0.99 USDINR 66.0 68.5
EURGBP 0.70 0.70 0.77 USDIDR 13732 15750
GBPUSD 1.52 1.58 1.62 USDRUB 65.3 65.0
USDJPY 123 124 78 USDTRY 2.88 3.20
AUDUSD 0.71 0.65 0.69 USDZAR 14.3 13.9
USDCAD 1.33 1.22 1.22 USDMXN 16.8 16.0
EURNOK 9.29 8.50 9.49 USDBRL 3.83 4.30
Source: UBS, as of November 17, 2015
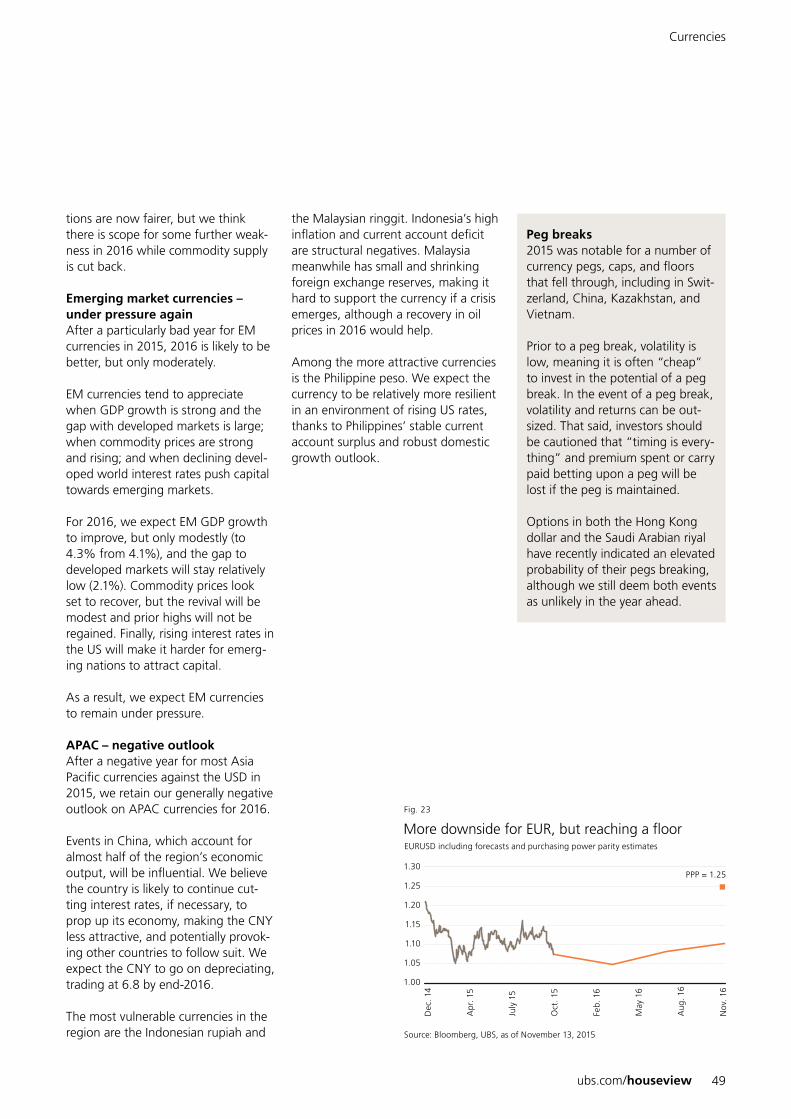
ubs.com/houseview 49
Currencies
tions are now fairer, but we think there is scope for some further weak-ness in 2016 while commodity supply is cut back.
Emerging market currencies – under pressure againAfter a particularly bad year for EM currencies in 2015, 2016 is likely to be better, but only moderately.
EM currencies tend to appreciate when GDP growth is strong and the gap with developed markets is large; when commodity prices are strong and rising; and when declining devel-oped world interest rates push capital towards emerging markets.
For 2016, we expect EM GDP growth to improve, but only modestly (to 4.3% from 4.1%), and the gap to developed markets will stay relatively low (2.1%). Commodity prices look set to recover, but the revival will be modest and prior highs will not be regained. Finally, rising interest rates in the US will make it harder for emerg-ing nations to attract capital.
As a result, we expect EM currencies to remain under pressure.
APAC – negative outlookAfter a negative year for most Asia Pacific currencies against the USD in 2015, we retain our generally negative outlook on APAC currencies for 2016.
Events in China, which account for almost half of the region’s economic output, will be influential. We believe the country is likely to continue cut-ting interest rates, if necessary, to prop up its economy, making the CNY less attractive, and potentially provok-ing other countries to follow suit. We expect the CNY to go on depreciating, trading at 6.8 by end-2016.
The most vulnerable currencies in the region are the Indonesian rupiah and
the Malaysian ringgit. Indonesia’s high inflation and current account deficit are structural negatives. Malaysia meanwhile has small and shrinking foreign exchange reserves, making it hard to support the currency if a crisis emerges, although a recovery in oil prices in 2016 would help.
Among the more attractive currencies is the Philippine peso. We expect the currency to be relatively more resilient in an environment of rising US rates, thanks to Philippines’ stable current account surplus and robust domestic growth outlook.
Peg breaks2015 was notable for a number of currency pegs, caps, and floors that fell through, including in Swit-zerland, China, Kazakhstan, and Vietnam.
Prior to a peg break, volatility is low, meaning it is often “cheap” to invest in the potential of a peg break. In the event of a peg break, volatility and returns can be out-sized. That said, investors should be cautioned that “timing is every-thing” and premium spent or carry paid betting upon a peg will be lost if the peg is maintained.
Options in both the Hong Kong dollar and the Saudi Arabian riyal have recently indicated an elevated probability of their pegs breaking, although we still deem both events as unlikely in the year ahead.
Source: Bloomberg, UBS, as of November 13, 2015
More downside for EUR, but reaching a floorEURUSD including forecasts and purchasing power parity estimates
1.20
1.10
1.25
1.15
1.30
1.00
1.05
Fig. 23
Dec
. 14
Apr
. 15
July
15
Oct
. 15
Feb.
16
May
16
Aug
. 16
Nov
. 16
PPP = 1.25
UBS House View – Year Ahead 201650
Commodities
Dominic Schnider, Head of CommoditiesWayne Gordon, commodities analystGiovanni Staunovo, commodities analyst
We expect commodity prices to stabilize in 2016, with an overall upward move in the high single digits. Crude oil will likely drive most of the improve-ment, although an ongoing economic deceleration in China should keep base metals weak. We expect the outlook for gold to improve next year as US real interest rates sink deeper into negative territory.
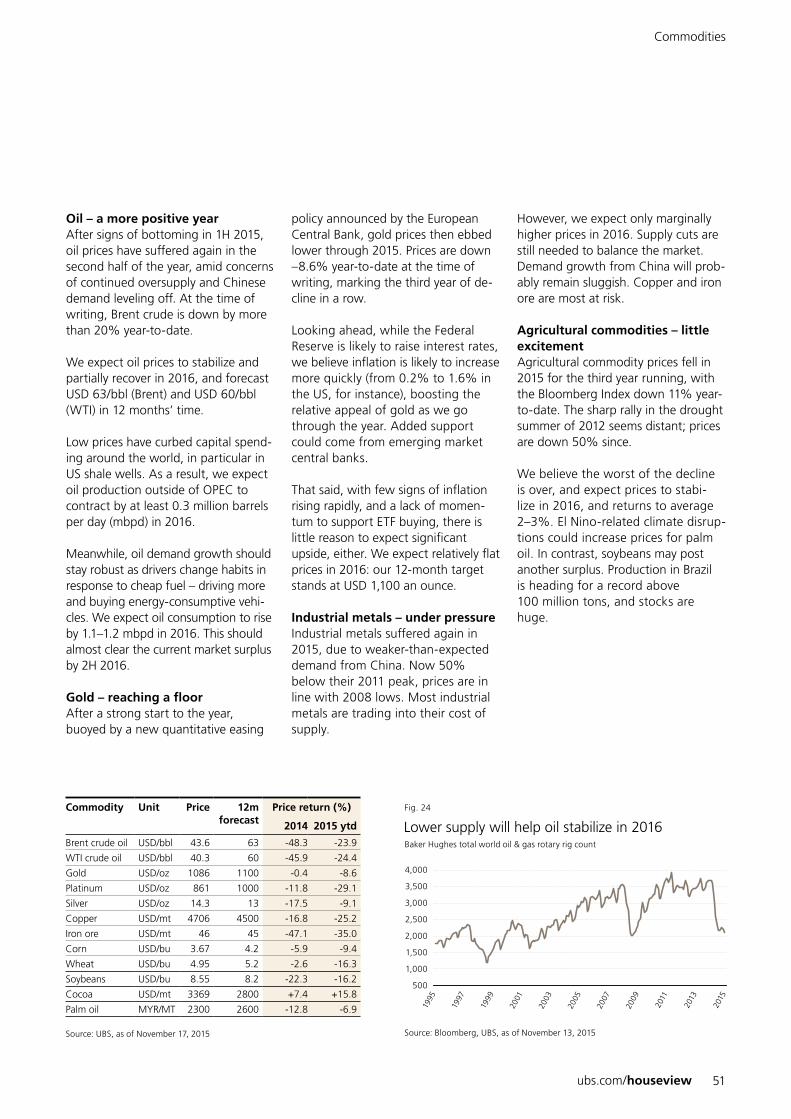
ubs.com/houseview 51
Oil – a more positive yearAfter signs of bottoming in 1H 2015, oil prices have suffered again in the second half of the year, amid concerns of continued oversupply and Chinese demand leveling off. At the time of writing, Brent crude is down by more than 20% year-to-date.
We expect oil prices to stabilize and partially recover in 2016, and forecast USD 63/bbl (Brent) and USD 60/bbl (WTI) in 12 months’ time.
Low prices have curbed capital spend-ing around the world, in particular in US shale wells. As a result, we expect oil production outside of OPEC to contract by at least 0.3 million barrels per day (mbpd) in 2016.
Meanwhile, oil demand growth should stay robust as drivers change habits in response to cheap fuel – driving more and buying energy-consumptive vehi-cles. We expect oil consumption to rise by 1.1–1.2 mbpd in 2016. This should almost clear the current market surplus by 2H 2016.
Gold – reaching a floorAfter a strong start to the year, buoyed by a new quantitative easing
policy announced by the European Central Bank, gold prices then ebbed lower through 2015. Prices are down –8.6% year-to-date at the time of writing, marking the third year of de-cline in a row.
Looking ahead, while the Federal Reserve is likely to raise interest rates, we believe inflation is likely to increase more quickly (from 0.2% to 1.6% in the US, for instance), boosting the relative appeal of gold as we go through the year. Added support could come from emerging market central banks.
That said, with few signs of inflation rising rapidly, and a lack of momen-tum to support ETF buying, there is little reason to expect significant upside, either. We expect relatively flat prices in 2016: our 12-month target stands at USD 1,100 an ounce.
Industrial metals – under pressureIndustrial metals suffered again in 2015, due to weaker-than-expected demand from China. Now 50% below their 2011 peak, prices are in line with 2008 lows. Most industrial metals are trading into their cost of supply.
However, we expect only marginally higher prices in 2016. Supply cuts are still needed to balance the market. Demand growth from China will prob-ably remain sluggish. Copper and iron ore are most at risk.
Agricultural commodities – little excitement Agricultural commodity prices fell in 2015 for the third year running, with the Bloomberg Index down 11% year-to-date. The sharp rally in the drought summer of 2012 seems distant; prices are down 50% since.
We believe the worst of the decline is over, and expect prices to stabi - lize in 2016, and returns to average 2–3%. El Nino-related climate disrup-tions could increase prices for palm oil. In contrast, soybeans may post another surplus. Production in Brazil is heading for a record above 100 million tons, and stocks are huge.
Commodities
Source: Bloomberg, UBS, as of November 13, 2015
Lower supply will help oil stabilize in 2016Baker Hughes total world oil & gas rotary rig count
2,500
1,500
3,000
2,000
4,000
3,500
500
1,000
Fig. 24
2009
2011
2013
2015
1997
1999
1995
2007
2003
2005
2001
Commodity Unit Price 12m forecast
Price return (%)
2014 2015 ytd
Brent crude oil USD/bbl 43.6 63 -48.3 -23.9
WTI crude oil USD/bbl 40.3 60 -45.9 -24.4
Gold USD/oz 1086 1100 -0.4 -8.6
Platinum USD/oz 861 1000 -11.8 -29.1
Silver USD/oz 14.3 13 -17.5 -9.1
Copper USD/mt 4706 4500 -16.8 -25.2
Iron ore USD/mt 46 45 -47.1 -35.0
Corn USD/bu 3.67 4.2 -5.9 -9.4
Wheat USD/bu 4.95 5.2 -2.6 -16.3
Soybeans USD/bu 8.55 8.2 -22.3 -16.2
Cocoa USD/mt 3369 2800 +7.4 +15.8
Palm oil MYR/MT 2300 2600 -12.8 -6.9
Source: UBS, as of November 17, 2015

UBS House View – Year Ahead 201652
Real Estate
Claudio Saputelli, Head of Global Real EstateMatthias Holzhey, Head of Swiss Real Estate Investments
Much has changed since the financial crisis, but on average, real estate prices are now higher than pre-crisis peaks. Some housing booms stand out. London and Hong Kong face the highest risk of correction. Zurich and Geneva seem only modestly over-valued, while New York looks fairly priced.
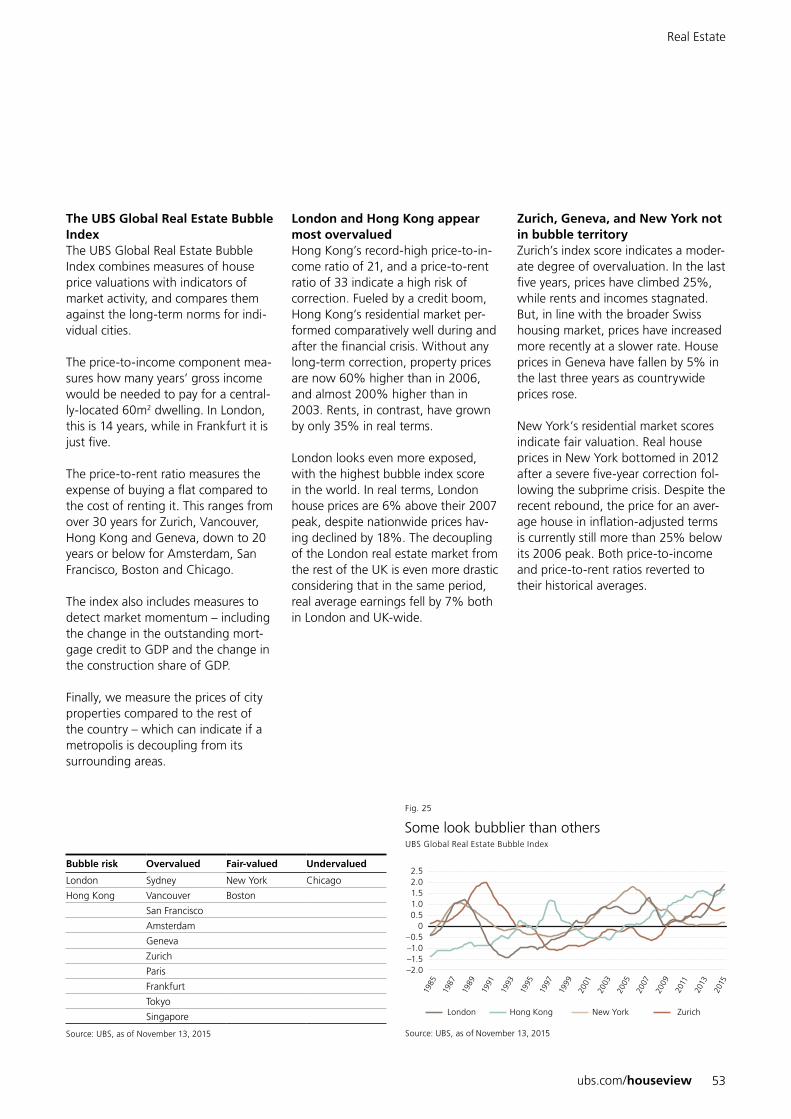
ubs.com/houseview 53
Real Estate
The UBS Global Real Estate Bubble Index The UBS Global Real Estate Bubble Index combines measures of house price valuations with indicators of market activity, and compares them against the long-term norms for indi-vidual cities.
The price-to-income component mea-sures how many years’ gross income would be needed to pay for a central-ly-located 60m2 dwelling. In London, this is 14 years, while in Frankfurt it is just five.
The price-to-rent ratio measures the expense of buying a flat compared to the cost of renting it. This ranges from over 30 years for Zurich, Vancouver, Hong Kong and Geneva, down to 20 years or below for Amsterdam, San Francisco, Boston and Chicago.
The index also includes measures to detect market momentum – including the change in the outstanding mort-gage credit to GDP and the change in the construction share of GDP.
Finally, we measure the prices of city properties compared to the rest of the country – which can indicate if a metropolis is decoupling from its surrounding areas.
London and Hong Kong appear most overvaluedHong Kong’s record-high price-to-in-come ratio of 21, and a price-to-rent ratio of 33 indicate a high risk of correction. Fueled by a credit boom, Hong Kong’s residential market per-formed comparatively well during and after the financial crisis. Without any long-term correction, property prices are now 60% higher than in 2006, and almost 200% higher than in 2003. Rents, in contrast, have grown by only 35% in real terms.
London looks even more exposed, with the highest bubble index score in the world. In real terms, London house prices are 6% above their 2007 peak, despite nationwide prices hav-ing declined by 18%. The decoupling of the London real estate market from the rest of the UK is even more drastic considering that in the same period, real average earnings fell by 7% both in London and UK-wide.
Zurich, Geneva, and New York not in bubble territoryZurich’s index score indicates a moder-ate degree of overvaluation. In the last five years, prices have climbed 25%, while rents and incomes stagnated. But, in line with the broader Swiss housing market, prices have increased more recently at a slower rate. House prices in Geneva have fallen by 5% in the last three years as countrywide prices rose.
New York’s residential market scores indicate fair valuation. Real house prices in New York bottomed in 2012 after a severe five-year correction fol-lowing the subprime crisis. Despite the recent rebound, the price for an aver-age house in inflation-adjusted terms is currently still more than 25% below its 2006 peak. Both price-to-income and price-to-rent ratios reverted to their historical averages.
Source: UBS, as of November 13, 2015
Some look bubblier than others
1.5
–0.5
2.0
0.5
2.5
–2.0–1.5
0
1.0
–1.0
Fig. 25
UBS Global Real Estate Bubble Index
2005
2007
2009
2011
2013
2015
1989
1993
1985
1991
1995
1987
2003
1999
2001
1997
London Hong Kong New York Zurich
Bubble risk Overvalued Fair-valued Undervalued
London Sydney New York Chicago
Hong Kong Vancouver Boston
San Francisco
Amsterdam
Geneva
Zurich
Paris
Frankfurt
Tokyo
Singapore
Source: UBS, as of November 13, 2015
Disclaimer
UBS Chief Investment Office WM’s investment views are prepared and published by Wealth Management and Retail & Corporate or Wealth Management Americas, Business Divisions of UBS AG (regulated by FINMA in Switzerland), its subsidiary or affiliate („UBS“). In certain countries UBS AG is referred to as UBS SA. This material is for your information only and is not intended as an offer, or a solicitation of an offer, to buy or sell any investment or other specific product. Certain services and products are subject to legal restrictions and cannot be offered worldwide on an unrestricted basis and/or may not be eligible for sale to all investors. All information and opinions expressed in this material were obtained from sources believed to be reliable and in good faith, but no representation or warranty, express or implied, is made as to its accuracy or completeness (other than disclosures relating to UBS). All information and opinions as well as any prices indicated are current as of the date of this report, and are subject to change without notice. The market prices provided in performance charts and tables are closing prices on the respective principal stock exchange. The analysis contained herein is based on numerous assumptions. Different assumptions could result in materially different results. Opinions expressed herein may differ or be contrary to those expressed by other business areas or divisions of UBS as a result of using different assumptions and/or criteria. UBS and any of its directors or employees may be entitled at any time to hold long or short positions in investment instruments referred to herein, carry out transactions involving relevant investment instruments in the capacity of principal or agent, or provide any other services or have officers, who serve as directors, either to/for the issuer, the investment instrument itself or to/for any company commercially or financially affiliated to such issuers. At any time, investment decisions (including whether to buy, sell or hold securities) made by UBS and its employees may differ from or be contrary to the opinions expressed in UBS research publications. Some investments may not be readily realizable since the market in the securities is illiquid and therefore valuing the investment and identifying the risk to which you are exposed may be difficult to quantify. UBS relies on information barriers to control the flow of information contained in one or more areas within UBS, into other areas, units, divisions or affiliates of UBS. Futures and options trading is considered risky. Past performance of an investment is no guarantee for its future performance. Additional information will be made available upon request. Some investments may be subject to sudden and large falls in value and on realization you may receive back less than you invested or may be required to pay more. Changes in foreign exchange rates may have an adverse effect on the price, value or income of an investment. The analyst(s) responsible for the preparation of this report may interact with trading desk personnel, sales personnel and other constituencies for the purpose of gathering, synthesizing and interpreting market information. Tax treatment depends on the individual circumstances and may be subject to change in the future. UBS does not provide legal or tax advice and makes no representations as to the tax treatment of assets or the investment returns thereon both in general or with reference to specific client’s circumstances and needs. We are of necessity unable to take into account the particular investment objectives, financial situation and needs of our individual clients and we would recommend that you take financial and/or tax advice as to the implications (including tax) of investing in any of the products mentioned herein. This material may not be reproduced or copies circulated without prior authority of UBS. UBS expressly prohibits the distribution and transfer of this material to third parties for any reason. UBS accepts no liability whatsoever for any claims or lawsuits from any third parties arising from the use or distribution of this material. This report is for distribution only under such circumstances as may be permitted by applicable law. In developing the Chief Investment Office (CIO) economic forecasts, CIO economists worked in collaboration with economists employed by UBS Investment Research. Forecasts and estimates are current only as of the date of this publication and may change without notice. For information on the ways in which UBS CIO WM manages conflicts and maintains independence of its investment views and publication offering, and research and rating methodologies, please visit www.ubs.com/research. Additional information on the relevant authors of this publication and other CIO publication(s) referenced in this report; and copies of any past reports on this topic; are available upon request from your client advisor.
External Asset Managers / External Financial Consultants: In case this research or publication is provided to an External Asset Manager or an External Financial Consultant, UBS ex-pressly prohibits that it is redistributed by the External Asset Manager or the External Financial Consultant and is made available to their clients and/or third parties. Australia: 1) Clients of UBS Wealth Management Australia Ltd: This notice is issued by UBS Wealth Management Australia Ltd ABN 50 005 311 937 (Holder of Australian Financial Services Licence No. 231127): This Docu-ment is general in nature and does not constitute personal financial product advice. The Document does not take into account any person’s objectives, financial situation or needs, and a re-cipient should obtain advice from an independent financial adviser and consider any relevant offer or disclosure document prior to making any investment decisions. 2) Clients of UBS AG: This notice is issued by UBS AG ABN 47 088 129 613 (Holder of Australian Financial Services Licence No 231087): This Document is issued and distributed by UBS AG. This is the case despite anything to the contrary in the Document. The Document is intended for use only by “Wholesale Clients” as defined in section 761G (“Wholesale Clients”) of the Corporations Act 2001 (Cth) (“Corpo-rations Act”). In no circumstances may the Document be made available by UBS AG to a “Retail Client” as defined in section 761G of the Corporations Act. UBS AG’s research services are only available to Wholesale Clients. The Document is general information only and does not take into account any person’s investment objectives, financial and taxation situation or particular needs. Bahamas: This publication is distributed to private clients of UBS (Bahamas) Ltd and is not intended for distribution to persons designated as a Bahamian citizen or resident under the Bahamas Exchange Control Regulations. Bahrain: UBS AG is a Swiss bank not licensed, supervised or regulated in Bahrain by the Central Bank of Bahrain and does not undertake banking or investment business activities in Bahrain. Therefore, Clients have no protection under local banking and investment services laws and regulations. Brazil: Prepared by UBS Brasil Administradora de Valores Mobiliários Ltda, entity regulated by Comissão de Valores Mobiliários („CVM“) Canada: In Canada, this publication is distributed to clients of UBS Wealth Management Canada by UBS Invest-ment Management Canada Inc.. Dubai: Research is issued by UBS AG Dubai Branch within the DIFC, is intended for professional clients only and is not for onward distribution within the United Arab Emirates. France: This publication is distributed by UBS (France) S.A., French „société anonyme“ with share capital of € 125.726.944, 69, boulevard Haussmann F-75008 Paris, R.C.S. Paris B 421 255 670, to its clients and prospects. UBS (France) S.A. is a provider of investment services duly authorized according to the terms of the „Code Monétaire et Financier“, regulated by French banking and financial authorities as the „Autorité de Contrôle Prudentiel et de Résolution.“ Germany: The issuer under German Law is UBS Deutschland AG, Bockenheimer Landstrasse 2-4, 60306 Frankfurt am Main. UBS Deutschland AG is authorized and regulated by the „Bundesanstalt für Finanzdienstleistungsaufsicht“. Hong Kong: This publication is distrib-uted to clients of UBS AG Hong Kong Branch by UBS AG Hong Kong Branch, a licensed bank under the Hong Kong Banking Ordinance and a registered institution under the Securities and Futures Ordinance. India: Distributed by UBS Securities India Private Ltd. 2/F, 2 North Avenue, Maker Maxity, Bandra Kurla Complex, Bandra (East), Mumbai (India) 400051. Phone: +912261556000. SEBI Registration Numbers: NSE (Capital Market Segment): INB230951431, NSE (F&O Segment) INF230951431, BSE (Capital Market Segment) INB010951437. Indonesia: This research or publication is not intended and not prepared for purposes of public offering of securities under the Indonesian Capital Market Law and its implementing regulations. Securities mentioned in this material have not been, and will not be, registered under the Indonesian Capital Market Law and Regulations. Israel: UBS AG is registered as a Foreign Dealer in cooperation with UBS Wealth Management Israel Ltd, a wholly owned UBS subsidiary. UBS Wealth Management Israel Ltd is a licensed Portfolio Manager which engages also in Investment Marketing and is regulated by the Israel Securities Authority. This publication shall not replace any investment advice and/or investment marketing provided by a relevant licensee which is adjusted to your personal needs. Italy: This publication is distributed to the clients of UBS (Italia) S.p.A., via del vecchio politecnico 3, Milano, an Italian bank duly authorized by Bank of Italy to the provision of financial services and supervised by „Consob“ and Bank of Italy. UBS Italia has not participated in the production of the publication and of the research on investments and financial analysis herein contained. Jersey: UBS AG, Jersey Branch, is regulated and authorized by the Jersey Financial Services Commission for the conduct of banking, funds and investment business. Luxem-bourg: This publication is not intended to constitute a public offer under Luxembourg law, but might be made available for information purposes to clients of UBS (Luxembourg) S.A., 33A avenue J.F. Kennedy, L-1855 Luxembourg, R.C.S. Luxembourg B 11142, a regulated bank under the supervision of the „Commission de Surveillance du Secteur Financier“ (CSSF), to which this publication has not been submitted for approval. Mexico: This document has been distributed by UBS Asesores México, S.A. de C.V., a company which is not part of UBS Grupo Financiero, S.A. de C.V. or of any other Mexican financial group and whose obligations are not guaranteed by any third party. UBS Asesores México, S.A. de C.V. does not guarantee any yield whatsoever. Netherlands: This publication is not intended to constitute a public offering or a comparable solicitation under Dutch law, but might be made available for information purposes to clients of UBS Bank (Netherlands) B.V., a regulated bank under the supervision of “De Nederlansche Bank“ (DNB) and „Autoriteit Financiële Markten“ (AFM), to which this publication has not been submitted for approval. New Zealand: This notice is distributed to clients of UBS Wealth Management Australia Limited ABN 50 005 311 937 (Holder of Australian Financial Services Licence No. 231127), Chifley Tower, 2 Chifley Square, Sydney, New South Wales, NSW 2000, by UBS Wealth Management Australia Ltd. You are being provided with this UBS publication or material because you have indicated to UBS that you are a client certified as a wholesale investor and/or an eligible investor („Certified Client“) located in New Zealand. This publication or material is not intended for clients who are not Certified Clients („Non-Certified Clients“), and if you are a Non-Certified Client you must not rely on this publication or material. If despite this warning you nevertheless rely on this publication or material, you hereby (i) acknowledge that you may not rely on the content of this publication or material and that any recommendations or opinions in this publication or material are not made or provided to you, and (ii) to the maximum extent permitted by law (a) indemnify UBS and its associates or related entities (and their respective directors, officers, agents and advisers (each a „Relevant Person“) for any loss, damage, liability or claim any of them may incur or suffer as a result of, or in connection with, your unauthorised reliance on this publication or material and (b) waive any rights or remedies you may have against any Relevant Person for (or in respect of) any loss, damage, liability or claim you may incur or suffer as a result of, or in connection with, your unauthorised reliance on this publication or material. Saudi Arabia: This publication has been approved by UBS Saudi Arabia (a subsidiary of UBS AG), a Saudi Arabian closed joint stock company incorporated in the Kingdom of Saudi Arabia under commercial register number 1010257812 having its registered office at Tatweer Tow-ers, P.O. Box 75724, Riyadh 11588, Kingdom of Saudi Arabia. UBS Saudi Arabia is authorized and regulated by the Capital Market Authority of Saudi Arabia. Singapore: Please contact UBS AG Singapore branch, an exempt financial adviser under the Singapore Financial Advisers Act (Cap. 110) and a wholesale bank licensed under the Singapore Banking Act (Cap. 19) regulated by the Monetary Authority of Singapore, in respect of any matters arising from, or in connection with, the analysis or report. Spain: This publication is distributed to clients of UBS Bank, S.A. by UBS Bank, S.A., a bank registered with the Bank of Spain. Taiwan: This material is provided in accordance with laws of Taiwan, in agreement with or at the request of clients. UAE: This research report is not intended to constitute an offer, sale or delivery of shares or other securities under the laws of the United Arab Emirates (UAE). The contents of this report have not been and will not be approved by any authority in the United Arab Emirates including the UAE Central Bank or Dubai Financial Authorities, the Emirates Securities and Commodities Authority, the Dubai Fi-nancial Market, the Abu Dhabi Securities market or any other UAE exchange. UK: Approved by UBS AG, authorised and regulated by the Financial Market Supervisory Authority in Switzerland. In the United Kingdom, UBS AG is authorised by the Prudential Regulation Authority and subject to regulation by the Financial Conduct Authority and limited regulation by the Prudential Regulation Authority. Details about the extent of our regulation by the Prudential Regulation Authority are available from us on request. A member of the London Stock Exchange. This publica-tion is distributed to private clients of UBS London in the UK. Where products or services are provided from outside the UK, they will not be covered by the UK regulatory regime or the Finan-cial Services Compensation Scheme. USA: This document is not intended for distribution into the US and / or to US persons. UBS Securities LLC is a subsidiary of UBS AG and an affiliate of UBS Financial Services Inc., UBS Financial Services Inc. is a subsidiary of UBS AG.
Version 05/2015.© UBS 2015. The key symbol and UBS are among the registered and unregistered trademarks of UBS. All rights reserved.