under-track cfd-based shape optimization for a low … · under-track cfd-based shape optimization...
TRANSCRIPT

Under-Track CFD-Based Shape Optimization for a
Low-Boom Demonstrator Concept
Mathias Wintzer⇤
Analytical Mechanics Associates, Inc., Hampton, VA 23666
Irian Ordaz†
NASA Langley Research Center, Hampton, VA 23681
James W. Fenbert‡
Analytical Mechanics Associates, Inc., Hampton, VA 23666
The detailed outer mold line shaping of a Mach 1.6, demonstrator-sized low-boom con-
cept is presented. Cruise trim is incorporated a priori as part of the shaping objective,
using an equivalent-area-based approach. Design work is performed using a gradient-driven
optimization framework that incorporates a three-dimensional, nonlinear flow solver, a
parametric geometry modeler, and sensitivities derived using the adjoint method. The
shaping e↵ort is focused on reducing the under-track sonic boom level using an inverse-
design approach, while simultaneously satisfying the trim requirement. Conceptual-level
geometric constraints are incorporated in the optimization process, including the internal
layout of fuel tanks, landing gear, engine, and crew station. Details of the model param-
eterization and design process are documented for both flow-through and powered states,
and the performance of these optimized vehicles presented in terms of inviscid L/D, trim
state, pressures in the nearfield and at the ground, and predicted sonic boom loudness.
I. Introduction
The field of sonic boom minimization has advanced steadily since the pioneering work of Seebas, Georgeand Darden.1,2, 3 The application of potential theory methods to the conceptual design of low-boom
aircraft has been demonstrated by Farhat et al.,4 while similar work additionally considered pressure signalssampled in the near-field of the CFD domain as part of an integrated conceptual design process.5 Ap-proaches using gradient-based optimization with non-linear methods were described by Alonso et al.,6 andthe subsequent application of these methods to the development of low-boom supersonic business jets wasdemonstrated by Choi et al.7 More recently, the application of adjoint-based adaptive mesh refinement forincreased simulation accuracy has been presented for both tetrahedral8,9 as well as Cartesian meshes,10 withthe latter being validated against flight test data.11 In the context of low-boom shape optimization, the use ofadjoint-derived sensitivities has been demonstrated using both continuous12 and discrete13,14 adjoint meth-ods. The e↵ectiveness of these approaches has encouraged their application to a wide range of conceptualdesign studies.15,16,17,18 Propulsion integration has also seen dedicated, extensive study, with methodologiespresented for high performance inlet19,20 and nozzle21,22 design. The synthesis of these recent advances isa topic of active research, and seeks to enable the development of vehicles that, at least conceptually and inthe CFD domain, achieve the low sonic boom levels that may enable lifting of the ban on overland supersonicflight.
In the experimental domain, the shaped sonic boom demonstrator23 (SSBD) was the first to apply manyof these technologies to a flight test demonstrator, where the theoretical basis relating vehicle shape to thesonic boom signature at the ground was proven in flight test. Preparation for a follow-on experiment is
⇤Engineer, Analytical Mechanics Associates, Inc., 21 Enterprise Parkway, Suite 300. Senior Member AIAA.†Aerospace Engineer, Aeronautics Systems Analysis Branch, Mail Stop 442. Member AIAA.‡Engineer, Analytical Mechanics Associates, Inc., 21 Enterprise Parkway, Suite 300.
1 of 24
American Institute of Aeronautics and Astronautics
https://ntrs.nasa.gov/search.jsp?R=20160006034 2018-06-09T02:09:44+00:00Z
presently underway that aims to determine public acceptance of a fully shaped low sonic boom signatureusing a flight test article. To that end, current e↵orts are focused on the design of a small, lightweight vehicleby NASA and industry partners.
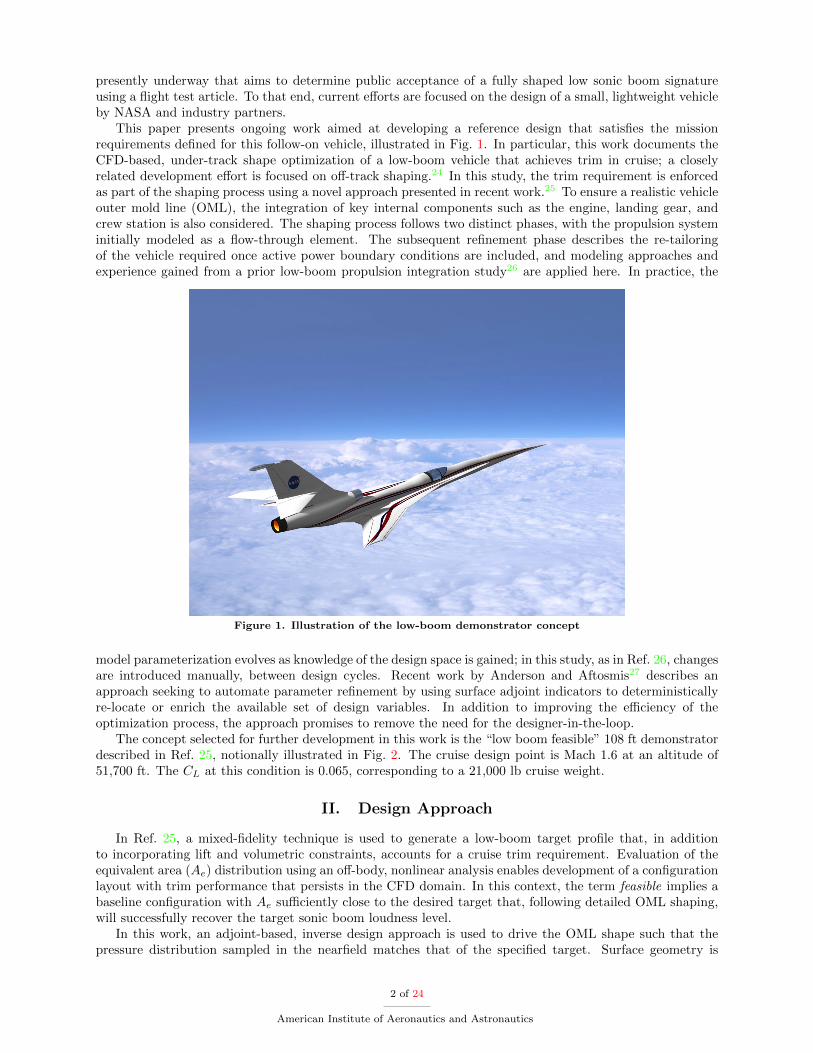
This paper presents ongoing work aimed at developing a reference design that satisfies the missionrequirements defined for this follow-on vehicle, illustrated in Fig. 1. In particular, this work documents theCFD-based, under-track shape optimization of a low-boom vehicle that achieves trim in cruise; a closelyrelated development e↵ort is focused on o↵-track shaping.24 In this study, the trim requirement is enforcedas part of the shaping process using a novel approach presented in recent work.25 To ensure a realistic vehicleouter mold line (OML), the integration of key internal components such as the engine, landing gear, andcrew station is also considered. The shaping process follows two distinct phases, with the propulsion systeminitially modeled as a flow-through element. The subsequent refinement phase describes the re-tailoringof the vehicle required once active power boundary conditions are included, and modeling approaches andexperience gained from a prior low-boom propulsion integration study26 are applied here. In practice, the
Figure 1. Illustration of the low-boom demonstrator concept
model parameterization evolves as knowledge of the design space is gained; in this study, as in Ref. 26, changesare introduced manually, between design cycles. Recent work by Anderson and Aftosmis27 describes anapproach seeking to automate parameter refinement by using surface adjoint indicators to deterministicallyre-locate or enrich the available set of design variables. In addition to improving the e�ciency of theoptimization process, the approach promises to remove the need for the designer-in-the-loop.
The concept selected for further development in this work is the “low boom feasible” 108 ft demonstratordescribed in Ref. 25, notionally illustrated in Fig. 2. The cruise design point is Mach 1.6 at an altitude of51,700 ft. The CL at this condition is 0.065, corresponding to a 21,000 lb cruise weight.
II. Design Approach
In Ref. 25, a mixed-fidelity technique is used to generate a low-boom target profile that, in additionto incorporating lift and volumetric constraints, accounts for a cruise trim requirement. Evaluation of theequivalent area (Ae) distribution using an o↵-body, nonlinear analysis enables development of a configurationlayout with trim performance that persists in the CFD domain. In this context, the term feasible implies abaseline configuration with Ae su�ciently close to the desired target that, following detailed OML shaping,will successfully recover the target sonic boom loudness level.
In this work, an adjoint-based, inverse design approach is used to drive the OML shape such that thepressure distribution sampled in the nearfield matches that of the specified target. Surface geometry is
2 of 24
American Institute of Aeronautics and Astronautics
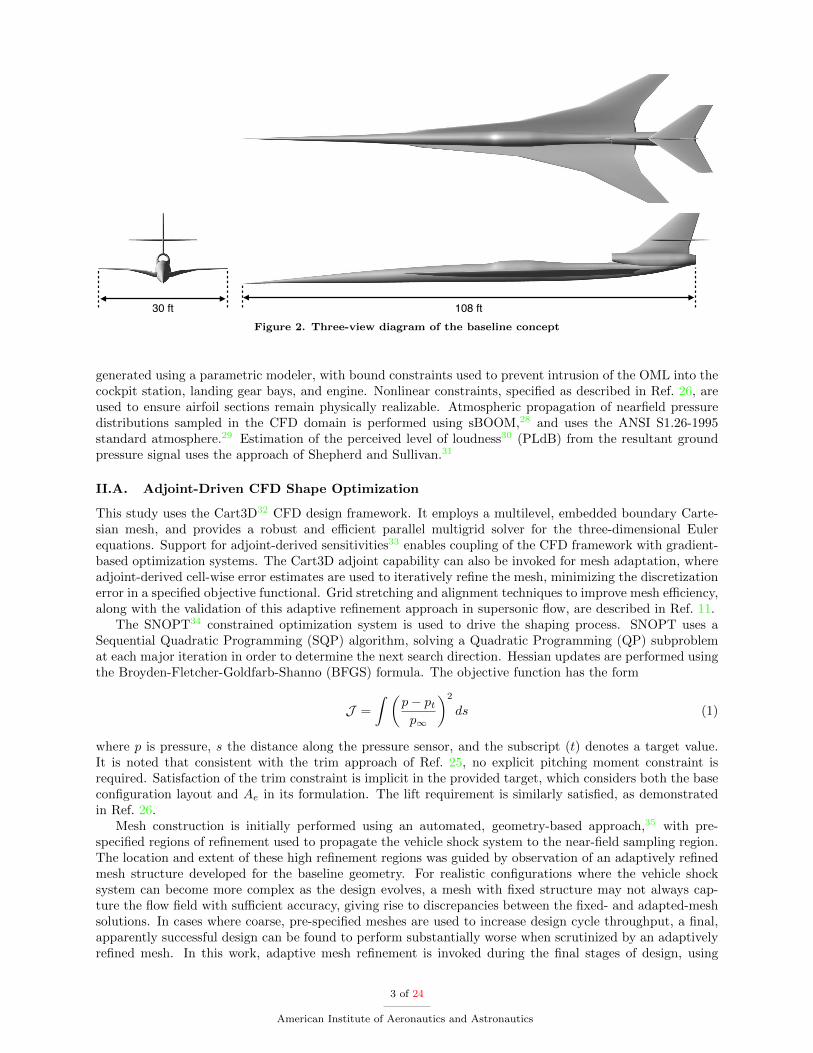
108 ft30 ftFigure 2. Three-view diagram of the baseline concept
generated using a parametric modeler, with bound constraints used to prevent intrusion of the OML into thecockpit station, landing gear bays, and engine. Nonlinear constraints, specified as described in Ref. 26, areused to ensure airfoil sections remain physically realizable. Atmospheric propagation of nearfield pressuredistributions sampled in the CFD domain is performed using sBOOM,28 and uses the ANSI S1.26-1995standard atmosphere.29 Estimation of the perceived level of loudness30 (PLdB) from the resultant groundpressure signal uses the approach of Shepherd and Sullivan.31
II.A. Adjoint-Driven CFD Shape Optimization
This study uses the Cart3D32 CFD design framework. It employs a multilevel, embedded boundary Carte-sian mesh, and provides a robust and e�cient parallel multigrid solver for the three-dimensional Eulerequations. Support for adjoint-derived sensitivities33 enables coupling of the CFD framework with gradient-based optimization systems. The Cart3D adjoint capability can also be invoked for mesh adaptation, whereadjoint-derived cell-wise error estimates are used to iteratively refine the mesh, minimizing the discretizationerror in a specified objective functional. Grid stretching and alignment techniques to improve mesh e�ciency,along with the validation of this adaptive refinement approach in supersonic flow, are described in Ref. 11.
The SNOPT34 constrained optimization system is used to drive the shaping process. SNOPT uses aSequential Quadratic Programming (SQP) algorithm, solving a Quadratic Programming (QP) subproblemat each major iteration in order to determine the next search direction. Hessian updates are performed usingthe Broyden-Fletcher-Goldfarb-Shanno (BFGS) formula. The objective function has the form
J =
Z ✓p� pt
p1
◆2
ds (1)
where p is pressure, s the distance along the pressure sensor, and the subscript (t) denotes a target value.It is noted that consistent with the trim approach of Ref. 25, no explicit pitching moment constraint isrequired. Satisfaction of the trim constraint is implicit in the provided target, which considers both the baseconfiguration layout and Ae in its formulation. The lift requirement is similarly satisfied, as demonstratedin Ref. 26.
Mesh construction is initially performed using an automated, geometry-based approach,35 with pre-specified regions of refinement used to propagate the vehicle shock system to the near-field sampling region.The location and extent of these high refinement regions was guided by observation of an adaptively refinedmesh structure developed for the baseline geometry. For realistic configurations where the vehicle shocksystem can become more complex as the design evolves, a mesh with fixed structure may not always cap-ture the flow field with su�cient accuracy, giving rise to discrepancies between the fixed- and adapted-meshsolutions. In cases where coarse, pre-specified meshes are used to increase design cycle throughput, a final,apparently successful design can be found to perform substantially worse when scrutinized by an adaptivelyrefined mesh. In this work, adaptive mesh refinement is invoked during the final stages of design, using
3 of 24
American Institute of Aeronautics and Astronautics
an approach demonstrated by Nemec and Aftosmis.36 While potentially resource-intensive, by tailoring thevolume grid to each instance of the geometry, flow features are more accurately captured, discretization errorlevels are consistent from grid to grid, and the final design maintains its performance under high-resolutionanalysis.
II.B. Geometry Modeling
The Jaguar parametric geometry modeler is used for this study, and is described in detail in Ref. 18. Itprovides su�cient flexibility to model full aircraft configurations, and o↵ers native computation of surfacesensitivities used during gradient-based shape optimization. Sensitivities associated with geometric featuresare also computed, allowing for the imposition of constraints on properties such as area, volume, and thicknessin a way that can be e�ciently handled by a gradient-based optimizer. As implemented, the modeler retainsmuch of the flexibility a↵orded by CAD-based geometry generation systems while o↵ering significant timesavings, especially as the number of design parameters is increased.
II.C. Model Parameterization
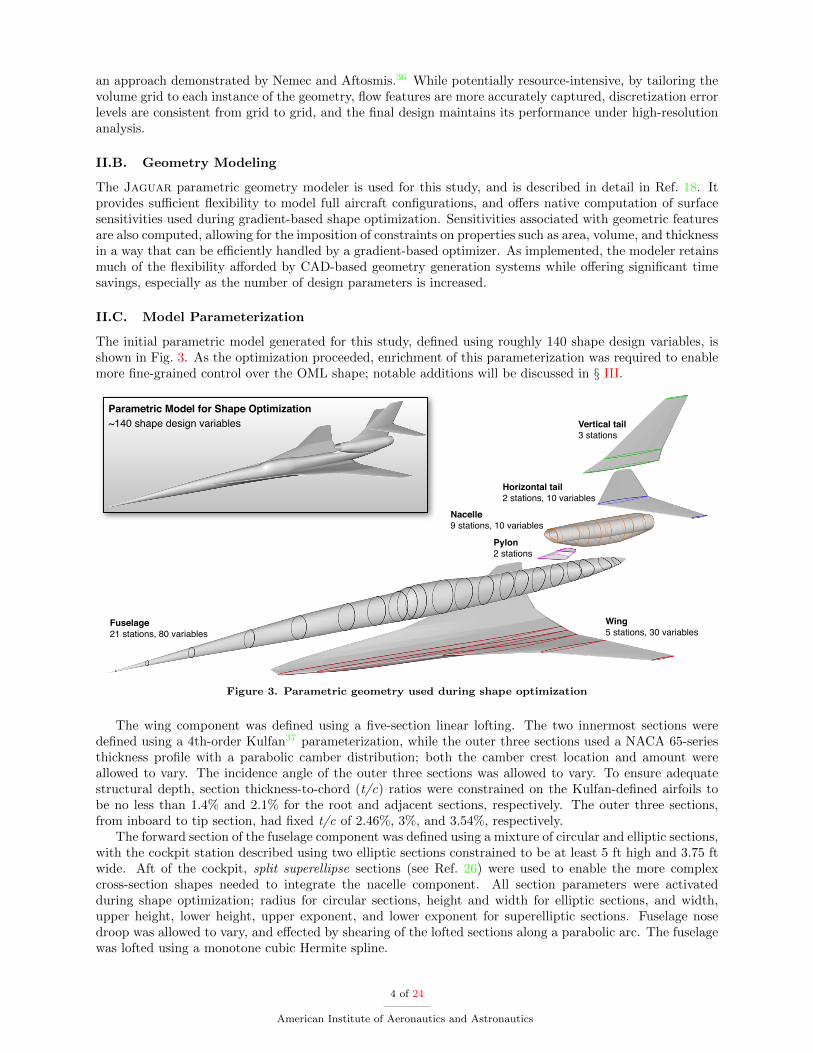
The initial parametric model generated for this study, defined using roughly 140 shape design variables, isshown in Fig. 3. As the optimization proceeded, enrichment of this parameterization was required to enablemore fine-grained control over the OML shape; notable additions will be discussed in § III.
Fuselage21 stations, 80 variables
Wing5 stations, 30 variables
Pylon2 stations
Nacelle9 stations, 10 variables
Horizontal tail2 stations, 10 variables
Vertical tail3 stations
Parametric Model for Shape Optimization~140 shape design variables
Figure 3. Parametric geometry used during shape optimization
The wing component was defined using a five-section linear lofting. The two innermost sections weredefined using a 4th-order Kulfan37 parameterization, while the outer three sections used a NACA 65-seriesthickness profile with a parabolic camber distribution; both the camber crest location and amount wereallowed to vary. The incidence angle of the outer three sections was allowed to vary. To ensure adequatestructural depth, section thickness-to-chord (t/c) ratios were constrained on the Kulfan-defined airfoils tobe no less than 1.4% and 2.1% for the root and adjacent sections, respectively. The outer three sections,from inboard to tip section, had fixed t/c of 2.46%, 3%, and 3.54%, respectively.
The forward section of the fuselage component was defined using a mixture of circular and elliptic sections,with the cockpit station described using two elliptic sections constrained to be at least 5 ft high and 3.75 ftwide. Aft of the cockpit, split superellipse sections (see Ref. 26) were used to enable the more complexcross-section shapes needed to integrate the nacelle component. All section parameters were activatedduring shape optimization; radius for circular sections, height and width for elliptic sections, and width,upper height, lower height, upper exponent, and lower exponent for superelliptic sections. Fuselage nosedroop was allowed to vary, and e↵ected by shearing of the lofted sections along a parabolic arc. The fuselagewas lofted using a monotone cubic Hermite spline.
4 of 24
American Institute of Aeronautics and Astronautics
The outer surface of the nacelle component was defined using split superelliptic sections up to the nozzleregion, which was defined using circular sections. Along with the inlet face, the nozzle section parameterswere specified by the engine model at the cruise power state and held fixed. Having to accommodate theinlet duct and propulsion system, the nacelle OML shape was heavily constrained; typically, only sectionwidths were allowed to vary. The internal flow-through duct was defined with superelliptic sections up tothe nominal fan face location, after which circular sections were specified. Duct geometry was held fixed.
The horizontal tail used an identical section parameterization as for the outer wing panel, with a 4%thick root and 5% thick tip section. The tail was treated as full-flying, and its incidence allowed to vary.The tip section incidence was also allowed to vary independently.
The diverter and vertical tail geometry were fixed throughout the optimization. The vertical tail wasconstructed using biconvex sections that were 4% thick at the root, and 6% thick at the tip. The diverterpresented a simple wedge profile to the flow.
II.D. Geometric Constraints due to Internal Systems
Figure 4. Crew station model
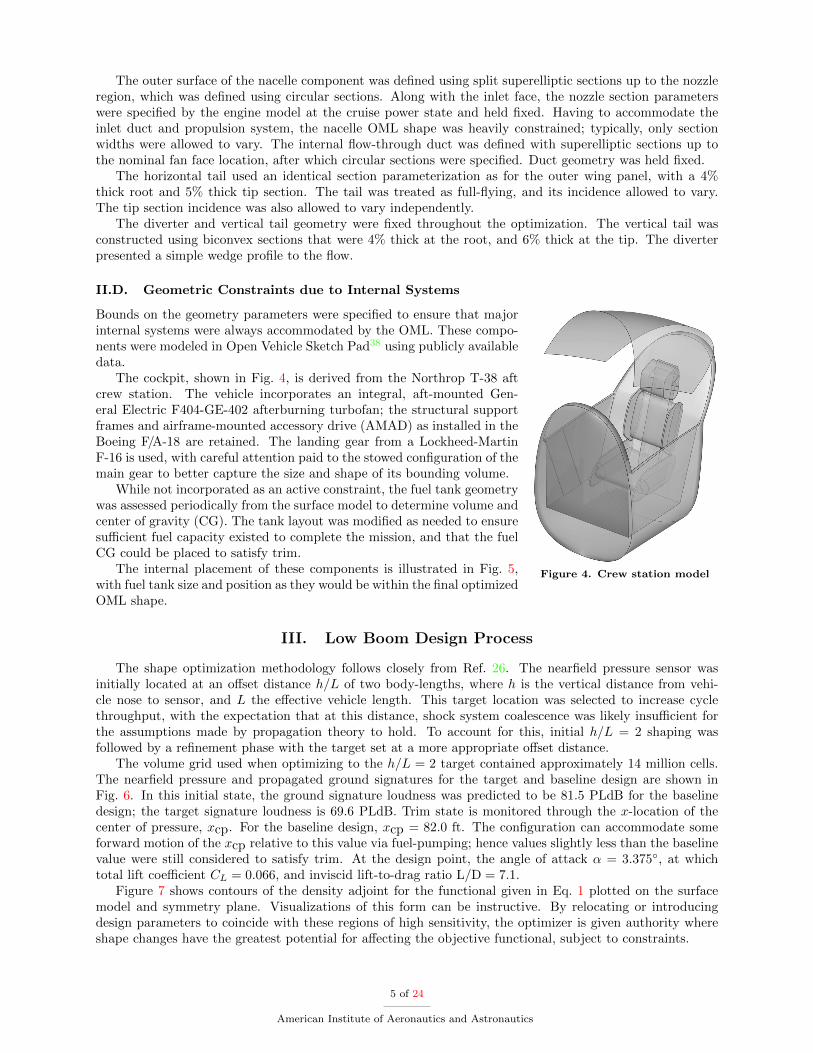
Bounds on the geometry parameters were specified to ensure that majorinternal systems were always accommodated by the OML. These compo-nents were modeled in Open Vehicle Sketch Pad38 using publicly availabledata.
The cockpit, shown in Fig. 4, is derived from the Northrop T-38 aftcrew station. The vehicle incorporates an integral, aft-mounted Gen-eral Electric F404-GE-402 afterburning turbofan; the structural supportframes and airframe-mounted accessory drive (AMAD) as installed in theBoeing F/A-18 are retained. The landing gear from a Lockheed-MartinF-16 is used, with careful attention paid to the stowed configuration of themain gear to better capture the size and shape of its bounding volume.
While not incorporated as an active constraint, the fuel tank geometrywas assessed periodically from the surface model to determine volume andcenter of gravity (CG). The tank layout was modified as needed to ensuresu�cient fuel capacity existed to complete the mission, and that the fuelCG could be placed to satisfy trim.
The internal placement of these components is illustrated in Fig. 5,with fuel tank size and position as they would be within the final optimizedOML shape.
III. Low Boom Design Process
The shape optimization methodology follows closely from Ref. 26. The nearfield pressure sensor wasinitially located at an o↵set distance h/L of two body-lengths, where h is the vertical distance from vehi-cle nose to sensor, and L the e↵ective vehicle length. This target location was selected to increase cyclethroughput, with the expectation that at this distance, shock system coalescence was likely insu�cient forthe assumptions made by propagation theory to hold. To account for this, initial h/L = 2 shaping wasfollowed by a refinement phase with the target set at a more appropriate o↵set distance.
The volume grid used when optimizing to the h/L = 2 target contained approximately 14 million cells.The nearfield pressure and propagated ground signatures for the target and baseline design are shown inFig. 6. In this initial state, the ground signature loudness was predicted to be 81.5 PLdB for the baselinedesign; the target signature loudness is 69.6 PLdB. Trim state is monitored through the x-location of thecenter of pressure, xcp. For the baseline design, xcp = 82.0 ft. The configuration can accommodate someforward motion of the xcp relative to this value via fuel-pumping; hence values slightly less than the baselinevalue were still considered to satisfy trim. At the design point, the angle of attack ↵ = 3.375�, at whichtotal lift coe�cient CL = 0.066, and inviscid lift-to-drag ratio L/D = 7.1.
Figure 7 shows contours of the density adjoint for the functional given in Eq. 1 plotted on the surfacemodel and symmetry plane. Visualizations of this form can be instructive. By relocating or introducingdesign parameters to coincide with these regions of high sensitivity, the optimizer is given authority whereshape changes have the greatest potential for a↵ecting the objective functional, subject to constraints.
5 of 24
American Institute of Aeronautics and Astronautics
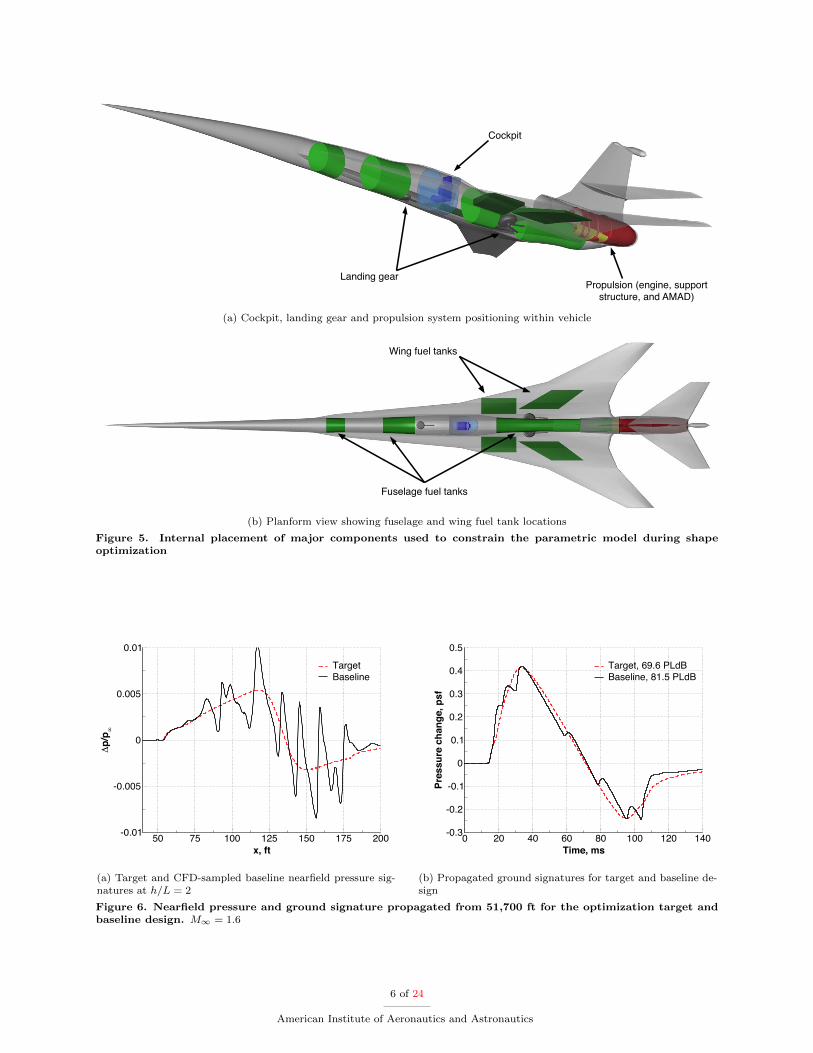
Propulsion (engine, support structure, and AMAD)
Landing gear
Cockpit
(a) Cockpit, landing gear and propulsion system positioning within vehicle
Fuselage fuel tanks
Wing fuel tanks
(b) Planform view showing fuselage and wing fuel tank locations
Figure 5. Internal placement of major components used to constrain the parametric model during shapeoptimization
50 75 100 125 150 175 200x, ft
-0.01
-0.005
0
0.005
0.01
∆p/
p ∞
TargetBaseline
(a) Target and CFD-sampled baseline nearfield pressure sig-natures at h/L = 2
0 20 40 60 80 100 120 140Time, ms
-0.3
-0.2
-0.1
0
0.1
0.2
0.3
0.4
0.5
Pres
sure
cha
nge,
psf
Target, 69.6 PLdBBaseline, 81.5 PLdB
(b) Propagated ground signatures for target and baseline de-sign
Figure 6. Nearfield pressure and ground signature propagated from 51,700 ft for the optimization target andbaseline design. M1 = 1.6
6 of 24
American Institute of Aeronautics and Astronautics
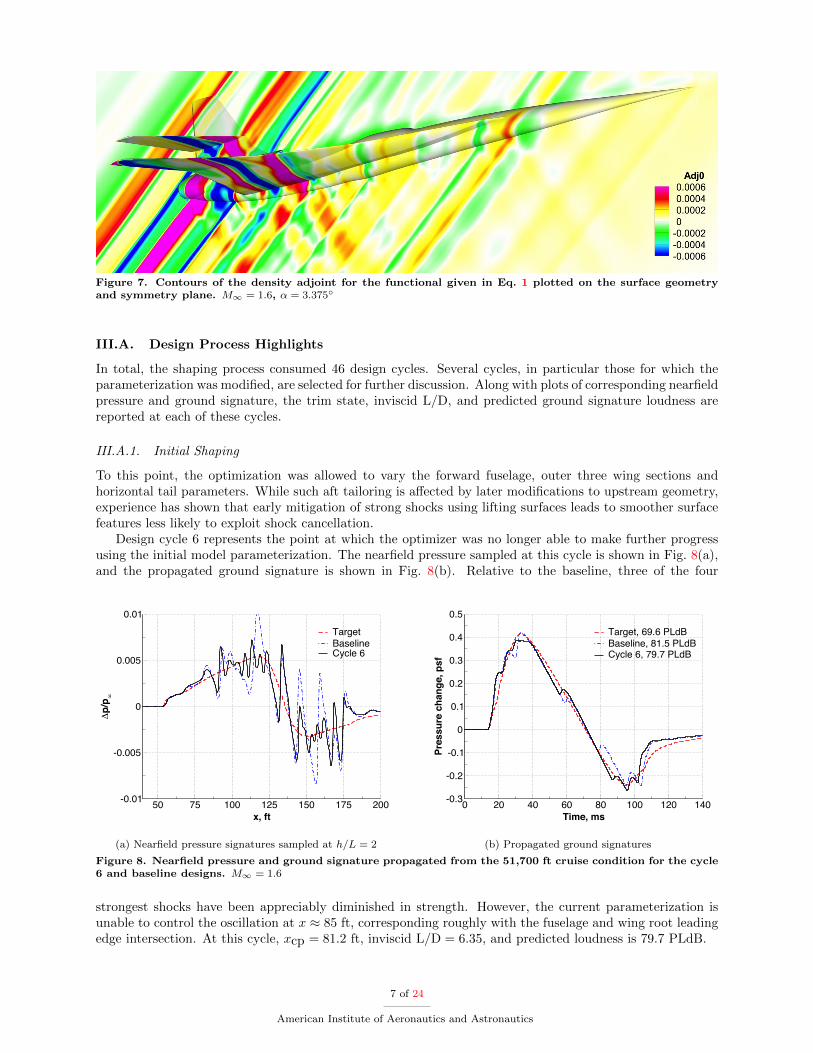
Figure 7. Contours of the density adjoint for the functional given in Eq. 1 plotted on the surface geometryand symmetry plane. M1 = 1.6, ↵ = 3.375�
III.A. Design Process Highlights
In total, the shaping process consumed 46 design cycles. Several cycles, in particular those for which theparameterization was modified, are selected for further discussion. Along with plots of corresponding nearfieldpressure and ground signature, the trim state, inviscid L/D, and predicted ground signature loudness arereported at each of these cycles.
III.A.1. Initial Shaping
To this point, the optimization was allowed to vary the forward fuselage, outer three wing sections andhorizontal tail parameters. While such aft tailoring is a↵ected by later modifications to upstream geometry,experience has shown that early mitigation of strong shocks using lifting surfaces leads to smoother surfacefeatures less likely to exploit shock cancellation.
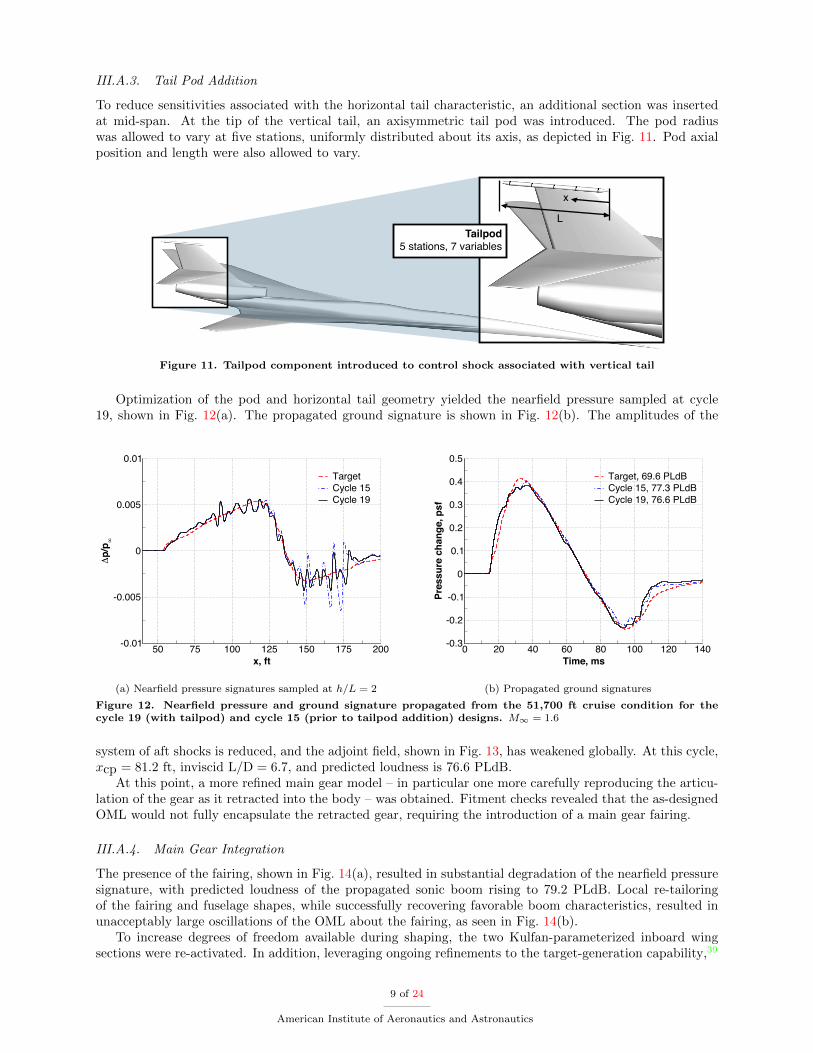
Design cycle 6 represents the point at which the optimizer was no longer able to make further progressusing the initial model parameterization. The nearfield pressure sampled at this cycle is shown in Fig. 8(a),and the propagated ground signature is shown in Fig. 8(b). Relative to the baseline, three of the four
50 75 100 125 150 175 200x, ft
-0.01
-0.005
0
0.005
0.01
∆p/
p ∞
TargetBaselineCycle 6
(a) Nearfield pressure signatures sampled at h/L = 2
0 20 40 60 80 100 120 140Time, ms
-0.3
-0.2
-0.1
0
0.1
0.2
0.3
0.4
0.5
Pres
sure
cha
nge,
psf
Target, 69.6 PLdBBaseline, 81.5 PLdBCycle 6, 79.7 PLdB
(b) Propagated ground signatures
Figure 8. Nearfield pressure and ground signature propagated from the 51,700 ft cruise condition for the cycle6 and baseline designs. M1 = 1.6
strongest shocks have been appreciably diminished in strength. However, the current parameterization isunable to control the oscillation at x ⇡ 85 ft, corresponding roughly with the fuselage and wing root leadingedge intersection. At this cycle, xcp = 81.2 ft, inviscid L/D = 6.35, and predicted loudness is 79.7 PLdB.
7 of 24
American Institute of Aeronautics and Astronautics

III.A.2. Fuselage Re-Parameterization
Three additional fuselage sections were introduced, and existing sections re-distributed to coincide with re-gions of high sensitivity. Over the next several cycles, the fuselage and nacelle parameters were activated ingroups, starting at the nose and sweeping aft. The nearfield pressure sampled at cycle 15, along with thepropagated ground signature are shown in Fig. 9(a) and (b), respectively. The updated fuselage parame-
50 75 100 125 150 175 200x, ft
-0.01
-0.005
0
0.005
0.01
∆p/
p ∞
TargetCycle 6Cycle 15
(a) Nearfield pressure signatures sampled at h/L = 2
0 20 40 60 80 100 120 140Time, ms
-0.3
-0.2
-0.1
0
0.1
0.2
0.3
0.4
0.5
Pres
sure
cha
nge,
psf
Target, 69.6 PLdBCycle 6, 79.7 PLdBCycle 15, 77.3 PLdB
(b) Propagated ground signatures
Figure 9. Nearfield pressure and ground signature propagated from the 51,700 ft cruise condition for the cycle15 and cycle 6 designs. M1 = 1.6
terization, coupled with the expanded design variable set, enables the optimizer to more e↵ectively controldeviations from the target signature. In particular, the oscillation at x ⇡ 85 ft is reduced in strength, andthe remaining strong expansion shock at x ⇡ 130 ft is largely eliminated. At this cycle, xcp = 80.9 ft,inviscid L/D = 6.1, and predicted loudness is 77.3 PLdB.
The remaining aft shock system starting at x ⇡ 150 ft could not be improved upon without furtherchanges to the parameterization. Figure 10 shows the high adjoint sensitivities in this region associated withthe horizontal tail and vertical tail tip.
Horizontal tailcharacteristic
Vertical tail tipcharacteristic
Figure 10. Contours of the density adjoint plotted on the geometry and symmetry plane at cycle 15; insetidentifies the regions of high sensitivity on the horizontal and vertical tails. M1 = 1.6, ↵ = 3.375�
8 of 24
American Institute of Aeronautics and Astronautics
III.A.3. Tail Pod Addition
To reduce sensitivities associated with the horizontal tail characteristic, an additional section was insertedat mid-span. At the tip of the vertical tail, an axisymmetric tail pod was introduced. The pod radiuswas allowed to vary at five stations, uniformly distributed about its axis, as depicted in Fig. 11. Pod axialposition and length were also allowed to vary.
Tailpod5 stations, 7 variables
x
L
Figure 11. Tailpod component introduced to control shock associated with vertical tail
Optimization of the pod and horizontal tail geometry yielded the nearfield pressure sampled at cycle19, shown in Fig. 12(a). The propagated ground signature is shown in Fig. 12(b). The amplitudes of the
50 75 100 125 150 175 200x, ft
-0.01
-0.005
0
0.005
0.01
∆p/
p ∞
TargetCycle 15Cycle 19
(a) Nearfield pressure signatures sampled at h/L = 2
0 20 40 60 80 100 120 140Time, ms
-0.3
-0.2
-0.1
0
0.1
0.2
0.3
0.4
0.5
Pres
sure
cha
nge,
psf
Target, 69.6 PLdBCycle 15, 77.3 PLdBCycle 19, 76.6 PLdB
(b) Propagated ground signatures
Figure 12. Nearfield pressure and ground signature propagated from the 51,700 ft cruise condition for thecycle 19 (with tailpod) and cycle 15 (prior to tailpod addition) designs. M1 = 1.6
system of aft shocks is reduced, and the adjoint field, shown in Fig. 13, has weakened globally. At this cycle,xcp = 81.2 ft, inviscid L/D = 6.7, and predicted loudness is 76.6 PLdB.
At this point, a more refined main gear model – in particular one more carefully reproducing the articu-lation of the gear as it retracted into the body – was obtained. Fitment checks revealed that the as-designedOML would not fully encapsulate the retracted gear, requiring the introduction of a main gear fairing.
III.A.4. Main Gear Integration
The presence of the fairing, shown in Fig. 14(a), resulted in substantial degradation of the nearfield pressuresignature, with predicted loudness of the propagated sonic boom rising to 79.2 PLdB. Local re-tailoringof the fairing and fuselage shapes, while successfully recovering favorable boom characteristics, resulted inunacceptably large oscillations of the OML about the fairing, as seen in Fig. 14(b).
To increase degrees of freedom available during shaping, the two Kulfan-parameterized inboard wingsections were re-activated. In addition, leveraging ongoing refinements to the target-generation capability,39
9 of 24
American Institute of Aeronautics and Astronautics

Figure 13. Contours of the density adjoint plotted on the cycle 19 surface geometry and symmetry plane.M1 = 1.6, ↵ = 3.375�
Stowedmain gear
Fairing
(a) Detail view of main gear OML protrusion in stowed state,with added fairing
Pinch point
(b) Detail view of OML “pinch point” occurring when reshap-ing the fuselage in the presence of the fairing
Figure 14. Illustration of main landing gear fairing and resulting pathological OML geometry following fuselageshaping
10 of 24
American Institute of Aeronautics and Astronautics
a new target pressure signature was produced. In addition to better accommodating the current under-trackAe, target loudness was reduced by ⇠3 PLdB to 66.7 PLdB.
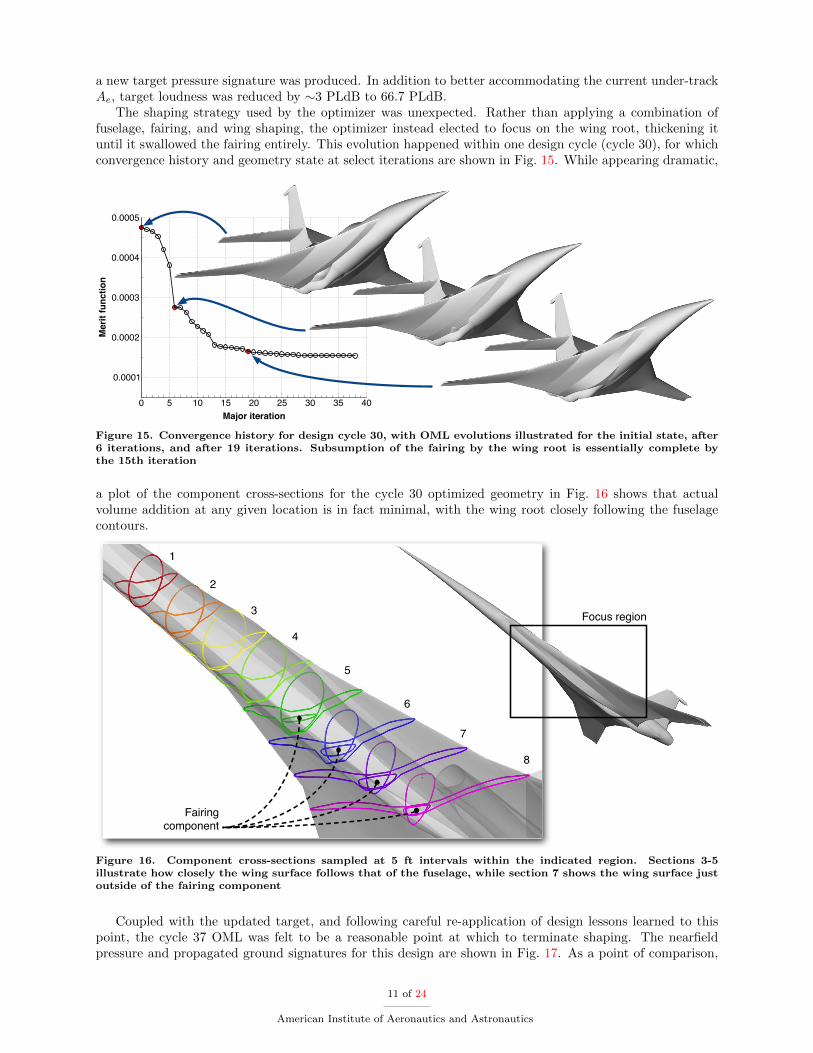
The shaping strategy used by the optimizer was unexpected. Rather than applying a combination offuselage, fairing, and wing shaping, the optimizer instead elected to focus on the wing root, thickening ituntil it swallowed the fairing entirely. This evolution happened within one design cycle (cycle 30), for whichconvergence history and geometry state at select iterations are shown in Fig. 15. While appearing dramatic,
0 5 10 15 20 25 30 35 40Major iteration
0.0001
0.0002
0.0003
0.0004
0.0005
Mer
it fu
nctio
n
Figure 15. Convergence history for design cycle 30, with OML evolutions illustrated for the initial state, after6 iterations, and after 19 iterations. Subsumption of the fairing by the wing root is essentially complete bythe 15th iteration
a plot of the component cross-sections for the cycle 30 optimized geometry in Fig. 16 shows that actualvolume addition at any given location is in fact minimal, with the wing root closely following the fuselagecontours.
Fairingcomponent
Focus region
1
2
3
4
5
6
7
8
Figure 16. Component cross-sections sampled at 5 ft intervals within the indicated region. Sections 3-5illustrate how closely the wing surface follows that of the fuselage, while section 7 shows the wing surface justoutside of the fairing component
Coupled with the updated target, and following careful re-application of design lessons learned to thispoint, the cycle 37 OML was felt to be a reasonable point at which to terminate shaping. The nearfieldpressure and propagated ground signatures for this design are shown in Fig. 17. As a point of comparison,
11 of 24
American Institute of Aeronautics and Astronautics

the cycle 29 signal is included to illustrate the signal degradation that resulted from addition of the fairing.At this cycle, xcp = 81.3 ft, inviscid L/D = 6.6, and predicted loudness is 71.8 PLdB. Note that the key
50 75 100 125 150 175 200x, ft
-0.01
-0.005
0
0.005
0.01
∆p/
p ∞
TargetCycle 29Cycle 37
(a) Nearfield pressure signatures sampled at h/L = 2
0 20 40 60 80 100 120 140Time, ms
-0.3
-0.2
-0.1
0
0.1
0.2
0.3
0.4
0.5
Pres
sure
cha
nge,
psf
Target, 66.7 PLdBCycle 29, 79.2 PLdBCycle 37, 71.8 PLdB
(b) Propagated ground signatures
Figure 17. Nearfield pressure and ground signature propagated from the 51,700 ft cruise condition for thecycle 37 and cycle 29 designs. M1 = 1.6
result is not the loudness level achieved, but rather the almost 10 PLdB reduction relative to the startingpoint.
III.A.5. Propagation from Increased O↵set Distances
To determine a more appropriate stando↵ distance for propagation, an adaptive refinement study using thecycle 37 OML was performed. Targets were specified at h/L = {1, 2, . . . , 5}, and the mesh was allowed togrow to 380 million cells. Figure 18(a) shows plots of stacked nearfield pressure signatures sampled fromthe terminal mesh, with corresponding propagated ground signals plotted in Fig. 18(b). In the nearfield,
0 25 50 75 100 125 150 175Distance along sensor, ft
-0.02
-0.015
-0.01
-0.005
0
0.005
0.01
0.015
∆p/
p ∞
h/L = 1
h/L = 2
h/L = 3
h/L = 4
h/L = 5
(a) Nearfield pressure signatures sampled at h/L ={1, 2, . . . , 5}
0 20 40 60 80 100 120 140Time, ms
-0.5-0.4-0.3-0.2-0.1
00.10.20.30.40.50.6
Pres
sure
cha
nge,
psf
h/L = 1, 75.1 PLdBh/L = 2, 75.5 PLdBh/L = 3, 76.1 PLdBh/L = 4, 76.0 PLdBh/L = 5, 75.7 PLdBh/L = 1
h/L = 2h/L = 3h/L = 4h/L = 5
(b) Propagated ground signatures
Figure 18. Nearfield pressures and ground signatures propagated from the 51,700 ft cruise condition for thecycle 38 design. M1 = 1.6
changes in the aft signal structure suggest that, from h/L = 1 to h/L = 2, shock interactions are continuingto occur that would invalidate the axisymmetric assumption for propagation. The h/L = 3 to h/L = 5 curvesare notable for their similarity, with attenuation being the dominant e↵ect. The ground signatures changequalitatively from h/L = 1 through h/L = 3, with visible di↵erences in the aft signal shape. Specifically,
12 of 24
American Institute of Aeronautics and Astronautics
the shock at ⇠90 ms is missed at h/L = 1, and the shock just after the 100 ms mark continues to growin amplitude until h/L = 3. Predicted loudness increases from 75.1 PLdB at h/L = 1 to 76.1 PLdB ath/L = 3. It is essentially unchanged at h/L = 4, then decreases slightly to 75.7 PLdB at h/L = 5, withthe fallo↵ felt to be an artifact of increasing nearfield signature dissipation with stando↵ distance. Taken asa whole, these results indicate that for this configuration, an o↵set distance of h/L = 3 is consistent withpropagation theory.
III.A.6. Refine at h/L = 3
The design mesh was revised to accommodate a target at h/L = 3. Regions of high refinement were expandedto encapsulate the zone of influence between vehicle and sensor, resulting in a mesh containing 60 millioncells. Function evaluation times – that is, time for a flow and adjoint solve – increased by a factor of 7a.
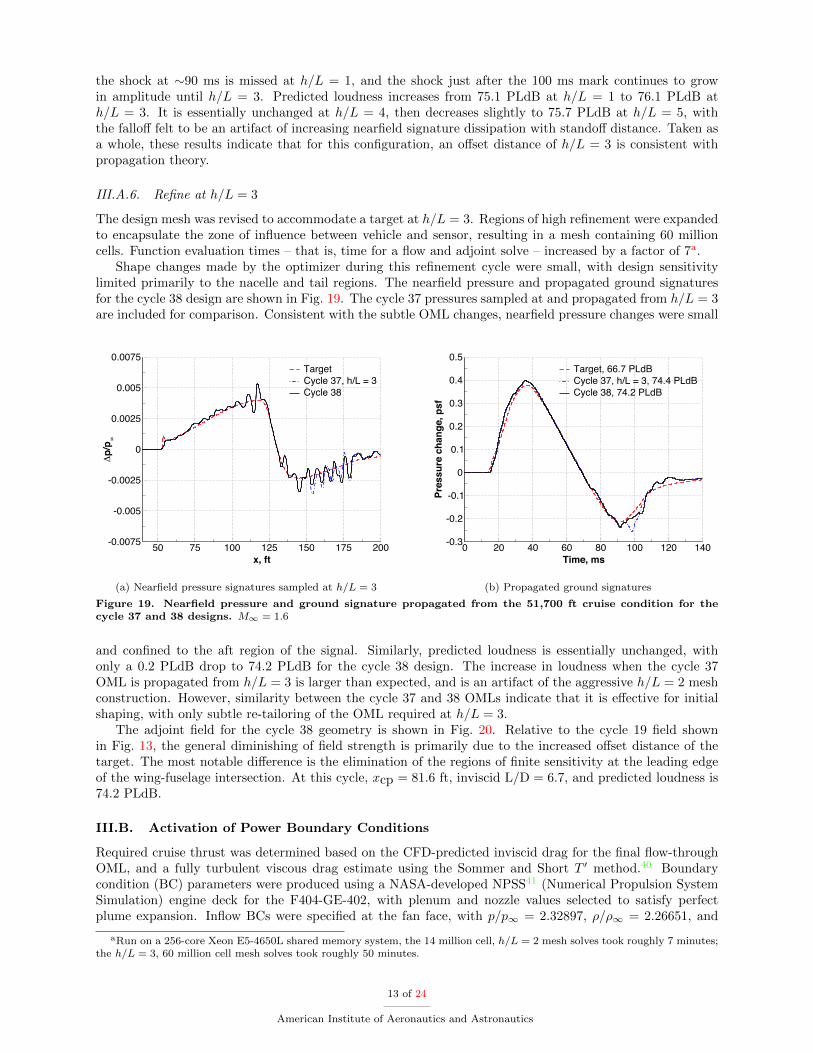
Shape changes made by the optimizer during this refinement cycle were small, with design sensitivitylimited primarily to the nacelle and tail regions. The nearfield pressure and propagated ground signaturesfor the cycle 38 design are shown in Fig. 19. The cycle 37 pressures sampled at and propagated from h/L = 3are included for comparison. Consistent with the subtle OML changes, nearfield pressure changes were small
50 75 100 125 150 175 200x, ft
-0.0075
-0.005
-0.0025
0
0.0025
0.005
0.0075
∆p/
p ∞
TargetCycle 37, h/L = 3Cycle 38
(a) Nearfield pressure signatures sampled at h/L = 3
0 20 40 60 80 100 120 140Time, ms
-0.3
-0.2
-0.1
0
0.1
0.2
0.3
0.4
0.5
Pres
sure
cha
nge,
psf
Target, 66.7 PLdBCycle 37, h/L = 3, 74.4 PLdBCycle 38, 74.2 PLdB
(b) Propagated ground signatures
Figure 19. Nearfield pressure and ground signature propagated from the 51,700 ft cruise condition for thecycle 37 and 38 designs. M1 = 1.6
and confined to the aft region of the signal. Similarly, predicted loudness is essentially unchanged, withonly a 0.2 PLdB drop to 74.2 PLdB for the cycle 38 design. The increase in loudness when the cycle 37OML is propagated from h/L = 3 is larger than expected, and is an artifact of the aggressive h/L = 2 meshconstruction. However, similarity between the cycle 37 and 38 OMLs indicate that it is e↵ective for initialshaping, with only subtle re-tailoring of the OML required at h/L = 3.
The adjoint field for the cycle 38 geometry is shown in Fig. 20. Relative to the cycle 19 field shownin Fig. 13, the general diminishing of field strength is primarily due to the increased o↵set distance of thetarget. The most notable di↵erence is the elimination of the regions of finite sensitivity at the leading edgeof the wing-fuselage intersection. At this cycle, xcp = 81.6 ft, inviscid L/D = 6.7, and predicted loudness is74.2 PLdB.
III.B. Activation of Power Boundary Conditions
Required cruise thrust was determined based on the CFD-predicted inviscid drag for the final flow-throughOML, and a fully turbulent viscous drag estimate using the Sommer and Short T
0 method.40 Boundarycondition (BC) parameters were produced using a NASA-developed NPSS41 (Numerical Propulsion SystemSimulation) engine deck for the F404-GE-402, with plenum and nozzle values selected to satisfy perfectplume expansion. Inflow BCs were specified at the fan face, with p/p1 = 2.32897, ⇢/⇢1 = 2.26651, and
aRun on a 256-core Xeon E5-4650L shared memory system, the 14 million cell, h/L = 2 mesh solves took roughly 7 minutes;the h/L = 3, 60 million cell mesh solves took roughly 50 minutes.
13 of 24
American Institute of Aeronautics and Astronautics
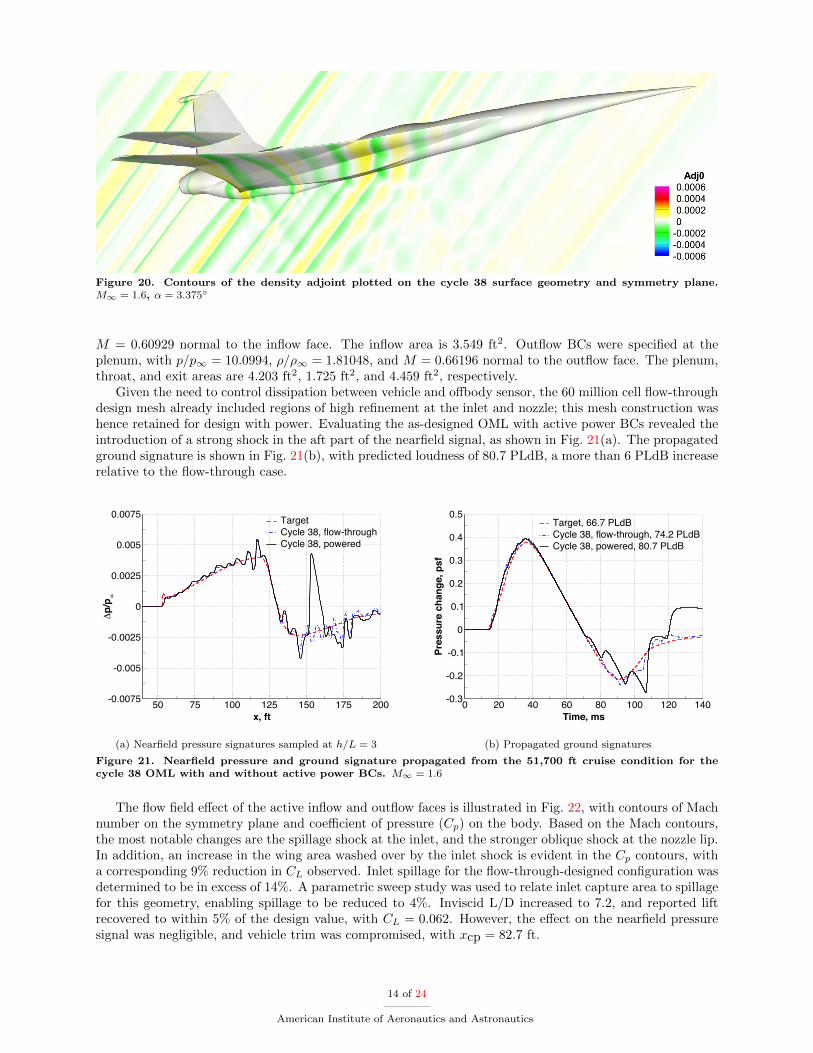
Figure 20. Contours of the density adjoint plotted on the cycle 38 surface geometry and symmetry plane.M1 = 1.6, ↵ = 3.375�
M = 0.60929 normal to the inflow face. The inflow area is 3.549 ft2. Outflow BCs were specified at theplenum, with p/p1 = 10.0994, ⇢/⇢1 = 1.81048, and M = 0.66196 normal to the outflow face. The plenum,throat, and exit areas are 4.203 ft2, 1.725 ft2, and 4.459 ft2, respectively.
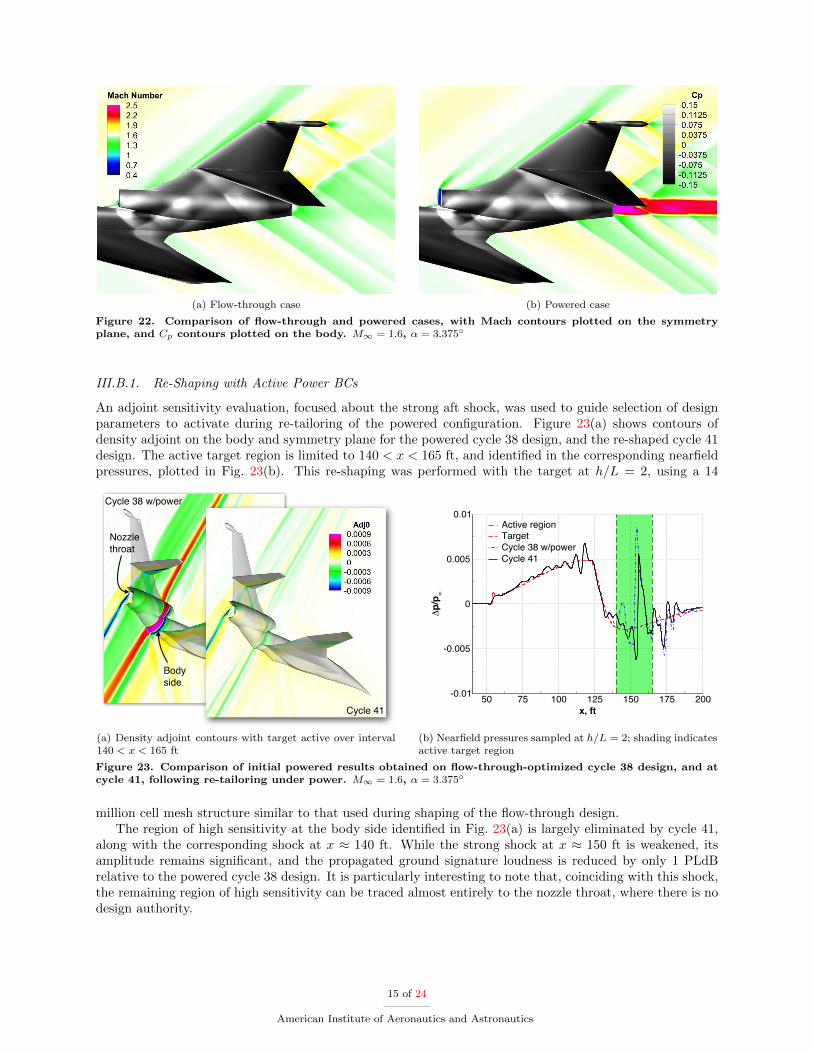
Given the need to control dissipation between vehicle and o↵body sensor, the 60 million cell flow-throughdesign mesh already included regions of high refinement at the inlet and nozzle; this mesh construction washence retained for design with power. Evaluating the as-designed OML with active power BCs revealed theintroduction of a strong shock in the aft part of the nearfield signal, as shown in Fig. 21(a). The propagatedground signature is shown in Fig. 21(b), with predicted loudness of 80.7 PLdB, a more than 6 PLdB increaserelative to the flow-through case.
50 75 100 125 150 175 200x, ft
-0.0075
-0.005
-0.0025
0
0.0025
0.005
0.0075
∆p/
p ∞
TargetCycle 38, flow-throughCycle 38, powered
(a) Nearfield pressure signatures sampled at h/L = 3
0 20 40 60 80 100 120 140Time, ms
-0.3
-0.2
-0.1
0
0.1
0.2
0.3
0.4
0.5
Pres
sure
cha
nge,
psf
Target, 66.7 PLdBCycle 38, flow-through, 74.2 PLdBCycle 38, powered, 80.7 PLdB
(b) Propagated ground signatures
Figure 21. Nearfield pressure and ground signature propagated from the 51,700 ft cruise condition for thecycle 38 OML with and without active power BCs. M1 = 1.6
The flow field e↵ect of the active inflow and outflow faces is illustrated in Fig. 22, with contours of Machnumber on the symmetry plane and coe�cient of pressure (Cp) on the body. Based on the Mach contours,the most notable changes are the spillage shock at the inlet, and the stronger oblique shock at the nozzle lip.In addition, an increase in the wing area washed over by the inlet shock is evident in the Cp contours, witha corresponding 9% reduction in CL observed. Inlet spillage for the flow-through-designed configuration wasdetermined to be in excess of 14%. A parametric sweep study was used to relate inlet capture area to spillagefor this geometry, enabling spillage to be reduced to 4%. Inviscid L/D increased to 7.2, and reported liftrecovered to within 5% of the design value, with CL = 0.062. However, the e↵ect on the nearfield pressuresignal was negligible, and vehicle trim was compromised, with xcp = 82.7 ft.
14 of 24
American Institute of Aeronautics and Astronautics
(a) Flow-through case (b) Powered case
Figure 22. Comparison of flow-through and powered cases, with Mach contours plotted on the symmetryplane, and Cp contours plotted on the body. M1 = 1.6, ↵ = 3.375�
III.B.1. Re-Shaping with Active Power BCs
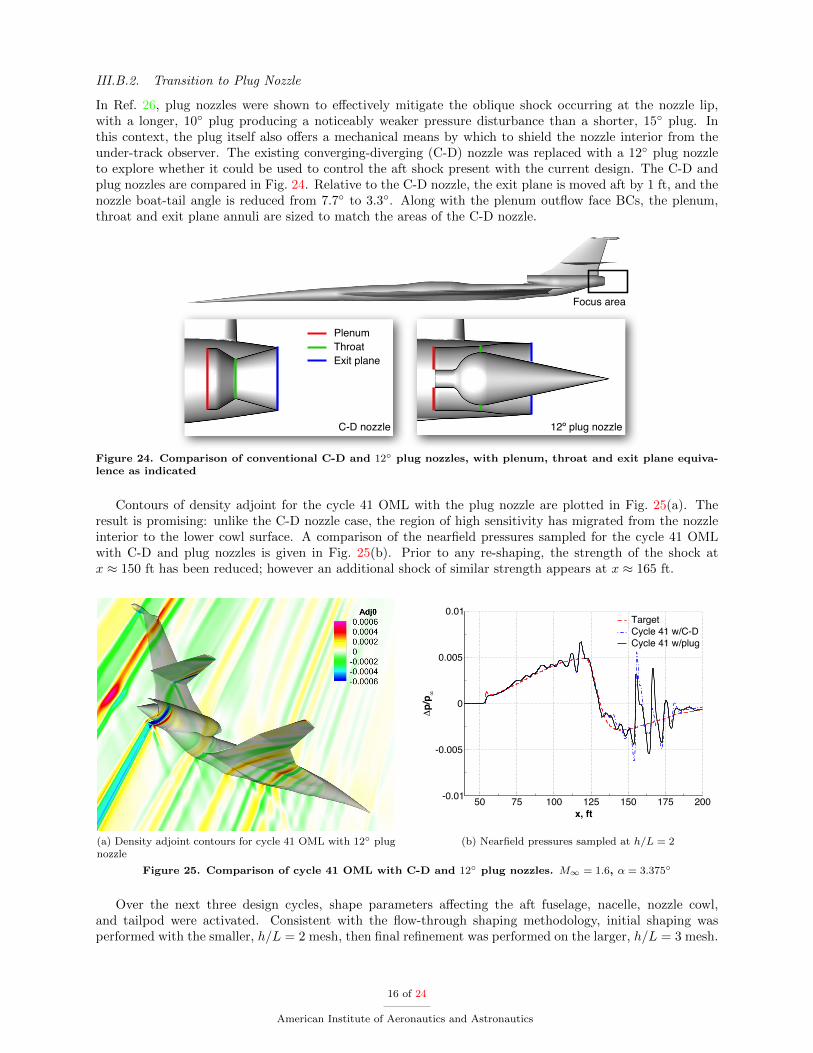
An adjoint sensitivity evaluation, focused about the strong aft shock, was used to guide selection of designparameters to activate during re-tailoring of the powered configuration. Figure 23(a) shows contours ofdensity adjoint on the body and symmetry plane for the powered cycle 38 design, and the re-shaped cycle 41design. The active target region is limited to 140 < x < 165 ft, and identified in the corresponding nearfieldpressures, plotted in Fig. 23(b). This re-shaping was performed with the target at h/L = 2, using a 14
Bodyside
Nozzlethroat
Cycle 38 w/power
Cycle 41
(a) Density adjoint contours with target active over interval140 < x < 165 ft
50 75 100 125 150 175 200x, ft
-0.01
-0.005
0
0.005
0.01
∆p/
p ∞
Active regionTargetCycle 38 w/powerCycle 41
(b) Nearfield pressures sampled at h/L = 2; shading indicatesactive target region
Figure 23. Comparison of initial powered results obtained on flow-through-optimized cycle 38 design, and atcycle 41, following re-tailoring under power. M1 = 1.6, ↵ = 3.375�
million cell mesh structure similar to that used during shaping of the flow-through design.The region of high sensitivity at the body side identified in Fig. 23(a) is largely eliminated by cycle 41,
along with the corresponding shock at x ⇡ 140 ft. While the strong shock at x ⇡ 150 ft is weakened, itsamplitude remains significant, and the propagated ground signature loudness is reduced by only 1 PLdBrelative to the powered cycle 38 design. It is particularly interesting to note that, coinciding with this shock,the remaining region of high sensitivity can be traced almost entirely to the nozzle throat, where there is nodesign authority.
15 of 24
American Institute of Aeronautics and Astronautics
III.B.2. Transition to Plug Nozzle
In Ref. 26, plug nozzles were shown to e↵ectively mitigate the oblique shock occurring at the nozzle lip,with a longer, 10� plug producing a noticeably weaker pressure disturbance than a shorter, 15� plug. Inthis context, the plug itself also o↵ers a mechanical means by which to shield the nozzle interior from theunder-track observer. The existing converging-diverging (C-D) nozzle was replaced with a 12� plug nozzleto explore whether it could be used to control the aft shock present with the current design. The C-D andplug nozzles are compared in Fig. 24. Relative to the C-D nozzle, the exit plane is moved aft by 1 ft, and thenozzle boat-tail angle is reduced from 7.7� to 3.3�. Along with the plenum outflow face BCs, the plenum,throat and exit plane annuli are sized to match the areas of the C-D nozzle.
Focus area
C-D nozzle 12º plug nozzle
PlenumThroatExit plane
Figure 24. Comparison of conventional C-D and 12� plug nozzles, with plenum, throat and exit plane equiva-lence as indicated
Contours of density adjoint for the cycle 41 OML with the plug nozzle are plotted in Fig. 25(a). Theresult is promising: unlike the C-D nozzle case, the region of high sensitivity has migrated from the nozzleinterior to the lower cowl surface. A comparison of the nearfield pressures sampled for the cycle 41 OMLwith C-D and plug nozzles is given in Fig. 25(b). Prior to any re-shaping, the strength of the shock atx ⇡ 150 ft has been reduced; however an additional shock of similar strength appears at x ⇡ 165 ft.
(a) Density adjoint contours for cycle 41 OML with 12� plugnozzle
50 75 100 125 150 175 200x, ft
-0.01
-0.005
0
0.005
0.01
∆p/
p ∞
TargetCycle 41 w/C-DCycle 41 w/plug
(b) Nearfield pressures sampled at h/L = 2
Figure 25. Comparison of cycle 41 OML with C-D and 12� plug nozzles. M1 = 1.6, ↵ = 3.375�
Over the next three design cycles, shape parameters a↵ecting the aft fuselage, nacelle, nozzle cowl,and tailpod were activated. Consistent with the flow-through shaping methodology, initial shaping wasperformed with the smaller, h/L = 2 mesh, then final refinement was performed on the larger, h/L = 3 mesh.
16 of 24
American Institute of Aeronautics and Astronautics
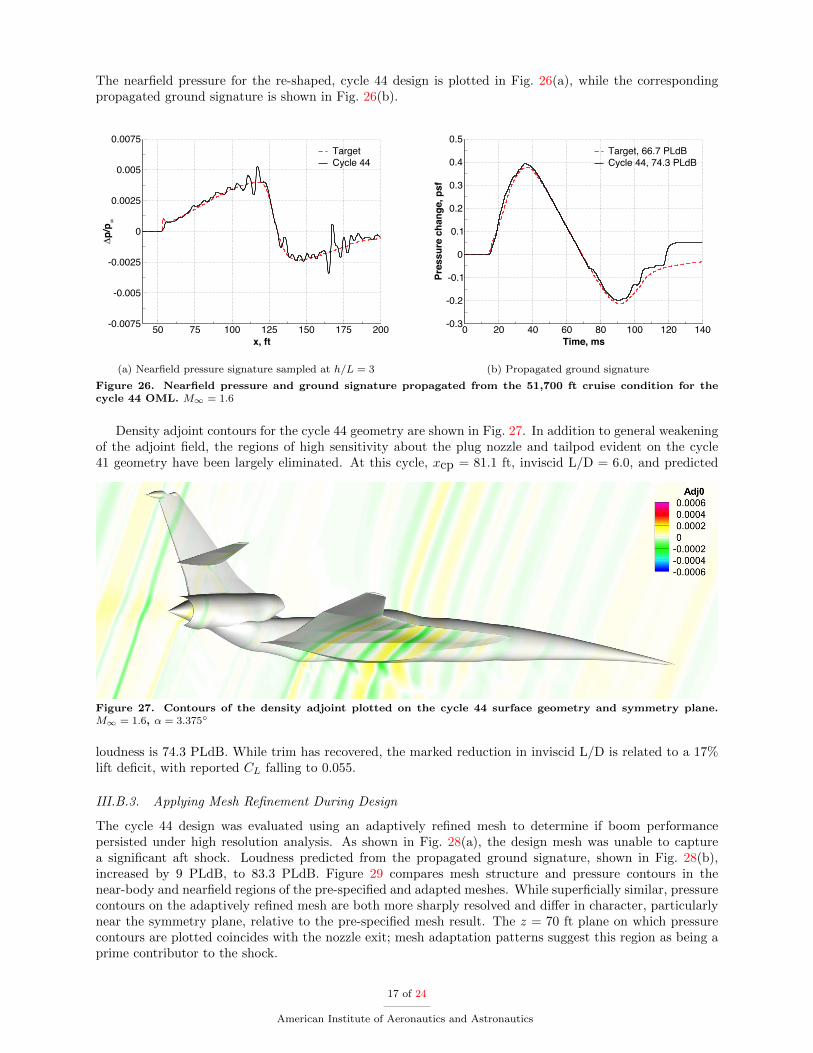
The nearfield pressure for the re-shaped, cycle 44 design is plotted in Fig. 26(a), while the correspondingpropagated ground signature is shown in Fig. 26(b).
50 75 100 125 150 175 200x, ft
-0.0075
-0.005
-0.0025
0
0.0025
0.005
0.0075
∆p/
p ∞
TargetCycle 44
(a) Nearfield pressure signature sampled at h/L = 3
0 20 40 60 80 100 120 140Time, ms
-0.3
-0.2
-0.1
0
0.1
0.2
0.3
0.4
0.5
Pres
sure
cha
nge,
psf
Target, 66.7 PLdBCycle 44, 74.3 PLdB
(b) Propagated ground signature
Figure 26. Nearfield pressure and ground signature propagated from the 51,700 ft cruise condition for thecycle 44 OML. M1 = 1.6
Density adjoint contours for the cycle 44 geometry are shown in Fig. 27. In addition to general weakeningof the adjoint field, the regions of high sensitivity about the plug nozzle and tailpod evident on the cycle41 geometry have been largely eliminated. At this cycle, xcp = 81.1 ft, inviscid L/D = 6.0, and predicted
Figure 27. Contours of the density adjoint plotted on the cycle 44 surface geometry and symmetry plane.M1 = 1.6, ↵ = 3.375�
loudness is 74.3 PLdB. While trim has recovered, the marked reduction in inviscid L/D is related to a 17%lift deficit, with reported CL falling to 0.055.
III.B.3. Applying Mesh Refinement During Design
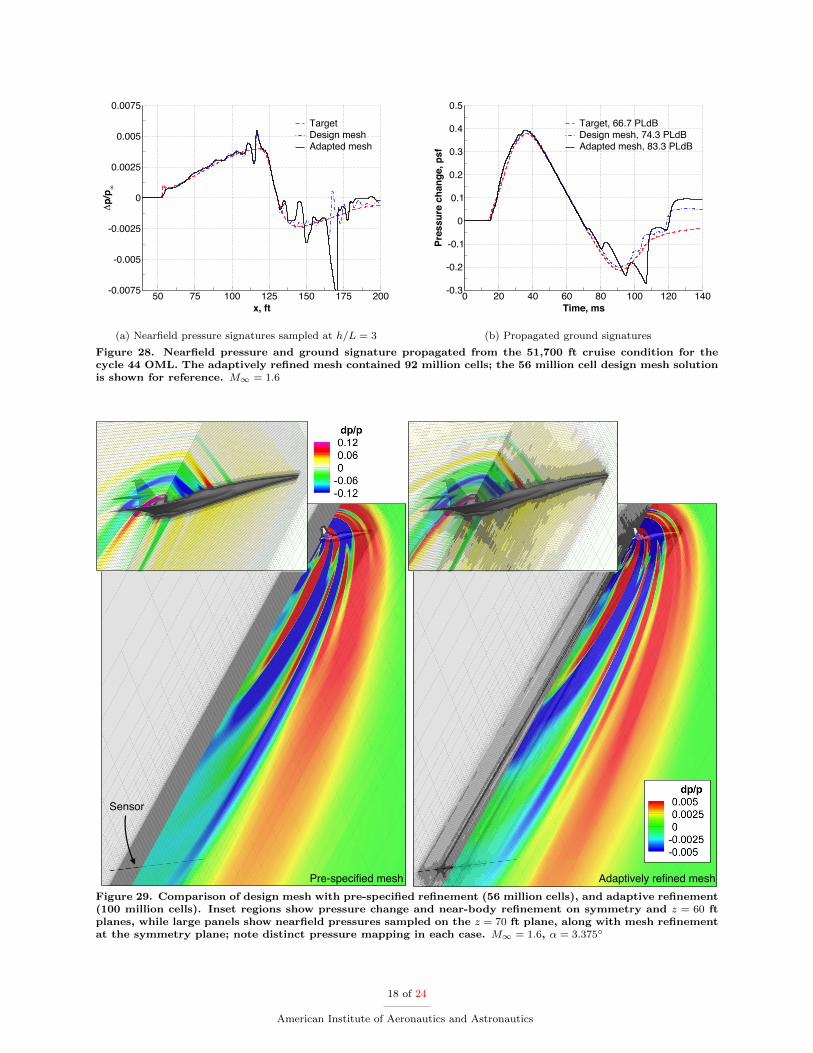
The cycle 44 design was evaluated using an adaptively refined mesh to determine if boom performancepersisted under high resolution analysis. As shown in Fig. 28(a), the design mesh was unable to capturea significant aft shock. Loudness predicted from the propagated ground signature, shown in Fig. 28(b),increased by 9 PLdB, to 83.3 PLdB. Figure 29 compares mesh structure and pressure contours in thenear-body and nearfield regions of the pre-specified and adapted meshes. While superficially similar, pressurecontours on the adaptively refined mesh are both more sharply resolved and di↵er in character, particularlynear the symmetry plane, relative to the pre-specified mesh result. The z = 70 ft plane on which pressurecontours are plotted coincides with the nozzle exit; mesh adaptation patterns suggest this region as being aprime contributor to the shock.
17 of 24
American Institute of Aeronautics and Astronautics
50 75 100 125 150 175 200x, ft
-0.0075
-0.005
-0.0025
0
0.0025
0.005
0.0075∆
p/p ∞
TargetDesign meshAdapted mesh
(a) Nearfield pressure signatures sampled at h/L = 3
0 20 40 60 80 100 120 140Time, ms
-0.3
-0.2
-0.1
0
0.1
0.2
0.3
0.4
0.5
Pres
sure
cha
nge,
psf
Target, 66.7 PLdBDesign mesh, 74.3 PLdBAdapted mesh, 83.3 PLdB
(b) Propagated ground signatures
Figure 28. Nearfield pressure and ground signature propagated from the 51,700 ft cruise condition for thecycle 44 OML. The adaptively refined mesh contained 92 million cells; the 56 million cell design mesh solutionis shown for reference. M1 = 1.6
Pre-specified mesh Adaptively refined mesh
Sensor
Figure 29. Comparison of design mesh with pre-specified refinement (56 million cells), and adaptive refinement(100 million cells). Inset regions show pressure change and near-body refinement on symmetry and z = 60 ftplanes, while large panels show nearfield pressures sampled on the z = 70 ft plane, along with mesh refinementat the symmetry plane; note distinct pressure mapping in each case. M1 = 1.6, ↵ = 3.375�
18 of 24
American Institute of Aeronautics and Astronautics
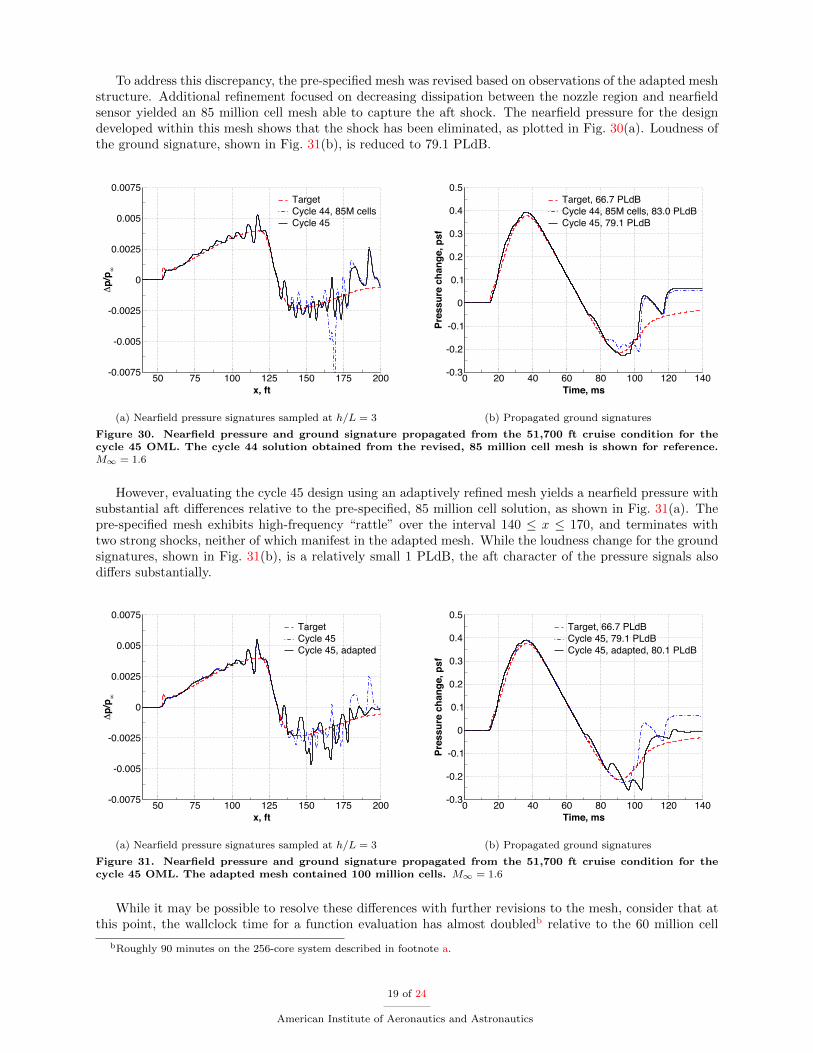
To address this discrepancy, the pre-specified mesh was revised based on observations of the adapted meshstructure. Additional refinement focused on decreasing dissipation between the nozzle region and nearfieldsensor yielded an 85 million cell mesh able to capture the aft shock. The nearfield pressure for the designdeveloped within this mesh shows that the shock has been eliminated, as plotted in Fig. 30(a). Loudness ofthe ground signature, shown in Fig. 31(b), is reduced to 79.1 PLdB.
50 75 100 125 150 175 200x, ft
-0.0075
-0.005
-0.0025
0
0.0025
0.005
0.0075
∆p/
p ∞
TargetCycle 44, 85M cellsCycle 45
(a) Nearfield pressure signatures sampled at h/L = 3
0 20 40 60 80 100 120 140Time, ms
-0.3
-0.2
-0.1
0
0.1
0.2
0.3
0.4
0.5
Pres
sure
cha
nge,
psf
Target, 66.7 PLdBCycle 44, 85M cells, 83.0 PLdBCycle 45, 79.1 PLdB
(b) Propagated ground signatures
Figure 30. Nearfield pressure and ground signature propagated from the 51,700 ft cruise condition for thecycle 45 OML. The cycle 44 solution obtained from the revised, 85 million cell mesh is shown for reference.M1 = 1.6
However, evaluating the cycle 45 design using an adaptively refined mesh yields a nearfield pressure withsubstantial aft di↵erences relative to the pre-specified, 85 million cell solution, as shown in Fig. 31(a). Thepre-specified mesh exhibits high-frequency “rattle” over the interval 140 x 170, and terminates withtwo strong shocks, neither of which manifest in the adapted mesh. While the loudness change for the groundsignatures, shown in Fig. 31(b), is a relatively small 1 PLdB, the aft character of the pressure signals alsodi↵ers substantially.
50 75 100 125 150 175 200x, ft
-0.0075
-0.005
-0.0025
0
0.0025
0.005
0.0075
∆p/
p ∞
TargetCycle 45Cycle 45, adapted
(a) Nearfield pressure signatures sampled at h/L = 3
0 20 40 60 80 100 120 140Time, ms
-0.3
-0.2
-0.1
0
0.1
0.2
0.3
0.4
0.5
Pres
sure
cha
nge,
psf
Target, 66.7 PLdBCycle 45, 79.1 PLdBCycle 45, adapted, 80.1 PLdB
(b) Propagated ground signatures
Figure 31. Nearfield pressure and ground signature propagated from the 51,700 ft cruise condition for thecycle 45 OML. The adapted mesh contained 100 million cells. M1 = 1.6
While it may be possible to resolve these di↵erences with further revisions to the mesh, consider that atthis point, the wallclock time for a function evaluation has almost doubledb relative to the 60 million cell
bRoughly 90 minutes on the 256-core system described in footnote a.
19 of 24
American Institute of Aeronautics and Astronautics
design mesh. The required mesh resolution is such that the computational resource outlay within a functionevaluation is commensurate with the application of mesh adaptation.
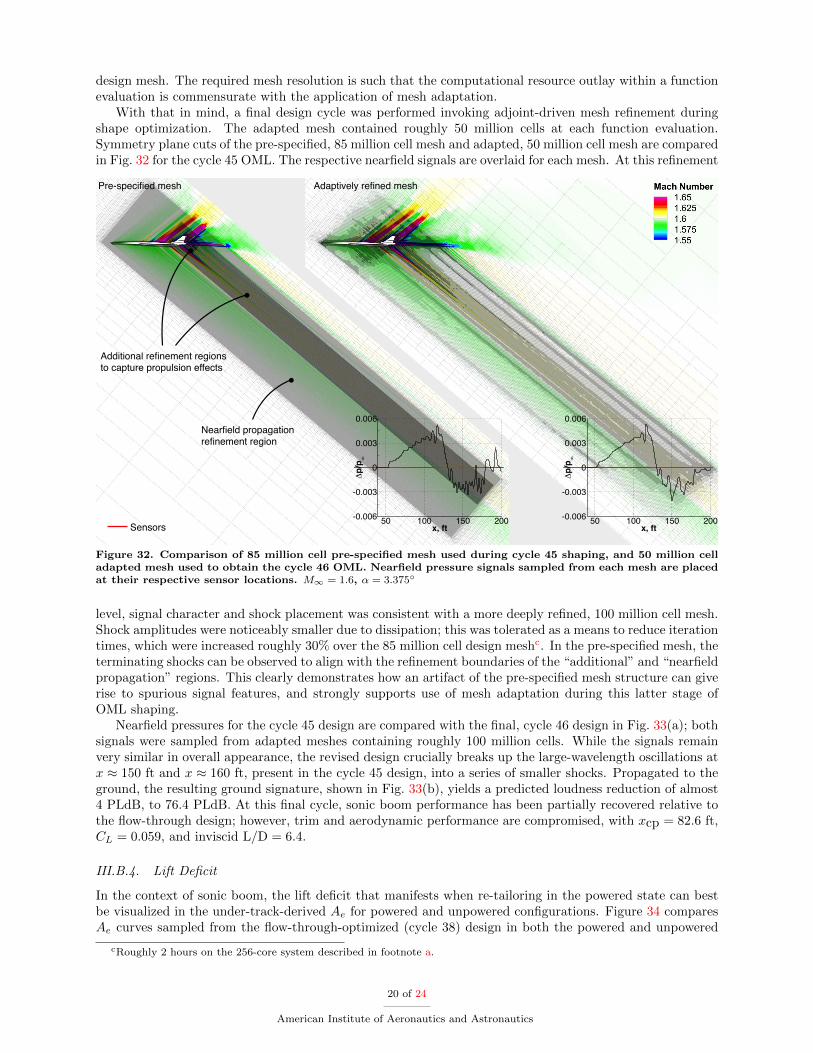
With that in mind, a final design cycle was performed invoking adjoint-driven mesh refinement duringshape optimization. The adapted mesh contained roughly 50 million cells at each function evaluation.Symmetry plane cuts of the pre-specified, 85 million cell mesh and adapted, 50 million cell mesh are comparedin Fig. 32 for the cycle 45 OML. The respective nearfield signals are overlaid for each mesh. At this refinement
50 100 150 200x, ft
-0.006
-0.003
0
0.003
0.006
∆p/
p ∞
50 100 150 200x, ft
-0.006
-0.003
0
0.003
0.006
∆p/
p ∞
Nearfield propagation refinement region
Additional refinement regions to capture propulsion effects
Pre-specified mesh Adaptively refined mesh
Sensors
Figure 32. Comparison of 85 million cell pre-specified mesh used during cycle 45 shaping, and 50 million celladapted mesh used to obtain the cycle 46 OML. Nearfield pressure signals sampled from each mesh are placedat their respective sensor locations. M1 = 1.6, ↵ = 3.375�
level, signal character and shock placement was consistent with a more deeply refined, 100 million cell mesh.Shock amplitudes were noticeably smaller due to dissipation; this was tolerated as a means to reduce iterationtimes, which were increased roughly 30% over the 85 million cell design meshc. In the pre-specified mesh, theterminating shocks can be observed to align with the refinement boundaries of the “additional” and “nearfieldpropagation” regions. This clearly demonstrates how an artifact of the pre-specified mesh structure can giverise to spurious signal features, and strongly supports use of mesh adaptation during this latter stage ofOML shaping.
Nearfield pressures for the cycle 45 design are compared with the final, cycle 46 design in Fig. 33(a); bothsignals were sampled from adapted meshes containing roughly 100 million cells. While the signals remainvery similar in overall appearance, the revised design crucially breaks up the large-wavelength oscillations atx ⇡ 150 ft and x ⇡ 160 ft, present in the cycle 45 design, into a series of smaller shocks. Propagated to theground, the resulting ground signature, shown in Fig. 33(b), yields a predicted loudness reduction of almost4 PLdB, to 76.4 PLdB. At this final cycle, sonic boom performance has been partially recovered relative tothe flow-through design; however, trim and aerodynamic performance are compromised, with xcp = 82.6 ft,CL = 0.059, and inviscid L/D = 6.4.
III.B.4. Lift Deficit
In the context of sonic boom, the lift deficit that manifests when re-tailoring in the powered state can bestbe visualized in the under-track-derived Ae for powered and unpowered configurations. Figure 34 comparesAe curves sampled from the flow-through-optimized (cycle 38) design in both the powered and unpowered
cRoughly 2 hours on the 256-core system described in footnote a.
20 of 24
American Institute of Aeronautics and Astronautics

50 75 100 125 150 175 200x, ft
-0.0075
-0.005
-0.0025
0
0.0025
0.005
0.0075∆
p/p ∞
TargetCycle 45, adaptedCycle 46, adapted
(a) Nearfield pressure signatures sampled at h/L = 3
0 20 40 60 80 100 120 140Time, ms
-0.3
-0.2
-0.1
0
0.1
0.2
0.3
0.4
0.5
Pres
sure
cha
nge,
psf
Target, 66.7 PLdBCycle 45, adapted, 80.1 PLdBCycle 46, adapted, 76.4 PLdB
(b) Propagated ground signatures
Figure 33. Nearfield pressure and ground signature propagated from the 51,700 ft cruise condition for the cycle46 OML. Solutions obtained on adaptively refined meshes containing 100 million cells; the cycle 45 solution isshown for reference. M1 = 1.6
state, along with the re-tailored, cycle 44 configuration with plug nozzle. Focusing for the moment on thecycle 38 design, the activation of power is shown to result in an area surplus accumulating from the 100 fte↵ective length mark. As the OML between the two states is identical, and CL is unchanged, the inflowand outflow BCs have altered the flow field in such a way that e↵ective volume has increased. Moving tothe cycle 44 curve, representing the powered, plug nozzle design, the Ae is seen to compare favorably withthat of the flow-through design. When considering that wing and horizontal tail parameters were frozenfollowing flow-through optimization (cycle 38), and that volume changes due to re-shaping with the plugnozzle cannot account for the e↵ective volume loss, the only means by which the optimizer could reduce Ae
was by reducing the contribution due to lift.
0 20 40 60 80 100 120Effective length, ft
10
20
30
40
50
Equi
vale
nt a
rea,
ft2
Cycle 38 flowthroughCycle 38 w/powerCycle 44
Figure 34. Ae curves integrated from the under-tracknearfield pressure signals sampled at h/L = 3 for theflow-through optimum (cycle 38), with and withoutpower, and the re-tailored plug nozzle design (cycle44). M1 = 1.6
Figures 35(a) and (b) compare Cp contours for theflow-through cycle 38 and powered cycle 44 designs,and clearly illustrate this relative loss of lift. Up tothe inlet, the upper and lower surface Cp contoursare almost identical, as would be expected based onthe similarity of their nearfield pressures to this point.Starting at the inlet, however, the powered configura-tion has a larger region of high pressure on the wingupper surface due to the inlet shock. Further down-stream, the nacelle lower surface has a larger suctionregion, though a following high pressure region maybalance this somewhat. Finally, while the horizontaltail upper surface contours are similar between the twoconfigurations, the lower surface suction is increasedfor the powered case. Taken together, these featuresare consistent with the net reduction in lift.
It is noted that the impact on aerodynamic andboom performance when transitioning to the poweredstate is configuration dependent, and experience withalternate vehicle layouts has shown that it can be neg-ligible for certain configurations, such as those employ-ing inlet and nozzle shielding.
21 of 24
American Institute of Aeronautics and Astronautics

Upper surface
Lower surface
Inlet
(a) Flow-through optimum (cycle 38), unpowered
Upper surface
Lower surface
Nacelle lower surface
(b) Plug nozzle re-tailored (cycle 44), powered
Figure 35. Comparison of Cp contours plotted on the cycle 38 and cycle 44 designs. The � symbol indicatesthe xcp location for trim, nominally at x = 82 ft. M1 = 1.6, ↵ = 3.375�
IV. Conclusions and Future Work
This work successfully demonstrates the application of powerful, adjoint-based techniques to the under-track, low boom shape optimization of a conceptual, demonstrator-class vehicle. Lift and trim constraintswere implicitly imposed using a technique incorporating both during objective formulation. To ensure devel-opment of a realistic OML, geometric constraints were developed from carefully constructed models of largeinternal components, and imposed on the parametric model during shape optimization. Periodic checks offuel tankage and CG were also performed to ensure adequate fuel was carried, and could be placed in a waythat did not invalidate trim.
Gradient-driven shape optimization of the vehicle was performed in both flow-through and powered states,with flow solutions computed using a nonlinear CFD solver capable of accurately capturing the supersonicshock system about the aircraft. Refinement, enrichment, and extension of the model parameterization wasguided by observation of the adjoint field at each design cycle. The flexible modeling approach allowedsubtle changes such as re-distribution of defining stations, to more visible changes such as addition of thetail pod. During the early design phase, cycle throughput was increased by the use of carefully constructed,compact nearfield grids. Subsequently, the vehicle OML was re-tailored using expanded, pre-specified gridsmore appropriate to the propagation theory used. Final OML refinement invoked adjoint-driven, adaptivemesh refinement as part of the shaping process, enabling capture of flow features missed by hand-craftedgrids.
Shape optimization for the flow-through configuration demonstrated an almost 10 PLdB reduction rela-tive to the feasible baseline. A particular point of interest was the substantial wing geometry change pursuedby the optimizer – and subsequent improvement in both boom and aerodynamic performance – when in-corporating the revised main landing gear geometry. When initially transitioning to the powered state, thisimprovement was largely erased, and analysis in the Ae space indicated that the current optimization targetdoes not account for the flow field e↵ect of active power BCs. As a result, any improvement in sonic boomperformance required a trade-o↵ in lift, resulting in a 9% deficit in the final powered design. That said,OML re-tailoring, coupled with the substitution of a plug nozzle geometry in place of the conventional C-D
22 of 24
American Institute of Aeronautics and Astronautics
nozzle, produced a powered, Mach 1.6 design with sonic boom loudness of 76.4 PLdB.Future work will initially focus on revising the target to consider powered e↵ects, and subsequently
re-tailoring the design to recover trim and lift performance. The current design was performed for a singlecruise point; multi-point design is an area of active research, both from a full-carpet, as well as full-missionperspective. Finally, uncertainty quantification, particularly in relation to the interaction of vehicle OML,cruise state, and atmospheric conditions will be explored in future studies.
V. Acknowledgements
This work was supported by TEAMS2 contract NNL12AA09C, and by the NASA Fundamental Aero-nautics Program Commercial Supersonic Technology Project. The authors gratefully acknowledge MichaelAftosmis (NASA Ames Research Center) and Marian Nemec (Science & Technology Corp.) for assistancewith applying the Cart3D adapted mesh shape design capability. The authors also wish to thank Karl Geisel-hart (NASA Langley Research Center) for guidance and data provided during propulsion integration, andSriram Rallabhandi (National Institute of Aerospace) for sBOOM support, and many helpful discussions.
References
1George, A. R. and Seebass, R., “Sonic Boom Minimization Including Both Front and Rear Shocks,” AIAA Journal ,Vol. 9, No. 10, October 1971, pp. 2091–2093.
2Seebass, R. and George, A. R., “Sonic-Boom Minimization,” Journal of the Acoustical Society of America, Vol. 51,No. 2C, January 1972, pp. 686–694.
3Darden, C. M., “Sonic-Boom Minimization with Nose-Bluntness Relaxation,” Technical Paper TP-1348, NASA, NASALangley Research Center, Hampton, VA, January 1979.
4Farhat, C., Maute, K., Argrow, B., and Nikbay, M., “Shape Optimization Methodology for Reducing the Sonic BoomInitial Pressure Rise,” AIAA Journal , Vol. 45, No. 5, May 2007, pp. 1007–1018.
5Chan, M. K., Supersonic Aircraft Optimization for Minimizing Drag and Sonic Boom, Ph.D. dissertation, StanfordUniversity, Stanford, CA, August 2003.
6Alonso, J. J., Kroo, I. M., and Jameson, A., “Advanced Algorithms for Design and Optimization of Quiet SupersonicPlatforms,” 40th AIAA Aerospace Sciences Meeting and Exhibit , No. 2002-0144, AIAA, Reno, NV, January 2002.
7Choi, S., Alonso, J. J., Kroo, I. M., and Wintzer, M., “Multifidelity Design Optimization of Low-Boom Supersonic Jets,”Journal of Aircraft , Vol. 45, No. 1, January-February 2008, pp. 106–118.
8Alauzet, F. and Loseille, A., “High-Order Sonic Boom Modeling Based on Adaptive Methods,” Journal of ComputationalPhysics, Vol. 229, No. 3, 2010, pp. 561–593.
9Park, M. A. and Darmofal, D. L., “Output-Adaptive Tetrahedral Cut-Cell Validation for Sonic Boom Prediction,” 26thAIAA Applied Aerodynamics Conference, No. 2008-6594, AIAA, Honolulu, HI, August 2008.
10Nemec, M., Aftosmis, M. J., and Wintzer, M., “Adjoint-Based Adaptive Mesh Refinement for Complex Geometries,”46th AIAA Aerospace Sciences Meeting , No. 2008-0725, AIAA, Reno, NV, January 2008.
11Wintzer, M., Nemec, M., and Aftosmis, M. J., “Adjoint-Based Adaptive Mesh Refinement for Sonic Boom Prediction,”26th AIAA Applied Aerodynamics Conference, No. 2008-6593, AIAA, Honolulu, HI, August 2008.
12Nadarajah, S. K., Kim, S., Jameson, A., and Alonso, J. J., “Sonic Boom Reduction using an Adjoint Method forSupersonic Transport Aircraft Configurations,” IUTAM Symposium Transsonicum IV , edited by H. Sobieczky, Vol. 73 of FluidMechanics and Its Applications, DLR, Gottingen, Germany, September 2002.
13Aftosmis, M. J., Nemec, M., and Cli↵, S. E., “Adjoint-Based Low-Boom Design with Cart3D,” 29th AIAA AppliedAerodynamics Conference, No. AIAA 2011-3500, AIAA, Honolulu, HI, June 2011.
14Wintzer, M. and Kroo, I. M., “Optimization and Adjoint-Based CFD for the Conceptual Design of Low Sonic BoomAircraft,” 50th AIAA Aerospace Sciences Meeting , No. AIAA-2012-0963, AIAA, Nashville, TN, January 2012.
15Palacios, F., Alonso, J. J., Colonno, M., Hicken, J., and Lukaczyk, T., “Adjoint-Based Method for Supersonic AircraftDesign Using Equivalent Area Distributions,” 50th AIAA Aerospace Sciences Meeting , No. AIAA 2012-0269, AIAA, Nashville,TN, January 2012.
16Morgenstern, J. M., Buonanno, M., and Nordstrud, N., “N+2 Low Boom Wind Tunnel Model Design and Validation,”30th AIAA Applied Aerodynamics Conference, No. AIAA 2012-3217, AIAA, New Orleans, LA, June 25–28 2012.
17Magee, T. E., Shaw, S. G., and Fugal, S. R., “Experimental Validations of a Low-Boom Aircraft Design,” 51st AIAAAerospace Sciences Meeting , No. AIAA 2013-0646, AIAA, Grapevine, TX, January 7–10 2013.
18Wintzer, M., Optimization and Adjoint-Based CFD for the Conceptual Design of Low Sonic Boom Aircraft , Ph.D.dissertation, Stanford University, Stanford, CA, August 2012.
19Conners, T. R. and Howe, D. C., “Supersonic Inlet Shaping for Dramatic Reductions in Drag and Sonic Boom Strength,”44th AIAA Aerospace Sciences Meeting and Exhibit , No. 2006-0030, AIAA, Reno, NV, January 9–12 2006.
20Slater, J. W., “Methodology for the Design of Streamline-Traced External-Compression Supersonic Inlets,” 50th AIAAJoint Propulsion Conference, No. 2014-3593, AIAA, Cleveland, OH, July 28–30 2014.
21Benson, T. J., “An Interactive Method of Characteristics Java Applet to Design and Analyze Supersonic Aircraft Nozzles,”50th AIAA Joint Propulsion Conference, No. 2014-4011, AIAA, Cleveland, OH, July 28–30 2014.
23 of 24
American Institute of Aeronautics and Astronautics
22Heath, C. M., Gray, J. S., Park, M. A., Nielsen, E. J., and Carlson, J.-R., “Aerodynamic Shape Optimization of aDual-Stream Supersonic Plug Nozzle,” 53rd AIAA Aerospace Sciences Meeting , No. 2015-1047, AIAA, Kissimmee, FL, January5–9 2015.
23Graham, D. H., Dahlin, J. H., Meredith, K. B., and Vadnais, J., “Aerodynamic Design of Shaped Sonic Boom Demon-stration Aircraft,” 43rd AIAA Aerospace Sciences Meeting and Exhibit , No. 2005-0008, AIAA, Reno, NV, January 2005.
24Ordaz, I., Wintzer, M., and Rallabhandi, S. K., “Full Carpet Design of a Low-Boom Demonstrator Concept,” 33rd AIAAApplied Aerodynamics Conference, AIAA, Dallas, TX, June 22–26 2015.
25Ordaz, I., Geiselhart, K. A., and Fenbert, J. W., “Conceptual Design of Low-Boom Aircraft with Flight Trim Require-ment,” 32nd AIAA Applied Aerodynamics Conference, No. 2014-2141, NASA Langley Research Center, Atlanta, GA, June16–20 2014.
26Wintzer, M., Castner, R., and Geiselhart, K. A., “Airframe-Nozzle-Plume Interactions in the Context of Low Sonic BoomDesign,” 53rd AIAA Aerospace Sciences Meeting , Kissimmee, FL, January 5–9 2015.
27Anderson, G. R. and Aftosmis, M. J., “Adaptive Shape Control for Aerodnyamic Design,” 56th AIAA/ASCE/AHS/ASCStructures, Structural Dynamics, and Materials Conference, No. 2015-0398, AIAA, Kissimmee, FL, January 5–9 2015.
28Rallabhandi, S. K., “Advanced Sonic Boom Prediction Using the Augmented Burgers Equation,” Journal of Aircraft ,Vol. 48, No. 4, July–August 2011, pp. 1245–1253.
29Committee S1, Acoustics, “Method for Calculation of the Absorption of Sound by the Atmosphere, Annex C,” ANSIStandard S1.26-1995, American National Standards Institute, New York, NY, September 1995.
30Stevens, S. S., “Perceived Level of Noise by Mark VII and Decibels (E),” The Journal of the Acoustical Society ofAmerica, Vol. 51, No. 2B, February 1972, pp. 575–601.
31Shepherd, K. P. and Sullivan, B. M., “A Loudness Calculation Procedure Applied to Shaped Sonic Booms,” TechnicalPaper TP 3134, NASA Langley Research Center, Hampton, VA, November 1991.
32Aftosmis, M. J., Berger, M. J., and Melton, J. E., “Robust and E�cient Cartesian Mesh Generation for Component-BasedGeometry,” AIAA Journal , Vol. 36, No. 6, June 1998, pp. 952–960.
33Nemec, M. and Aftosmis, M. J., “Adjoint sensitivity computations for an embedded-boundary Cartesian mesh method,”Journal of Computational Physics, Vol. 227, 2008, pp. 2724–2742.
34Gill, P. E., Murray, W., and Saunders, M. A., User’s Guide for SNOPT Version 7: Software for Large-Scale NonlinearProgramming , Department of Mathematics, University of California, San Diego, La Jolla, CA, February 2006.
35Aftosmis, M. J., “Solution Adaptive Cartesian Grid Methods for Aerodynamic Flows with Complex Geometries,” LectureSeries 1997-02, von Karman Institute for Fluid Dynamics, Chaussee de Waterloo 72, B-1640 Rhode-Saint-Genese, Belgium,March 3–7 1997.
36Nemec, M. and Aftosmis, M. J., “Output Error Estimates and Mesh Refinement in Aerodynamic Shape Optimization,”51st AIAA Aerospace Sciences Meeting , No. 2013-0865, AIAA, Grapevine, TX, January 7–10 2013.
37Kulfan, B. M., “Universal Parametric Geometry Representation Method,” Journal of Aircraft , Vol. 45, No. 1, January-February 2008, pp. 142–158.
38Hahn, A. S., “Vehicle Sketch Pad: Parametric Geometry for Conceptual Aircraft Design,” 48th AIAA Aerospace SciencesMeeting, No. 2010-0657, AIAA, Orlando, FL, January 4–7 2010.
39Rallabhandi, S. K., “Application of Adjoint Methodology in Various Aspects of Sonic Boom Design,” 32nd AIAA AppliedAerodynamics Conference, No. 2014-2271, AIAA, Atlanta, GA, June 16–20 2014.
40Sommer, S. C. and Short, B. J., “Free-Flight Measurements of Turbulent-Boundary-Layer Skin Friction in the Presenceof Severe aerodynamic Heating at Mach Numbers from 2.8 to 7.0,” Technical Note 3391, National Advisory Committee forAeronautics, Mo↵ett Field, CA, March 1955.
41Lytle, J., Follen, G., Naiman, C., Evans, A., Veres, J., Owen, K., and Lopez, I., “Numerical Propulsion System Simulation(NPSS) 1999 Industry Review,” Technical Memorandum 2000-209795, NASA Glenn Research Center, Cleveland, OH, August2000.
24 of 24
American Institute of Aeronautics and Astronautics