understanding green infrastructure at different scales
TRANSCRIPT

Understanding Green Infrastructure at Different Scales :A SIGNPOSTING GUIDE
Introduction to the guide
Green Infrastructure (GI) has emerged as a dominant part of the built environment agenda. It can make a valuable contribution to addressing a wide range of urban environmental challenges ranging from climate change adaptation and resilience to improved societal health and well-being. Yet, despite the benefits associated with GI, implementation is far from straightforward. One of the core challenges associated with GI delivery is understanding not only how GI provisions link to benefits but also attempting to understand how such benefits vary at different scales. This is particularly important for built environment professionals who need to know the gains that can be obtained from activities undertaken within their specific areas of spatial responsibility. The aim of this leaflet therefore, is to offer practitioners a simple signposting guide of the various environmental, social and economic benefits that can be accrued from GI provisions at micro, meso and macro scales.
What is Green Infrastructure and why is it important ?
Green Infrastructure (GI) can be defined as:
“ the network of natural and semi-natural features, green spaces, rivers and lakes that intersperse and connect villages, towns and cities . . . a natural, service-providing infrastructure that is often more cost-effective, more resilient and more capable of meeting social, environmental and economic objectives than ‘grey’ infrastructure”
( Landscape Institute, 2013 ).
Much of the justification for GI is based upon a recognition that our urban areas are undergoing unprecedented levels of environmental change. Our cities are experiencing increased maximum summer temperatures, increased levels of surface water run-off, rises in pollution levels and increased habitat fragmentation. These problems are further compounded by concerns associated with social cohesion, ageing, health and well-being and competition for land resources. Whilst GI can make a valuable contribution in helping to ameliorate these challenges, it can only do so as part of a shared commitment to changes in practice at all levels.
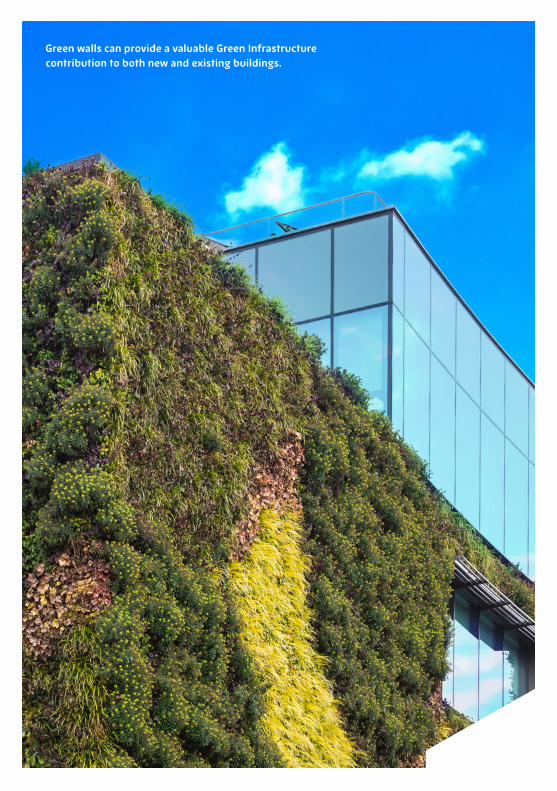
Green walls can provide a valuable Green Infrastructure contribution to both new and existing buildings.
What do we mean by scale ?
Who is this guide for ?
We define scale loosely given the differing spatial interests of built environment professionals and policy makers across the UK. We consider micro scale to be that of an individual or average sized site or development proposal and its immediate surroundings. Meso scale typically spans multiple micro locations. Spatially, this may be a neighbourhood or settlement. Macro scale is the largest scale and typically spans multiple meso locations. Spatially, this may include a city, region, or combined authority area.
This guide is for all built environment professionals with an interest in improving the resilience and liveability of our urban areas. GI is not the responsibility of any single organisation or authority. Rather it is a plural activity which requires the commitment and engagement of stakeholders operating at a range of different scales and coming from a range of different professional backgrounds. It will therefore be of relevance to local and regional authorities, statutory agencies, architects, designers, planners, developers, NGOs and third sector organisations and others engaged in land use change. Central to this guide is a recognition that many of the stakeholders potentially involved in GI delivery will also need to meet wider social and economic objectives. On this basis, this guide seeks to provide equal coverage of environmental, social and economic benefits.
How to use this guide
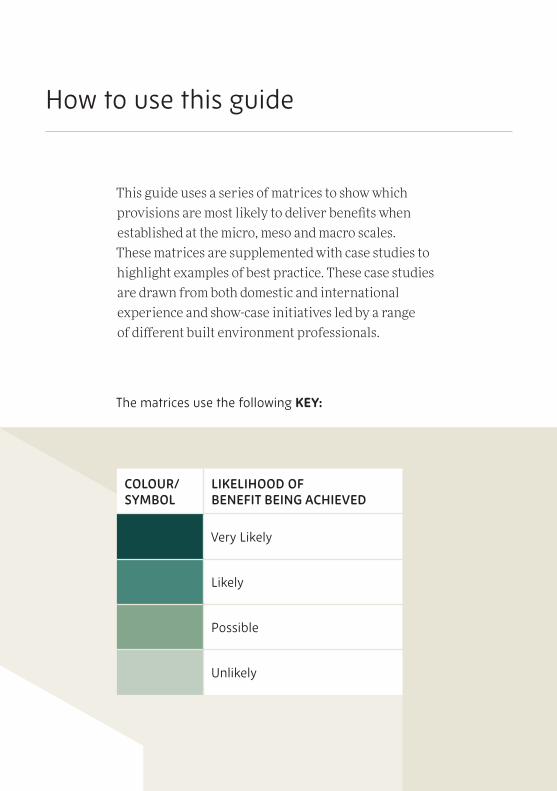
This guide uses a series of matrices to show which provisions are most likely to deliver benefits when established at the micro, meso and macro scales. These matrices are supplemented with case studies to highlight examples of best practice. These case studies are drawn from both domestic and international experience and show-case initiatives led by a range of different built environment professionals.
The matrices use the following KEY:
COLOUR/ SYMBOL
LIKELIHOOD OF BENEFIT BEING ACHIEVED
Very Likely
Likely
Possible
Unlikely
How this guide was created
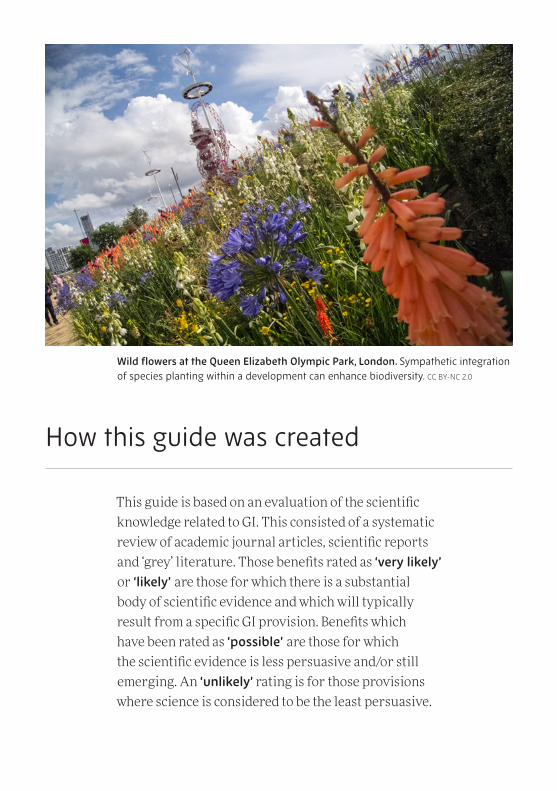
This guide is based on an evaluation of the scientific knowledge related to GI. This consisted of a systematic review of academic journal articles, scientific reports and ‘grey’ literature. Those benefits rated as ‘very likely’ or ‘likely’ are those for which there is a substantial body of scientific evidence and which will typically result from a specific GI provision. Benefits which have been rated as ‘possible’ are those for which the scientific evidence is less persuasive and/or still emerging. An ‘unlikely’ rating is for those provisions where science is considered to be the least persuasive.
Wild flowers at the Queen Elizabeth Olympic Park, London. Sympathetic integration of species planting within a development can enhance biodiversity. CC BY-NC 2.0
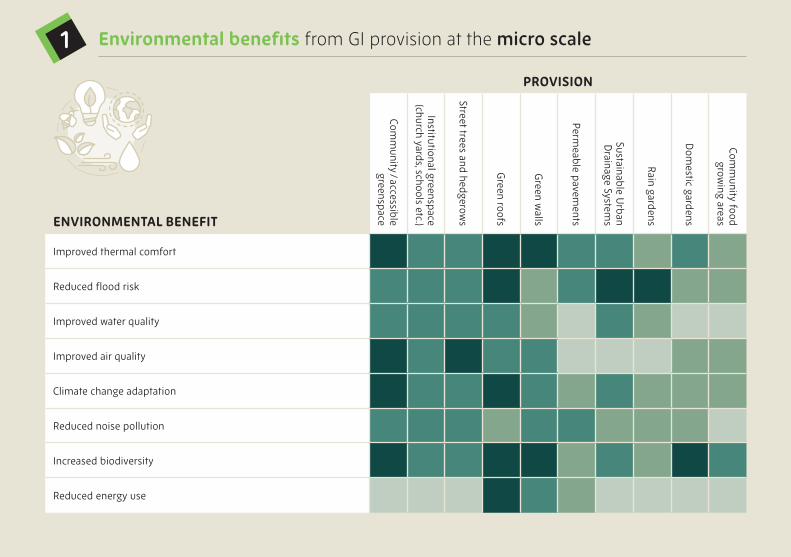
Environmental benefits from GI provision at the micro scale1
ENVIRONMENTAL BENEFIT
PROVISION
Comm
unity / accessible greenspace
Institutional greenspace (church yards, schools etc.)
Street trees and hedgerows
Green roofs
Green w
alls
Permeable pavem
ents
Sustainable Urban
Drainage System
s
Rain gardens
Dom
estic gardens
Comm
unity food grow
ing areas
Improved thermal comfort
Reduced flood risk
Improved water quality
Improved air quality
Climate change adaptation
Reduced noise pollution
Increased biodiversity
Reduced energy use
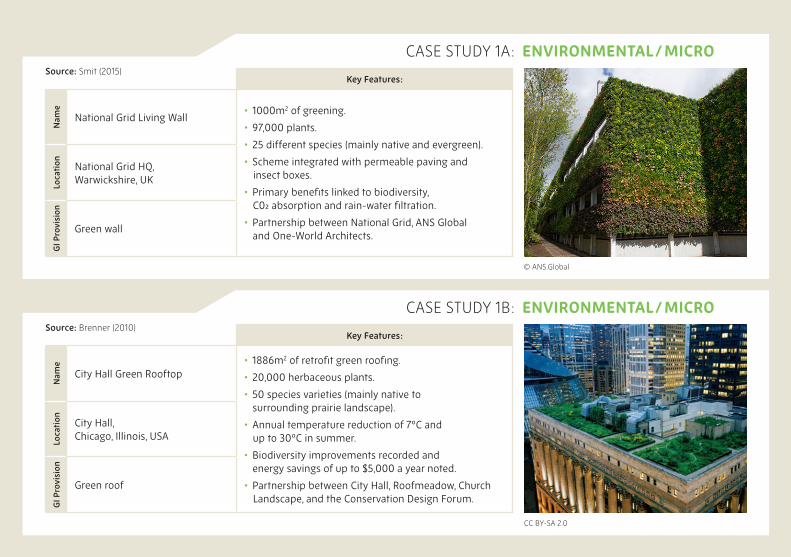
CASE STUDY 1A : ENVIRONMENTAL / MICRO
CASE STUDY 1B : ENVIRONMENTAL / MICRO
Key Features :
Nam
e
National Grid Living Wall• 1000m2 of greening.
• 97,000 plants.
• 25 different species (mainly native and evergreen).
• Scheme integrated with permeable paving and insect boxes.
• Primary benefits linked to biodiversity, C02 absorption and rain-water filtration.
• Partnership between National Grid, ANS Global and One-World Architects.
Loca
tion
National Grid HQ, Warwickshire, UK
GI P
rovi
sion
Green wall
Key Features :
Nam
e
City Hall Green Rooftop• 1886m2 of retrofit green roofing.
• 20,000 herbaceous plants.
• 50 species varieties (mainly native to surrounding prairie landscape).
• Annual temperature reduction of 7ºC and up to 30ºC in summer.
• Biodiversity improvements recorded and energy savings of up to $5,000 a year noted.
• Partnership between City Hall, Roofmeadow, Church Landscape, and the Conservation Design Forum.
Loca
tion
City Hall, Chicago, Illinois, USA
GI P
rovi
sion
Green roof
Source: Smit (2015)
Source: Brenner (2010)
CC BY-SA 2.0
© ANS.Global
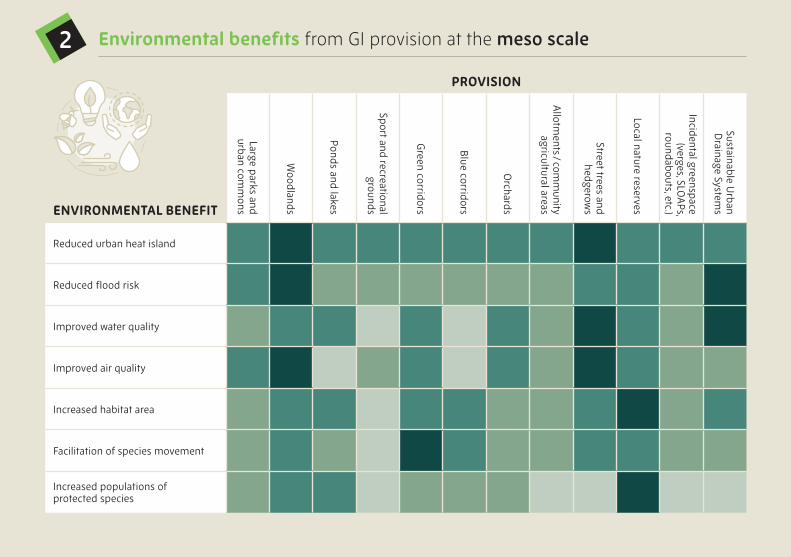
Environmental benefits from GI provision at the meso scale2
ENVIRONMENTAL BENEFIT
PROVISION
Large parks and urban com
mons
Woodlands
Ponds and lakes
Sport and recreational grounds
Green corridors
Blue corridors
Orchards
Allotm
ents / comm
unity agricultural areas
Street trees and hedgerow
s
Local nature reserves
Incidental greenspace (verges, SLO
APs,
roundabouts, etc.)
Sustainable Urban
Drainage System
s
Reduced urban heat island
Reduced flood risk
Improved water quality
Improved air quality
Increased habitat area
Facilitation of species movement
Increased populations of protected species
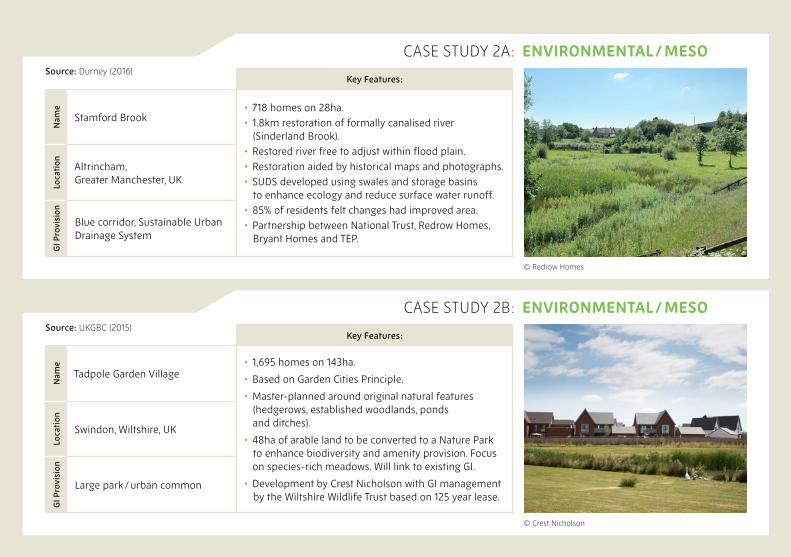
CASE STUDY 2A : ENVIRONMENTAL / MESO
CASE STUDY 2B : ENVIRONMENTAL / MESO
Key Features :
Nam
e
Stamford Brook• 718 homes on 28ha.• 1.8km restoration of formally canalised river
(Sinderland Brook).• Restored river free to adjust within flood plain.• Restoration aided by historical maps and photographs.• SUDS developed using swales and storage basins
to enhance ecology and reduce surface water runoff.• 85% of residents felt changes had improved area.• Partnership between National Trust, Redrow Homes,
Bryant Homes and TEP.
Loca
tion
Altrincham, Greater Manchester, UK
GI P
rovi
sion
Blue corridor, Sustainable Urban Drainage System
Key Features :
Nam
e
Tadpole Garden Village• 1,695 homes on 143ha.
• Based on Garden Cities Principle.
• Master-planned around original natural features (hedgerows, established woodlands, ponds and ditches).
• 48ha of arable land to be converted to a Nature Park to enhance biodiversity and amenity provision. Focus on species-rich meadows. Will link to existing GI.
• Development by Crest Nicholson with GI management by the Wiltshire Wildlife Trust based on 125 year lease.
Loca
tion
Swindon, Wiltshire, UK
GI P
rovi
sion
Large park / urban common
Source: Durney (2016)
Source: UKGBC (2015)
© Redrow Homes
© Crest Nicholson
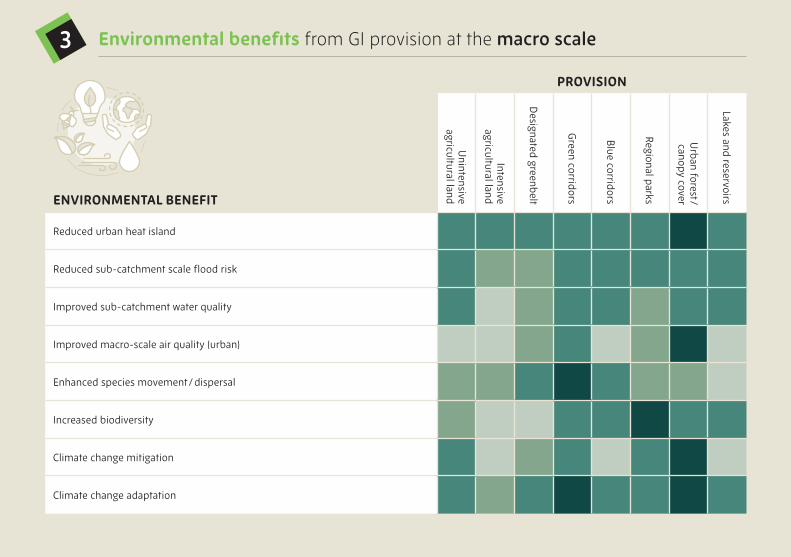
Environmental benefits from GI provision at the macro scale3
ENVIRONMENTAL BENEFIT
PROVISION
Unintensive
agricultural land
Intensive agricultural land
Designated greenbelt
Green corridors
Blue corridors
Regional parks
Urban forest /
canopy cover
Lakes and reservoirs
Reduced urban heat island
Reduced sub-catchment scale flood risk
Improved sub-catchment water quality
Improved macro-scale air quality (urban)
Enhanced species movement / dispersal
Increased biodiversity
Climate change mitigation
Climate change adaptation
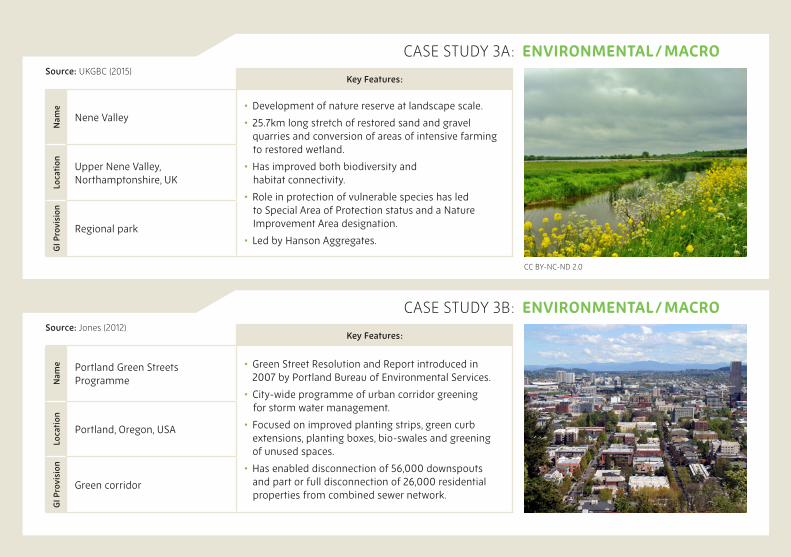
CASE STUDY 3A : ENVIRONMENTAL / MACRO
CASE STUDY 3B : ENVIRONMENTAL / MACRO
Key Features :
Nam
e
Nene Valley• Development of nature reserve at landscape scale.
• 25.7km long stretch of restored sand and gravel quarries and conversion of areas of intensive farming to restored wetland.
• Has improved both biodiversity and habitat connectivity.
• Role in protection of vulnerable species has led to Special Area of Protection status and a Nature Improvement Area designation.
• Led by Hanson Aggregates.
Loca
tion
Upper Nene Valley, Northamptonshire, UK
GI P
rovi
sion
Regional park
Key Features :
Nam
e Portland Green Streets Programme
• Green Street Resolution and Report introduced in 2007 by Portland Bureau of Environmental Services.
• City-wide programme of urban corridor greening for storm water management.
• Focused on improved planting strips, green curb extensions, planting boxes, bio-swales and greening of unused spaces.
• Has enabled disconnection of 56,000 downspouts and part or full disconnection of 26,000 residential properties from combined sewer network.
Loca
tion
Portland, Oregon, USA
GI P
rovi
sion
Green corridor
Source: UKGBC (2015)
Source: Jones (2012)
CC BY-NC-ND 2.0
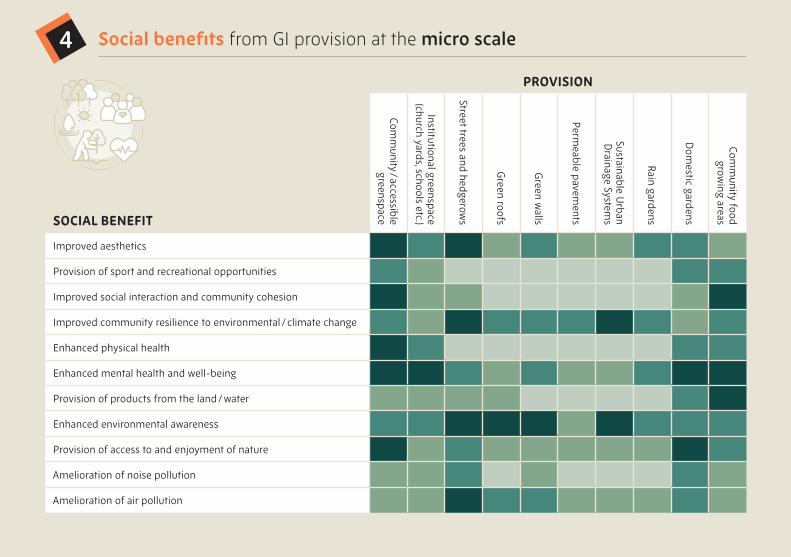
Social benefits from GI provision at the micro scale4
SOCIAL BENEFIT
PROVISION
Comm
unity / accessible greenspace
Institutional greenspace (church yards, schools etc.)
Street trees and hedgerows
Green roofs
Green w
alls
Permeable pavem
ents
Sustainable Urban
Drainage System
s
Rain gardens
Dom
estic gardens
Comm
unity food grow
ing areas
Improved aesthetics
Provision of sport and recreational opportunities
Improved social interaction and community cohesion
Improved community resilience to environmental / climate change
Enhanced physical health
Enhanced mental health and well-being
Provision of products from the land / water
Enhanced environmental awareness
Provision of access to and enjoyment of nature
Amelioration of noise pollution
Amelioration of air pollution
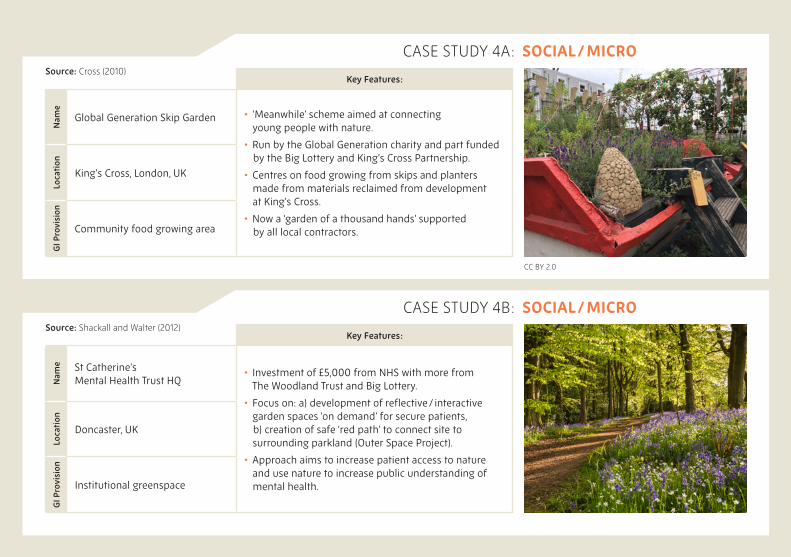
CASE STUDY 4A : SOCIAL / MICRO
CASE STUDY 4B : SOCIAL / MICRO
Key Features :
Nam
e
Global Generation Skip Garden • ‘Meanwhile’ scheme aimed at connecting young people with nature.
• Run by the Global Generation charity and part funded by the Big Lottery and King’s Cross Partnership.
• Centres on food growing from skips and planters made from materials reclaimed from development at King’s Cross.
• Now a ‘garden of a thousand hands’ supported by all local contractors.
Loca
tion
King’s Cross, London, UK
GI P
rovi
sion
Community food growing area
Key Features :
Nam
e St Catherine’s Mental Health Trust HQ
• Investment of £5,000 from NHS with more from The Woodland Trust and Big Lottery.
• Focus on: a) development of reflective / interactive garden spaces ‘on demand’ for secure patients, b) creation of safe ‘red path’ to connect site to surrounding parkland (Outer Space Project).
• Approach aims to increase patient access to nature and use nature to increase public understanding of mental health.
Loca
tion
Doncaster, UK
GI P
rovi
sion
Institutional greenspace
Source: Cross (2010)
Source: Shackall and Walter (2012)
CC BY 2.0
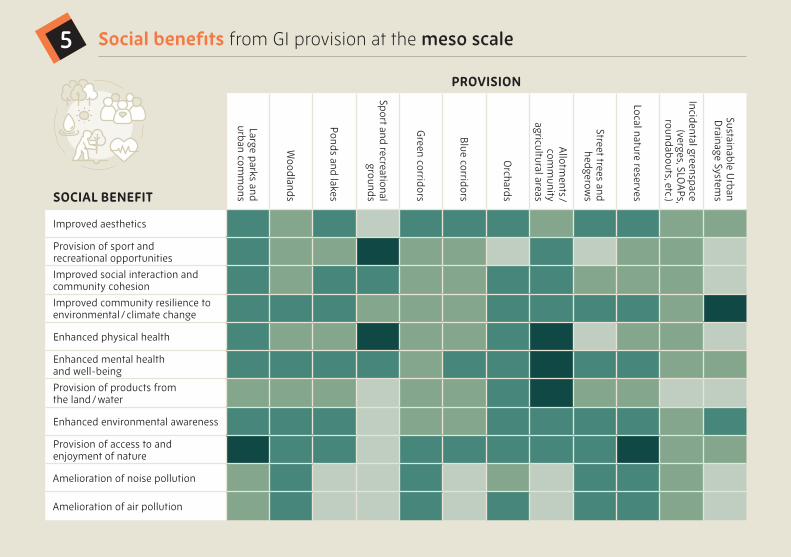
Social benefits from GI provision at the meso scale5
SOCIAL BENEFIT
PROVISION
Large parks and urban com
mons
Woodlands
Ponds and lakes
Sport and recreational grounds
Green corridors
Blue corridors
Orchards
Allotm
ents / com
munity
agricultural areas
Street trees and hedgerow
s
Local nature reserves
Incidental greenspace (verges, SLO
APs,
roundabouts, etc.)
Sustainable Urban
Drainage System
s
Improved aesthetics
Provision of sport and recreational opportunities
Improved social interaction and community cohesion
Improved community resilience to environmental / climate change
Enhanced physical health
Enhanced mental health and well-being
Provision of products from the land / water
Enhanced environmental awareness
Provision of access to and enjoyment of nature
Amelioration of noise pollution
Amelioration of air pollution
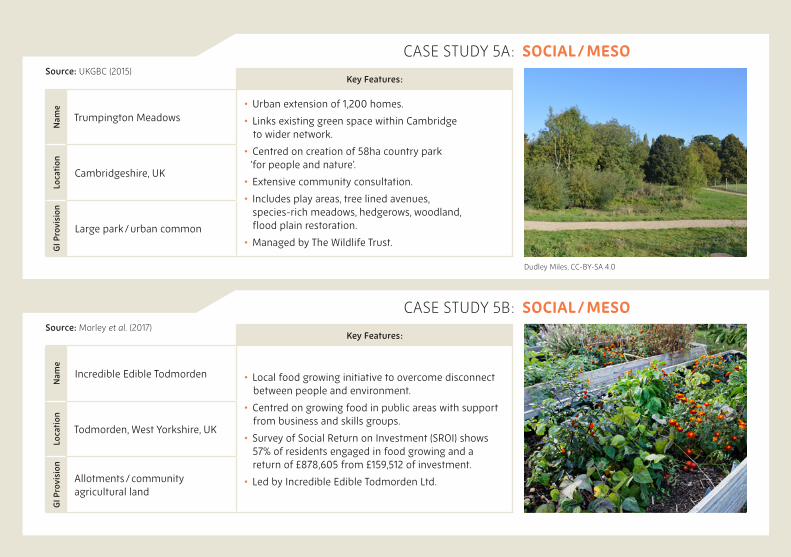
CASE STUDY 5A : SOCIAL / MESO
CASE STUDY 5B : SOCIAL / MESO
Key Features :
Nam
e
Trumpington Meadows• Urban extension of 1,200 homes.
• Links existing green space within Cambridge to wider network.
• Centred on creation of 58ha country park ‘for people and nature’.
• Extensive community consultation.
• Includes play areas, tree lined avenues, species-rich meadows, hedgerows, woodland, flood plain restoration.
• Managed by The Wildlife Trust.
Loca
tion
Cambridgeshire, UK
GI P
rovi
sion
Large park / urban common
Key Features :
Nam
e
Incredible Edible Todmorden • Local food growing initiative to overcome disconnect between people and environment.
• Centred on growing food in public areas with support from business and skills groups.
• Survey of Social Return on Investment (SROI) shows 57% of residents engaged in food growing and a return of £878,605 from £159,512 of investment.
• Led by Incredible Edible Todmorden Ltd.
Loca
tion
Todmorden, West Yorkshire, UK
GI P
rovi
sion
Allotments / community agricultural land
Source: UKGBC (2015)
Source: Morley et al. (2017)
Dudley Miles, CC-BY-SA 4.0
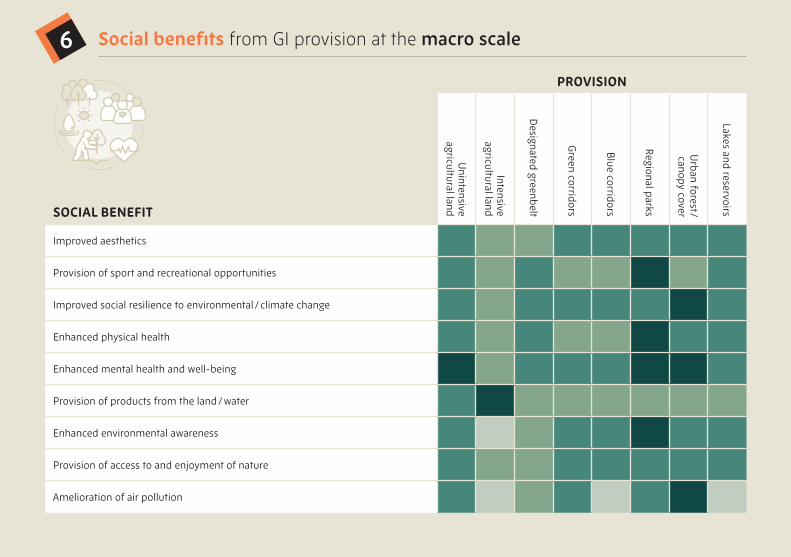
Social benefits from GI provision at the macro scale6
SOCIAL BENEFIT
PROVISION
Unintensive
agricultural land
Intensive agricultural land
Designated greenbelt
Green corridors
Blue corridors
Regional parks
Urban forest /
canopy cover
Lakes and reservoirs
Improved aesthetics
Provision of sport and recreational opportunities
Improved social resilience to environmental / climate change
Enhanced physical health
Enhanced mental health and well-being
Provision of products from the land / water
Enhanced environmental awareness
Provision of access to and enjoyment of nature
Amelioration of air pollution
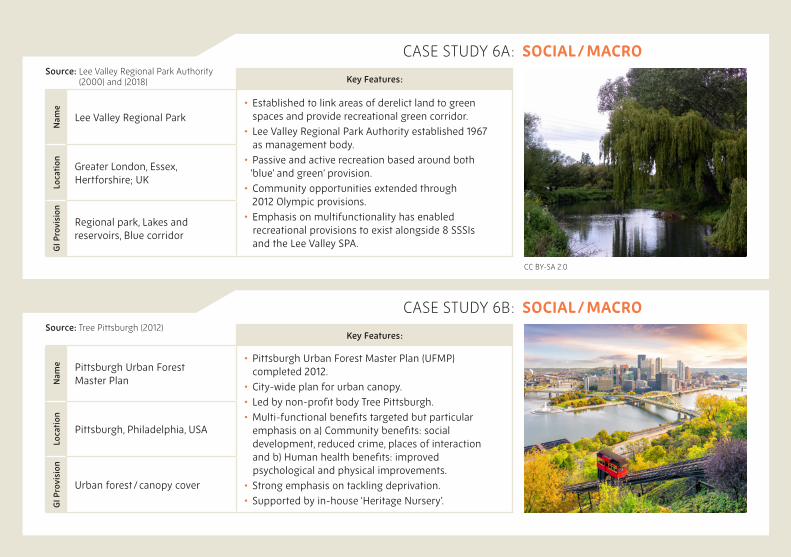
CASE STUDY 6A : SOCIAL / MACRO
CASE STUDY 6B : SOCIAL / MACRO
Key Features :
Nam
e
Lee Valley Regional Park• Established to link areas of derelict land to green
spaces and provide recreational green corridor.• Lee Valley Regional Park Authority established 1967
as management body.• Passive and active recreation based around both
‘blue’ and green’ provision.• Community opportunities extended through
2012 Olympic provisions.• Emphasis on multifunctionality has enabled
recreational provisions to exist alongside 8 SSSIs and the Lee Valley SPA.
Loca
tion
Greater London, Essex, Hertforshire; UK
GI P
rovi
sion
Regional park, Lakes and reservoirs, Blue corridor
Key Features :
Nam
e Pittsburgh Urban Forest Master Plan
• Pittsburgh Urban Forest Master Plan (UFMP) completed 2012.
• City-wide plan for urban canopy.• Led by non-profit body Tree Pittsburgh.• Multi-functional benefits targeted but particular
emphasis on a) Community benefits: social development, reduced crime, places of interaction and b) Human health benefits: improved psychological and physical improvements.
• Strong emphasis on tackling deprivation.• Supported by in-house ‘Heritage Nursery’.
Loca
tion
Pittsburgh, Philadelphia, USA
GI P
rovi
sion
Urban forest / canopy cover
Source: Lee Valley Regional Park Authority (2000) and (2018)
Source: Tree Pittsburgh (2012)
CC BY-SA 2.0
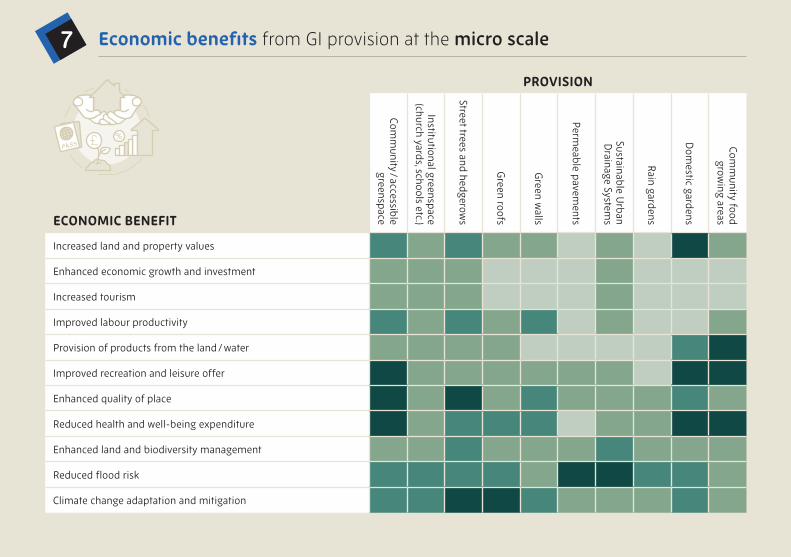
Economic benefits from GI provision at the micro scale7
ECONOMIC BENEFIT
PROVISION
Comm
unity / accessible greenspace
Institutional greenspace (church yards, schools etc.)
Street trees and hedgerows
Green roofs
Green w
alls
Permeable pavem
ents
Sustainable Urban
Drainage System
s
Rain gardens
Dom
estic gardens
Comm
unity food grow
ing areas
Increased land and property values
Enhanced economic growth and investment
Increased tourism
Improved labour productivity
Provision of products from the land / water
Improved recreation and leisure offer
Enhanced quality of place
Reduced health and well-being expenditure
Enhanced land and biodiversity management
Reduced flood risk
Climate change adaptation and mitigation
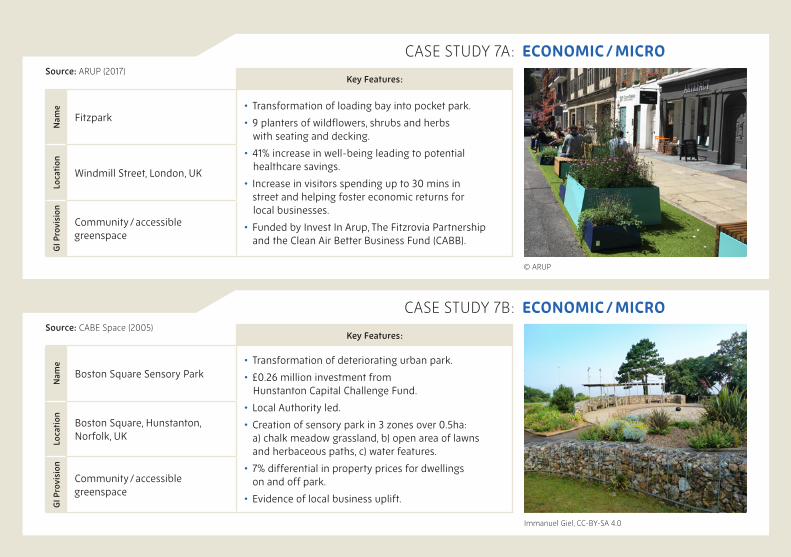
CASE STUDY 7A : ECONOMIC / MICRO
CASE STUDY 7B : ECONOMIC / MICRO
Key Features :
Nam
e
Fitzpark• Transformation of loading bay into pocket park.
• 9 planters of wildflowers, shrubs and herbs with seating and decking.
• 41% increase in well-being leading to potential healthcare savings.
• Increase in visitors spending up to 30 mins in street and helping foster economic returns for local businesses.
• Funded by Invest In Arup, The Fitzrovia Partnership and the Clean Air Better Business Fund (CABB).
Loca
tion
Windmill Street, London, UK
GI P
rovi
sion
Community / accessible greenspace
Key Features :
Nam
e
Boston Square Sensory Park• Transformation of deteriorating urban park.
• £0.26 million investment from Hunstanton Capital Challenge Fund.
• Local Authority led.
• Creation of sensory park in 3 zones over 0.5ha: a) chalk meadow grassland, b) open area of lawns and herbaceous paths, c) water features.
• 7% differential in property prices for dwellings on and off park.
• Evidence of local business uplift.
Loca
tion
Boston Square, Hunstanton, Norfolk, UK
GI P
rovi
sion
Community / accessible greenspace
Source: ARUP (2017)
Source: CABE Space (2005)
© ARUP
Immanuel Giel, CC-BY-SA 4.0
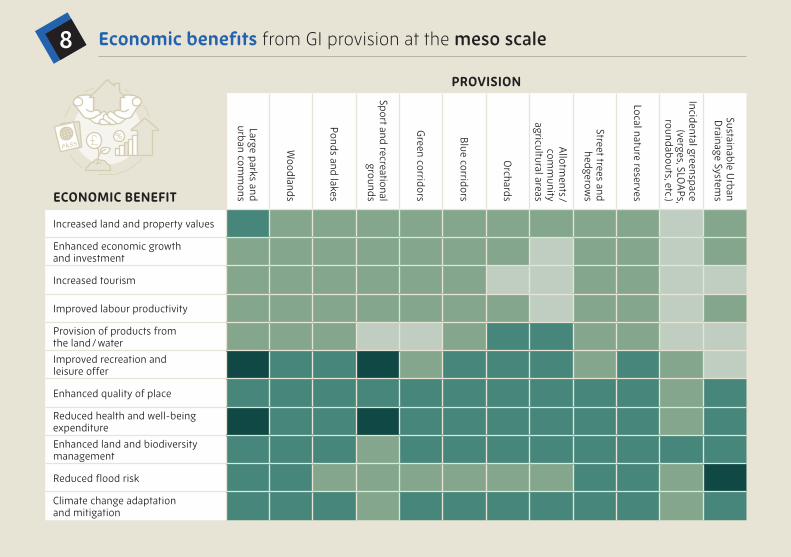
Economic benefits from GI provision at the meso scale8
ECONOMIC BENEFIT
PROVISION
Large parks and urban com
mons
Woodlands
Ponds and lakes
Sport and recreational grounds
Green corridors
Blue corridors
Orchards
Allotm
ents / com
munity
agricultural areas
Street trees and hedgerow
s
Local nature reserves
Incidental greenspace (verges, SLO
APs,
roundabouts, etc.)
Sustainable Urban
Drainage System
s
Increased land and property values
Enhanced economic growth and investment
Increased tourism
Improved labour productivity
Provision of products from the land / water
Improved recreation and leisure offer
Enhanced quality of place
Reduced health and well-being expenditure
Enhanced land and biodiversity management
Reduced flood risk
Climate change adaptation and mitigation
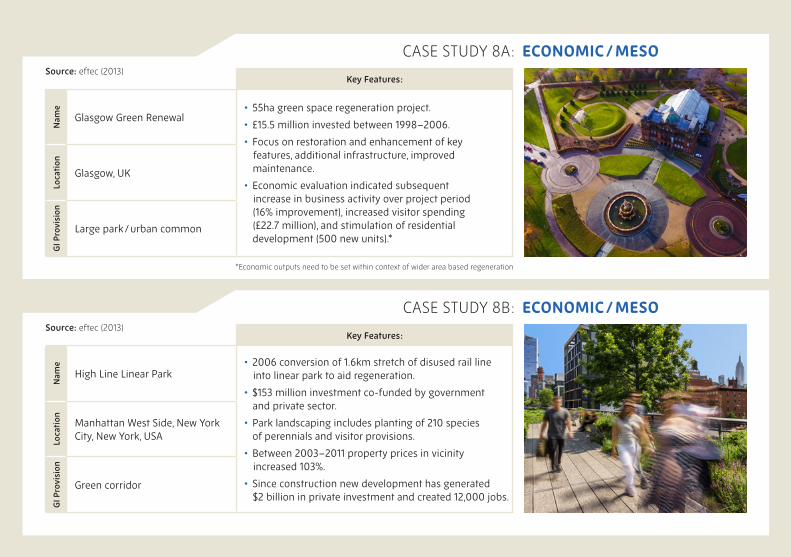
CASE STUDY 8A : ECONOMIC / MESO
CASE STUDY 8B : ECONOMIC / MESO
Key Features :
Nam
e
Glasgow Green Renewal• 55ha green space regeneration project.
• £15.5 million invested between 1998–2006.
• Focus on restoration and enhancement of key features, additional infrastructure, improved maintenance.
• Economic evaluation indicated subsequent increase in business activity over project period (16% improvement), increased visitor spending (£22.7 million), and stimulation of residential development (500 new units).*
Loca
tion
Glasgow, UK
GI P
rovi
sion
Large park / urban common
Key Features :
Nam
e
High Line Linear Park• 2006 conversion of 1.6km stretch of disused rail line
into linear park to aid regeneration.
• $153 million investment co-funded by government and private sector.
• Park landscaping includes planting of 210 species of perennials and visitor provisions.
• Between 2003–2011 property prices in vicinity increased 103%.
• Since construction new development has generated $2 billion in private investment and created 12,000 jobs.
Loca
tion
Manhattan West Side, New York City, New York, USA
GI P
rovi
sion
Green corridor
*Economic outputs need to be set within context of wider area based regeneration
Source: eftec (2013)
Source: eftec (2013)
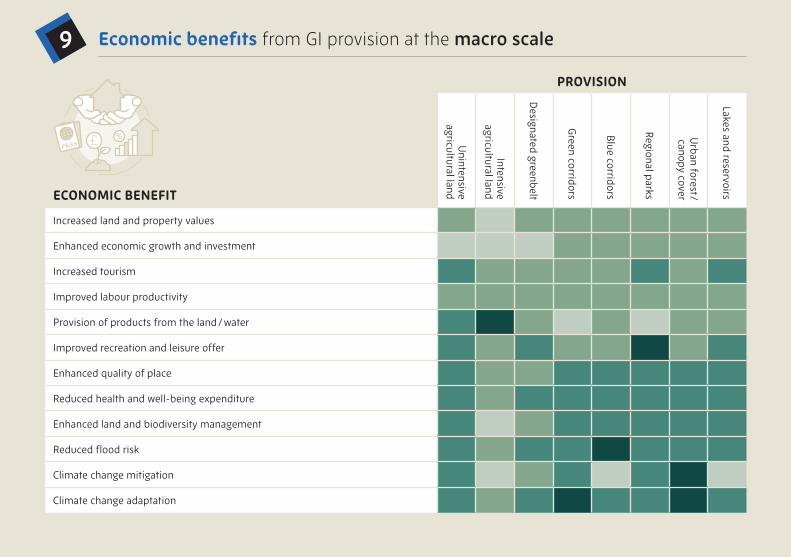
Economic benefits from GI provision at the macro scale9
ECONOMIC BENEFIT
PROVISION
Unintensive
agricultural land
Intensive agricultural land
Designated greenbelt
Green corridors
Blue corridors
Regional parks
Urban forest /
canopy cover
Lakes and reservoirs
Increased land and property values
Enhanced economic growth and investment
Increased tourism
Improved labour productivity
Provision of products from the land / water
Improved recreation and leisure offer
Enhanced quality of place
Reduced health and well-being expenditure
Enhanced land and biodiversity management
Reduced flood risk
Climate change mitigation
Climate change adaptation
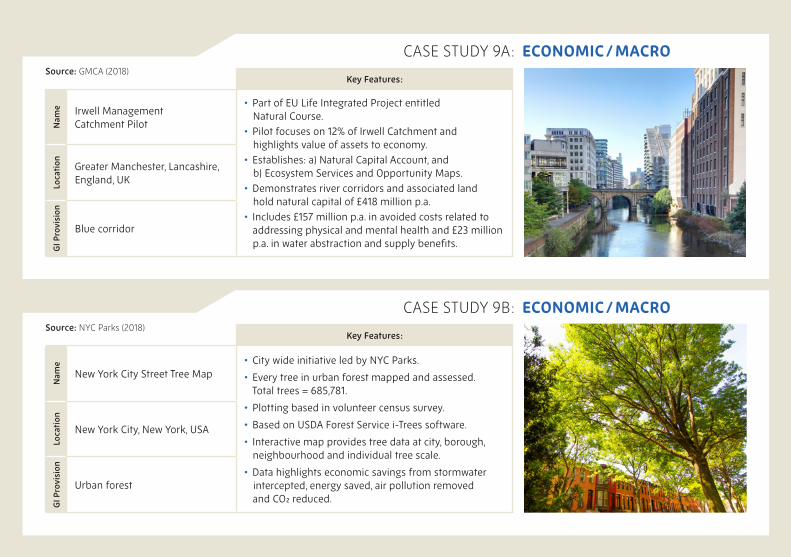
CASE STUDY 9A : ECONOMIC / MACRO
CASE STUDY 9B : ECONOMIC / MACRO
Key Features :
Nam
e Irwell Management Catchment Pilot
• Part of EU Life Integrated Project entitled Natural Course.
• Pilot focuses on 12% of Irwell Catchment and highlights value of assets to economy.
• Establishes: a) Natural Capital Account, and b) Ecosystem Services and Opportunity Maps.
• Demonstrates river corridors and associated land hold natural capital of £418 million p.a.
• Includes £157 million p.a. in avoided costs related to addressing physical and mental health and £23 million p.a. in water abstraction and supply benefits.
Loca
tion
Greater Manchester, Lancashire, England, UK
GI P
rovi
sion
Blue corridor
Key Features :
Nam
e
New York City Street Tree Map• City wide initiative led by NYC Parks.
• Every tree in urban forest mapped and assessed. Total trees = 685,781.
• Plotting based in volunteer census survey.
• Based on USDA Forest Service i-Trees software.
• Interactive map provides tree data at city, borough, neighbourhood and individual tree scale.
• Data highlights economic savings from stormwater intercepted, energy saved, air pollution removed and CO2 reduced.
Loca
tion
New York City, New York, USA
GI P
rovi
sion
Urban forest
Source: GMCA (2018)
Source: NYC Parks (2018)
References
ARUP (2017) Fitzpark, Windmill Street: Monitoring Report, ARUP, London, UK.
Brenner, K. (2010) The Metropolitan Field Guide, 21 April 2010.
Commission for Architecture and the Built Environment (CABE) Space (2005) Does Money Grow on Trees? CABE Space, Welwyn Garden City, UK.
Cross, S. (2010) Innovative sustainable ‘skip garden’ celebrates first anniversary, The Guardian, 30 July 2010.
Durney, J. (2016) Green Infrastructure and Housing Development: A Report to the Ecosystems Knowledge Network (EKN), EKN Oxford, UK.
Eftec (2013) Green Infrastructure’s Contribution to Economic Growth: A Review, Final Report for DEFRA and Natural England, eftec, London, UK.
Greater Manchester Combined Authority (GMCA) (2018) Irwell Management Catchment: Natural Capital Account and Ecosystem Services Opportunity Mapping, Natural Course, GMCA, Manchester, UK.
Jones, C. (2012) Portland Green Streets, Biophilic Cities Project, Virginia, USA.
Landscape Institute (2013) Green Infrastructure: An Integrated Approach to Land Use, Landscape Institute — A Position Statement, London, UK.
References
Lee Valley Regional Park Authority (LVRPA) (2000) Lee Valley Park Development Framework (draft), LVRPA, Enfield, UK.
Lee Valley Regional Park Authority (LVRPA) (2018) Lee Valley Regional Park Plan, LVRPA, Enfield, UK.
Morely, A., Farrier, A. and Dooris, M. (2017) Propagating Success? The Incredible Edible Model — Final Report. Manchester Metropolitan University, Manchester, UK.
New York City (NYC) Parks (2018) New York City Street Tree Map: Explore and Care for NYC’s Urban Forest, NYC Parks, New York, USA.
Shackall, A. and Walter, R. (2012) Greenspace Design for Health and Wellbeing: Practical Guide, Forestry Commission, Edinburgh, UK.
Tree Pittsburgh (2012) Pittsburgh Urban Forest Master Plan (UFMP), Tree Pittsburgh, Pittsburgh, USA.
Smit, J. (2015) Landscape Case Study: Living wall, National Grid, Warwick. www.HorticultureWeek.co.uk
UK Green Building Council (UKGBC) (2015) Demystifying Green Infrastructure, UKGBC, London
The University of Manchester and University of Sheffield are committed to working with the environment. This leaflet has been printed using:
• FSC (Forest Stewardship Council) recycled paper from 100% post-consumer waste
• 100% renewable energy • Zero water or chemicals
• Zero waste to landfill and no negative carbon impact
• Please recycle after use
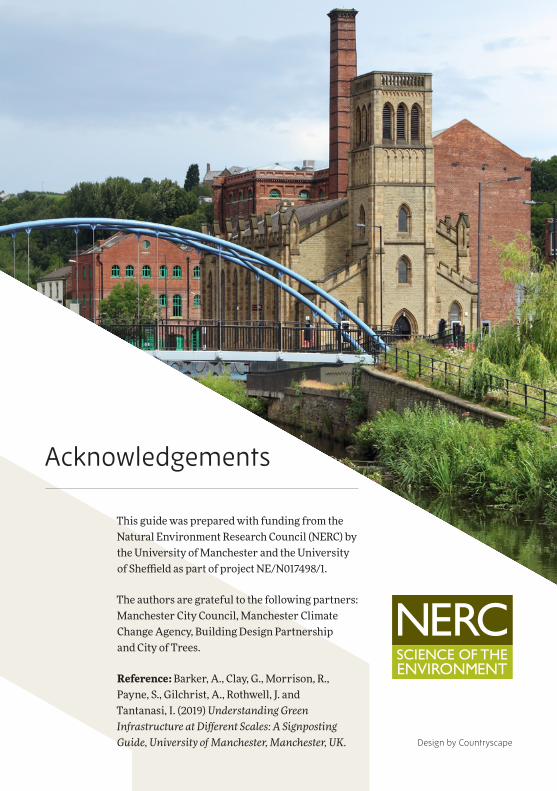
Acknowledgements
This guide was prepared with funding from the Natural Environment Research Council (NERC) by the University of Manchester and the University of Sheffield as part of project NE/N017498/1.
The authors are grateful to the following partners: Manchester City Council, Manchester Climate Change Agency, Building Design Partnership and City of Trees.
Reference : Barker, A., Clay, G., Morrison, R., Payne, S., Gilchrist, A., Rothwell, J. and Tantanasi, I. (2019) Understanding Green Infrastructure at Different Scales: A Signposting Guide, University of Manchester, Manchester, UK. Design by Countryscape