understanding risk and return in private equity - nhh · understanding risk and return in private...
TRANSCRIPT

Understanding Risk and Return in Private Equity
David T. Robinson
J. Rex Fuqua Distinguished ProfessorFuqua School of Business
Duke University
Private Equity for Large Institutional Investors
David T. Robinson Risk and Return in PE 12/15/15 1 / 33

My Background
J. Rex Fuqua Distinguished Professor at Duke University’s Fuqua School of Business, formerhead of the school’s Finance area
Director of Research for Duke’s Innovation & Entrepreneurship Initiative
Education: MBA and PhD from University of Chicago Graduate School of Business. M.Sc. inEconomics from the London School of Economics.
Research and teaching focus: entrepreneurial finance, venture capital and private equity
Member of the National Bureau of Economic Research (Corporate Finance, Productivity andEntrepreneurship)
Member and former Vice-Chair of World Economic Forum’s Global Agenda Council on theFuture of Financing
Advisory board: Private Equity Research Consortium, Private Capital Research Institute
David T. Robinson Risk and Return in PE 12/15/15 2 / 33

Central Questions in Private Equity
How has private equity performed as an asset class?
I How does it compare to public equity
How much do macro factors explain variation in performance?
I Liquidity
I Macro fundamentals
How do the incentives created by limited partner agreements explain variation inperformance?
I What is the relation between fees and performance?
I Waterfalls and exit timing
I Performance and carry distribution rules
David T. Robinson Risk and Return in PE 12/15/15 3 / 33

How has PE performed?
The Fundamental HurdleData
Private equity is by its very nature difficult to study–it’s private!
Public-use data on PE firms is notoriously unreliable
16
Figure 3: U.S. Funds with Performance Data
Panel A: Venture Capital Funds
Panel B: Buyout Funds
4.3. Evidence on performance of U.S. Venture Capital funds
We now turn our attention to the various performance metrics, and how these differ according to
data provider. We start with VC returns, before performing a similar analysis on buyouts.
There are clearly many ways to summarize returns; we first compare Median IRRs by
vintage year for the three data providers. The median has the advantage of minimizing the impact
of outliers which can significantly affect other measures of average performance. Since return
0
20
40
60
80
100
120
140
160
180
1981
1982
1983
1984
1985
1986
1987
1988
1989
1990
1991
1992
1993
1994
1995
1996
1997
1998
1999
2000
2001
2002
2003
2004
2005
2006
2007
2008
TVE Preqin CA
0
10
20
30
40
50
60
1986 1987 1988 1989 1990 1991 1992 1993 1994 1995 1996 1997 1998 1999 2000 2001 2002 2003 2004 2005 2006 2007 2008
TVE Preqin CA
Source: Harris, Jenkinson, Kaplan and Stücke
To make headway, we need access to LP-level cash-flow data
David T. Robinson Risk and Return in PE 12/15/15 4 / 33

How has PE performed?
DataProvided to us by a large anonymous institutional LP.
Management fees, carried interest, GP ownership (capital commitments), andquarterly cash flows.
Funds raised between 1984-2009, with cash flows to Q2 2010.
Bona fide funds. No co-investment vehicles.
All Funds Venture Capital BuyoutNumber of Funds 837 295 542Fraction of 1st Funds 0.30 0.25 0.32Fraction of 2nd Funds 0.24 0.26 0.23Fraction of 3rd Funds 0.16 0.15 0.16
Total Committed Capital $596,843 $61,358 $535,485Total LP Capital $585,745 $60,469 $525,276Total GP Capital $11,088 $879 $10,209
% of VE U.S. universe 34.4% 15.9% 55.7%
Mean Fund Size ($M) 713.06 207.96 987.98
David T. Robinson Risk and Return in PE 12/15/15 5 / 33

How has PE performed? How Does it Compare to Public Equity?
Average PerformanceKey Findings
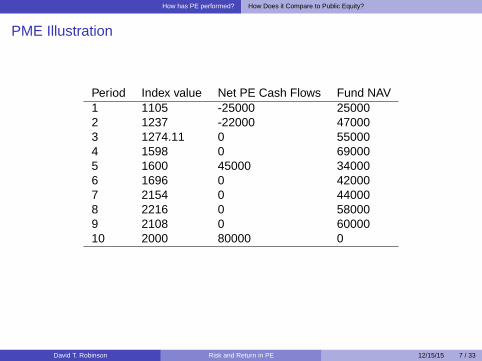
We measure relative performance using a Public Market Equivalent (PME)
I The ratio of the present value of distributions to the present value of capital callsI Discount rate is the realized public market index chosen–in our case the S&PI This compares the return that could be earned on the called capital, were it invested in
the index, with the returns earned in PEI It is the α on PE–the abnormal performance of the asset class–assuming that the β of
PE is one.
Key findings:
I Buyout exceeds public index by about 18%I High dispersion in performance: the top quartile in buyout has outperformed public
index by almost 50%, the bottom quartile underperforms dramaticallyI On a size-weighted basis, Venture has underperformedI Even the top end of the distribution in VC has underperformed
Harris, Jenkinson and Kaplan (2014) have reported similar findings using evenlarger databases
David T. Robinson Risk and Return in PE 12/15/15 6 / 33
How has PE performed? How Does it Compare to Public Equity?
PME Illustration
Period Index value Net PE Cash Flows Fund NAV1 1105 -25000 250002 1237 -22000 470003 1274.11 0 550004 1598 0 690005 1600 45000 340006 1696 0 420007 2154 0 440008 2216 0 580009 2108 0 6000010 2000 80000 0
IRR 17%PME 1.69
David T. Robinson Risk and Return in PE 12/15/15 7 / 33

How has PE performed? How Does it Compare to Public Equity?
Average PerformanceDigging Deeper
Equally weighted: Size weighted:All Funds Venture Buyout All Funds Venture Buyout(n=560) (n=192) (n=368) (n=560) (n=192) (n=368)
IRRMean 0.11 0.09 0.12 0.09 -0.07 0.12Median 0.07 0.02 0.10 0.11 -0.03 0.13St. Dev. 0.36 0.47 0.28 0.27 0.41 0.2425th %ile -0.03 -0.08 -0.01 0.00 -0.11 0.0475th %ile 0.20 0.16 0.22 0.19 0.05 0.19
S&P PMEMean 1.13 1.03 1.18 1.14 0.84 1.18Median 1.01 0.82 1.09 1.05 0.75 1.12St. Dev. 0.72 0.95 0.56 0.47 0.65 0.4225th %ile 0.70 0.52 0.82 0.87 0.51 0.9175th %ile 1.41 1.13 1.46 1.42 0.94 1.44
David T. Robinson Risk and Return in PE 12/15/15 8 / 33

Central Questions in Private Equity
How has private equity performed as an asset class?
I How does it compare to public equity
How much do macro factors explain variation in performance?
I Liquidity
I Macro fundamentals
How do the incentives created by limited partner agreements explain variation inperformance?
I What is the relation between fees and performance?
I Waterfalls and exit timing
I Performance and carry distribution rules
David T. Robinson Risk and Return in PE 12/15/15 9 / 33

How much do macro factors explain?
Possible Concerns/Explanations
Leverage: What about the fact that the β of PE investments might not be 1?
I To check this, we recalculated our PME in a way that allowed us to assume that therelevant index was a levered position in the market.
I We also replaced the S&P 500 with indices that were more closely tailored to the natureof the underlying investments.
Liquidity: Tying up capital for long periods of time creates broad concerns aboutliquidity
I PE absorbs liquidity in market downturns and releases liquidity in market upturns,especially VC
I But the overall sensitivity of calls/distributions to market conditions is actually not thatstrong
David T. Robinson Risk and Return in PE 12/15/15 10 / 33

How much do macro factors explain? Leverage
Main ResultsVarying β for Buyout
11.
21.
41.
61.
8PM
E
0 100 200 300Beta
(mean) vc_pme (mean) buy_pme(mean) re_pme
PME/Beta Relation
David T. Robinson Risk and Return in PE 12/15/15 11 / 33

How much do macro factors explain? Leverage
Main ResultsChanging the Reference Index
0
0.2
0.4
0.6
0.8
1
1.2
1.4
1.6
1984 1985 1986 1987 1988 1989 1990 1991 1992 1993 1994 1995 1996 1997 1998 1999 2000 2001 2002 2003 2004 2005 2006 2007 2008 2009
S&P 500 PME Tailored PME
David T. Robinson Risk and Return in PE 12/15/15 12 / 33

How much do macro factors explain? Liquidity
Why does PE generate abnormal returns?Thinking about Liquidity
Vintage year diversification cuts cash flow volatility by more than half
Buyout Funds Venture Capital FundsWeighting: Equal Commitment Equal Commitment
No diversification 11.57 N/A 11.99 N/ADiversification into fund age buckets 8.46 8.91 9.11 9.39Full diversification 4.54 3.38 4.09 3.36
David T. Robinson Risk and Return in PE 12/15/15 13 / 33

How much do macro factors explain? Liquidity
Why does PE generate abnormal returns?A Different Take on Liquidity
Performance Differences based on Propensity to Call Capital in Down MarketsBuyout Funds Venture Capital Funds
IRR TVPI PME IRR TVPI PME
High Propensity 0.14 1.72 1.27 0.13 1.58 1.21(0.02) (0.07) (0.04) (0.07) (0.29) (0.18)
Low Propensity 0.05 1.36 1.12 0.03 1.19 0.90(0.02) (0.06) (0.03) (0.06) (0.17) (0.13)
Difference 0.09*** 0.36*** 0.15*** 0.09 0.39* 0.31*(0.03) (0.10) (0.05) (0.06) (0.22) (0.15)
David T. Robinson Risk and Return in PE 12/15/15 14 / 33

How much do macro factors explain? Macro fundamentals
Private Equity and Macro Conditions
PE Cash flows vary predictably with business conditions
But only a small fraction of cash flow volatility can be explained; most isidiosyncratic
Controlling for J-curve effects delivers most of the explanatory power
Principal Components of six macro variables do about as well: P/D, Yield Spread,# of IPOs, # of M&A, Buyout and Venture Capital Industry Fundraising dollars
David T. Robinson Risk and Return in PE 12/15/15 15 / 33

How much do macro factors explain? Macro fundamentals
Private Equity and Macro Conditions
Columns (1)-(5): Buyout Funds Columns (6)-(10):Venture Capital Funds(1) (2) (3) (4) (5) (6) (7) (8) (9) (10)
Panel A: Dependent variable is net cash flow as percentage of committed capital
ln(P/D) 1.36*** 1.28*** 4.24** 4.12**(0.46) (0.47) (1.74) (1.72)
ln(Yield Spread) -0.62*** -0.81**(0.11) (0.32)
Princ. Comp. 1 0.33*** 0.86**(0.11) (0.39)
Princ. Comp. 2 -0.44*** -0.72***(0.09) (0.23)
Fund Age FE Yes Yes Yes Yes Yes Yes Yes Yes Yes YesTime FE No Yes No No No No Yes No No NoObservations 21,687 21,687 21,684 21,684 21,684 13,032 13,032 13,029 13,029 13,029Adjusted R2 0.072 0.079 0.072 0.074 0.075 0.038 0.075 0.043 0.045 0.046
David T. Robinson Risk and Return in PE 12/15/15 16 / 33

Central Questions in Private Equity
How has private equity performed as an asset class?
I How does it compare to public equity
How much do macro factors explain variation in performance?
I Liquidity
I Macro fundamentals
How do the incentives created by limited partner agreements explain variation inperformance?
I What is the relation between fees and performance?
I Waterfalls and exit timing
I Performance and carry distribution rules
David T. Robinson Risk and Return in PE 12/15/15 17 / 33

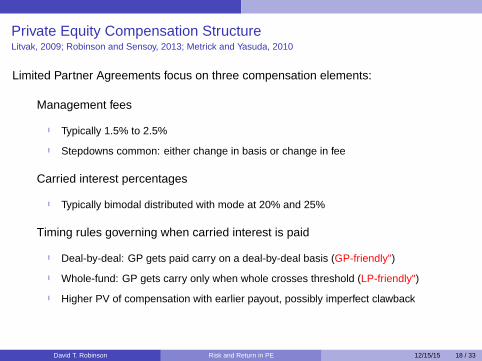
Private Equity Compensation StructureLitvak, 2009; Robinson and Sensoy, 2013; Metrick and Yasuda, 2010
Limited Partner Agreements focus on three compensation elements:
1 Management fees
I Typically 1.5% to 2.5%
I Stepdowns common: either change in basis or change in fee
2 Carried interest percentages
I Typically bimodal distributed with mode at 20% and 25%
3 Timing rules governing when carried interest is paid
I Deal-by-deal: GP gets paid carry on a deal-by-deal basis
(“GP-friendly")
I Whole-fund: GP gets carry only when whole crosses threshold
(“LP-friendly")
I Higher PV of compensation with earlier payout, possibly imperfect clawback
David T. Robinson Risk and Return in PE 12/15/15 18 / 33

Private Equity Compensation StructureLitvak, 2009; Robinson and Sensoy, 2013; Metrick and Yasuda, 2010
Limited Partner Agreements focus on three compensation elements:
1 Management fees
I Typically 1.5% to 2.5%
I Stepdowns common: either change in basis or change in fee
2 Carried interest percentages
I Typically bimodal distributed with mode at 20% and 25%
3 Timing rules governing when carried interest is paid
I Deal-by-deal: GP gets paid carry on a deal-by-deal basis (“GP-friendly")
I Whole-fund: GP gets carry only when whole crosses threshold
(“LP-friendly")
I Higher PV of compensation with earlier payout, possibly imperfect clawback
David T. Robinson Risk and Return in PE 12/15/15 18 / 33
Private Equity Compensation StructureLitvak, 2009; Robinson and Sensoy, 2013; Metrick and Yasuda, 2010
Limited Partner Agreements focus on three compensation elements:
1 Management fees
I Typically 1.5% to 2.5%
I Stepdowns common: either change in basis or change in fee
2 Carried interest percentages
I Typically bimodal distributed with mode at 20% and 25%
3 Timing rules governing when carried interest is paid
I Deal-by-deal: GP gets paid carry on a deal-by-deal basis (“GP-friendly")
I Whole-fund: GP gets carry only when whole crosses threshold (“LP-friendly")
I Higher PV of compensation with earlier payout, possibly imperfect clawback
David T. Robinson Risk and Return in PE 12/15/15 18 / 33

Can micro factors explain performance? Fees and Performance
Two views on Fees and Performance
1: GP compensation is too high. Incentives are inadequate because of excessivefixed fees and insufficient skin in the game. Especially in booms and amonglarge funds.
I LPs lack sophistication and contract suboptimally (Phalippou, 2009).
I If so, higher compensation and lower ownership should result in worse net-of-feeperformance.
2: GP-LP contracts are driven by market forces, reflect entry conditions.
I Compensation, ownership will be either unrelated or positively related to net-of-feeperformance, depending on how LPs add value.
I Does not imply agency problems aren’t important, just that contracts deal with them.
David T. Robinson Risk and Return in PE 12/15/15 19 / 33

Can micro factors explain performance? Fees and Performance
Management Fees & Carry Over the Funding CycleWhat happens to compensation when money rushes in?
Dependent Variable: PV Lifetime Fees (% of fund size) Carried Interest (%)(1) (2) (3) (4) (5) (6) (7) (8)
ln(Industry Flows) 0.58*** 0.71*** 0.02 0.02(0.18) (0.16) (0.05) (0.03)
ln(Fund Size) -0.85*** -0.69** -1.15*** -1.12*** 0.35*** 0.32*** 0.07 0.13*(0.31) (0.29) (0.15) (0.16) (0.12) (0.12) (0.06) (0.08)
ln(Fund No.) 0.87* 0.70* 0.22 0.34 0.58*** 0.63*** -0.16 -0.18(0.47) (0.41) (0.33) (0.33) (0.20) (0.22) (0.15) (0.16)
Sample VC VC BO BO VC VC BO BOVintage Year FE? No Yes No Yes No Yes No YesObservations 264 264 491 491 295 295 542 542R-squared 0.08 0.17 0.18 0.22 0.17 0.20 0.01 0.08
David T. Robinson Risk and Return in PE 12/15/15 20 / 33

Can micro factors explain performance? Fees and Performance
Compensation and PerformanceKey Takeaways
Little support for the idea that higher compensation or lower ownership areassociated with lower returns to LPs.
Most relations insignificant, but higher carry and lower ownership buyout fundsactually have higher net-of-fee performance.
Inconsistent with the inefficiency view with one exception: Some evidence thathigh-carry VC funds underperform.
Conclusions are robust to:
I Changing the benchmark portfolio used to compute the PME
I Lots of additional statistical controls and corrections.
Suggests that GPs with higher fees/carry earn them in the form of higher grossreturns, so net returns do not suffer.
David T. Robinson Risk and Return in PE 12/15/15 21 / 33

Can micro factors explain performance?
Central Questions in Private Equity
How has private equity performed as an asset class?
I How does it compare to public equity
How much do macro factors explain variation in performance?
I Liquidity
I Macro fundamentals
How do the incentives created by limited partner agreements explain variation inperformance?
I What is the relation between fees and performance?
I Waterfalls and exit timing
I Performance and carry distribution rules
David T. Robinson Risk and Return in PE 12/15/15 22 / 33

Can micro factors explain performance? Contract terms and performance
Waterfalls
Waterfalls are superficially beneficial to LPs
I The LP gets paid first: the GP gets paid only after they have returned invested capital,fees, and a preferred return
But the catchup provisions distort incentives
I GP may have an incentive to exit investments just to earn all the catchup!
Incentives are especially acute for older funds
David T. Robinson Risk and Return in PE 12/15/15 23 / 33

Can micro factors explain performance? Contract terms and performance
Liquidations Cluster Around WaterfallsA Gross Return Approach
Threshold:Total Distributions Exceed
108% of Gross Paid In Capital1-yr. Window All Quarters Only Distributions
Before Threshold 6.83 2.25 12.30(n=1660) (n=26,784) (n=922)
After Threshold 20.43 5.44 29.42(n=1660) (n=10,113) (n=1,153)
t-test of Difference 10.656 19.188 8.696
David T. Robinson Risk and Return in PE 12/15/15 24 / 33

Can micro factors explain performance? Contract terms and performance
Central Questions in Private Equity
How has private equity performed as an asset class?
I How does it compare to public equity
How much do macro factors explain variation in performance?
I Liquidity
I Macro fundamentals
How do the incentives created by limited partner agreements explain variation inperformance?
I What is the relation between fees and performance?
I Waterfalls and exit timing
I Performance and carry distribution rules
David T. Robinson Risk and Return in PE 12/15/15 25 / 33

Can micro factors explain performance? Contract terms and performance
Whole Fund vs. Deal-by-Deal Contracts
Are LPs better off with LP-friendly schemes or with GP-friendly schemes?
Ceteris Parabus: of course they are
I Randomly rewrite contracts to make them more LP-friendly but don’t change effort,incentives or selection and of course LPs are better off.
But what if Ceteris isn’t Parabus?
I Differences in bargaining power may reflect differences in underlying skill
I GP-friendly contracts may induce GPs to make different choices
F Sharper market-timing incentives
F Changing risk preferences conditional on “money in the pocket"
F Grandstanding to signal GP type
David T. Robinson Risk and Return in PE 12/15/15 26 / 33
Can micro factors explain performance? Contract terms and performance
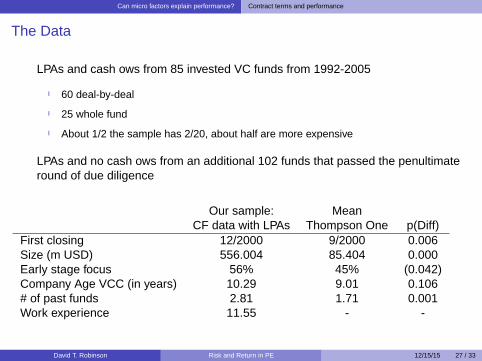
The Data
LPAs and cash flows from 85 invested VC funds from 1992-2005
I 60 deal-by-deal
I 25 whole fund
I About 1/2 the sample has 2/20, about half are more expensive
LPAs and no cash flows from an additional 102 funds that passed the penultimateround of due diligence
Our sample: MeanCF data with LPAs Thompson One p(Diff)
First closing 12/2000 9/2000 0.006Size (m USD) 556.004 85.404 0.000Early stage focus 56% 45% (0.042)Company Age VCC (in years) 10.29 9.01 0.106# of past funds 2.81 1.71 0.001Work experience 11.55 - -
David T. Robinson Risk and Return in PE 12/15/15 27 / 33

Can micro factors explain performance? Contract terms and performance
The Findings in a Nutshell
Gross Net Notes:Raw 0.407 0.329 Table 3History 0.406 0.357 Table 6, Column 1Vintage 0.322 0.252 Table 6, Column 2Contracts 0.277 0.219 Table 6, Column 6
0
0.05
0.1
0.15
0.2
0.25
0.3
0.35
0.4
0.45
Raw History Vintage Contracts
Gross
Net
Additional statistical work suggests that most of this occurs because contractsaffect incentives, not just because better GPs get sweeter contracts
Indeed, we see differences in exit timing consistent with incentives induced by thecontract
David T. Robinson Risk and Return in PE 12/15/15 28 / 33

Can micro factors explain performance? Contract terms and performance
A Closer Look
0.0
1.0
2.0
3de
nsity
BE
0 10 20 30 40 50 60Fund Quarter
Deal-by-deal & Whole-fund Exit Time
David T. Robinson Risk and Return in PE 12/15/15 29 / 33

Can micro factors explain performance? Contract terms and performance
Investment Hangover
0.2
.4.6
.81
CD
F
0 2 4 6 8 10PME of late exits
Cond. on Strong Exits DD Cond. on Strong Exits WF
Late Exits Conditional on Early Exits
David T. Robinson Risk and Return in PE 12/15/15 30 / 33

Can micro factors explain performance? Contract terms and performance
Investment Hangover
0.2
.4.6
.81
CD
F
0 2 4 6 8 10PME of late exits
Cond. on Weak Exits DD Cond. on Weak Exits WF
Late Exits Conditional on Early Exits
David T. Robinson Risk and Return in PE 12/15/15 31 / 33

To Conclude
The best available data indicates that Private Equity has outperformed publicequities by around 2-3% per year over the last 20 years.
I This is almost all coming from buyout.I VC has underperformed on average, except for the 1990s. It is extremely difficult to
gain access to top performing VCs.
Determinants of Fee/CarryI Carried interest goes up for VCs during boom timesI Carry goes up with fund size and experienceI Not so for BuyoutI Holding fund size constant, fees go up during boomsI But fund size doesn’t stay constant during booms, it grows a lot
Do GPs earn their keep?I They seem to. Net-of-fee returns are uncorrelated with fees. Suggests better
performers charge more, but earn more, and thus earn their keepI Contrast this with public intermediated equity investment
Nevertheless: waterfalls, distribution rules, and fee and carry provisions introducemeasurable distortions in behavior
David T. Robinson Risk and Return in PE 12/15/15 32 / 33

For Further Reading
Robinson, David T and Berk Sensoy, “Cyclicality, Performance Measurement and Cash Flow Liquidity in Private Equity,"forthcoming, Journal of Financial Economics
I Contains performance statistics as well as an analysis of liquidity and macro factors.
Harris, Robert, Tim Jenkinson and Steven N. Kaplan, “Private Equity Performance: What Do We Know?" Journal ofFinance, 2014.
I Additional evidence in favor of a PME around 1.8 using an even larger data set.
Robinson, David T and Berk Sensoy, “Do Private Equity Fund Managers Earn their Fees? Compensation, Ownership, andCash Flow Performance," Review of Financial Studies, 26(11): 2760-2797 (November, 2013).
I Shows that net-of-fee returns are uncorrelated with fees, and that waterfalls, fee basis changes, etc., affect behavior.
Hartmann-Wendells, Thomas, Niklas Hüther, David T. Robinson, and Sönke Sievers, “Paying for Performance in PrivateEquity: Evidence from Limited Partner Agreements," working paper, Duke University.
I Shows that carry provisions are correlated with performance and appear to induce distortions in exit behavior.
David T. Robinson Risk and Return in PE 12/15/15 33 / 33