understanding worlds through 30 years of infrared …ridl.cfd.rit.edu/products/publications/sdw/sdw...
TRANSCRIPT
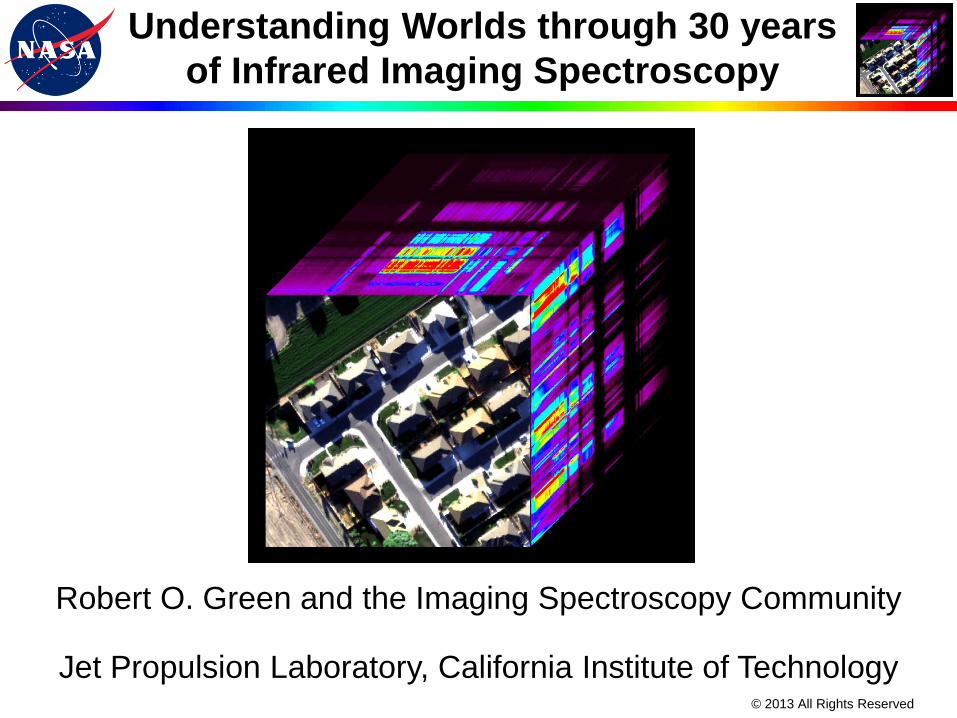
Understanding Worlds through 30 years
of Infrared Imaging Spectroscopy
Robert O. Green and the Imaging Spectroscopy Community
Jet Propulsion Laboratory, California Institute of Technology © 2013 All Rights Reserved

• Remote Sensing or
Remote Measurement
• Imaging Spectroscopy
• Earth Measurements Examples
• Other Planets and the Moon
• Instrument Evolution and
Next Generation Measurements
• Conclusions
Overview

Remote Sensing or
Remote Measurement
?
? ?
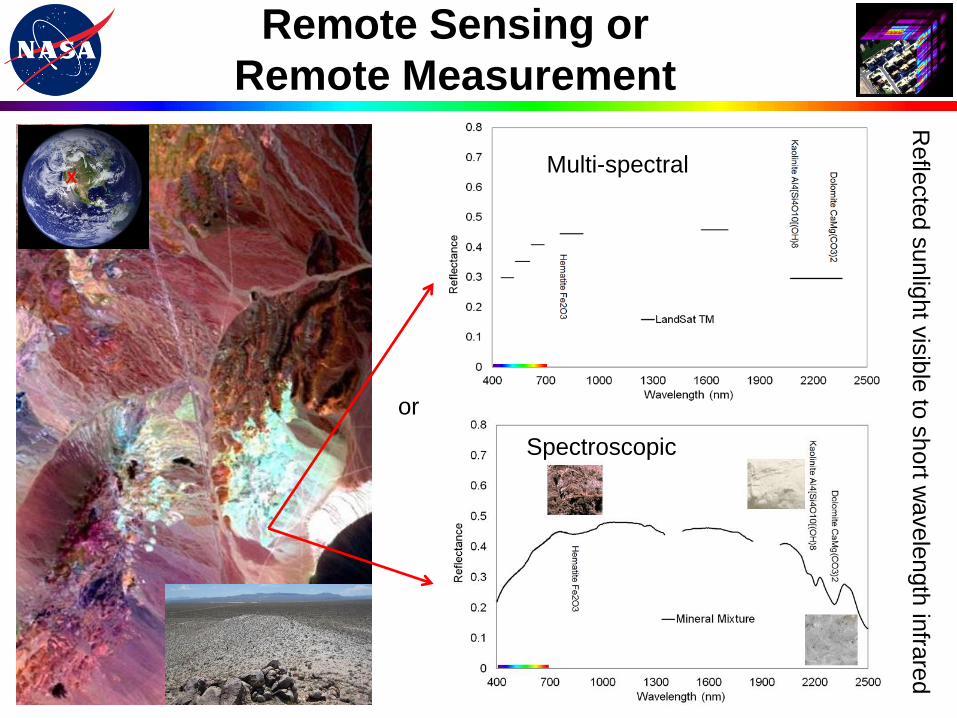
Remote Sensing or
Remote Measurement
Multi-spectral
Spectroscopic
or
X
Refle
cte
d s
unlig
ht v
isib
le to
short w
avele
ngth
infra
red
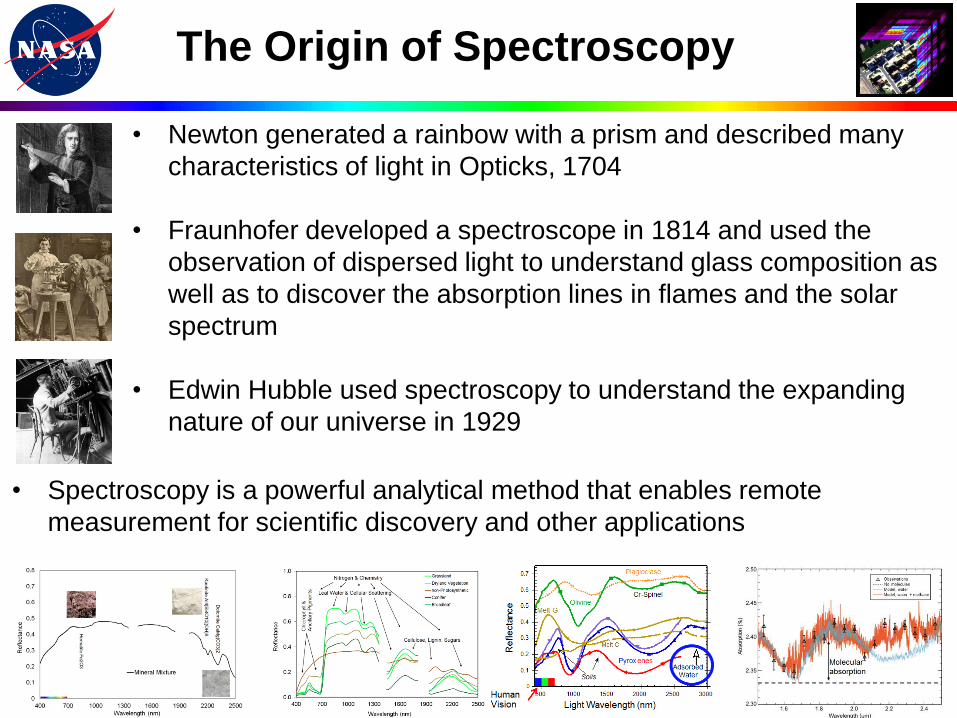
• Newton generated a rainbow with a prism and described many
characteristics of light in Opticks, 1704
• Fraunhofer developed a spectroscope in 1814 and used the
observation of dispersed light to understand glass composition as
well as to discover the absorption lines in flames and the solar
spectrum
• Edwin Hubble used spectroscopy to understand the expanding
nature of our universe in 1929
The Origin of Spectroscopy
• Spectroscopy is a powerful analytical method that enables remote
measurement for scientific discovery and other applications

Imaging Spectroscopy
Early conceptual figure
Requires advanced: detectors, optical designs, computation, etc.
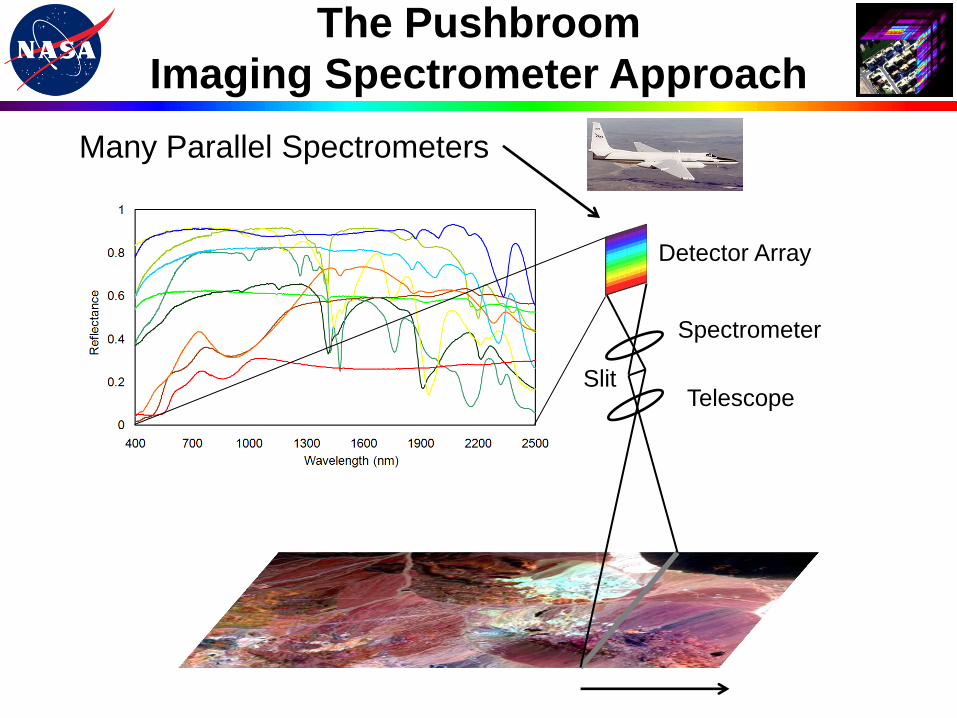
The Pushbroom
Imaging Spectrometer Approach
Spectrometer
Telescope
Detector Array
Slit
Many Parallel Spectrometers
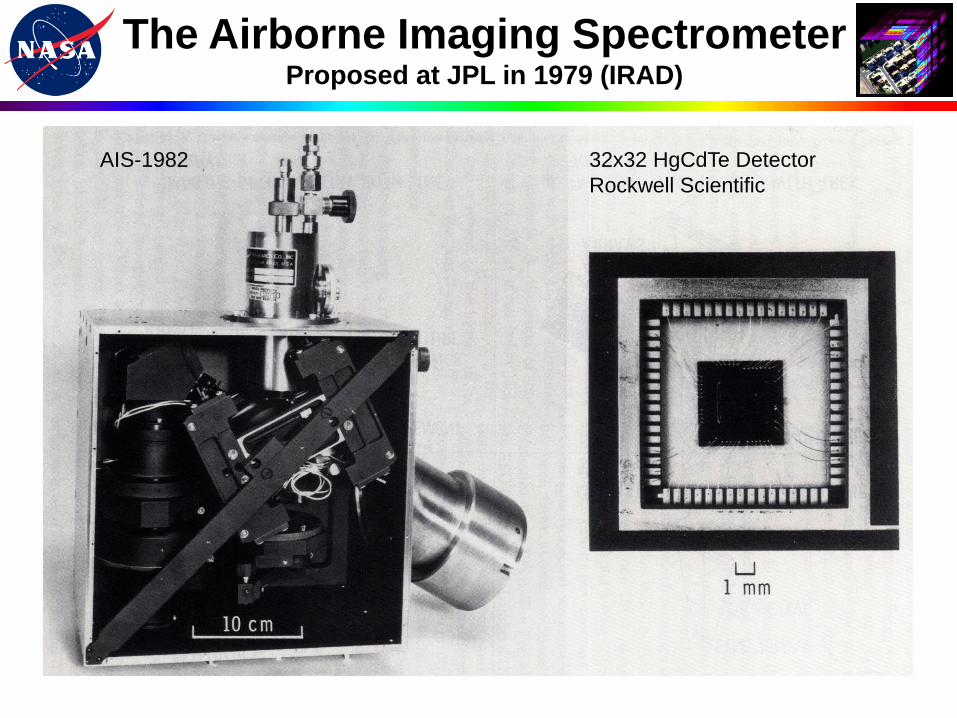
The Airborne Imaging Spectrometer Proposed at JPL in 1979 (IRAD)
AIS-1982 32x32 HgCdTe Detector
Rockwell Scientific
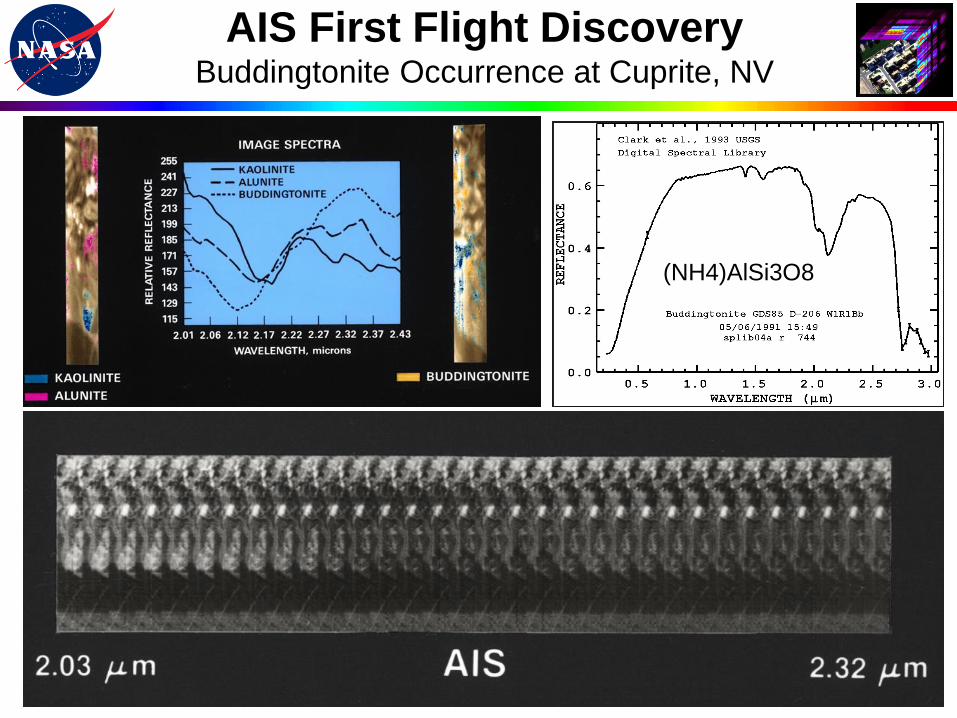
AIS First Flight Discovery Buddingtonite Occurrence at Cuprite, NV
(NH4)AlSi3O8
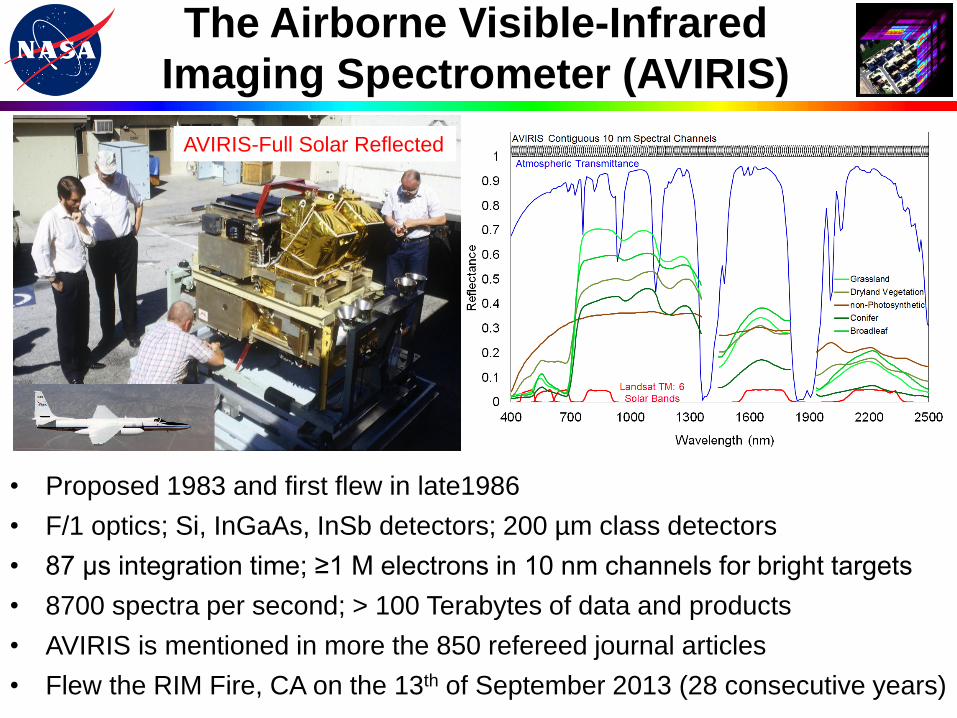
• Proposed 1983 and first flew in late1986
• F/1 optics; Si, InGaAs, InSb detectors; 200 µm class detectors
• 87 µs integration time; ≥1 M electrons in 10 nm channels for bright targets
• 8700 spectra per second; > 100 Terabytes of data and products
• AVIRIS is mentioned in more the 850 refereed journal articles
• Flew the RIM Fire, CA on the 13th of September 2013 (28 consecutive years)
The Airborne Visible-Infrared
Imaging Spectrometer (AVIRIS)
AVIRIS-Full Solar Reflected
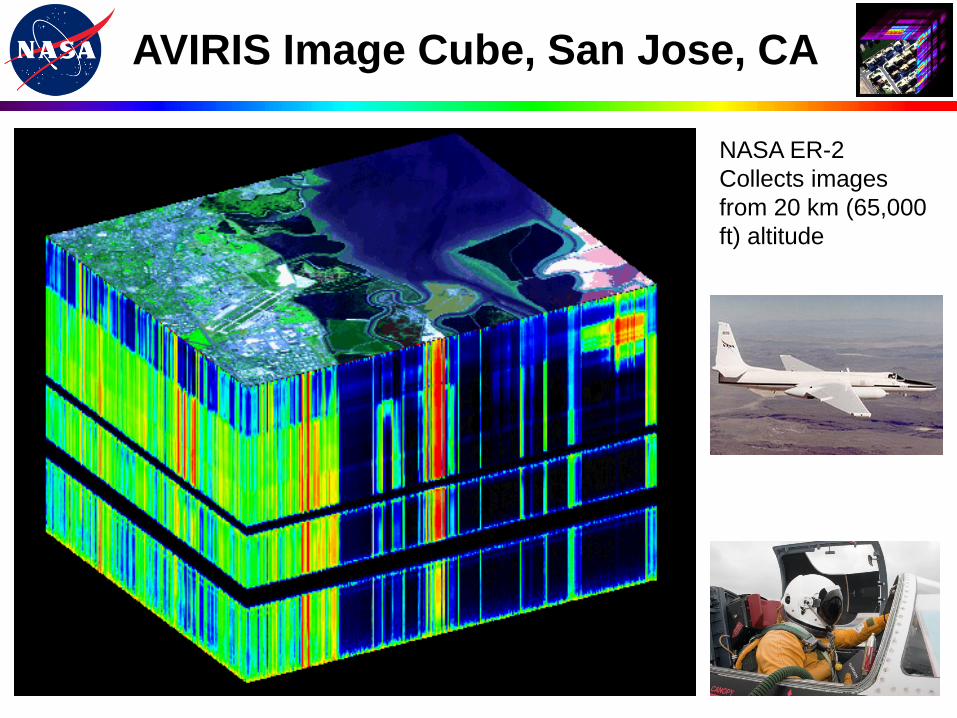
AVIRIS Image Cube, San Jose, CA
NASA ER-2
Collects images
from 20 km (65,000
ft) altitude
Earth Measurement Examples
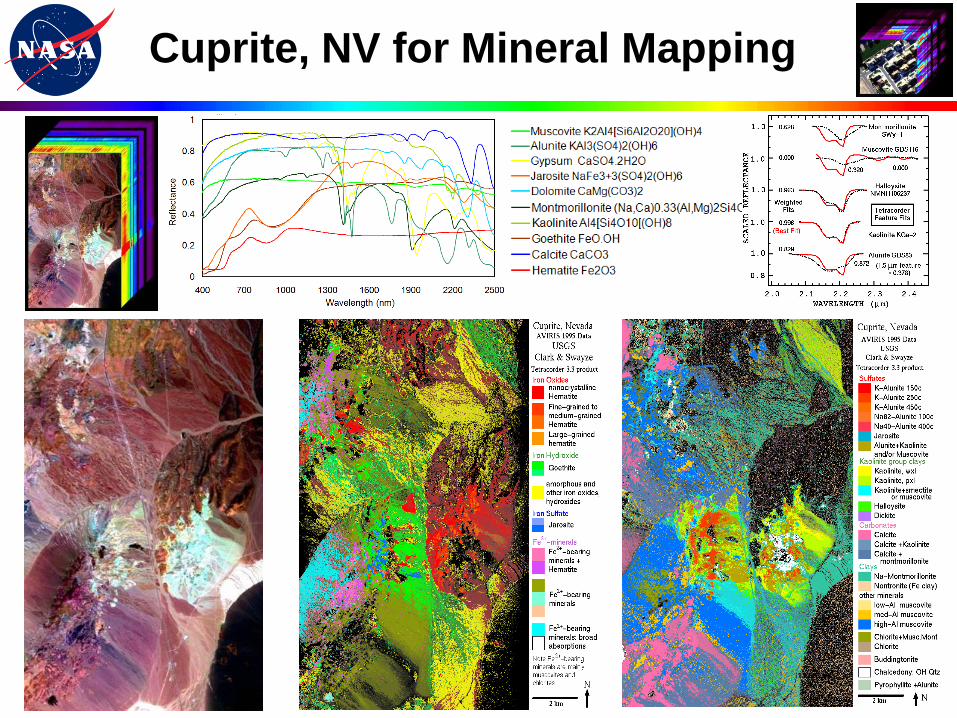
Cuprite, NV for Mineral Mapping
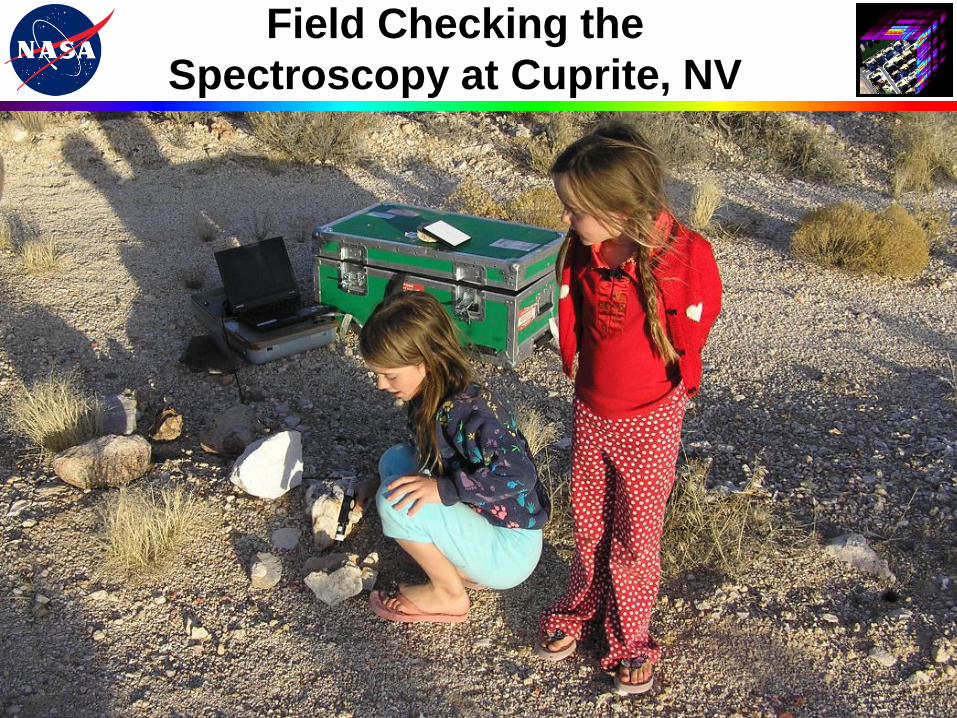
Field Checking the
Spectroscopy at Cuprite, NV
14
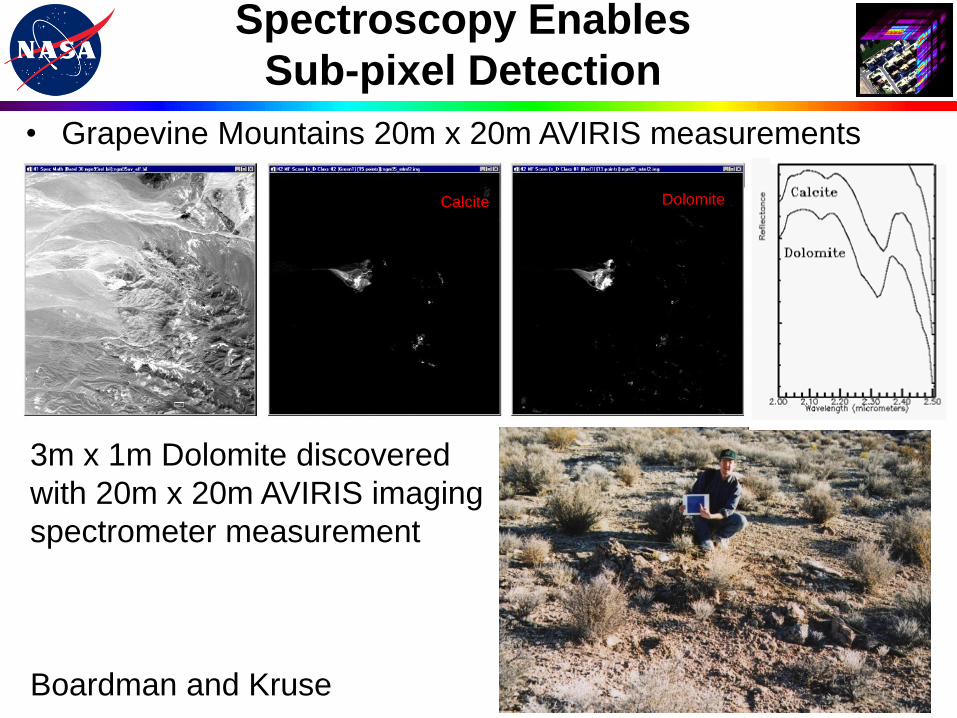
• Grapevine Mountains 20m x 20m AVIRIS measurements
Spectroscopy Enables
Sub-pixel Detection
Calcite Dolomite
3m x 1m Dolomite discovered
with 20m x 20m AVIRIS imaging
spectrometer measurement
Boardman and Kruse
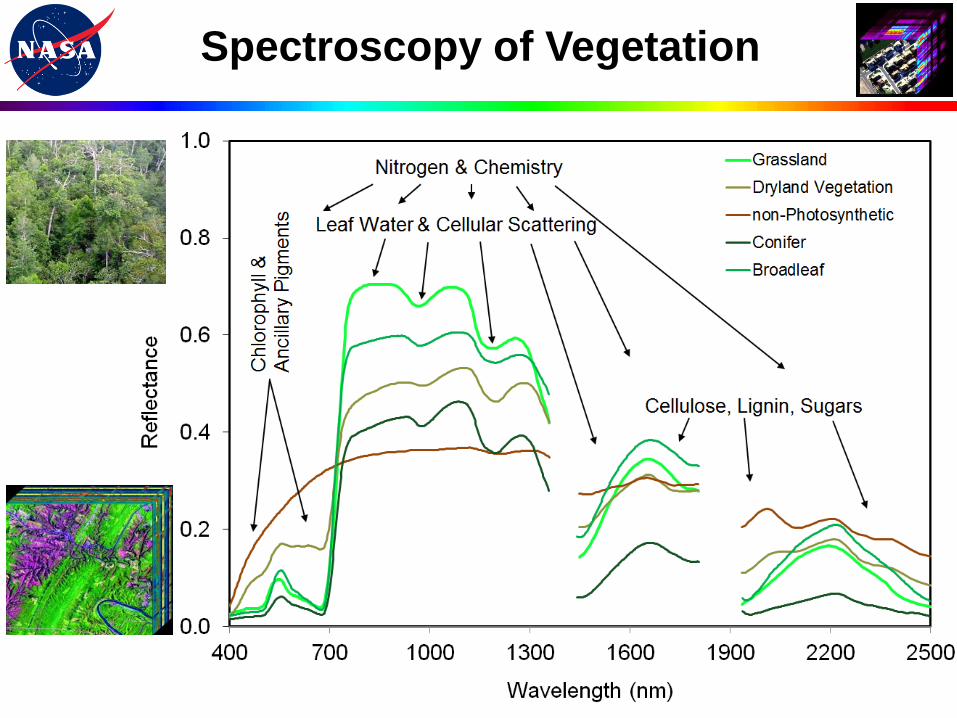
Spectroscopy of Vegetation

Mapping Vegetation Species with Imaging Spectroscopy MESMA Species Type 90% accurate
Species Fractional Cover Quercus agrifolia
Dar Roberts, et al, UCSB
Airborne Imaging Spectroscopy, Santa Barbara, CA
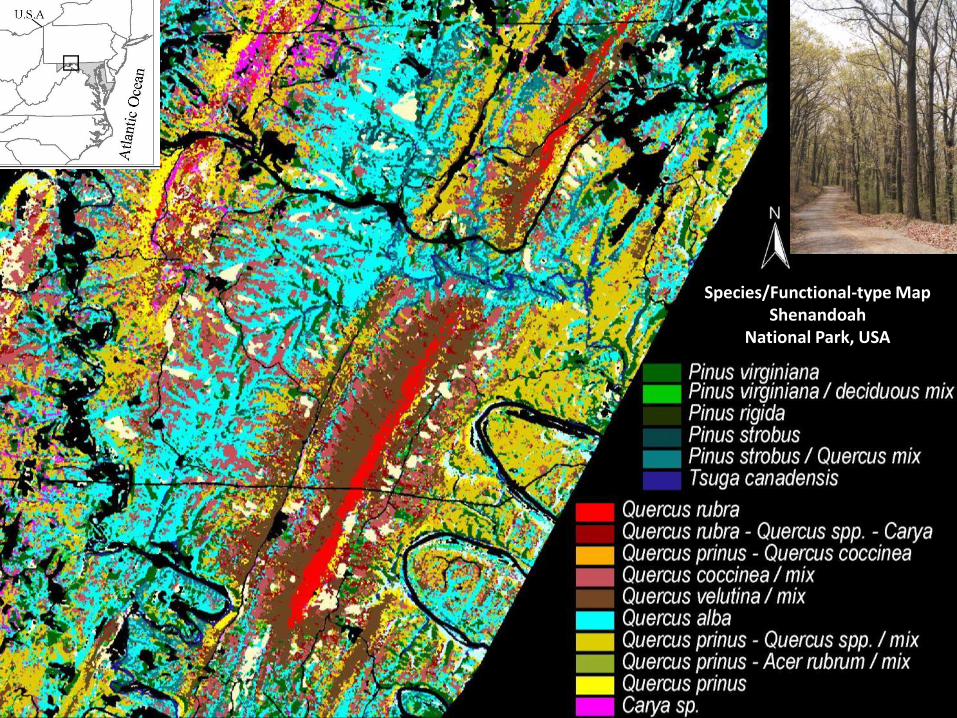
Species/Functional-type Map Shenandoah
National Park, USA
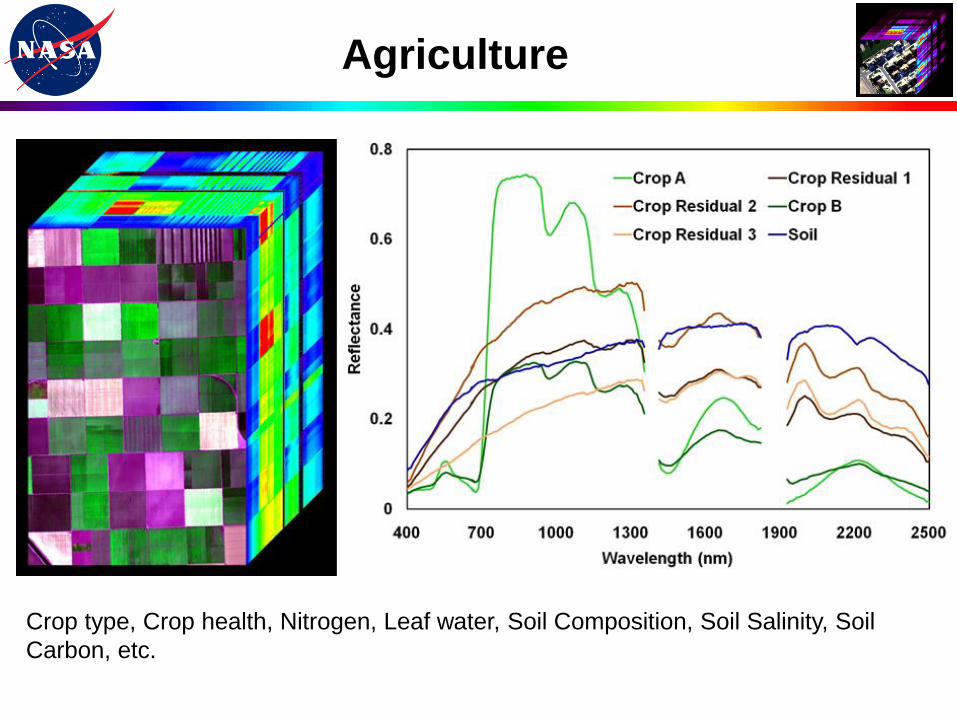
Agriculture
Crop type, Crop health, Nitrogen, Leaf water, Soil Composition, Soil Salinity, Soil
Carbon, etc.
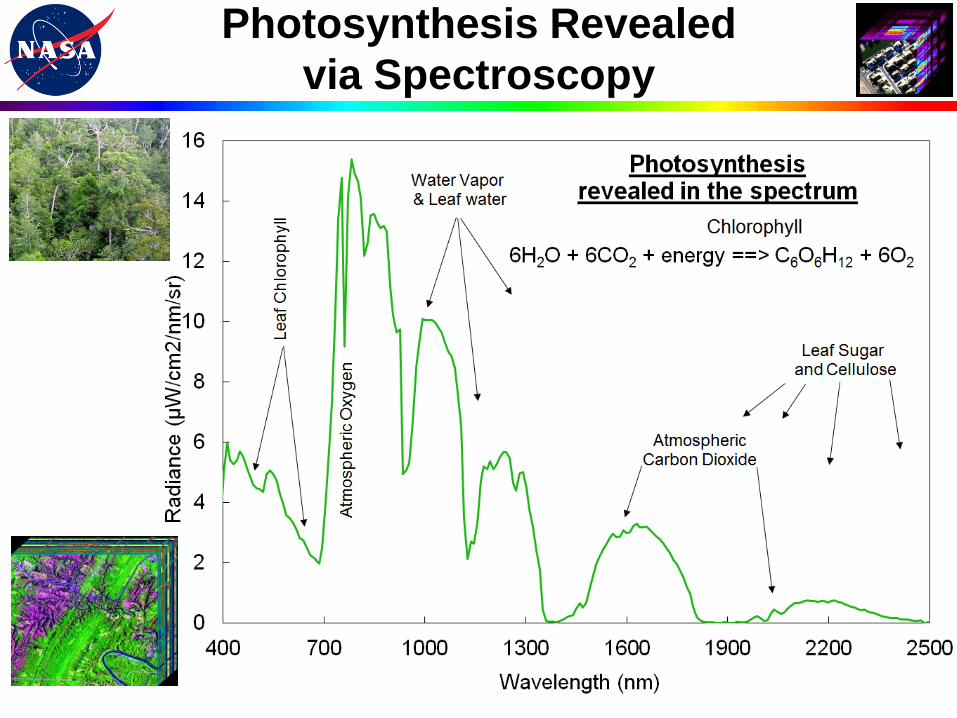
Photosynthesis Revealed
via Spectroscopy
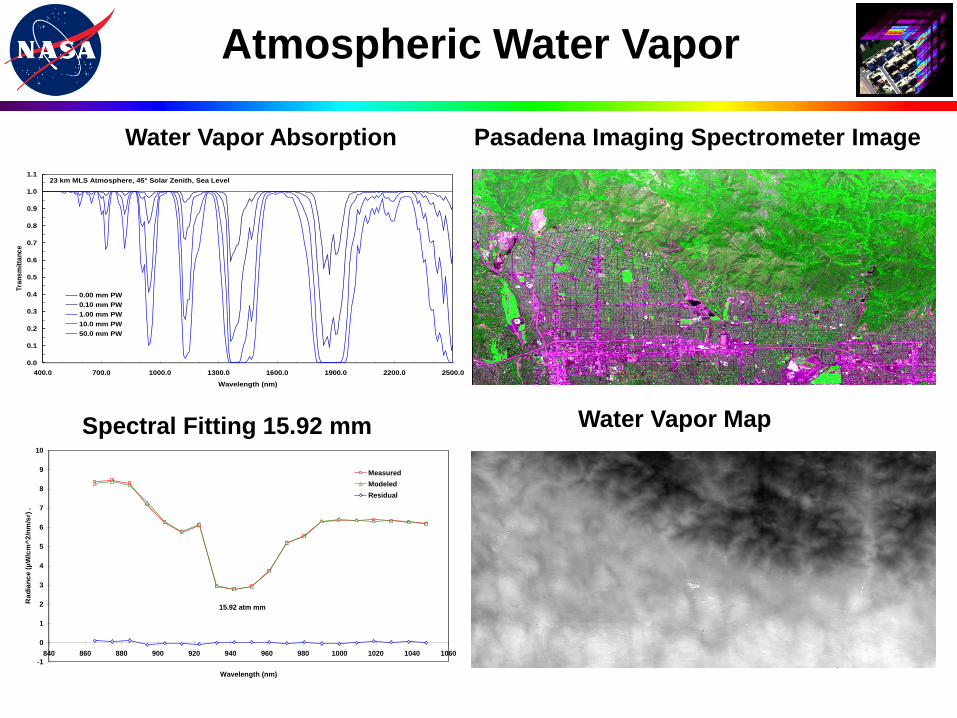
Atmospheric Water Vapor
-1
0
1
2
3
4
5
6
7
8
9
10
840 860 880 900 920 940 960 980 1000 1020 1040 1060
Wavelength (nm)
Ra
dia
nc
e (
µW
/cm
^2
/nm
/sr)
.
Measured
Modeled
Residual
15.92 atm mm
0.0
0.1
0.2
0.3
0.4
0.5
0.6
0.7
0.8
0.9
1.0
1.1
400.0 700.0 1000.0 1300.0 1600.0 1900.0 2200.0 2500.0
Wavelength (nm)
Tra
ns
mit
tan
ce
0.00 mm PW
0.10 mm PW
1.00 mm PW
10.0 mm PW
50.0 mm PW
23 km MLS Atmosphere, 45° Solar Zenith, Sea Level
Spectral Fitting 15.92 mm
Pasadena Imaging Spectrometer Image
Water Vapor Map
Water Vapor Absorption
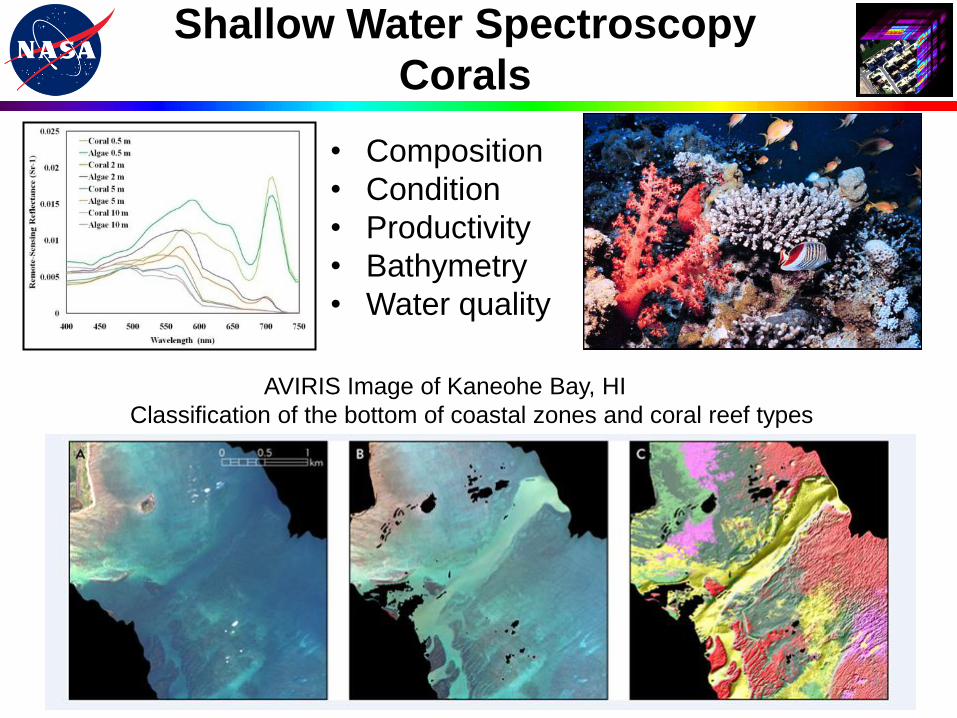
AVIRIS Image of Kaneohe Bay, HI
Classification of the bottom of coastal zones and coral reef types
Shallow Water Spectroscopy
Corals
• Composition
• Condition
• Productivity
• Bathymetry
• Water quality
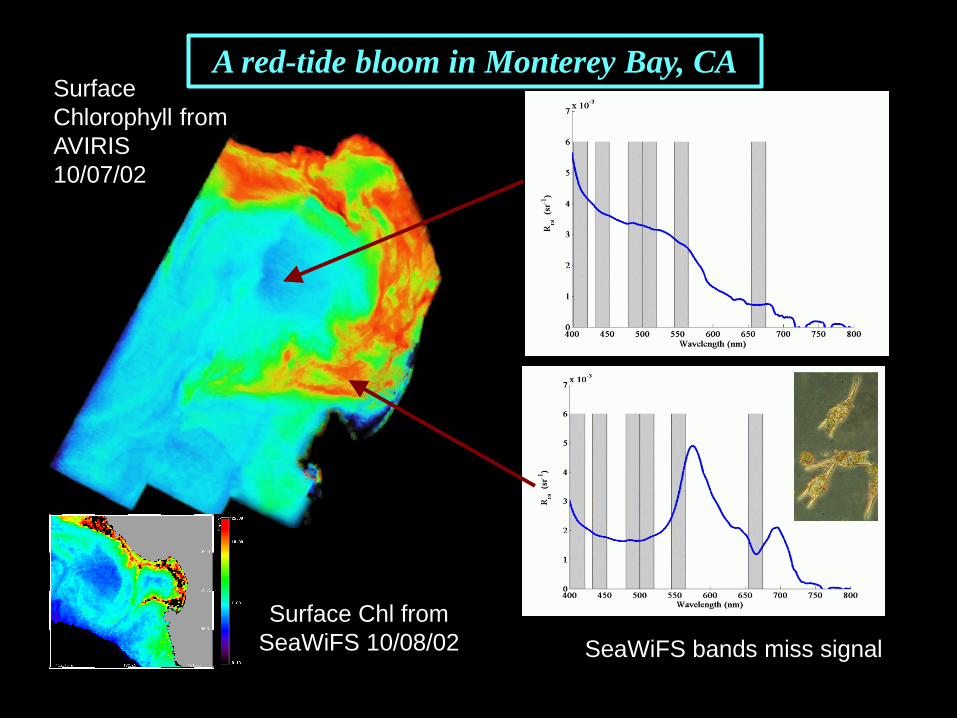
A red-tide bloom in Monterey Bay, CA Surface
Chlorophyll from
AVIRIS
10/07/02
Surface Chl from
SeaWiFS 10/08/02 SeaWiFS bands miss signal

Three Phases of Water
Mount Rainier, WA

Nepal Himalaya
1956
2007
• Water availability
• Melting of the Earth’s glaciers.
Kaspari et al. in prep
Snow and Ice: Albedo, Dust, Melting Upper Colorado River Basin (T. Painter, JPL)
San Juan Mountains, CO
15 June 2011

Fire: Risk, Burning, Severity and
Recovery
0
2
4
6
8
10
12
14
16
18
20
400 700 1000 1300 1600 1900 2200 2500
Wavelength (nm)
Rad
ian
ce(u
W/c
m^2/n
m/s
r)
.
AVIRIS
Estimate
Residual
Simi Valley Fire
Spectrum AA
Temperature Estimate=999K
7.5% of the Spectrum Sample Area
Species Type Dry Biomass (Cellulose/Lignin) Canopy Water
Simi Valley Fire 2003
Fire Temperature Severity Recovery
T ~ 1200K
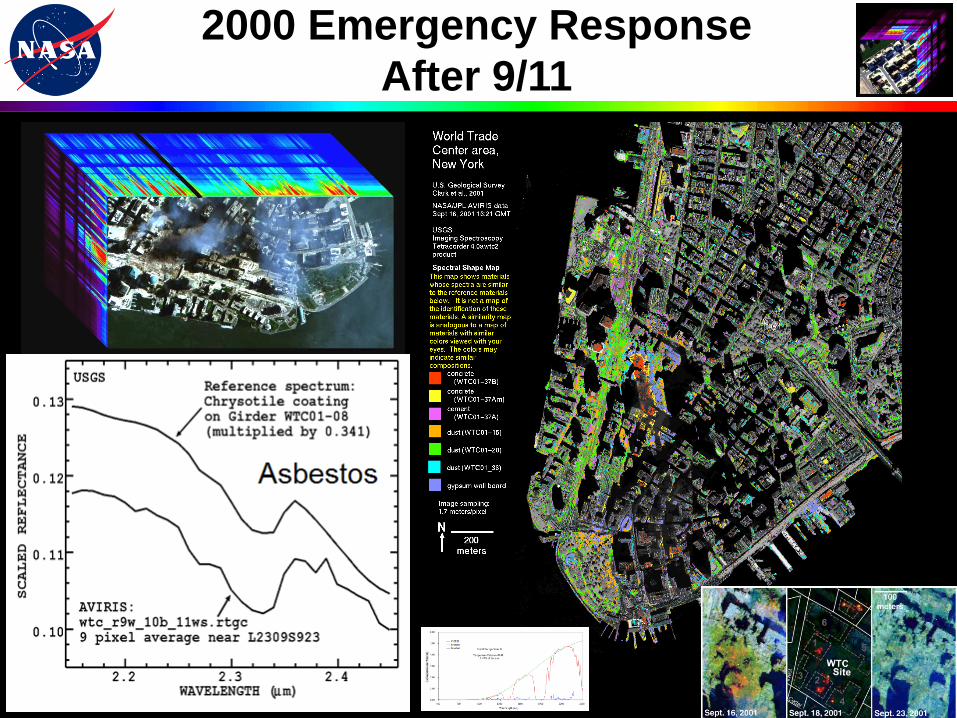
2000 Emergency Response
After 9/11

2005 Hurricane Katrina Response
OBJECTIVE
- Assess impact of flood and hazards via
imaging spectroscopy
- Examples: Flood water composition,
particulate distribution, oil contamination,
methane leaks, environmental damage,
fires, etc.
COLLABORATORS
- Delivery to FEMA
- Roger Clark, Trude King, et al., USGS
- Prof. Susan Ustin, UC Davis
- Prof. Dar Roberts, UC Santa Barbara
- Prof. Greg Asner, Carnegie (CIW) &
Stanford
- Robert Green, JPL
- Joseph Boardman, AIG
April 25, 2010 MODIS
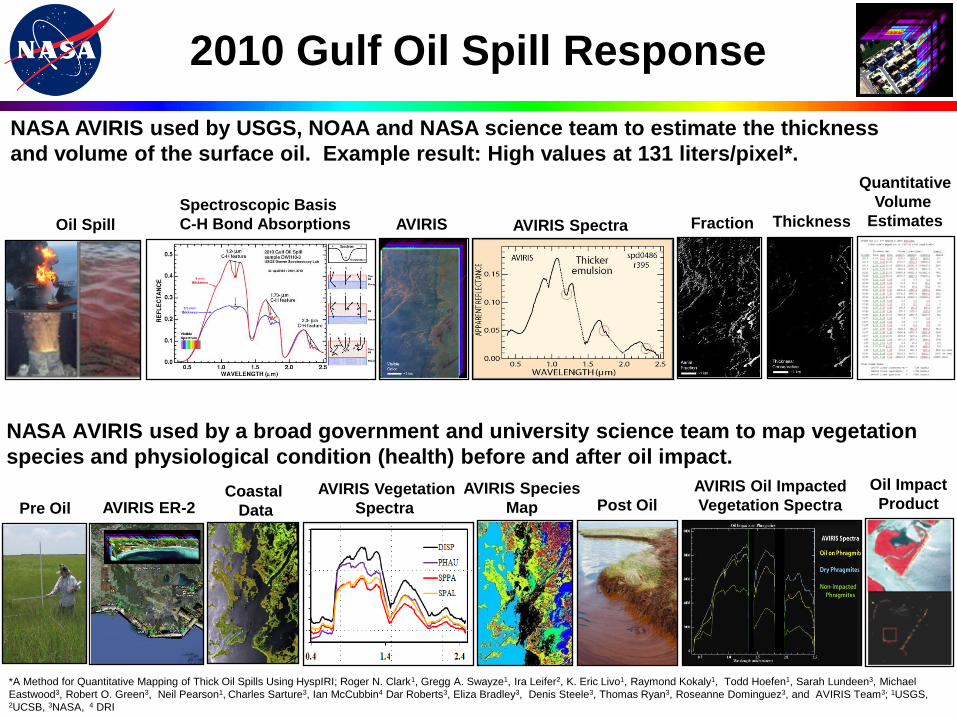
2010 Gulf Oil Spill Response
NASA AVIRIS used by USGS, NOAA and NASA science team to estimate the thickness
and volume of the surface oil. Example result: High values at 131 liters/pixel*.
Oil Spill
Spectroscopic Basis
C-H Bond Absorptions AVIRIS AVIRIS Spectra Thickness Fraction
NASA AVIRIS used by a broad government and university science team to map vegetation
species and physiological condition (health) before and after oil impact.
Quantitative
Volume
Estimates
Pre Oil AVIRIS ER-2 Coastal
Data Post Oil AVIRIS Vegetation
Spectra
AVIRIS Species
Map
AVIRIS Oil Impacted
Vegetation Spectra
Oil Impact
Product
*A Method for Quantitative Mapping of Thick Oil Spills Using HyspIRI; Roger N. Clark1, Gregg A. Swayze1, Ira Leifer2, K. Eric Livo1, Raymond Kokaly1, Todd Hoefen1, Sarah Lundeen3, Michael
Eastwood3, Robert O. Green3, Neil Pearson1, Charles Sarture3, Ian McCubbin4 Dar Roberts3, Eliza Bradley3, Denis Steele3, Thomas Ryan3, Roseanne Dominguez3, and AVIRIS Team3; 1USGS, 2UCSB, 3NASA, 4 DRI
Other Planets and the Moon
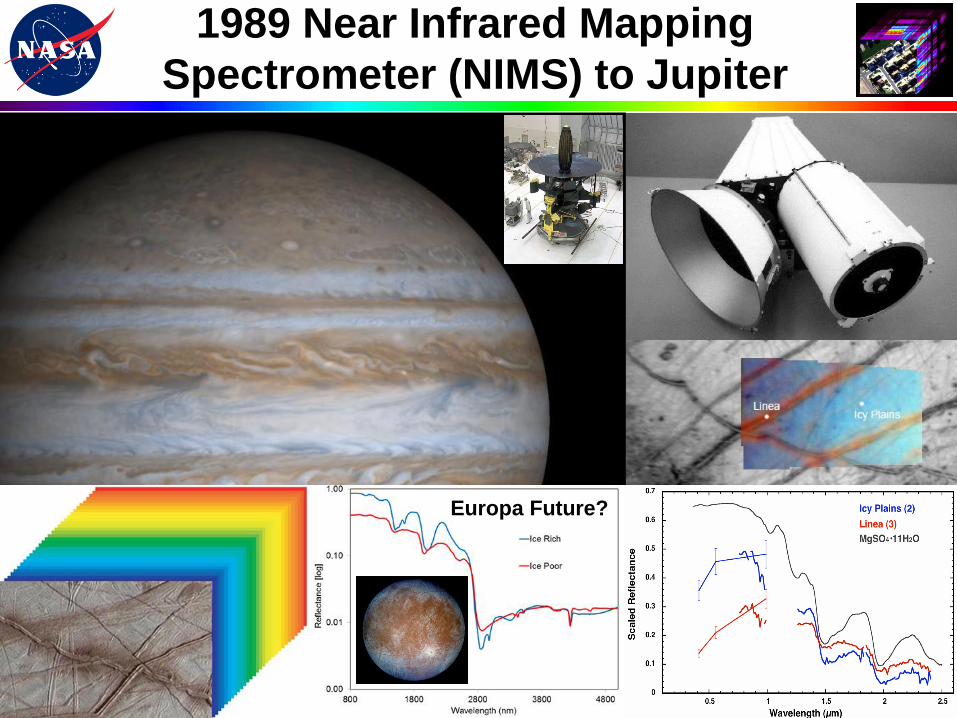
1989 Near Infrared Mapping
Spectrometer (NIMS) to Jupiter
Europa Future?

1997 Visual and Infrared Mapping
Spectrometer (VIMS) to Saturn
Titan

2005 CRISM to Mars
• Spectral: 400 to 4000 nm
• Spatial: 12 by 12 km @24
0
0.01
0.02
0.03
0.04
0.05
0.06
0.07
0.08
0.09
0.1
400 700 1000 1300 1600 1900 2200 2500
Wavelength (nm)
I/F
Corrected
Water Ice Absorptions
12 Aug 2005
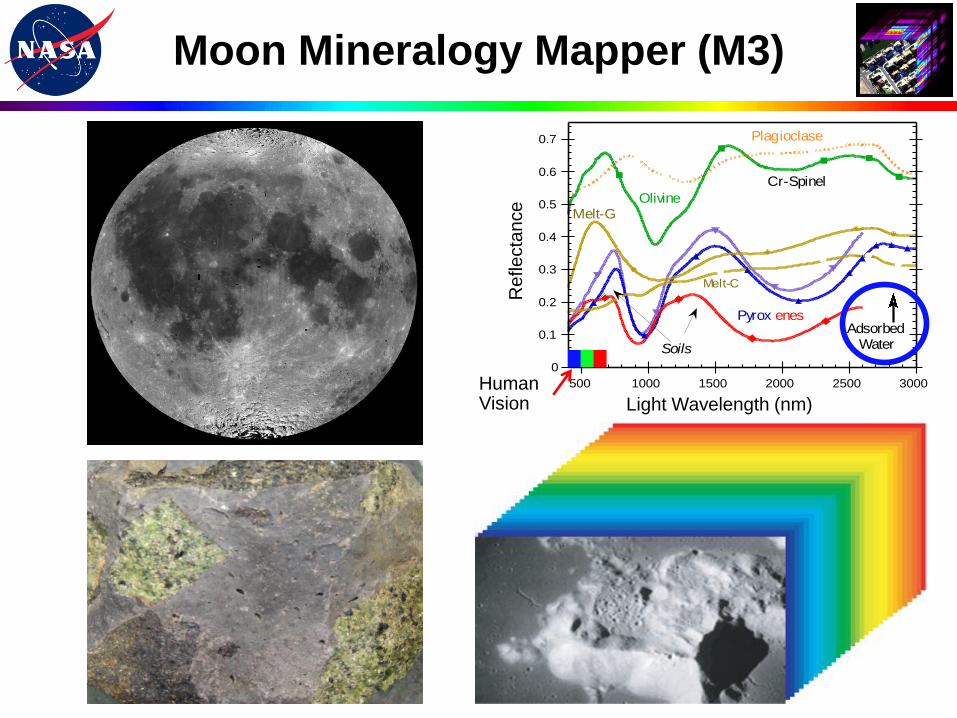
Moon Mineralogy Mapper (M3)
0
0.1
0.2
0.3
0.4
0.5
0.6
0.7
500 1000 1500 2000 2500 3000
Re
flect
an
ce
Wavelength nm
Lunar Mineral Separates
Soils
AdsorbedWater
Olivine
Pyrox enes
Plagioclase
Melt-G
Cr-Spinel
Melt-C
0
0.05
0.1
0.15
0.2
0.25
0.3
500 1000 1500 2000 2500 3000
Refle
ctance
Wavelength nm
Apollo 17Lunar Basalt Samples
79221 (soil)
75035 (rock)
Light Wavelength (nm)
Re
fle
cta
nce
Human Vision
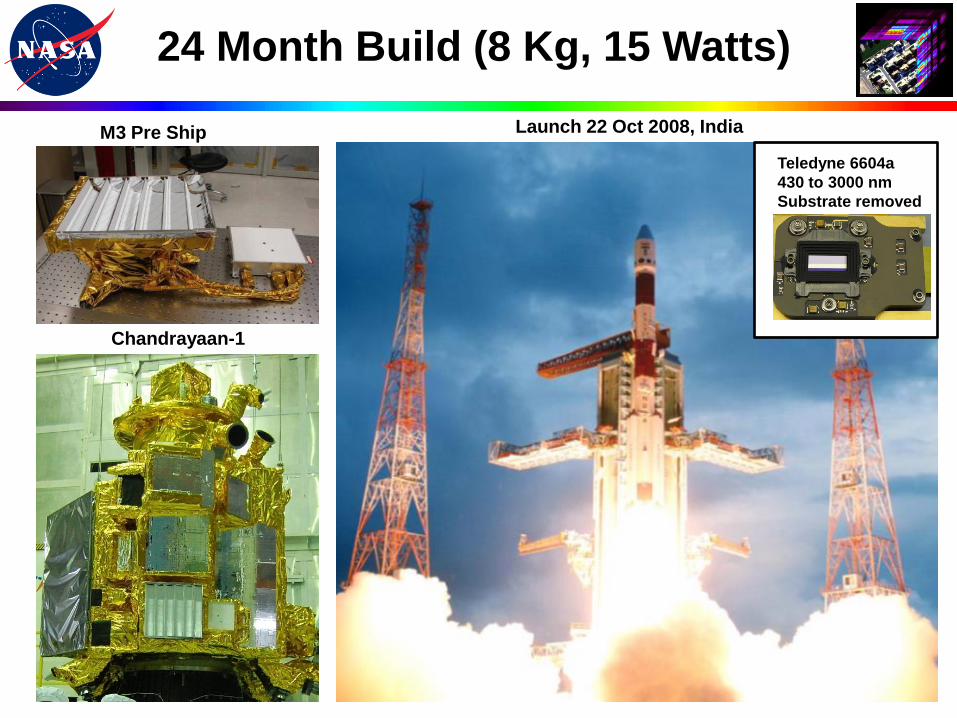
Launch 22 Oct 2008, India
24 Month Build (8 Kg, 15 Watts)
M3 Pre Ship
Chandrayaan-1
Teledyne 6604a
430 to 3000 nm
Substrate removed
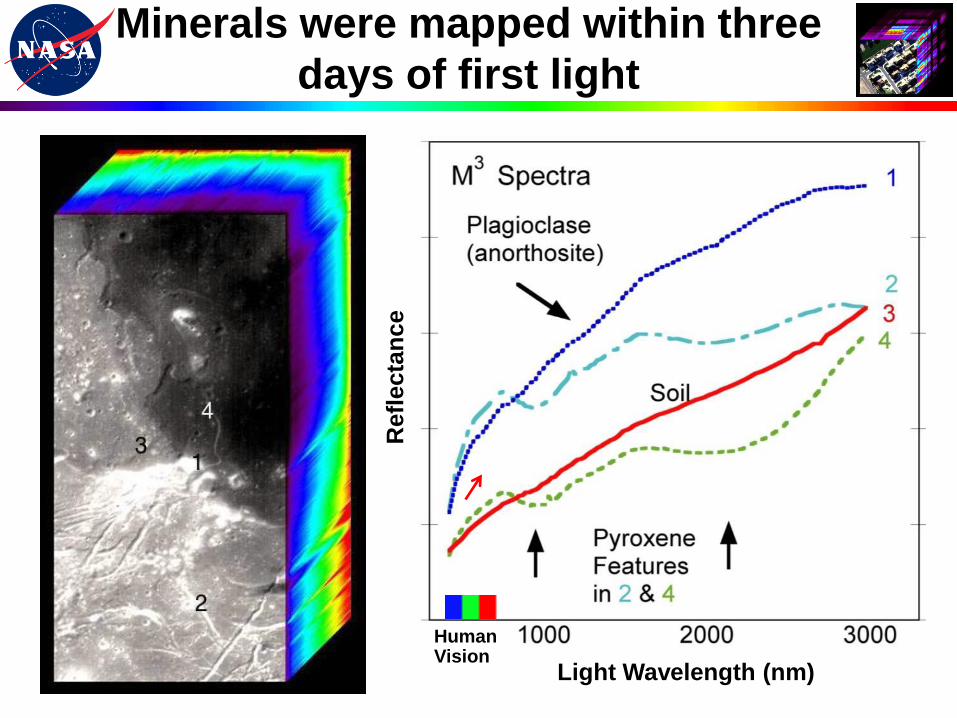
Minerals were mapped within three
days of first light
Human Vision
Refl
ecta
nce
Light Wavelength (nm)

M3 Hydroxyl/Water on the Moon
0.7
0.8
0.9
1
1.1
1.2
1.3
1.4
1800 2000 2200 2400 2600 2800 3000
Lat 81.7 scLat 76.6 scLat 67.1 scLat 43.2 scLat 23.0 scLat 18.0 sc
Sca
led
Re
fle
cta
nce
*
Wavelength (nm)
m3g20090205t150614Eq Long 0.6 degBeta angle 39 deg
Unexpected Minerals
Ch
loro
ph
yll
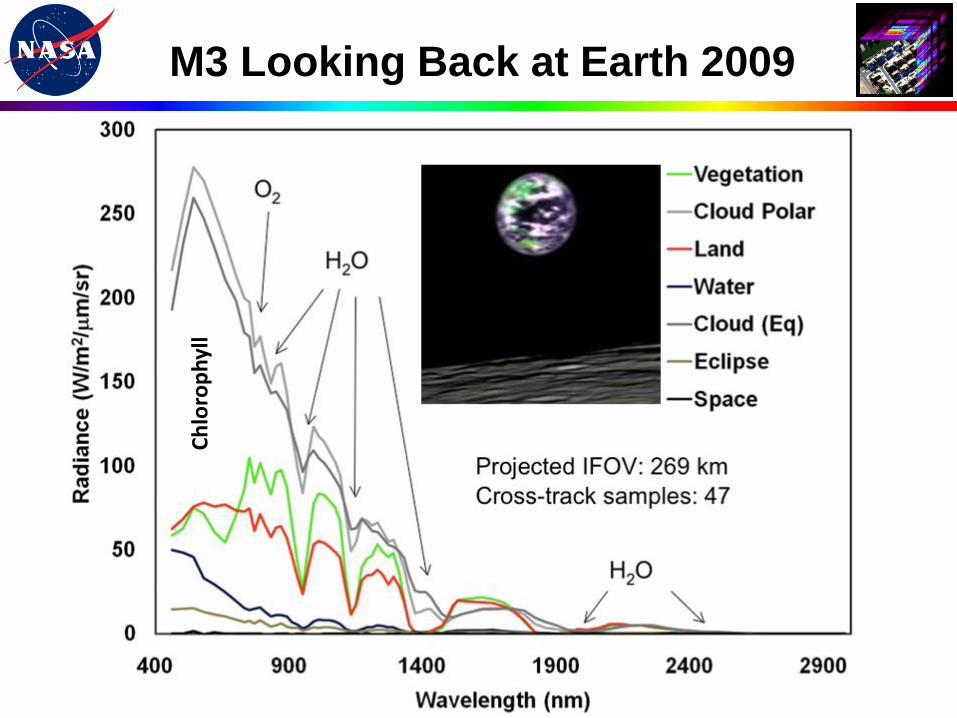
M3 Looking Back at Earth 2009
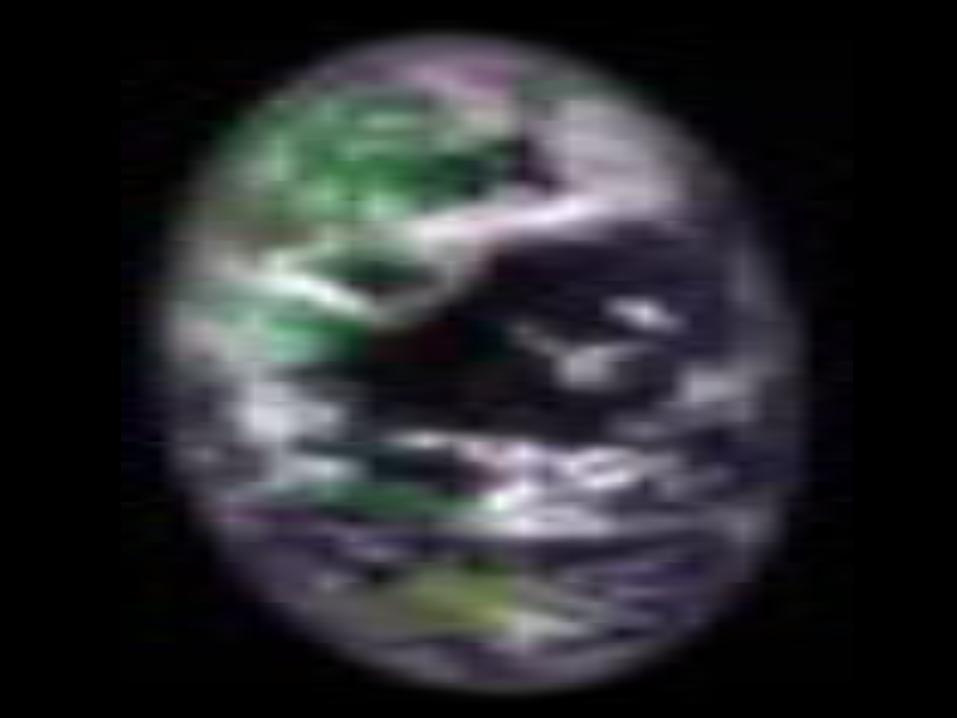
M3 Measurement of Earth 22 July 2009
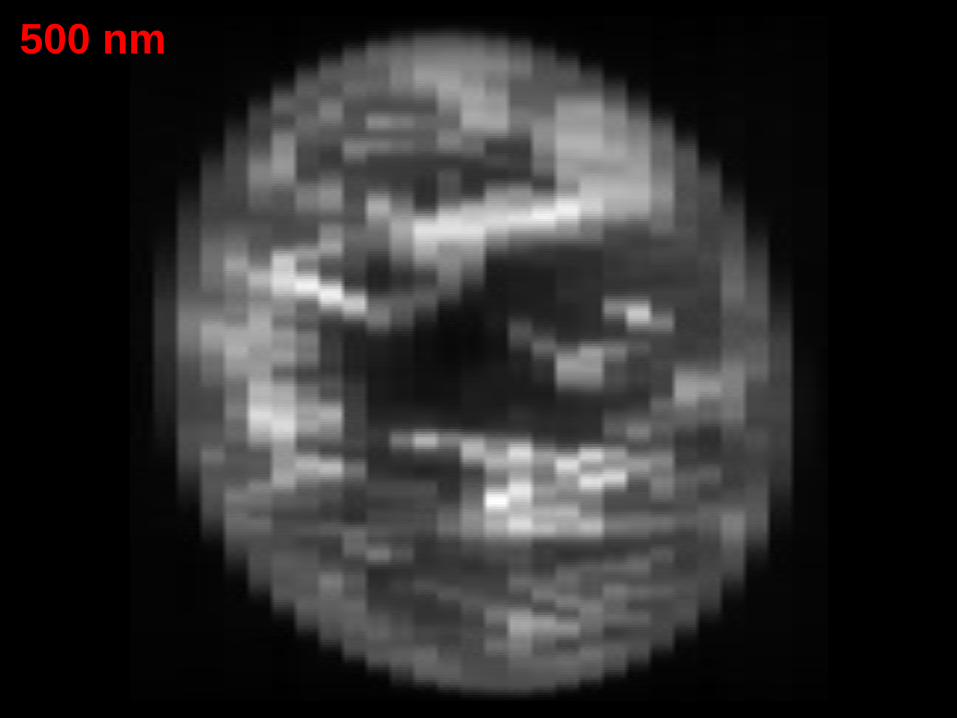
500 nm
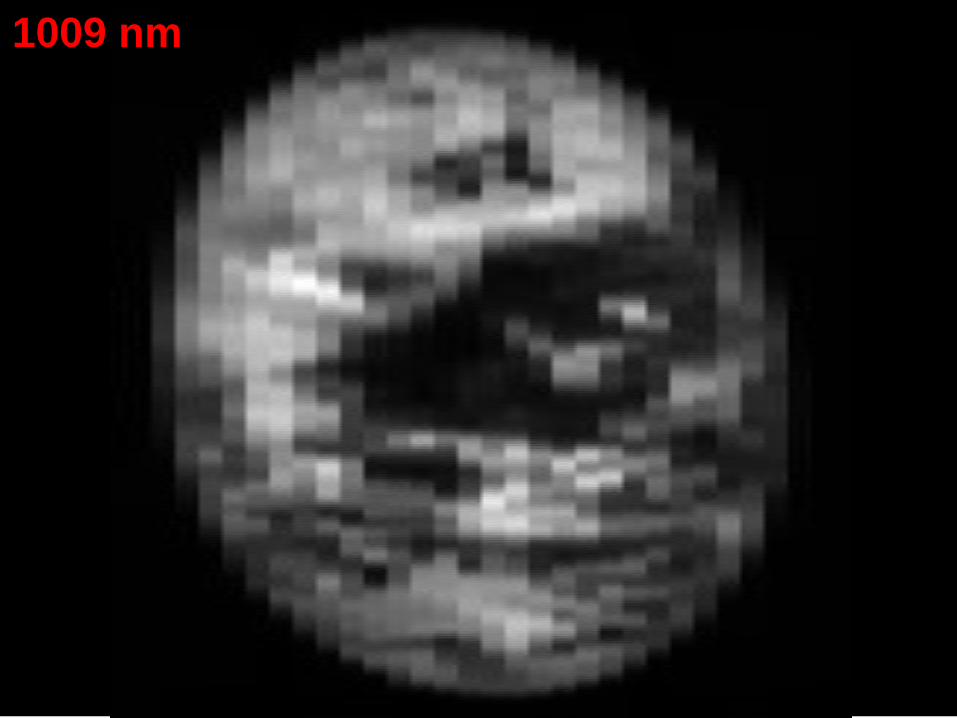
1009 nm
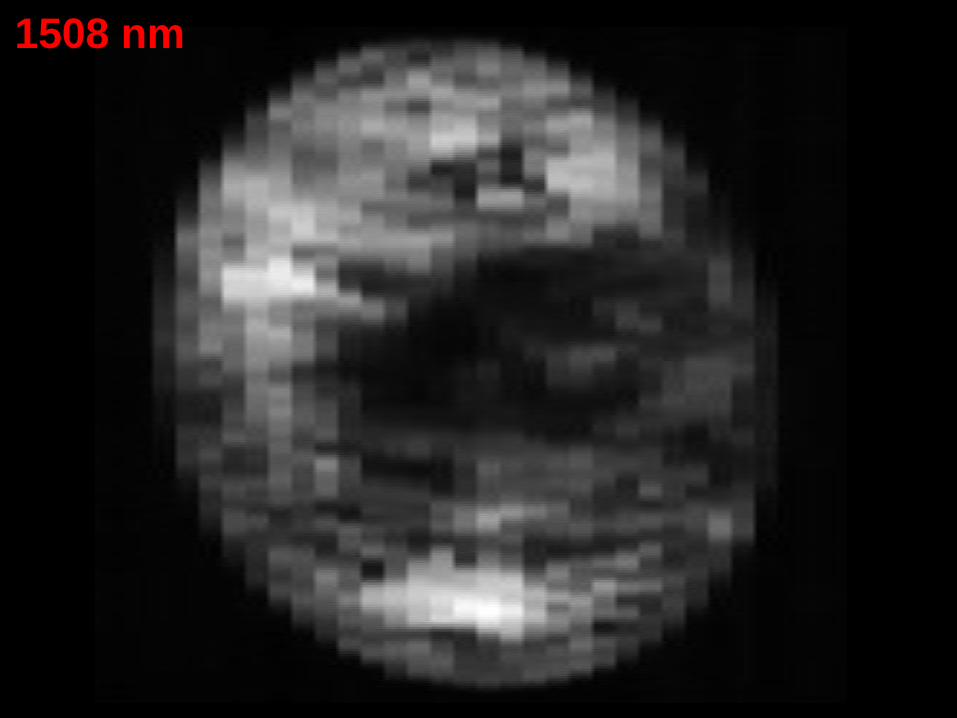
1508 nm

2018 nm

2497 nm
2816 nm
Instrument Evolution and
Next Generation Measurements
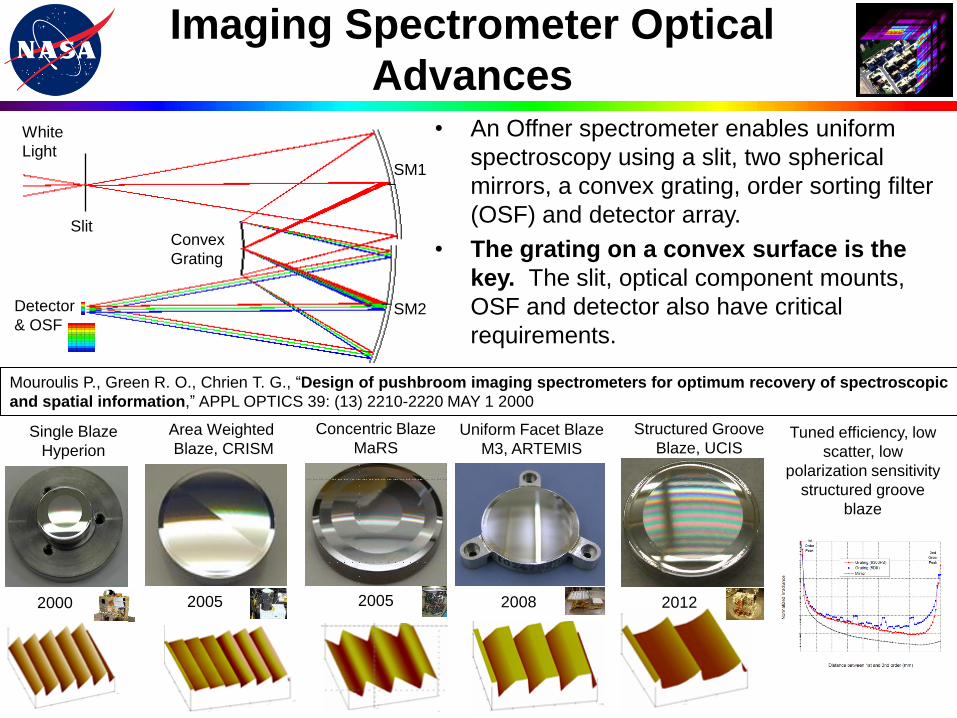
• An Offner spectrometer enables uniform
spectroscopy using a slit, two spherical
mirrors, a convex grating, order sorting filter
(OSF) and detector array.
• The grating on a convex surface is the
key. The slit, optical component mounts,
OSF and detector also have critical
requirements.
Imaging Spectrometer Optical
Advances White
Light
.
Slit Convex
Grating
Detector
& OSF
SM1
SM2
Mouroulis P., Green R. O., Chrien T. G., “Design of pushbroom imaging spectrometers for optimum recovery of spectroscopic
and spatial information,” APPL OPTICS 39: (13) 2210-2220 MAY 1 2000
Single Blaze
Hyperion
Concentric Blaze
MaRS Uniform Facet Blaze
M3, ARTEMIS
Structured Groove
Blaze, UCIS Tuned efficiency, low
scatter, low
polarization sensitivity
structured groove
blaze
Area Weighted
Blaze, CRISM
2000 2005 2005 2008 2012
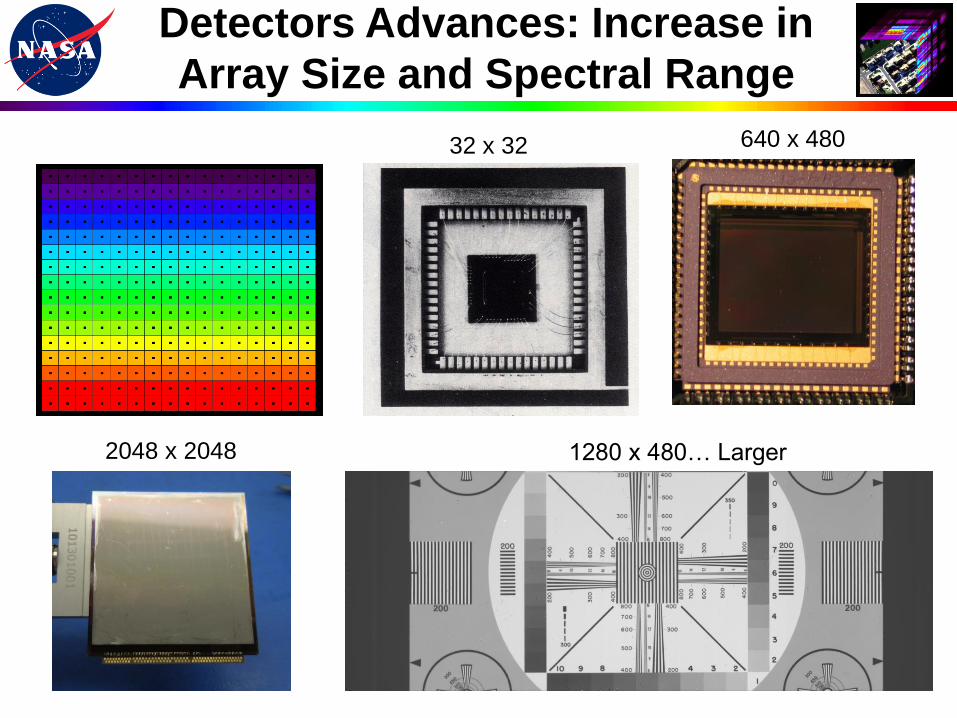
Detectors Advances: Increase in
Array Size and Spectral Range
32 x 32 640 x 480
2048 x 2048 1280 x 480… Larger
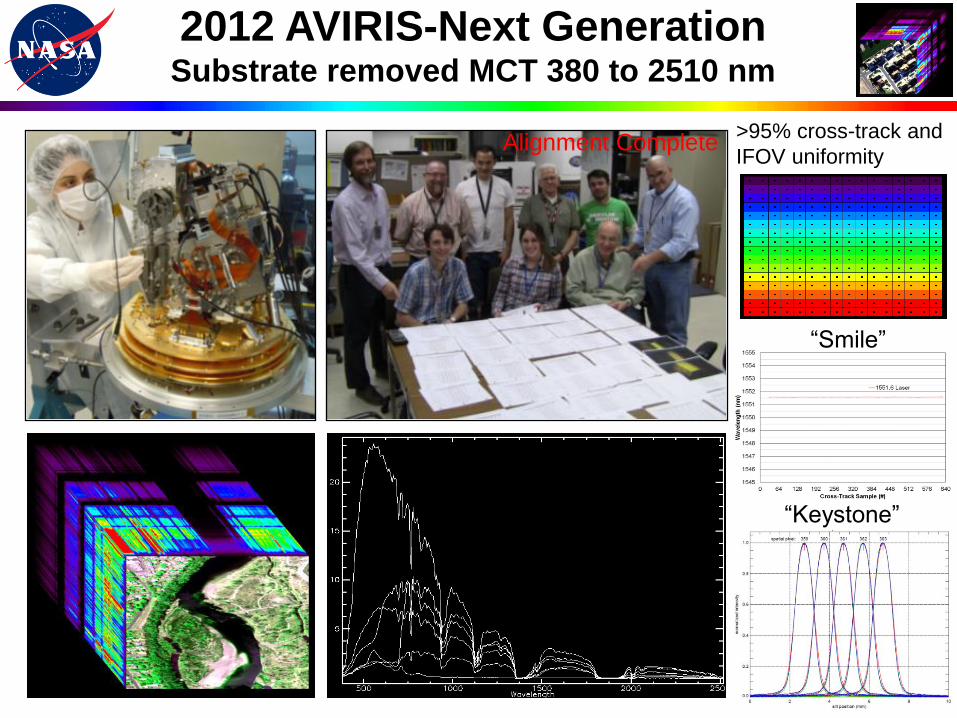
2012 AVIRIS-Next Generation Substrate removed MCT 380 to 2510 nm
“Smile”
“Keystone”
Alignment Complete >95% cross-track and
IFOV uniformity
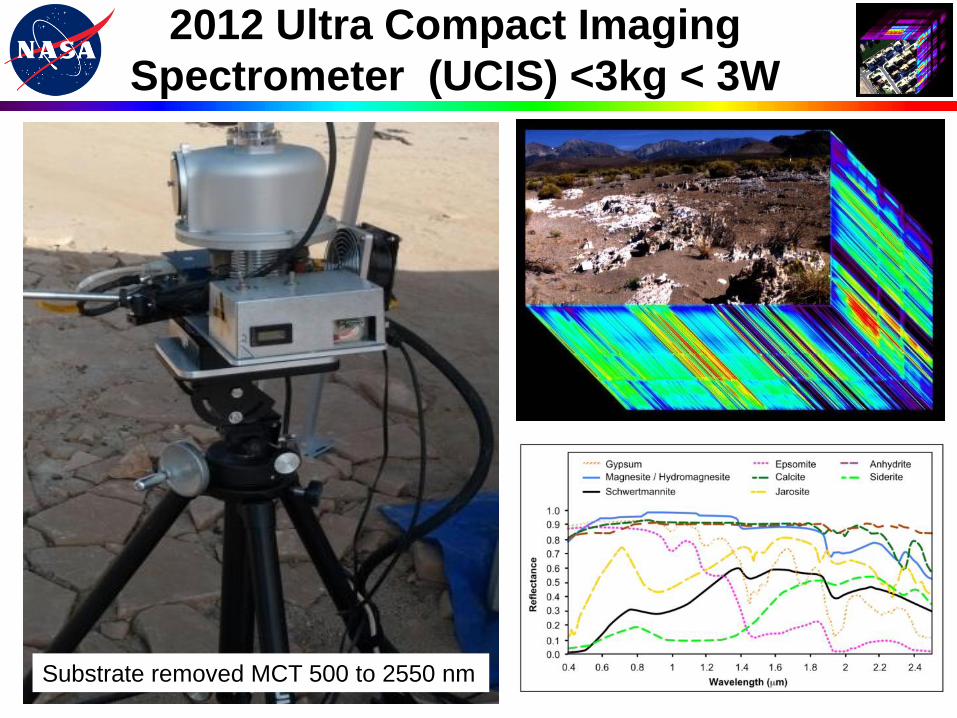
2012 Ultra Compact Imaging
Spectrometer (UCIS) <3kg < 3W
Substrate removed MCT 500 to 2550 nm

Pisolithic Ironstone with <100 µm spot
2012 Micro Scale Imaging
Spectroscopy with UCIS

Exoplanet Worlds
Spectroscopy of Exoplanets
• Provides access to information
about molecules, atmospheric
conditions, composition
Imaging strategies exist
Disequilibrium chemistry
• Spectroscopy could provide the
first evidence for life beyond
Earth
From “The Presence of Methane in the Atmosphere of an Extrasolar Planet,“Swain,
Vasisht & Tinetti, Nature, Volume 452, pp. 329-331 (2008)
Transit spectroscopy

Understanding Worlds with
Imaging Spectroscopy

• Spectroscopy reveals physics, chemistry, and biology and related processes
• With advances in detectors, optics, and electronics, imaging spectroscopy
became feasible in the late 20th Century (AIS)
• Since its inception, the use of imaging spectroscopy on Earth and
throughout the solar system has been proven and expanded extraordinarily
• There are now a suite of compelling science research examples for
understanding worlds from the micron scale to exoplanet distances
• Imaging spectroscopy enables remote measurement for the 21st Century
Conclusions
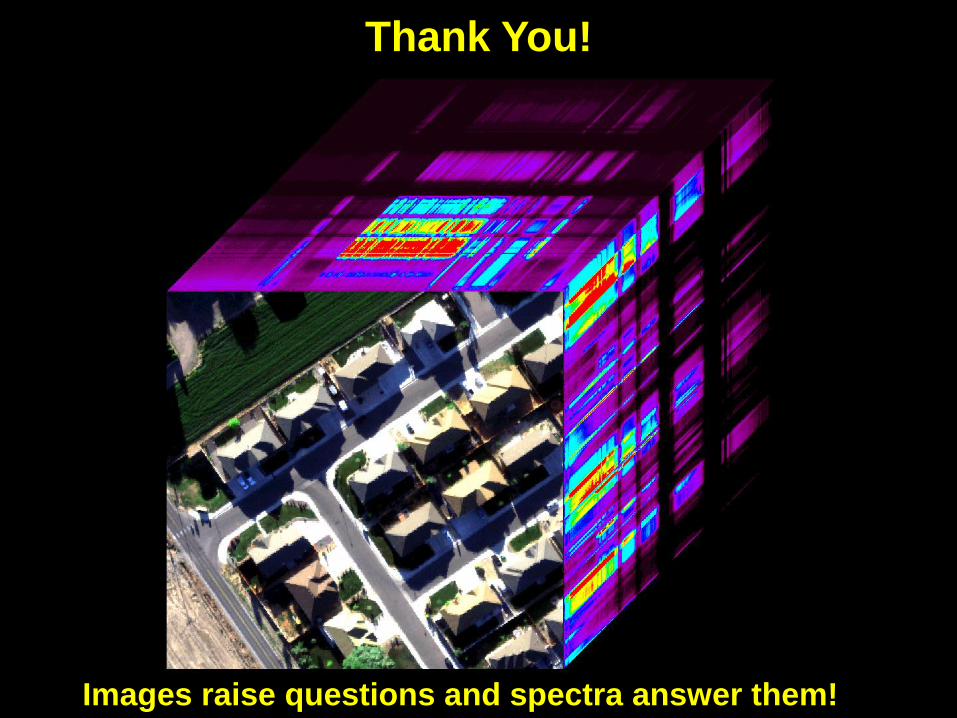
Thank You!
Images raise questions and spectra answer them!