united states renewable energy attractiveness indices
TRANSCRIPT
United States renewable energy attractiveness indices
Fall 2012

United States renewable energy attractiveness indices | Issue 9 3United States renewable energy attractiveness indices | Issue 92
Historical Boardwalk DecisionThe Third Circuit’s recent opinion in Historic Boardwalk Hall, LLC v. Commissioner may have broad repercussions for partnerships involved with tax credit monetization. The ���������� �������������������������������������������partner in the partnership, stripping the TEI of its eligibility to receive tax credits because it did not have any meaningful downside risk or upside potential in the partnership. Tax equity investors looking into renewable energy credits must now be cautious to evaluate transactions in terms of both risk and reward before entering into them.
Interview with Mark VachonErnst & Young’s Global Cleantech Center recently interviewed Mark Vachon, VP of General Electric (GE) ecomagination, to ����������� ���������������������������������������������of natural gas into energy markets, the impact of global economic dynamics on the renewables industry and the state of worldwide renewables capital markets.
WebsiteErnst & Young LLP has a single location website, http://www.ey.com/GL/en/Industries/Oil---Gas/Oil_Gas_Renewable_Energy_Attractiveness-Indices where you can go to get back issues of the United States Attractiveness Indices (USAI), country attractiveness indices and biofuel attractiveness indices.
Issue contentTable of contentsOverview of indices and glossary ..........................4
US highlights ......................................................6
Historic Boardwalk decision ..................................7
Interview with Mark Vachon .................................10
Market activity ....................................................14
All renewables index at September 2012 .............18
Long-term indices ...............................................19
Commentary: high-scoring states ........................20
Commentary: key states .......................................24
All Renewable Index at August 2012 ....................25
Commentary: guidance notes ..............................26
Ernst & Young LLP renewable energy services ......27
Contacts .............................................................28
United States renewable energy attractiveness indices | Issue 94
Overview of indices
The Ernst & Young LLP United States Attractiveness Indices (USAI) provide scores for state renewable energy markets, renewable energy infrastructures and their suitability for individual technologies. The indices provide scores out of 100 and are updated on a biannual basis.
The main indices (all renewables, long-term wind and long-term solar) are referred to as the “long-term indices.” The long-term indices are forward-looking and have a long-term outlook on the renewable energy industry. Thus, a state that has positive attributes (such as unexploited wind resources, attractive power pricing or tax climate) will score well even if that state currently has little installed capacity. Readers should refer to the guidance notes set out on page 26.
All renewables index
This index provides an overall score for all renewable energy technologies. It combines individual technology indices as follows:
�� Long-term wind index — 45%
�� Long-term solar index — 45% (comprising the residential solar index, commercial solar index and the large-scale index)
�� Biomass index — 5%
�� Geothermal index — 5%
Individual technology indicesThese indices are derived from scoring:
�� ���������� ������ ����������������������������������accounting for 65%
�� ���������������� ������ ��������������������������infrastructure index), accounting for 35%
Renewables Infrastructure IndexThis index is an assessment by state of the general regulatoryinfrastructure for renewable energy. On a weighted basis, the index considers:
�� Strength of Renewable Portfolio Standard (RPS) — 29%
�� Planning and grid connection issues — 57%
�� ���������������������!
GlossaryAWEA American Wind Energy Association CHP Combined heat and power DOE Department of Energy GC Green certificate GW Gigawatt (1,000 GW) IPO Initial public offering IRR Internal rate of returnITC Investment tax credit
kWh Kilowatt Hour (1,000 kWh) M&A Mergers and acquisitions MW Megawatt (1,000 MW) MWh Megawatt hour (1,000,000 Wh) PE Private equity PPA Power purchase agreement PTC Production tax credit PV Photovoltaic REC Renewable energy certificates
RPS Renewable portfolio standard SREC Solar renewable energy
certificate WREGIS Western renewable energy generation information systemUSPREF US partnership for renewable
energy finance
Technology factors������ ��"�#������$����� ��������������������������������' Each of the technology indices considers, on a weighted basis, the following:
�� Power offtake attractiveness — 32%
�� Tax climate — 8%
�� Grant/soft loan availability — 8%
�� Market growth potential — 26%
�� Current installed base — 8%
�� Resource quality — 18%
Long-term solar indexThese indices are derived from scoring:
�� The large-scale (utility-scale projects) solar index — 67%
�� The commercial (rooftop and ground-mount installations) solar index —22 %
�� The residential solar index — 11%
Comments and suggestionsWe welcome your comments or suggestions on any aspect of the indices. Tailor-made attractiveness surveys and market reports ������� ��"�#�#��������*��� ��������� ��������+����"��������account. Please contact Mike Bernier, Dorian Hunt, Paul Naumoff or Gabriel Wuebben at Ernst & Young LLP with any comments and/or suggestions:
Mike Bernier | [email protected] Hunt | [email protected]
United States renewable energy attractiveness indices | Issue 9 7United States renewable energy attractiveness indices | Issue 96
US highlights
All Renewables IndexA number of states exited the All Renewables Index’s top ten this issue. Pennsylvania was edged into the second tier, while Massachusetts (12) and Nevada (15) joined the ranks of the top-performing states. Nevada climbed most, due to improvement in its wind environment and a series of substantial projects coming online. California continues to lead in the All Renewables Index, taking the top spot in all technologies across the board. Colorado, Texas, New Mexico and Massachusetts rounded out the �� ��"�������������;���������<�#�='�>������������#��������#$��to an attractive small-scale solar market although the scale of opportunity remains a detriment.
With the Production Tax Credit (PTC) expiration, there is no surprise that mid-year wind development surpassed that of the previous year as developers rush to commence development before the PTC placed-in-service deadline and 1603 Credit Termination Date. Solar, also, saw investment at a record pace when compared with all previous six-month starts.
Long-term Wind IndexWith 1.7 GW installed in Q1 and 1.2 GW in Q2, (2.895 GW total to date in 2012), US wind installations are likely to surpass 50 GW of total installed capacity before the end of the year. Installations through Q2 surpassed all previous years through Q2, barring 2009 which also saw a rush to beat the initial 1603 Grant deadline. As in previous years, California’s offtake prices, favorable regulatory and incentive environment, and outstanding resource quality secured its top position in the Long-term Wind Index, aside from the continued expansion of its massive Alta facilities. California is followed by Colorado and Texas.
Texas, which was handicapped in our previous issue by ����������������$������������#���������������$���������?�� �����"��Renewable Energy Zones (CREZ), which should alleviate some of the state’s transmission issues.
Long-term Solar IndexWith the explosive growth of rooftop solar, 2012 is shaping up to be another strong year in PV growth. With several large-scale ��+�����$�#��������#���������������������������������������?������������������������#�����������#��"������������������ ��"����������������@��������F�����<�#�='�����������#�������������#�remained virtually static, with Hawaii, New Mexico, Nevada and J������$�����������������$�K��������� ��"�'����� ����#�F;X?����*�����#����$���K$����������"������ �#�������[���\��������*�into the top 10.
Biomass/Geothermal IndexWith respect to geothermal and biomass, the renewable ���������������������$��������$ ��������� �������$�������*��������������K$����#�������$����]$�������#� ����������*�'�?����������meets these standards exceptionally well. As in previous issues of the USAI, Hawaii’s All Renewable Index standing was helped by its strong geothermal standing.
Historic Boardwalk decision
Special report
Tax credits
Decision in “Historic Boardwalk Hall” case creates challenges for investors
By Denise Ryan
A recent IRS victory on the question of a highly structured partnership’s right to claim historic tax credits (HTCs) raises concerns for practitioners structuring such deals and has prompted conversations with IRS about more guidance on limited liability company participation.
The US Court of Appeals for the Third Circuit 27 August gave IRS its latest victory in a line of cases where the agency challenged highly structured partnerships, holding in Historic Boardwalk Hall LLC v. Commissioner, 3d Cir., No. 11-1832, 8/27/12 (167 DTR K-3, 8/29/12 ), that a corporate partner in a limited liability company could not claim HTCs because the corporation was not a ������#�� ��������������@@?'
The Tax Court had held that a partnership formed to allow Pitney Bowes to invest in the historic rehabilitation of the East Hall of the ���������?����[���\���������"�������������������������#����������historic rehabilitation tax credits because the partnership was not a sham lacking economic substance. The Third Circuit reversed holding that Pitney Bowes was a partner in form, not in substance, and could not claim the tax credits regardless of whether the transaction otherwise had economic substance.
The Historic Boardwalk Hall case has many practical implications for the manner in which HTC deals are structured, practitioners told BNA in recent interviews.
The decision adds to other recent IRS victories in cases attacking highly structured, tax-advantaged partnerships, David Blair, a partner at Crowell & Moring in Washington, noted 10 September.
Although the Third Circuit’s opinion in Historic Boardwalk Hall, LLC v. Commissioner dealt with historic rehabilitation tax credits (HRTCs) and not renewable energy credits, it is instructive because the Internal Revenue Service (IRS) was challenging the prohibited ����������=����#����������������������=����#��� ��"������������'�������$������#������������=��]$�����"����������������������#�� ��������������partnership and thus was not eligible to receive Section 47 tax credits because it did not have any meaningful downside risk or upside potential in the partnership. The case could be read broadly to cover any partnership working with tax credits, not just those dealing with HRTCs. In such terms it could be read as saying any purported partner without a meaningful stake in the success or failure of the partnership should not be respected for tax purposes. This means that any tax equity investor looking into renewable energy credits must now be cautious to evaluate transactions in terms of both risk and reward before entering into them.
>�����#��`����#�����������������������$���������"����������������is separate from whether the transaction had economic substance, �������������������� ���������������� ����������������<;F���#���= ��������������������������������������#���#����������substance doctrine and the new economic substance penalty.”
Future HTC Deals on Hold
The Third Circuit’s holding promises to affect the structuring of HTC deals in the future. Forrest Milder, a partner at Nixon Peabody in Boston, said 10 September it is too early to tell how the decision will impact the structure of future syndications of historic tax credits but that he “wouldn’t be surprised if limited partner investors will have a greater sharing of `upside’ and `downside’ in HTC transactions.”
Parties in future deals must balance economic risk with tax risk, ���#�������[��+������ ����������F�� ����|�\����������}��������'
Nocjar observed 10 September that in general as economic risk decreases, tax risk increases. For syndication sponsors, he said, as tax risk increases, the amount of investor funds that can be raised to rehabilitate historic structures may diminish unless they offer higher returns.
“The market will slow for a period of time until everyone absorbs the implication of the case,” said Michael Bernier, senior manager ���X�����|�~�$����������������'������������#����F� ������������nearly all of the deals that were scheduled to close are on hold, and deals must be adjusted so that the investor bears “meaningful” upside and downside risk.
>���"�����������������������������#�����������������#������������“meaningful” is, he said.
Facts key for pre-existing deals
A number of deals similar to HBH are already in existence. But analyses of these transactions are very fact intensive and they may not be easily compared to the one considered by the Third Circuit.
Milder noted that on the surface many existing transactions look like HBH, but the “devil is in the details,” and some of the facts of HBH were notably worse than those involved in other, similar
United States renewable energy attractiveness indices | Issue 9 9United States renewable energy attractiveness indices | Issue 98
HTC transactions. For example, he said, HBH and many other transactions include guarantees of certain aspects of the deal, including in some cases tax credits, but there may or may not be liquid security backing it up like the guaranteed investment contract (GIC) of HBH. Moreover, said Milder, the GIC was purchased with the investor’s own money.
In any transaction, he said, projections are often revised and re-�$������������������$������������#���������$�������������K������pay its debts and otherwise run like a business. However, in Historic Boardwalk Hall the Third Circuit expressed great skepticism about the assumptions on which the revisions to the HBH projections were based.
Milder explained that the decision could be distinguished in other ways as well, such as the fact that HBH was a “Single-Tier” transaction, while many more recent HTC transactions are done as Two-Tier “lease passthroughs.” “The bottom line is that I think it is very hard to say whether any particular transaction will be affected by the decision without analyzing the particular transaction,” said Milder.
Bernier noted that while many deals look like HBH, the facts and circumstances in this case were particularly favorable for the IRS argument. “The big issue that investors face in pre-existing deals is undertaking the [Financial Accounting Standards Board Interpretation No.] 48 analysis to determine if they now have an uncertain tax position that needs to be reserved for [generally accepted accounting principles] purposes,” said Bernier. “While this is a big issue, the case does not lead us to believe that all historic tax credit structures are not valid, only structures where the investors do not have meaningful upside and downside risk.”
Each investment needs to be evaluated individually based on its facts and circumstances, said Bernier, to evaluate whether such risk exists.
Effect of Virginia Tax Credit Case?
In Virginia Historic Tax Credit Fund 2001 LP v. Commissioner, 639 F.3d 129 (4th Cir. 3/29/11) (61 DTR K-3,3/30/11 ), the US Court of Appeals for the Fourth Circuit held that payments outside investors made to partnerships that purchased unused
Virginia historic renovation tax credits from developers were not nontaxable partner contributions to capital, but consideration for sales of the credits that should have been reported as income.
While both the Virginia case and Historic Boardwalk Hall involved historic tax credits, the circuit courts took different approaches in deciding if the partnerships could take the credits. “The cases are different because the Fourth Circuit approached the issue as a disguised sale,” said Blair, “and the Third Circuit applied the doctrine of substance over form.”
Blair said that one of the more interesting aspects of the Virginia Historic Tax Credit Fund decision was the court’s argument that the disguised sale issue turned on the same risk-reward analysis that underlies the substance over form analysis in Historic Boardwalk Hall and in TIFD III-E Inc. v. United States, 459 F.3d 220 (2d Cir. 2006), known as the “Castle Harbour ” decision.
Important Aspects of ‘HBH’
The Historic Boardwalk Hall decision was a blow to HTC investors, and provides investors with certain signposts they must observe in forming HTC syndicates, Blair observed that the decision “is yet another victory for the IRS in attacking equity interests through #�����]$��� ����� ���'������������#�����������#��������<;F���approach to these cases.”
Bernier said, “Personally, I think the most important part of the decision was the Third Circuit’s comments, ‘Like the Virginia Historic court, we reach our conclusion mindful of Congress’s goal of encouraging rehabilitation of historic buildings …. The HRTC statute “is not under attack here.” It is the prohibited sale of tax credits, not the tax credit provision itself, that the IRS has challenged.’ ”
Bernier said he believes that the Third Circuit followed the lead of the Fourth Circuit in making it clear that there is a limit to the amount that the tax code can be massaged to further congressional intent. “This case brings to mind the saying that pigs get fat, hogs get slaughtered,” said Bernier. “[I]f the investor did not negotiate such great terms, the result might very well have been different.”
“I think many were hoping that the court would determine whether the relevant credits themselves should be taken into account in determining whether the overall transaction had economic substance,” said Nocjar. “Unfortunately, the court, in footnote 50, expressly stated that, since it was assuming without deciding that the transaction had economic substance, it was not going to answer that question.”
“There are several possible takeaways,” said Milder, “but I suppose the most important result of the decision is that when `partners’ do a historic project together, they have to better share the ����������#��$�#�������������������������HBH.”
Possible IRS guidance
The uncertainty created by the recent line of IRS victories has prompted conversations with the Service urging more guidance although some practitioners are skeptical that the agency will step in.
“While we were waiting for the Boardwalk Hall decision, a group of us, working with the Historic Tax Credit Coalition, had already met with the IRS and suggested that the IRS publish some guidance providing `safe harbors’ that would be acceptable structures for historic transactions that involved partnerships,” Milder said.
“The people we spoke with at the IRS expressed real interest in pursuing this, and we have been working on a draft for their ��"������������#'�`[�����������������������������������<;F�� ��+�����to produce any guidance in this regard, and I expect that we won’t know if they have decided to produce guidance until something ��������������� ���'�
Bernier noted that “while we hope to get guidance in the future, guidance on areas like this often takes time. The industry will have to come to their own conclusions as we can’t fall into a situation where no deals are done prior to guidance being released.”
IRS is already using the Historic Boardwalk Hall case to challenge HTC structures currently under audit, and the case is not an isolated incident, Bernier observed.
Milder also said IRS is already auditing more HTC partnerships—not a huge number but certainly more than a few years ago.
Blair said he doubted there would be IRS guidance as the issues are too fact-bound for IRS to put forth brightline rules.
Nocjar said he also doubts there will be guidance because of the fact intensive-nature of the deals. “[O]ne reasonable person’s equity interest can be viewed as debt (or something else) by yet another reasonable person,” he said.
What constitutes ’reasonable downside’?
While the Third Circuit emphasized in Historic Boardwalk Hall that Pitney Bowes did not have a “reasonable downside,” going forward, the question becomes how to structure HTC deals to have a reasonable downside.
Milder said that the Third Circuit referred to the investor not having a “meaningful stake” in the upside “or” downside of the transaction. He explained that the Third Circuit’s use of the word “or” means that having either upside or downside would be �$����������$���������=��#"��������$�#���#���� �$#���������"�������if it is at all possible.
“At this point, I don’t think that the tax community has developed standards for what would be a `reasonable’ way to address downside,” he said, adding it may be enough for an investor to put in some of the investment relatively early, which could result in the investor losing some of the investment, but the investor ����$�����������#���������$���������������*'
Another possibility could be eliminating developer guarantees that might otherwise be in the transaction, observed Milder, so that the investor has no assurance of getting back the cash value of its investment if the transaction fails or the tax credits are not awarded. “The industry is still considering different alternatives,” said Milder.
Copyright © 2012, The Bureau of National Affairs, Inc. No copyright is claimed in works of the federal government of the United States of America which are included therein. This copyrighted material is reprinted with the permission of EY’s Global Cleantech Center. © 2012 Thomson Reuters/RIA. All rights reserved.
Reproduced with permission from Daily Tax Report, 183 DTR \����F� �'����������'�?� �����������������$���$����[��������Affairs, Inc. (800-372-1033) <http://www.bna.com>
United States renewable energy attractiveness indices | Issue 9 11United States renewable energy attractiveness indices | Issue 910
Interview with Mark Vachon Vice President, GE ecomagination
facing a utility that has to ramp up a turbine in less than ������$������� $� ��$��������������������'�����������perfect solution to help balance out generation when the wind dies down and wind turbines stop spinning. The shift away from other fossil fuels that aren’t as clean as natural gas will be really important too.
Ernst & Young: as you travel, what are the key issues in other markets?
Mark Vachon: It varies by region. In Germany, when you decide to exit nuclear, you get a huge generation challenge that will probably result in more distributed energy. When you look at Australia, we believe the pricing of carbon will hold there, even as the government changes, and that means more renewables.
In China, it is all the above with coal at the center and a growing commitment to renewables and nuclear. We will certainly do some experiments in electric vehicles and continue to push renewables there. But, if we can get the gas mix there up substantially, that will help them. That’s certainly part of Beijing’s 12th Five-Year plan.
<�����������$������#����������$�����������=���� ���������'�In Canada, the challenge is how to manage the oil sands and other resources in an environmentally sensitive way. Here in the US, with shale gas, the question is, how do we manage the water challenges associated with that while tapping into an amazing resource.
Ernst & Young:�����������������������������economic recession altered concerns around climate ��� ������������������������!
Mark Vachon: We believe in climate science. At GE, we made that decision seven years ago and have been acting �����������'�~��������������#�������$����������$���#�is those who want to keep pounding the climate change science drum are losing credibility. That’s because they’re pounding the drum, but are not acting.
Our belief is: let’s get busy with the answer. Whether you �����"�������������������������������$����������������a classic business productivity focus that has always been relevant. Customers are very interested in that conversation no matter what their take on climate change.
business strategy with a commercial foundation. Through ���������������������#���"�����������#��������������#�on environmental design requirements.
We bring to the challenge great leadership in environment, health and safety compliance. We don’t talk about that a whole lot. But we have done some great things in all of these areas. Another strength of ecomagination is that it �������� ��������������������$�������������"��������������environmental value proposition for our customer base. And there are not a lot of customers or companies that have that third tier of opportunity. In terms of lessons, efforts like ecomagination cannot be led from the environmental, health and safety (EHS) department. They ��"����������#�������?X�'�����$���\�����<���������#���#�supported ecomagination from the very beginning. Those factors are the reason ecomagination has been successful.
Ernst & Young: looking ahead into the next year or two, will there be any changes to ecomagination in terms of focus on R&D or investment?
Mark Vachon: The level of resource commitment won’t change. GE has a public commitment to spend US$10 �����������������������������������#�$�������� ������"��year period. Geographic priorities will continue to shift. I have been in the role a year and a half, and I have spent most of my time outside of the United States, whether in China, Australia or Canada. In the US, one of the macro dynamics is the natural gas revolution. This is creating consternation, of course, as a threat to renewables. But it’s also a huge opportunity. Europe remains a focus — particularly as a regulatory leader. And we will focus on Brazil too.
Ernst & Young: how is the natural gas rush affecting your business?
Mark Vachon: Given our commitment to renewables, it may seem counterintuitive, but the gas boom has the potential to be positive. Last year, we announced our Flex 50 gas turbine, which was developed using technology borrowed ������$���"��������$������'�<���$�K� ��������$�*���������� �����������K�=������� ������'�������������� �����$ ���jet engine and then throttle back is similar to the challenge
Ernst & Young: there have been big changes in the US renewable energy marketplace over the past year. How has GE responded?
Mark Vachon: To start, the elimination of the production tax credit (PTC) accelerated orders, which in the near-term has been fabulous. We will book record sales this year in wind, in part because of that credit. The downside is that the big sales this year point to a slowdown in 2013.
More broadly, in both solar and wind, overcapacity and the retreat of incentives will lead to a shakeout. Would we prefer a smoother industry performance? Yes, but in some respects the company with the strongest technology and healthiest balance sheet will be best able to withstand the shakeout. Survivors will be well positioned on the other side.
Ernst & Young: GE’s growth in wind is an example of how the ecomagination strategy has been a success. What lessons were learned from the effort?
Mark Vachon: This is hard work. But ecomagination works because it is more than a sustainability initiative. Interestingly enough, something like two-thirds of sustainability-based programs will fail. And the reason they will fail is that there isn’t an economic imperative there. GE has always been unapologetic that ecomagination is a
The following is an interview conducted by Ernst & Young’s Global Cleantech Center in the recent publication, Cleantech matters.
Mark Vachon, a 29-year GE veteran, ����������� �������������GE’s Corporate Executive Council, leads ecomagination, GE’s business strategy which has invested more than US$5 billion in cleantech research and development and generated US$105 billion in revenues through 2011.

United States renewable energy attractiveness indices | Issue 9 13United States renewable energy attractiveness indices | Issue 912
To the extent that climate change can lay a heavy burden of “saving the world” on a conversation, we lose time and we lose focus on real solutions to real problems.
When I was in Brussels a few weeks ago, meeting with the EU Commissioner of Environment, they were saying the same thing. They have the same market focus as GE on �������������'�F��<�����*����������������������������������������������������#������#����������������$�#���"��happened even without the economic downturn.
Ernst & Young: another effect of this crisis has been the retreat of government leadership on some energy and environment issues. Have we seen a shift in the role business must play?
Mark Vachon: yes, business increasingly needs to be the leader. That’s about innovating and delivering solutions that speak to the reality of constrained resources, regardless of government engagement. We are planning on very little government role. That said, this will cycle �"�������'�<���"������������������������$�������"��returned to the government.
Ernst & Young:�����"�#���������������������$�������years have meant a shortage of capital and the need for new funding models. How do you see the capital drought playing out in the energy space?
Mark Vachon: we play in this space through Energy ����������F��"������������#������������� ��+�����������'�<��this area, I think the opportunities will be fewer and more focused near term, but we will still play there. We do equity investing as well, and we will continue to do it. We’ve also developed a competency in crowd sourcing new innovation in this energy space through the ecomagination Challenge. Our role there will continue to identify and cultivate new ideas.
More importantly though, there is huge pent-up demand ����������������������������"���$����� �����������#�energy start-ups. The phone calls that are coming in to us are increasingly voluminous and desperate. I think there is going to be a bit of a crash on some of the stuff that has �����"�#�������$�#����$���������������#���#�������� ����'�There’s certainly going to be a lot better deals, and I think corporations such as GE will be natural potential partners. But in considering acquisitions, we will be very selective. Beyond money, I would also say we have a real ability to help develop these ideas through a phase of reducing their technology risk, and also help debug their business models. Through our ecomagination Challenge, we help accelerate innovation by providing a bit of money and actually working with our partners to get them to scale faster.
Ernst & Young: given instability in the Mideast, we’ve returned to a time of heightened anxiety around oil supplies, as well as renewed worries about nuclear in the wake of Fukushima. What are you seeing among your clients in terms of energy strategy?
Mark Vachon: talking about this globally, it’s a challenge to move individual wedges of the total pie of energy use in any short period of time. But looking at what’s in motion, I think gas will take a bigger share in time. Renewables will continue, if not as robustly as in the past. Nuclear will certainly go sideways for a while.
Stepping back a bit further, thinking about the long term in our lifetimes and our children’s too, the world will continue to be based on fossil fuels.
So at GE, through our ecomagination strategy, we’re looking at how we help manage that reality in terms of extraction, distribution, utilization, re-use. We’re at work on the innovations and technologies that we can apply to make this as environmentally productive as possible. //
United States renewable energy attractiveness indices | Issue 9 15United States renewable energy attractiveness indices | Issue 914
Market activity
General}����������������#����$�������$� �����������������������*�global economy, the uncertain future of the Production Tax Credit (PTC) and the expiration of the ARRA 1603 Grant, 2012 has been ���������������� ������������������#���#���������"����������#�development. Wind developers in particular are rushing, once again to place projects in service before the sunset of the PTC, a critical incentive. The sunset of the 1603 program has also created a glut of warehoused solar components, purchased to meet the construction commencement requirements of the 1603 Grant. Deployment of these so-called “safe harbored” solar assets to individual projects is currently underway and should result in installation of more than 1 GW of solar assets according to SEIA.
All this solar activity comes at the expense of Original Equipment Manufacturers (OEMs), both domestic and international. The glut in polysilicon continues, driving PV prices downward. Despite US efforts to stem a wave of subsidized Chinese components through imposition of trade tariffs, the domestic manufacturing sector is shuttering and consolidating at an alarming rate while prices drop ever lower. Capitalizing on this favorable pricing, the use of solar in the US is growing, from small-scale residential, commercial and industrial to utility-scale applications.
While congressional deadlock has paralyzed initiatives to extend the 1603 Grant and the PTC, the White House has taken it upon itself to spur development through an Executive Order that would �= �#���� ��+������"�������`������������#���������������������solar and wind energy projects.
��� �����������`}��?�����}�������������"����������������#������#�seven large-scale projects on public land that will receive special coordinated attention in an effort to fast-track deployment of nearly 5,000 MW of renewable power in Arizona, California, Nevada and Wyoming. However, as is the case with the PTC and myriad other incentives, it won’t be clear until November to see what will become of the plan.
WindNaturally, the pressing question in the wind industry involves the extension of the Production Tax Credit. While wind advocates celebrate the surpassing of 50 GW of domestic installed capacity, turbine and component manufacturers are already bracing for the slack that, even in the case of an 11th-hour extension, is sure to sap development into 2013. In light of the potential expiration of ������?���������������� ������������#� ��+���������������"���������
lapse in predevelopment activity and turbine orders; reports persist throughout the country of increasing layoffs at manufacturing facilities preparing for the worst.
Meanwhile, legislation extending the PTC is lumbering along with bipartisan support. The Family and Business Tax Cut Certainty Act of 2012, which includes a one-year extension of the wind energy PTC, passed the Senate Finance Committee in early August. However, extension legislation is inextricably attached to the upcoming elections; while the Senate suggests that a vote on the legislation was possible in September, the Republican-dominated House has indicated that no such vote would take place prior to 6 November. Indeed, a congressional shake-up or a Romney victory could spell the end of the incentive permanently. It is #����$������������ ����������"������#���������#�������� ���������could have, but previous expirations in 1999, 2001, and 2003 resulted in drops of annual installed capacity of 93%, 73% and 77% respectively.
Thus, developers are scrambling to commence construction on projects before year end. According to American Wind Energy Association statistics, Q1 and Q2 installations totaled 1,695 and 1,200 megawatts respectively, bringing cumulative installed capacity to 49,802 MW by mid-2012. This represents 34% increase �����������#��� ������J}����������������������������"������������period in 2011. Meanwhile, there are currently over 10,300 MW under construction across 30 states, 40% more than were under construction at this point one year ago.
California and Texas continue expanding enviable renewable portfolios with large wind installations. While Alta Wind already represents one of the largest wind installations in the country, Terra-Gen Power recently announced that it closed $650 million ��������������������}��#��<<���#�<��������������= ����#�����##�168 and 132 MWs to the facility, respectively. Their completion would bring the total capacity of the Alta Wind Energy Center to 1,320 MW.
While California and Texas maintained dominance over the domestic wind industry, some Midwestern states are posting impressive growth. In particular, both Kansas and Michigan are
This is a sample of the main market activities in the renewables sector over the past quarter.
SourcesAll information relating to market activity in the sector is obtained from publicly available sources.
poised to double their installed capacity, with 1,300 and 500 MWs currently under construction, while Illinois and Ohio commissioned over 200 and 300 MWs, respectively, in Q2. In Michigan, DTE Energy completed construction and began full commercial � ������������������������?�$���}��#����+�������\$�����������the state’s largest wind facilities to date. The 212.8-MW project represents only part of DTE Energy’s plan to meet Michigan’s RES; the utility intends to add 1,000 MW of renewable facilities to meet its goal of 10% renewable energy by 2015. Michigan may see an even greater boost in development this September, as the state votes on a ballot proposal to expand the existing RES from 10% by 2015 to 25% by 2025.
Meanwhile, Illinois celebrated the start of full commercial � ���������������������J}������ �>����}��#�X���������������\$�'��Bishop Hill, which features 133 turbines located on 22,000 acres of farm land, is poised to expand; the 81 MW Bishop Hill II facility is currently under construction, and a Bishop Hill III project, currently in development, would add an additional 83 turbines.
As mentioned above, the White House “We Can’t Wait” initiative saw the selection of seven large-scale projects on public land that will receive fast-track review. Of these, two are wind facilities. ���������������$�#�����������}��#�X������ �� ���#�J���"��Wind Energy project, a phased effort comprising up to 258 wind turbines generating up to up to 500 MW on federally managed
lands in Mohave County. As part of the project, transmission lines are planned to connect to existing Western Area Power Administration lines. The Department of the interior expects �����"��#���#�#�����������#��������\��$�������'��������#������������������}�����>�$�����������"��������� �� ���#�Chokecherry/Sierra Madre Wind Energy project, located on over 225,000 acres in Carbon County, Wyoming. The project is the largest proposed wind farm in North America, with the potential to produce up to 3,000 MW of wind energy. Due to its mammoth size, Chokecherry represents a very complex review process, culminating in a series of right-of-way applications through October, 2014, the target date for completing Federal permit and review decisions. Wyoming has more immediate reason to celebrate, however, with the execution of a lease of 12,000 acres from the city of Cheyenne for a proposed 150-turbine wind farm. The US $750 million Belvoir Ranch, projected to generate up to 300 MW, is, like most other wind projects currently in developments, in a state of relative limbo pending some conclusion on the PTC extension. A number of massive wind development are scheduled to come online in 2012, most notably Oregon’s Shepherd’s Flat, boasting 845 MW of nameplate capacity. This project is remarkable not only for its scale; it also represents major contributions from non-traditional corporate tax equity investors. In light of the often-discussed dearth of tax equity, this bodes well for the industry.
United States renewable energy attractiveness indices | Issue 9 17United States renewable energy attractiveness indices | Issue 916
SolarWhile solar is not under the same pressure to complete projects before year end, the pace with which installed capacity is growing mirrors that of wind. However, whereas recently-commissioned and developing wind projects continue to demonstrate immense scale, solar is seeing considerable support from the smaller and less volatile residential and commercial segments. Much of this may be attributable to growth in the third-party ownership model in the residential and commercial segments. Moreover, ����K��#���������� � ��������*�����K��������������������
“safe harbored” solar assets — originally purchased late in 2011 in order to reach the 1603 Grant construction commencement provisions, to individual projects.
According to Solar Energy Industries Association (SEIA), Q1 2012 (500+ MW) represented the second greatest quarter in solar installation behind Q4, 2011. In that period, residential (94 MW) and commercial (289 MW) installations beat all previous records, while utility-scale installations dipped. The momentum continued into the second quarter; IMS research reports that PV installations ������������������!�������������������������������=�months of 2012, during which time the US accounted for 40% of global new solar PV capacity growth. 2012 is �= ����#���������������������������J�;�������� ��#�����3.3 GW in total installations at year end.
The year to date has seen numerous big investments in third-party ownership, with traditional banking
investors (US Bank, Rabobank, Morgan Stanley) as well as corporate investors (Google) contributing equity to �������#�������$����$�#�������������������� ���������(SunRun, SolarCity, etc.). In these arrangements, investors receive the 30% federal Investment Tax Credit (ITC) and #� ����������������������������� ��������������*�����regular payments over the equipment lease term, and the customer self-generates renewable electricity at a discount to prevailing retail utility rates without having to purchase the system.
<���##�����������=�������������#�����#� �������������������etc.), these funds are also beginning to capitalize on the stabilizing SREC market. Key solar states such as J������$�������J�����#���#�[���\��������������#� ��in installations), have seen their SREC markets stumble in ������������������ ���������"��#�"��� �������#�K��#�#�markets. Recently passed legislation in these states places ������$�#����������������������*���#�F;X?����*�����accelerating the programs and absorbing that SREC oversupply. In addition, the sheer volume of residential deals has dampened SREC market volatility. Stabilizing these markets has led some to believe that consistent F;X?������K����������������������#'������=�� ����?�����Power Finance (CPF), which channels third-party dollars into distributed solar installations, traditionally guaranteed equity returns exclusively from PPAs. Now, SREC revenue will also be part of the contract between investors and CPF, $����������������"�����������$������������������������#�transferring the volatility of commodity trading to CPF.
Aside from the residential segment, the commercial segment is making strides. Walmart provides the most visible example, as the retail giant proceeds on its long-term goal of 100% renewable energy procurement. As of August, Walmart had commissioned more than 150 solar installations within the US, and the company plans to install solar panels on top of approximately half of its Massachusetts stores. The retailer expects to have more than 90 MW of capacity online by the end of 2012. Apple is also expanding its self-generation footprint, with a 20 MW solar facility attached to a data center in North Carolina.
In contrast, utility-scale development, while surpassing Q1 2011 and Q1 2010 benchmarks, grew at a slightly more modest pace than residential and commercial. The ��������������������������������#�������������� �������quarters on record in Q3 and Q4 of 2011, and there have been numerous notable accomplishments. In California, the 230-megawatt Antelope Valley Solar Ranch One ���F;��� ��+�����$�������������������#��$������$��#��(CdTe) modules, began panel installation after a dispute �"������������������������������ ���������#�����=���#�#�delays. Elsewhere in the southwest, Agua Caliente, a 290-megawatt solar project in Yuma County, Arizona, has reached more than 85% completion and is already delivering more than 250 MW to the grid. When complete, Agua Caliente will be the world’s largest operating photovoltaic power plant. Like Wyoming, Arizona,
?������������#�[�"�#������ ��������#��������������������`}��?�����}�������������"��������������#������#��"����������solar projects for fast-track review.
Biomass/GeothermalAs with solar and wind, California is a leading state in biomass (second only to Washington) and geothermal ������'�<�����*������=���#��������������� ���������������the commissioning of Energy Source’s 50 MW Hudson Ranch facility in the bountiful Salton Sea geothermal resource area, a region generating only 300 MW of a suspected 1,400 to 2,000 MW of potential capacity. Nevada has also commissioned over 30 MW of geothermal in 2012 and has the greatest number of projects currently in development (almost 60) for more than 600 MW in planned capacity addition.
Like wind, biomass and geothermal projects are � �������������= �������������������?�����������������sunset at the end of 2013. Also like wind, many biomass and geothermal projects rely upon this incentive to ��������� ����������'��������������#��������� �� �������are requesting that an extension of the PTC would include extensions not only for wind, but also for these technologies that have traditionally been eligible for the PTC.
United States renewable energy attractiveness indices | Issue 9 19United States renewable energy attractiveness indices | Issue 918
Wind indicesWind indices Solar indices
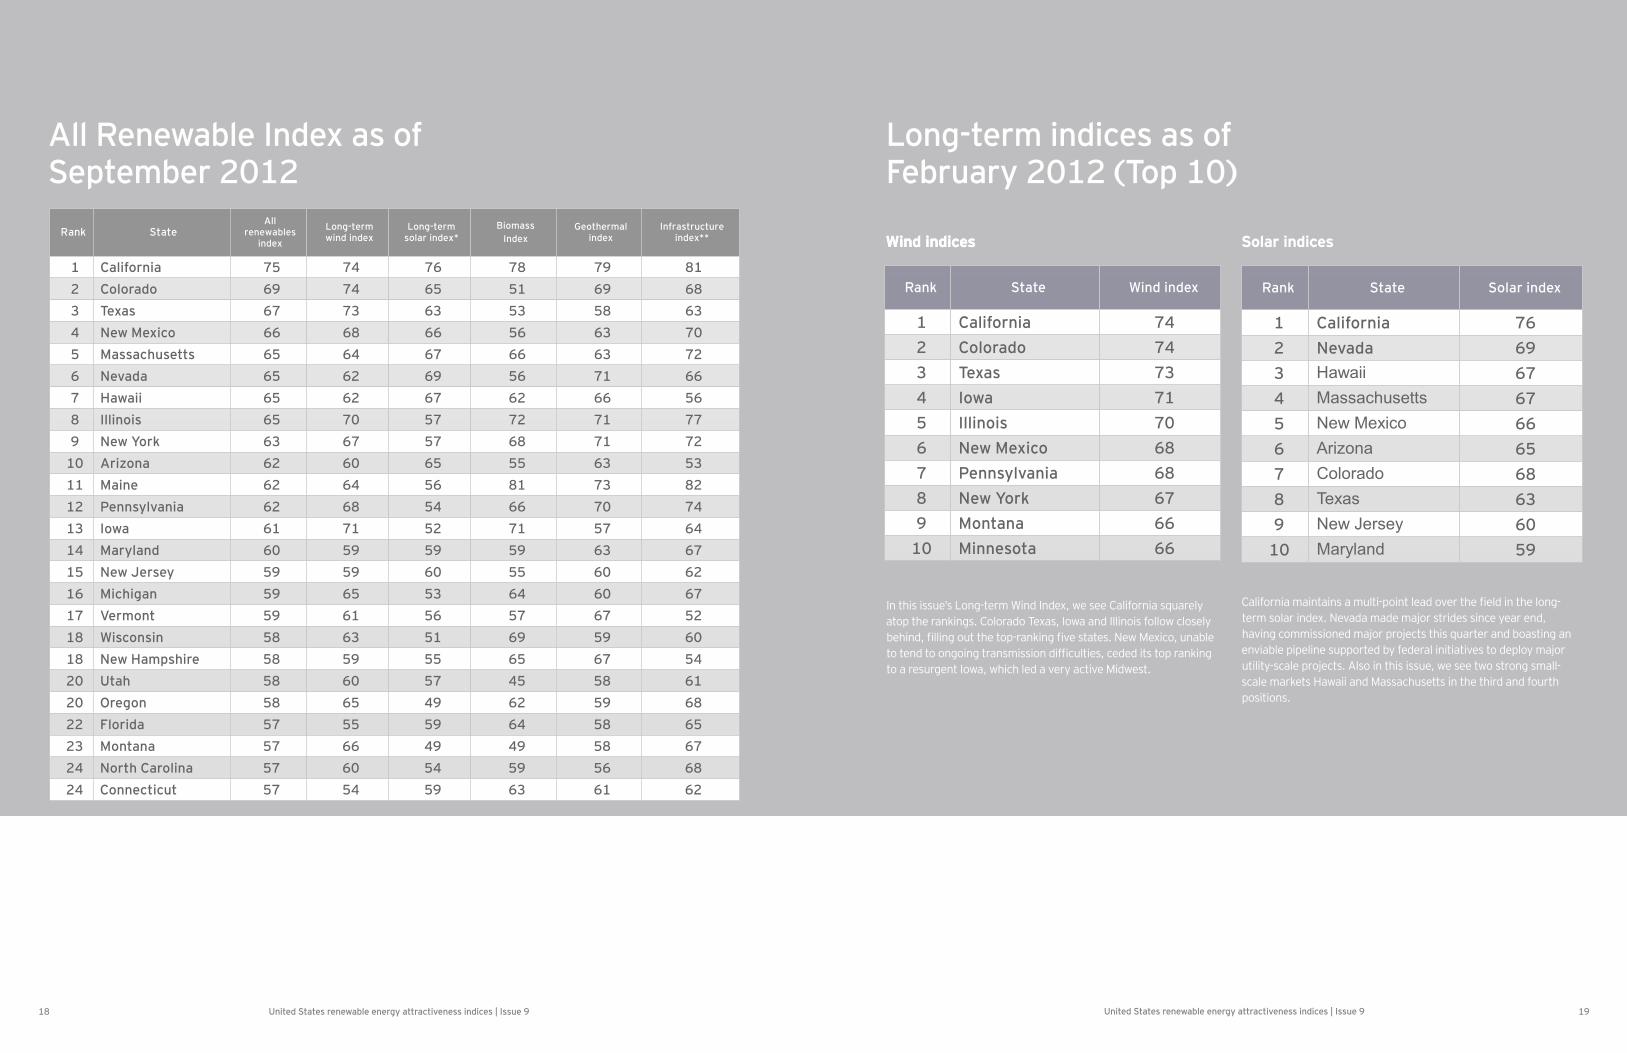
In this issue’s Long-term Wind Index, we see California squarely atop the rankings. Colorado Texas, Iowa and Illinois follow closely �����#���������$�������� ����*����"��������'�[���J�=�����$������������#�����������������������#����$���������#�#������� ����*���to a resurgent Iowa, which led a very active Midwest.
?�����������������������$���� ��������#��"����������#������������term solar index. Nevada made major strides since year end, having commissioned major projects this quarter and boasting an enviable pipeline supported by federal initiatives to deploy major utility-scale projects. Also in this issue, we see two strong small-scale markets Hawaii and Massachusetts in the third and fourth positions.
All Renewable Index as of September 2012
Long-term indices as of February 2012 (Top 10)
Rank StateAll
renewablesindex
Long-term wind index
Long-term solar index*
BiomassIndex
Geothermal index
Infrastructure index**
1 California 75 74 76 78 79 812 Colorado 69 74 65 51 69 683 Texas 67 73 63 53 58 634 New Mexico 66 68 66 56 63 705 Massachusetts 65 64 67 66 63 726 Nevada 65 62 69 56 71 667 Hawaii 65 62 67 62 66 568 Illinois 65 70 57 72 71 779 New York 63 67 57 68 71 72
10 Arizona 62 60 65 55 63 5311 Maine 62 64 56 81 73 8212 Pennsylvania 62 68 54 66 70 7413 Iowa 61 71 52 71 57 6414 Maryland 60 59 59 59 63 6715 New Jersey 59 59 60 55 60 6216 Michigan 59 65 53 64 60 6717 Vermont 59 61 56 57 67 5218 Wisconsin 58 63 51 69 59 6018 New Hampshire 58 59 55 65 67 5420 Utah 58 60 57 45 58 6120 Oregon 58 65 49 62 59 6822 Florida 57 55 59 64 58 6523 Montana 57 66 49 49 58 6724 North Carolina 57 60 54 59 56 6824 Connecticut 57 54 59 63 61 62
Rank State Wind index
1 California 742 Colorado 743 Texas 734 Iowa 715 Illinois 706 New Mexico 687 Pennsylvania 688 New York 679 Montana 66
10 Minnesota 66
Rank State Solar index
1 California 762 Nevada 693 Hawaii 674 Massachusetts 675 New Mexico 666 Arizona 657 Colorado 688 Texas 639 New Jersey 60
10 Maryland 59
United States renewable energy attractiveness indices | Issue 9 21United States renewable energy attractiveness indices | Issue 920
Solar Electric Generating System reaching the halfway point in construction. The solar thermal system went on line in late April when it began delivering more than 50 MW. Still under ������$������������������������������������������������ ����� �����to be built on public land and, with a planned capacity of 392 MW, will be the largest solar facilities in the world when complete in 2013. Additionally, two massive proposed projects were included in the “We Can’t Wait” initiative. The proposed Desert Harvest Solar Energy project in Riverside County would utilize photovoltaic technology to produce an estimated 150 MW of solar energy, while the proposed McCoy Solar Energy, also in Riverside County, would produce an estimated 750 MW of solar PV energy. Both projects are scheduled to complete Federal permit and review decisions by December 2012.
Aside from an aggressive RPS and the CSI, California administers a number of programs geared toward growth in distributed generation, such as the Renewable Auction Mechanism (RAM). This mechanism is a market-based procurement mechanism for large investor-owned utilities. The California Public Utilities Commission expects RAM, which operates like streamlined feed-in-tariff, to complement the RPS program by reducing transaction costs and providing a procurement opportunity for smaller RPS-eligible projects (<20 MW). California also administers a more traditional feed-in tariff, which allows eligible customer-generators to enter into 10-, 15- or 20-year standard contracts with their utilities to sell the electricity produced by small renewable energy systems (<3 MW) at time-differentiated market-based prices.
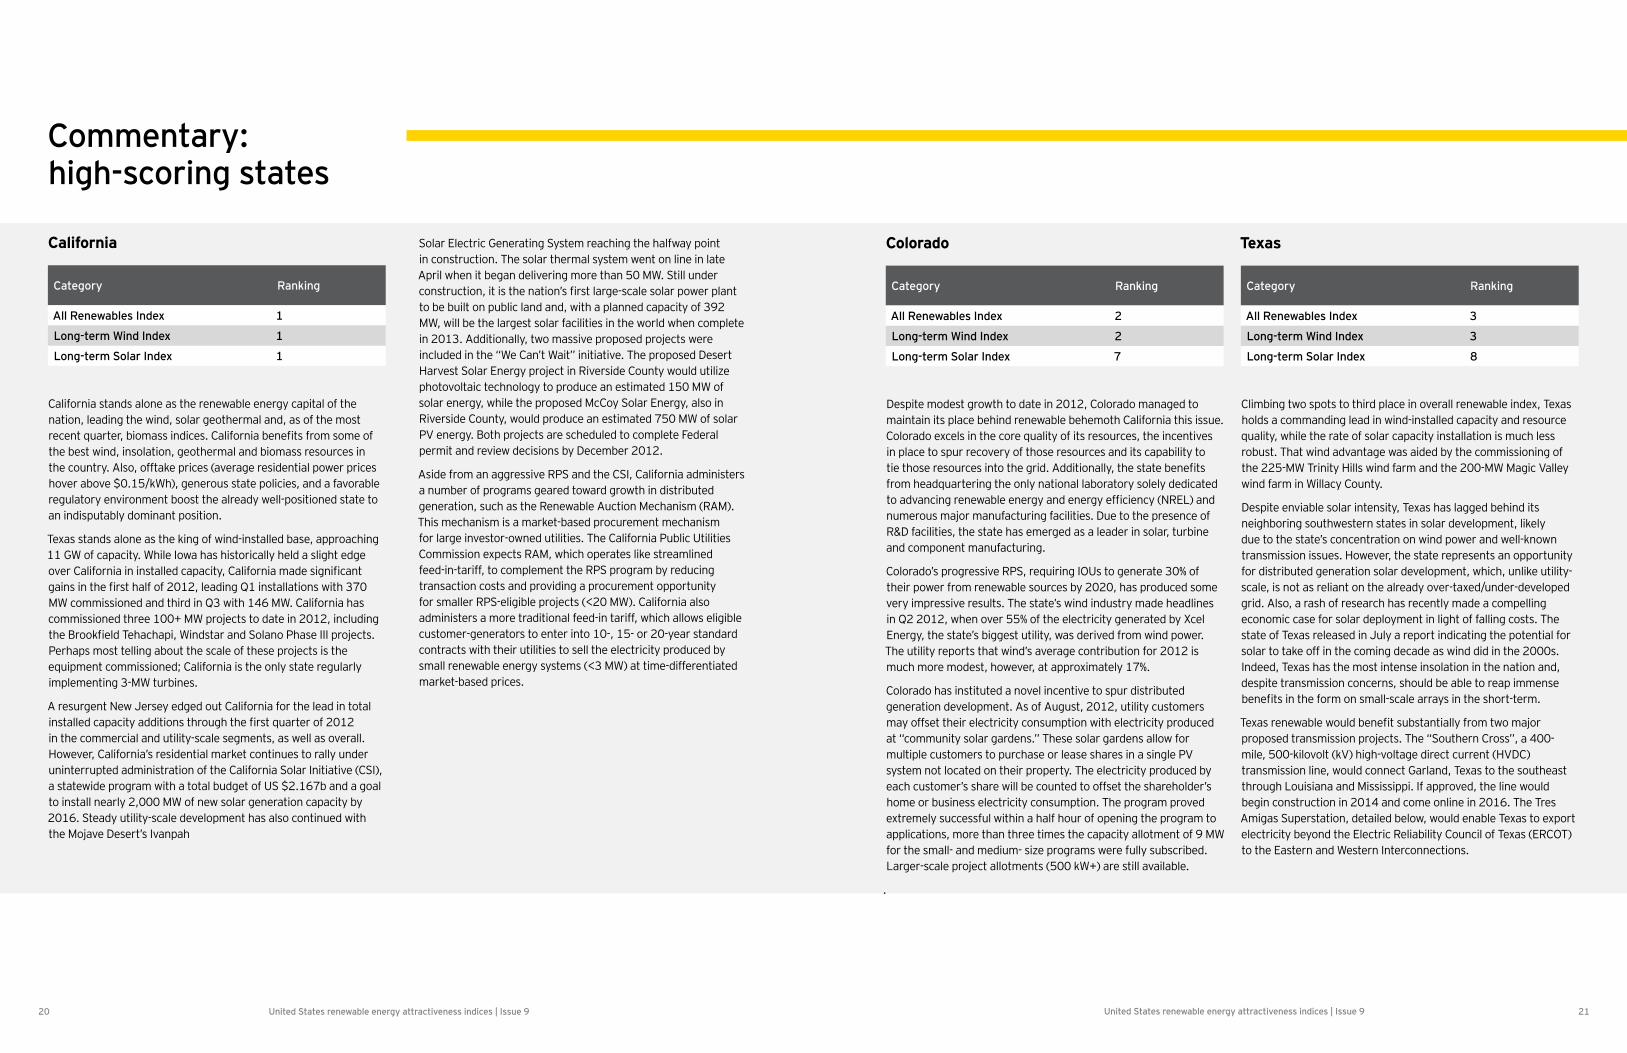
Commentary: high-scoring states
California
Category Ranking
All Renewables Index 1
Long-term Wind Index 1
Long-term Solar Index 1
California stands alone as the renewable energy capital of the nation, leading the wind, solar geothermal and, as of the most �������]$�����������������#����'�?�������������������������������the best wind, insolation, geothermal and biomass resources in the country. Also, offtake prices (average residential power prices hover above $0.15/kWh), generous state policies, and a favorable regulatory environment boost the already well-positioned state to an indisputably dominant position.
Texas stands alone as the king of wind-installed base, approaching 11 GW of capacity. While Iowa has historically held a slight edge �"���?���������������������#��� ������?������������#����������������������������������������������#��� ����������������������¡��MW commissioned and third in Q3 with 146 MW. California has commissioned three 100+ MW projects to date in 2012, including ��������*���#�������� ���}��#�������#�F������������<<<� ��+����'�Perhaps most telling about the scale of these projects is the equipment commissioned; California is the only state regularly implementing 3-MW turbines.
�����$�����[���\������#�#��$��?���������������������#������������������#��� ������##�����������$�����������]$��������������in the commercial and utility-scale segments, as well as overall. However, California’s residential market continues to rally under uninterrupted administration of the California Solar Initiative (CSI), a statewide program with a total budget of US $2.167b and a goal to install nearly 2,000 MW of new solar generation capacity by 2016. Steady utility-scale development has also continued with the Mojave Desert’s Ivanpah
Colorado
Category Ranking
All Renewables Index 2
Long-term Wind Index 2
Long-term Solar Index 7
Despite modest growth to date in 2012, Colorado managed to maintain its place behind renewable behemoth California this issue. Colorado excels in the core quality of its resources, the incentives in place to spur recovery of those resources and its capability to ��������������$����������������#'��##����������������������������from headquartering the only national laboratory solely dedicated ����#"�����������������������#����������������[;X@����#�numerous major manufacturing facilities. Due to the presence of R&D facilities, the state has emerged as a leader in solar, turbine and component manufacturing.
Colorado’s progressive RPS, requiring IOUs to generate 30% of their power from renewable sources by 2020, has produced some very impressive results. The state’s wind industry made headlines ��� ��������������"�����!��������������������������#��������Energy, the state’s biggest utility, was derived from wind power. The utility reports that wind’s average contribution for 2012 is much more modest, however, at approximately 17%.
Colorado has instituted a novel incentive to spur distributed generation development. As of August, 2012, utility customers may offset their electricity consumption with electricity produced at “community solar gardens.” These solar gardens allow for multiple customers to purchase or lease shares in a single PV system not located on their property. The electricity produced by each customer’s share will be counted to offset the shareholder’s home or business electricity consumption. The program proved extremely successful within a half hour of opening the program to applications, more than three times the capacity allotment of 9 MW for the small- and medium- size programs were fully subscribed. Larger-scale project allotments (500 kW+) are still available.
.
Texas
Category Ranking
All Renewables Index 3
Long-term Wind Index 3
Long-term Solar Index 8
Climbing two spots to third place in overall renewable index, Texas holds a commanding lead in wind-installed capacity and resource quality, while the rate of solar capacity installation is much less robust. That wind advantage was aided by the commissioning of the 225-MW Trinity Hills wind farm and the 200-MW Magic Valley wind farm in Willacy County.
Despite enviable solar intensity, Texas has lagged behind its neighboring southwestern states in solar development, likely due to the state’s concentration on wind power and well-known transmission issues. However, the state represents an opportunity for distributed generation solar development, which, unlike utility-scale, is not as reliant on the already over-taxed/under-developed grid. Also, a rash of research has recently made a compelling economic case for solar deployment in light of falling costs. The �����������=����������#����\$������ ������#����������� �������������solar to take off in the coming decade as wind did in the 2000s. Indeed, Texas has the most intense insolation in the nation and, despite transmission concerns, should be able to reap immense ����������������������������������������������������������'
��=���������������$�#���������$����������������������+���proposed transmission projects. The “Southern Cross”, a 400-mile, 500-kilovolt (kV) high-voltage direct current (HVDC) transmission line, would connect Garland, Texas to the southeast through Louisiana and Mississippi. If approved, the line would begin construction in 2014 and come online in 2016. The Tres Amigas Superstation, detailed below, would enable Texas to export electricity beyond the Electric Reliability Council of Texas (ERCOT) to the Eastern and Western Interconnections.
United States renewable energy attractiveness indices | Issue 9 23United States renewable energy attractiveness indices | Issue 922
Massachusetts
Category Ranking
All Renewables Index 5
Long-term Wind Index 16
Long-term Solar Index 4
Although not particularly strong in wind generation, Massachusetts represents the fourth most attractive market for solar development according to our analysis. Massachusetts presents small-scale solar installers, both residential and non-residential, with attractive offtake prices. A number of legislative actions further buoyed the state in 2012.
In August, the Massachusetts governor signed a new Energy Act into law (SB2395), which doubled the net metering capacity on the amount of excess power produced by solar electric installations that can be fed back into the grid. The bill also exempted certain small private projects from the net-metering cap. The previous cap had been met earlier this year for certain market segments and threatened to diminish the incentive net metering makes available to customers.
In addition, SB 2395 extends from 31 December 2012 to 31 December 2016 the requirement that electric distribution companies solicit proposals for long-term renewable generation contracts. These contracts, with terms ranging from 10 to 20 years, may include RECs, energy, or a combination of both.
Massachusetts has, as a result of such incentives and a very healthy SREC market, become one of the most attractive states in the union for small-scale solar. In August, Walmart announced its intent to install solar panels on top of approximately half of its Massachusetts stores. Borrego Solar also recently closed a US $64M fund for third-party solar installations exclusively throughout Massachusetts. As mentioned in a previous section, this deal also monetizes future SREC revenue, a credit to the stability of a once-extremely volatile commodity.
New Mexico
Category Ranking
All Renewables Index 4
Long-term Wind Index 6
Long-term Solar Index 5
While not particularly strong in any one technology, New Mexico represents broadly attractive and underdeveloped opportunity for solar, wind and geothermal generating capacity. Top-tier wind resources would be better capitalized upon with improved transmission infrastructure, which may be approaching. Local demand for renewable energy is limited, but a means of exporting the potential power could unlock an explosion in New Mexico development.
Groundbreaking for the Tres Amigas SuperStation was announced ����\$�������������$������ ��+����� ��������������������#�in recent months, likely in anticipation of a resolution to the PTC expiration. If completed, Tres Amigas would serve as the nation’s �����������������������*����$����������������$�����#��������of electricity throughout various interconnections.
�##����������$ �����"���������������������������������¢�����900 miles, 1,100 to 3,500 MW, are currently under state review by the state Renewable Energy Transmission Authority (RETA). ;X��������$ ����#����������������������"�� �� �����������$#���the 900-mile Centennial West Clean Line, which would add 3,500 MWs to the grid, and the Lucky Corridor, which recently signed a memorandum of understanding with the Western Area Power Administration to explore the potential joint development of a 93-mile, 230 kV transmission line project in the northern part of the state. Both of these projects would enable export of New Mexico’s wind and solar energy to electricity users across the West, and could open the state up to rapid development. Unfortunately, these transmission projects appear to be in a holding pattern in light of the uncertainty surrounding the PTC.
Finally, Cape Wind continues to trudge along. The most recent approval came from the FAA, which concluded that the project ��$�#����������������������������������������'�F������������������Cape Wind announced the purchase of Falmouth Marina to serve as the base of operations for the project. A spokesman for the ��+������#�����#����������������= ���������������������������the second quarter of 2013, begin construction in 2014 and begin operations in 2015. The company has secured PPAs for sale of nearly 80% of the proposed 468 MW of installed capacity at the facility.
Nevada[�"�#����#����������������� ���������$����������������$�������development and a potentially massive solar pipeline. Commercial operation began for the 151 MW Spring Valley Wind Farm, [�"�#������������#� ��+������� $��������#'�����££��$��������������has a 20-year power purchase agreement for the wind farm with NV Energy.
Additionally, the state has been tapped by the White House for two of seven fast-track proposal reviews. The Moapa Solar Energy Center If approved, would deploy100 MW of PV and 100 MW of CSP on public land. The target date for completing federal review is December, 2013. Secondly, the Silver State South project would produce an estimated 350 MW of solar PV energy. Review for the Silver State South Project should be complete by March 2013. Construction on the 50 MW Silver State North Project has already �������� ����#����*��������������������� ��+������� $��������#�����be delivering power to the grid.
United States renewable energy attractiveness indices | Issue 9 25United States renewable energy attractiveness indices | Issue 924
Commentary: key states
SREC Developments[���\������J�����#���#�������"�������#��"�������F;X?�prices to market-leading installed capacity in the residential and commercial solar segments. At the close of 2011, solar development in these three states had all but ceased in light of F;X?��"���$ �'�<��������J�����#���#�[���\������ �������*�to life in response to new legislation, while Pennsylvania lost the opportunity to follow suit and still languishes in a stalled market.
<�������\$�����"������?������������#�F��¢����`�������$���������bill,” into law. The law replaces the RPS’s GWh solar carve-out, established in 2010, with a percentage carve-out of 3.47%, effectively accelerating the state’s solar RPS. The response was �����������#���������[���\����������#�����$������������ ��2012 for solar installations.
In Maryland a similar bill, S.B. 791, also increased the solar carve-out, accelerating the amount of renewable energy that must be derived from solar in the state’s RPS. These credits have also been monetized effectively, as a the state’s largest solar array, currently under construction, has not only a 20-year PPA to sell electricity, but will also sell the SRECs.
Pennsylvania, however, failed to enact legislation which would have lifted its moribund REC market. The proposed H.B. 1580 would accelerate the solar carve-out from 0.14% to 0.2% by 2015 in hopes of boosting the SREC market. However, the legislation has languished in committee for months, and there is little hope that it will proceed any time soon in the face of scathing opposition from the Energy Association of Pennsylvania, which claims that its ��������$�#����������$�����¤���J���������������������������implementation.
For more details on the country attractiveness indices (CAI) and previous issues, please visit www.ey.com/CAI
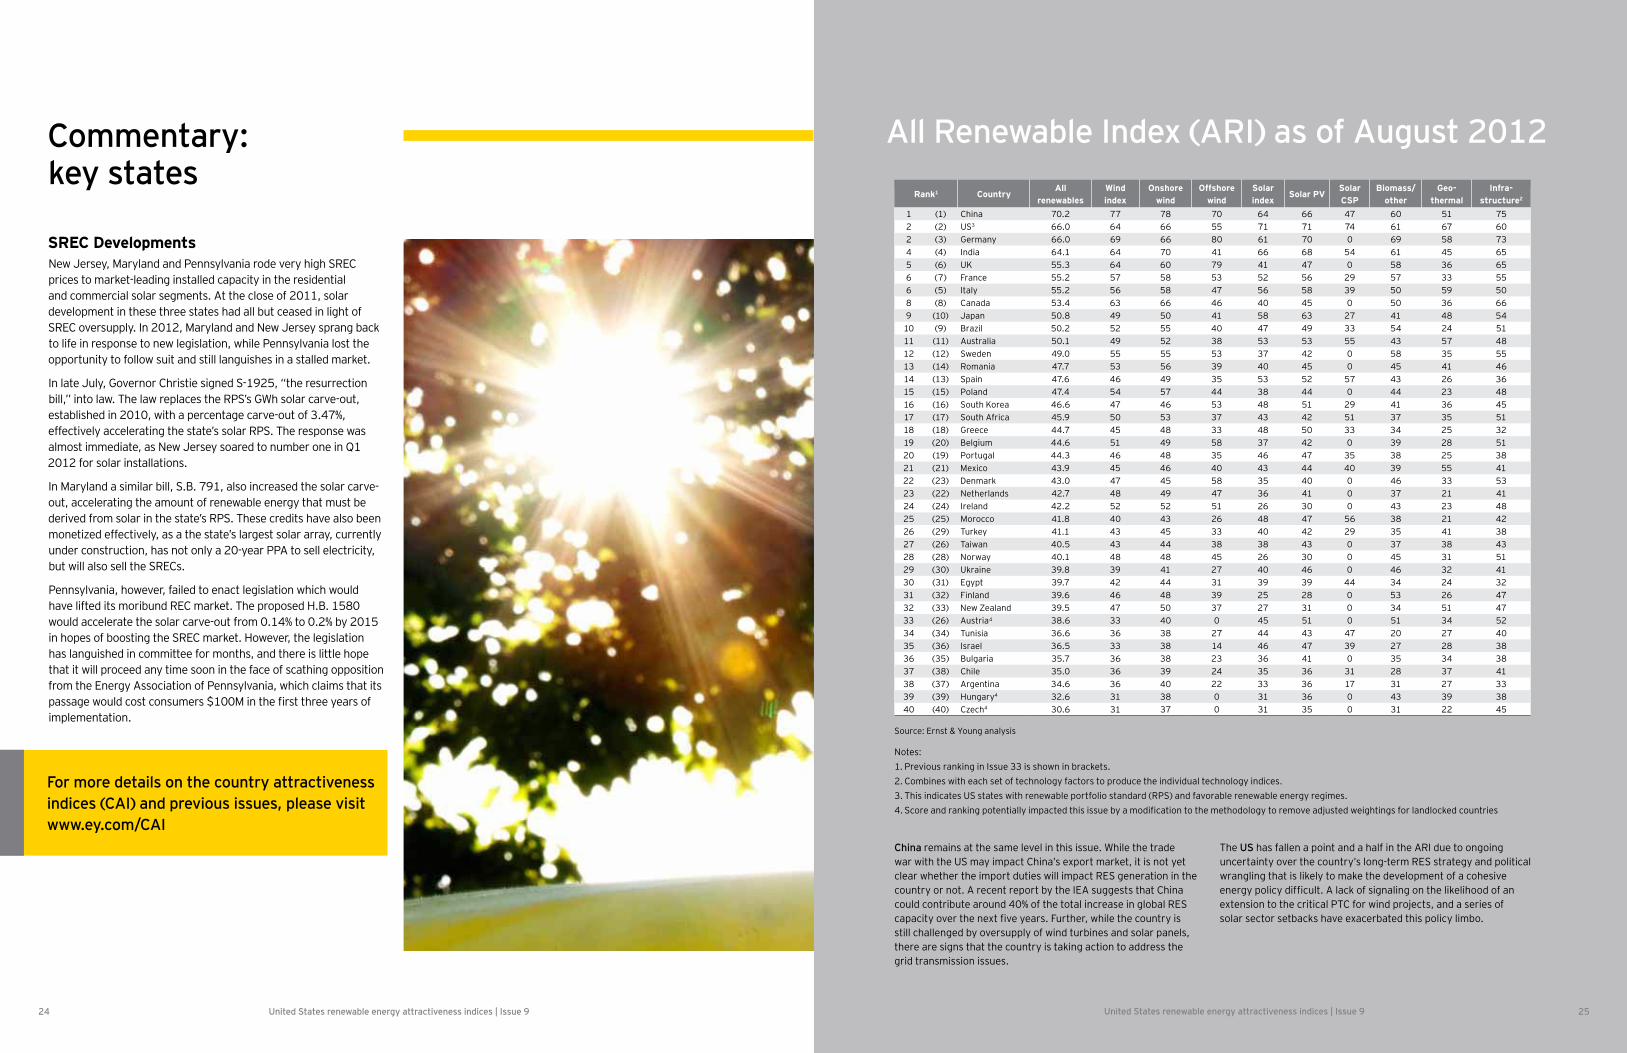
Rank1 CountryAll
renewablesWind index
Onshore wind
Offshore wind
Solar index
Solar PVSolar CSP
Biomass/ other
Geo-thermal
Infra- structure2
1 (1) China 70.2 77 78 70 64 66 47 60 51 752 (2) US3 66.0 64 66 55 71 71 74 61 67 602 (3) Germany 66.0 69 66 80 61 70 0 69 58 734 (4) India 64.1 64 70 41 66 68 54 61 45 655 (6) UK 55.3 64 60 79 41 47 0 58 36 656 (7) France 55.2 57 58 53 52 56 29 57 33 556 (5) Italy 55.2 56 58 47 56 58 39 50 59 508 (8) Canada 53.4 63 66 46 40 45 0 50 36 669 (10) Japan 50.8 49 50 41 58 63 27 41 48 54
10 (9) Brazil 50.2 52 55 40 47 49 33 54 24 5111 (11) Australia 50.1 49 52 38 53 53 55 43 57 4812 (12) Sweden 49.0 55 55 53 37 42 0 58 35 5513 (14) Romania 47.7 53 56 39 40 45 0 45 41 4614 (13) Spain 47.6 46 49 35 53 52 57 43 26 3615 (15) Poland 47.4 54 57 44 38 44 0 44 23 4816 (16) South Korea 46.6 47 46 53 48 51 29 41 36 4517 (17) South Africa 45.9 50 53 37 43 42 51 37 35 5118 (18) Greece 44.7 45 48 33 48 50 33 34 25 3219 (20) Belgium 44.6 51 49 58 37 42 0 39 28 5120 (19) Portugal 44.3 46 48 35 46 47 35 38 25 3821 (21) Mexico 43.9 45 46 40 43 44 40 39 55 4122 (23) Denmark 43.0 47 45 58 35 40 0 46 33 5323 (22) Netherlands 42.7 48 49 47 36 41 0 37 21 4124 (24) Ireland 42.2 52 52 51 26 30 0 43 23 4825 (25) Morocco 41.8 40 43 26 48 47 56 38 21 4226 (29) Turkey 41.1 43 45 33 40 42 29 35 41 3827 (26) Taiwan 40.5 43 44 38 38 43 0 37 38 4328 (28) Norway 40.1 48 48 45 26 30 0 45 31 5129 (30) Ukraine 39.8 39 41 27 40 46 0 46 32 4130 (31) Egypt 39.7 42 44 31 39 39 44 34 24 3231 (32) Finland 39.6 46 48 39 25 28 0 53 26 4732 (33) New Zealand 39.5 47 50 37 27 31 0 34 51 4733 (26) Austria4 38.6 33 40 0 45 51 0 51 34 5234 (34) Tunisia 36.6 36 38 27 44 43 47 20 27 4035 (36) Israel 36.5 33 38 14 46 47 39 27 28 3836 (35) Bulgaria 35.7 36 38 23 36 41 0 35 34 3837 (38) Chile 35.0 36 39 24 35 36 31 28 37 4138 (37) Argentina 34.6 36 40 22 33 36 17 31 27 3339 (39) Hungary4 32.6 31 38 0 31 36 0 43 39 3840 (40) Czech4 30.6 31 37 0 31 35 0 31 22 45
Source: Ernst & Young analysis
Notes:1. Previous ranking in Issue 33 is shown in brackets.2. Combines with each set of technology factors to produce the individual technology indices.3. This indicates US states with renewable portfolio standard (RPS) and favorable renewable energy regimes.4.
China remains at the same level in this issue. While the trade war with the US may impact China’s export market, it is not yet clear whether the import duties will impact RES generation in the country or not. A recent report by the IEA suggests that China could contribute around 40% of the total increase in global RES
still challenged by oversupply of wind turbines and solar panels, there are signs that the country is taking action to address the grid transmission issues.
The US has fallen a point and a half in the ARI due to ongoing uncertainty over the country’s long-term RES strategy and political wrangling that is likely to make the development of a cohesive
extension to the critical PTC for wind projects, and a series of solar sector setbacks have exacerbated this policy limbo.
All Renewable Index (ARI) as of August 2012
United States renewable energy attractiveness indices | Issue 9 27United States renewable energy attractiveness indices | Issue 926
Commentary: guidance notes
Long-term IndexAs stated on page 4, the individual technology indices, which combine to generate the all renewables index, are made up as follows:
�� Renewables Infrastructure Index — 35%
�� Technology factors — 65%
These guidance notes provide further details on the renewables infrastructure index and the technology factors.
Renewables Infrastructure IndexThe renewables infrastructure index is an assessment, by state, of the general regulatory infrastructure for renewable energy. On a weighted basis, the index considers:
�� Strength of RPS (29%) — states with RPS were ranked based upon the immediacy of the target deadlines, the amount of renewable energy that needs to be developed to meet the target, penalties if the target is missed and the presence of a compliance-based renewable energy credit market.
�� Planning and grid connection issues (57%) — favorable planning environments (low failure rates, easy-to-navigate approval/permitting processes) are scored highly. Grid connection scoring is based on the ease of obtaining a grid connection in a cost-effective manner. The score also takes into account the degree of grid saturation for intermittent technologies.
�� ��������������������!���������*�������������$����������������������������"����������������������#������� ��������to equity and good lending terms, will score higher.
This generic renewables infrastructure index is combined with each set of technology factors to provide the individual technology indices.
Technology factors��������� �������=���#����� ��"�#�������$����� ����� assessments for each state, namely:
1. Onshore Wind Index2. Large-scale Solar Index3. Commercial Solar Index4. Residential Solar Index5. Geothermal Index6. Biomass and other resources index
Each of the technology indices considers, on a weighted basis, the following factors:
1 This considers the price received (including proceeds from REC sales and other major incentive programs, such as state production tax credits) per kWh of electricity generated.
2 Tax climate (8%) — favorable, high-scoring tax climates that stimulate renewable energy generation can exist in a variety of forms and/or structures. Typical incentives and structures are direct renewable energy tax breaks, sales tax abatements for equipment, real estate tax abatements and accelerated tax depreciation on renewable energy assets.
3 Grant or soft loan availability (8%) — grants can be available at local and/or regional levels and typically tend to be more prevalent in immature markets or technologies. Soft loans have historically been used for renewable energy technologies to kick-start the industry. High scores are achieved through an array of meaningful grants and soft loans.
4 Market growth potential (26%) — this category takes a holistic approach to estimating a state’s projected growth levels. The market growth potential takes into account information contained in other categories, as well as information gathered but not included in one of the other categories.
5 Current installed base (8%) — high installed bases demonstrate that the state has an established infrastructure and supply chain in place, which will facilitate continued growth. High installed bases are also indicative of the acceptance for such projects, and the lack of public support can make planning and ������� ��"���������#����$��'
6 Resource quality (18%) — this measures the quality of resources available; for example, wind speeds and solar intensity are indicators of resource quality.
Ernst & Young renewable energy services
Team overviewTax credit investment advisory services
With a dedicated 15-member team of advisors devoted to tax credit monetization, Ernst & Young LLP’s Tax Credit Investment Advisory Services (TCIAS) helps take advantage of the opportunities and address the risks associated with renewable energy activity.
Members of the group, supported by a network of experienced �����������������������������X�����|�~�$�����������������������worldwide, provide advice and services in the following areas:
�� Tax credit monetization
�� Financial modeling
�� Strategic planning
�� Transaction structuring
�� Investment due diligence
In addition to TCIAS, our Business Tax Services Group provides a wide variety of tax advisory services to the renewable energy industry. Among these are:
Renewable Energy GroupErnst & Young LLP’s Renewable Energy Group authors both the renewable energy country attractiveness indices and the biofuels indices. Members of the group provide advice in the following areas:
�� Financial advisory and valuation
�� Asset valuation
�� Transaction support
�� Financial modeling and structuring
�� Finance raising
�� PPA tendering
For more information on the Renewable Energy Group, go to http://www.ey.com/GL/en/Industries/Power---Utilities/Renewable-Energy-Overview
Strategic growth marketsErnst & Young LLP is at the forefront of issues affecting America’s best high-growth companies. Our vast experience advising these companies sustains our dominant competitive position in key markets, including our Assurance and Advisory services’ share of the Russell 2000®, Forbes’ largest private companies and the number of companies we assist in going public. We are also the leader in convening the experts who shape the business climate, and advising policy makers on the issues affecting these companies.
��������������� �������� ����Ernst & Young LLP can help clients move towards sustainability in their building projects, including helping to achieve LEED ����������������#� ��"�#�������#��$������������������#�����#�#$�������������������������]$� ��������������������$��#���'
Washington Council Ernst & Young (WCEY)WCEY is a legislative and regulatory advocacy group within Ernst & Young LLP that represents clients on a wide range of energy and energy tax issues. In the energy sector, WCEY represents a wide variety of renewable energy technologies and trade associations, including solar, hydropower, open-loop biomass, closed-loop biomass, biodiesel, renewable diesel and cellulosic biomass alcohol.
Business incentives and credit servicesErnst & Young LLP assists clients who are relocating, expanding or conducting research and experimentation activities. We help clients utilize economic development incentives offered by US state and local governments, including cash grants, tax credits, exemptions, abatements, loans and utility subsidies. For further information on our services and for future copies of the indices, please contact Mike Bernier or Dorian Hunt.
For more details on the USAI and previous issues, please visithttp://www.ey.com/GL/en/Industries/Oil---Gas/Oil_Gas_Renewable_Energy_Attractiveness-Indices
ContactsErnst & Young LLP
Michael Bernier+1 617 585 [email protected]
Dorian Hunt +1 617 375 2448 [email protected]
Ernst & Young
Assurance | Tax | Transactions | Advisory
About Ernst & Young
Ernst & Young is a global leader in assurance, tax, transaction and advisory services. Worldwide, our 167,000 people are united by our shared values and an unwavering commitment to quality. We make a difference by helping our people, our clients and our wider communities achieve their potential.
Ernst & Young refers to the global organization of member firms of Ernst & Young Global Limited, each of which is a separate legal entity. Ernst & Young Global Limited, a UK company limited by guarantee, does not provide services to clients. For more information about our organization, please visit www.ey.com
Ernst & Young LLP is a member firm serving clients in the US. Ernst & Young (LLP) is a member firm serving clients in Canada and Mancera.
© 2012 EYGM Limited. All Rights Reserved.
EYG No. YY2809 BSC no. 1210-1402093NY ED None
This publication contains information in summary form and is therefore intended for general guidance only. It is not intended to be a substitute for detailed research or the exercise of professional judgment. Neither EYGM Limited nor any other member of the global Ernst & Young organization can accept any responsibility for loss occasioned to any person acting or refraining from action as a result of any material in this publication. On any specific matter, reference should be made to the appropriate advisor.
Contacts:For further information on our services and points of view, please visit our websites www.ey.com/renewables or www.ey.com/CAI, or contact:
Paul Naumoff Global/Americas Leader, Sustainability and Cleantech Tax Services Ernst & Young LLP Columbus, OH [email protected]
Ben Warren Partner, Head of Environmental Finance Ernst & Young LLP [email protected]
Gil Forer Global Cleantech Center Leader Ernst & Young LLP New York, NY [email protected]
Scott Sarazen Global Cleantech Markets Leader Ernst & Young LLP Boston, MA [email protected]
John deYonge Director of Cleantech Account Enablement Ernst & Young LLP New Jersey [email protected]
Jay Spencer Americas Cleantech Leader Ernst & Young LLP Boston, MA [email protected]
Robert Seiter Europe/Middle East/Ireland/Africa Ernst & Young GmbH Cleantech Leader Germany [email protected]