university o f c o logne wor kin g paper s e ries in...
TRANSCRIPT

Department of EconomicsUniversity of CologneAlbertus-Magnus-PlatzD-50923 KölnGermany
http://www.wiso.uni-koeln.de
U N I V E R S I T Y O F C O L O G N E
W O R K I N G P A P E R S E R I E S I N E C O N O M I C S
No. 70
PORK BARREL POLITICS, VOTER TURNOUT, ANDINEQUALITY: AN EXPERIMENTAL STUDY
JENS GROßERTHORSTEN GIERTZ

Porkbarrelpolitics,voterturnout,andinequality:
Anexperimentalstudy*
JensGroßer(FloridaStateUniversity)i
ThorstenGiertz(emeneo,Shanghai)ii
ABSTRACT
Weexperimentallystudyporkbarrelpolitics in two‐candidatemajoritarianelections.Candidates
form distinct supporter groups by favoring some voters in budget spending at the expense of
others.Wecomparevoluntaryandcompulsorycostlyvotingandfindthat,onaverage,theformer
mode induces more narrowly targeted favors and therefore more inequality among otherwise
identicalvoters.Whenthesamecandidatesactovermanyelections,suchaswithparties,theytend
tocultivatepolicypolarizationbyfrequentlyfavoringtheirexclusivesupportersagainandavoiding
thoseoftheopponent,andwithcompulsoryvotingwefindadditionalfrequentpolicyoverlapfora
separatesubsetofvoters.Ourfindingsareimportantforunderstandinghowaninclinationtowards
asustained“dividedsociety”canarisepurelyfromthepoliticalprocess,absentofanycoordination
devicessuchasideologicalpreferences.
Thisversion:January,2014
Keywords:Porkbarrelpolitics,voterturnout,inequality,ColonelBlottogames,laboratoryexperiments
iFloridaStateUniversity,DepartmentsofPoliticalScienceandEconomics&ExperimentalSocialScienceatFloridaState(xs/fs),531BellamyBuilding,Tallahassee,FL32306,U.S.A.iiemeneoconsulting,Shanghai,ThePeople’sRepublicofChina.e‐mail:[email protected];[email protected]
* This is amuch improved version of “Candidates, voters, and endogenous group formation: A Colonel Blotto experiment“(2009).We thankWalterElberfeld,TomPalfrey, andArthurSchram forhelpful comments.Thepaperhasbenefitedgreatlyfrom comments of participants in seminars at the University of Amsterdam, University of Cologne, University of Hanover,Princeton University, and Florida State University, and at the 9th International Social Dilemma Conference in Chicago, thePublicChoiceSocietyandESAmeetings inSanAntonio, the InternationalESAmeetingsatHarvardUniversity, the1stEPCRMeetinginCanterbury,theGEWTagunginCologne,andtheSocialDilemmasConferenceatFloridaStateUniversity.

1
1Introduction
Pork‐barrelspendingisacommonpracticeineverydaypolicymaking.1Inordertoboosttheirchances
in the election, candidates promise generous budget shares to subsets of the electorate, hoping to
receive their votes and political contributions in return. For example, they promise subsidies to
declining industries (e.g., theU.S. textileandcoal industries;DixitandLondregan1995)and financial
help for local infrastructure projects (e.g., building and improvements of roads and harbors). Such
tactical redistribution has the potential to create inequalities between voters (Myerson 1993), and
thereforetocounteracttheprogrammaticredistributionviataxesandthegeneralwelfaresystemthatis
rooted in the basic belief in equality (Dixit and Londregan 1996).2 So far, political scientists and
economistshavestudiedtacticalredistributionunderthepremiseofcompulsoryvoting,albeitvotingis
voluntary in most elections around the world.3 So how then can the voting mode affect tactical
redistribution?Throughthecostsofvoting!Ifsuchcostsareinvolved,thencompulsoryandvoluntary
votingcanaffectpork‐barrelingandthusinequalityverydifferently.Towit, inordertolurevoluntary
votes,a candidate’spromises to individualvotersmustnotonlyexceed theirpromises received from
the opponent, but also compensate for their voting costs. We therefore argue that under budgetary
constraints, compared to the compulsorymode, voluntary voting forces candidates to target budget
spendingmore narrowly (i.e., makemore generous promises to fewer voters) and thus yieldsmore
inequality among otherwise homogenous voters. In the present paper,we utilize game theory and a
laboratoryexperimentinordertostudythisrelationshipbetweenthevotingmodeandinequality.
Considerour two‐stagegameof electoral competition,orpolitygame. In the first stage, twoex‐
ante identical candidates independently and simultaneously announce binding policy offers. That is,
eachtargetsindividualsfromafinitenumberofex‐anteidenticalvoters(notincludingthecandidates)
1 For an annual overview of pork barrel projects in theUnited States, see for example Citizens Against GovernmentWaste(http://cagw.org/reporting/pig‐book).2Here,weseetacticalredistributionasallocationofshort‐term favorsandprogrammaticredistributionas long‐termpoliciesthatonlychangewithmajorideologicalshiftsintheelectorate(e.g.,DixitandLondregan1996).AccordingtoStokes(2009),aprogrammaticelectoralstrategyexecutesfavorsfollowingapublicdebate,whilethisdebateisabsentinanon‐programmaticstrategy.Inhertaxonomy,ourstudyisbestcategorizedas“distributivepolitics”(i.e.,favorsarematerial,non‐programmatic,biased,andnotbasedonquidproquoarrangements).3TheInternationalInstituteforDemocracyandElectoralAssistance(IDEA)providesalistofcountrieswithcompulsoryvoting:http://www.idea.int/vt/compulsory_voting.cfm.
2
amongwhom,ifshewinstheupcomingelection,afixedbudgedisdividedevenly.Inthesecondstage,
majoritarianvotingtakesplace,withatie‐breakingcoinflip,wherethewinningcandidategetsabonus
(“spoilsofoffice”)andherpolicyoffer is implemented,and the losergoesawayempty‐handed.Thus,
candidates play a symmetric constant‐sum game. We focus on pure tactical redistribution, to wit,
candidatesneedonlyallocateafixedbudgetamongvoters(asinMyerson1993).4Forexample,theydo
not levy taxes or choose the budget level (Lizzeri 1999). And, we abstract away from exogenous
ideologicalpreferences(e.g.,CoxandMcCubbins1986;DixitandLondregan1996,1998)andeconomic
inefficienciesthatcanaccruefrompork‐barreling(e.g.,Baron1991;DixitandLondregan1995),albeit
efficiencyandinequalityaresomewhataffectedbythecostsofvoting.5Aswearethefirsttocompare
pork‐barrelingwithvoluntaryandcompulsoryvoting,usingpureredistributionseemsappropriate.
For the polity gamewith compulsory voting andmore than six voters, in any subgame perfect
equilibrium inweaklyundominated strategies, policy offersmustbe inmixed strategies and the two
candidateshaveequalchancesofwinning.Also,voterscastavoteforthecontenderwhopromisesthem
moremoneyor,iftheyareindifferent,voteforeithercontenderorblank(wefocusonequilibriawhere
eachoftheseactionsischosenwithprobabilityone‐third).If,tothecontrary,acandidateusesapure
strategythatfavorsaminorityofvoters,thentheopponentcanwinoutrightbytargetingtheremaining
majority.And,ifherpurestrategyfavorshalfoftheelectorateormore,thentheopponentcanwinwith
more than fifty percent chance by targeting all except one of these voters,which is a best response.
Thus,inanyequilibriumtheegalitarianoffercanonlyappearinastrictlymixedstrategyso,onaverage,
tacticalredistributioncreatesinequalityamongotherwisehomogenousvoters.Whilewithcompulsory
votingany strictlypositivepreference intensity (or, difference in receivedpromises)of a supporter is
sufficienttogarnerhervote,inthevoluntarymodetheintensitymustalsocompensateforthecostsof
4Incontrasttoourstudy,inMyerson(1993)thenumberofvotersisinfiniteandfavorsareiiddrawsfromthecandidates’offerdistributions,sothebudgetconstraintholdsonaverage.Further,inequilibrium,expostallvotershavedifferentoffersandareneverindifferentbetweenthecandidates,whileinourmodeltherearetypicallyindifferentvoters.Foranoverviewofmodelsoftacticalredistribution,seeforexamplePerssonandTabellini(2000).5Inthecompulsorymodethecostsofvotingaccruetoallvotersalike,whileinthevoluntarymodeonlythosewhochoosetoturnoutbearthecosts.Inthispaper,afixedbudgetmeansthatvoluntaryvotingisalwaysthemoreefficientmodeinthesenseof cost‐benefit analysis, unless everyone chooses to turn out in which case both modes are equally efficient. The greatestpossibleex‐postinequalityisbetweenvictor’ssupporterswhoabstainandvoterswhoreceivenopromisefromthevictorandturnout.Here,weconcentrateonredistributiveinequalitysolelycreatedviabudgetspending.

3
voting. Therefore, we predict that pork‐barrel spending is on average more narrowly targeted and
hencecreatesmoreredistributiveinequalitywithvoluntarythancompulsoryvoting.
Inourstudy,differentvotergroupsemerge fromendogenouspolicymaking,and their sizesand
compositionsofpreferenceintensitiesarepubliclyannouncedbeforevoting.Withvoluntaryvoting,we
thencananalyzeourelectionsasparticipationgameswithexogenoussupportergroupsandcomplete
information about group sizes (Palfrey and Rosenthal 1983), which have also been studied in the
laboratory (e.g., Großer and Schram 2010; Schram and Sonnemans 1996).6 In any Nash equilibrium
(henceforthNE)ofthesegames,onlyvoterswithpreferenceintensityequaltoorlargerthantwicethe
votingcostshaveapositiveturnoutprobability,andthisprobabilityalsodependsonallothervoters’
preferenceintensities, theelectoratesize,andsupportergroupsizes. Infact,aminoritycandidatecan
havehigherchances in theelection thanheropponentdue tosmaller free‐rider incentives insmaller
groups,andthiseffectisstrengthenediftheminorityalsocontainsgreaterpreferenceintensitiesthan
themajority, which regularly occurs in our game (cf. Campbell 1999). In contrast, with compulsory
votingamajoritycandidatealwayshashigherchances.However,NEfailstopredictturnoutlevelsand
patterns in experimental participation games,which aremuch better explained by quantal response
equilibrium(QRE;McKelveyandPalfrey1995)thatallowsfornoisydecision‐making(e.g.,Goereeand
Holt2005;GroßerandSchram2010).Ourstudyprovidesfirstinsightsintohowcandidatesandvoters
dealwiththedifferentcomplexitiesofthetwovotingmodes.
Of central concern in pork barrel politics are the commitment problems involved. To wit, the
candidatescanneverbesurethattheirsupporterswillvoteforthem,andvotersinturncannottakeit
for granted that policy promises will be fulfilled (e.g., Alesina 1988; Corazzini et al., forthcoming)
albeitpromisesarebindinginourstudysovotersfacenopreferenceuncertainty.Also,politicalparties
havelong‐terminterestsinkeepingpromises,andthereforearemoretrustworthythanlegislatorswho
are tempted tobreakpartydiscipline in favorof their constituencies (GrossmanandHelpman2005).
Here,weexaminewhether,andifsohow,candidatesandindividualvotersarewillingandabletoform
6Inabasicparticipationgame,twovotergroupscompeteinamajoritarianelectionwhereeachvoterdecidesonwhetherornottoturnouttovoteatacost.Here,wedefineparticipationgamesmorebroadly,sinceinourstudyarelativelysmallnumberofelectionscanarisethatarespecialcasesofthesegames,suchasthevolunteer’sdilemmagame(Diekmann1985).

4
long‐standingtacitpoliticalalliances(i.e.,viamutualpromisesandvotes)andhowsuchbondsimpact
pork‐barrelingandinequality.Inourexperiment,candidatesareeitherpartieswhoactineveryelection
orpoliticianswho change fromelection to election.7 Importantly, politicians cannot respond to voter
decisions in the current election,8 while parties can reciprocate these decisions in their next policy
offersalbeitwithdifficulties,asindividualvoterbehaviorcouldnotbetraced.Notethatlong‐standing
alliances are inconsistent with mixed strategy play and must rely on mutual reciprocity within the
respectivepairofapartyandvoter (e.g.,Axelrod1981;Krepsetal.1982).Butsince individualvoter
behaviorcouldnotbe traced,partiesmightrewardandpunishsubsetsofvoterscollectivelyvia their
budget promises. In practice, there are partisan voters and favors are often anchored in previous
policies. Therefore, in spite of the possibility that rivals can challenge each other’s alliances and the
absenceof coordinationdevices such as ideological preferences (e.g., Cox andMcCubbins1986;Dixit
andLondregan1996),weanticipatethatsomelong‐standingalliancesalsoariseinthelaboratory.
OurmodelbelongstotheclassofColonelBlottogames(e.g.,Borel1921;GrossandWagner1950;
Hart 2008; Owen 1968; Roberson 2006), where two antagonistic colonels independently and
simultaneously allocate their forces across various battlefields, and the number of battles won
determines the outcome of the war. These games find an immediate application in elections, where
candidates battle for votes or voting blocs (e.g., Brams and Davis 1974; Laslier and Picard 2002;
Myerson1993;SankoffandMellos1972;Snyder1989;Young1978).Theextentofinequalitycausedby
tacticalredistributiondependsonthespecificsoftheelectoralcompetition.Myerson(1993)showsfor
different electoral rules (i.e., rank‐scoring rules, approval voting, and single transferable votes) that
increasing thenumberof candidates raises their incentives to target smaller subsetsofvoters,which
yieldsmoreinequality.DixitandLondregan(1996)findthatcandidatesfavorthemorefamiliarallied
voters if these canbe targetedmoreeffectively,but they favor swingvoters ifboth typesareequally
receptive.InLizzeri(1999),candidatesaccumulatenationalbudgetdeficitssincetheadditionalmoney
7Notethatsomeelectioncampaignsemphasizeparties(e.g.,DutchNationalElections)andotherscenteronpoliticians(e.g.,U.S. Presidential Elections). Of course, outside of the laboratory politicians can to some extent coordinate policies acrosselections (e.g., using decisions of predecessors as clues) and parties sometimes disappear from the political arena. Forilluminatingtheeffectsofthelifespanofcandidatesonpolicymaking,itisconvenienttostudyourextremecases.8Inourexperiment,politiciansrandomlyrecurrednowandthenbutseemednottoreciprocatetheirearlierelectionresults.

5
can be used for more effective targeting. With regard to economic efficiency, Dixit and Londregan
(1995)showthattacticalredistributioncanconservedecliningindustries(e.g.,theU.S.textileandcoal
industries) and thus prevent resources from shifting to more efficient uses. The reason is that
candidatescannotcrediblypromisefuturegainstothosewhoneedtoshift.And,inLizzeriandPersico
(2001) candidates can engage in both tactical redistribution and efficiency enhancing public goods
provision.Theyfindthatpublicgoodsareunderprovidedrelativetothesocialoptimumundervarious
electoral rules (i.e., winner‐take‐all, proportional representation, and the Electoral College), and
inequalityisgreaterthemoredesirablepublicgoodsare.Finally,LizzeriandPersico(2005)showthat
increasingthenumberofcandidateleadstogreaterinefficiency.Toourknowledge,wewerethefirstto
studytheColonelBlottogameexperimentally9aswellasexaminepork‐barrelingwithvoluntaryvoting.
Intheconclusions,weelaborateonexternalvaliditybylinkingourfindingstothoseofvariousrelated
empiricalstudiesthatdo,however,notutilizetheframeworkofaColonelBlottogame.
2Politygameandpredictions
In this section, we describe and analyze our game. Additional analysis is provided in our online
supportinginformation.10
Thepolitygame
Consider our two‐stage electoral competition game, or polity game, with two ex‐ante identical
candidates, labeled , ,andafinitenumberofex‐anteidenticalvoterswhoarenevercandidates,
labeled 1, … , . Inthefirststage(Policymaking), thecandidates independentlyandsimultaneously
announcebindingpolicyoffers.Towit, eachof them targets individual voters tobenefit frombudget
spending,with theonly constraint that at least one voter is selected.Thus, there are2 1possible
offersacandidatecanchoosefrom(4,095inourexperimentwithtwelvevoters).Ifsheprevailsinthe
election,thenafixedbudget 0, , willbedividedevenlybetweenher targetedvoters,
soeachreceivesbenefitsof ⁄ (non‐targetedvotersreceivezerobenefits).Andifsheloses,thenher
9 The recent, independent experiments of Avrahami and Kareev (2009) and Chowdhury, Kovenock, and Sheremeta (2013)studyasymmetricColonelBlottogames,thoughnotinthecontextofelections.10Thesupportinginformationisavailableathttps://sites.google.com/site/jwghome/research.

6
offerwillbeinconsequential.Notethattargetingfewervotersincreaseseachselectedvoter’sbenefits,
which is a crucial relationship for our comparison of voting modes. In the second stage (Election),
majoritarianvotingtakesplacewhereacoinflipbreaksatie.Thewinningcandidategetsabonus, 1,
(“spoils of office”) and her offer is implemented, and the loser goes away empty‐handed, 0.We
assumethatallplayersareriskneutralandmaximizetheirexpectedownpayoffs.
Eachvoter’spreferenceintensity( ),ordifferenceinreceivedpromises,arisesfromendogenous
policymaking.Namely, shemaybe targeted by neither candidate so 0 and she is indifferent
betweenthetworivals; byonecandidateso 0andsheprefersthiscontender;or byboth
candidates,inwhichcasesheeitherprefersthecontenderwhopromiseshermoremoney( 0)oris
indifferent ifbothpromisethesameamount( 0).Notethatavarietyofdifferentcompositionsof
preferences intensities can emerge that define a supporter group for each candidate and a group of
indifferentvoterswithzerointensity.Thesegroupsvaryinsize,includingnonexistence,andpreference
intensities, with a maximal in‐group diversity of two different intensities in at most one supporter
group. The following two examples illustrate the formation of preferences and voter groups. A full
characterizationofallpossibleelectionsisintheonlinesupportinginformation.
Supposethat 5and 5inbothexamples.
Example1:
00010 0005001101 0 0
01111 0 5 ,
whereontheleft‐handside , , denotesthevectorofcandidate ’sselectionofvoters 1, … ,5
(1 if targeted and0otherwise) and gives the sumof the two rivals’ vectors.Andon the
right‐handside, denotesthevectorofcandidate ’sbudgetpromisestoeachvoter.Intheexample,
promises ⁄ 5toonevoter( 1)andtheremainingfourvotersarepromisednothing,and
promises ⁄ 5/3toeachof 3votersandtheother twovotersarepromisednothing.Also,
vector | | denotes the vector subtractionwhere the resulting absolute elements give the
preferenceintensityofeachvoter,respectively.Therearetwosupportergroups (consistingofvoter

7
4)and (voters2,3,and5),and consistingof indifferentvoter1.Notethatthetwooffersdonot
overlap(i.e., 2, , )andeachsupportergroupcontainsonlyonepreferenceintensity.
Example2:
11100 00
00101 00 0
11201 0 ,
where 3and 2,andthetwopolicyoffersoverlapforvoter3.Further,therearetwosupporter
groups (consistingofvoters1and2)and (voters3and5),and consistingofindifferentvoter4.
This simple example already produces the maximum possible number of four distinct preference
intensities,thatis,5/3(5/6;5/2;0)forvoters1and2(voter3;voter5;voter4).
Finally,wedistinguishbetweenelectionswithvoluntaryandcompulsoryvoting.Inthevoluntary
mode,eachvoterdecidesonwhethertopayacost 0andvoteforcandidateAorB,ortoabstainat
nocost.Bycontrast, inthecompulsorymodeeachvotermustpay andvote forcandidateAorB,or
voteblank(i.e.,voteforneithercandidate).11
Equilibrium
Weusebackwardinductioninordertoanalyzeinturnthepolitygamewithcompulsoryandvoluntary
voting,focusingonsubgameperfectequilibriuminweaklyundominatedstrategies.InthePolicymaking
stage, candidates play a symmetric constant‐sum normal form gamewhere each cell represents one
possibleelection(i.e.,pairofoffers)anditsentriesrepresenttherivals’probabilitiesofwinning.Then,a
purestrategy isa selectionof specificvoters (i.e., apolicyoffer)andamixed strategy isaprobability
distributionoverallpurestrategies. It ishelpful to sub‐dividemixedstrategies further.Specifically, a
pure [un]balanced number strategy is a selection of one specific number of voters, where all pure
strategies using this number are playedwith equal [at least twodifferent] probabilities, and amixed
[un]balancednumberstrategyisaprobabilitydistributionoverallpurebalancednumberstrategies[all
strategieswithstrictlypositiveprobabilityforatleastonepureunbalancednumberstrategy].
11Weassumeapenalty forabstaining thatexceedsc, so thisoption isstrictlydominatedbyvotingsincerelyandblank.Forexample,Australiausesthecompulsorymodeandvotershavetheoptiontocastablankvote.

8
Proposition1(Politygamewithcompulsoryvotingand 6):12InthePolicymakingstage,inanyNE
inweakly undominated strategies each candidate has an equal chance ofwinning and always uses a
strictlymixedbalancednumber strategythus, inequality is createdonaveragethat cannot result in
4⁄ targeted votersor less. In theElection stage, inaNE inweaklyundominated strategiesof every
feasiblepair ofpolicy offers, eachnon‐indifferent voter votes sincerelyand each indifferent voter votes
blankorforcandidateAorBwithprobabilityone‐thirdforeach.
Proof:Seeouronlinesupportinginformation.
Thus,inequilibriumwithcompulsoryvoting,electionresultsareentirelydeterminedbythetwo
supportergroupsizes,andalsochanceifthereareindifferentvotersorties.Forindifferentvoters,any
voting strategy is optimal, which includes the random strategy used in Proposition 1 (various other
strategiesareanalyzedinGroßerandGiertz2014).Further,candidateshaveequalchancesastheycan
alwaysimitateeachother’sstrategy.Also,ifsomevotersaremorelikelyfavoredthanothers,thenthe
opponent can achieve a greater than fifty percent chance of winning by targeting or avoiding these
voters,socandidatesdonotusepurestrategiesorunbalancednumberstrategies inanyNE.And, the
opponent can exploit a pure balanced number strategy by a similar argument made earlier for the
intuition of mixed strategy equilibrium in the Policymaking stage, so only a strictly mixed balanced
numberstrategyisviableinNE.
Turning tovoluntaryvoting,mostof theemergingelectionsareparticipationgames á laPalfrey
andRosenthal(1983),andallothersarespecialcasesthereof(suchasthevolunteer’sdilemmagame,
Diekmann1985;moredetailsaboutthevariousgamesareprovidedbelowandintheonlinesupporting
information).Foreachpossibleelection,thewinningprobabilitiesofthecandidates(i.e.,therespective
cell’sentriesofthenormalformgame)arederivedfromthepredictedturnoutprobabilitiesandvotes,
soNEcanbesolved.
12Focusingonelectorateswithmorethansixvotersavoidsspecialcases inbothvotingmodes(seealsoProposition2).Forexample, if 2, then in both modes each possible offer pair is a NE. Or, if 6 and voting is compulsory, then thePolicymakingstagealsohaspurestrategyequilibria,whichneveroccurfor 6.Notethat 12inourexperiment.

9
Proposition2 (Polity gamewithvoluntary voting and 6): In thePolicymaking stage, inanyNE
eachcandidatehasanequalchanceofwinningandneverusesanystrategythatpromisesvotersbenefitsof
⁄ 2 thus, inequality is always created if 2⁄ . Also, at least one NE in pure ormixed
balancednumberstrategiesexists.AndintheElectionstage,inaNEinweaklyundominatedstrategiesof
every feasiblepairofpolicyoffers,eachvoterwithpreference intensity 2 abstainsandeachvoter
with 2 turnsoutwithpositiveprobabilityandvotessincerely.
Proof:Seeouronlinesupportinginformation.
In the voluntarymode, in equilibrium election results depend on voters’ turnout probabilities,
whichinturndependonthevotingcosts,ownandallothervoters’preferenceintensities,andsizesof
relevantsupportergroups(i.e.,thatcontainonlyvoterswith 2 ,comparedtooriginalgroupsinthe
compulsorymodewhereallvoterscount).Arationalvoteronlyturnsoutifherexpectedbenefitsfrom
voting equals or exceeds the voting costs.13 Then, anticipating NE decisions in the election, each
candidatemustpromisehersupporters ⁄ 2 inordertoearnthechanceofreceivingtheirvotes.
Inaddition,wemakethefollowingtwoconjectures:
Conjecture1(Effectsofpreferenceintensityandgroupsizesonturnoutprobabilities):Ceterisparibus,
avoter’sturnoutprobabilityincreasesinherpreferenceintensityanddecreasesintheabsolutedifference
insupportergroupsizes.
Argument:Giventhelargevarietyofdifferentelections,sufficientlygeneralequilibriumpropertiesof
theeffectsofpreference intensityandsupportergroupsizesonvoterturnoutareverydifficult, ifnot
impossible, to obtain. Thus, our conjecture is based on findings from related studies. First, in many
experiments, higher incentives increase cooperation even if NE predicts no or opposite effects (e.g.,
PalfreyandPrisbrey1997).Forexample,inalaboratoryparticipationgameonreformswithexogenous
groups,CasonandMui(2005)findthatturnoutratesdecreaseinthevotingcosts.Hence,weanticipate
thatturnoutandpreference intensityarepositivelyassociated inourexperiment.Also, inGroßerand
13Avoteonlyraisestheindividual’sbenefitsifitispivotal(i.e.,forcesorbreaksatie,givenothers’votes).Thisincreaseequals
2⁄ (i.e.,theone‐halfstemsfromatie‐breakingcoinflip)sosheturnsoutwithpositiveprobablityifandonlyif /2 .

10
Schram(2010)turnoutratesdecreaseintheabsolutedifferenceinexogenoussupportergroupsizes(as
in Levine and Palfrey 2007 where voting costs are private information), which is against the NE
predictionsbutinlinewithQRE(McKelveyandPalfrey1995)andgroupthinkmodels(e.g.,Feddersen
andSandroni2006).QREallows fordecision‐makingerrors that arise frombounded rationality (e.g.,
biasedperceptionsofcostsandbenefits)whereaparameter controlsthedegreeofnoise.14Forour
data,weexpect 0ofamagnitudesimilartothose inparticipationgameexperiments(e.g.,Goeree
andHolt2005;GroßerandSchram2010)andhencestrictlypositiveturnoutratesevenforvoterswith
2 whoabstaininNE.
Finally,usingbackwardinduction,Propositions1and2andConjecture1holdforeachrepetition
of the finitely played polity game, independent of whether candidates are parties who act in every
electionorpoliticianswhochangefromelectiontoelection.
Conjecture2(Inequalityandthevotingmode):Voluntaryvotingcreatesmoreredistributiveinequality
amongotherwise identicalvoters thancompulsoryvoting,while inequality is the samewithpartiesand
politicians.
Argument: In the voluntary mode, candidates’ promises must sufficiently compensate for the
supporters’votingcostsinordertoearnthechanceofreceivingtheirvotes(e.g.,inNEonlyvoterswith
2 turnoutwithpositiveprobability).Thecompensationmustbefinancedbyfavoringonaverage
fewervotersthanwithcompulsoryvoting,sovoluntaryvotingtendstocreatemoreinequality.Further,
in line with the conjecture, in NE candidates never target 4⁄ and 2⁄ voters with
compulsory and voluntary voting, respectively (Propositions 1 and 2). Finally, offers of parties and
politicians should not be different, as our predictions hold for each repetition of the finitely played
politygame.
14InQREplayersmakestochasticbestresponses,thatis,morelucrativedecisionsoccurmoreoftenthanlesslucrativeones.Inthe logit specificationofGoereeandHolt (2005), forexample, 0 in thenoise‐freeextreme (i.e.,QRE turns intoNE)and→ ∞intheotherextremewithpurenoise(i.e.,everyoneturnsoutwithprobabilityone‐half).Besidesturnoutpatterns,QRE
can also explain other important empirical phenomena, such as that majorities winmore often thanminorities where NEpredictstheopposite(GroßerandSchram2010).ButnotethatobservedcandidatechoicesofvotersareoftenclosertotheNEthanQREpredictions(e.g.,McKelveyandOrdeshook1990,albeitindifferentvotersareusuallynotexamined).

11
3Proceduresandexperimentaldesign
Thecomputerexperiment15was runat theCREED laboratory,UniversityofAmsterdam. In total,184
studentsattendedtwelvesessionsoffourteentoeighteenparticipantsthatlastedabouttwohours(for
theread‐aloudinstructions,seeouronlinesupportinginformation).Earningswereexpressedintokens
andexchangedforcashforoneƒperfourtokensattheendoftheexperiment.Participantsearnedan
averageofƒ38.31(€17.38),includingaƒ10show‐upfee.
Ineachsession,apolityconsistedoftwocandidatesandtwelvevoters.Eachparticipantwaseither
acandidateorvoterthroughoutthesession,andwasinformedaboutherorhisroleatthestartofthe
experiment.Westudytwotreatmentvariables inabetween‐subjectsdesign,varyingthevotingmode
(CompulsoryversusVoluntary)andlifespanofcandidates(PartiesversusPoliticians).Withcompulsory
voting,eachvoterautomaticallypaidonetokenandhadtovoteblankorvoteforcandidateAorB.With
voluntary voting, each voter decided on whether to spend one token in order to vote for either
candidate,ortoabstainatnocost.Forthecandidates’lifespan,inPartiestwoparticipantsfromapoolof
fourteenwererandomlyappointed“CandidateA”and“CandidateB,”respectively,onceandforallatthe
start of the session, and the remaining twelveparticipantswere voters throughout. InPoliticians, six
participantsfromapoolofeighteenwererandomlyappointedpotentialcandidatesonceandforallat
thestartofthesession,andtheremainingtwelveparticipantswerealwaysvoters.Beforeeachelection,
allsixpotentialcandidateschosetheiroffers,andthereaftertwopoliticianswererandomlyappointed
actual “Candidate A” and “Candidate B.”16 This procedure not only provides us with more offer
observations, but also averts implicit coordination across elections via the A‐ and B‐labels, so
interactionsofpoliticiansareroughlyone‐shotencounters.
Eachsessionconsistedof51periodswithtwodecisionstageseach.Inthefirststage,candidates
independentlyandsimultaneouslymadetheirpolicyoffersbytargetingindividualvoters(i.e.,clickon
buttons thatwere arranged in a circle on the screen,where eachbutton represented the samevoter
throughoutthesession).Inthesecondstage,thetwo(actual)offerswereannouncedandmajoritarian
15WeusedRatImage(AbbinkandSadrieh1995)toprogramtheexperiment.16Weused the samepredetermined random sequence of actual candidates in allPoliticians sessions,where each potentialcandidatewasanactualcandidatefifteen,seventeen,ornineteentimes(seeouronlinesupportinginformation).

12
votingwithrandomtie‐breakingtookplace.Thereafter,abudgetofeighteentokenswasdividedevenly
between the winner’s targeted voters (non‐targeted voters received zero tokens), while the loser’s
policy offerwas inconsequential. In order to avoidnegative earningsdue to the costs of voting, each
voter received one extra token independent of her or his decision. Also, the bonus for the winning
(losing)candidatewastwenty(zero)tokens.Further,voterswerepaidforeachperiod,andcandidates
inParties(Politicians)werepaidforseventeenperiodsrandomlyselectedattheendofthesession(i.e.,
eachperiodinwhichtheywereactualcandidates;seefootnote16).
When making their decisions, candidates knew if in the previous period a specific voter was
targetedbyAorBorbothcandidates(i.e.,thiswasvisibleonthevoterbuttonsonthescreen),butnot
herorhisdecision.And,whenvotersmadetheirdecisionstheyknewtheirownreceivedpromisesand
thosemadetoallothervoters,butcouldnottraceothers’promisesfrompreviousperiods.Finally,all
participants were informed about the procedures outlined here and in the instructions.17 Table 1
summarizesourtreatmentsandparameters:
Table1:Summaryoftreatmentsandparameters
Note: denotes thenumberofvoters targetedby thewinner.All treatmentshad51decisionperiodsandtwelvevoters.Wehavefourindependentobservations(i.e.,politiesorsessions)pertreatment.
Forourexperimentalparameters 12, 18,and 1weemployedGAMBIT(McKelveyet
al.2013) to compute symmetricNE in strictlymixedbalancednumber strategiesof thePolicymaking
stage,whichisshowninTable2.
17Theinstructionsusedmoreneutrallabelsforrolesanddecisionsthanthepaper(seeouronlinesupportinginformation).
Treatment
Candidatepayoffsforwinning(losing)
Voterpayoffs Numberofactual
(potential)candidates
Benefits if (not)targetedbywinner
Costsofparticipation(abstention)
Compulsoryvoting‐Parties 20(0) 1 18/ (1) 1(‐) 2(2)
Voluntaryvoting‐Parties 20(0) 1 18/ (1) 1(0) 2(2)
Voluntaryvoting‐Politicians 20(0) 1 18/ (1) 1(0) 2(6)
13
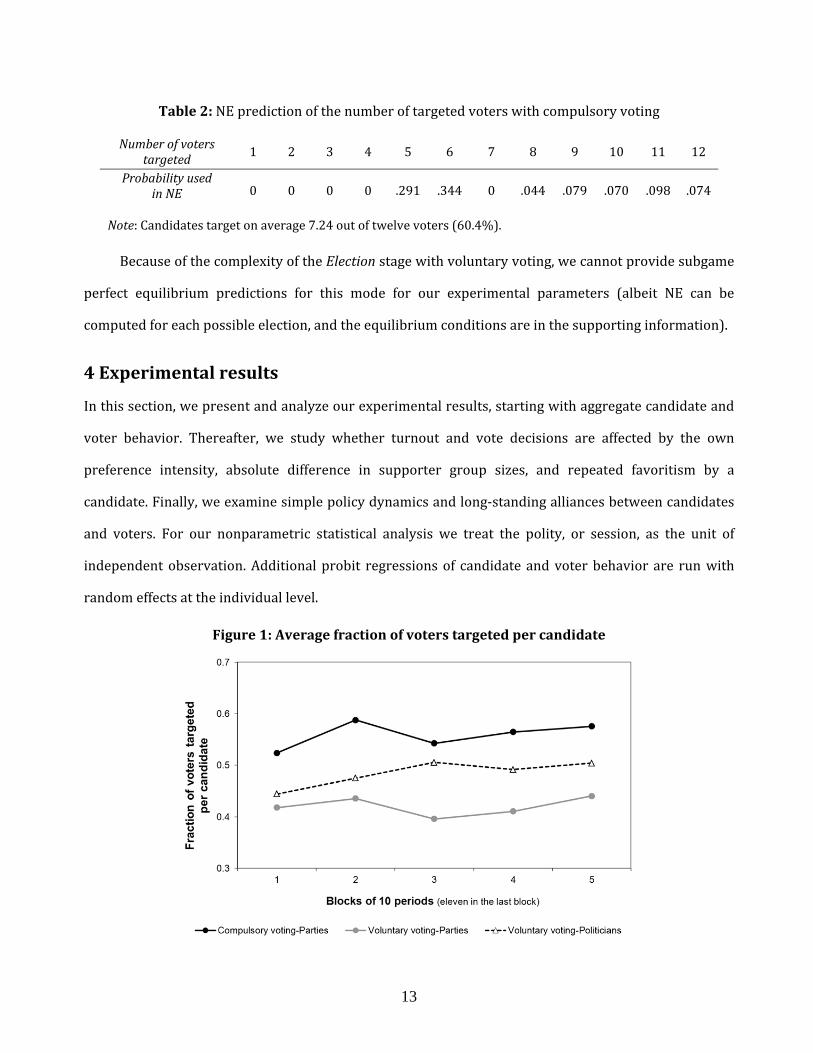
Table2:NEpredictionofthenumberoftargetedvoterswithcompulsoryvoting
Numberofvoterstargeted 1 2 3 4 5 6 7 8 9 10 11 12
ProbabilityusedinNE 0 0 0 0 .291 .344 0 .044 .079 .070 .098 .074
Note:Candidatestargetonaverage7.24outoftwelvevoters(60.4%).
BecauseofthecomplexityoftheElectionstagewithvoluntaryvoting,wecannotprovidesubgame
perfect equilibrium predictions for this mode for our experimental parameters (albeit NE can be
computedforeachpossibleelection,andtheequilibriumconditionsareinthesupportinginformation).
4Experimentalresults
Inthissection,wepresentandanalyzeourexperimentalresults,startingwithaggregatecandidateand
voter behavior. Thereafter, we study whether turnout and vote decisions are affected by the own
preference intensity, absolute difference in supporter group sizes, and repeated favoritism by a
candidate.Finally,weexaminesimplepolicydynamicsandlong‐standingalliancesbetweencandidates
and voters. For our nonparametric statistical analysis we treat the polity, or session, as the unit of
independentobservation.Additionalprobit regressionsof candidate andvoterbehaviorare runwith
randomeffectsattheindividuallevel.
Figure1:Averagefractionofvoterstargetedpercandidate

14
Aggregatebehavior
We examine aggregate candidate and voter behavior, in turn. Figure 1 shows for each treatment
observedfractionsofvoterstargetedpercandidate,averagedoverblocksoftenperiods(eleveninthe
lastblock).InPoliticians,thepolicyoffersofallpotentialcandidatesareincluded.18
Asseeninthefigure,thereisconsiderableredistributiveinequalityinalltreatments,thatis,the
averagefractionsofvoterstargetedpercandidatearemuchsmallerthanone(i.e.,theegalitarianoffer).
Further,thefractionissmallerinVoluntaryvoting‐PartiesthanCompulsoryvoting‐Partiesineachblock
ofperiods (overall,0.42versus0.56). In the firstblock thegap is about0.10points, and increases to
about 0.15 points in the remaining blocks. Also,with voluntary voting the average fraction of voters
targeted per candidate is smaller in Parties than Politicians in each block (overall, 0.42 versus 0.48,
albeitthisdifferenceisnotstatisticallysignificant).Thefractionsaresimilarinthefirsttwoblocks(0.42
versus0.44and0.44versus0.48),butgreatergapsof0.06to0.11pointsoccurintheremainingblocks.
Experimental result 1: There is substantial redistributive inequality in all treatments. On average,
partiescreategreater inequality in thevoluntary thancompulsorymode,and inequality is the same for
partiesandpoliticianswithvoluntaryvoting.
Support: One‐tailedWilcoxon‐Mann‐Whitney tests reject thenull hypothesis of nodifference in average fractions of voters
targetedpercandidateinfavorofsmallerfractionsinVoluntaryvoting‐PartiesthanCompulsoryvoting‐Parties( 0.029),but
not forVoluntaryvoting‐PartiesversusVoluntaryvoting‐Politicians ( 0.171).Theexactsameresultsalsohold for the last
three blocks of periods only. For comparison, average fractions are smaller inVoluntary voting‐Politicians thanCompulsory
voting‐Parties( 0.100),butnodifferenceisfoundifonlythelastthreeblocksareconsidered( 0.171).
Confronting this resultwith our NE, in the compulsorymode (see Table 2 for predictions) the
averagefractionofvoterstargetedpercandidateiswith0.56closetothe0.60inNE.Also,outof408
policy offers, 3, 4, 5, 25, and77 offers targeted one, two, three, four, and seven voters, respectively,
comparedtothezeropredicted.InNEwithvoluntaryvoting,eachcandidatetargetsatmost 2⁄ 9
voters (Proposition2). InVoluntary voting‐Parties, 3, 1, and 13 out of 408policy offers targeted ten,
eleven, and twelve voters, and in Voluntary voting‐Politicians, for the two actual (six potential)
18AveragepolicyoffersinPoliticiansarenotdifferentbetweenthesixpotentialandtwoactualcandidates(two‐tailedWilcoxonsignedrankstest, 0.313).

15
candidatesthesenumbersare3,2,and18outof408(19,5,and49outof1224).Thus,inalltreatments,
offers that never occur inNE are indeed rarely observed (with the only exception of seven targeted
votersinthecompulsorymode).Finally,consistentwithConjecture2,averageinequalityisgreaterwith
voluntarythancompulsoryvotingand,inthevoluntarymode,thesameforpartiesandpoliticians.
Figure2:Averagevotingrates
Next,weturntoaggregatevoterbehavior.Figure2showsforeachtreatmentobservedratesofvoting
for a candidate per electorate (lines without markers) and per targeted voters (lines with markers),
averaged over blocks of ten periods (eleven in the last block). The rates are computed as the total
numberofvotesforthetwocandidates,dividedbytheelectoratesizerespectivelythenumberofvoters
whoreceiveatleastonepromise.Inthecompulsory(voluntary)mode,thevotingratedecreaseswith
eachblankvote (abstention).Therefore,whenvoting is compulsory the rateperelectorate is smaller
thanoneifthereisatleastoneblankvote,andtheratepertargetedvotersislargerthanoneifthereare
moreA‐andB‐votesofnon‐targetedvotersthanblankvotesoftargetedvoters.Notethatoutsideofthe
laboratoryonlyturnoutratesperelectorateandperregisteredvotersarereported.

16
Theobservedvoluntaryvoting(or,turnout)ratesperelectorateareaboutthesameinPartiesand
Politicians in the first twoblocksofperiods(0.38versus0.38and0.37versus0.36,respectively)and
0.04to0.06pointshigherinParties intheremainingblocks.Incomparison,thelevelsanddifferences
aregreaterforratespertargetedvoters(0.61versus0.57and0.56versus0.56inthefirsttwoblocks,
andgapsof0.12to0.13pointsintheremainingblocks),sinceindifferentvoterswithnopromiseswho
abstainarenotconsidered.19
Experimentalresult2:Voterturnoutratesaresimilarwithpartiesandpoliticians.
Support: One‐tailedWilcoxon‐Mann‐Whitney tests cannot reject the null hypothesis of no difference in turnout rates per
electorateandpertargetedvotersbetweenPartiesandPoliticians( 0.557and 0.343),andthisalsoholdsforthelast
threeblocksofperiodsonly( 0.243and 0.171).
In Compulsory voting‐Parties, the average voting rate per electorate is smaller than one in all
blocksofperiods.Also,theaverageratepertargetedvotersisgreaterthanoneinallblocks,indicating
thatsome indifferentvoterswithnopromisesneverthelessvoted forAorB,which isconsistentwith
our prediction that these voters vote randomly (Proposition 2;more about this below). This rate is
highest in the first block and lowest in the last block (1.19 and 1.04, respectively), and it is greater
(smaller)thanoneinthree(one)outoffourpolities.
Voterbehavior
In the following, we study turnout and vote decisions by taking into account the specific electoral
composition (i.e., group sizes and pattern of preference intensities).We first categorize and present
observed fractions of the various elections, and thereafter investigate whether non‐indifferent and
indifferent voters vote sincerely and randomly, respectively (Propositions 1 and 2). Finally, we use
probitregressionsinordertoexaminewhethervoter’sdecisionsareaffectedbytheirownpreference
intensity,theabsolutedifferenceinsupportergroupsizes,andrepeatedfavoritismbyacandidate.
Electoralcompositions
Foranoverviewofthevariouselectoralcompositionsinourexperiment,wecategorizeelectionsusing
relevantsupportergroupsthatconsistmerelyofvoterswith 2(notethatouranalysisbelowalso
19Recallthattheturnoutratepertargetedvotersincludesindividualswith ∈ 0,2 ,whoabstaininNE(Proposition2).
17
usesoriginal supporter groups).Moreover, a game is calledstandard if every supporter in a relevant
grouphasthesamepreferenceintensity,albeit candifferacrossgroups,andmodifiedifonerelevant
groupcontainstwodifferent 2(which,inthevoluntaryvoting,requiresanadditionalequilibrium
condition). In Voluntary voting‐Politicians (‐Parties) we find 75.5% (81.4%) standard participation
games,5.9%(3.9%)modifiedparticipationgames,11.3%(11.3%)standardvolunteer’sdilemmagames,
0%(0%)modifiedvolunteer’sdilemmagames,and7.3%(3.4%)gameswithuniversalabstention.And,
inCompulsoryvoting‐Partiesthesenumbersare71.1%,2.0%,12.7%,0%,and14.2%.Thus,overall,most
electionsarecategorizedasstandard“participationgames.”
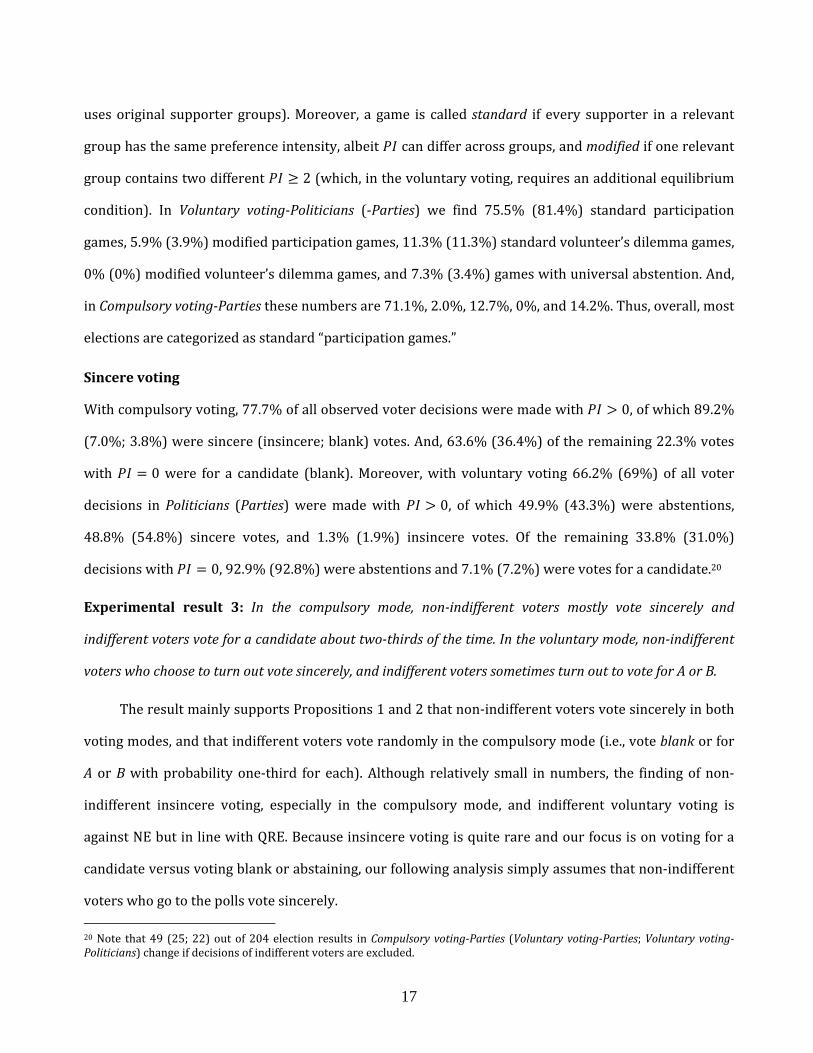
Sincerevoting
Withcompulsoryvoting,77.7%ofallobservedvoterdecisionsweremadewith 0,ofwhich89.2%
(7.0%;3.8%)weresincere(insincere;blank)votes.And,63.6%(36.4%)oftheremaining22.3%votes
with 0were for a candidate (blank).Moreover,with voluntary voting66.2% (69%) of all voter
decisions inPoliticians (Parties)weremadewith 0, ofwhich 49.9% (43.3%)were abstentions,
48.8% (54.8%) sincere votes, and 1.3% (1.9%) insincere votes. Of the remaining 33.8% (31.0%)
decisionswith 0,92.9%(92.8%)wereabstentionsand7.1%(7.2%)werevotesforacandidate.20
Experimental result 3: In the compulsory mode, non‐indifferent voters mostly vote sincerely and
indifferentvotersvoteforacandidateabouttwo‐thirdsofthetime.Inthevoluntarymode,non‐indifferent
voterswhochoosetoturnoutvotesincerely,andindifferentvoterssometimesturnouttovoteforAorB.
TheresultmainlysupportsPropositions1and2thatnon‐indifferentvotersvotesincerelyinboth
votingmodes,andthatindifferentvotersvoterandomlyinthecompulsorymode(i.e.,voteblankorfor
A orBwithprobability one‐third for each).Although relatively small innumbers, the findingof non‐
indifferent insincere voting, especially in the compulsory mode, and indifferent voluntary voting is
againstNEbutinlinewithQRE.Becauseinsincerevotingisquiterareandourfocusisonvotingfora
candidateversusvotingblankorabstaining,ourfollowinganalysissimplyassumesthatnon‐indifferent
voterswhogotothepollsvotesincerely.
20Note that49 (25;22)outof204election results inCompulsoryvoting‐Parties (Voluntaryvoting‐Parties;Voluntaryvoting‐Politicians)changeifdecisionsofindifferentvotersareexcluded.

18
Votingdecisions
Figure3depictsobservedaveragevotingratesforacandidatepertreatmentperdifferentcategoriesof
preferenceintensities.Inalltreatments,theintensitymarkedlyaffectsthedecisionto(turnoutto)vote
foracandidate.Ascanbeseen,verysimilarpatternsofvoluntary turnoutratesare found in the two
respectivetreatments,wheretheratesgenerallyincreaseinthe ‐category.Amaindifferencebetween
Voluntary voting‐Politicians and ‐Parties is that the biggest jump in turnout rates occurs in different
categories(0.35in ∈ 2,3 versus0.28in ∈ 3,4 ,respectively).Bycontrast,inCompulsoryvoting‐
Partiesthevotingrateforacandidateis0.64forindifferentvoters, 0,andveryclosetooneforall
categorieswith 0(0.96overall).Atlarge,ourfindingsareinlinewithPropositions1and2.
Figure3:Votingratesandpreferenceintensities
Next, we further examine voter decisions by running, for each treatment separately, probit
regressions with random effects at the individual level. Specifically, our panel models estimate the
effectsofthepreferenceintensity,absolutedifferenceinsupportergroupsizes,repeatedfavoritismbya
candidate,andinequalityconcernsontheindividualdecisionto(turnoutto)voteforacandidate.Our
dependentdummyvariable, ,equalsoneifvoter jvotedforAorB inperiodt,andzerootherwise.
Further,weutilizethefollowingindependentvariables.Tobegin, measuresj’spreferenceintensity
intokensinperiodt.Forthecompulsory(voluntary)mode,thedummyvariable ( )equals

19
oneif 0( 2)tokensandzerootherwise,whichallowsustoexamineajumpinvotingrates
for this intensity rangeversus 0 ( 2) tokens,aspredicted inProposition1 (2).Also, for the
voluntarymode,theinteractionvariable measurestheeffectofpreferenceintensitiesofat
leasttwotokensontheturnoutprobability.Moreover,∆ ,∆ ,∆ ,and∆ measurethe
absolutedifferenceinsupportergroupsizesinperiod ,wheresuperscript“”(“”)indicatesthat isin
theminority(majority)groupandsuperscript“O”(“R”)referstooriginal(relevant)groupsconsistingof
voterswith 0( 2).We interact the∆ ‐variableswith thedummyvariables in the
compulsory mode, and , (equal to one if ∈ 0,2 and zero otherwise) and in the
voluntarymode,sowecantestwhethervoterswith intensities intheserangesresponddifferentlyto
supportergroupsizedifferences.Further, | |measurestheabsolutedifferenceinthe
candidates’ numbers of targeted voters in period t, which is utilized to examinewhether indifferent
voters inthecompulsorymodedecidebasedon inequalityconcerns(recall thattheirearningsdonot
dependontheelectionresult;seealsoFeddersen,Gailmard,andSandroni2009).And, isadummy
variableequaltooneif isasupporterofthesamecandidateinperiods 1andt,andzerootherwise,
sowecantestwhetherjrespondstorepeated(stronger)favoritismbyacandidate.Finally,thevariable
Period(t)measuresatimetrendand and areerrorterms,wherethelattertermisarandomeffect
usedtocorrectforthepanelstructureinourdata.Table3givestheresultsofourprobitestimations.21
Wefirstfocusonvoluntaryvoting,whereourestimatesareverysimilaracrosstreatments.Towit,
forstatisticallysignificantcoefficientsthesignsandsignificancelevelsare,withoneexception,identical
in Politicians and Parties. Specifically, the coefficients of the dummy variable are large and
positive,supportingourNEpredictionthatpreferenceintensitiesofat leasttwotokensareimportant
forinducingturnout(seeProposition2).Also, ∈ 0,2 andmuchlessso 2positivelyaffectthe
turnoutprobability (i.e., thecoefficientsof are0.78and0.57,andarereducedby thecoefficients
0.62and 0.40of ,respectively).Notethattheeffectof ∈ 0,2 isnotpredictedbyNE
(see Proposition 2) but consistent with QRE. Further, the absolute difference in relevant supporter
group sizes, ∆ , negatively affects the turnout probability of voters with 2, and somewhat
21Theresultsaresimilarifweonlyconsiderthevastmajorityofelectionscategorizedasstandard“participationgames.”

20
strongersoinminoritiesthanmajorities( 0.23versus 0.12inPoliticiansand 0.46versus 0.34in
Parties, respectively). These relationships are also reported for exogenous supporter groups (Großer
andSchram2010).Finally,theprobabilityofturnoutisunaffectedby∆ forvoterswith ∈ 0,2
who abstain in NE, the period, and repeated favoritism by a candidate (i.e., the coefficients of the
respectivevariablesarestatisticallyinsignificant).
Table3:Randomeffectsprobitregressionsofvotingforacandidate
ConstantandIndependentvariables
Coefficients
Voluntaryvoting‐Politicians
Voluntaryvoting‐Parties
Compulsoryvoting‐Parties
Constant ‐1.72(10.73)*** ‐1.72(13.04)*** 0.15(0.88)
1.69(6.35)***
1.97(11.76)*** 2.18(10.06)***
0.78(8.70)*** 0.57(4.86)*** 0.16(1.93)*
‐0.62(6.36)*** ‐0.40(3.07)**
∆ ‐0.07(1.19)
∆ ‐0.05(1.03)
∆ , ‐0.05(0.50) 0.28(1.29)
∆ , ‐0.06(1.52) 0.02(0.31)
∆ ‐0.23(3.91)*** ‐0.46(7.43)***
∆ ‐0.12(3.75)*** ‐0.34(8.39)***
0.13(2.76)**
‐0.06(1.09)
Period(t) ‐0.00(0.76) ‐0.00(0.67) 0.00(1.13)
‐0.12(1.57) ‐0.06(0.73) ‐0.02(0.12)Note:The independentdummyvariable isavoter’sdecisiononvoting foracandidate( 1)orabstaining
respectivelyvotingblank( 0).Absolutez‐valuesareinparentheses,and*(**;***)indicatessignificanceat
the5%(1%;0.1%)‐level.
With compulsory voting, the estimatesmostly support our NE predictions (see Proposition 1).
Compared to indifferent voters, there is a statistically significant, largepositive effect on voting for a
candidate for non‐indifferent voters, but also an unpredicted significant, small positive effect of the
preferenceintensity(capturedbythecoefficients1.69of and0.16of ,respectively).And, in
linewithNE, neitherminority normajority voters respond to∆ . Finally, indifferent butnotnon‐

21
indifferent votersdo indeed somewhat resort to inequality concerns (i.e., the coefficient of is
statisticallysignificantandpositive,andthatof isinsignificant).
Experimental result 4: With voluntary voting, turnout levels jump up drastically for preference
intensitiesofat least two tokens.Further, the turnoutrate increases in thepreference intensityand, for
voters with 2 tokens in both the minority and majority, in the absolute difference in relevant
supportergroupsizes.Withcompulsoryvoting,non‐indifferentvotersalmostalwaysvoteforacandidate,
while indifferent voters do so two‐thirds of the time and somewhatmore likely for the candidatewho
allocatesthebudgetmoreequally.
Candidatebehavior
Inthefollowing,weanalyzecandidatebehaviorinmoredetail.Wefirstlookattheirwinningrates,and
thereafterexamine simplepolicydynamics (i.e., changes inoffers fromoneelection to thenext), also
usingprobitestimationswithrandomeffectsatthecandidatelevel.
Winningrates
For the more successful candidates per polity, the winning rates are 0.53, 0.55, 0.61, and 0.65 in
Compulsoryvoting‐Parties,0.53,0.55,0.55,and0.63inVoluntaryvoting‐Parties,and0.51,0.55,0.57,and
0.63inVoluntaryvoting‐Politicians.Notethatthelowestpossiblerateis0.51 26/51periods.
Experimentalresult5:Inone‐thirdofthepolitiesthecandidates’winningratesareunequal.
Support: In four out of twelve (3 4) polities one candidate wins statistically significantly more often than the rival(s).
Binomial tests reject the null hypothesis of equalwinning rates for these polities (one per treatment 0.05 plus one in
Compulsoryvoting‐Parties, 0.10)butnotforallotherpolities( 0.10).Ofthetwentyfour(4 6)potentialcandidatesin
Politicians, thirteen win more and eleven win fewer than half of their actual candidacies, which is significant for four
respectivelythreeofthem( 0.10).
Weconjecturethatdeviationsfromthepredictedequalchancesofcandidates(seePropositions1and
2)areduetothecomplexityofpolicymaking.

22
Voterstatesandtransitions
Next, we study whether candidates choose their policy offers depending on offers in the previous
period.Therearefourpossible“voterstates,”asdefinedbythepromisesavoterreceives.Namely,sheis
targetedby Neithercandidateor OnlyAor OnlyBor Bothcandidates.Figure4depicts
thesevoterstatespertreatmentas“circles.”Further,eachvotereitherremainsinthesamestatefrom
oneperiod to thenext,orentersanother state as representedby “arrows”directed to thenewstate.
Therefore, each circle has three outgoing and three incoming arrows. For periods 1 to 50, observed
average fractions of voters in each state are given in the figure next to the respective state’s label
(predictionsareinbrackets),andobservedaveragefractionsofremaininginandtransitingtoanother
state are given atand visualized by the size ofthe respective circles and arrows (predictions are
explained in the text, anda full overview is available on request from theauthors).Note that a state
fractionisequaltothesumofitsthreefractionsofoutgoingtransitionsplusthefractionofremainingin
thatstate.Forexample,inVoluntaryvoting‐Politicians(toppanelofFigure4)theobservedaveragestate
fractionofOnlyAis0.244 0.069 0.060 0.054 0.061.
Figure4:Voterstatesandtransitionsbetweenelections
Voluntaryvoting‐Politicians
Voluntaryvoting‐Parties
.068 .051
.061 .050
Neither .275 (.269) Only B .244 (.250)
Only A .244 (.250) Both .237 (.232)
.061 .055
.069 .069
.068 .054
.076 .058
.060
.078
.060
.062

23
Compulsoryvoting‐Parties
Wenowexaminewhethercandidatestarget individualvotersrandomly(seePropositions1and
2),usingBinomialtestsandprobitregressionsinturn.FortheBinomialtests,wesimplyusepereach
treatment as our predicted target probability, labeled , the observed average number of voters
targetedinanoffer(i.e.,inthegiventreatment, isaveragedoverallcandidatesand51periods).22So,
we have 0.48 (0.42; 0.56) in Voluntary voting‐Politicians (Voluntary voting‐Parties; Compulsory
voting‐Parties).Assumingthateachcandidate’sdecisionsonwhetherornottotargetindividualvoters
areindependentfromeachotherandheropponent’sdecisions,wethenpredictthateachvoterenters
22 Note that does not capture any variation in target probabilities across candidates and periods. To some extent, suchdifferencesareaccountedforinourprobitregressions,below(seeTable4).Also,withprobability 1 acandidatedoesnottargetanyvoter,but inourgameat lastonemustbetargeted.However, thisprobability isverysmall( 1 0.420.0014)soouranalysisisvirtuallynotaffected.Finally,theresultsaresimilarforvariousalternativesto .
.098 .134
.170 .031
Neither .309 (.336) Only B .248 (.244)
Only A .295 (.244) Both .148 (.177)
.053
.021
.095 .031
.064
.069
.020
.014
.084 .040
.056
.020
.115 .136
.034 .110
Both .298 (.313)
Only B .278 (.246)
Only A .243 (.246)
Neither .181 (.194)
.061 5.6%
.049
.037 .060
.072 .056 . 057
.031 .067
.036
.038
.041

24
stateNeither,OnlyA,OnlyB,andBothwithprobability 1 , 1 , 1 ,and ,respectively.
And,thepredictedprobabilityofeachoutgoingtransitioniscomputedastheproductoftherespective
probabilitiesofthedepartureanddestinationstates.Therearesixteensuchprobabilitiespertreatment,
fourforeachvoterstate.Forexample,inVoluntaryvoting‐Parties(middlepanelofFigure4)wepredict
that each voter entersNeither with probability 0.336 and her respective transition probabilities are
0.113 0.336 0.336 for NeitherNeither, 0.082 0.336 0.244 for NeitherOnly A, 0.082
0.336 0.244forNeitherOnlyB,and0.059 0.336 0.177forNeitherBoth,with0.113 0.082
0.082 0.059 0.336.
Confronting our predictionswith the data usingBinomial tests,23 inVoluntaryvoting‐Politicians
(toppanelofFigure4)noneof theobservedstate fractions is statistically significantlydifferent from
ourrandombenchmark,andonlyfouroutofsixteenfractionsofoutgoingtransitionsandremainingina
statearesignificantlydifferent(3 0.1and 0.01).Further,inVoluntaryvoting‐Parties(middle
panel) these numbers are three ( 0.01, 0.001, and 0.0001) and thirteen ( 0.1,
2 0.01, and 8 0.0001), and in Compulsory voting‐Parties (bottom panel) they are one
( 0.001)andfourteen(2 0.1, 0.001,and11 0.0001).Therefore,andalsovisible in
Figure 4, politicians target votersmostly randomlywhile parties deviatemarkedly fromour random
benchmark,andweexaminenextwhethertheydososystematically.
Focusing first onParties,with voluntary voting the fractions of voters remaining inOnlyAand
OnlyBarefargreaterthanpredicted,whilethetransitionfractionsofOnlyAOnlyBandOnlyBOnlyA
are much smaller (all 0.0001). Thus, in the voluntary mode parties tend to cultivate polarized
groupsbyrepeatedlyfavoringtheirexclusivesupportersandavoidingthoseoftherival.And,asseenin
themiddlepanelofFigure4,policypolarization is assisted in that voterswhoarenewly included in
(excludedfrom)offersareusuallydrawnfrom(releasedto)Neither,andthosewhohappenedtobein
BothareusuallyreleasedbybothpartiessotheyenterNeither.Moreover,inthecompulsorymodethe
fractionsofvotersremaininginOnlyAandOnlyBarealsofargreaterthanintherandombenchmark,
23InrunningourBinomialtests,forvoterstatesweuse 2,400observations(4sessions12voters50periods)andfortransitionsweuse observations(i.e.,theactualnumberofobservationsperstatefromwheretherespectivetransitiondeparts),where rangesfrom354to741.

25
however, the sameholds for remaining inBoth (all 0.0001) so in addition to policy polarization
parties bump into each other’s offers for some voters. And, as with voluntary voting, the transition
fractions of Only AOnly B and Only BOnly A are much smaller than predicted ( 0.001 and
0.0001).Allinall,policyoffersinthetwoPartiestreatmentsareconsiderablypredictable,whichis
inconsistentwithmixedstrategyplayofcandidates(seePropositions1and2)andhintstosometacit
agreementsbetweenpartiestowardsfocusingtheirbattleforvotesonasubsetofvoters.
Table4:Randomeffectsprobitregressionsofcandidatebehavior
ConstantandIndependentvariables
Coefficients
Voluntaryvoting‐Politicians
Voluntaryvoting‐Parties
Compulsoryvoting‐Parties
Constant ‐0.20(3.13)** 0.28(4.44)*** 0.39(6.22)***
Period(t) 0.01(4.36)*** 0.00(0.52) 0.00(1.41)
‐0.12(1.56) 0.20(2.78)** ‐0.09(1.23)
, 0.15(2.01)* ‐0.38(5.59)*** ‐0.34(4.27)***
, ‐0.02(0.32) ‐1.13(15.16)*** ‐0.67(9.24)***
, ‐0.01(0.16) ‐0.54(6.39)*** ‐0.01(0.20)
, 0.05(0.46) ‐0.30(3.08)** 0.11(0.95)
, 0.13(1.29) ‐0.58(5.15)*** ‐0.12(1.14)
, 0.13(1.23) ‐0.13(1.13) ‐0.09(0.90)Note:Theindependentdummyvariableisacandidate’schoicewhethertotargetaspecificvoter(=1),or
not(=0).Absolutez‐valuesareinparentheses.*(**;***)indicatessignificanceatthe5%(1%;0.1%)‐level.
Next,weanalyze candidatebehavior inmoredetailby runningprobit regressionswith random
effects at the candidate level. Specifically, we studywhether the probabilitieswithwhich voters are
targeted depend on previous voter states and are different afterwinning and losing. Our dependent
dummy variable indicates whether or not (one or zero) candidate targets voter in period t. Our
independent variables are the Period (t), measuring a time trend, and the following seven dummy
variables (equal to one if true, and zerootherwise): indicateswhether won in theprevious
period; , , , (i.e.,Other refers to candidate ), and , indicate ’s
voterstateinthepreviousperiod,respectively,sotheconstantrepresentsthestatewheresheorhewas

26
targeted only by candidate ; and, finally, three variables that interact with each voter state
variable,respectively.OurestimationsareshowninTable4.
InVoluntaryvoting‐Politicians, ourestimatesaremostlyconsistentwithmixedstrategyNEplay
(seeTable2) in thatpolicyoffersaremade independentofpreviousvoterstatesandelectionresults
(i.e., six of the seven dummy variables are small and insignificant). Albeit relatively small, the two
statisticallysignificantexceptionsarethenegativeconstantandpositivecoefficientof , .24By
contrast, inVoluntaryvoting‐Partiescandidatesstronglyrespondtopreviousvoterstatesandelection
results(i.e., thecoefficientsofthesevendummyvariablesareusuallygreaterthanforpoliticians,and
sixare significant). Specifically, exclusive supporters in 1aremore likely favoredagain, andeven
moresoafterwinning(i.e.,theconstantandcoefficientof arepositiveandsignificant,andthe
coefficientsofallotherdummyvariablesarenegative).Note that theseestimatesbackupourearlier
finding that parties tend to cultivate policy polarizationin particular, the negative coefficients of
, , , , and , stand out the most, which accentuates the
parties’ active avoidance of the rival’s targeted voters. Moreover, in Compulsory voting‐Parties the
constantisstatisticallysignificantandpositiveandthecoefficientsof , and ,
are significant and negative,whereas all other coefficients are insignificant. Also these estimates are
consistentwithourearlierpolicypolarizationfinding,andcomparingthecoefficientsof , inthe
two Parties treatments emphasizes the important difference caused by the voting mode: in the
compulsorymode theestimate isminisculewhile in thevoluntarymode it is largeandnegative (i.e.,
0.014n.s.versus 0.540***)hence,partiesseek(avoid)policyoverlapwithcompulsory(voluntary)
voting.Also,interestingly,partiesdonotrespondtoelectionresultswhenvotingiscompulsory(i.e.,all
coefficients of variables involving are insignificant). Thus, in contrast to voluntary voting,
partiesdonothold their targetedvotersresponsible forwinningor losing,which is intuitivebecause
the supporters’ compulsory votes are almost always sincere, so there is virtually no room for
24 One possible reason why politicians target voters in , somewhat more often than other voters are fairnessconcerns(i.e.,sothatthistimethesevotershaveachancetoearnmoney).Recallthatinthistreatmentsomeindifferentvotershadfairnessconcernstoo,asindicatedbythe ‐coefficientinTable3.

27
reciprocatingtheirdecisions.Inotherwords,partiesknowthattheybearmostoftheresponsibilityfor
electionsresultsundercompulsoryvoting.
Finally, we find no period effects on the probabilities with which candidates target individual
votersinParties(i.e.,bothcoefficientsarestatisticallyinsignificant)andasignificant,tinypositiveeffect
inPoliticians.Weconjecturethatthesefindingsareduetothedifferentfeedbackpartiesandpoliticians
receiveabouttheirownpolicyoffers.Towit,politiciansareactualcandidatesonlyone‐thirdofthetime,
whilepartiesexperiencetheconsequencesoftheirdecisionsineveryperiod.
Experimentalresult6: Parties choose their policy offers based on voters’ previous states. In both
votingmodes,theytendtocultivatepolicypolarizationbyrepeatedlytargetingtheirexclusivesupporters
again and avoiding those of the opponent, and in the voluntarymode this behavior is boosted after a
victory.Withcompulsoryvoting,theyalsoseekpolicyoverlapforaseparatesubsetofvoters.
Politicalalliances
Weconcludeourexperimental results sectionbypresentingaparticularly illustratingexampleof the
formationoflong‐standingtacitalliancesbetweenpartiesandindividualvoters(i.e.,continuousmutual
promisesandvotes).Recallthatsuchalliancesareinconsistentwithmixedstrategyplayofcandidates
sincetheanticipationofbondscanusuallybeexploitedbytherival.Alsorecallthatinourexperiment
individualvoterdecisionswerenotrevealed,soinordertosustainalliancespartieshadtoreciprocate
basedontheirsubjectivebeliefsaboutthesedecisions.Inshort,itseemsthatlastingalliancesbetween
partiesandvotersaredifficulttoachieve.
Figure5depictsforonepolity(Session6,Voluntaryvoting‐Parties)thedecisionsofeachpartyand
voterineveryperiod.PolicyoffersofpartyA(B)areshownontheleft‐hand(right‐hand)side,andon
bothsideseachvoterisrepresentedbyacolumnandeachperiodbyarow.Ablack(gray)cellindicates
thatinthisperiodvoter wastargetedbyparty , anddid(not)voteforthisparty.And,an“M”
(white)cellindicatesthatinthisperiod wasnottargetedby anddid(not)votefori.Theexampleis
self‐explanatory,sowerefrainfromdefiningalliancesbyanexactdurationofmutualfavors.

28
Figure5:TacitpoliticalalliancesinSession6,Voluntaryvoting‐Parties
PolicyofferA PolicyofferB
Note: PartyA‘s (B’s) offers are shownon the left‐hand (right‐hand) side.On each side, each voter isrepresentedbyacolumnandeachperiodbyarow.Ablack(gray)cell indicatesthat wastargetedby
, anddid(not)voteforthispartyandan“M”(white)cellindicatesthat wasnottargetedby anddid(not)votefor .
Ascanbeseen,partyApersistentlytargetsvoters2,8,and9fromperiod22onwardsandvoter
10isaddedstartinginperiod29,andthesefavorsarereturnedbyavotein74.3%ofthecases.Voter8
often abstains, so alliances only form betweenA and voters 2, 9, and 10. By contrast, for period 21
onwards, partyB targets voters less persistently andon averagemore of them thanA (5.11 vs. 3.77
votersperperiod),yielding45.2%ofreturnedfavors.RepeatedmutualfavorsareshortforB(atmost
fiveperiods)sonoalliancesarefoundforthisparty.Notethatbothpoliciesareclearlypolarizedfrom
period22onwards (withonly twooverlaps inperiod48). Surprisingly, althoughBwinsonlynineof
these thirty elections, she or he does not attempt to increase the own chances via bumping intoA’s
VotersRound 1 2 3 4 5 6 7 8 9 10 11 12
1 2 0 0 0 0 0 0 0 0 0 0 0
2 3 2 2 3 0 0 0 0 0 0 3 2
3 0 3 2 2 2 2 2 2 0 0 0 0
4 3 0 0 0 0 0 0 0 0 2 2 2
5 0 2 2 2 2 2 2 0 0 0 0 0
6 0 3 2 2 3 0 0 0 0 0 0 0
7 0 2 3 2 2 0 0 0 0 0 0 0
8 3 0 0 0 0 0 0 0 0 0 2 3
9 3 0 0 0 0 0 0 0 0 0 2 3
10 3 3 3 0 0 0 0 0 0 0 2 2
11 3 3 2 2 0 0 0 0 0 0 3 2
12 3 0 0 0 0 2 2 2 0 0 2 2
13 0 0 2 2 2 3 3 0 0 0 0 0
14 0 0 3 3 3 2 2 0 0 0 0 0
15 0 0 2 2 3 2 3 0 0 0 0 0
16 0 0 3 3 2 2 2 0 0 0 0 0
17 0 0 3 3 2 2 2 0 0 0 0 0
18 0 0 2 3 2 3 0 0 0 0 0 0
19 0 0 2 3 2 2 0 0 0 0 0 0
20 0 2 0 0 0 0 2 3 2 0 0 0
21 0 3 2 2 0 0 0 0 0 0 0 0
22 0 3 0 0 0 0 0 3 3 0 0 0
23 0 3 M 0 0 0 0 3 3 0 0 0
24 0 3 0 0 0 0 0 3 3 0 0 0
25 0 3 0 0 0 0 0 3 3 0 0 0
26 0 3 0 0 0 0 0 3 3 0 0 0
27 0 3 0 0 0 0 0 3 3 0 0 0
28 0 3 0 0 0 0 0 3 2 0 0 0
29 0 3 0 0 0 0 0 2 2 3 0 0
30 0 3 0 0 0 0 0 2 3 3 0 0
31 0 3 0 0 0 0 0 3 3 3 0 0
32 0 3 0 0 0 0 0 2 3 3 0 0
33 0 3 0 0 0 0 0 2 3 3 0 0
34 0 3 0 0 0 0 0 2 3 3 0 0
35 0 3 0 0 0 0 0 3 3 3 0 0
36 0 3 0 0 0 0 0 3 2 2 0 0
37 0 2 0 0 0 0 0 2 2 3 0 0
38 0 3 0 0 0 0 0 3 3 3 0 0
39 0 3 0 0 0 0 0 2 3 3 0 0
40 0 3 0 0 0 0 0 2 2 2 0 0
41 0 3 0 0 0 0 0 2 3 3 0 0
42 0 3 0 0 0 0 0 3 3 2 0 0
43 0 3 0 0 0 0 0 3 3 3 0 0
44 0 3 0 0 0 0 0 2 3 3 0 0
45 0 3 0 0 0 0 0 2 3 3 0 0
46 0 3 0 0 0 0 0 2 3 3 0 0
47 0 3 0 0 0 0 0 2 3 3 0 0
48 0 2 0 0 0 0 0 2 3 3 0 0
49 0 3 0 0 0 0 0 2 3 3 0 0
50 0 3 0 0 0 0 0 2 3 3 0 0
51 0 3 0 0 0 0 0 2 2 2 0 0
VotersRound 1 2 3 4 5 6 7 8 9 10 11 12
1 2 2 3 2 3 2 2 0 0 0 0 0
2 0 2 2 2 3 3 3 3 0 0 0 0
3 0 0 2 2 2 2 2 2 3 0 0 0
4 0 0 3 2 2 2 2 3 3 0 0 0
5 0 0 2 2 2 2 2 3 2 0 0 0
6 0 0 2 2 2 3 3 0 0 0 0 0
7 0 0 0 2 2 2 3 3 0 0 0 0
8 0 0 0 2 2 2 3 0 0 0 0 0
9 0 0 M 2 3 2 2 3 3 3 0 0
10 0 0 0 0 0 3 3 3 3 2 0 0
11 0 0 0 2 3 3 3 3 0 0 0 0
12 0 0 0 0 0 0 2 2 3 2 2 0
13 0 2 2 2 2 0 0 3 3 2 0 0
14 3 0 0 0 0 0 0 0 0 2 2 2
15 2 0 0 0 0 0 0 3 3 3 2 2
16 0 0 0 0 0 0 0 3 3 2 2 0
17 0 0 0 0 0 0 0 3 3 2 3 2
18 3 0 0 0 0 0 0 0 0 0 2 2
19 3 0 0 0 0 0 0 3 3 3 3 2
20 2 0 M 0 0 0 2 2 3 2 2 2
21 2 0 0 2 2 0 0 0 0 2 3 2
22 2 0 0 0 2 0 0 0 2 2 2 2
23 3 0 0 0 0 0 0 0 0 2 2 2
24 2 0 2 3 3 2 0 0 0 0 0 2
25 0 0 3 3 3 0 0 0 0 0 0 0
26 0 0 2 3 2 3 0 0 0 0 0 0
27 3 0 3 2 3 0 0 0 0 0 0 2
28 3 0 3 2 3 0 0 0 0 0 0 2
29 2 0 2 2 3 2 2 0 0 0 0 2
30 3 0 3 3 3 0 0 0 0 0 0 2
31 2 0 3 2 3 0 0 0 0 0 0 2
32 3 0 3 2 2 0 0 0 0 0 0 2
33 0 0 0 0 0 3 3 0 0 0 2 2
34 0 0 M 0 2 3 3 0 0 0 2 3
35 0 0 0 0 3 3 3 0 0 0 2 0
36 0 0 M 3 2 3 3 0 0 0 3 3
37 2 0 2 2 3 3 0 0 0 0 0 2
38 0 0 0 0 3 2 2 0 0 0 3 3
39 0 0 0 3 3 2 2 0 0 0 3 2
40 2 0 2 3 2 2 0 0 0 0 2 2
41 3 0 3 2 2 3 0 0 0 0 0 2
42 0 0 2 3 0 3 2 0 0 0 2 2
43 3 0 3 3 2 0 0 0 0 0 0 2
44 3 0 3 2 2 3 0 0 0 0 0 2
45 3 0 2 3 2 0 0 0 0 0 0 2
46 0 0 0 0 0 3 2 0 0 0 2 2
47 0 0 0 0 0 3 2 0 0 0 2 2
48 0 3 0 0 0 0 0 0 2 0 0 0
49 2 0 0 3 3 3 2 0 0 0 0 2
50 3 0 0 2 3 3 2 0 0 0 0 3
51 2 0 2 0 3 2 2 0 0 0 3 2

29
alliancesormakingofferstofewervoters.25Generally,votersstopvotingforacandidateassoonasan
offergetstoosmall,whichisinlinewithourfindingthatvotersrespondmainlytomonetaryincentives
butnottofavoritismperse,andthattheyhaveastronger“bargaining”positionthancandidateasthey
decideafterobservingtheirpolicyoffers.Thisexample,andothersthatareavailablefromtheauthors
onrequest,yield:
Experimental result 7: Some long‐standing political alliances arise between parties and individual
voters.Thesebondsare rational in the sense that votersonly casta vote for thepartyas longas their
preferenceintensitiesdonotgettoosmall.
5Conclusions
Althoughpork‐barrel spending isubiquitous ineverydaypolicymaking,manyof its consequencesare
stillnotunderstood.Here,weprovidenovelinsightsonhowvoluntaryversuscompulsorycostlyvoting
can affect tactical redistribution and thus inequality. Our experimental results show that, for a fixed
budget,candidatesmakeonaveragegreaterpromisestofewervoterswithvoluntarythancompulsory
voting,because in the formermodesupportersmustbecompensated for thevotingcosts inorder to
earn the chance of receiving their votes. Thus, among otherwise homogenous voters, redistributive
inequality is on average greater with voluntary voting. Further, the voters’ decisions are generally
similartothosereportedinexperimentsusingexogenousgroupswithbothcompulsory(e.g.,McKelvey
andOrdeshook1990)andvoluntaryvoting(e.g.,GroßerandSchram2010;LevineandPalfrey2007).
That is, they vote sincerely most of the time and voluntary turnout rates are positively related to
preferenceintensityand,forsufficientlyhighintensities,negativelyrelatedtotheabsolutedifferencein
relevantsupportergroupsizes.
Our paper also adds to studies of electoral competition by comparing elections that center on
politicians and parties, respectively. Specifically, parties can coordinate their policies across several
legislativeperiodswhilepoliticianscannot,whichweimplementintheexperimentasfinitelyrepeated
25ForanexampleofhowB coulddefeatA, suppose thatB targets fivevotersandbumps intoall foursupportersofA.ThisyieldsfourA‐supporterswith 0.9tokensandoneB‐supporterwith 3.6tokens.Theoretically,inNEallA‐supportersabstainsince 2tokens,andBwinsoutrightasherorhisonlysupportersurelyturnsouttovotesincerely.

30
versusnearlyone‐shotcandidateencounters.Wefindthatthisdistinctionmattersa lot.Towit,while
politicians’ promises to voters are virtually unpredictable across elections, parties tend to cultivate
policy polarizationby repeatedly favoring again their exclusive supporters and avoiding those of the
opponent, so that some long‐standing tacit alliances form between parties and individual voters. In
addition,partieswithcompulsoryvotingbattleforthevotesofaseparatedsubsetofvoters,something
whichisnotobservedinthevoluntarymode.
Morebroadly,thepresentpaperlinksgreatlytoavarietyof importanttheoreticalandempirical
studies in the electoral competition literature,which accentuates its external validity. First,we show
that a lasting divided society can emerge via pork barrel politics in spite of the absence of apparent
“coordinationdevices”thatmoreeffectivelyfacilitatelong‐standingalliancesbetweenpartiesandtheir
supporters.Forexample,wedonotuse ideologicalpreferencesofvoterssuchas inmodelsofspatial
competition (e.g., Dixit and Londregan 1996; Downs 1957; Hotelling 1929), other characteristics of
voters(e.g.,educationandreligion),costsrelatedtopolicychanges,oropportunitiestomonitorvoter
behavior(e.g.,Nichter2008;Stokes2005).Inthisregard,ourexperimentnotonlyprovidesinsightson
short‐term favors, but also on a more fundamental distributive process that contributes to shaping
society in the long run. Second, observational evidence suggests that voters do indeed respond to
political favors inways consistentwithour theoretical andexperimental findings for thepolitygame
withvoluntaryvoting.Chen(2013)findsthatgovernmentdeliveryofdistributiveaidraisesturnoutfor
the incumbent party and decreases turnout for the opposition. In our terminology, the aid increases
preference intensities of incumbent supporters and decreases those of opponent supporters (and
potentially turns them into incumbent supporters). As a consequence, because voters’ preference
intensities andpositively associatedwith their probability of going to the polls, turnout rises for the
incumbentpartyandfallsfortheopposition.NotethatinChen(2013)thedistributiveaidoperateson
anexistingdivideintheelectorate(i.e.,theDemocraticandRepublicandivideintheU.S.),whileinour
experimentpolarization isendogenous.Third, there isobservationalevidencethatcompulsoryvoting
leads to less redistributive inequality than voluntary voting. In particular, Fowler (2013) shows that
Australia’sadaptionofthecompulsorymodemarkedlyincreasedturnoutandpensionspendingatthe

31
national level, and hence yielded a public policy that considers the preferences of larger numbers of
citizens.Moreover,higherlevelsofvoterparticipationareassociatedwithmoreequaldistributionsof
income (e.g., Lijphart 1997; Mueller and Stratmann 2003). Finally, voluntary turnout patterns with
respecttopreferenceintensitiesanddifferencesinsupportergroupsizesinourandotherexperimental
studies(e.g.,GroßerandSchram2010;LevineandPalfrey2007)areverysimilartothoseobservedin
the field (for surveys, seeBlais 2000andMatsusaka andPalda1993).Thus, in strong support of the
externalvalidityofthispaper,manyofourfindingsareconsistentwiththoseofotherempirical,more
partial studies. In linking thevarious important studiesonelectoral competition,webelieve that our
studycanhelptoobtainamorecoherentpictureofthegeneralpoliticalprocess.
References
Abbink,Klaus,andAbdolkarimSadrieh.1995. “RatImage,ResearchAssistanceToolbox forComputer‐
AidedHumanBehaviorExperiments.”DiscussionPaperNo.B‐325,UniversityofBonn.
Alesina,Alberto.1988.“Credibilityandpolicyconvergenceinatwo‐partysystemwithrationalvoters.”
AmericanEconomicReview78(4):796‐805.
Avrahami,Judith,andYaakovKareev.2009.“Dotheweakstandachance?Distributionofresourcesina
competitiveenvironment.”CognitiveScience33(5):940‐50.
Axelrod,Robert.1981.“Theemergenceofcooperationamongegoists.”AmericanPoliticalScienceReview
75(2):306‐18.
Baron,DavidP.1991.“Majoritarianincentives,porkbarrelprograms,andproceduralcontrol.”American
JournalofPoliticalScience35(1):57‐90.
Blais,André.2000.Tovoteornottovote?Themeritsandlimitsofrationalchoicetheory.PittsburghPA:
UniversityofPittsburghPress.
Borel,Emile.1921.“Lathéoriedujeuetleséquationsintégralesànoyausymétrique.”ComptesRendus
del’AcadémiedesSciences173:1304‐08.
Brams, Steven J., andMorton D. Davis. 1974. “The 3/2’s rule in presidential campaigning.”American
PoliticalScienceReview68(1):113‐34.

32
Campbell,ColinM.1999.“Largeelectoratesanddecisiveminorities.”JournalofPoliticalEconomy107
(6):1199‐1217.
Cason, Timothy N., and Vai‐Lam Mui. 2005. “Uncertainty and resistance to reform in laboratory
participationgames.”EuropeanJournalofPoliticalEconomy21,708‐37.
Chen,Jowei.2013.“Voterpartisanshipandtheeffectofdistributivespendingonpoliticalparticipation.”
AmericanJournalofPoliticalScience57(1):200‐17.
Chowdhury, Subhasish M., Dan Kovenock, and Roman M. Sheremeta. 2013. “An experimental
investigationofColonelBlottogames.”EconomicTheory52(3):833‐61.
Corazzini,Luca,SebastianKube,MichelAndréMaréchal,andAntonioNicoló.“Electionsanddeceptions:
Anexperimentalstudyonthebehavioraleffectsofdemocracy.”AmericanJournalofPoliticalScience.
Forthcoming.
Cox,GaryW.,andMathewD.McCubbins.1986.“Electoralpoliticsasaredistributivegame.” Journalof
Politics48(2):370‐89.
Diekmann,Andreas.1985.“Volunteer’sdilemma.”JournalofConflictResolution29(4):605‐10.
Dixit,Avinash, and JohnLondregan. 1995. “Redistributivepolitics andeconomic efficiency.”American
PoliticalScienceReview89(4):856‐66.
Dixit, Avinash, and John Londregan. 1996. “The determinants of success of special interests in
redistributivepolitics.”JournalofPolitics58(4):1132‐55.
Dixit, Avinash, and John Londregan. 1998. “Ideology, tactics, and efficiency in redistributive politics.”
QuarterlyJournalofEconomics113(2):497‐529.
Downs,Anthony.1957.Aneconomictheoryofdemocracy.NewYork:HarperandRowPublishers.
Feddersen,Timothy,SeanGailmard,andAlvaroSandroni.2009.“Moralbias in largeelections:Theory
andexperimentalevidence.”AmericanPoliticalScienceReview103(2):175‐92.
Feddersen, Timothy, and Alvaro Sandroni. 2006. “A theory of participation in elections.” American
EconomicReview96(4):1271‐82.
Fowler,Anthony.2013.“Electoralandpolicyconsequencesofvoterturnout:Evidenceforcompulsory
votinginAustralia.”QuarterlyJournalofPoliticalScience8(2):159‐82.

33
Goeree,JacobK.,andCharlesA.Holt.2005.“Anexplanationofanomalousbehaviorinmodelsofpolitical
participation.”AmericanPoliticalScienceReview99(2):201‐13.
Gross,O.A.,andR.A.Wagner.1950.“AcontinuousColonelBlottogame.”ResearchMemorandumRM‐
408.SantaMonica:RANDCorporation.
Grossman,GeneM.,andElhananHelpman.2005.“Partydisciplineandporkbarrelpolitics.”Cambridge,
MA:NBRRWorkingPaper11396.
Großer, Jens, and Arthur Schram. 2010. “Public opinion polls, voter turnout, and welfare: An
experimentalstudy.”AmericanJournalofPoliticalScience54(3):700‐17.
Großer, Jens, and Thorsten Giertz. 2009. “Candidates, voters, and endogenous group formation: A
ColonelBlottoexperiment.”Workingpaper.
Großer, Jens, andThorstenGiertz.2014. “Indifferentvotersandporkbarrelpolitics:AColonelBlotto
experiment.”Workingpaper.
Hart, Sergiu. 2008. “Discrete Colonel Blotto and general lotto games.” International Journal of Game
Theory36(3‐4):441‐60.
Hotelling,Harold.1929.“Stabilityincompetition.”EconomicJournal39(153):41‐57.
Kreps, DavidM., PaulMilgrom, John Roberts, and RobertWilson. 1982. “Rational cooperation in the
finitelyrepeatedprisoners’dilemmagame.”JournalofEconomicTheory27(2):245‐52.
Laslier, Jean‐François, and Nathalie Picard. 2002. “Distributive politics and electoral competition.”
JournalofEconomicTheory103(1):106‐30.
Levine,DavidK.,andThomasR.Palfrey.2007.“Theparadoxofvoterparticipation?Alaboratorystudy.”
AmericanPoliticalScienceReview101(1):143‐58.
Lijphart, Arend. 1997. “Unequal participation: Democracy’ unresolved dilemma.” American Political
ScienceReview91(1):1‐14.
Lizzeri,Alessandro.1999.“Budgetdeficitsandredistributivepolitics.”ReviewofEconomicStudies 66
(4):909‐28.
Lizzeri,Alessandro,andNicolaPersico.2001.“Theprovisionofpublicgoodsunderalternativeelectoral
incentives.”AmericanEconomicReview91(1):225‐39.

34
Lizzeri, Alessandro, and Nicola Persico. 2005. “A drawback of electoral competition.” Journal of the
EuropeanEconomicAssociation3(6):1318‐48.
Matsusaka, John G., and Filip Palda. 1993. “The Downsian voter meets the ecological fallacy.” Public
Choice77(4):855‐78.
McKelvey,RichardD.,AndrewMcLennan,andTheodoreL.Turocy.2013. “Gambit:SoftwareTools for
GameTheory,Version14.0.1.”http://www.gambit-project.org.
McKelvey, Richard D., and Thomas R. Palfrey. 1995. “Quantal response equilibria for normal form
games.”GamesandEconomicBehavior10(1):6‐38.
McKelvey, Richard D., and Peter C. Ordeshook. 1990. “A decade of experimental research on spatial
models of elections and committees.” In Government, democracy, and social choice, ed. Melvin J.
HinichandJamesM.Enelow.Cambridge:CambridgeUniversityPress.
Mueller,DennisC., andThomas Stratmann. 2003. “The economic effects of democratic participation.”
JournalofPublicEconomics87(9‐10):2129‐55.
Myerson, Roger B. 1993 “Incentives to cultivate favored minorities under alternative electoral
systems.”AmericanPoliticalScienceReview87(4):856‐69.
Nichter, Simeon. 2008. “Vote buying or turnout buying? Machine politics and the secret ballot.”
AmericanPoliticalScienceReview102(1):19‐31.
Owen,Guillermo.1968.Gametheory.Philadelphia:W.B.Saunders.
Palfrey, ThomasR., and Jeffrey E. Prisbrey. 1997. “Anomalous behavior in public goods experiments:
Howmuchandwhy?”AmericanEconomicReview87(5):829‐46.
Palfrey,ThomasR.,andHowardRosenthal.1983.“Astrategiccalculusofvoting.”PublicChoice41(1):7‐
53.
Persson,Torsten,andGuidoTabellini.2000.Politicaleconomics:explainingeconomicpolicy.Cambridge,
MA:MITPress.
Roberson,Brian.2006.“TheColonelBlottogame.”EconomicTheory29(1):1‐24.
Sankoff,David,andKoulaMellos.1972.“Theswingratioandgametheory.”AmericanPoliticalScience
Review66(2):551‐54.

35
Schram,Arthur, and Joep Sonnemans. 1996. “Voter turnout as a participation game: an experimental
investigation.”InternationalJournalofGameTheory25(3):385‐406.
Snyder,JamesM.1989.“Electiongoalsandtheallocationofcampaignresources.”Econometrica57(3),
637‐60.
Stokes,SusanC.2005.“Perverseaccountability:Aformalmodelofmachinepoliticswithevidencefrom
Argentina.”AmericanPoliticalScienceReview99(3):315‐25.
Stokes,SusanC.2009.“Porkbyanyothername…Buildingaconceptualschemeofdistributivepolitics.”
Workingpaper:YaleUniversity.
Young,H.Peyton.1978. “Theallocationof funds in lobbyingandcampaigning.”BehavioralScience23
(1),21‐31.
OnlineSupportinginformation
See https://sites.google.com/site/jwghome/research