university of nairobieie.uonbi.ac.ke/sites/default/files/cae/engineering/eie/supervisory... · my...
TRANSCRIPT
UNIVERSITY OF NAIROBI
DEPARTMENT OF ELECTRICAL AND INFORMATION ENGINEERING
FINAL YEAR PROJECT REPORT
TITLE: SUPERVISORY CONTROL AND DATA ACQUISITION SYSTEM
SUBMITTED BY
YEGO ALLAN KIPKOSGEI F17/23100/2008
SUPERVISOR: PROF. M.K MANGOLI EXAMINER: DR. C. WEKESA
Project report submitted in partial fulfillment of the requirements for the award of the degree of Bachelor of Science in Electrical & Electronic Engineering of the University of Nairobi.
Date of Submission:

i
DECLARATION OF ORIGINALITY
1) I understand what plagiarism is and I am aware of the university policy in this regard.
2) I declare that this final year project report is my original work and has not been submitted
elsewhere for examination, award of a degree or publication.
Where other people’s work or my own work has been used, this has properly been
acknowledged and referenced in accordance with the University of Nairobi’s requirements.
3) I have not sought or used the services of any professional agencies to produce this work.
4) I have not allowed, and shall not allow anyone to copy my work with the intention of
passing it off as his/her own work.
5) I understand that any false claim in respect of this work shall result in disciplinary action,
in accordance with University anti-plagiarism policy.
Signature: ……………………………………………………………………………………… Date: ……………………………………………………………………………………………..
NAME OF STUDENT: Yego Allan Kipkosgei
REGISTRATION NUMBER: F17/23100/2008
COLLEGE: Architecture And Engineering
FACULTY/ SCHOOL/ INSTITUTE: Engineering
DEPARTMENT: Electrical And Information Engineering
COURSE NAME: Bachelor Of Science In Electrical & Electronic Engineering
TITLE OF WORK: SCADA SYSTEMS CONTROL AND DATA ACQUISITION

ii
DEDICATION
This work is dedicated to my family, friends, colleagues and all of who have played a big role in the successful completion of this project.

iii
ACKNOWLEDGEMENT
First and foremost I wish to thank the God Almighty who has seen me through my studies at the
university.
Secondly I greatly appreciate the guidance of my supervisor Prof. M. K. Mang’oli, the Dean-
Faculty of Engineering, Chairman-Department of Electrical and Information Engineering and all
my lecturers and support staff at the University of Nairobi for their support which contributed
greatly to the provision of knowledge as well as the completion of this project.
Thirdly I wish to thank my brothers Anthony, Edwin, Brian and Ronald who kept up and
tolerated my frequent absence.
Lastly, I extend special thanks to my parents, Mr. and Mrs. Yego for their mutual, emotional and
financial support throughout my education.
iv
TABLE OF CONTENTS
DECLARATION OF ORIGINALITY .................................................................................................... i
DEDICATION .......................................................................................................................................ii
ACKNOWLEDGEMENT .................................................................................................................... iii
TABLE OF CONTENTS ...................................................................................................................... iv LIST OF FIGURES .............................................................................................................................. vi
LIST OF TABLES ............................................................................................................................... vii
ABSTRACT .........................................................................................................................................viii CHAPTER ONE: INTRODUCTION ................................................................................................... 1
1.1: Overview of SCADA .................................................................................................................. 1 1.2: Overview of the SMART GRID ................................................................................................. 1
1.3: Integrating SCADA on a SMART GRID .................................................................................. 2
1.4: Objective .................................................................................................................................... 3
1.5: Scope of the Project .................................................................................................................. 3
CHAPTER TWO: LITERATURE REVIEW ......................................................................................... 4 2.1: SCADA SYSTEM ....................................................................................................................... 4
2.1.1: Introduction to SCADA Systems ........................................................................................ 4
2.1.2: Components of SCADA ...................................................................................................... 4
2.2: SMART GRID ............................................................................................................................ 8 2.2.1: Introduction to SMART GRID ........................................................................................... 8
2.2.2: What are the issues with existing grid? .......................................................................... 10
2.2.3: Advantages of Smart Grid ............................................................................................... 10
2.2.4: Building Blocks of Smart Grid ........................................................................................ 11
2.3: Integration of SCADA and Smart Grid .................................................................................. 14 2.3.1: Data sources ..................................................................................................................... 16
2.3.2: Energy management systems ........................................................................................... 17
2.3.3: Wide area applications .................................................................................................... 17
CHAPTER THREE: METHODOLOGY ............................................................................................ 19
3.1: Kenya’s Electricity Transmission System .............................................................................. 19 3.1.1: Power Plants in the Kenyan Grid ................................................................................... 20
3.2: Simulation of the Kenyan Transmission Grid ....................................................................... 23
v
3.2.1: PowerWorld Simulator .................................................................................................... 24
3.2.2: TRANSMISSION LINE PARAMETERS .......................................................................... 28 CHAPTER FOUR: RESULTS AND ANALYSIS ............................................................................... 30
4.1: Effect of Loss of a Generator .................................................................................................. 31
4.1.2: Recovery after loss of Generator ........................................................................................ 31 4.1.3: Improvements to the Grid .................................................................................................... 31
CHAPTER FIVE: CONCLUSION ..................................................................................................... 37 APPENDIXES ..................................................................................................................................... 38
A: LOAD FLOW SOLUTIONS ..................................................................................................... 38
B: POWERWORLD GRAPHS ....................................................................................................... 41
REFERENCES .................................................................................................................................... 47
vi
LIST OF FIGURES
Figure 2.1: SCADA System Structure ................................................................................................. 5
Figure 2.2: Structure of today’s typical power system ...................................................................... 9
Figure 2.3: The four essential building blocks of any smart technology. ....................................... 11
Figure 2.4: Turning the existing power grid into a Smart Grid ...................................................... 15
Figure 2.5: Phase Measurement Unit (PMU) device ....................................................................... 17
Figure 3.2: Single Line Diagram of the Kenyan Transmission System .......................................... 26
Figure 3.3: PowerWorld Design of the Kenyan Transmission Grid ............................................... 27
Figure 4.1: Simulated SCADA system for Kenya’s High Voltage grid ........................................... 33
Figure 4.2: Overloading of lines in the event of loss of a generator .............................................. 34
Figure 4.3: Isolation of the Western Load Centers by opening of the Olkaria 1-Lanet
Transmission Line ............................................................................................................................... 35
Figure 4.4: System net injection of power in MW ............................................................................ 36
Figure B5: Dandora Bus System State .............................................................................................. 46

vii
LIST OF TABLES
Table 3.1: Comparison between the first option and second option of SCADA Implementation - 23
Table 3.2: Transmission Line Capacity, Length and O/C Setting -------------------------------------- 29
Table A1: Y-Bus Solution of the Simulated System ------------------------------------------------------- 38
Table A4: Generators State----------------------------------------------------------------------------------- 40
Table A5: Loads State ----------------------------------------------------------------------------------------- 41
Table A6: Switched Shunts State ---------------------------------------------------------------------------- 41

viii
ABSTRACT
Supervisory Control and Data Acquisition (SCADA) is a computer system for gathering and
analyzing real time data. SCADA is an integral part in power monitoring. Through it power
generation, transmission and distribution can be monitored and controlled either remotely or at
the generation, transmission and or distribution station.
Currently, the Kenya electrical power system network is of the concentrated generation
configuration and SCADA is widely used in this network. The use of SCADA in the system is an
integral part in the day to day operation of the same. However there are several shortcomings to
the existing system the improvements of which are mentioned in this project report.
In this project, implementation of SCADA to realize a Smart Grid for the Kenya electrical power
system is simulated. SCADA for the transmission stage of the grid is considered. It is also
shown how the incorporation of modern control methods improves on the shortcomings of the
existing grid thereby making its operation smart.

1
CHAPTER ONE: INTRODUCTION
1.1: Overview of SCADA
Supervisory Control and Data Acquisition (SCADA) is an industrial control system used to
monitor processes and functions of various industrial devices. In a power system, these devices
can be deployed in remote locations in the field or used inside substations that are in use in the
transmission and distribution phases.
The monitoring and control via SCADA is done at nodes within the power system. The number
of individual nodes that have operational significance within a single energy transmission or
distribution system may be in the thousands, and may be widely scattered geographically.
Without automation, management of a system of this size would require the efforts of a large
work force. SCADA assists in the operation and management by providing a computer-based
technology that offers flexibility in operational efforts, ease in gathering and maintaining data,
and the ability to develop studies and reports on a timely basis.
A SCADA system in its simplest form consists of a central host or master computer (Master
Terminal Unit/MTU) communicating with one or more data gathering units (Remote Terminal
Units / RTU) by means of one or more communications media and a collection of standard
and/or custom software.
A wide range of telecommunications media (i.e., land lines, public switched network, radio
frequency, VHF/UHF, microwave, cellular telephone, fiber optic cable, and satellite) is utilized
to link the RTUs and MTU together.
1.2: Overview of the SMART GRID
A Smart Grid is an electricity network that intelligently integrate the actions of all users
connected to it – generators, consumers and those that do both – in order to efficiently deliver
sustainable, economic and secure electricity supplies.

2
The energy demand in Kenya combined with the move towards renewable energy sources such
as wind and geothermal power necessitates a shift from the traditional centralized generation
currently in use to a high penetration of dispersed generation. The decentralization of the grid
will allow injection of power from alternative sources at various locations.
Moreover, the Smart Grid allows a bidirectional energy and data circulation between the
customer and the supplier thus improving the efficiency of power supply. On the consumer end
this is achieved by integrating Smart Meters.
1.3: Integrating SCADA on a SMART GRID
With the increased penetration of renewable energy generation, the transmission system in
Kenya is facing ever more demanding operating conditions. The variability of the power output
of renewable energy sources and unplanned flows through transmission grids are causing
difficulties for the system operators, who are responsible for maintaining the stability of the
system. The global trend to handle such challenges is towards development of the Smart Grid
and with it incorporating SCADA for monitoring and control.
The Smart Grid as aforementioned incorporates the whole power system from generation to
transmission to distribution to consumption with the latter incorporating the smart meters.
Monitoring and control between the grid operations center and power substations are effectively
implemented with SCADA. However, SCADA as a solution is quite expensive on the grid
between the distribution substation and the customer and it therefore it is not used on this part of
the grid.
As a result, the scope of this project will be on the transmission stage of the Kenya electrical
power system.
In the Kenya electrical power system, SCADA is implemented widely. On the generation side of
the grid, KENGEN employs SCADA to monitor and control all the station countrywide. These
include hydro, geothermal and thermal station. SCADA is widely used locally in all these
stations as well as centrally to coordinate all of them.

3
SCADA is also used on the transmission stage. This is monitored locally at the transmission
stations and also remotely at the National Control Centre located in Dandora.
1.4: Objective
To design and simulate a SCADA system for Kenya’s Electrical Power Network and use it to
realize a Smart Grid for the Kenya Electrical Power Network
The SCADA system should be a representation of the Kenyan system as is with the addition of
features that improve on the shortcomings of the existing SCADA system.
1.5: Scope of the Project
The simulated SCADA system will be that of the high voltage transmission system in Kenya.
This includes the 220 kV and 132 kV transmission system that is used across the country. As
aforementioned this comes about because SCADA as a solution is quite expensive on the grid
between the distribution substation and the customer and it therefore it is not used on this part of
the grid.

4
CHAPTER TWO: LITERATURE REVIEW
2.1:SCADA SYSTEM
2.1.1:Introduction to SCADA Systems
Supervisory Control And Data Acquisition is a system that has been adopted by energy
infrastructure operators globally as a tool to assist them in efficiently and cost-effectively
managing their complex individual systems.
This is done through measuring, monitoring, and controlling key functions at nodes within the
infrastructure. The number of individual nodes that have operational significance within a single
energy transmission or distribution system may be in the thousands, and may be widely scattered
geographically.Without automation, management of a system of this size would require the
efforts of a large work force, both in the field and in the office, and would of necessity mandate a
considerable degree of decentralized operational control. SCADA assists in the operation and
management by providing a computer-based technology that offers flexibility in operational
efforts, ease in gathering and maintaining data, and the ability to develop studies and reports on a
timely basis.
SCADA provides management and monitoring with real-time data on production operations,
implement more efficient control paradigms, improves plant and personnel safety, and reduces
costs of operation[1].
2.1.2: Components of SCADA
A SCADA system in its simplest form consists of a central host or master computer (usually
called a master station, master terminal unit or MTU) communicating with one or more data
gathering units or remotes (usually called remote stations, remote terminal units, or RTU's) by
means of one or more communications media and a collection of standard and/or custom
software.
5
A wide range of telecommunications media (i.e., land lines, public switched network, radio
frequency, VHF/UHF, microwave, cellular telephone, fiber optic cable, and satellite) is utilized
to link the RTUs and MTU together. In many systems the communications function is provided
by a commercial communications entity over a public communications system (e.g., phone, cell
phone, VSAT). In others, the operator owns and maintains the communications as a dedicated
part of the SCADA system (e.g., VHF/UHF radio, microwave).
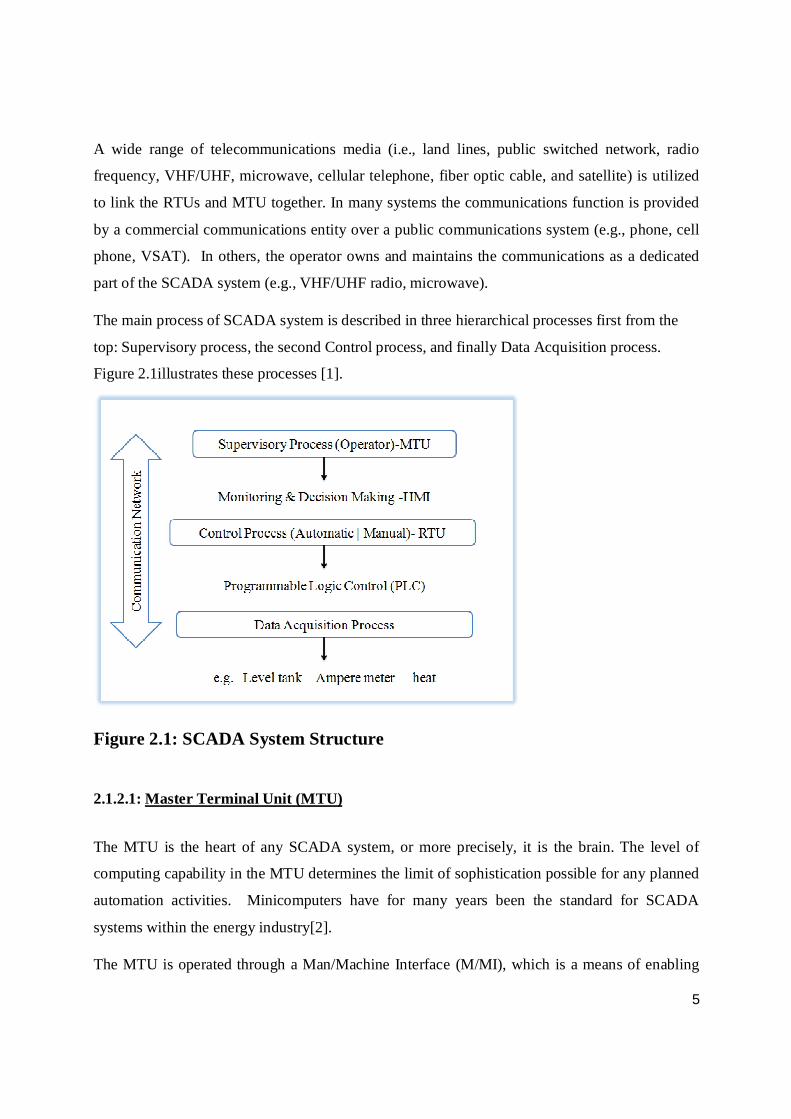
The main process of SCADA system is described in three hierarchical processes first from the
top: Supervisory process, the second Control process, and finally Data Acquisition process.
Figure 2.1illustrates these processes [1].
Figure 2.1: SCADA System Structure
2.1.2.1: Master Terminal Unit (MTU)
The MTU is the heart of any SCADA system, or more precisely, it is the brain. The level of
computing capability in the MTU determines the limit of sophistication possible for any planned
automation activities. Minicomputers have for many years been the standard for SCADA
systems within the energy industry[2].
The MTU is operated through a Man/Machine Interface (M/MI), which is a means of enabling
6
the operator to issue commands through the MTU to the facilities in the field. This almost
always includes a keyboard, but may also include mouse-driven graphic displays, touch screens,
and the like.
Most SCADA systems are designed with one (or more) computer units functioning as the
primary MTU, with at least one additional unit installed in parallel and programmed to act as a
backup. The standby unit typically is up and continuously running, and receives all incoming
data at the same time as the primary unit. It is also used by the Control Staff for various off-line
activities, such as compiling and issuing reports, archive retrieval, and “what if” studies. In most
cases it is identical to the primary unit, although it merely needs to have approximately equal
capabilities.
In the event the primary unit fails the standby unit is available for immediate service. Some
systems are designed for the standby unit to automatically take over system control if the
primary unit fails. Others require manual intervention and a controlled introduction of the
standby unit.
2.1.2.2: Remote Terminal Unit (RTU)
An RTU is an instrument that monitors one or more physical parameters at a specific point in a
piping system or wire network. Its function is similar to that of a gauge or meter, but it is also
capable of passing on, via a modem, the data it is observing. An RTU can be either intelligent or
not. The simplest RTU compares the condition it sees (pressure, voltage, temperature, etc.) to a
pre-established range and converts it to a digital value that represents the appropriate percentage
of that range. The digital value is transmitted when the MTU polls the RTU at regular intervals.
Another type of RTU, called an accumulator, counts repetitive signals from a field device and
transmits the number of pulses seen since it was last polled by the MTU. These RTUs do
nothing but gather data and report it. They cannot institute any status change.
Certain RTUs are designed to receive a signal from the MTU and substitute it for an existing
signal at a particular device, such as a valve operator. This causes the device to adjust to a new
7
setting, with a corresponding change in system conditions. None of the RTUs described so far
require intelligence to perform its function[2].
An intelligent RTU is sometimes also referred to as a Programmable Logic Controller (PLC) or
an Intelligent Electronic Device (IED). Such a device contains one or more microchips that can
be programmed to enable the RTU to perform certain computational or control tasks in the field,
relieving the MTU of some of its duties. An example of such an intelligent unit might be a flow
computer as used in most gas transmission SCADA systems.
Simple (non-intelligent) RTUs can collect raw data regarding gas conditions across an orifice
plate in a meter tube, and forward the data to the MTU. The MTU then processes the data using
standard flow equations contained in its programming and calculates the instantaneous flow. It
may be required to do this for dozens of points on the system, each time the system is scanned.
This requires significant computing time.
An intelligent field unit gathers the appropriate raw data and makes the flow calculation on site,
using the same equations used by the MTU. It then transmits the actual flow value to the MTU.
The flow computer can perform this measurement and calculation on a nearly continuous basis,
while the MTU can only do it as often as the RTU is polled. The flow computer obtains a more
accurate volume for the measurement period, which is then transmitted to the MTU once each
day. It also provides a greater measure of security in the event of a communications or MTU
disruption, because it continues to store usable data for later transmission. Only the
instantaneous raw values are lost. Most SCADA systems employ both simple and intelligent
field devices.
2.1.2.3: Communication
In order for a SCADA system to function there must be reliable two-way communications
between the MTU in the Control Center and the RTU in the field. This can be provided by the
public switched phone system, fiber optics, cellular telephone, VHF or UHF radio, microwave,
satellite radio, or even a dedicated hard wire system

8
Deserving of special note in the communications arena are the numerous systems now using the
Internet as the primary communications medium. This is an attractive concept because it is easy
to access, can be very cost-effective for far-flung systems (every transmission can be a local call)
and is reliable if the operator is judicious in selecting the ISP. However, such a system increases
the vulnerability to intrusion.
2.1.2.4: Software
Today’s SCADA systems require sophisticated software to facilitate their operations. These
programs provide the necessary operational flexibility, as well as the ability to archive data,
create and utilize graphic schematics, and issue regular reports. Some systems even allow off-
line simulations for use in operator training programs.
Most SCADA systems use commercially available software packages that employ open
architecture protocols, making each system look very much like many others. This feature
provides ease of installation and setup of a new system. It also facilitates compatibility between
devices offered by different vendors. Operators are not limited to single sources for subsequent
additions to the system.
2.2: SMART GRID
2.2.1: Introduction to SMART GRID
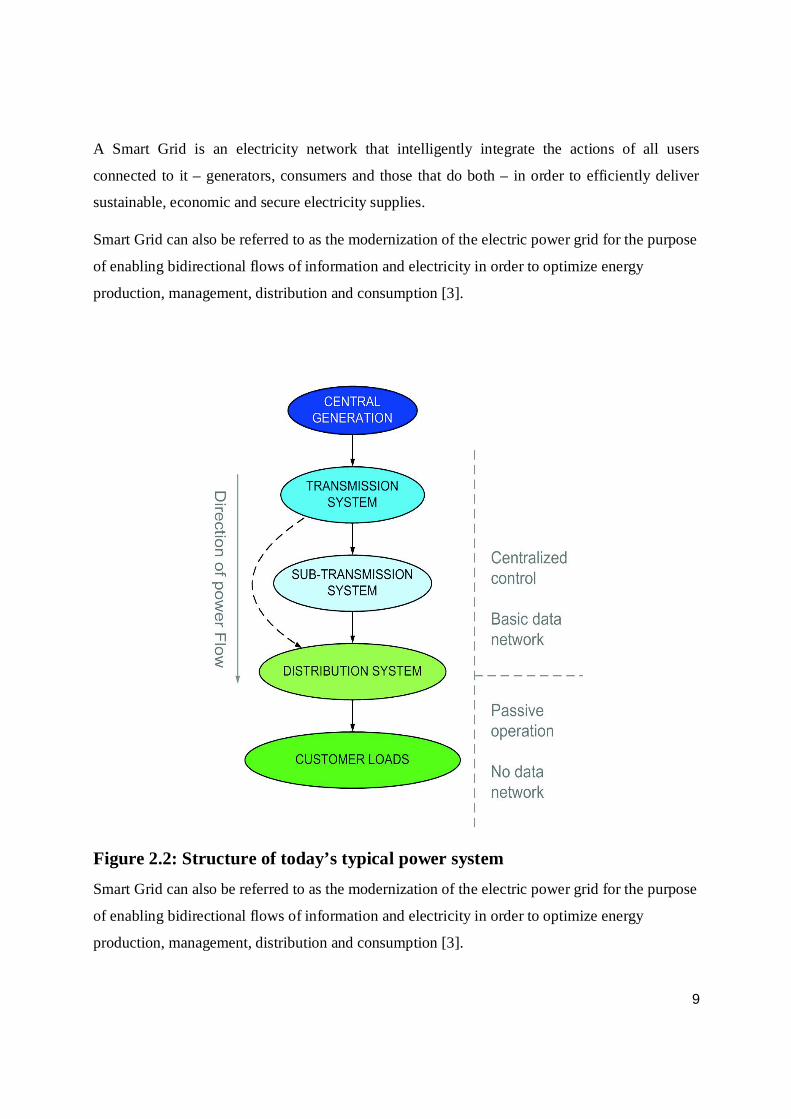
Electric power is a fundamental utility in modern society. Power systems today are based on
technology that was mainly developed for one-way power flows from large power plants to
generally passive customers at the receiving end of the network.This is illustrated in Figure 2.2
below. Making grids “smarter” will help to alleviate many of the challenges that power systems
are currently facing and that will occur with increasing frequency in the future, such as variable-
output renewables, distributed generation, electric vehicles, under-investment in grid
infrastructure, and more.
9
A Smart Grid is an electricity network that intelligently integrate the actions of all users
connected to it – generators, consumers and those that do both – in order to efficiently deliver
sustainable, economic and secure electricity supplies.
Smart Grid can also be referred to as the modernization of the electric power grid for the purpose
of enabling bidirectional flows of information and electricity in order to optimize energy
production, management, distribution and consumption [3].
Figure 2.2: Structure of today’s typical power system Smart Grid can also be referred to as the modernization of the electric power grid for the purpose
of enabling bidirectional flows of information and electricity in order to optimize energy
production, management, distribution and consumption [3].

10
Electrical distribution networks are becoming increasingly complex systems. The addition of
embedded generation, sustainable energy projects, demand side participation schemes and smart
metering require the system operator to gather an unprecedented level of information in real-time
from their network [4].
Smart Grids are intelligent systems and networks which effectively improve the efficiency of
current energy production and also integrate a growing number of renewable sources [1].
SCADA systems, which form the data collection and processing infrastructure of these complex
and intelligent networks, are used to control geographically dispersed assets, often scattered over
thousands of square kilometers, where centralized data acquisition and control are critical to
system operation [5].
2.2.2: What are the issues with existing grid?
1. Limited delivery system: The current electricity delivery uses a supervisory control and
data acquisition system (SCADA) which suffers limited bandwidths and relatively slow
data transmission rates that often require several seconds or more to respond to an alarm
or system change and there is no visibility in the distribution network below the
substation.
2. High cost of power outage and power quality interruption: Frequent power outage and
interruption in Kenya as a result of various factors have a huge toll on the economy. This
affects mostly industries which require high quality power.
3. Inefficiency at managing peak load: Electricity demands vary all the time, and the cost to
meet these demands changes as well. For the existing grid, supply has to change
according to the demands continuously and the power grid will also need to maintain a
buffer of excess supply, which results in lower efficiency, higher emissions, and higher
costs.
As a result of the issues above, the existing grid has to change to meet the demand proposed by
this modern society.
2.2.3: Advantages of Smart Grid
11
Improved Reliability
Higher asset utilization
Reduced operating costs for utilities
Increased efficiency and conservation
Better integration of plug-in hybrid electric vehicles (PHEVs) and renewable energy
Lower greenhouse gas (GHG) and other emissions
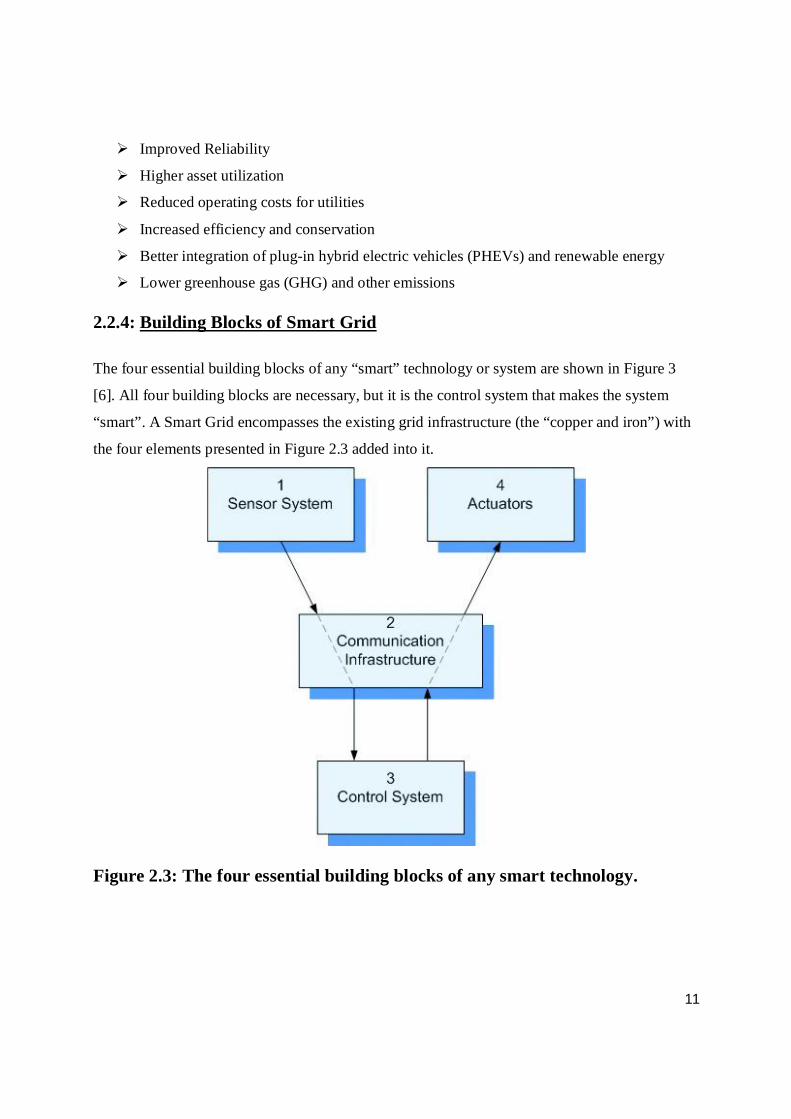
2.2.4: Building Blocks of Smart Grid
The four essential building blocks of any “smart” technology or system are shown in Figure 3
[6]. All four building blocks are necessary, but it is the control system that makes the system
“smart”. A Smart Grid encompasses the existing grid infrastructure (the “copper and iron”) with
the four elements presented in Figure 2.3 added into it.
Figure 2.3: The four essential building blocks of any smart technology.

12
2.2.4.1: Sensor systems
A Smart Meter forms part of this system. It is a combination of a sensor (that can measure and
communicate electricity consumption in real-time), logic (that enables communication with the
operator), and an actuator (that enables active control of consumer appliances). Real-time pricing
of electricity consumption will provide customers with the incentive to load shift from peak to
off-peak periods (demand response) and to promote energy efficiency measures.
Phasor Measurement Units (PMU) or synchro-phasors measure the voltage amplitude and
phase angle (the voltage “phasor”) at network buses and current phasors in transmission lines
and transformers. The state of the power system is defined as a collection of positive sequence
voltage phasors at all network buses [7].
The measurements are taken many times per second and have a precise time “stamp” to within a
microsecond. Measurements from multiple geographical locations are synchronized to a
common time reference using a Global Positioning Satellite (GPS) receiving clock.
Many PMU’s also provide other measurements, such as individual phase voltages and currents,
harmonics, local frequency, and rate of change of frequency [7].
2.2.4.2: Communication Infrastructure Communication Technology will link together all the units and control logics of the Smart Grid.
One aspect is two-way connection of consumers and distribution operators, while the supply of
rapid, secure, wide-area communication (in the range of milliseconds) for transmission operators
is another. Fibre optics ensures reliable, high speed communication and is important for
dedicated high-speed broadband in the power industry.
Wide Area Measurement Protection and Control Systems (WAMPACS) rely on fast
communication, and is probably best achieved using fibre optics. Fibre optics is also increasingly
installed in households and, in the future, will be used for communication between smart meters
and the utilities.
2.2.4.3: Control Systems Energy Management Systems (EMS) are systems of computer-aided tools used by power system
operators to monitor, control, and optimize the performance of the power system, including
generation, transmission & distribution (T&D), and consumption. Thus, the EMS represents the
“brains” of the power grid [8].
13
Transmission Systems today employ SCADA systems as integral parts of EMS. SCADA
performs the monitoring and control functions in EMS. SCADA systems are highly distributed.
A SCADA control center performs centralized monitoring and control, based on information
received from remote stations. Automated or operator-driven supervisory control commands can
then be sent to remote station control devices that can control local operations[9].
Problems with SCADA include slow refresh rate, latency, and skew, resulting in lower accuracy
and “visibility” of the power system state.
Traditional EMS applications are model-based, and thus the results are only as good as the
accuracy of the model. Measurement-based applications do not suffer from this[8]. The
introduction of synchronized WAMPACS has already begun in severalcountries, including U.S.,
central-western Europe and the Nordic countries, China, and Russia [10].
WAMPACS analyse the data transmitted from PMU’s deployed over a large portion of the
power system substations and transmission lines. Data from multiple locations are synchronized
to a common time reference using GPS.
Important uses of WAMPACS include state estimation and advanced real-time visualization of
power systems, real-time congestion management, stability enhancement, improved damping of
inter-area oscillations, the design of advanced warning systems and adaptive protection systems,
validation of system models, and analyses of the causes of blackouts [10].
Information on the voltage magnitude and phase angle makes it possible to generate a single
state estimate for interconnected systems, where each subsystem is under a different control
centre and therefore has its own state estimator. Synchronized measurement technology can
achieve significant improvements in real-time visualization of power systems.
2.2.4.5: Actuators A number of actuators in the existing grid will also be part of the Smart Grid concept, including,
among others, switches and circuit breakers. Here, focus will be on the new elements, including
smart meters, new Flexible AC Transmission System (FACTS) devices, and energy storage
units.
Power flow control is mainly based on mechanical devices, such as transformer tap changers and
turbine governors, which have limited flexibility and speed of control. FACTS devices are high

14
power electronic devices that can perform control at a very high speed. Some are connected in
shunt to the grid to provide reactive power and voltage control, while others are connected in
series to provide control of power flow.
FACTS devices provide the system operator with a measure of freedom in operating the system.
FACTS devices have already been installed in many parts of the world. A Smart Grid will
improve control and increase the benefits from using existing and new FACTS [11].
There are many different FACTS devices, of which the five most common are listed below. All
these are based on controllable semiconductors (e.g. thyristors).
Static Var Compensator (SVC)
Static synchronous compensator (STATCOM)
Thyristor-Controlled Series Capacitor (TCSC)
Static Synchronous Series Compensator (SSSC)
Unified Power-Flow Controller (UPFC)
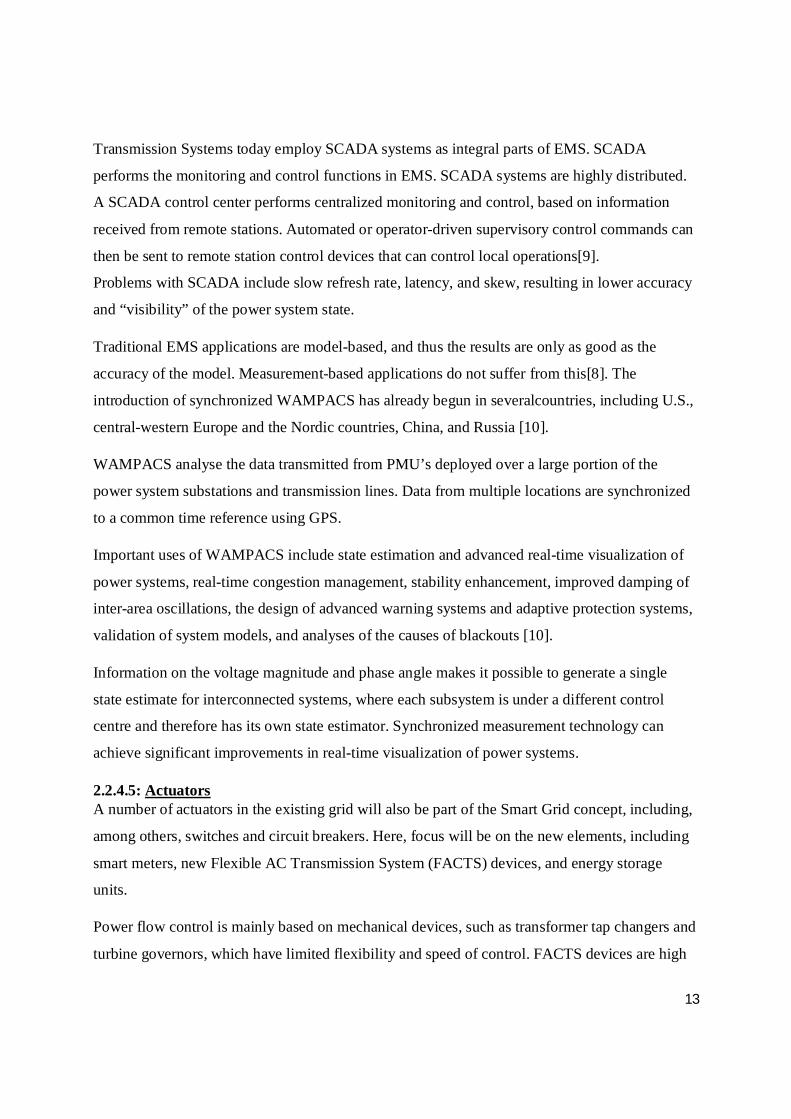
2.3: Integration of SCADA and Smart Grid
Smart Grid is actually an addition of both “hardware” and “software” technology into the
existing grid infrastructure and management systems. This is illustrated in Figure 2.4 below. The
figure also shows examples of units that are aided by Smart Grid technology. We observe that
Smart Grids represent an addition of different sensor systems, communication infrastructure,
control units, and centralised management systems into the existing grid infrastructure.
The Smart Grid will require a combination of standard based, interoperable hardware and
software components. Many of the technologies already exist, but enormous challenges must be
overcome in developing hardware, not to mention software, in order to integrate the Smart Grid
with the existing grid infrastructure.
15
Figure 2.4: Turning the existing power grid into a Smart Grid
16
Transmission systems in many countries are facing ever more demanding operating conditions
with increasing penetrations of renewable energy generation, larger flows and greater cross
border trading of electricity. The variability of the power output of renewable energy sources and
unplanned flows through transmission grids are causing difficulties for the system operators, who
are responsible for maintaining the stability of the system. Excessive power flows in transmission
circuits and large variations in busbar voltages may arise during steady-state operation so that
when faults and network outages occur, they can lead to system collapse [12].
In order to aid the transmission system operators to monitor, control, and optimise the
performance of generation and transmission systems, a suite of Applications collected into an
Energy Management System (EMS) is used. As the monitoring and control functions for EMS
are often provided by SCADA, these systems are also referred to as EMS/SCADA. The EMS is
normally located in the System Control Centre and effective real-time monitoring and remote
control exist between the Control Centre and the generating stations and transmission substations
[12].
With the growing availability of measurements from Phasor Measurement Units (PMUs), it is
expected that, in future, PMU measurements will be integrated with EMS. However, at present,
PMUs are mainly incorporated into separate Wide Area Applications. It is expected that EMS
and Wide Area Applications will coexist separately for some time [12].
2.3.1: Data sources
1. IEDs and SCADA:IEDs receive measurements and status information from substation
equipment and pass it into the process bus of the local SCADA. The substation
SCADAsystems are connected to the Control Centre where the SCADA master is located
and the information is passed to the EMS Applications.
2. Phasor measurement units: Figure 2.5 shows a PMU. It measures 50/60 Hz sinusoidal
waveforms of voltages and currents at a high sampling rate, up to 1200 samples per
second and with high accuracy. From the voltage and current samples, the magnitudes
and phase angles of the voltage and current signals are calculated in the phasor
microprocessor of the PMU. As the PMUs use the clock signal of the Global Positioning
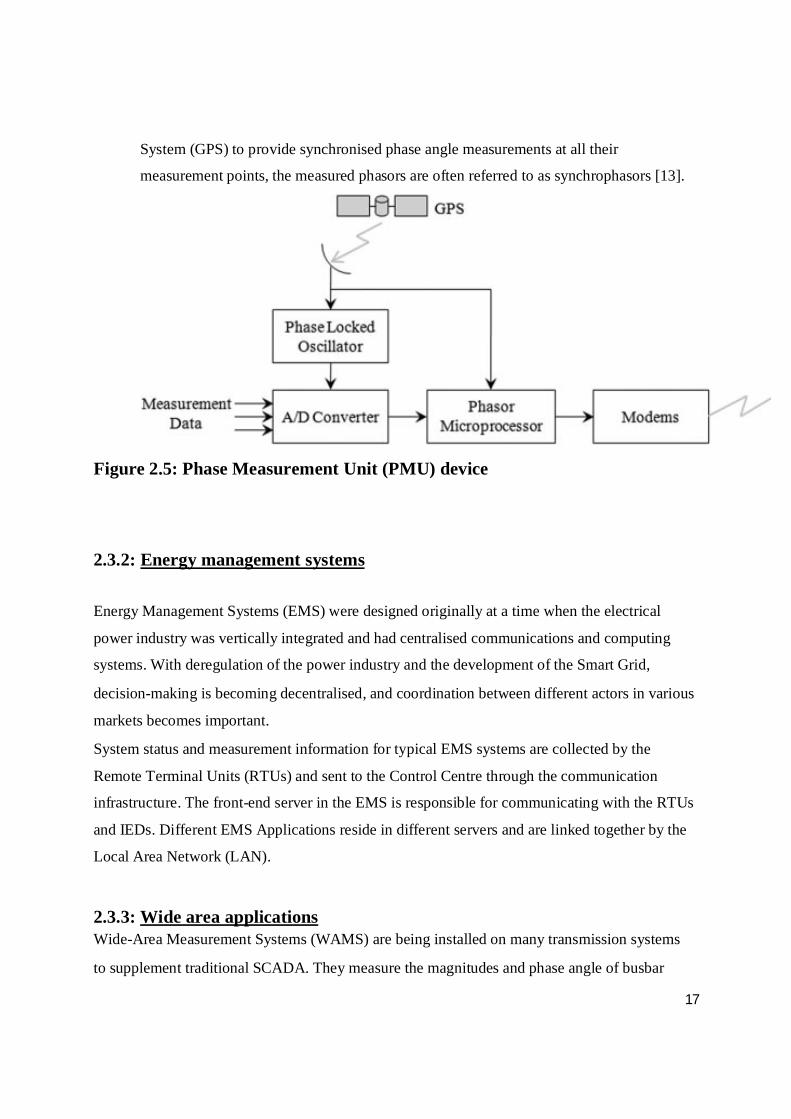
17
System (GPS) to provide synchronised phase angle measurements at all their
measurement points, the measured phasors are often referred to as synchrophasors [13].
Figure 2.5: Phase Measurement Unit (PMU) device
2.3.2: Energy management systems
Energy Management Systems (EMS) were designed originally at a time when the electrical
power industry was vertically integrated and had centralised communications and computing
systems. With deregulation of the power industry and the development of the Smart Grid,
decision-making is becoming decentralised, and coordination between different actors in various
markets becomes important.
System status and measurement information for typical EMS systems are collected by the
Remote Terminal Units (RTUs) and sent to the Control Centre through the communication
infrastructure. The front-end server in the EMS is responsible for communicating with the RTUs
and IEDs. Different EMS Applications reside in different servers and are linked together by the
Local Area Network (LAN).
2.3.3: Wide area applications Wide-Area Measurement Systems (WAMS) are being installed on many transmission systems
to supplement traditional SCADA. They measure the magnitudes and phase angle of busbar

18
voltages as well as current flows through transmission circuits. This information, measured over
a wide area, is transmitted to the Control Centre and is used for:
1. Power system state estimation: Since the phasor data is synchronised, the magnitudes and
phase angles of voltages at all busbars in the grid can be estimated using a state
estimation algorithm. These estimates can then be used to predict possible voltage and
angle instabilities as well as to estimate system damping and vulnerability to small signal
oscillation.
2. Power system monitoring and warning: The phasor data allows the operating conditions
the power system to be monitored on a real-time basis, system stability to be assessed and
warnings generated.
3. Power system event analysis: Synchronised phasor data of high accuracy is available
before and after a fault or other network incident. This enables the system operators to
study causes and effects of faults and take countermeasures against subsequent events.
In future, it is anticipated that these Applications will be integrated into a Wide Area Monitoring,
Protection and Control (WAMPAC) system [14].

19
CHAPTER THREE: METHODOLOGY
3.1: Kenya’s Electricity Transmission System
The existing transmission network in Kenya comprises 1,331 km of 220 kV and 2,343 km of 132
kV lines, and is interconnected with Uganda through a 132 kV double circuit line. This
information is illustrated in Figure 3.1 which shows Kenya’s transmission system.
The grid has nine generation substations with a transformation capacity of 1846 MVA and forty-
five transmission substations with a capacity of 2,954 MVA.
The existing transmission system capacity is severely constrained particularly during peak hours.
The problem is partly due to inadequate reactive power in major load centers and also
transmission constraints particularly in the Western and Nairobi regions.
The Kenyan grid can be divided into five regions: Coast, Nairobi, Mt. Kenya, Western and
Eastern Regions. In this project I will simulate SCADA system on Kenya’s transmission system.
The design of the system will incorporate 13 buses to represent five generators, six loads, and a
slack bus. All the power from the hydro plants will be channeled to the generator at Kiambere for
purposes of this simulation. Additional power from renewable energy sources and Independent
Power Producers that are increasingly coming into play and that necessitate the move to a Smart
Grid will be represented as an AC power source in one of the buses.
The choice of the buses is to be a representation of the grid across the five regions mentioned
beforehand. These include:
Rabai (Coast Region)
Kiambere (Eastern Region)
Olkaria (Western Region)
Dandora (Nairobi Region)
Lessos (Western Kenya Region)
Turkwel (Western Region)
Kamburu (Eastern Region) This is also our slack bus

20
3.1.1: Power Plants in the Kenyan Grid The simulated transmission system in Figure 3.3 below has five generating stations. These
include the following.
3.1.1.1: Kiambere Commissioned in 1968, Kiambere was the first major power station in independent Kenya.
It was originally designed with a provision of three turbine generator units. However, two
vertical Kaplan turbines were installed.
The stations output has been increased from 40 MW to 72 MW by an upgrade that was recently
completed.
Power from Kiambere is transmitted directly to Nairobi via a 132KV substation. The station is
situated 170 km north east of Nairobi.
3.1.2.2: Kipevu Kipevu power plant is located at Kipevu in Mombasa.
Kipevu III is the largest diesel plant in East Africa and comprises of 7 diesel engines with a total
output of 73.5MW and is connected to the national grid via a new 132KV switchyard extension.
The engines are fired on heavy fuel oil(HFO). The new power plant employs the latest
technology in plant monitoring and supervision, safety, sound, attenuation and exhaust air
emission dispersion control and efficient treatment to ensure environmental protection.
3.1.2.3: Turkwel Power Station Turkwel Power Station is one of the major hydro-electric power stations in Kenya. It is situated
in north-western Kenya, on the border of Turkana and West Pokot counties, approximately 550
km from Nairobi.
Turkwel Power Station has the capacity of 106MW.The power produced is connected to the
national grid at Lessos sub-station on a 220KV transmission line over a distance of 230
kilometers.
It generates approximately 10% of the national electricity supply.

21
3.1.2.4: Olkaria Power Station Olkaria has several power station including Olkaria I, II and III. Olkaria IV is under construction,
scheduled to come online by the end of 2014.
Olkaria II Power Station is Africa’s largest Geothermal Power Station. It generates 70MW.
The second phase of Olkaria II was commissioned in 2010 injecting an extra 35 MW of power
making a total of 150MW of power produced through geothermal means.
The Power Station is located in the North Eastern sector of the greater Olkaria geothermal field.
Designed and constructed with an advantage of newer technology, this state-of-the-art plant is
highly efficient in steam utilization. It works on single flash plant cycle with a steam
consumption of 7.5 t/h/MW. The turbines are single flow six stage condensing with direct
contact spray jet condenser. The power generated is transmitted to the national grid via 220 kV
double circuit line.
3.1.2.4: Kamburu Power Station Kamburu power station was the 2nd major power station in independent Kenya after Kindaruma
power station. It was commissioned in 1974 and three installed vertical Francis turbines. The
spillway has three radial gates and one flap gate.
The station comprises three units each with a capacity of 31 MW. Its reservoir capacity (F.S.L) is
123 million cubic meters.The actual site of the Kamburu plant was selected at about 160km from
Nairobi via Nairobi – Thika – Kangonde –Embu highway and about 50km from Embu town.

22
Figure 3.1: Kenya’s Transmission System

23
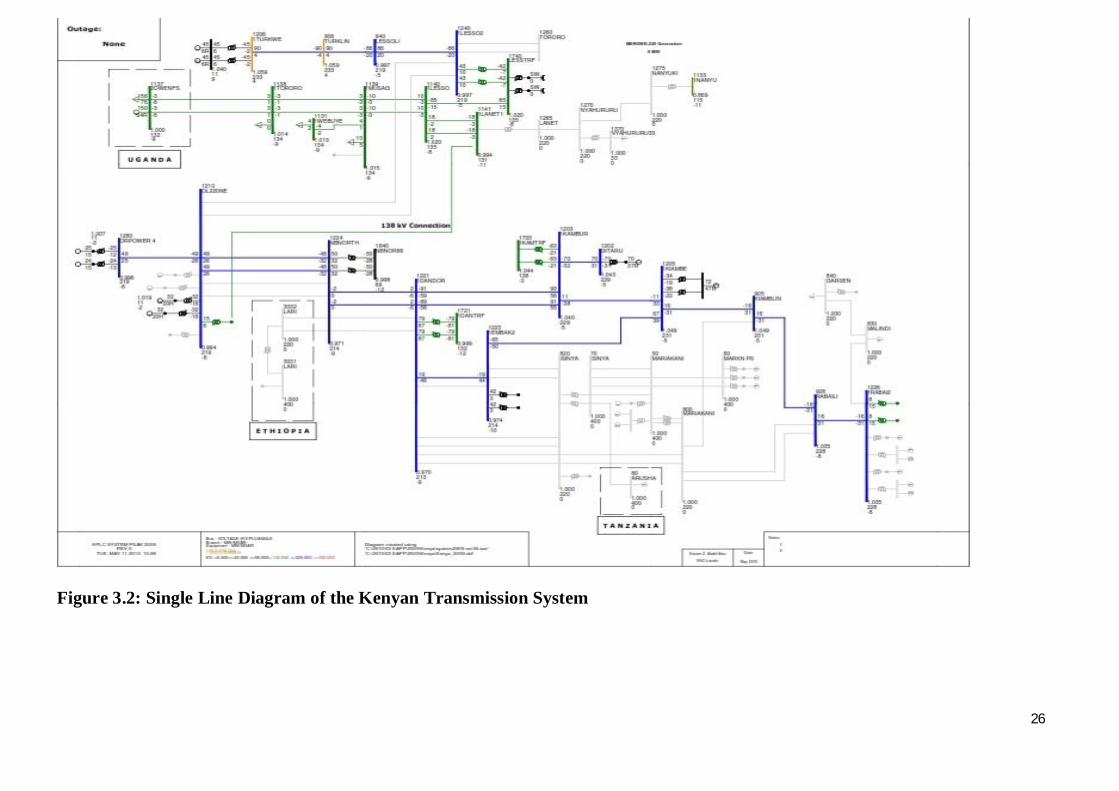
3.2: Simulation of the Kenyan Transmission Grid Figure 3.2 shows a single line diagram of Kenya’s transmission grid. The simulation of the grid
will be based on this line diagram.
The simulation of any SCADA for the transmission system can be approached in two different
ways.
The first approach is to build the software from zero up by using high level languages such as
java, visual basic, C or C#. This approach is time consuming and very taxing with the likelihood
of making many errors in the simulation very high.
The second option is to simulate with package software such as PowerWorld, WinCC Flexible,
Wincc 6, both from SIEMENS, Industsoft from InduSoftand Ifix from iFix Automation.
These software provide diverse formulas including multiple industrial formulas and enable one
to design advanced integrated SCADA systems especially with their ease of integration with
multiple control devices. However, the software are expensive.
Table 3.1 below makes a comparison between the first and second options.
Items FirstSolution Second Solution
(Commercial) (High levellanguages)
Designtime Less More
Cost Applications Programmer
Flexibility Low High
Devicedrivers Available needto installOPCtoconnectwith otherdevices
Efficiency High Low
Table 3.1: Comparison between the first option and second option of SCADA
Implementation

24
Looking at the pros and cons of both options of simulation, coupled with the short duration of
time I have to simulate my project, I decided to go with the second option.
3.2.1: PowerWorld Simulator
PowerWorld Simulator is a power system simulation package developed by PowerWorld
Corporation. The package is designed from the ground up to be user-friendly and highly
interactive. PowerWorld has the power for serious engineering analysis, but it is also highly
interactive and graphical.
PowerWorldconsists of a number of integrated products. At its core is a comprehensive, robust
Power Flow Solution engine capable of efficiently solving systems of up to 100,000 buses. This
makes Simulator quite useful as a standalone power flow analysis package.
PowerWorld allows the user to visualize the system through the use of full-color animated one
line diagrams complete with zooming and panning capability.
Transmission lines can be switched in (or out) of service, new transmission or generation can be
added, and new transactions can be established, all with a few mouse clicks.
Additionally, the choice of PowerWorld is also influenced by the fact that PowerWorld
Corporation also distribute free licenses for students through their website. The license caters for
a maximum of 13 bus system, which my system satisfies.
The Kenyan transmission grid is designed and simulated on the PowerWorld platform. As is with
a focus of highlighting the limitations of the SCADA in use. Thereafter improvements on the
observed limitations are introduced thereby making the SCADA system ‘smarter’.
The main services and requirements that are needed for a SCADA system to be simulated
include:
1. Reading magnitude voltage from generation
2. Reading real and reactive power generation
3. Investigating load flow studies
4. Providing graphical representation and Human Machine Interface (HMI) of the Kenyan
Transmission system

25
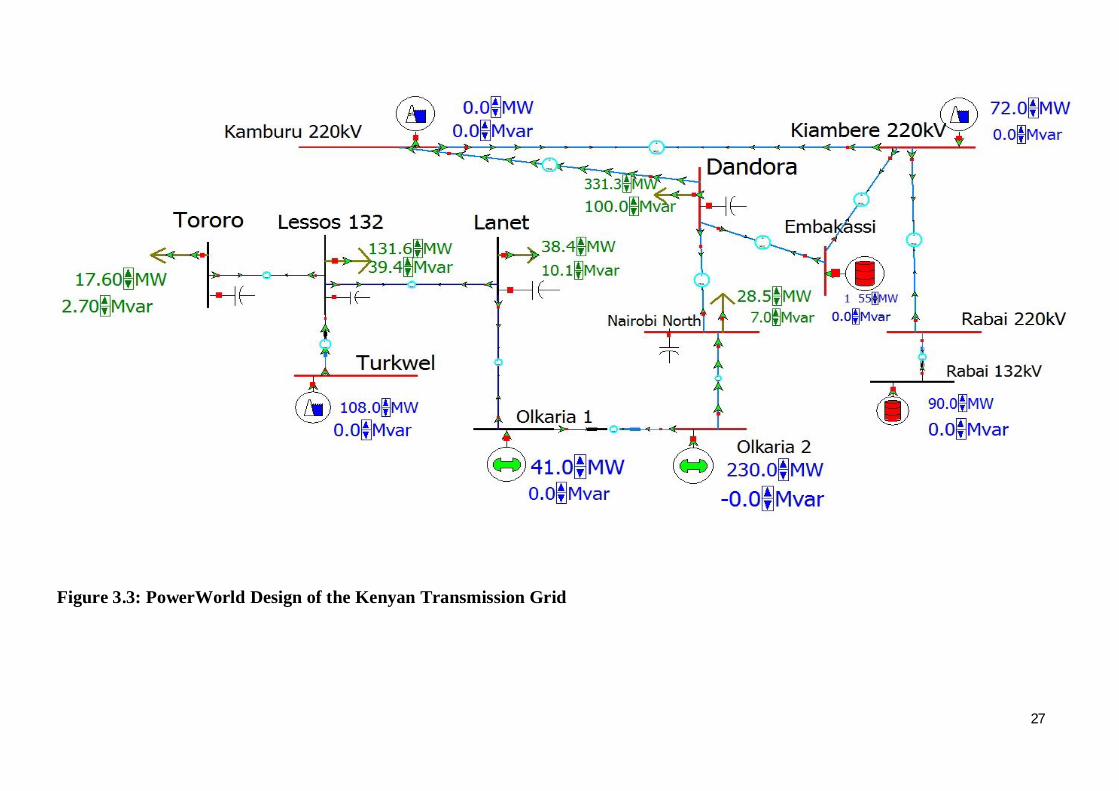
Figure 3.3 show the PowerWorld design of the Kenyan transmission grid.
26
Figure 3.2: Single Line Diagram of the Kenyan Transmission System
27
Figure 3.3: PowerWorld Design of the Kenyan Transmission Grid
28
The chosen buses as illustrated in Figure 3.3 above have the following parameters.
Generator Buses:
i. Kiambere: Active power 280 MW. Voltage 220 kV.
ii. Rabai: Active power 90 MW; Voltage 220 kV.
iii. Embakassi: Active power 54 MW. Voltage 220 kV.
iv. Olkaria: Active power 280 MW. Voltage 220 kV.
v. Turkwel: Active power 106 MW. Voltage 220 kV.
Load Buses
i. Dandora: Active power 331.3 MW. Reactive power 100 MVars.
ii. Nairobi North: Active power 28.5 MW. Reactive power 7.0 MVars.
iii. Lanet: Active power 38.4 MW. Reactive power 10.1 MVars.
iv. Lessos: Active power 131.6 MW. Reactive power 39.4 MVars.
v. Tororo: Active power 17.6 MW. Reactive power 2.7 MVars.
Slack Bus: Kamburu. Voltage of the bus is 220 kV and the Voltage angle is 0 degrees. Bus 1.
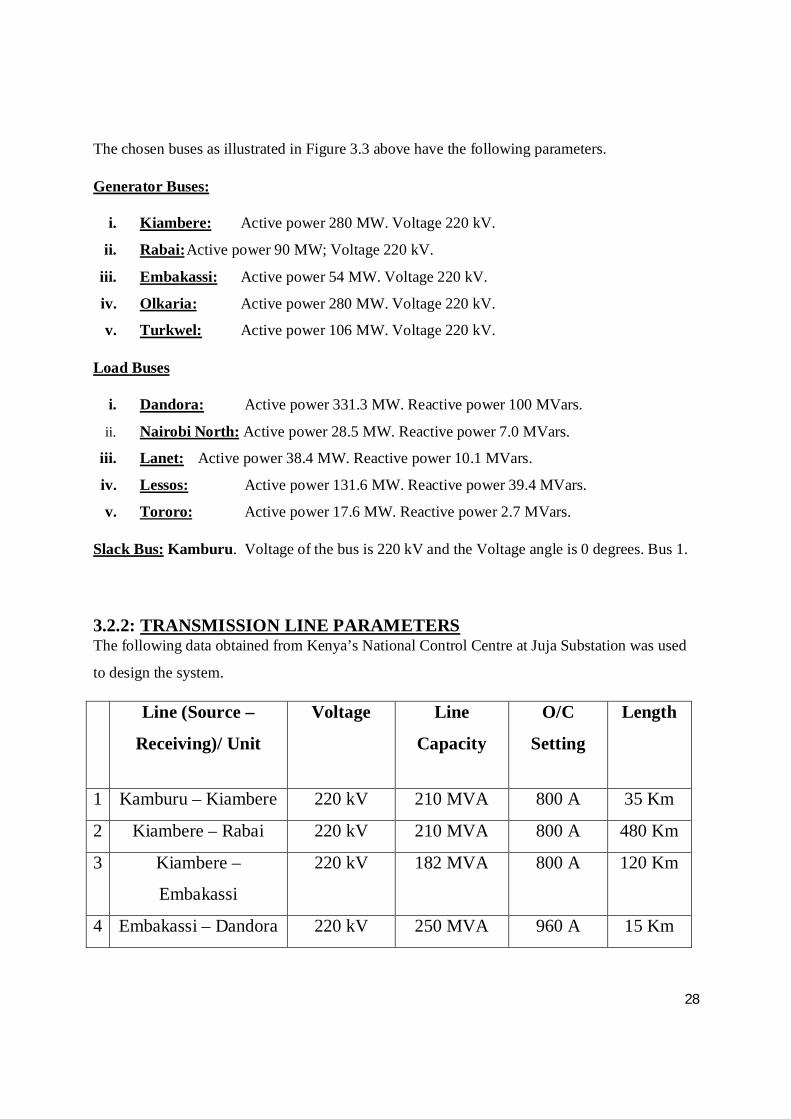
3.2.2: TRANSMISSION LINE PARAMETERS The following data obtained from Kenya’s National Control Centre at Juja Substation was used
to design the system.
Line (Source –
Receiving)/ Unit
Voltage Line
Capacity
O/C
Setting
Length
1 Kamburu – Kiambere 220 kV 210 MVA 800 A 35 Km
2 Kiambere – Rabai 220 kV 210 MVA 800 A 480 Km
3 Kiambere –
Embakassi
220 kV 182 MVA 800 A 120 Km
4 Embakassi – Dandora 220 kV 250 MVA 960 A 15 Km

29
5 Olkaria 2 – Nairobi
North
220 kV 282 MVA 1200 A 70 Km
6 Olkaria - Lanet 132 kV 150 MVA 600 A 95 Km
7 Lanet – Lessos 132 kV 135 MVA 600 A 126 Km
8 Lessos -Tororo 132 kV 81 MVA 375 A 157 Km
9 Lessos - Turkwel 220 kV 210 MVA 320 A 218 Km
Table 3.2: Transmission Line Capacity, Length and O/C Setting The transmission lines are of the Aluminum Steel Core Reinforced (ASCR) type. ACSR
conductor consists of a solid or stranded steel core surrounded by strands of aluminum. ACSR
conductor is available in a range of steel strengths varying from 6% up to 40%. The higher
strength ACSR conductors are used for river crossings, overhead earth wires, and installations
involving extra-long spans.
The principal advantage of these conductors are their high tensile strength and light weight,
covering longer spans with less supports. Due to the greater diameter of an ACSR conductor
much higher corona limit can be obtained, giving a big advantage on high and extra high voltage
overhead lines.
Useful Data Sheet Information used in the circuit design from Eland Cables are as follows:
132 kV ACSR at 870 A and 20° C
Resistance: 69.3mΩ/Km Inductance: 1.213 mH/Km Capacitance: 0.00947 µF/Km
220 kV ACSR at 905 A and 20° C
Resistance: 69.3mΩ/Km Inductance: 1.282 mH/Km Capacitance: 0.00894 µF/Km
From the above parameters and the transmission line lengths indicated in Table 3.2 above, the
SCADA system for Kenya’s high voltage transmission system was designed using PowerWorld
software.

30
CHAPTER FOUR: RESULTS AND ANALYSIS
The load flow solution of the simulated system is solved using the Full Newton Solution.
The Y-bus of the system is calculated. The load flow solution results are shown in Appendix
A.Once the load flow solution is computed, the additional results are as indicated in the tables
that follow.
During normal operation of the system, the line flows are as shown below. The bus labelled
Kamburu, which is our system slack bus generates active power of 49.4MW and reactive power
of 1286.2 MVar. As such this indicates that the loads on the system require more power than is
supplied by the four generators and this deficit is taken care of by the slack bus. In the event that
there is excess power in the system, the slack bus will in turn draw this power.
The system loads vary throughout the day with maximum loads occurring between 7p.m to 9p.m
when the domestic loads increase significantly. This provision is taken into account by having
adjustable loads as can be seen in Figure 4.1.
The lines connecting the different buses have set thermal ratings. As the power requirements are
adjusted, the flow of active and reactive power from and to the generators through the lines also
changes. These changes are monitored by the pie charts that are indicated on each of the
transmission lines in the system. The charts provide an elaborate warning scheme to guard
against exceeding the line parameters.
When the line is within the set parameters, the chart is blue in colour. An example is the
Kamburu-Kiambere Line (Figure 4.1).
The first warning comes when the line is carrying 80% of its rated capacity. The chart is orange
in colour. This can be seen in the line between Kiambere and Rabai buses.
The second warning is when the line is carrying its maximum capacity, at 100%. This time the
chart is red in colour. This is in the Lessos-Lanet 132kV line. Additionally, the arrows indicating
line flows also turn red.
This flagging system alerts the operator and he/she can then take the necessary action. In the case
of the Lanet-Lessos line for example he can bring the switched shunts online to provide the

31
required reactive power at the Lanet load center. This eases the burden on the line by avoiding
carrying of MVars from Turkwel or Olkaria to service the load.
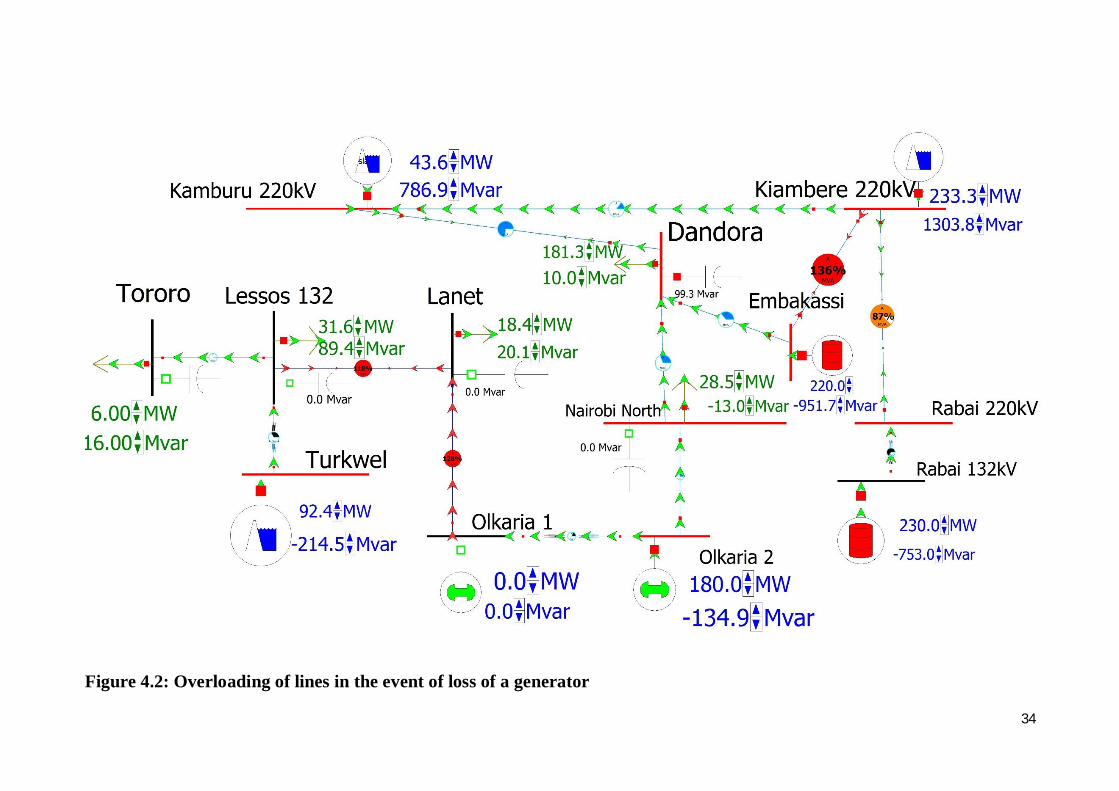
4.1: Effect of Loss of a Generator Suppose there is loss of a major generation plant such as Olkaria 1. This is simulated by opening
the circuit breaker of the generator. As can be seen in Figure 4.2, the result is that the load
centers in Nakuru and Eldoret- represented by loads on Lanet and Lessos bus- have to be
provided with power from the hydro stations. As power is drawn from Kiambere, the thermal
limits of the Kiambare-Embakassi line are exceeded. This leads to the opening of the line’s
circuit breaker. This is followed by the additional power being drawn from Embakassi generating
station, which in turn overloads the Embakassi-Dadora line causing it to trip.If not corrected, this
cascading sequence of events eventually leads to a national blackout. Therefore, corrective action
needs to be taken as soon as the first event occurs. The overloaded lines are represented by the
red pie charts.
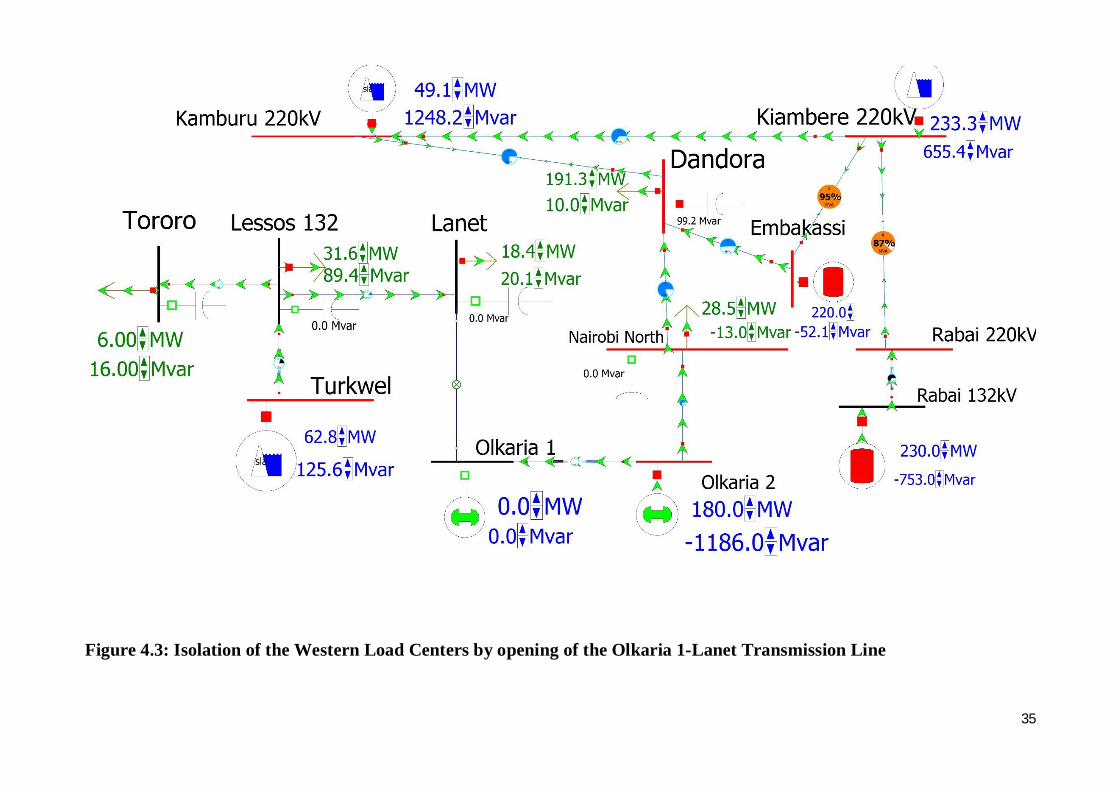
4.1.2: Recovery after loss of Generator The quickest correction strategy for this scenario is the isolation of the Olkaria 1-Lanet line as
shown in Figure 4.3.This results in the disconnection of the link between Western Kenya loads
from the generation stations in Eastern Kenya. As soon as this is carried out, the load system
stabilizes.
The Kiambere-Embakassi line is now loaded to less than 100% of its rated value, indicated by
the orange pie chart.
4.1.3: Improvements to the Grid Figure 4.4 shows the net injection of power into the Kenyan system. Most of the power in the
Kenyan grid is supplied by generation stations in the Eastern part of the country. The generation
plant in Western Kenya such as Turkwel, Sondu and Mumias have smaller combined capacity
compared to the hydro and thermal plants in the Eastern Kenya.
When there is an increase in load on the Lanet bus, power is supplied from Kiambere. This
results in significant voltage drops as the distance is quite large. The drop in voltage is
accompanied by reduction in system frequency as well. The quality of power to the consumers in

32
Western Kenya is thus compromised. Additionally the increased loads lead to tripping of lines
and frequent blackouts in the region.
A solution to this problem which I have implemented in my design is the inclusion of switched
shunts at the load buses. These provide or draw reactive power to or from the loads locally. The
transmission lines are thus not heavily loaded as they only carry active power.
This solution incorporates the new Flexible AC Transmission System (FACTS) devices, and
energy storage units. FACTS devices are high power electronic devices that can perform control
at a very high speed. In this case they are connected in shunt to the grid and provide reactive
power and voltage control, enabling us to realize a smarter grid.

33
Figure 4.1: Simulated SCADA system for Kenya’s High Voltage grid
34
Figure 4.2: Overloading of lines in the event of loss of a generator
35
Figure 4.3: Isolation of the Western Load Centers by opening of the Olkaria 1-Lanet Transmission Line

36
Figure 4.4: System net injection of power in MW

37
CHAPTER FIVE: CONCLUSION
The Kenya Electrical Power Network SCADA system was successfully realized. Several
limitations to the existing system were noted. There is a need to move from the current system
where only supervisory and data acquisition functions are performed, to one where there is
automatic control. The Kenyan grid as is without the automatic control was simulated and the
limitations noted.
The varying loads were supplied by the required power from the coordinated generation of the
five generators.
Another improvement to the SCADA system was the inclusion of switched shunts at the load
buses. These provided compensation of the transmission lines and resulted in the stable operation
of the system by significantly reducing overloading of the lines. The switched shunts also
improved the voltage profiles and frequency of power supplied hence improving quality of
power for the consumers. These devices are part of the Flexible AC Transmission System
(FACTS). Their inclusion results in a smarter grid. They provide the system operator with a
measure of freedom in operating the system.
The inclusion of a smarter SCADA system was realized. It is noted that the move to a smart
transmission grid does not necessitate the restructuring of the whole grid. The only change is
addition of actuators that provide faster and flexible control of the transmission system.
Smart Grid will improve control and increase the benefits from using existing SCADA systems.
38
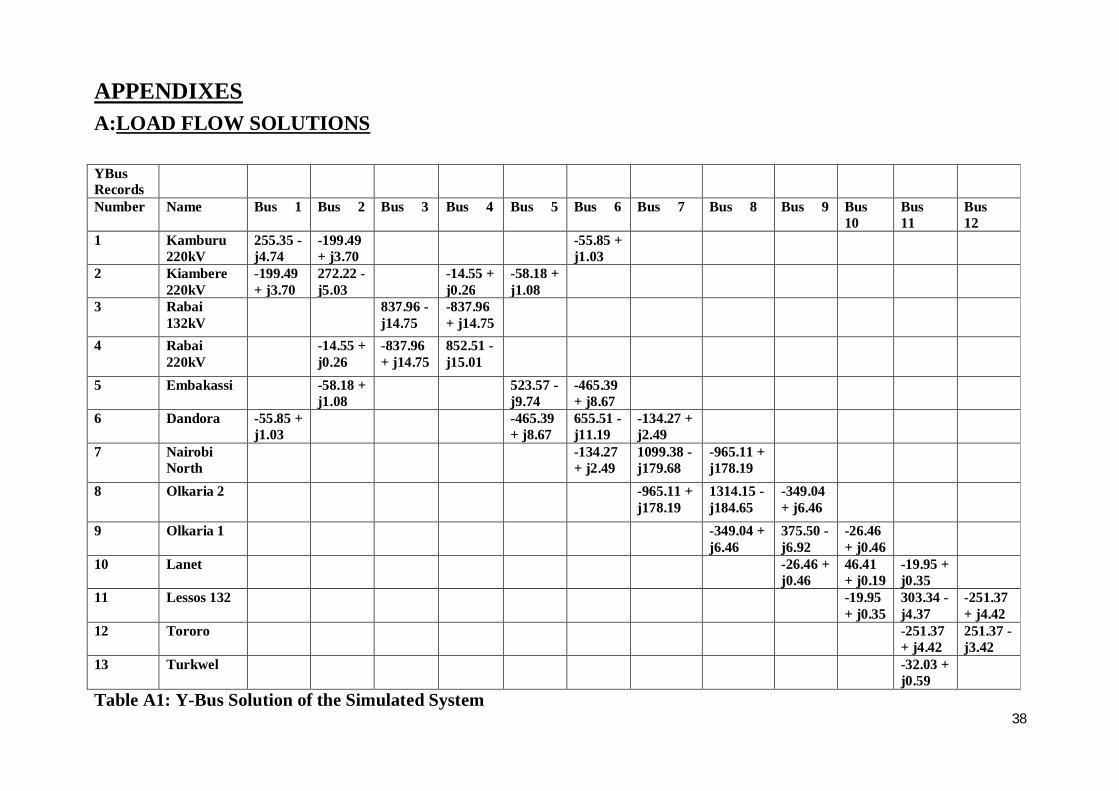
APPENDIXES A:LOAD FLOW SOLUTIONS
YBus Records
Number Name Bus 1 Bus 2 Bus 3 Bus 4 Bus 5 Bus 6 Bus 7 Bus 8 Bus 9 Bus 10
Bus 11
Bus 12
1 Kamburu 220kV
255.35 - j4.74
-199.49 + j3.70
-55.85 + j1.03
2 Kiambere 220kV
-199.49 + j3.70
272.22 - j5.03
-14.55 + j0.26
-58.18 + j1.08
3 Rabai 132kV
837.96 - j14.75
-837.96 + j14.75
4 Rabai 220kV
-14.55 + j0.26
-837.96 + j14.75
852.51 - j15.01
5 Embakassi -58.18 + j1.08
523.57 - j9.74
-465.39 + j8.67
6 Dandora -55.85 + j1.03
-465.39 + j8.67
655.51 - j11.19
-134.27 + j2.49
7 Nairobi North
-134.27 + j2.49
1099.38 - j179.68
-965.11 + j178.19
8 Olkaria 2 -965.11 + j178.19
1314.15 - j184.65
-349.04 + j6.46
9 Olkaria 1 -349.04 + j6.46
375.50 - j6.92
-26.46 + j0.46
10 Lanet -26.46 + j0.46
46.41 + j0.19
-19.95 + j0.35
11 Lessos 132 -19.95 + j0.35
303.34 - j4.37
-251.37 + j4.42
12 Tororo -251.37 + j4.42
251.37 - j3.42
13 Turkwel -32.03 + j0.59
Table A1: Y-Bus Solution of the Simulated System
39
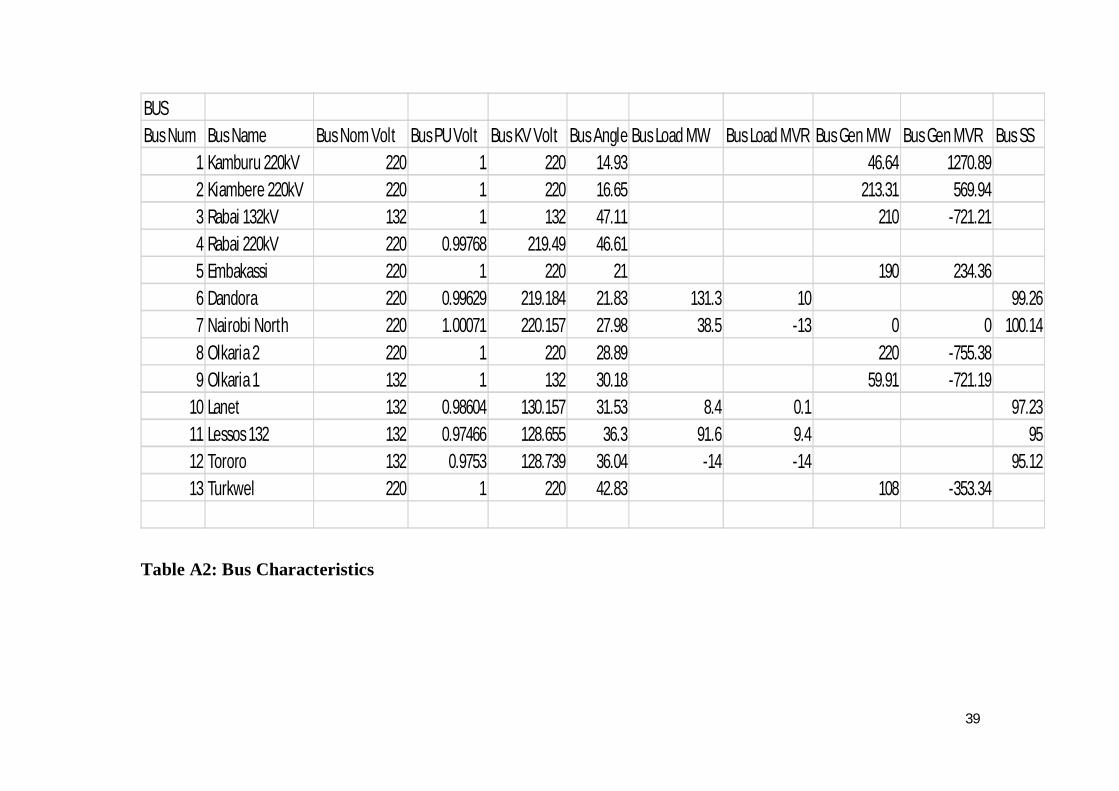
BUSBus Num Bus Name Bus Nom Volt Bus PU Volt Bus KV Volt Bus Angle Bus Load MW Bus Load MVR Bus Gen MW Bus Gen MVR Bus SS
1 Kamburu 220kV 220 1 220 14.93 46.64 1270.892 Kiambere 220kV 220 1 220 16.65 213.31 569.943 Rabai 132kV 132 1 132 47.11 210 -721.214 Rabai 220kV 220 0.99768 219.49 46.615 Embakassi 220 1 220 21 190 234.366 Dandora 220 0.99629 219.184 21.83 131.3 10 99.267 Nairobi North 220 1.00071 220.157 27.98 38.5 -13 0 0 100.148 Olkaria 2 220 1 220 28.89 220 -755.389 Olkaria 1 132 1 132 30.18 59.91 -721.19
10 Lanet 132 0.98604 130.157 31.53 8.4 0.1 97.2311 Lessos 132 132 0.97466 128.655 36.3 91.6 9.4 9512 Tororo 132 0.9753 128.739 36.04 -14 -14 95.1213 Turkwel 220 1 220 42.83 108 -353.34
Table A2: Bus Characteristics
40
Bus NumBus Name Bus Name:1 Branch Device TypeLine MW Line MVR Line MVA Line Lim MVA Line Max PercentLine Loss MW Line Loss MVR2 Kiambere 220kV Rabai 220kV Line 184.5 728.1 751.2 900 83.5 387.79 6.823 Rabai 132kV Rabai 220kV Transformer 210 -721.2 751.2 1200 62.6 6.73 0.125 Embakassi Kiambere 220kV Line 25 -441.3 442 500 88.4 33.57 0.626 Dandora Nairobi North Line -8.8 1433.6 1433.7 1500 96 154.17 2.866 Dandora Embakassi Line -154.7 -675.5 692.9 900 77.3 10.39 0.196 Dandora Kamburu 220kV Line 32.1 -668.9 669.7 900 74.7 80.87 1.58 Olkaria 2 Nairobi North Line 225.7 -1539.5 1555.9 1700 91.6 24.26 4.488 Olkaria 2 Olkaria 1 Transformer -5.7 784.1 784.1 1700 46.1 17.61 0.33
10 Lanet Lessos 132 Line 26.2 159.7 161.8 274.4 59 13.49 0.2410 Lanet Olkaria 1 Line -34.6 -62.5 71.5 274.4 26.4 1.99 0.0311 Lessos 132 Tororo Line -13.5 -109.1 109.9 900 12.2 0.51 0.0113 Turkwel Lessos 132 Transformer 108 -353.3 369.5 700 52.8 42.61 0.79
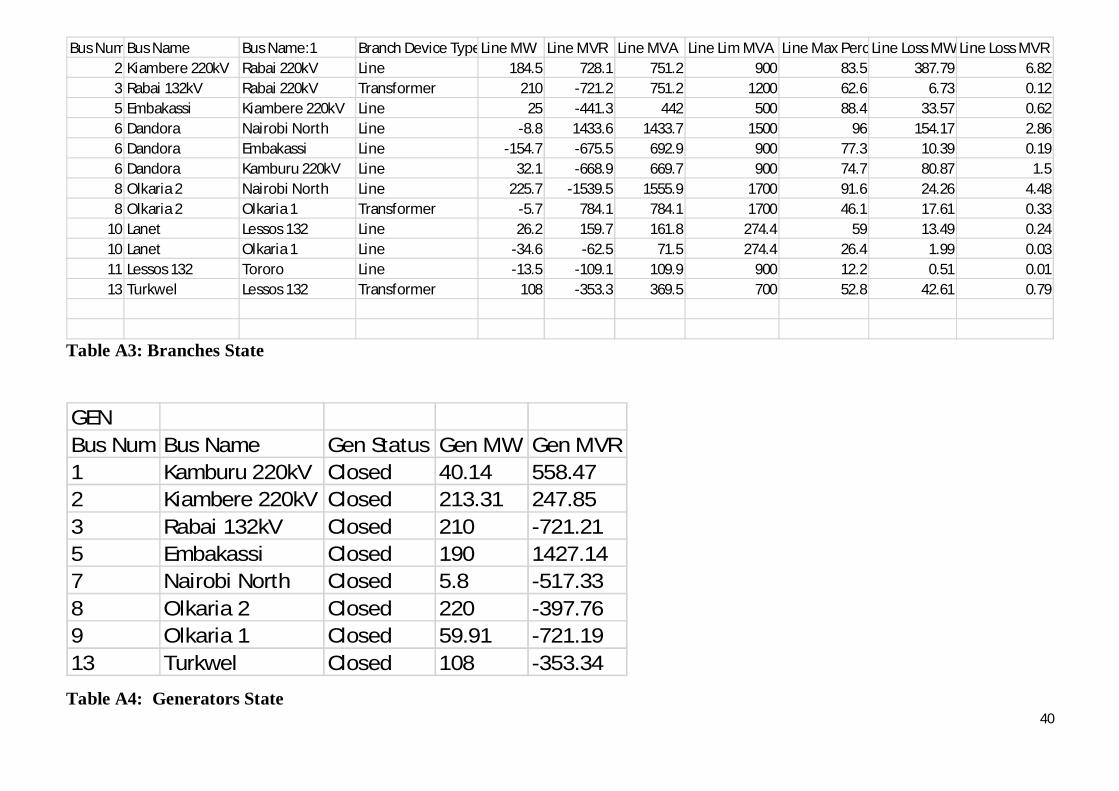
Table A3: Branches State
GENBus Num Bus Name Gen Status Gen MW Gen MVR1 Kamburu 220kV Closed 40.14 558.472 Kiambere 220kV Closed 213.31 247.853 Rabai 132kV Closed 210 -721.215 Embakassi Closed 190 1427.147 Nairobi North Closed 5.8 -517.338 Olkaria 2 Closed 220 -397.769 Olkaria 1 Closed 59.91 -721.1913 Turkwel Closed 108 -353.34
Table A4: Generators State
41
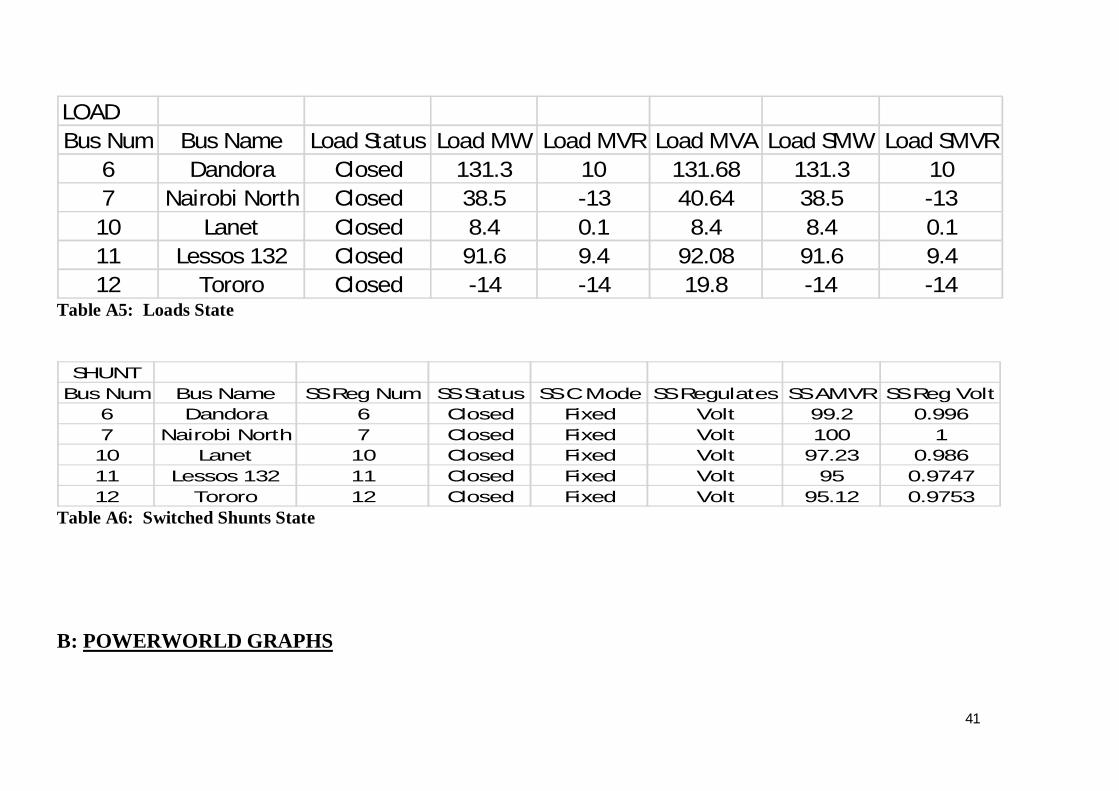
LOADBus Num Bus Name Load Status Load MW Load MVR Load MVA Load SMW Load SMVR
6 Dandora Closed 131.3 10 131.68 131.3 107 Nairobi North Closed 38.5 -13 40.64 38.5 -13
10 Lanet Closed 8.4 0.1 8.4 8.4 0.111 Lessos 132 Closed 91.6 9.4 92.08 91.6 9.412 Tororo Closed -14 -14 19.8 -14 -14
Table A5: Loads State
SHUNTBus Num Bus Name SS Reg Num SS Status SS C Mode SS Regulates SS AMVR SS Reg Volt
6 Dandora 6 Closed Fixed Volt 99.2 0.9967 Nairobi North 7 Closed Fixed Volt 100 1
10 Lanet 10 Closed Fixed Volt 97.23 0.98611 Lessos 132 11 Closed Fixed Volt 95 0.974712 Tororo 12 Closed Fixed Volt 95.12 0.9753
Table A6: Switched Shunts State
B: POWERWORLD GRAPHS

42
Figure B1: Generator MW Density
43
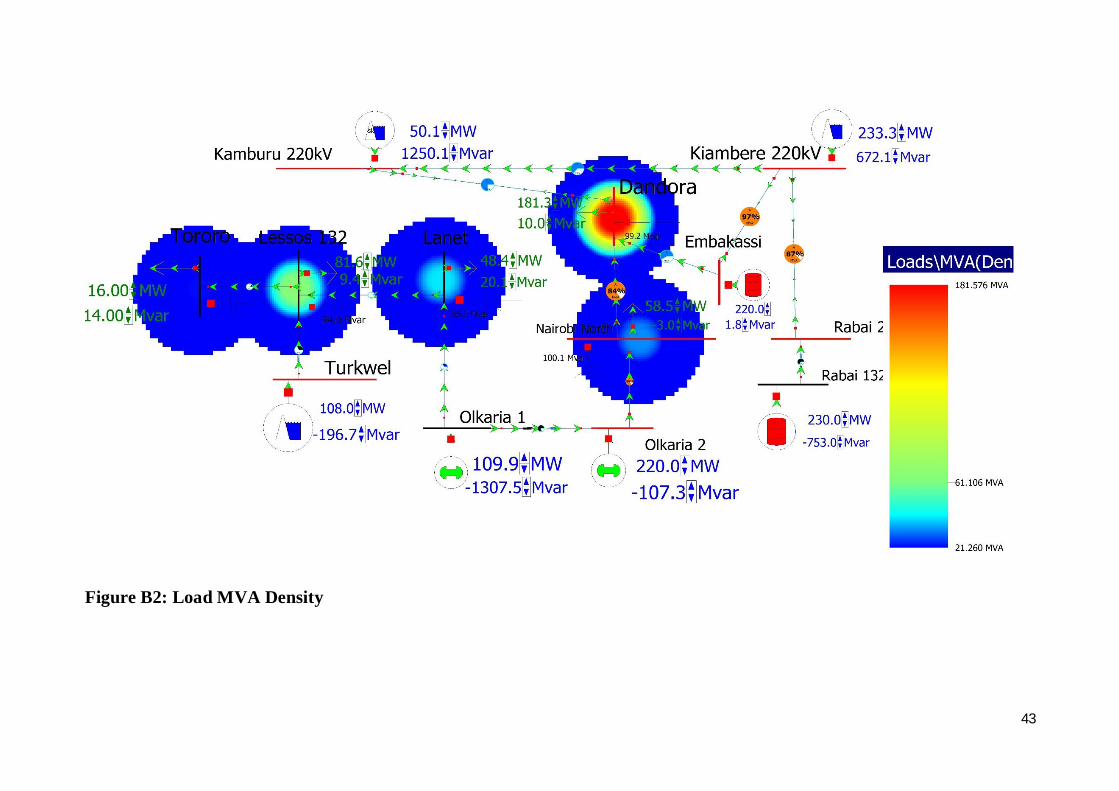
Figure B2: Load MVA Density

44
Figure B3: Transmission Line Lengths
45
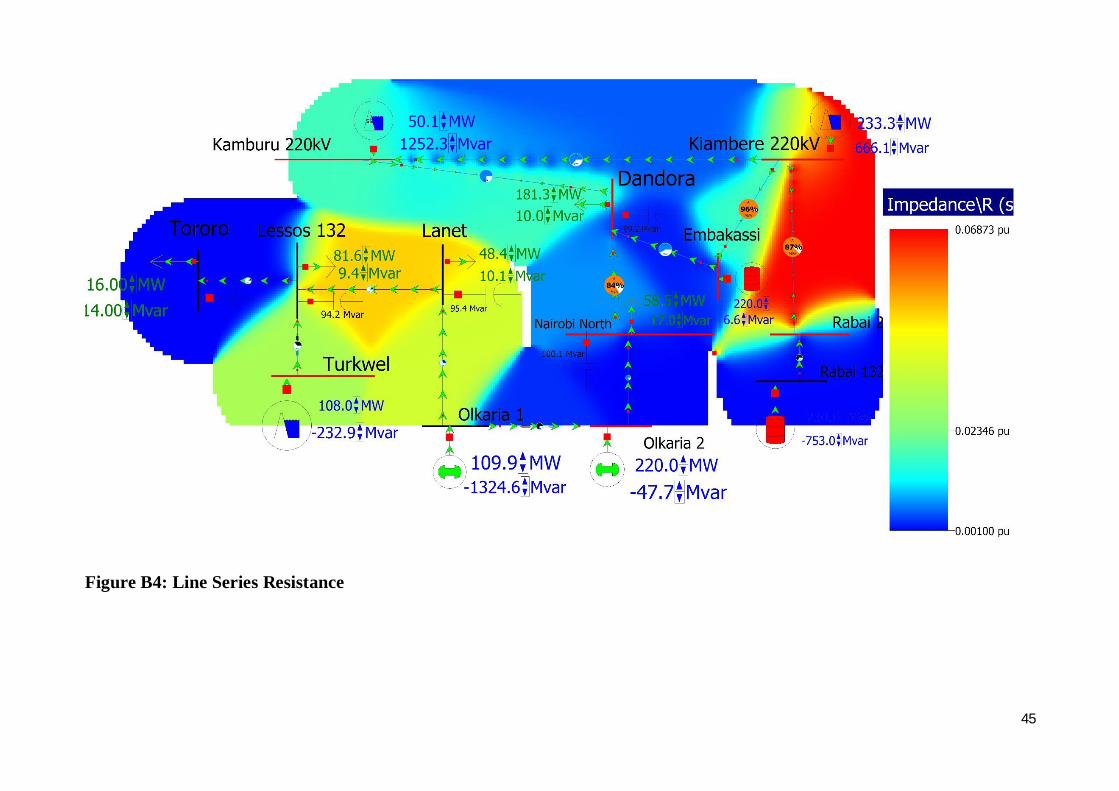
Figure B4: Line Series Resistance
46
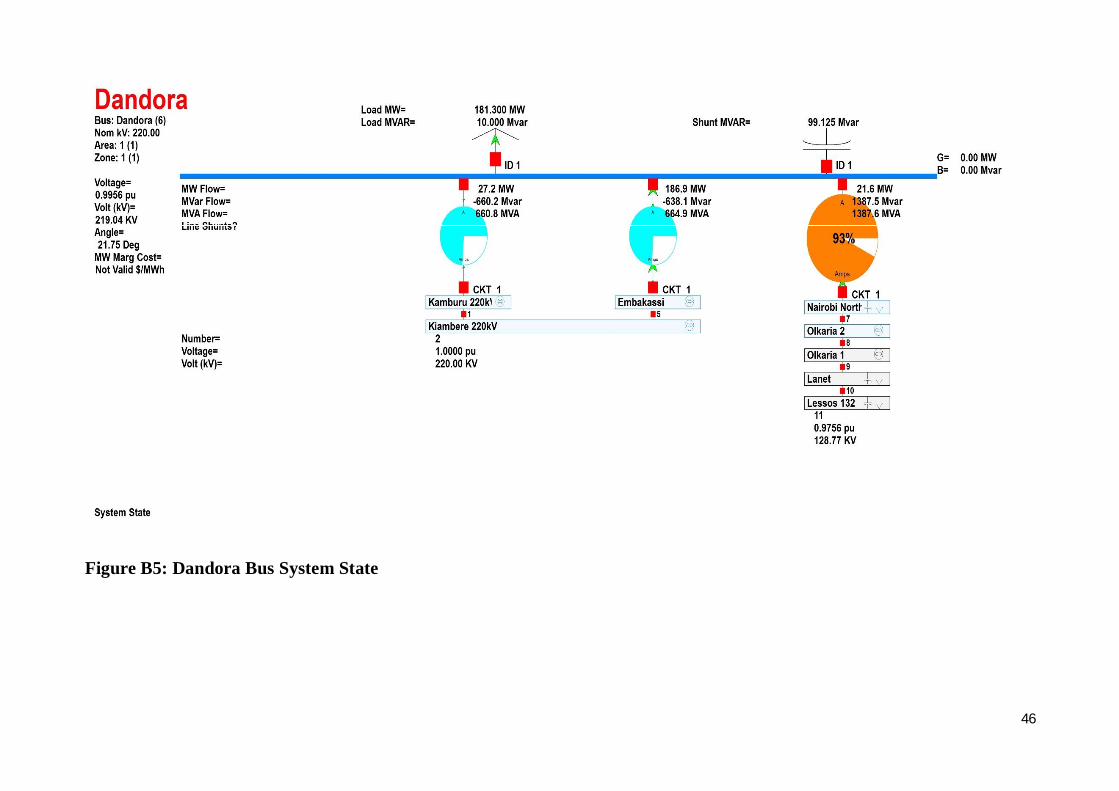
Figure B5: Dandora Bus System State
47
REFERENCES [1] Bailey, David and Wright, Edwin, Practical SCADA for Industry, first edition, Elsevier,
2003.
[2] Prof. Dr.-Ing. Dieter Metz, University of Applied Sciences - Hochschule Darmstadt, Power System Control Technology & Operational Training, 2007
[3] Christine Hertzog, Liz Ude, and Douglas Stuart, Smart Grid Dictionary, second edition, 16 June, 2010.
[4] Securing an Integrated SCADA System; Network Security & SCADA Systems Whitepaper, Published April 2007
[5] PerttiJärventausta, Sami Repo, AnttiRautiainen, JarmoPartanen: “Smart grid power system control in distributed generation environment”, Annual Reviews in Control, Volume 34, Issue 2, December 2010, pp. 277-286.
[6] Santacana et al, Getting Smart, IEEE Power & Energy Magazine, March/April 2010.
[7] Horowitz, S.H., Phadke, A.G. and Renz, B.A., The Future of PowerTransmission, IEEE Power & Energy magazine, March/April 2010, pp. 34-40.
[8] Giri, J., Sun, D. and Avila-Rosales, Wanted: A More Intelligent Grid, IEEE Power & Energy magazine, March/April magazine, January/February 2009.
[9] Stouffer, K., Falco, J. and Kent, K. (2006), Guide to Supervisory Control and Data Acquisition (SCADA) and Industrial Control Systems Security, National Institute of Standards and Technology (NIST), Gaithersburg, MD, USA, September 2006.
[10] Chakrabarti, S. et al, Measurements Get Together, IEEE Power & Energy M, 2009.
[11] Schavemaker, P. and Sluis, L. v. d., Electrical power system essentials. John Wiley & Sons Ltd., Chichester, West Sussex PO19 8SQ, England, Smart Grid Resource Center. Electric Power Research Institute (EPRI), U.S. website:http://smartgrid.epri.com/, 2008.
[12] J. Ekanayake, et. al., Smart Grid - Technology and Applications, 2012.
[13] IEEE C37.118: Standard for Synchrophasors for Power Systems, IEEE, 2005.
[14] Network Protection and Automation Guide: Protective Relays, Measurements and Control, Alstom Grid, Available from http://www.alstom.com/grid/NPAG/ on request, May 2011.