unix disk access patterns
TRANSCRIPT

1993 Winter USENIX – January 25-29, 1993 – San Diego, CA 405
Table 1: The three computer systems traced
a. Each machine uses an HP PA-RISC microprocessor.b. Cello’s file buffer size changed from 10MB to 30MB on April 26, 1992.
Name Processora MIPSHP-UXVersion
Physicalmemory
File buffercache size
Fixedstorage
Users Usage type
cello HP 9000/877 76 8.02 96 MB 10/30b MB 10.4 GB 20 Timesharing
snake HP 9000/720 58 8.05 32 MB 5 MB 3.0 GB 200 Server
hplajw HP 9000/845 23 8.00 32 MB 3 MB 0.3 GB 1 Workstation
Introduction
The I/O gap between processor speed anddynamic disk performance has been growing as VLSIperformance (improving at 40–60% per year) outstripsthe rate at which disk access times improve (about 7%per year). Unless something is done, new processortechnologies will not be able to deliver their fullpromise. Fixes to this problem have concentrated onever-larger file buffer caches, and on speeding up diskI/Os through the use of more sophisticated accessstrategies. Surprisingly, however, there has been verylittle published on the detailed low-level behavior ofdisk I/Os in modern systems, which such techniques areattempting to improve. This paper fills part of this void,and also uses the data to provide analyses of sometechniques for improving write performance throughthe use of disk caches.
We captured every disk I/O made by threedifferent HP-UX systems during a four-month period(April 18, 1992 through August 31, 1992). We presenthere analyses of 63-day contiguous subsets of this data.The systems we traced are described in Table 1: two ofthem were at HP Laboratories, one (snake) at UCBerkeley.
The most significant results of our analyses ofthese systems are: the majority of disk accesses (57%)are writes; only 8–12% of write accesses, but 18–33%of reads, are logically sequential at the disk level; 50–75% of all I/Os are synchronous; the majority (67–78%) of writes are to metadata; user-data I/Os representonly 13–41% of the total accesses; 10–18% of all writerequests are overwrites of the last block written out; andswap traffic is mostly reads (70–90%).
UNIX disk access patternsChris Ruemmler and John Wilkes – Hewlett-Packard Laboratories
ABSTRACT
Disk access patterns are becoming ever more important to understand as the gap between processorand disk performance increases. The study presented here is a detailed characterization of every low-level disk access generated by three quite different systems over a two month period. Thecontributions of this paper are the detailed information we provide about the disk accesses on thesesystems (many of our results are significantly different from those reported in the literature, whichprovide summary data only for file-level access on small-memory systems); and the analysis of a setof optimizations that could be applied at the disk level to improve performance.
Our traces show that the majority of all operations are writes; disk accesses are rarely sequential; 25–50% of all accesses are asynchronous; only 13–41% of accesses are to user data (the rest result fromswapping, metadata, and program execution); and I/O activity is very bursty: mean request queuelengths seen by an incoming request range from 1.7 to 8.9 (1.2–1.9 for reads, 2.0–14.8 for writes),while we saw 95th percentile queue lengths as large as 89 entries, and maxima of over 1000.
Using a simulator to analyze the effect of write caching at the disk level, we found that using a smallnon-volatile cache at each disk allowed writes to be serviced considerably faster than with a regulardisk. In particular, short bursts of writes go much faster – and such bursts are common: writes rarelycome singly. Adding even 8KB of non-volatile memory per disk could reduce disk traffic by 10–18%, and 90% of metadata write traffic can be absorbed with as little as 0.2MB per disk of non-volatile RAM. Even 128KB of NVRAM cache in each disk can improve write performance by asmuch as a factor of three.FCFS scheduling for the cached writes gave better performance than amore advanced technique at small cache sizes.
Our results provide quantitative input to people investigating improved file system designs (such aslog-based ones), as well as to I/O subsystem and disk controller designers.
Internal Accession Date Only
UNIX disk access patterns Ruemmler and Wilkes
406 1993 Winter USENIX – January 25-29, 1993 – San Diego, CA
The paper is organized as follows. We begin witha short overview of previous work in the area. Thencomes a description of our tracing method and details ofthe systems we traced; it is followed by a detailedanalysis of the I/O patterns observed on each of thesystems. Then we present the results of bothsimulations of adding non-volatile write buffers in thedisks, and conclude with a summary of our results.
Related work
Most I/O access pattern studies have beenperformed at the file system level of the operatingsystem rather than at the disk level. Since logging everyfile system operation (particularly every read and write)generates huge quantities of data, most such studieshave produced only summary statistics or made someother compromise such as coalescing multiple I/Ostogether (e.g., [Ousterhout85, Floyd86, Floyd89]).Many were taken on non-UNIX systems. For example:IBM mainframes [Procar82, Smith85, Kure88,Staelin88, Staelin90, Staelin91, Bozman91]; Craysupercomputers [Miller91]; Sprite (with no timing dataon individual I/Os) [Baker91]; DEC VMS[Ramakrishnan92];TOPS-10 (static analysis only)[Satyanarayanan81].
TheUNIX buffer cache means that most accessesnever reach the disk, so these studies are not very goodmodels of what happens at the disk. They also ignorethe effects of file-system generated traffic, such as formetadata and read-ahead, and the effects of swappingand paging. There have been a few studies of disktraffic, but most have had flaws of one kind or another.For example: poor measurement technology (60 Hztimer) [Johnson87]; short trace periods (75 minutes at atime, no detailed reporting of data, 2ms timergranularity) [Muller91]; limited use patterns[Carson90]. Raymie Stata had earlier used the sametracing technology as this study to look at the I/Os in atime-sharing UNIX environment [Stata90]. Hediscovered skewed device utilization and small averagedevice queue lengths with large bursts.
We were interested in pursuing this path further,and gathering detailed statistics without the limitationsof others’ work. The next section details how we did so.
Trace gathering
We traced three different Hewlett-Packardcomputer systems (described in Table 1). All wererunning release 8 of the HP-UX operating system[Clegg86], which uses a version of theBSD fast filesystem [McKusick84]. The systems had severaldifferent types of disks attached to them, whoseproperties are summarized in Table 2.
Trace collection methodAll of our data were obtained using a kernel-level
trace facility built into HP-UX. The tracing iscompletely transparent to the users and adds nonoticeable processor load to the system. We logged thetrace data to dedicated disks to avoid perturbing thesystem being measured (the traffic to these disks isexcluded from our study). Channel contention isminimal: the logging only generates about one writeevery 7 seconds.
Each trace record contained the following dataabout a single physical I/O:
• timings, to 1µs resolution, of enqueue time (whenthe disk driver first sees the request); start time(when the request is sent to the disk) andcompletion time (when the request returns fromthe disk);
• disk number, partition and device driver type;• start address (in 1KB fragments);• transfer size (in bytes);• the drive’s request queue length upon arrival at the
disk driver, including the current request;• flags for read/write, asynchronous/synchronous,
block/character mode;• the type of block accessed (inode, directory,
indirect block, data, superblock, cylinder groupbitmap)
The tracing was driven by a daemon spawnedfrom init; killing the daemon once a day caused a new
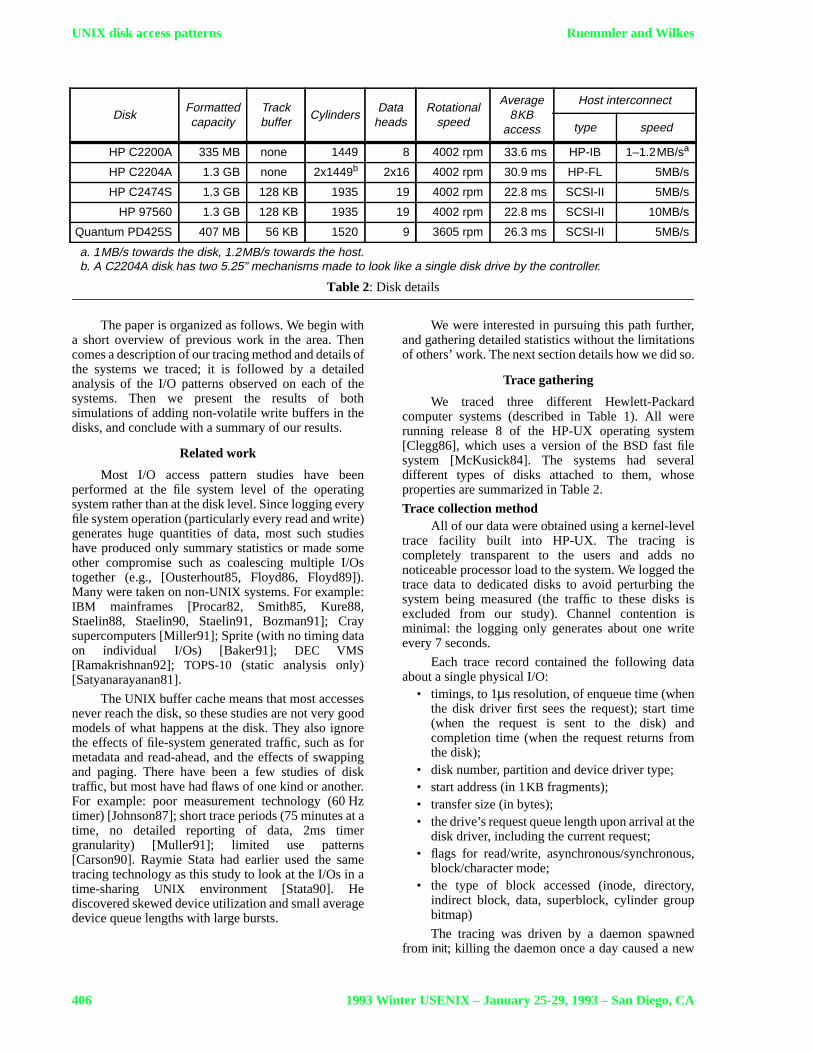
Table 2: Disk details
a. 1MB/s towards the disk, 1.2MB/s towards the host.b. A C2204A disk has two 5.25” mechanisms made to look like a single disk drive by the controller.
DiskFormattedcapacity
Trackbuffer
CylindersData
headsRotational
speed
Average8KB
access
Host interconnect
type speed
HP C2200A 335 MB none 1449 8 4002 rpm 33.6 ms HP-IB 1–1.2MB/sa
HP C2204A 1.3 GB none 2x1449b 2x16 4002 rpm 30.9 ms HP-FL 5MB/s
HP C2474S 1.3 GB 128 KB 1935 19 4002 rpm 22.8 ms SCSI-II 5MB/s
HP 97560 1.3 GB 128 KB 1935 19 4002 rpm 22.8 ms SCSI-II 10MB/s
Quantum PD425S 407 MB 56 KB 1520 9 3605 rpm 26.3 ms SCSI-II 5MB/s

Ruemmler and Wilkes UNIX disk access patterns
1993 Winter USENIX – January 25-29, 1993 – San Diego, CA 407
Table 3: Summary of the traces gathered;cello andhplajw weretraced from 92.4.18 to 92.6.20;snake from 92.4.25 to 92.6.27
a. The remaining portion of this drive is the area where the trace data was collected.b. The percentages do not add up to 100% due to raw disk accesses to the boot partition on disk A.
snake hplajw
ID disk type partition size number of I/Os reads ID disk type partition size number of I/Os reads
A QuantumPD425S
/ (root) 313 MB 5 848 567 46.6% 40%
A HP 2200A
/ (root) 278 MB 346 553 83.0% 36%
(swap) 94 MB 50 694 0.4% 91% (swap) 24 MB 19 625 4.7% 71%
B HP 97560 /usr1 1.3 GB 2 862 620 22.8% 48% (swap) 16 MB 17 940 4.3% 68%
C HP 97560 /usr2 1.3 GB 3 793 004 30.2% 43% Ba HP 2200A (swap) 16 MB 31 113 7.5% 82%
Total 3.0 GB 12 554 885 100.0% 43% Total 334 MB 416 262 99.5%b 42%
cello
ID disk type partition size number of I/Os reads
A HP C2474S
/ (root) 958 MB 3 488 934 11.9% 59%
/usr/local/lib/news 105 MB 3 511 772 12.0% 44%
(swap1) 126 MB 243 932 0.8% 80%
(swap2) 48 MB 59 423 0.2% 70%
B HP 2204A /users 1.3 GB 4 162 026 14.2% 47%
C HP 2204A /usr/local/src 1.3 GB 1 027 978 3.5% 85%
D HP 2204A /usr/spool/news 1.3 GB 14 372 382 49.0% 36%
E HP 2204A
/usr/spool/news/in.batches 105 MB 479 441 1.6% 13%
/nfs/export/refdbms 29 MB 21 531 0.1% 84%
/backup 946 MB 185 845 0.6% 22%
/tmp 126 MB 623 663 2.1% 4%
(swap3) 75 MB 212 324 0.7% 80%
F HP 2204A /nobackup 1.3 GB 668 687 2.3% 71%
G HP 2204A /nobackup-2 1.3 GB 68 431 0.2% 79%
H HP 2204A /mount/oldroot 1.3 GB 224 908 0.8% 88%
Subtotal for swap partitions 249 MB 515 679 1.8% 79%
Subtotal for the news partitions 1.4 GB 18 363 595 62.6% 37%
Subtotal excluding news and swap 8.8 GB 10 472 003 35.6% 54%
Grand total 10.4 GB 29 351 277 100.0% 44%
trace file to be started (the kernel’s buffering schememeant that no events were lost). Each time thishappened, we also collected data on the physicalmemory size, the cache size, system process identifiers,mounted disks, and the swap configuration.
Traced systemsCello is a timesharing system used by a small
group of researchers at Hewlett-Packard Laboratoriesto do simulation, compilation, editing, and mail. Anews feed that was updated continuously throughoutthe day resulted in the majority (63%) of the I/Os in thesystem, and these I/Os have a higher-than-usual amountof writes (63%). The other partitions vary, with the
mean being 46% writes. Because of the large activitydirected to the news partitions, the system as a wholedoes more writes (56%) than reads.
Snake acted as a file server for an HP-UX cluster[Bartlett88] of nine clients at the University ofCalifornia, Berkeley. Each client was an Hewlett-Packard 9000/720 workstation with 24MB of mainmemory, 66MB of local swap space, and a 4MB filebuffer cache. There was no local file system storage onany of the clients; all the machines in the cluster saw asingle common file system with complete single-system semantics. The cluster had accounts forprofessors, staff, graduate students, and computer

UNIX disk access patterns Ruemmler and Wilkes
408 1993 Winter USENIX – January 25-29, 1993 – San Diego, CA
science classes. The main use of the system was forcompilation and editing. This cluster was new inJanuary 1992, so many of the disk accesses were for thecreation of new files. Over the tracing period, the /usr1disk gained 243MB and /usr2gained 120MB of data.
Finally, the personal workstation (hplajw) wasused by the second author of this paper. The main usesof the system were electronic mail and editing papers.There was not much disk activity on this system: the filebuffer cache was doing its job well.
Cello and hplajw were traced from 92.4.18 to92.6.20;snake from 92.4.25 to 92.6.27. We also use acommon week-long subset of the data for someanalyses; this period runs from 92.5.30 to 92.6.6. Allthe numbers and graphs in this paper are derived fromeither the full or the week-long traces: we say explicitlyif the shorter ones are being used. Each trace (full orshort) starts at 0:00 hours on a Saturday.
The file system configurations for the threesystems are given in Table 3. The total numbers of I/Orequests logged over the tracing period discussed in thispaper were: 29.4M (cello), 12.6M (snake) and 0.4M(hplajw).
The swap partitions are used as a backing store forthe virtual memory system. In general, there is littleswap activity (0.4% onsnake, 1.8% oncello): thesesystems are reasonably well equipped with memory, orlocal swap space in the case ofsnake’s diskless clients.The exception ishplajw, on which 16.5% of I/Os are forpaging because of memory pressure from simultaneousexecution of the X windowing system, FrameMaker,GNU Emacs, and a bibliography database program.
Analysis
This section presents our detailed analyses of thetrace data. Although it represents measurements from asingle file system design (the HP-UX/4.3BSD fast filesystem), we believe this data will be of use to other filesystem designers – particularly in providing upperbounds on the amount of disk traffic that might be savedby different approaches to designing file systems.
For example, we know that HP-UX is veryenthusiastic about flushing metadata to disk to make thefile system very robust against power failures.1 Thismeans that the metadata traffic we measured representsclose to an upper bound on how much a metadata-logging file system might be able to suppress.
I/O timingsFigure 1 shows the distribution of both elapsed
and physical I/O times for the three systems. Thephysical time is the time between the disk driverdispatching a request to the disk and the I/O completionevent – i.e., approximately the time that the disk isbusy; theelapsed time includes queueing delays. Thevalues are shown in Figure 1 and Table 4. Largedifferences between these two times indicate that manyI/Os are being queued up in the device driver waitingfor previous I/Os to complete.
Typical causes for the difference in times includehigh system loads, bursty I/O activity, or an unevendistribution of load between the disks. Table 4 showsthat the disparity in I/O times between elapsed andphysical times is much larger for writes than for reads.This suggests that writes are very bursty. One cause is
1 Other people might add “or crashes” here, but we’ve neverexperienced a system crash in 6 years of running HP-UX onover twenty PA-RISC machines.
b. Snake c. Hplajwa. Cello
Figure 1: Distributions of physical and elapsed I/O times; see Table 4 for the mean values
0
0.1
0.2
0.3
0.4
0.5
0.6
0.7
0.8
0.9
1
0 20 40 60 80 100 120 140
Fra
ctio
n of
I/O
s
Time (ms)
physicalelapsed
0
0.1
0.2
0.3
0.4
0.5
0.6
0.7
0.8
0.9
1
0 20 40 60 80 100 120 140
Fra
ctio
n of
I/O
s
Time (ms)
physical readsphysical writeselapsed readselapsed writes
0
0.1
0.2
0.3
0.4
0.5
0.6
0.7
0.8
0.9
1
0 20 40 60 80 100 120 140
Fra
ctio
n of
I/O
s
Time (ms)
physicalelapsed
0
0.1
0.2
0.3
0.4
0.5
0.6
0.7
0.8
0.9
1
0 20 40 60 80 100 120 140
Fra
ctio
n of
I/O
s
Time (ms)
physical readsphysical writeselapsed readselapsed writes
0
0.1
0.2
0.3
0.4
0.5
0.6
0.7
0.8
0.9
1
0 20 40 60 80 100 120 140
Fra
ctio
n of
I/O
s
Time (ms)
physicalelapsed
0
0.1
0.2
0.3
0.4
0.5
0.6
0.7
0.8
0.9
1
0 20 40 60 80 100 120 140
Fra
ctio
n of
I/O
s
Time (ms)
physical readsphysical writeselapsed readselapsed writes

Ruemmler and Wilkes UNIX disk access patterns
1993 Winter USENIX – January 25-29, 1993 – San Diego, CA 409
Table 5: Per-disk queue length distributions
percentilecello snake hplajw
A B D A A
% disk idle 73.0% 61.3% 70.5% 78.1% 63.0%
80% 2 3 2 2 5
90% 4 10 25 4 13
95% 11 43 89 7 20
99% 98 144 177 18 39
100% 606 1520 1070 111 124
the syncer daemon, which pushes delayed (buffered)writes out to disk every 30 seconds.
Snake has by far the fastest physical I/O times:33% of them take less than 5ms. This is due to the useof disks with aggressive read-ahead and immediatewrite-reporting (the drive acknowledges some writes assoon as the data are in its buffer). More on this later.
The I/O loads on the disks on these systems arequite moderate – less than one request per second perdisk. Nonetheless, the queue lengths can become quitelarge, as can be seen from Figures 2 and 3. Over 70% ofthe time, requests arrive at an idle disk. Some disks seequeue lengths of 5 or more 15% of the time requests areadded, and 5% of the time, experience queue lengthsaround 80 (cello) or 20 (hplajw). The maximum queuelengths seen are much larger: over 1000 requests oncello, over 100 onhplajw andsnake. This suggests thatimproved request-scheduling algorithms may bebeneficial [Seltzer90, Jacobson91].
The bursty nature of the arrival rate is also shownby Figure 4, which shows the overall arrival rates ofrequests, and by Figure 6, which shows request inter-arrival times. Many of the I/O operations are issued lessthan 20ms apart; 10–20% less than 1ms apart.
The I/O load on bothsnake and cello issignificantly skewed, as Figure 5 shows: one diskreceives most of the I/O operations on each system.
c. Hplajw: mean = 4.1; stddev = 7.8b. Snake: mean = 1.7, stddev = 3.5a. Cello: mean = 8.9; stddev = 36.0
Figure 2: Queue length distributions for each disk in each system
0
0.2
0.4
0.6
0.8
1
1 10 100
Fra
ctio
n of
I/O
s
Queue length
disk Adisk B
0
0.2
0.4
0.6
0.8
1
1 10 100
Fra
ctio
n of
I/O
s
Queue length
disk Adisk Bdisk Cdisk Ddisk Edisk Fdisk Gdisk H
0
0.2
0.4
0.6
0.8
1
1 10 100
Fra
ctio
n of
I/O
s
Queue length
disk Adisk Bdisk C
I/O typesSome previous studies (e.g., [Ousterhout85])
assumed that almost all accesses to the disk were foruser data and therefore neglected to measure metadataand swap accesses. Our data (presented in Table 6)
0 7 14 21 28 35 42 49 561
10
100
1000
10000
Que
ue L
engt
h
Day
mean
50%
75%
85%
95%
max
Percentiles
0 7 14 21 28 35 42 49 561
10
100
1000
Que
ue L
engt
h
Day
mean
50%
75%
85%
95%
max
Percentiles
b. Hplajw
a. Cello
Figure 3: Mean queue length distributions versus time(daily values over 92.4.18–92.6.20)
Table 4: Mean I/O request response times in ms
system I/O type physical elapsed
cello
reads 23.6 27.4
writes 27.7 272.0
total 25.9 164.0
snake
reads 17.0 22.3
writes 14.9 42.2
total 15.8 33.7
hplajw
reads 27.5 39.2
writes 24.1 142.0
total 25.5 98.5

UNIX disk access patterns Ruemmler and Wilkes
410 1993 Winter USENIX – January 25-29, 1993 – San Diego, CA
Figure 4: I/O rates for all three systems. All traces being on a Saturday; the hourly data spans 92.5.30–92.6.6
10
100
1000
10000
100000
0 20 40 60 80 100 120 140 160 180
Num
ber
of I/
Os
Time (hours)
c. Daily I/O rate on hplajw.Mean = 6607/day, or 0.076/s.
f. Hourly I/O rate on hplajw.Mean = 265/hour.
b. Daily I/O rate on snake.Mean = 199 284/day, or 2.3/s.
e. Hourly I/O rate on snake.Mean = 7158/hour.
a. Daily I/O rate on cello.Mean = 465 964 I/Os/day, or 5.4/s.
d. Hourly I/O rate on cello.Mean = 19 422/hour.
1000
10000
100000
1e+06
0 10 20 30 40 50 60 70
Num
ber
of I/
Os
Time (days)
10
100
1000
10000
100000
0 20 40 60 80 100 120 140 160 180
Num
ber
of I/
Os
Time (hours)
1000
10000
100000
1e+06
0 10 20 30 40 50 60 70
Num
ber
of I/
Os
Time (days)
10
100
1000
10000
100000
0 20 40 60 80 100 120 140 160 180
Num
ber
of I/
Os
Time (hours)
1000
10000
100000
1e+06
0 10 20 30 40 50 60 70
Num
ber
of I/
Os
Time (days)
a. Cello b. Cello (92.5.30 to 92.6.6)
c. Snake d. Snake (92.5.30 to 92.6.6)
0 7 14 21 28 35 42 49 560
0.1
0.2
0.3
0.4
0.5
0.6
0.7
0.8
0.9
1
Fra
ctio
n of
I/O
s
Day
A
B
C
Disk ID
0 24 48 72 96 120 1440
0.1
0.2
0.3
0.4
0.5
0.6
0.7
0.8
0.9
1
Fra
ctio
n of
I/O
s
Hour
A
B
C
Disk ID
0 24 48 72 96 120 1440
0.1
0.2
0.3
0.4
0.5
0.6
0.7
0.8
0.9
1
Fra
ctio
n o
f I/
Os
Hour
A
B
C
D
E
F
Disk ID0 7 14 21 28 35 42 49 56
0
0.1
0.2
0.3
0.4
0.5
0.6
0.7
0.8
0.9
1
Fra
ctio
n o
f I/
Os
Day
A
B
C
D
E
F
Disk ID
Figure 5: I/O load distribution across the disks forcello andsnake. DisksG andH oncello are omitted, because they saw almost no I/Otraffic; hplajw is omitted because almost all I/O was to the root disk.

Ruemmler and Wilkes UNIX disk access patterns
1993 Winter USENIX – January 25-29, 1993 – San Diego, CA 411
Figure 6: System-wide distribution and density plotsof I/O request inter-arrival times. Cello mean: 185ms;
snake mean: 434ms;hplajw mean: 13072ms
a. inter-arrival distributions
b. inter-arrival densities
0
0.2
0.4
0.6
0.8
1
0 20 40 60 80 100
Fra
ctio
n of
I/O
s
Time (ms)
cellosnakehplajw
0
0.05
0.1
0.15
0.2
0.25
0 20 40 60 80 100
Fra
ctio
n of
I/O
s
Time (ms)
cellosnakehplajw
suggest that these assumptions are incorrect. In everytrace, the user data is only 13–41% of all the I/Osgenerated in each system. The metadata percentage isespecially high for writes, where 67–78% of the writesare to metadata blocks.
The ratio of reads to writes varies over time (Figure8). The spikes in the hourly graph correspond to nightlybackups. Overall, reads represent 44% (cello), 43%(snake) and 42% (hplajw) of all disk accesses. This is asurprisingly large fraction, given the sizes of the buffercaches on these systems –cello in particular. Whencello’s buffer cache was increased from 10MB to 30MB,the fraction of reads declined from 49.6% to 43.1%: asurprisingly small reduction. This suggests thatpredictions that almost all reads would be absorbed bylarge buffer caches [Ousterhout85, Ousterhout89,Rosenblum92] may be overly optimistic.
The HP-UX file system generates bothsynchronous and asynchronous requests. SynchronousI/O operations cause the invoking process to wait untilthe I/O operation has occurred before proceeding, sodelaying synchronous operations can increase thelatency associated with an I/O operation. Asynchronousoperations proceed in the background, not tied directlyto any process. Requests not explicitly flagged eitherway are treated as synchronous at the file system level,asynchronous at the disk level (this distinction is onlyimportant for writes).
Most read requests are implicitly synchronous(Table 6 and Figure 7), except for user data, where 14–
Table 6: distribution of I/Os by typeIn this table,user data means file contents,metadata includes inode, directory, indirect blocks, superblock, and otherbookkeeping accesses,swap corresponds to virtual memory and swapping traffic, andunknown represents blocksclassified as such by the tracing system (they are demand-paged executables and, onsnake, diskless-cluster I/Os madeon behalf of its clients). The percentages under “I/O type” sum to 100% in each row.The amount of raw (character-mode, or non-file-system) traffic is also shown as a percentage of the entire I/Os. Rawaccesses are made up of the swap traffic and the demand-paging of executables from theunknown category. Onhplajw,there was also a small amount of traffic to the boot partition in this mode.Numbers in parentheses represent the percentage of that kind of I/O that was synchronous at the file system level (i.e.,did not explicitly have theasynchronous-I/O flag attached to the I/O request).
system operationI/O type Raw
disk I/Osuser data metadata swap unknown
cello
reads 51.4% (66%) 40.0% (100%) 3.2% (100%) 5.5% (100%) 8.6%
writes 32.0% (55%) 67.3% (72%) 0.7% (100%) 0.0% (100%) 0.7%
total 40.6% (61%) 55.2% (81%) 1.8% (100%) 2.4% (100%) 4.2%
snake
reads 5.7% (86%) 17.4% (100%) 0.7% (100%) 76.2% (83%) 34.0%
writes 19.5% (46%) 78.1% (18%) 0.1% (100%) 2.3% (45%) 0.1%
total 13.4% (53%) 51.5% (30%) 0.4% (100%) 34.7% (82%) 15.0%
hplajw
reads 23.6% (60%) 10.7% (100%) 29.2% (100%) 36.4% (100%) 65.7%
writes 21.7% (26%) 71.2% (52%) 7.1% (100%) 0.0% (100%) 7.1%
total 22.5% (41%) 45.5% (57%) 16.5% (100%) 15.4% (100%) 31.9%

UNIX disk access patterns Ruemmler and Wilkes
412 1993 Winter USENIX – January 25-29, 1993 – San Diego, CA
Figure 8: Fraction of I/Os oncello that are reads as a function of time (daily: 92.4.18 to 92.6.20; hourly: 92.5.30 to92.6.6). Note the reduction in read fraction aftercello’s buffer cache was increased in size on 92.4.26.
0
0.2
0.4
0.6
0.8
1
0 10 20 30 40 50 60 70
Fra
ctio
n R
eads
Day
0
0.2
0.4
0.6
0.8
1
0 20 40 60 80 100 120 140 160 180
Fra
ctio
n R
eads
Hour
0 7 14 21 28 35 42 49 560
0.1
0.2
0.3
0.4
0.5
0.6
0.7
0.8
0.9
1F
ract
ion
of I/
Os
Day
Read Sync.
Read Neither
Read Async.
Write Sync.
Write Neither
Write Async.
I/O Type
Figure 7: I/Os on each system classified by type, expressed as a fraction of the total I/Os on that system.The labelssynchronous andasynchronous indicate that one of these flags was associated by the file system with the request;
neither indicates that the file system did not explicitly mark the request in either way. The flags do not occur together.
b. Snake
Mean values reads writes both
asynchronous 5.9% 42.6% 48.5%
neither 37.9% 4.6% 42.5%
synchronous 0.0% 9.0% 9.0%
total 43.8% 56.2% 100.0%
c. Hplajw
Mean values reads writes both
asynchronous 4.0% 28.8% 32.8%
neither 38.4% 4.4% 42.8%
synchronous 0.0% 24.4% 24.4%
total 42.4% 57.6% 100.0%
a. Cello
Mean values reads writes both
asynchronous 7.7% 18.7% 26.4%
neither 36.4% 0.8% 37.2%
synchronous 0.0% 36.4% 36.4%
total 44.1% 55.9% 100.0%
0 7 14 21 28 35 42 49 560
0.1
0.2
0.3
0.4
0.5
0.6
0.7
0.8
0.9
1
Fra
ctio
n of
I/O
s
Day
Read Sync.
Read Neither
Read Async.
Write Sync.
Write Neither
Write Async.
I/O Type
0 7 14 21 28 35 42 49 560
0.1
0.2
0.3
0.4
0.5
0.6
0.7
0.8
0.9
1
Fra
ctio
n of
I/O
s
Day
Read Sync.
Read Neither
Read Async.
Write Sync.
Write Neither
Write Async.
I/O Type

Ruemmler and Wilkes UNIX disk access patterns
1993 Winter USENIX – January 25-29, 1993 – San Diego, CA 413
Figure 9: Density and distribution plots of the distance inKB between the end ofone request and the start of the next. In the distribution plots, the X-axis is given by
x = sign(d) × log10 (|d|)of the distanced. The large peaks at –8KB correspond
to block overwrites. The traces run from 92.5.30 to 92.6.6.
d. Snake root disk (trace A) e. Snake /usr1 disk (trace B) f. Hplajw root disk
a. Cello root disk (trace A) b. Cello /users disk (trace B) c. Cello news disk (trace D)
g. Cello distribution plot h. Snake distribution plot i. Hplajw distribution plot
0
0.02
0.04
0.06
0.08
0.1
0.12
0.14
-100 -80 -60 -40 -20 0 20 40 60 80 100
Fra
ctio
n of
I/O
s
Distance (kilobytes)
0
0.05
0.1
0.15
0.2
0.25
-100 -80 -60 -40 -20 0 20 40 60 80 100
Fra
ctio
n of
I/O
s
Distance (kilobytes)
0
0.01
0.02
0.03
0.04
0.05
0.06
0.07
-100 -80 -60 -40 -20 0 20 40 60 80 100
Fra
ctio
n of
I/O
s
Distance (kilobytes)
0
0.02
0.04
0.06
0.08
0.1
0.12
-100 -80 -60 -40 -20 0 20 40 60 80 100
Fra
ctio
n of
I/O
s
Distance (kilobytes)
0
0.01
0.02
0.03
0.04
0.05
0.06
0.07
0.08
0.09
-100 -80 -60 -40 -20 0 20 40 60 80 100
Fra
ctio
n of
I/O
s
Distance (kilobytes)
0
0.2
0.4
0.6
0.8
1
-8 -6 -4 -2 0 2 4 6 8
Fra
ctio
n of
I/O
s
Log base 10 of distance (kilobytes)
Disk ADisk BDisk D
0
0.2
0.4
0.6
0.8
1
-8 -6 -4 -2 0 2 4 6 8
Fra
ctio
n of
I/O
s
Log base 10 of distance (kilobytes)
Disk ADisk BDisk C
0
0.2
0.4
0.6
0.8
1
-8 -6 -4 -2 0 2 4 6 8
Fra
ctio
n of
I/O
s
Log base 10 of distance (kilobytes)
Disk ADisk B
0
0.05
0.1
0.15
0.2
0.25
0.3
0.35
0.4
-100 -80 -60 -40 -20 0 20 40 60 80 100
Fra
ctio
n of
I/O
s
Distance (kilobytes)
Figure 10: Distributions ofper-disk write group sizes and write burst sizes
0
0.2
0.4
0.6
0.8
1
1 10 100 1000
Fra
ctio
n of
writ
e I/O
s
Write group size (I/Os)
cellosnakehplajw
0
0.2
0.4
0.6
0.8
1
1 10 100 1000
Fra
ctio
n of
writ
e I/O
s
Write burst size (I/Os)
cellosnakehplajw
UNIX disk access patterns Ruemmler and Wilkes
414 1993 Winter USENIX – January 25-29, 1993 – San Diego, CA
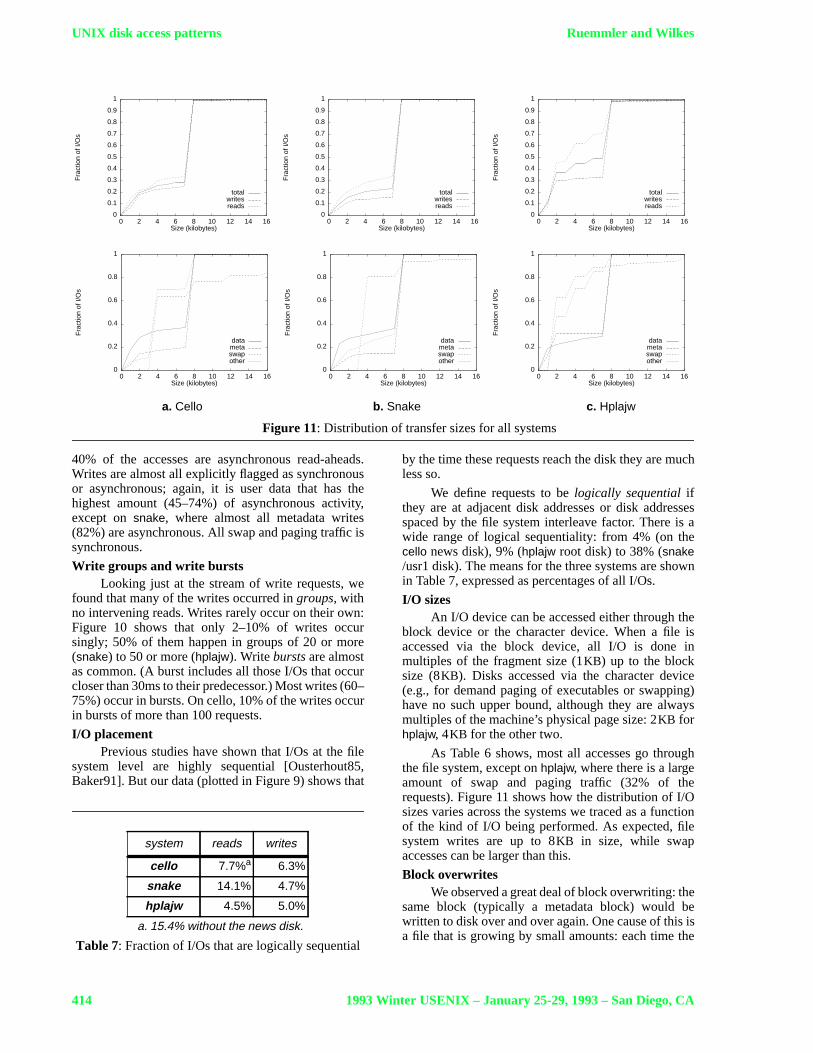
Figure 11: Distribution of transfer sizes for all systems
a. Cello b. Snake c. Hplajw
0
0.1
0.2
0.3
0.4
0.5
0.6
0.7
0.8
0.9
1
0 2 4 6 8 10 12 14 16
Fra
ctio
n of
I/O
s
Size (kilobytes)
totalwritesreads
0
0.2
0.4
0.6
0.8
1
0 2 4 6 8 10 12 14 16
Fra
ctio
n of
I/O
s
Size (kilobytes)
datametaswapother
0
0.1
0.2
0.3
0.4
0.5
0.6
0.7
0.8
0.9
1
0 2 4 6 8 10 12 14 16
Fra
ctio
n of
I/O
s
Size (kilobytes)
totalwritesreads
0
0.2
0.4
0.6
0.8
1
0 2 4 6 8 10 12 14 16
Fra
ctio
n of
I/O
s
Size (kilobytes)
datametaswapother
0
0.1
0.2
0.3
0.4
0.5
0.6
0.7
0.8
0.9
1
0 2 4 6 8 10 12 14 16
Fra
ctio
n of
I/O
s
Size (kilobytes)
totalwritesreads
0
0.2
0.4
0.6
0.8
1
0 2 4 6 8 10 12 14 16
Fra
ctio
n of
I/O
s
Size (kilobytes)
datametaswapother
40% of the accesses are asynchronous read-aheads.Writes are almost all explicitly flagged as synchronousor asynchronous; again, it is user data that has thehighest amount (45–74%) of asynchronous activity,except onsnake, where almost all metadata writes(82%) are asynchronous. All swap and paging traffic issynchronous.
Write groups and write burstsLooking just at the stream of write requests, we
found that many of the writes occurred ingroups, withno intervening reads. Writes rarely occur on their own:Figure 10 shows that only 2–10% of writes occursingly; 50% of them happen in groups of 20 or more(snake) to 50 or more (hplajw). Writebursts are almostas common. (A burst includes all those I/Os that occurcloser than 30ms to their predecessor.) Most writes (60–75%) occur in bursts. On cello, 10% of the writes occurin bursts of more than 100 requests.
I/O placementPrevious studies have shown that I/Os at the file
system level are highly sequential [Ousterhout85,Baker91]. But our data (plotted in Figure 9) shows that
by the time these requests reach the disk they are muchless so.
We define requests to belogically sequential ifthey are at adjacent disk addresses or disk addressesspaced by the file system interleave factor. There is awide range of logical sequentiality: from 4% (on thecello news disk), 9% (hplajw root disk) to 38% (snake/usr1 disk). The means for the three systems are shownin Table 7, expressed as percentages of all I/Os.
I/O sizesAn I/O device can be accessed either through the
block device or the character device. When a file isaccessed via the block device, all I/O is done inmultiples of the fragment size (1KB) up to the blocksize (8KB). Disks accessed via the character device(e.g., for demand paging of executables or swapping)have no such upper bound, although they are alwaysmultiples of the machine’s physical page size: 2KB forhplajw, 4KB for the other two.
As Table 6 shows, most all accesses go throughthe file system, except onhplajw, where there is a largeamount of swap and paging traffic (32% of therequests). Figure 11 shows how the distribution of I/Osizes varies across the systems we traced as a functionof the kind of I/O being performed. As expected, filesystem writes are up to 8KB in size, while swapaccesses can be larger than this.
Block overwritesWe observed a great deal of block overwriting: the
same block (typically a metadata block) would bewritten to disk over and over again. One cause of this isa file that is growing by small amounts: each time the
Table 7: Fraction of I/Os that are logically sequential
a. 15.4% without the news disk.
system reads writes
cello 7.7%a 6.3%
snake 14.1% 4.7%
hplajw 4.5% 5.0%

Ruemmler and Wilkes UNIX disk access patterns
1993 Winter USENIX – January 25-29, 1993 – San Diego, CA 415
file is extended, HP-UX posts the new inode metadatato disk – metadata is essentially held in a write-throughcache.
Figure 12 plots the time between overwrites of thesame block. On the root disks, 25% (hplajw andcello)to 38% (snake) of updated blocks are overwritten inless than 1 second; 45% of the blocks are overwritten in30 seconds (cello); 18% of the blocks are overwritten at30-second intervals (snake – presumably the syncerdaemon); and over 85% of all blocks written areoverwritten in an hour or less – 98% forsnake.
A similar picture is told by the block accessdistributions shown in Figure 13. Up to 30% of thewrites are directed to just 10 blocks, and 65–100% ofthe writes go to the most popular 1000 blocks; 1% ofthe blocks receive over 90% of the writes.
Together, these figures suggest that caching only asmall percentage of the blocks in non-volatile memorycould eliminate a large fraction of the overwrites.
Figure 12: Distribution of 8KB-block overwrite delays
0
0.1
0.2
0.3
0.4
0.5
0.6
0.7
0.8
0.9
1
.001 .01 .1 1 10 100 1e4 1e5 1e6
Fra
ctio
n of
writ
es
Time (seconds)
disk Adisk Bdisk Cdisk Ddisk Edisk Fdisk Gdisk H
0
0.2
0.4
0.6
0.8
1
.01 .1 1 10 100 1e4 1e5 1e6
Fra
ctio
n of
writ
es
Time (seconds)
disk Adisk Bdisk C
0
0.2
0.4
0.6
0.8
1
.01 .1 1 10 100 1e4 1e5 1e6
Fra
ctio
n of
writ
es
Time (seconds)
disk Adisk B
a. Cello
b. Snake
c. Hplajw
Immediate reportingThe disks onsnake use a technique known as
immediate reporting for some of their writes. Ourstudies show that enabling it reduces the mean writetime from 20.9ms to 13.2ms.
HP-UX’s immediate reporting is intended toprovide faster write throughput for isolated writes andsequential transfers. It operates as follows. Aneligiblewrite command is acknowledged as complete by thedisk drive as soon as the data has reached the drive’svolatile buffer memory. Eligible writes are those thatare explicitly or implicitly asynchronous, and those thatare physically immediately after the write that the driveis currently processing. The disk’s write buffer actssolely as aFIFO: no request reordering occurs.
Since the data that is immediately-reported isvulnerable to power failures until it is written to disk,HP-UX disables immediate reporting for write requestsexplicitly flagged as synchronous.
Figure 13: Distribution of writes by 8KB blocknumber; blocks are sorted by write access count
a. Cello
b. Snake
c. Hplajw
0
0.1
0.2
0.3
0.4
0.5
0.6
0.7
0.8
0.9
1
0.001 0.01 0.1 1 10 100
Fra
ctio
n of
writ
e I/O
s
Percent of disk
disk Adisk B
0
0.1
0.2
0.3
0.4
0.5
0.6
0.7
0.8
0.9
1
0.0001 0.001 0.01 0.1 1 10 100
Fra
ctio
n of
writ
e re
ques
ts
Percent of disk
disk Adisk Bdisk C
0
0.1
0.2
0.3
0.4
0.5
0.6
0.7
0.8
0.9
1
0.0001 0.001 0.01 0.1 1 10 100
Fra
ctio
n of
writ
e re
ques
ts
Percent of disk
disk Adisk Bdisk D

UNIX disk access patterns Ruemmler and Wilkes
416 1993 Winter USENIX – January 25-29, 1993 – San Diego, CA
Simulation studies
We constructed a simulation model to explorevarious design alternatives in the I/O subsystem. Wereport here on our results with adding non-volatileRAM (NVRAM) caches. We begin with a description ofthe model itself, and the calibration we performed on it.We then present the results of applying differentcaching strategies.
The simulation modelWe modelled the disk I/O subsystem in
(excruciating) detail, including transfer times over theSCSI bus from the host, bus contention, controlleroverhead, seek times as a (measured) function ofdistance, read and write settling times, rotationposition, track- and cylinder-switch times, zone bitrecording for those disks that had it, media transfer rate,and placement of sparing areas on the disks.
Figure 15: Distributions of physical I/O timesfor different disk caching policies with 128KB
of cache, over the period 92.5.30–92.6.6
b. Snake root disk
c. Hplajw root disk
a. Cello root disk
0
0.1
0.2
0.3
0.4
0.5
0.6
0.7
0.8
0.9
1
0 5 10 15 20 25 30 35 40 45 50
Fra
ctio
n of
I/O
s
Time (ms)
noneimmediate report
fcfssatf
0
0.1
0.2
0.3
0.4
0.5
0.6
0.7
0.8
0.9
1
0 5 10 15 20 25 30 35 40 45 50
Fra
ctio
n of
I/O
s
Time (ms)
noneimmediate report
fcfssatf
0
0.1
0.2
0.3
0.4
0.5
0.6
0.7
0.8
0.9
1
0 5 10 15 20 25 30 35 40 45 50
Fra
ctio
n of
I/O
s
Time (ms)
noneimmediate report
fcfssatf
When immediate reporting is enabled, writes arefaster, and take only 3–7ms for an 8KB block. Figure 1shows that 45% of all writes occur in less than 7ms.This is 53% of the writes eligible for immediatereporting (determined from Figure 7 and Table 3). Theminimum physical request time is around 3ms, made upof 1.6ms ofSCSI bus data transfer time, plus about thesame again in disk, driver andSCSI channel overheads.
The main benefit of immediate reporting is thatsequential, back-to-back writes can proceed at full diskdata rates, without the need for block interleaving. (Onthe HP97560 disks onsnake, this means 2.2MB/sec.)However, only 4.7–6.3% I/Os are sequential writes, sothe benefit is not as great as might be hoped. Perhapscaching, which allows request reordering in the disk,could help alleviate this problem. To investigate this,we turned to simulation studies driven by our trace data.
Figure 14: Measured and modelled physicaldisk I/O times over the period 92.5.30–92.6.6
0
0.1
0.2
0.3
0.4
0.5
0.6
0.7
0.8
0.9
1
0 10 20 30 40 50 60 70
Fra
ctio
n of
I/O
s
Time (ms)
realsimulated
0
0.1
0.2
0.3
0.4
0.5
0.6
0.7
0.8
0.9
1
0 10 20 30 40 50 60 70
Fra
ctio
n of
I/O
s
Time (ms)
realsimulated
0
0.1
0.2
0.3
0.4
0.5
0.6
0.7
0.8
0.9
1
0 10 20 30 40 50 60 70
Fra
ctio
n of
I/O
s
Time (ms)
realsimulated
c. Quantum PD425S
b. HP97560
a. HP C2200A

Ruemmler and Wilkes UNIX disk access patterns
1993 Winter USENIX – January 25-29, 1993 – San Diego, CA 417
Figure 16: Physical and elapsed times for different cache sizes and caching policies.The root disk from each system is shown; traces are from 92.5.30–92.6.6.
b. Cello elapsed I/O times
d. Snake elapsed I/O times
f. Hplajw elapsed I/O times
a. Cello physical I/O times
c. Snake physical I/O times
e. Hplajw physical I/O times
16 32 64 128 256 512 1024 2048 40960
2
4
6
8
10
12
14
16
18
20
Tim
e (m
s)
Cache size (kilobytes)
none
imm. rpt
fcfs
satf
Caching Policy
16 32 64 128 256 512 1024 2048 40960
50
100
150
200
250
300
Tim
e (m
s)
Cache size (kilobytes)
none
imm. rpt
fcfs
satf
Caching Policy
16 32 64 128 256 512 1024 2048 40960
5
10
15
20
25
Tim
e (m
s)
Cache size (kilobytes)
none
imm. rpt
fcfs
satf
Caching Policy
16 32 64 128 256 512 1024 2048 40960
10
20
30
40
50
60
70
80
90
100
Tim
e (m
s)
Cache size (kilobytes)
none
imm. rpt
fcfs
satf
Caching Policy
16 32 64 128 256 512 1024 2048 40960
5
10
15
20
25
Tim
e (m
s)
Cache size (kilobytes)
none
imm. rpt
fcfs
satf
Caching Policy
16 32 64 128 256 512 1024 2048 40960
20
40
60
80
100
120
140
160
180
200
Tim
e (m
s)
Cache size (kilobytes)
none
imm. rpt
fcfs
satf
Caching Policy
To calibrate our model, we compared themeasured I/O times in the traces against the three diskswe simulated. The result is the close match shown inFigure 14. We did not attempt to mimic the two-spindle,single-controller HP2204A: instead, we modelled it asan HP2474S (but with read-ahead disabled, since theHP2204 controllers do not provide it). Since our resultscompare simulator runs, rather than comparesimulations against the real trace (other than for thecalibration), we believe the results are still useful.
Read-ahead at the diskWe did a limited exploration of the effects of in-
disk read-ahead. If read-ahead is enabled, the diskcontinues to read sequentially into an internal read-ahead cache buffer after a read until either a newrequest arrives, or the buffer fills up. (This buffer isindependent of the write caches we discuss later.) Inthe best case, sequential reads can proceed at the fulldisk transfer rate. The added latency for other requestscan be made as small as the time for a single sector read
(0.2ms for an HP97560) in all but one case: if the read-ahead crosses a track boundary, the track switchproceeds to completion even if there is a new request toservice.2
Table 8 shows the effects of disabling or enablingread-ahead for thecello traces. Enabling it improvesphysical read performance by 10% and elapsed readtimes by 42%, but has no effect on write times.
2 A more recent HP disk, the HP C3010, lets the host decidewhether such inter-track read-aheads should occur.
Table 8: Effect of read-ahead on I/O times, averagedover all disks oncello; 92.5.30–92.6.6
read-ahead?
Reads Writes
elapsed physical elapsed physical
no 33.7ms 16.4ms 255.4ms 18.3ms
yes 19.5ms 14.7ms 255.5ms 18.3ms
UNIX disk access patterns Ruemmler and Wilkes
418 1993 Winter USENIX – January 25-29, 1993 – San Diego, CA
Non-volatile write caching at the diskIf non-volatile memory were used for the write
buffers in the disk, the limitations of immediatereporting could be lifted: both synchronous and non-sequential writes could be cached. In particular, wewere interested in how the write-back policy from thecache would affect performance.
Policies we explore here include: no cache at all,immediate reporting, caching with a straightFCFSscheduling algorithm, and caching with a modifiedshortest access time first scheduling (SATF) algorithm.(SATF is a scheduling algorithm that takes both seekand rotation position into account [Seltzer90,Jacobson91]. We modified it to favor writing largeblocks out of the cache over small ones since this gavebetter performance at small cache sizes: it freed upspace in the cache faster.)
We gave reads priority over flushing dirty buffersfrom the cache to disk, given the small number ofasynchronous reads we saw in our traces. Eachsimulated disk was also given a reserved buffer forreads so that these did not have to wait for space in thewrite buffer. In addition, large writes (>32KB) werestreamed straight to the disk, bypassing the write buffer.
The results are presented in Figure 15 and 16,which show how the I/O times change under thedifferent policies for the traces from the differentsystems.
We were surprised by two things in this data: first,there was almost no difference in the mean physical I/Otimes between theFCFS and SATF schedulingdisciplines in the disk. In this context,FCFS is really theSCAN algorithm used by the device driver (modified byoverwrites, which are absorbed by the cache). Withsmall numbers of requests to choose from,SATF maysecond-guess the request stream from the host – and getit wrong – in the face of incoming read requests. Atlarger cache sizes, this effect is compensated for by theincreased number of requests SATF can select from.
Second, even though the mean physical timeswere uniformly better when caching was enabled, theelapsed times for small cache sizes were sometimesworse. We tracked this down to the cache bufferreplacement policy: the cache slots occupied by arequest are not freed until the entire write has finished,so that an incoming write may have to wait for theentire current write to complete. At small cache sizes,this has the effect of increasing the physical times ofwrites that happen in bursts big enough to fill the cache– thereby accentuating the queueing delays, whichoccur mostly in these circumstances.
We also found that a very small amount ofNVRAM (even as little as 8KB per disk) at theSCSIcontroller or in the host would eliminate 10–18% of thewrite traffic, as a result of the many overwrites. Indeed,on snake, 44–67% of metadata writes are overwrittenin a 30 second period: absorbing all of these wouldreduce the total I/Os by 20%.
Reads were slowed down a little (less than 4%)when caching was turned on. We surmise that theincreased cache efficiency increased the mean seekdistance for writes by absorbing many of theoverwrites. This meant that a read issued while a cache-flush write was active would occasionally have to waitfor a slightly longer seek to complete than it would havedone if there had been no caching. Also, reads do notinterrupt a write: if this happens, the physical read timewill include the time for the write to finish.
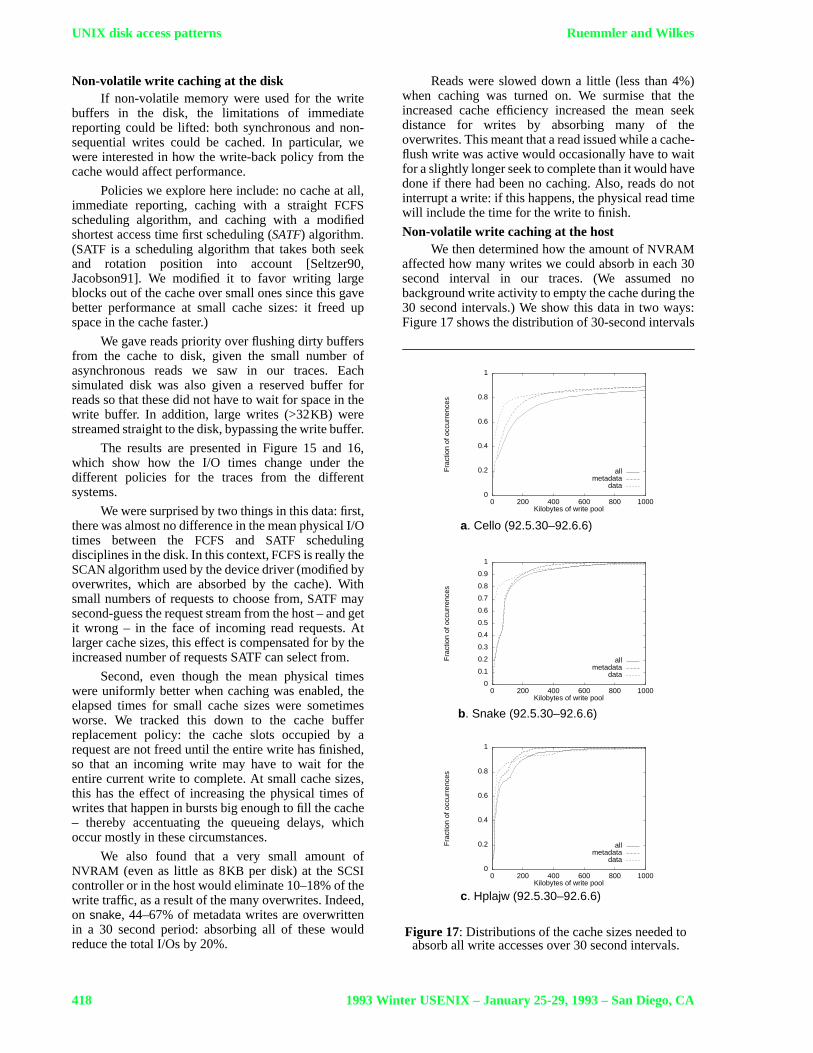
Non-volatile write caching at the hostWe then determined how the amount ofNVRAM
affected how many writes we could absorb in each 30second interval in our traces. (We assumed nobackground write activity to empty the cache during the30 second intervals.) We show this data in two ways:Figure 17 shows the distribution of 30-second intervals
Figure 17: Distributions of the cache sizes needed toabsorb all write accesses over 30 second intervals.
b. Snake (92.5.30–92.6.6)
c. Hplajw (92.5.30–92.6.6)
0
0.2
0.4
0.6
0.8
1
0 200 400 600 800 1000
Fra
ctio
n of
occ
urre
nces
Kilobytes of write pool
allmetadata
data
0
0.1
0.2
0.3
0.4
0.5
0.6
0.7
0.8
0.9
1
0 200 400 600 800 1000
Fra
ctio
n of
occ
urre
nces
Kilobytes of write pool
allmetadata
data
0
0.2
0.4
0.6
0.8
1
0 200 400 600 800 1000
Fra
ctio
n of
occ
urre
nces
Kilobytes of write pool
allmetadata
data
a. Cello (92.5.30–92.6.6)

Ruemmler and Wilkes UNIX disk access patterns
1993 Winter USENIX – January 25-29, 1993 – San Diego, CA 419
in which a given amount of cache was able to absorballof the writes; Figure 18 shows the fraction of writesabsorbed by a given cache size. (The disparity betweenthe “overwrites” and “total” lines in the latter representsthe amount of valid data in theNVRAM cache at theend of the 30 second period.)
Two hundredKB of NVRAM can absorb all writesin 65% (cello) to 90% (hplajw) of 30 second intervals. Ifmetadata alone is considered (because it has the highestpercentage of synchronous I/Os), all metadata writescan be absorbed in 80% of the intervals with 100KB(hplajw andsnake) to 250KB (cello) of NVRAM.
The “total” lines in Figure 18 show the write I/Obandwidth: once the cache is big enough to absorb this,little further improvement is seen. 95% absorption isreached at 700KB (hplajw), 1MB (snake) and 4MB
Figure 18: distributions of the number of writesabsorbed by given cache sizes over 30 second intervals.
0
0.1
0.2
0.3
0.4
0.5
0.6
0.7
0.8
0.9
1
10 100 1000 10000 100000
Fra
ctio
n of
writ
es a
bsor
bed
Cache size (kilobytes)
totaloverwrite
0
0.1
0.2
0.3
0.4
0.5
0.6
0.7
0.8
0.9
1
10 100 1000 10000 100000
Fra
ctio
n of
writ
es a
bsor
bed
Cache size (kilobytes)
totaloverwrites
0
0.2
0.4
0.6
0.8
1
10 100 1000 10000 100000
Fra
ctio
n of
writ
es a
bsor
bed
Cache size (kilobytes)
totaloverwrites
b. Snake (92.5.30–92.6.6)
c. Hplajw (92.5.30–92.6.6)
a. Cello (92.5.30–92.6.6)
(cello). Overwrites account for 25% (hplajw) to 47%(snake) of all writes.
Conclusions
We have provided a great deal of information onthree complete, disk-level I/O traces from computersystems with moderately disparate workloads. Theseresults will be of use to others in understanding whatfile systems do, to evaluate possible changes, and toprovide distribution parameters for modelling.
We have also presented the results of simulationsof write caching at the disk level, and demonstrated thatthis is an effective technique, although a new finding isthat the write scheduling policy has little effect on thecache efficacy.
AcknowledgmentsThis work was carried out as part of the DataMesh
research project at HP Laboratories. We thank the usersand administrators of the systems we traced for theircooperation in allowing us to gather the data. DavidJacobson helped us interpret some of our results.
AvailabilityFor researchers wishing greater detail than can be
reproduced here, we have made the raw data for thegraphs in this paper available via anonymousftp fromftp.hpl.hp.com, in the filepub/wilkes/USENIX.Jan93.tar.
References
[Baker91] Mary G. Baker, John H. Hartman,Michael D. Kupfer, Ken W. Shirriff, and John K.Ousterhout. Measurements of a distributed filesystem.Proceedings of 13th ACM Symposium onOperating Systems Principles (Asilomar, PacificGrove, CA). Published asOperating SystemsReview25(5):198–212, 13–16 October 1991.
[Bartlett88] Debra S. Bartlett and Joel D. Tesler. Adiscless HP-UX file system.Hewlett-PackardJournal39(5):10–14, October 1988.
[Bozman91] G. P. Bozman, H. H. Ghannad, and E. D.Weinberger. A trace-driven study of CMS filereferences. IBM Journal of Research andDevelopment35(5/6):815–28, Sept.–Nov. 1991.
[Carson90] Scott D. Carson. Experimentalperformance evaluation of the Berkeley file system.Technical report UMIACS–TR–90–5 and CS–TR–2387. Institute for Advanced Computer Studies,University of Maryland, January 1990.
[Clegg86] Frederick W. Clegg, Gary Shiu-Fan Ho,Steven R. Kusmer, and John R. Sontag. The HP-UXoperating system on HP Precision Architecturecomputers.Hewlett-Packard Journal37(12):4–22,December 1986.
[English92] Robert M. English and Alexander A.Stepanov. Loge: a self-organizing storage device.USENIX Winter 1992 Technical ConferenceProceedings (San Francisco, CA), pages 237–51,20–24 January 1992.

UNIX disk access patterns Ruemmler and Wilkes
420 1993 Winter USENIX – January 25-29, 1993 – San Diego, CA
[Floyd86] Rick Floyd. Short-term file referencepatterns in aUNIX environment. Technical report177. Computer Science Department, University ofRochester, NY, March 1986.
[Floyd89] Richard A. Floyd and Carla Schlatter Ellis.Directory reference patterns in hierarchical filesystems.IEEE Transactions on Knowledge andData Engineering1(2):238–47, June 1989.
[Jacobson91] David M. Jacobson and John Wilkes.Disk scheduling algorithms based on rotationalposition. Technical report HPL–CSP–91–7.Hewlett-Packard Laboratories, 24 February 1991.
[Johnson87] Thomas D. Johnson, Jonathan M. Smith,and Eric S. Wilson. Disk response timemeasurements.USENIX Winter 1987 TechnicalConference Proceedings(Washington, DC), pages147–62, 21–23 January 1987.
[Kure88] Øivind Kure.Optimization of file migration indistributed systems. PhD thesis, published asUCB/CSD 88/413. Computer Science Division,Department of Electrical Engineering and ComputerScience, UC Berkeley, April 1988.
[McKusick84] Marshall K. McKusick, William N. Joy,Samuel J. Leffler, and Robert S. Fabry. A fast filesystem forUNIX. ACM Transactions on ComputerSystems2(3):181–97, August 1984.
[Miller91] Ethan L. Miller and Randy H. Katz.Analyzing the I/O behavior of supercomputerapplications. Digest of papers, 11th IEEESymposium on Mass Storage Systems (Monterey,CA), pages 51–9, 7–10 October 1991.
[Muller91] Keith Muller and Joseph Pasquale. A highperformance multi-structured file system design.Proceedings of 13th ACM Symposium on OperatingSystems Principles (Asilomar, Pacific Grove, CA).Published asOperating Systems Review25(5):56–67, 13–16 October 1991.
[Ousterhout85] John K. Ousterhout, Hervé Da Costa,David Harrison, John A. Kunze, Mike Kupfer, andJames G. Thompson. A trace-driven analysis of theUNIX 4.2 BSD file system.Proceedings of 10thACM Symposium on Operating Systems Principles(Orcas Island, WA). Published asOperating SystemsReview19(5):15–24, December 1985.
[Ousterhout89] John Ousterhout and Fred Douglis.Beating the I/O bottleneck: a case for log-structuredfile systems.Operating Systems Review23(1):11–27, January 1989.
[Porcar82] Juan M. Porcar. File migration indistributed computer systems. PhD thesis, publishedas Technical report LBL–14763. Physics, ComputerScience and Mathematics Division, LawrenceBerkeley Laboratory, UC Berkeley, July 1982.
[Ramakrishnan92] K. K. Ramakrishnan, PrabuddhaBiswas, and Ramakrishna Karedla. Analysis of fileI/O traces in commercial computing environments.Proceedings of 1992ACM SIGMETRICS and
PERFORMANCE92 International Conference onMeasurement and Modeling of Computer Systems(Newport, RI). Published as PerformanceEvaluation Review20(1):78–90, 1–5 June 1992.
[Rosenblum92] Mendel Rosenblum and John K.Ousterhout. The design and implementation of alog-structured file system.ACM Transactions onComputer Systems, 10(1):26–52, February 1992.
[Satyanarayanan81] M. Satyanarayanan. A study of filesizes and functional lifetimes.Proceedings of 8thACM Symposium on Operating Systems Principles(Asilomar, Ca). Published asOperating SystemsReview, 15(5):96–108, December 1981.
[Seltzer90] Margo Seltzer, Peter Chen, and JohnOusterhout. Disk scheduling revisited.USENIXWinter 1990 Technical Conference Proceedings(Washington, DC), pages 313–23, 22–26 Jan. 1990.
[Smith85] Alan Jay Smith. Disk cache—miss ratioanalysis and design considerations.ACMTransactions on Computer Systems3(3):161–203,August 1985.
[Staelin88] Carl Staelin. File access patterns. Technicalreport CS–TR–179–88. Department of ComputerScience, Princeton University, September 1988.
[Staelin91] Carl Staelin and Hector Garcia-Molina.Smart filesystems.USENIX Winter 1991 TechnicalConference Proceedings (Dallas, TX), pages 45–51,21–25 January 1991.
[Stata90] Raymie Stata.File systems with multiple fileimplementations. Masters thesis, published as atechnical report. Dept of Electrical Engineering andComputer Science, MIT, 22 May 1990.
Author information
Chris Ruemmler is currently finishing hisMSdegree in Computer Science at the University ofCalifornia, Berkeley. He received hisBS degree fromthe University of California, Berkeley in May, 1991. Hecompleted the work in this paper during an internship atHewlett-Packard Laboratories. His technical interestsinclude architectural design, operating systems,graphics, and watching disks spin around and around at4002RPM. His personal interests include deep seafishing, swimming, and music.
John Wilkes graduated with degrees in Physics(BA 1978,MA 1980), and a Diploma (1979) and PhD(1984) in Computer Science from the University ofCambridge. He has worked since 1982 as a researcherand project manager at Hewlett-Packard Laboratories.His current primary research interests are in resourcemanagement in scalable systems in general, and fast,highly available parallel storage systems in particular.He particularly enjoys working with university studentson projects such as this one.
The authors can be reached by electronic mail [email protected] [email protected].
HPLaboratoriesTechnicalReport
UNIX Disk Access Patterns
Chris Ruemmler and John WilkesComputer Systems LaboratoryHewlett-Packard Laboratories, Palo Alto, CA
HPL–92–152, December 1992
Also published in USENIX Winter 1993 Technical Conference Proceedings(San Diego, CA), January 25–29, 1993, pages 405–420.© Copyright Hewlett-Packard Company 1992