unsteady aerodynamic characteristics of transversely
TRANSCRIPT

Unsteady Aerodynamic Characteristics ofTransversely Inclined Prisms Under Forced-Vibration---The Base Intensi�cation PhenomenonZengshun Chen
Chongqing UniversityJie Bai
Chongqing UniversityCruz Y. Li ( [email protected] )
The Hong Kong University of Science and Technology https://orcid.org/0000-0002-9527-4674Yemeng Xu
Chongqing UniversityJianmin Hua
Chongqing UniversityXuanyi Xue
Chongqing University
Research Article
Keywords: Forced-vibration technique, transversely inclined prisms, unsteady aerodynamics force,aerodynamic damping, response prediction
Posted Date: July 6th, 2021
DOI: https://doi.org/10.21203/rs.3.rs-609108/v1
License: This work is licensed under a Creative Commons Attribution 4.0 International License. Read Full License
Unsteady Aerodynamic Characteristics of 1
Transversely Inclined Prisms under Forced-2
Vibration---The Base Intensification Phenomenon 3
4
Zengshun Chen a, Jie Bai a, Cruz Y. Li b,*, Yemeng Xu a, Jianmin Hua a, Xuanyi Xue a,* 5
6
a School of Civil Engineering, Chongqing University, Chongqing 400045, China 7
b Department of Civil and Environmental Engineering, The Hong Kong University of Science 8
and Technology, Clear Water Bay, Kowloon, Hong Kong, China. 9
10
11
[email protected] (Zengshun Chen); [email protected] (Jie Bai); 12
[email protected] (Cruz Y. Li); [email protected] (Yemeng Xu); [email protected] (Jiamin 13
Hua); [email protected] (Xue X. Y.) 14
15
16
E-mail address: [email protected] 17
Mailing address: School of Civil Engineering, Chongqing University, Chongqing 400045, 18
China 19
20
* Corresponding Author
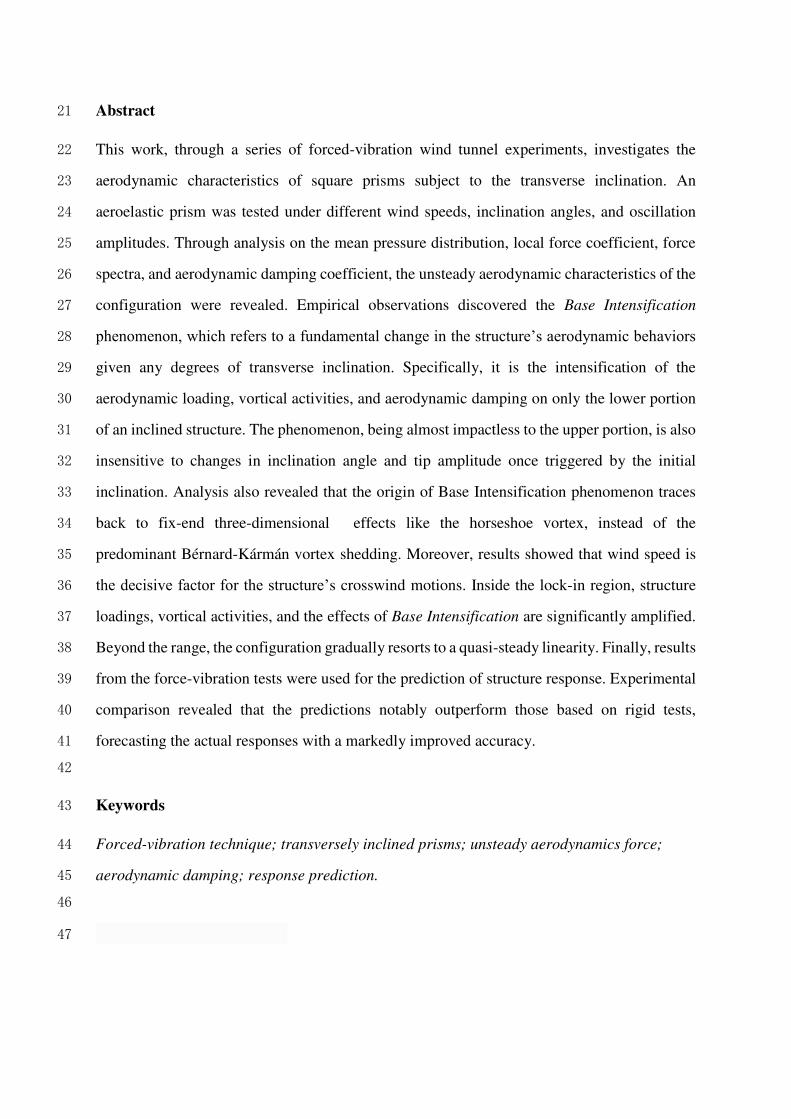
Abstract 21
This work, through a series of forced-vibration wind tunnel experiments, investigates the 22
aerodynamic characteristics of square prisms subject to the transverse inclination. An 23
aeroelastic prism was tested under different wind speeds, inclination angles, and oscillation 24
amplitudes. Through analysis on the mean pressure distribution, local force coefficient, force 25
spectra, and aerodynamic damping coefficient, the unsteady aerodynamic characteristics of the 26
configuration were revealed. Empirical observations discovered the Base Intensification 27
phenomenon, which refers to a fundamental change in the structure’s aerodynamic behaviors 28
given any degrees of transverse inclination. Specifically, it is the intensification of the 29
aerodynamic loading, vortical activities, and aerodynamic damping on only the lower portion 30
of an inclined structure. The phenomenon, being almost impactless to the upper portion, is also 31
insensitive to changes in inclination angle and tip amplitude once triggered by the initial 32
inclination. Analysis also revealed that the origin of Base Intensification phenomenon traces 33
back to fix-end three-dimensional effects like the horseshoe vortex, instead of the 34
predominant Bérnard-Kármán vortex shedding. Moreover, results showed that wind speed is 35
the decisive factor for the structure’s crosswind motions. Inside the lock-in region, structure 36
loadings, vortical activities, and the effects of Base Intensification are significantly amplified. 37
Beyond the range, the configuration gradually resorts to a quasi-steady linearity. Finally, results 38
from the force-vibration tests were used for the prediction of structure response. Experimental 39
comparison revealed that the predictions notably outperform those based on rigid tests, 40
forecasting the actual responses with a markedly improved accuracy. 41
42
Keywords 43
Forced-vibration technique; transversely inclined prisms; unsteady aerodynamics force; 44
aerodynamic damping; response prediction. 45
46
47

Highlights: 48
A series of forced-vibration tests were performed to obtain unsteady aerodynamic forces 49
acting on a transversely inclined slender prism. 50
The nonlinear, unsteady aerodynamics characteristics of transverse inclination have been 51
analyzed. 52
The Base Intensification unsteady phenomenon, which is unique to the transverse 53
inclination, has been identified and introduced. 54
The response of the prisms predicted by the unsteady aerodynamic forces; the newly 55
proposed prediction method outperforms the traditional method based on rigid tests. 56
57

1. Introduction 58
With the continuous improvement of construction technology, modern buildings are becoming 59
increasingly slender and flexible all over the world. Consequently, the influence of wind 60
loading and wind-induced vibration on super-tall buildings are of great safety concern, 61
particularly after being remined by the recent vibration of the SEG Tower in Shenzhen. 62
Therefore, studies on the aerodynamic characteristics of super-tall buildings bear critical 63
importance. To date, much remain unexplored for the even the most canonical configurations, 64
for example the square prism. To tackle the outstanding issues, the deepening of our 65
understanding of bluff-body aerodynamics demands persistent effort. 66
67
The aerodynamic characteristic of a structure is the key determinant to its wind-induced 68
response. In the event of excessive excitations, whether by the Vortex-Induced-Vibration 69
(VIV), galloping, or fluttering, irreversible damage may be incurred on the structure. In many 70
cases, the modes of vibration are closely associated to the aerodynamic damping, because a 71
negative aerodynamic damping will aggravate the vibration until plastic deformation. 72
Therefore, a series of experimental research have been performed on the aerodynamic 73
characteristics of bluff-bodies. Tanaka et al. [1] studied the aerodynamic characteristics of 74
unconventional building models (spiral, cone, etc.) through rigid pressure test. Hui et al. [2] 75
examined the influence of different façade appendages on the aerodynamic characteristics of 76
high-rise buildings. Likewise, Carassale et al. [3] studied the influence of round corners on the 77
aerodynamic characteristics of rectangular prisms. However, these studies are limited to the 78

scenarios when the structure is aligned vertically perpendicular to the incoming flow, which 79
might not be the case for many modern designs of infrastructure. To this end, Hu et al. [4] 80
studied the longitudinally inclined (forward and backward) rectangular prism through a series 81
of wind tunnel tests. They concluded that the inclination angle has profound impacts on the 82
aerodynamic characteristics of prisms, yet the degrees of the impact are significantly different 83
depending on the inclination angle. Perhaps the biggest limitation to this work is the rigidity of 84
the test model. Due to the complex behaviors of the fluid and its mutually reinforcing 85
interactive mechanisms with the structure, it is difficult to evaluate the unsteady aerodynamic 86
forces accurately using a rigid model. Aeroelasticity must be included to accommodate the 87
fluid-structure interaction. 88
89
Subsequently, Hu et al. [5] confirmed the quasi-static theory inadequate for predicting inclined 90
structural responses using an aeroelastic model. Mannini et al. [6] too disproved the theory for 91
low mass-damping structures. Later, Chen et al. [7] discovered the Partial Reattachment 92
phenomenon for aeroelastic tapered prisms, in which the closure of a separation envelope to a 93
separation bubble by increasing the wind attack angle suppresses the Bérnard-Kármán vortex 94
shedding altogether. Indeed, the quasi-static theory also failed in the prediction of tapered 95
prisms. Research showed that structures with shape irregularities generally disobey the quasi-96
static theory. The fundamental cause is the neglect of the unsteady effects, which is only 97
captured by aeroelastic measurement. In other word, ignoring the unsteady effects brought 98
about by aeroelasticity is equivalent to a quasi-static prediction, which is bound to deviate from 99
reality. 100

101
To this end, previous research proved that the forced-vibration method produce relatively 102
accurate evaluations of the unsteady effects [8–10]. Kim et al. [11] examined the impact of 103
vibration amplitude on the aerodynamic forcing of a structure, finding notable improvements 104
by forced-vibration compared to the rigid test. Furthermore, Chen et al. [12, 13] systematically 105
compared the aerodynamic forces measured from rigid, forced-vibration and the hybrid 106
aeroelastic-pressure balance (HAPB) test (i.e., free-vibration). Their analysis showed that the 107
HAPB, being the optimal testing method among the three, accurately depicts the bi-directional 108
feedback loop of the fluid-structure coupling, whereas this loop is utterly absent for the rigid 109
test and unidirectional for the forced-vibration test. 110
111
In addition, Chen et al. [14] studied the unsteady aerodynamic forces acting on a rectangular 112
prism using the forced-vibration method, finding that the permission of vibration significantly 113
alters the aerodynamic force coefficient in the crosswind direction, while only minimally 114
affecting those in the alongwind direction. Interestingly, they also found the generalized and 115
local root-mean-square (RMS) lift increases with oscillation amplitude only at low wind speed 116
and remains relatively constant at high wind speed. Furthermore, based on [4] and a series of 117
aeroelastic wind tunnel tests, it was shown that both the oscillation amplitude and wind speed 118
are the key factors affecting the aerodynamic damping of longitudinally inclined prisms, 119
especially in the lock-in region [9]. The inclination angle per se may also lead to major 120
deviations of the aerodynamic damping from the vertical case. 121

122
The thorough literature review discloses a critical void in bluff-body aerodynamics, that is, 123
there is yet a study on the transversely inclined prism with the aeroelastic effect. Yet the 124
configuration is highly probable given variations of the wind attack angle. Intuitively, the 125
transverse inclination will modify the aerodynamic characteristics of structures and their 126
surrounding flow field. Perhaps the only referential effort was the one that proposed a modified 127
quasi-steady model for transversely inclined prisms [15]. However, the predicted response was 128
only acceptable for the onset of galloping but notably off thereafter. Therefore, the 129
aerodynamic characteristics brough about by transverse inclination, and the feasibility of the 130
quasi-steady theory for this configuration demand further investigation. 131
132
This work aims to examine the aerodynamic characteristics of transversely inclined prisms. 133
The unsteady aerodynamic forces acting on the model were obtained through a series of forced-134
vibration tests, and the aerodynamic characteristics of the model were analyzed under 135
representative wind speeds, inclination angles, and vibration amplitude. In composition, 136
Section 1 offers the contextual information and a thorough literature review on the topic of 137
investigation. Section 2 details the methodology of the forced-vibration wind tunnel test. 138
Section 3 presents the identification of the model’s aerodynamic characteristics from test 139
results, and elucidates the influence of inclination angle on the aerodynamic characteristics. 140
Section 4 discusses the predicted response of the model by the identified aerodynamic 141

damping, and the comparative observations with the aeroelastic results. Section 5 summarizes 142
the major findings of this work. 143
144

2. Wind Tunnel Test Specifications 145
(a)turbulence intensity and wind
profile (b)the wind speed spectrum
Fig. 1 Wind field characteristics

85
.685
.090
.012
0.0
13
0.0
12
0.0
10
0.0
80
.072
.2
91
5.0
Level 1
Level 2
Level 3
Level 4
Level 5
Level 6
Level 7
Level 8
Level 9
Side face
32
.2
Wind
A B C D
A
B
C
D
E
Windward
face
50.8 50.8
(a)
WindInclined transversely
prisms
Left sides
Right sides
α
(b)

(c)
Fig. 2 Model for pressure measurements: (a) The distribution of Pressure taps; (b)
transversely inclined prisms; (c) The forced-vibration device and system
The main investigative method of this work is wind tunnel experiment, which proved one of 146
the most effective method for endeavors in bluff-body aerodynamics. The wind tunnel tests 147
were performed in the high-speed section of the CLP Power Wind/Wave Tunnel Facility at the 148
Hong Kong University of Science and Technology. The dimension of the wind tunnel was 29.2 149
m (Length) × 3 m (Width) × 2 m (Height). The corresponding the blockage ratio was 0.78%, 150
with which undesired influence of tunnel walls on the wind field can be avoided [16]. The 151
mean wind profile exponent 𝛽 was determined as 0.15, and the turbulence intensity at the 152
model top was 10%. The corresponding provisions in the specification were compared with the 153
wind characteristics measured in this test, as shown in Fig. 1 (a) and (b). The comparison 154
shows that the simulated wind characteristics closely replicate the target ones, therefore are 155
appropriate for wind tunnel testing. 156
157
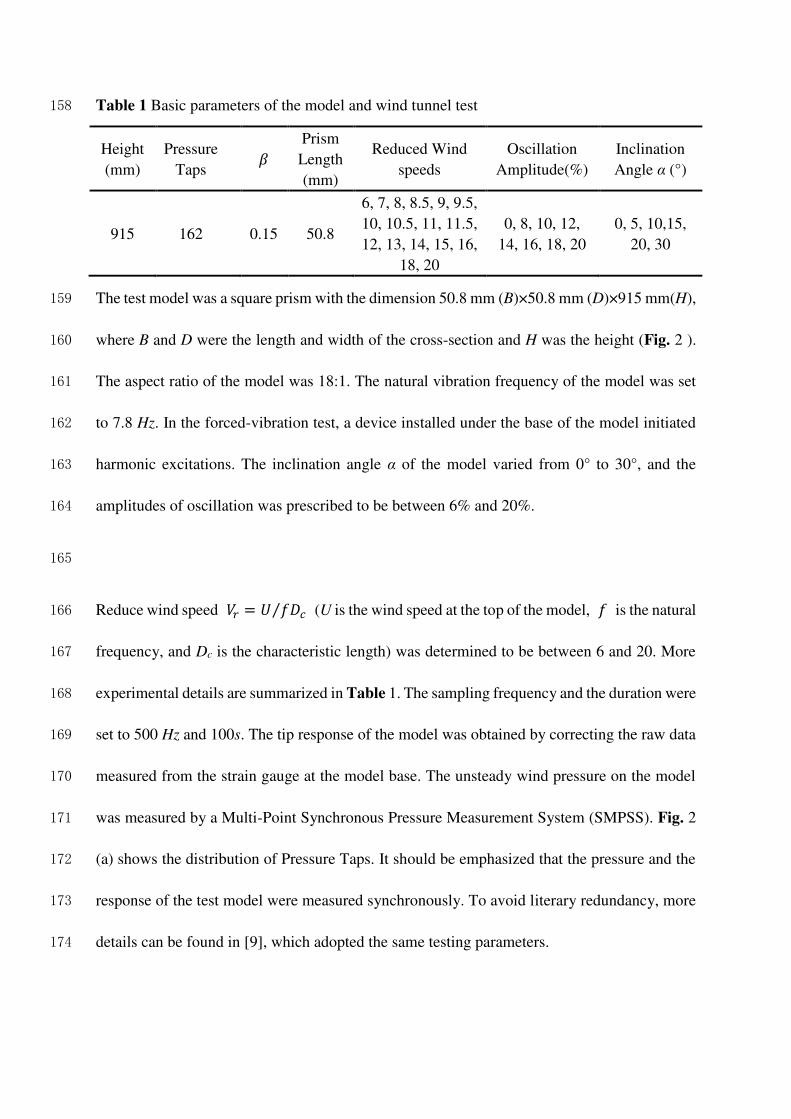
Table 1 Basic parameters of the model and wind tunnel test 158
Height
(mm)
Pressure
Taps 𝛽
Prism
Length
(mm)
Reduced Wind
speeds
Oscillation
Amplitude(%)
Inclination
Angle α (°)
915 162 0.15 50.8
6, 7, 8, 8.5, 9, 9.5,
10, 10.5, 11, 11.5,
12, 13, 14, 15, 16,
18, 20
0, 8, 10, 12,
14, 16, 18, 20
0, 5, 10,15,
20, 30
The test model was a square prism with the dimension 50.8 mm (B)×50.8 mm (D)×915 mm(H), 159
where B and D were the length and width of the cross-section and H was the height (Fig. 2 ). 160
The aspect ratio of the model was 18:1. The natural vibration frequency of the model was set 161
to 7.8 Hz. In the forced-vibration test, a device installed under the base of the model initiated 162
harmonic excitations. The inclination angle α of the model varied from 0° to 30°, and the 163
amplitudes of oscillation was prescribed to be between 6% and 20%. 164
165
Reduce wind speed 𝑉𝑟 = 𝑈 𝑓𝐷𝑐⁄ (U is the wind speed at the top of the model, 𝑓 is the natural 166
frequency, and Dc is the characteristic length) was determined to be between 6 and 20. More 167
experimental details are summarized in Table 1. The sampling frequency and the duration were 168
set to 500 Hz and 100s. The tip response of the model was obtained by correcting the raw data 169
measured from the strain gauge at the model base. The unsteady wind pressure on the model 170
was measured by a Multi-Point Synchronous Pressure Measurement System (SMPSS). Fig. 2 171
(a) shows the distribution of Pressure Taps. It should be emphasized that the pressure and the 172
response of the test model were measured synchronously. To avoid literary redundancy, more 173
details can be found in [9], which adopted the same testing parameters. 174

175
176
177
178
179
180
181
182
183
184
185
186
187
188
189
190
191
192
193
194
195
196
𝛼 = 0° 𝛼 = 5° 𝛼 = 10° 𝛼 = 15° 𝛼 = 20° 𝛼 = 30°
Fig. 3 Mean pressure distribution on the left side(𝑉𝑟 = 11 )
𝛼 = 0° 𝛼 = 5° 𝛼 = 10° 𝛼 = 15° 𝛼 = 20° 𝛼 = 30°
Fig. 4 Mean pressure distribution on the right side (𝑉𝑟 = 11 )

197
198
199
200
201
𝛼 = 0° 𝛼 = 5° 𝛼 = 10° 𝛼 = 15° 𝛼 = 20° 𝛼 = 30°
Fig. 5 Mean pressure distribution on the left side (𝑉𝑟 = 18 )
𝛼 = 0° 𝛼 = 5° 𝛼 = 10° 𝛼 = 15° 𝛼 = 20° 𝛼 = 30°
Fig. 6 Mean pressure distribution on the right side(𝑉𝑟 = 18 )

𝜎𝑦 𝐷⁄ = 0% 𝜎𝑦 𝐷⁄ = 8% 𝜎𝑦 𝐷⁄ = 18% 𝜎𝑦 𝐷⁄ = 0% 𝜎𝑦 𝐷⁄ = 8% 𝜎𝑦 𝐷⁄ = 18%
Left face Right face
Fig. 7 Mean pressure distribution on both sides (𝑉𝑟 = 11 α = 10°)
𝜎𝑦 𝐷⁄ = 0% 𝜎𝑦 𝐷⁄ = 8% 𝜎𝑦 𝐷⁄ = 18% 𝜎𝑦 𝐷⁄ = 0% 𝜎𝑦 𝐷⁄ = 8% 𝜎𝑦 𝐷⁄ = 18%
Left face Right face

3.Results and Discussion 202
3.1 Unsteady Aerodynamic Coefficient 203
3.1.1 Mean Pressure Distribution 204
Equation (1) was used to calculate the mean wind pressure coefficient 𝐶𝑃 acting on the model: 205
where 𝑃𝑖 is the local pressure acting on the model and 𝜌 is the density of air. 206
207
Fig. 3-Fig. 8 present the mean pressure distribution of the model surface at different inclination 208
angles α and vibration amplitude 𝜎𝑦 𝐷⁄ . Due to the change of wind attack angle as the result 209
of transverse inclination, the flow separation at the leading edge is not exactly symmetrical. 210
Therefore, perhaps the most representative observations come from pressure distributions on 211
the side faces. Given the abundance of test results, the most insightful sets of data, with wind 212
speeds of 𝑉𝑟 = 11 and 𝑉𝑟 = 18 and vibration amplitudes 𝜎𝑦 𝐷⁄ = 0%, 8%, and 18%, are 213
presented. 𝑉𝑟 = 11 is characteristic of the lock-in region and 𝑉𝑟 = 18 is characteristic of the 214
high wind speed region. It is also important to define the orientation of the side faces for the 215
convenience of subsequent discussion. As shown in Fig. 2 (b) , the left side refers to the near-216
wind side that faces the ground. The right side refers to the far-wind side that faces the ceiling. 217
218
In the most general sense, the side faces of the model experiences suction (negative pressure). 219
The sharpness of pressure gradients seems to be inversely proportional to the wind speed, 220
Fig. 8 Mean pressure distribution on both sides (𝑉𝑟 = 18 α = 10°)
𝐶𝑃 = 2𝑃𝑖𝜌𝑈2 (1)

although this might be directly attributed to the lock-in effect. In addition, the pressure 221
distribution on either faces are completely different, where dynamical activities on the left face 222
are of greater intensity and subject to more prominent changes with α. Moreover, the lower 223
half of the model is greatly affected by α, whereas the upper half remains relatively insensitive. 224
225
Specifically, we examine the side faces in parallel for better comparisons. Fig. 3 and Fig. 4 226
show the wind pressure distribution of the left and right faces of different α at velocity 𝑉𝑟 =227 11, and no forced-vibration 𝜎𝑦 𝐷⁄ = 0%. On the right side, α has limited influence on the 228
pressure of the top half of the model. However, the model base is quite sensitive to α: low 229
suction zones propagate from the rear corner of the model base towards higher level, before 230
being thwarted near the mid-span. In this lock-in region, α promotes the restoration of pressure 231
most prominently at 15°. In addition, the maximum pressure on the right side is 𝐶𝑃 = −1.3 at 232
the Level 8, which stays fairly consistent at all α’s. 233
234
In comparison to that of the right side, the pressure distribution on the left side is more 235
sophisticated. First, the top half of the model remains unaffected by α, but a region of sharp 236
pressure restoration (𝐶𝑃 = −0.2 and − 0.3) persists at about 1/5H from the free-end. The 237
location corresponds precisely with that of the maximum pressure on the right side. At the 238
model mid-span, a sharp band of high-pressure zone runs across the entire model width, which 239
is consistently maintained with only slight alterations at α =10° and 15°. Conversely, the 240
bottom half of the model is subjected to substantial variations. A pressure restoration zone near 241

the rear end of the base is evident. The restoration is accompanied by a sharply propagating 242
pressure gradient. Yet, perhaps the most drastic and unexpected change occurs at α=15°. A 243
region of extreme suction, at 𝐶𝑃 = −2.1, occurs just below the mid-span high-pressure band. 244
Just below this suction zone, another sharp pressure gradient takes place and restores pressure 245
back to as high as 𝐶𝑃 = −0.3. From an aerodynamics point-of-view, the logical explanation 246
is that at α = 15°, an intense separation bubble forms, which is associated to reattachment and 247
the impingement of certain types of vortices. However, the affiliation of these vortices requires 248
further evidence. 249
250
With the increase of wind speed (Fig. 5 and Fig. 6) beyond the lock-in region to 𝑉𝑟 = 18, the 251
most visible change is the moderation of extremities in the pressure distribution on either side. 252
Evidently, the pressure patterns for the right side resembles those of the lock-in case, except 253
displaying less variability and milder extreme values. For example, the observed maxima 254
reduced from -1.3 to -1.0. On the left side, similar observations are made. Features like the 255
leading-edge restoration near the free-end, mid-span restoration band, and the suction zone all 256
appear with much milder intensity. Interestingly, near the model base, the pattern and intensity 257
of the pressure distribution are almost identical between 𝑉𝑟 = 11 and 18. This is to say, 258
knowing the lock-in is excited by the resonance between the Karman vortex and structure 259
motion, the vortical activities on the model base are not associated with the Bérnard-Kármán 260
vortex shedding. Instead, they are perhaps associated with the horse-shoe vortex that occurs 261
universally near the base of three-dimensional bluff-bodies. 262

263
Next, to elucidate the influence of vibration amplitude on wind pressure distribution, Fig. 7 264
and Fig. 8 present a comparison of the mean wind pressure distribution at 𝛼 = 10°, wind speed 265
at 𝑉𝑟 = 11 and 𝑉𝑟 = 18, and amplitude at 0%, 8% and 18%. Clearly, pressure distribution is 266
only almost insensitive to the vibration amplitude. Although minute variations can be observed, 267
but when compared to the degree of change in vibration amplitude (i.e., from 0-18%), such 268
differences are trivial. 269
270
3.1.2 RMS Generalized Force Coefficient 271
Fig. 9 Generalized RMS force coefficients
The unsteady aerodynamic force coefficient in the crosswind direction can be obtained as: 272
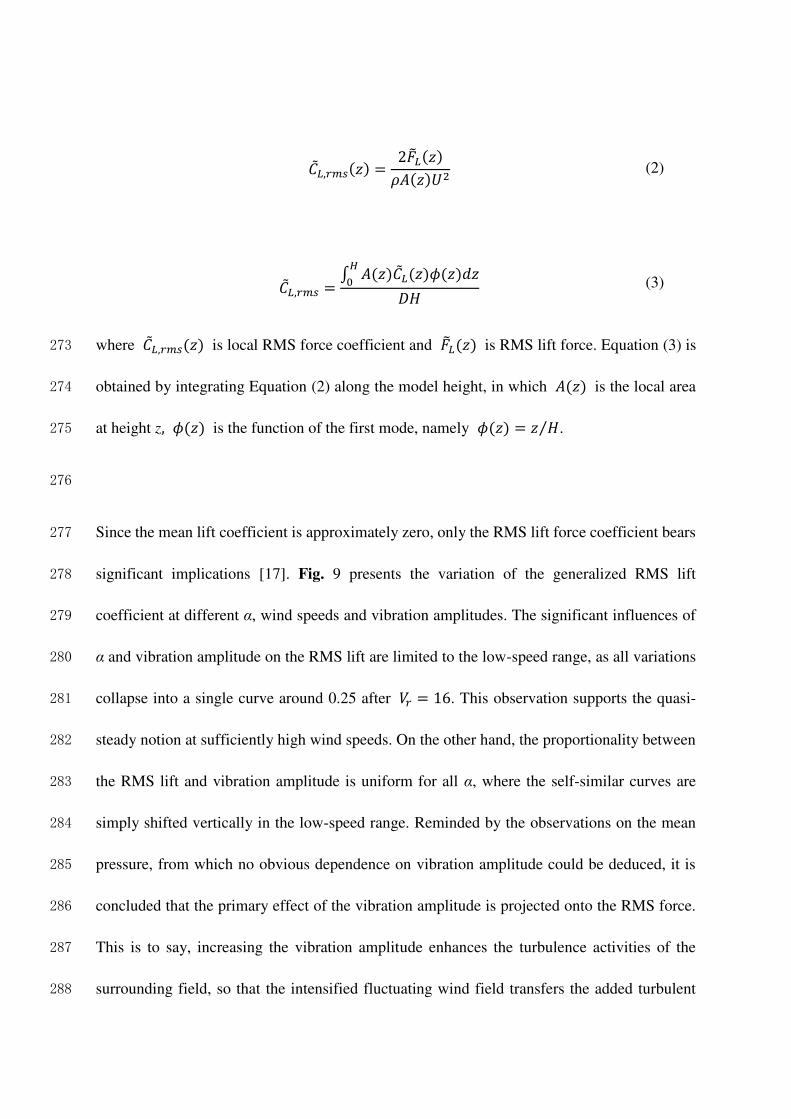
�̃�𝐿,𝑟𝑚𝑠(𝑧) = 2�̃�𝐿(𝑧)𝜌𝐴(𝑧)𝑈2
(2)
�̃�𝐿,𝑟𝑚𝑠 = ∫ 𝐴(𝑧)�̃�𝐿(𝑧)𝜙(𝑧)𝑑𝑧𝐻0 𝐷𝐻 (3)
where �̃�𝐿,𝑟𝑚𝑠(𝑧) is local RMS force coefficient and �̃�𝐿(𝑧) is RMS lift force. Equation (3) is 273
obtained by integrating Equation (2) along the model height, in which 𝐴(𝑧) is the local area 274
at height z, 𝜙(𝑧) is the function of the first mode, namely 𝜙(𝑧) = 𝑧 𝐻⁄ . 275
276
Since the mean lift coefficient is approximately zero, only the RMS lift force coefficient bears 277
significant implications [17]. Fig. 9 presents the variation of the generalized RMS lift 278
coefficient at different α, wind speeds and vibration amplitudes. The significant influences of 279
α and vibration amplitude on the RMS lift are limited to the low-speed range, as all variations 280
collapse into a single curve around 0.25 after 𝑉𝑟 = 16. This observation supports the quasi-281
steady notion at sufficiently high wind speeds. On the other hand, the proportionality between 282
the RMS lift and vibration amplitude is uniform for all α, where the self-similar curves are 283
simply shifted vertically in the low-speed range. Reminded by the observations on the mean 284
pressure, from which no obvious dependence on vibration amplitude could be deduced, it is 285
concluded that the primary effect of the vibration amplitude is projected onto the RMS force. 286
This is to say, increasing the vibration amplitude enhances the turbulence activities of the 287
surrounding field, so that the intensified fluctuating wind field transfers the added turbulent 288

kinetic energy (TKE) onto the structure as fluctuating pressure. The extra TKE is attributed to 289
the added kinetic energy from the enlarged vibration amplitude and reflects this intensification 290
of the unsteady effects. 291
292
With a rather straightforward proportionality of the vibration amplitude, the effect of α on the 293
RMS lift becomes lucid. First, an increase of α, regardless of the extent, significantly amplifies 294
the RMS lift by at least 20% (some even to 100%). Second, compared to the vertical case (α = 295
0°), any alteration of α induces the lock-in effect for the non-vibrating case (𝜎𝑦 𝐷⁄ = 0%). 296
Finally, an increase of α only minimally affect the maximum RMS lift, as its magnitude 297
generally floats around 0.55. All these observations point to a single fact: the aerodynamic 298
characteristics of the configuration experience a sudden change after prescribing an α to the 299
vertical case, but once taken place, further increase of α project minimal impacts. 300
301
3.1.3 RMS Local Force Coefficient 302

Fig. 10 Local RMS lift coefficient in the low wind speed (𝑉𝑟 = 11)
Fig. 11 Local RMS lift coefficient in the high wind speed (𝑉𝑟 = 18)
To instigate better understanding of the interaction between the structure and fluid, the local 303
RMS lift force coefficients showing the distribution of aerodynamic forces along the model 304
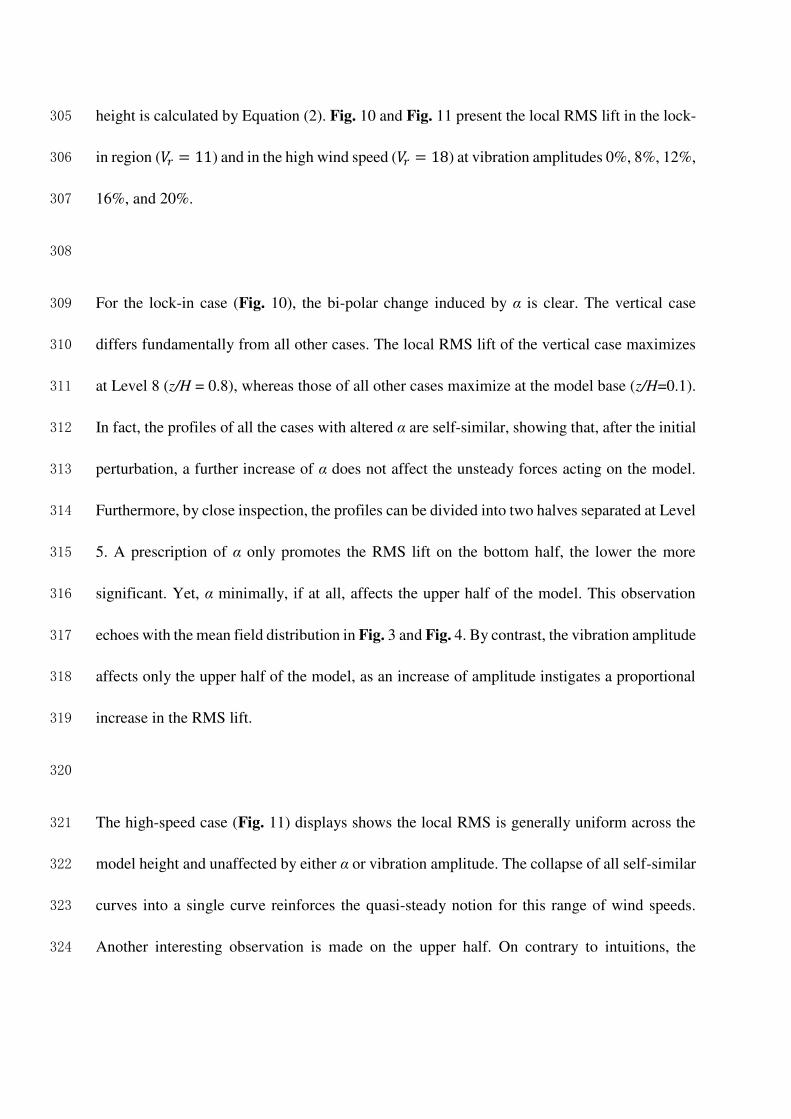
height is calculated by Equation (2). Fig. 10 and Fig. 11 present the local RMS lift in the lock-305
in region (𝑉𝑟 = 11) and in the high wind speed (𝑉𝑟 = 18) at vibration amplitudes 0%, 8%, 12%, 306
16%, and 20%. 307
308
For the lock-in case (Fig. 10), the bi-polar change induced by α is clear. The vertical case 309
differs fundamentally from all other cases. The local RMS lift of the vertical case maximizes 310
at Level 8 (z/H = 0.8), whereas those of all other cases maximize at the model base (z/H=0.1). 311
In fact, the profiles of all the cases with altered α are self-similar, showing that, after the initial 312
perturbation, a further increase of α does not affect the unsteady forces acting on the model. 313
Furthermore, by close inspection, the profiles can be divided into two halves separated at Level 314
5. A prescription of α only promotes the RMS lift on the bottom half, the lower the more 315
significant. Yet, α minimally, if at all, affects the upper half of the model. This observation 316
echoes with the mean field distribution in Fig. 3 and Fig. 4. By contrast, the vibration amplitude 317
affects only the upper half of the model, as an increase of amplitude instigates a proportional 318
increase in the RMS lift. 319
320
The high-speed case (Fig. 11) displays shows the local RMS is generally uniform across the 321
model height and unaffected by either α or vibration amplitude. The collapse of all self-similar 322
curves into a single curve reinforces the quasi-steady notion for this range of wind speeds. 323
Another interesting observation is made on the upper half. On contrary to intuitions, the 324

maximum RMS lift for the upper half does not occur at the free-end but immediately below. 325
This observation bears critical importance and will be discussed in the subsequent sections. 326
327
3.2 Power Spectral Density 328
3.2.1 Generalized Force Spectra 329
Fig. 12 and Fig. 13 present the generalized force spectra in the crosswind direction at 𝛼 = 0°, 330 15° and 30°. The 𝜎𝑦 𝐷⁄ = 0% case represents model with infinite rigidity, which does not 331
consider any fluid-structure interaction. As the result, only one peak [18] corresponding to the 332
frequency of the Bérnard-Kármán vortex shedding is observed. With vibration amplitudes, the 333
forced-vibration tests consider the one-way fluid-structure interaction (i.e., from structure to 334
fluid), thus two peaks appear. 335
336
In the high-wind case (Fig. 13), the two peaks are well separated. The peak of lower frequency 337
corresponds to the natural frequency (7.8Hz) of the model. The peak of higher frequency 338
corresponds to the frequency of the Bérnard-Kármán vortex shedding. Evidently, an increase 339
of α, though enhancing the sharpness of the structure frequency, does not change the Karman 340
shedding activity at all. An increase of vibration amplitude only promotes the energy content 341
by slightly widening the peaks. 342
343
The lock-in case (Fig. 12), by contrast, is much more complicated. At 𝑉𝑟 = 11 , two 344
frequencies are close to each other, and a clear merging of the peaks is observed. The merging, 345

or the resonance, between the structure and the Bérnard-Kármán vortex shedding frequencies 346
amplifies the peak amplitude at the reduced frequency of ~0.09. With an increased vibration 347
amplitude, the second peak becomes increasingly merged into the first peak, while the 348
frequency of the latter remains unchanged, hence the name lock-in. In the 𝜎𝑦 𝐷⁄ = 18% case, 349
a third peak also appears around 0.18, which is believed to be the second harmonic of the 350
primary lock-in frequency. Finally, as expected, α has minimal effects on the lock-in behavior. 351
352
Fig. 12 Generalized force spectrum in the crosswind direction
(𝑉𝑟 = 11)
3.2.2 353
Pointwise Pressure Spectra 354
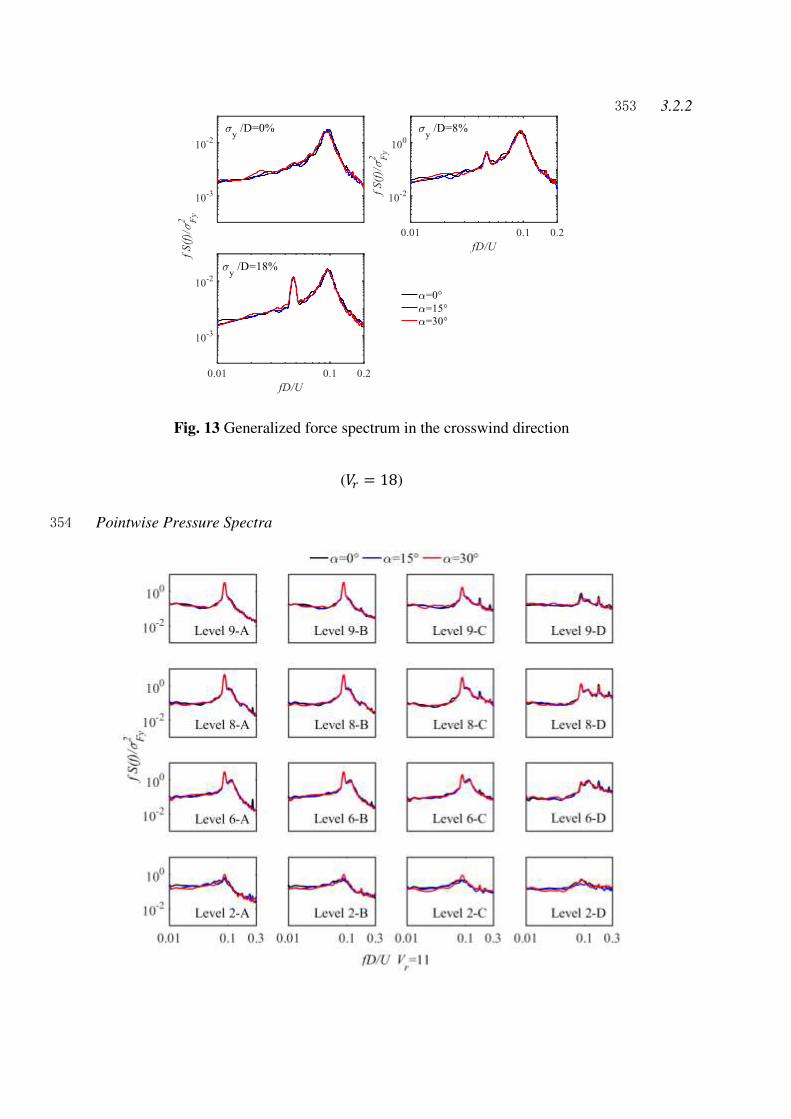
Fig. 13 Generalized force spectrum in the crosswind direction
(𝑉𝑟 = 18)
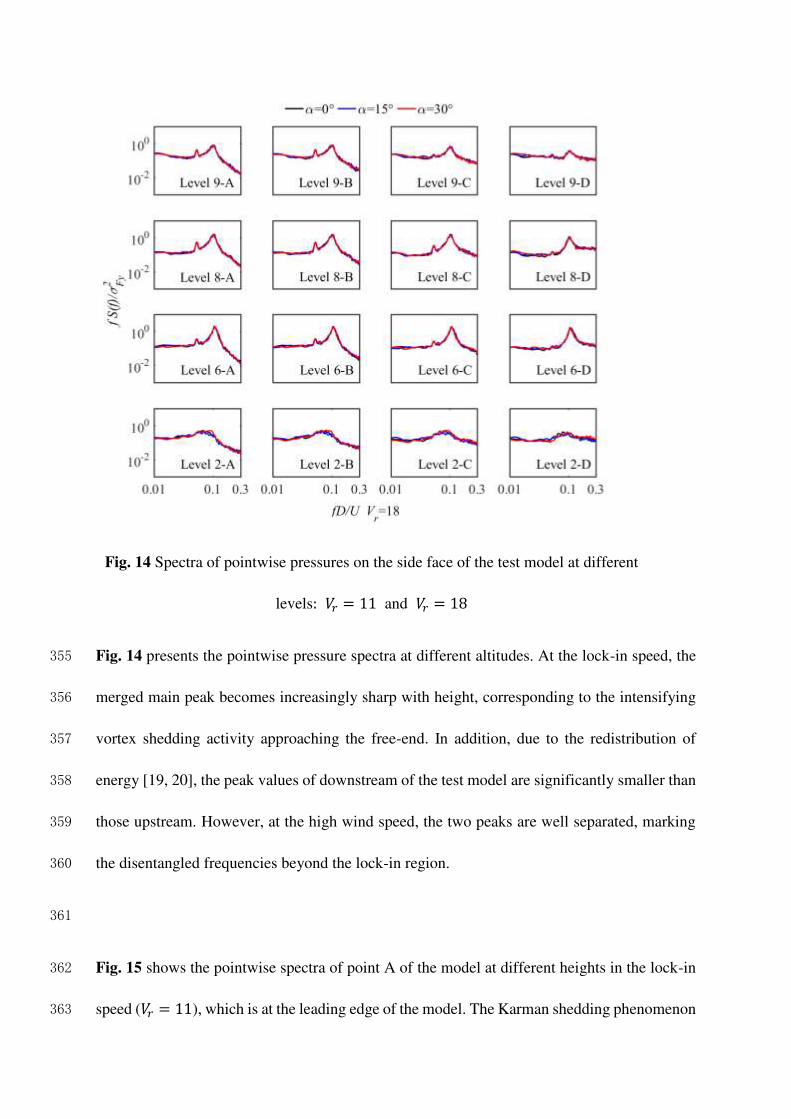
Fig. 14 Spectra of pointwise pressures on the side face of the test model at different
levels: 𝑉𝑟 = 11 and 𝑉𝑟 = 18
Fig. 14 presents the pointwise pressure spectra at different altitudes. At the lock-in speed, the 355
merged main peak becomes increasingly sharp with height, corresponding to the intensifying 356
vortex shedding activity approaching the free-end. In addition, due to the redistribution of 357
energy [19, 20], the peak values of downstream of the test model are significantly smaller than 358
those upstream. However, at the high wind speed, the two peaks are well separated, marking 359
the disentangled frequencies beyond the lock-in region. 360
361
Fig. 15 shows the pointwise spectra of point A of the model at different heights in the lock-in 362
speed (𝑉𝑟 = 11), which is at the leading edge of the model. The Karman shedding phenomenon 363

intensifies with height and is insensitive with α except at Level 2. Near the base, a notable 364
proportionality of vortical activity and α is observed. In general, the prominent effects of 365
transverse inclination is limited to the model base where the Karman shedding is heavily 366
disrupted. 367
368
3.3 Strouhal number 369
Fig. 16 shows the altitudinal Strouhal Number (St) of the model at high wind speed (𝑉𝑟 = 18). 370
The variations of St with α are consistent with previously observed patterns on the mean 371
pressure and RMS lift: the transverse inclination angle affect only the bottom half of the model. 372
In the upper half, St is uniform at 0.11, and it drops to as low as 0.07 near the base. Interestingly, 373
all inclined cases exhibit greater St compared to the vertical case except for α =10°. The 374
changing of St at the base signals a shift in the dominant vortical mechanism, which will be 375
further reinforced by upcoming observations. 376
377
Fig. 17 presents a comparison of the Karman shedding frequency of the forced-vibration and 378
rigid tests. In the rigid model, the frequency exhibits a linear relationship with wind speed. By 379
contrast, in the forced-vibration test, although the linearity is the same at high wind speeds, 380
fluctuations exist at low speeds. Most notably, inside the lock-in region, the shedding frequency 381
is locked with the natural frequency of the structure (7.8 Hz) for a range of velocities. The 382
platform at 7.8 Hz, after persisting for a range of velocities , is suddenly broken to meet the 383

linearity. This vivid manifestation of the lock-in phenomenon is also evident for all α’s and is 384
in agreement with previous studies[14, 18, 21]. 385
Fig. 15 Pointwise spectra analysis at points A at
different heights
Fig. 16 Local Strouhal
numbers (𝑉𝑟 = 18)
Fig. 17 Comparison of static and forced-vibration tests with vortex shedding frequency
4.Identification of Aerodynamic Damping and Response Prediction 386
4.1 Identification of Aerodynamic Damping 387

Galloping, flutter and Vortex-Induced Vibration (VIV) are main modes of aeroelastic vibration 388
in crosswind direction, and the aerodynamic damping plays a key role in all of them [22–26]. 389
Therefore, it is necessary to study the aerodynamic damping of transversely inclined structures. 390
391
The governing equation of motion of a prism in the crosswind direction is expressed as: 392
𝑚(𝑧)�̈�(𝑧, 𝑡) + 2𝑚(𝑧)𝜉𝑣𝜔𝑣�̇�(𝑧, 𝑡) + 𝑘𝑣(𝑧, 𝑡) = 𝑃(𝑧, 𝑡) (4)
where 𝑚(𝑧) is the mass per unit height at altitude z, 𝜉𝑣 is the damping ratio, 𝜔𝑣 is the 393
natural angular frequency, 𝑣 is the generalized crosswind displacement, and k is the structure 394
stiffness. 𝑃(𝑧, 𝑡) is the local crosswind force that consists of the aerodynamic and motion-395
induced (self-excited) components, which can be expressed as: 396
𝑃(𝑧, 𝑡) = 0.5𝜌𝑈2[𝐶𝑀(𝑧, 𝑡) + 𝐶𝐿(𝑧, 𝑡)]𝐷 (5)
where 𝐶𝑀(𝑧, 𝑡) and 𝐶𝐿(𝑧, 𝑡) are the local crosswind aerodynamic force and the motion-397
induced force coefficients at height z, respectively. 𝜌 is the density of air; 𝑈 is the wind 398
speed at point of reference. 399
400
In the forced-vibration test, the time history tip response can be expressed as 𝑦(𝑡) =401 �̂� cos 2𝜋𝑓𝑡, where �̂� is the maximum standard derivation of the tip response. The motion-402
induced force consists of the aerodynamic stiffness term in phase with displacement and the 403
aerodynamic damping term in phase with velocity. For super tall buildings, the aerodynamic 404

stiffness term is usually small and can be ignored in crosswind direction. Therefore, only the 405
aerodynamic damping term is of concern [27]. Accordingly, Eq. 5 can be expressed as: 406
𝑃(𝑧, 𝑡) = 𝑆1 cos 2𝜋𝑓𝑡 + 𝑆2 sin 2𝜋𝑓𝑡 (6)
where the aerodynamic damping force coefficient 𝑆1 is expressed as: 407
𝑆1 = 2𝑇 ∫ 𝑃(𝑧, 𝑡) �̇�2𝜋𝑓�̂�𝑇0 𝑑𝑡 (7)
Since 408 𝑦�̂� = cos 2𝜋𝑓𝑡 𝑎𝑛𝑑 �̇��̂� = sin 2𝜋𝑓𝑡 (8)
The local damping force coefficient 𝜒(𝑧) is 409
𝜒(𝑧) = 2𝑆1𝜌𝐷𝑈2 (9)
The generalized damping force coefficient 𝜅 is 410
𝜅 = ∫ 𝜇(𝑧)𝜙(𝑧)𝑑𝑧𝐻0 𝐻 (10)
The normalized damping coefficient 𝜒 is 411
𝜒 = 𝜉𝑏 𝜂 = − 34 𝐷�̂�⁄ ( 𝑈𝐷𝑤𝑣)2 𝜅 (11)
where 𝜂 = 𝜌𝐷2 𝑚𝑣⁄ , 𝜉𝑏 is aerodynamic damping ratio, 𝑚𝑣 is the unit mass. 412
413
4.1.1 Generalized Aerodynamic Damping Coefficient 414

Fig. 18 Generalized aerodynamic damping for transversely inclined prisms
Fig. 19 Comparison of generalized aerodynamic damping at different inclination
angles
Fig. 18 presents the generalized aerodynamic damping of the model, which is obtained from 415
Eq. (10) at different vibration amplitude, wind speeds and α. In general, the generalized 416
aerodynamic damping χ is positive in the lock-in region, while it is negative in the high wind 417
speeds. The positive aerodynamic coefficient signifies the self-containing nature of the 418
crosswind vibration. Incidentally, for the zero-ordinate of χ marks the end of the lock-in, 419
hence prominent vibration. Accordingly, if the aeroelastic effect is ignored (i.e., without 420
aerodynamic damping), there will be over- and underestimations in the predicted response at 421
low and high wind speeds, respectively. 422
423
Both α the vibration amplitude has limited influence on χ, except the latter mildly shifts the 424
corresponding velocity of the zero-ordinate to higher magnitudes. Perhaps the generalized 425
aerodynamic damping force coefficient presented in Fig. 19 illustrates this insensitivity to a 426
better depiction. The curves of generalized χ are closely self-similar, displaying a lucid message 427
that α and vibration amplitude have minimal influence on χ. In general, wind speed is primary 428
determinant of the behaviors of χ. 429
430
4.1.2 Local aerodynamic damping coefficients 431
According to Eq. (9), the local aerodynamic damping of the structure with 𝜎𝑦 𝐷⁄ = 14% is 432
obtained in Fig. 20. At sufficiently high levels, the local χ curves resemble those of the 433
generalized χ from Fig. 19 and Fig. 20. Nonetheless, near the model base (Levels 2 and 434
4), 𝜒(𝑧) is of much less magnitude compared to their high-level counterparts. At Level 2, on 435
contrary to all other cases, 𝜒(𝑧) barely crosses the zero-ordinate. Perhaps another 436
unexpected observation on the altitudinal effect on 𝜒(𝑧) is that the maximum local χ does 437
not occur at Level 9, but rather at Levels 7 and 8. Readers are also remined by similar 438
observations made on the local RMS lift. After consulting fluid mechanics and bluff-body 439
aerodynamics, logical explanations are found for these unintuitive observations. 440
441

The oddities of Level 2 and Level 9 are attributed to different mechanisms either dominating 442
or affecting the aerodynamic behaviors of the structure. As is well-known, the predominant 443
driving mechanism of this configuration, including the excitation of the lock-in phenomenon, 444
is the Bérnard-Kármán vortex shedding. The self-similar local 𝜒(𝑧) curves, as well as all 445
previous observations, support this notion. The first exception is at the model base. Near the 446
model base, the Bérnard-Kármán vortex shedding is completely overshadowed by fix-end 447
vortical activities like the horse-shoe vortex shedding. As the result, the entire array of 448
aerodynamic parameters at the model base, including the aforementioned mean pressure 449
distribution, RMS lift coefficient, Strouhal number, and aerodynamic damping are 450
fundamentally different from higher levels. As for the other end, the free-end of the model, the 451
Bérnard-Kármán vortex shedding is heavily affected by three-dimensional effects like the 452
downwash axial flow. However, the degree of the influence is not as overwhelming as the 453
horseshoe vortex. Consequently, as reflected by the local RMS lift, local Strouhal number, and 454
here the local aerodynamic coefficient, the Karman shedding maintains its dominance but with 455
a compromised intensity. The maximum local RMS lift and local χ are also recorded slight 456
below the free-end. Nonetheless, and in spite the different driving mechanisms near both ends, 457
the overall lock-in phenomenon dictates the intensity of all aerodynamic activities, thus wind 458
speed becomes the most decisive factor. 459
460
Perhaps this is also a good point to elucidate the aerodynamic effect of the transverse 461
inclination. As all evidence suggest, the transverse inclination induces a bi-polar step-change 462
to the aerodynamic behaviors of the prism. A prescription of any degrees of α projects a notable 463

impact to the bottom half of the model, while the upper half remains unaffected. The impact 464
consists of drastically enhanced base RMS lift, elevated base Strouhal number, and here the 465
extended range of positive 𝜒(𝑧) . All of these suggest a universal tenet: the transverse 466
inclination intensifies fix-end aerodynamic phenomena like the horseshoe vortex, causing a 467
more erratic wind field near, and stronger loadings onto, the structure base. Yet, once the initial 468
perturbation, the degree of the intensification is influenced by neither the angle of inclination 469
nor the amplitude of tip vibration. The practical implications are that structural inclinations of 470
any orientation, as it easily changes with the wind attack angle, may cause unpredictable wind 471
environment at the pedestrian level, and demand more safety reinforcement near the build base. 472
Therefore, in addition to the existing observations in the literature, it is remarked that the Base 473
Intensification phenomenon will add another layer of complexity to the aerodynamics of 474
inclined structures. 475
476
Fig. 20 Local aerodynamic damping for transversely inclined structures

4.2 Response prediction 477
In this final section, based on the unsteady aerodynamic force obtained from the forced-478
vibration test, the response of the structure is predicted according to the frequency domain 479
method [12]. 480
𝑆𝑢(𝑤) = 𝑆𝐹𝑢(𝑤) ∙ 𝐻2(𝑤) (12)
𝐻2(𝑤) = {(1 − (𝑓𝑢 𝑓𝑠⁄ )2)2 + 4(𝜉𝑏 + 𝜉0)2(𝑓𝑢 𝑓𝑠⁄ )2}−1 (13)
where 𝑆𝑢(𝑤) is the displacement spectrum,𝑆𝐹𝑢(𝑤) is the force spectrum, 𝐻2(𝑤) is the 481
mechanical admittance, 𝜉𝑏 is the aerodynamic damping ratio identified by Eq. (11), 𝜉0 is the 482
structural damping ratio, and 𝑓𝑠 is the natural frequency (7.8Hz). 483
484
The predicted value of the standard tip response is obtained through the integration of Eq. 485
(14): 486
𝜎𝑦 = { 1𝐾𝑠 ∫ 𝑆𝑢(𝑤)𝑑𝑤∞0 }1/2
(14)
where 𝐾𝑠 is the model stiffness and 𝜎𝑦 is the tip response. 487

Fig. 21 Comparison between the predicted standard deviation of the test model tip
response and the measured values of the aeroelastic test
Fig. 21 shows the comparison between the predicted and measured response at different α’s. 488
As expected, the predicted responses by forced-vibration and rigid tests increase with wind 489
speed, generally matching the trend of the experimental result. Nevertheless, notable 490
differences can be found in the predicted and experimental responses. For the vertical case, 491
both predictions closely match the measured response, except the forced-vibration response is 492
almost exact in the lock-in region and overestimates at high wind speeds. Compared to the 493
underestimating rigid test, the forced-vibration provides more adequate predictions for 494
structural safety. With inclination, the forced-vibration prediction generally outperforms the 495
rigid prediction by tallying smaller differences with the experimental value. In specific cases, 496
such as at 𝑉𝑟 = 20 and α = 20° and 30°, the forced-vibration prediction outperforms the rigid 497
one by as much as 28.9% and 27.2%. This is because the rigid prediction completely ignores 498
the fluid-structure interaction. On this note, even the forced-vibration prediction universally 499
underestimates the actual response, especially in the lock-in region. The primary cause is that 500

the forced-vibration experiment considers only the one-way fluid-structure interaction by 501
ignoring the flow-induced motion. To provide better predictions, future effort must rely on the 502
results from a free-vibration, fully aeroelastic test. 503
504
5.Conclusion 505
In this work, unsteady aerodynamic characteristic of a transversely inclined square prisms were 506
investigated using the forced-vibration technique, in which different wind speeds, inclination 507
angles, and oscillation amplitudes have been tested. Specifically, the configuration’s 508
aerodynamic loading, vortical activities, and aerodynamic damping have been analysis. 509
Subsequently, the predicted responses of the forced-vibration and rigid tests were compared 510
with empirical values. 511
512
The central finding of this work is the discovery of the Base Intensification phenomenon. It 513
refers to the intensification of the aerodynamic loading, vortical activities, and aerodynamic 514
damping of the lower half of a structure when subjected to transverse inclination. The 515
phenomenon is incurred by any prescription of transverse inclination at any degree. Yet, 516
interestingly, once incurred, it does not intensify nor deteriorate with the angle of inclination 517
and tip vibration amplitude. This bi-polar step-change is associated with the promotion of fix-518
end effects like the horseshoe vortex shedding. The upper half of the structure, dominated by 519
the Bérnard-Kármán vortex shedding, is generally unaffected by transverse inclination. 520
521

Another major finding is that the wind speed is the most dominant mechanism of the 522
aerodynamic behaviors of the configuration. In the lock-in region, the crosswind vibrations, 523
including the Base Intensification phenomenon, are significantly amplified. With a continuous 524
increase of wind speed, the configuration gradually resorts to the quasi-steady linear behavior. 525
526
Based on empirical results, the response of the inclined model is predicted by the force-527
vibration and rigid test. The force-vibration offers a great improvement to the prediction based 528
on the rigid test. However, since the former only considers the one-way fluid-structure 529
interaction, the prediction still tends to underestimate actual response, particularly inside the 530
lock-in region. 531
532
Finally, some engineering implications and future forecasts deserve a brief discussion. Due to 533
the Base Intensification phenomenon, the safety of inclined structures, regardless of inclination 534
orientation, demands more engineering caution. Potential perils like erratic pedestrian-level 535
winds and excessive aerodynamic load on structure base may take place given changes in the 536
wind attack angle. Moreover, future effort shall improve the response prediction by resorting 537
to the free-vibration tests, such that the safety of inclined structures may be better guaranteed 538
in the design stage. 539
540

Acknowledgement 541
The work described in this paper was supported by the National Natural Science Foundation 542
of China (Grant No.: 51908090), the Fundamental Research Funds for the Central Universities 543
(Project No.: 2019CDXYTM0032), the Natural Science Foundation of Chongqing, China 544
(Grant No.: cstc2019jcyj-msxm0639, cstc2020jcyj-msxmX0921), the Key project of 545
Technological Innovation and Application Development in Chongqing (Grant No.: 546
cstc2019jscx-gksb0188). The authors appreciate the use of the testing facility, as well as the 547
technical assistance provided by the CLP Power Wind/Wave Tunnel Facility at the Hong Kong 548
University of Science and Technology. The authors would also like to express our sincere 549
thanks to the Design and Manufacturing Services Facility (Electrical and Mechanical 550
Fabrication Unit) of the Hong Kong University of Science and Technology for their help in 551
manufacturing the test rig of the forced vibration wind tunnel test system. 552
553
554

Declaration 555
To be used for all articles, including articles with biological applications 556
557
Funding 558
The work described in this paper was supported by the National Natural Science Foundation 559
of China (Grant No.: 51908090), the Fundamental Research Funds for the Central Universities 560
(Project No.: 2019CDXYTM0032), the Natural Science Foundation of Chongqing, China 561
(Grant No.: cstc2019jcyj-msxm0639, cstc2020jcyj-msxmX0921), the Key project of 562
Technological Innovation and Application Development in Chongqing (Grant No.: 563
cstc2019jscx-gksb0188). 564
565
Conflict of Interest 566
The authors declare that they have no conflict of interest. 567
568
Availability of Data and Material 569
The datasets generated during and/or analyzed during the current work are restricted by 570
provisions of the funding source but are available from the corresponding author on reasonable 571
request. 572
573

Code Availability 574
The custom code used during and/or analyzed during the current work are restricted by 575
provisions of the funding source. 576
577
Author Contributions 578
All authors contributed to the study conception and design. Material preparation, data 579
collection and analysis were performed by Zengshun Chen, Jie Bai and Yemeng Xu, Jianmin 580
Hua, and Xuanyi Xue. The first draft of the manuscript was written by Cruz Y. Li and Jie Bai 581
and all authors commented on previous versions of the manuscript. All authors read and 582
approved the final manuscript. 583
584
Compliance with Ethical Standards 585
All procedures performed in this work were in accordance with the ethical standards of the 586
institutional and/or national research committee and with the 1964 Helsinki declaration and 587
its later amendments or comparable ethical standards. 588
589
Consent to Participate 590
Informed consent was obtained from all individual participants included in the study. 591
592
Consent for Publication 593
Publication consent was obtained from all individual participants included in the study. 594
Reference 595
1. Tanaka, H., Tamura, Y., Ohtake, K., Nakai, M., Chul Kim, Y.: Experimental 596
investigation of aerodynamic forces and wind pressures acting on tall buildings with various 597
unconventional configurations. J. Wind Eng. Ind. Aerodyn. 107–108, 179–191 (2012). 598
https://doi.org/10.1016/j.jweia.2012.04.014 599
2. Hui, Y., Yuan, K., Chen, Z., Yang, Q.: Characteristics of aerodynamic forces on high-600
rise buildings with various façade appurtenances. J. Wind Eng. Ind. Aerodyn. 191, 76–90 601
(2019). https://doi.org/10.1016/j.jweia.2019.06.002 602
3. Carassale, L., Freda, A., Marrè-Brunenghi, M.: Experimental investigation on the 603
aerodynamic behavior of square cylinders with rounded corners. J. Fluids Struct. 44, 195–204 604
(2014). https://doi.org/10.1016/j.jfluidstructs.2013.10.010 605
4. Hu, Gang, Tse, K.T., Kwok, K.C.S., Chen, Z.S.: Pressure measurements on inclined 606
square prisms. Wind Struct. 21, 383–405 (2015). 607
https://doi.org/10.12989/WAS.2015.21.4.383 608
5. Hu, G., Tse, K.T., Kwok, K.C.S.: Galloping of forward and backward inclined slender 609
square cylinders. J. Wind Eng. Ind. Aerodyn. 142, 232–245 (2015). 610
https://doi.org/10.1016/j.jweia.2015.04.010 611
6. Mannini, C., Marra, A.M., Bartoli, G.: Experimental investigation on VIV-galloping 612
interaction of a rectangular 3:2 cylinder. Meccanica. 50, 841–853 (2015). 613
https://doi.org/10.1007/s11012-014-0025-8 614
7. Chen, Z., Fu, X., Xu, Y., Li, C.Y., Kim, B., Tse, K.T.: A perspective on the 615
aerodynamics and aeroelasticity of tapering: Partial reattachment. J. Wind Eng. Ind. Aerodyn. 616
212, 104590 (2021). https://doi.org/10.1016/j.jweia.2021.104590 617
8. Cooper, K.R., Nakayama, M., Sasaki, Y., Fediw, A.A., Resende-Ide, S., Zan, S.J.: 618
Unsteady aerodynamic force measurements on a super-tall building with a tapered cross 619
section. J. Wind Eng. Ind. Aerodyn. 72, 199–212 (1997). https://doi.org/10.1016/S0167-620
6105(97)00258-4 621
9. Chen, Z., Tse, K.T., Kwok, K.C.S., Kareem, A.: Aerodynamic damping of inclined 622
slender prisms. J. Wind Eng. Ind. Aerodyn. 177, 79–91 (2018). 623
https://doi.org/10.1016/j.jweia.2018.04.016 624
10. Zou, L., Li, F., Song, J., Shi, T., Liang, S., Mercan, O.: Investigation of torsional 625
aeroelastic effects on high-rise buildings using forced vibration wind tunnel tests. J. Wind 626
Eng. Ind. Aerodyn. 200, 104158 (2020). https://doi.org/10.1016/j.jweia.2020.104158 627
11. Kim, Y.C., Lo, Y.L., Chang, C.H.: Characteristics of unsteady pressures on slender 628
tall building. J. Wind Eng. Ind. Aerodyn. 174, 344–357 (2018). 629
https://doi.org/10.1016/j.jweia.2018.01.027 630

12. Chen, Z., Huang, H., Tse, K.T., Xu, Y., Li, C.Y.: Characteristics of unsteady 631
aerodynamic forces on an aeroelastic prism: A comparative study. J. Wind Eng. Ind. 632
Aerodyn. 205, 104325 (2020). https://doi.org/10.1016/j.jweia.2020.104325 633
13. Chen, Z., Tse, K.T., Kwok, K.C.S., Kareem, A., Kim, B.: Measurement of unsteady 634
aerodynamic force on a galloping prism in a turbulent flow: A hybrid aeroelastic-pressure 635
balance. J. Fluids Struct. 102, 103232 (2021). 636
https://doi.org/10.1016/j.jfluidstructs.2021.103232 637
14. Chen, Z., Tse, K.T., Kwok, K.C.S.: Unsteady pressure measurements on an 638
oscillating slender prism using a forced vibration technique. J. Wind Eng. Ind. Aerodyn. 170, 639
81–93 (2017). https://doi.org/10.1016/j.jweia.2017.08.004 640
15. Chen, Z., Tse, K.T., Hu, G., Kwok, K.C.S.: Experimental and theoretical 641
investigation of galloping of transversely inclined slender prisms. Nonlinear Dyn. 91, 1023–642
1040 (2018). https://doi.org/10.1007/s11071-017-3926-y 643
16. Holmes, J.D.: Wind Loading of Structures. CRC Press (2018) 644
17. Lin, N., Letchford, C., Tamura, Y., Liang, B., Nakamura, O.: Characteristics of wind 645
forces acting on tall buildings. J. Wind Eng. Ind. Aerodyn. 93, 217–242 (2005). 646
https://doi.org/10.1016/j.jweia.2004.12.001 647
18. Bearman, P.W., Obasaju, E.D.: An experimental study of pressure fluctuations on 648
fixed and oscillating square-section cylinders. J. Fluid Mech. 119, 297–321 (1982). 649
https://doi.org/10.1017/S0022112082001360 650
19. Kareem, A.: Measurements of pressure and force fields on building models in 651
simulated atmospheric flows. Sixth US Natl. Conf. Wind Eng. 36, 589–599 (1990). 652
https://doi.org/10.1016/0167-6105(90)90341-9 653
20. Kareem, A., Cermak, J.E.: Pressure fluctuations on a square building model in 654
boundary-layer flows. J. Wind Eng. Ind. Aerodyn. 16, 17–41 (1984). 655
https://doi.org/10.1016/0167-6105(84)90047-3 656
21. Chen, Z., Huang, H., Xu, Y., Tse, K.T., Kim, B., Wang, Y.: Unsteady aerodynamics 657
on a tapered prism under forced excitation. Eng. Struct. 240, 112387 (2021). 658
https://doi.org/10.1016/j.engstruct.2021.112387 659
22. Steckley, A., Vickery, B.J., Isyumov, N.: On the measurement of motion induced 660
forces on models in turbulent shear flow. J. Wind Eng. Ind. Aerodyn. 36, 339–350 (1990). 661
https://doi.org/10.1016/0167-6105(90)90318-7 662
23. Vickery, B.J., Steckley, A.: Aerodynamic damping and vortex excitation on an 663
oscillating prism in turbulent shear flow. J. Wind Eng. Ind. Aerodyn. 49, 121–140 (1993). 664
https://doi.org/10.1016/0167-6105(93)90009-D 665

24. Dai, H.L., Abdelmoula, H., Abdelkefi, A., Wang, L.: Towards control of cross-flow-666
induced vibrations based on energy harvesting. Nonlinear Dyn. 88, 2329–2346 (2017). 667
https://doi.org/10.1007/s11071-017-3380-x 668
25. Abdel-Rohman, M.: Effect of Unsteady Wind Flow on Galloping of Tall Prismatic 669
Structures. 22 670
26. Dai, H.L., Abdelkefi, A., Wang, L., Liu, W.B.: Control of cross-flow-induced 671
vibrations of square cylinders using linear and nonlinear delayed feedbacks. Nonlinear Dyn. 672
78, 907–919 (2014). https://doi.org/10.1007/s11071-014-1485-z 673
27. Chen, X.: Estimation of stochastic crosswind response of wind-excited tall buildings 674
with nonlinear aerodynamic damping. Eng. Struct. 56, 766–778 (2013). 675
https://doi.org/10.1016/j.engstruct.2013.05.044 676
677
678
679