update : eskom electricity supply · overview 1. we committed to report back to you in 10 – 14...
TRANSCRIPT

UPDATE : ESKOM ELECTRICITY SUPPLY
03 April 2019
1

Minister Opening Remarks
2
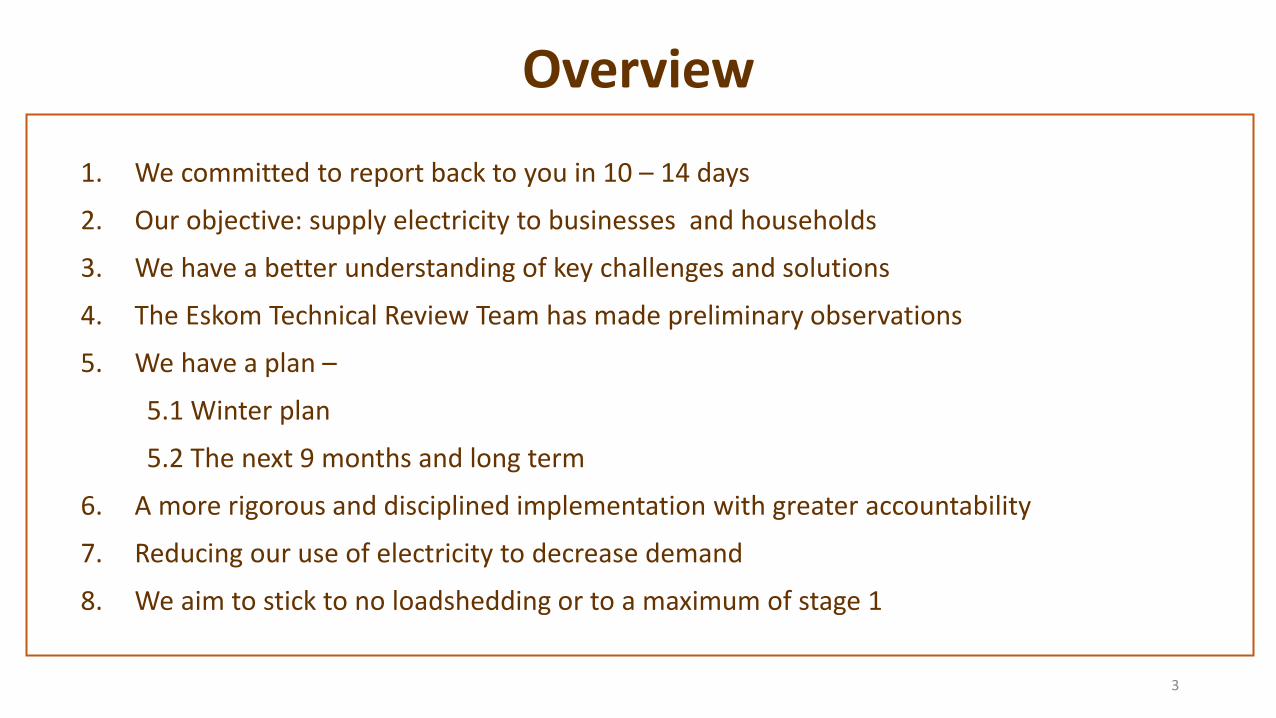
Overview
1. We committed to report back to you in 10 – 14 days
2. Our objective: supply electricity to businesses and households
3. We have a better understanding of key challenges and solutions
4. The Eskom Technical Review Team has made preliminary observations
5. We have a plan –
5.1 Winter plan
5.2 The next 9 months and long term
6. A more rigorous and disciplined implementation with greater accountability
7. Reducing our use of electricity to decrease demand
8. We aim to stick to no loadshedding or to a maximum of stage 1
3

Our Objectives
1. To be transparent and frank with South Africans
2. Ensure energy security
3. Impact positively on the economy: production in mines, factories, secure growth
4. Supply electricity to households and to minimise disruptions
5. Better understanding of root causes of breakdowns
6. Develop a reliable plan and urgent execution
4

Update on issues from previous briefing
1. Coal and coal quality
2. Diesel
3. Faster Procurement
4. People and skills
5. Restructuring
6. Unions, job losses and privatisation (security of jobs…)
7. Finance issues
8. New Build Status (Medupi and Kusile)
5

6
Eskom System Update

Eskom Generation Capacity
Installed Dispatchable Generation (MW)
Eskom Coal 36 479 MW
Eskom Nuclear 1 860 MW
Eskom Hydro 3 324 MW
Eskom OCGT + GT 2 409 MW
International Imports 1 500 MW
IPP OCGT 1 005 MW
Total 46 577 MW
7

Eskom Transmission Grid and Demand Distribution
10 900
1 132
2 367
6 630
2 260
4 710
3 805
714
3 095
Transmission lines km
765 kV 2 784 km
533 kV HVDC 1 035 km
400 kV 19 421 km
275 kV 7 218 km
220 kV 1 351 km
132 kV 889 km
Total 32 698 km
Substation assets
Number of substations 167
Transformer capacity (≥ 30 MVA)
152 415 MVA
Number of transformers 444
8

Eskom grid superimposed on Europe shows that Eskom grid spans 5 European countries
9

What led to loadshedding? Thurs 14th to Sat 23rd March 2019
Loadshedding was implemented up to Stage 4 as a result of:
• High plant failures -UCLF (up to 13 000 MW) ~ normally under 10 000MW
• 16 boiler tube leaks in 10 days ~ normally 10 to 13 per month
• Depleted diesel levels and low water levels in Eskom hydro
• Loss of Cahora Bassa imports due to cyclone IDAI (1200MW lost)
Loadshedding stopped on Saturday 23 March 2019 when
• When UCLF was reduced to 11 000MW
• Diesel tanks and water levels were replenished
• 800MW of Cahora Bassa recovered
Protection of the system
• Loadshedding is a last resort lever to protect the network 10

11
Eskom’s Plan

Overall objective for Winter (next 5 months)
• Improve the Energy Availability factor
• Stop/Minimise loadshedding (limit to stage 1)
• Execute proper maintenance to reduce plant breakdowns
• Encourage public participation and energy saving initiatives
• Ensure effective and regular communication with all stakeholders
12

Scenarios for Winter 2019
• Scenario 1 - No loadshedding
Less than 9 500MW Unplanned Outages
And 3 000MW to 5 000MW planned Outages
• Scenario 2 (Max of 26 Days of Stage 1 loadshedding) Above 9 500 MW And 3000MW to 5000 MW planned Outages
13
Further briefing on Progress plan in September 2019

Initiatives to achieve scenario 1 (Max 9 500 MW)
1. Increasing supply
• Kriel Unit 2 (475 MW), 18 Apr
• Matla Unit 5 (575 MW), 13 May
• Non-commercials: Medupi 2 and Kusile 2 (1200 MW)
• Effort to bring Kusile 3
• Diesel supply measures: Money approved and released on time
2. Improved plant performance as a result of cooler weather
3. Cahora Bassa imports back at full load (additional 300 MW)
14

Eskom was able to meet demand on 2 April with existing capacity
Installed Dispatchable Generation (MW)
Eskom Coal 36 479 MW Eskom Nuclear 1 860 MW Eskom Hydro 3 324 MW Eskom OCGT + GT 2 409 MW International Imports 1 500 MW IPP OCGT 1 005 MW Total 46 577 MW
Residual Demand breakdown (MW) during evening peak on 02 Apr 2019
Eskom Coal (1669 MW from non-commercial units)
24 273 MW
Eskom Nuclear 1 845 MW Eskom Hydro 1 716 MW Eskom OCGT + GT 546 MW International Imports 1 009 MW IPP OCGT 0 MW Virtual Power Station 409 MW Total 29 798 MW
8500 MW unplanned maintenance
15

Overall objective up to December 2019
• Improve the Energy Availability factor
• Every effort to stop loadshedding
• In the event unanticipated events occur, limit to stage 1
• Continue with rigorous maintenance to reduce plant breakdowns
• Encourage public participation in energy saving initiatives
• Ensure effective and regular communication with all stakeholders
16
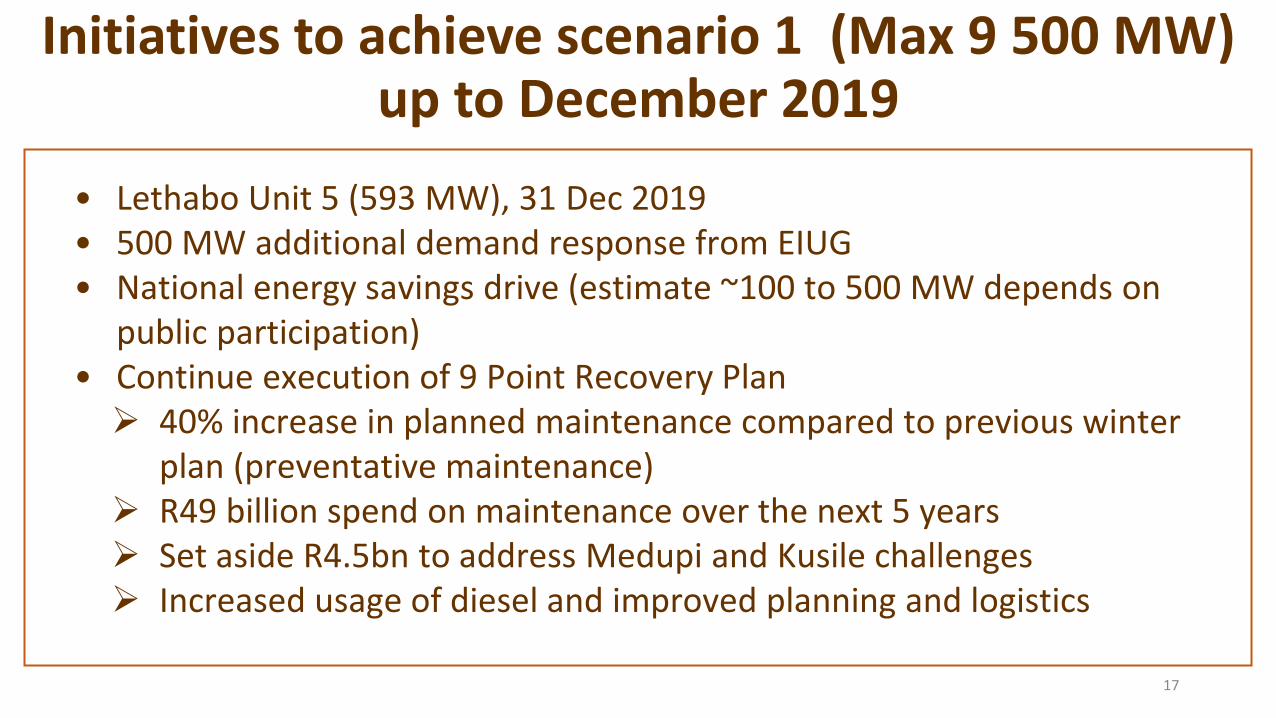
Initiatives to achieve scenario 1 (Max 9 500 MW) up to December 2019
17
• Lethabo Unit 5 (593 MW), 31 Dec 2019 • 500 MW additional demand response from EIUG • National energy savings drive (estimate ~100 to 500 MW depends on
public participation) • Continue execution of 9 Point Recovery Plan 40% increase in planned maintenance compared to previous winter
plan (preventative maintenance) R49 billion spend on maintenance over the next 5 years Set aside R4.5bn to address Medupi and Kusile challenges Increased usage of diesel and improved planning and logistics
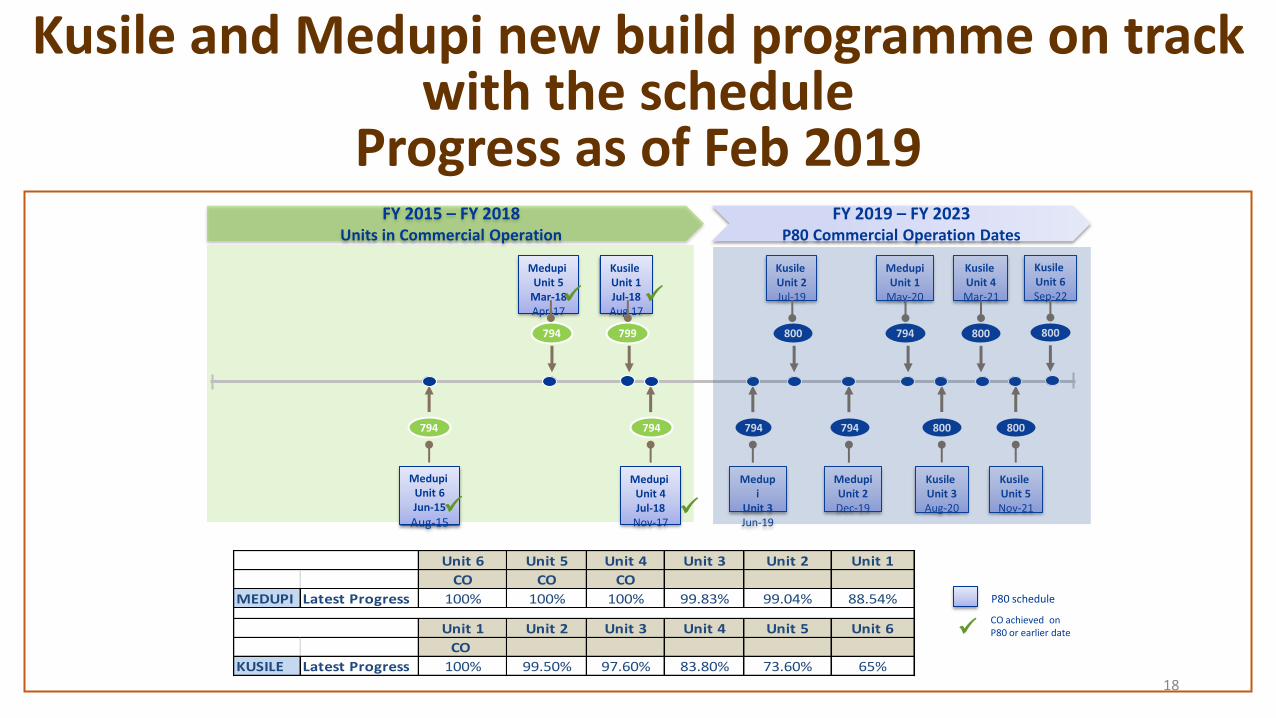
Kusile and Medupi: Latest Construction Progress as of Feb 2019
P80 schedule
CO achieved on P80 or earlier date
FY 2015 – FY 2018 Units in Commercial Operation
Medupi Unit 5
Mar-18 Apr-17
794
Kusile Unit 1 Jul-18 Aug 17
799
Kusile Unit 2 Jul-19
800
Medupi Unit 4 Jul-18
Nov-17
794
Medupi
Unit 3 Jun-19
794
Medupi Unit 2 Dec-19
794
Medupi Unit 1
May-20
794
Medupi Unit 6 Jun-15
Aug-15
794
Kusile Unit 4
Mar-21
800
Kusile Unit 3 Aug-20
800
Kusile Unit 5 Nov-21
800
FY 2019 – FY 2023 P80 Commercial Operation Dates
Kusile Unit 6 Sep-22
800
Unit 6 Unit 5 Unit 4 Unit 3 Unit 2 Unit 1
CO CO CO
MEDUPI Latest Progress 100% 100% 100% 99.83% 99.04% 88.54%
Unit 1 Unit 2 Unit 3 Unit 4 Unit 5 Unit 6
CO
KUSILE Latest Progress 100% 99.50% 97.60% 83.80% 73.60% 65%
Kusile and Medupi new build programme on track with the schedule
Progress as of Feb 2019
18

Initial briefing from Eskom Technical Review Team
19

1. Generation Capability
• Place strong leadership at all key positions
• Appoint permanent Power Station Mangers with full authority
• Fill critical positions
• Improve the root cause analysis capabilities and execute promptly
0
10
20
30
40
50
60
70
80
90
100
2005 2006 2007 2008 2009 2010 2011 2012 2013 2014 2015 2016 2017 2018 2019
Total Generation (% EAF)
EAF Plan
20

2. Plant Efficiencies • Strongly focus on overall process
optimization
• Review the Duvha 3 recommendations on boiler oxygen levels without compromising safety
• Track partial load losses with daily targets based on each stations capabilities
• Create and manage daily leading indicators dashboard
21
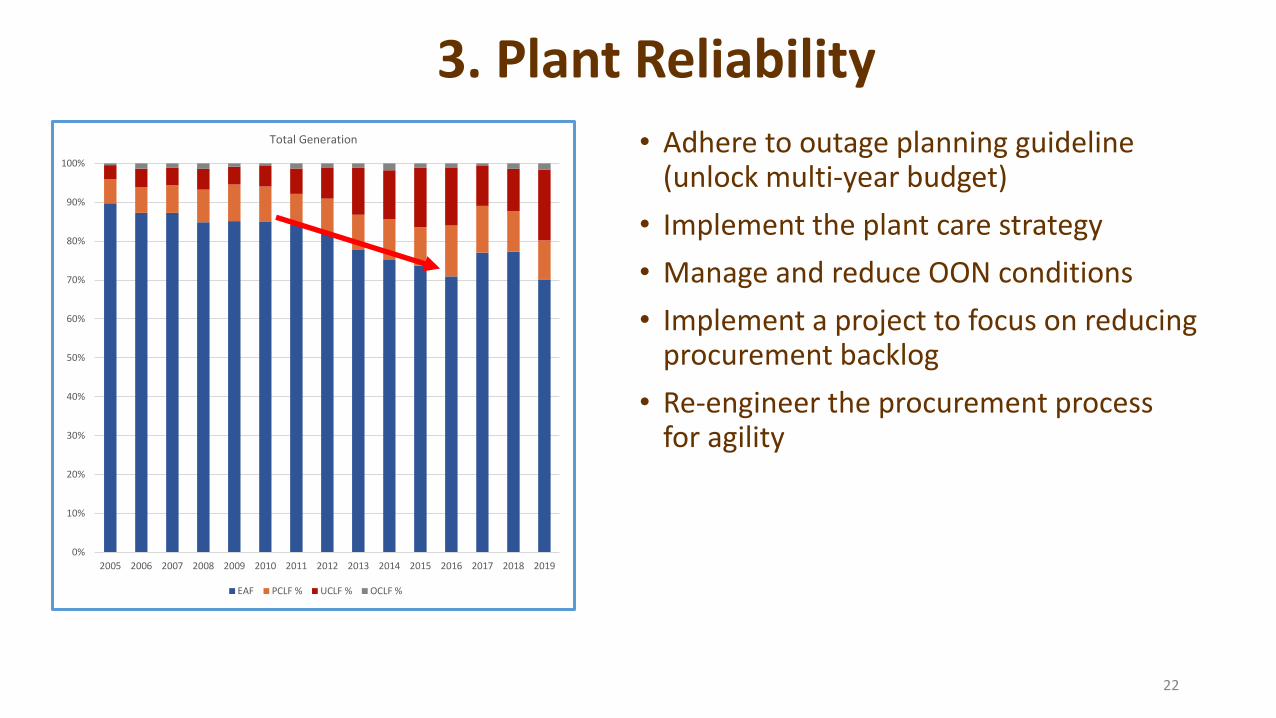
3. Plant Reliability
• Adhere to outage planning guideline (unlock multi-year budget)
• Implement the plant care strategy
• Manage and reduce OON conditions
• Implement a project to focus on reducing procurement backlog
• Re-engineer the procurement process for agility
0%
10%
20%
30%
40%
50%
60%
70%
80%
90%
100%
2005 2006 2007 2008 2009 2010 2011 2012 2013 2014 2015 2016 2017 2018 2019
Total Generation
EAF PCLF % UCLF % OCLF %
22

4. New Build
• Update maintenance strategies for the milling plant and fabric filter plant
• Put in place appropriate maintenance contracts for all plant
• Improve optimization of all boilers and turbines
System Defect Medupi Kusile
High Flue Gas Exit
Temperatures
Boiler design results in high temperatures at
superheater and reheater tube sections. Cooling water
system unable to cope in certain conditions. This
situation can result in unit trips.
✔ ✔
Boiler Erosion Excessive erosion in the boiler, which manifests mainly
in reheater 1 ✔ ✔
Gas Air Heater High temperature gradients leading to fouling. Also
problems with erosion and ash carry over to the clean
air side ✔ ✔
Milling Plant Require more frequent servicing, sensitive to coal
quality. This contributes to load losses and can also lead
to unit trips in severe cases. ✔ ✔
Pulsed Jet Fabric Filter
system
Design causes excessive wear of filter bags and ash
accumulation. This can lead to load losses (reduced
generation) and trips. ✔ ✔
Dust Handling Plant Excessive leaks, lack of spares, premature failure of
components, ash accumulation. This can also lead to
unit trips ✔ ✔
Distributed Control
System (DCS)
Units 6,5 and 4 control system – hardware failures.
Problems with the DCS system causes control
difficulties and unit trip in certain cases. ✔
Water Treatment Plant
Laboratory (WTPL) and
Demineralised Water
Storage Tanks (DWST)
Excessive settlement of the WTPL and DWST
foundations beyond allowable tolerances, resulting in
observable cracking of the WTPL walls ✔
23

We appeal to household to reduce electricity use – “Less is more − Live Lightly!”
24
• The power system remains vulnerable all day during summer
• Use air conditioning efficiently
o Set air conditioning to 23ºC
o Close windows and doors to optimise air conditioning
o Switch off 30 minutes before leaving the office
1. Switch off all geysers and pool pumps (all day until 9pm), and invest in a timer
2. If you use the pool frequently, limit pool filtering cycles to two cycles daily, and not between 5pm & 9pm
3. Switch off all non-essential lighting and appliances
During Earth Hour 30 March 2019, South Africans achieved 554 MW Savings!!
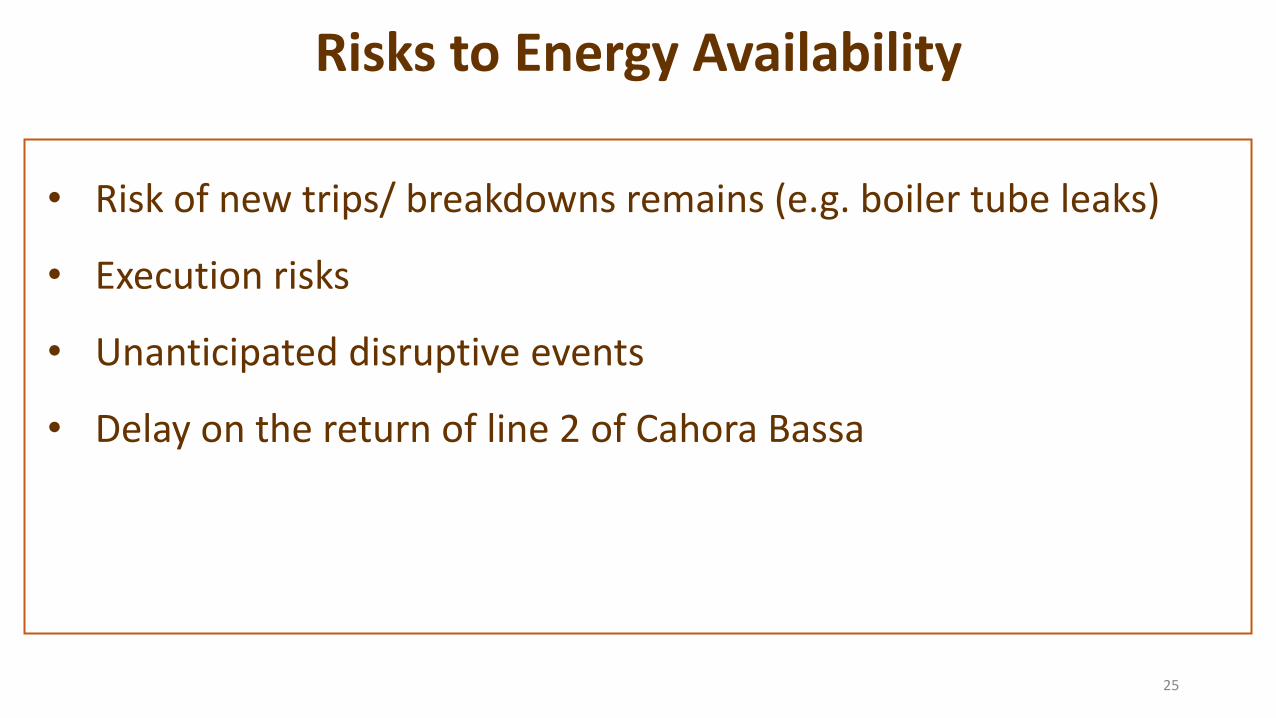
Risks to Energy Availability
• Risk of new trips/ breakdowns remains (e.g. boiler tube leaks)
• Execution risks
• Unanticipated disruptive events
• Delay on the return of line 2 of Cahora Bassa
25

END
26