update of life cycle analysis of lithium-ion batteries in
TRANSCRIPT

Update of Life Cycle Analysis of Lithium-ion Batteries in the
GREET Model
by
Q. Dai, J. Dunn, J. C. Kelly, and A. Elgowainy
Systems Assessment Group
Energy Systems Division
Argonne National Laboratory
September 2017

ii
iii
CONTENTS
ACRONYMS ................................................................................................................................. iv
1 LIB manufacturing .................................................................................................................. 6
2 NMC cathode material production ........................................................................................ 12
References ..................................................................................................................................... 17
FIGURES
Figure 1. Process Schematic for LIB Pack Manufacturing (Source: ANL 2017) .......................... 7
Figure 2 Process flow diagram for NCM production from hydrometallurgical recycling of spent
LIB ................................................................................................................................................ 14
TABLES
Table 1. Energy demand for LIB manufacturing (MJ/kWh battery produced) .............................. 9
Table 2. Changes to LIB manufacturing LCI in GREET ............................................................. 10
Table 3. LCIs for NMC precursors production ............................................................................. 15
Table 4. LCIs for NMC production .............................................................................................. 16
iv
ACRONYMS
CATARC China Automotive Technology and Research Center
CERC Clean Energy Research Center
CVC Clean Vehicle Consortium
LCA life cycle analysis
LCI life cycle inventory
LFP lithium iron phosphate
LIB lithium-ion battery
NMP N-Methyl-2-Pyrrolidone
NMC lithium nickel manganese cobalt oxide
ppmv part per million by volume

v
This page intentionally left blank.

6
Update of Life Cycle Analysis of Lithium-ion
Batteries in the GREET® Model
Qiang Dai, Jennifer Dunn, Jarod C. Kelly, and Amgad Elgowainy
Energy Systems Division
Argonne National Laboratory
September 2017
This memo documents updates for life cycle analysis of lithium-ion batteries (LIB) in the
GREET model. These updates were obtained through 1) our site visits to two LIB
manufacturing facilities and one LIB recycling facility in China; 2) Argonne’s latest modeling
effort by Ahmed et al to support efficient simulation, analysis, and design of advanced LIB
technologies. These updates therefore reflect the current status of lithium nickel manganese
cobalt oxide (NMC) cathode material production and LIB manufacturing, and will be
incorporated into GREET 2017.
1 LIB MANUFACTURING
Process energy demand for LIB manufacturing has been identified as an environmental
hotspot in previous battery life cycle analysis (LCA) studies (Kim et al 2016, Dunn et al 2015a,
and Ellingsen et al 2014). However, reported energy consumption for LIB manufacturing is
based on engineering calculations (Wood III et al 2015, Dunn et al 2014) or pilot-scale battery
manufacturing facilities (Ellingsen et al 2014), and therefore does not necessarily represent the
actual energy consumption of the LIB industry. Kim et al are the first to report the environmental
impacts of battery manufacturing at a commercial-scale facility. However, for proprietary
reasons, life cycle inventory (LCI) data for LIB manufacturing and assembly is not disclosed
(Kim et al 2016). Since greenhouse gas (GHG) and criteria air pollutant emissions are very
sensitive to the assumed electricity mix and upstream processes of fuels used for LIB production,
the results of Kim et al, which are based on national average electricity mix and natural gas
processing in South Korea, may not be representative of LIB manufacturing elsewhere in the
world.
LIB manufacturing is a complex process comprised of numerous sub-processes, as
depicted in Figure 1. Note that solvents are needed for the electrode material preparation process,
to make the electrode material a slurry for subsequent electrode coating. Currently, N-Methyl-2-
Pyrrolidone (NMP) is typically used for the positive electrode (hereinafter referred to as cathode)
materials, while water is typically used for the anode electrode (hereinafter referred to as anode)
materials (Wood III et al 2015). Due to cost and environmental concerns, NMP is usually
recovered after the solvent evaporation process and reused for future LIB production (Wood III
et al 2015). Also note that some of the electrode production processes, as well as the entire cell
assembly process, need to take place in a dry room, in which the moisture content of the air
cannot exceed 100 parts per million by volume (ppmv), to prevent LiPF6, the dominant
electrolyte salt, from detrimental reaction with water (Ahmed et al 2016a).

7
Figure 1. Process Schematic for LIB Pack Manufacturing (Source: ANL 2017)
8
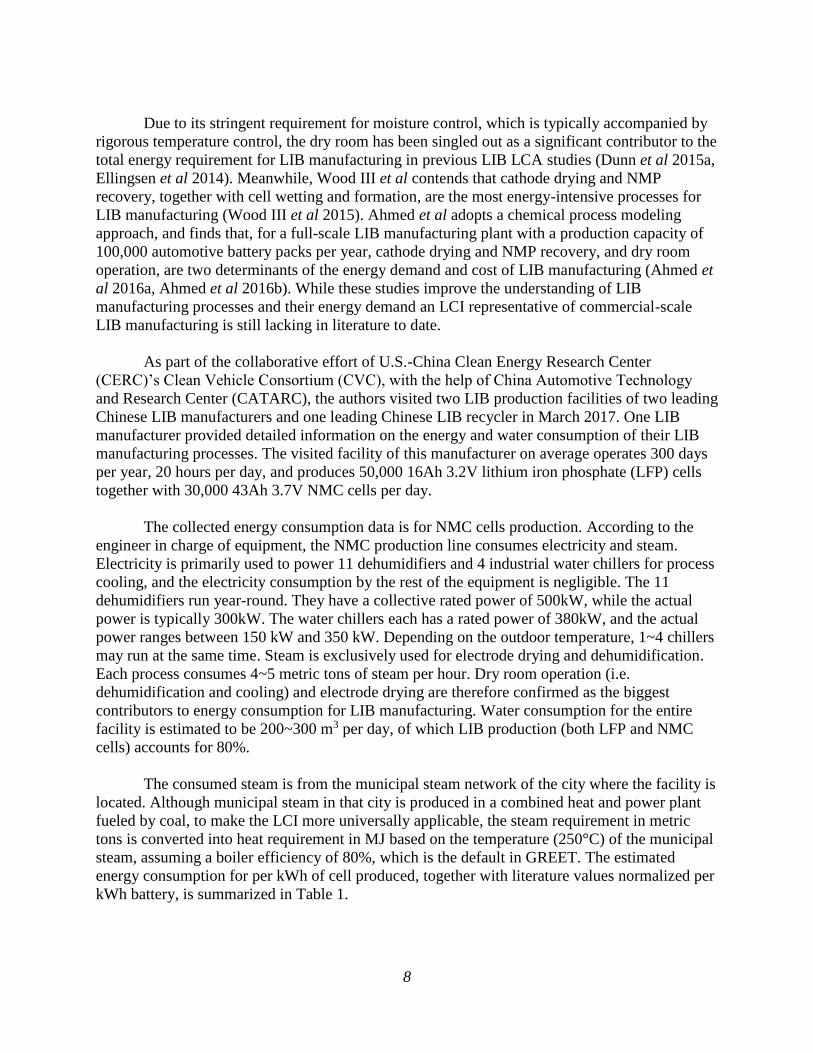
Due to its stringent requirement for moisture control, which is typically accompanied by
rigorous temperature control, the dry room has been singled out as a significant contributor to the
total energy requirement for LIB manufacturing in previous LIB LCA studies (Dunn et al 2015a,
Ellingsen et al 2014). Meanwhile, Wood III et al contends that cathode drying and NMP
recovery, together with cell wetting and formation, are the most energy-intensive processes for
LIB manufacturing (Wood III et al 2015). Ahmed et al adopts a chemical process modeling
approach, and finds that, for a full-scale LIB manufacturing plant with a production capacity of
100,000 automotive battery packs per year, cathode drying and NMP recovery, and dry room
operation, are two determinants of the energy demand and cost of LIB manufacturing (Ahmed et
al 2016a, Ahmed et al 2016b). While these studies improve the understanding of LIB
manufacturing processes and their energy demand an LCI representative of commercial-scale
LIB manufacturing is still lacking in literature to date.
As part of the collaborative effort of U.S.-China Clean Energy Research Center
(CERC)’s Clean Vehicle Consortium (CVC), with the help of China Automotive Technology
and Research Center (CATARC), the authors visited two LIB production facilities of two leading
Chinese LIB manufacturers and one leading Chinese LIB recycler in March 2017. One LIB
manufacturer provided detailed information on the energy and water consumption of their LIB
manufacturing processes. The visited facility of this manufacturer on average operates 300 days
per year, 20 hours per day, and produces 50,000 16Ah 3.2V lithium iron phosphate (LFP) cells
together with 30,000 43Ah 3.7V NMC cells per day.
The collected energy consumption data is for NMC cells production. According to the
engineer in charge of equipment, the NMC production line consumes electricity and steam.
Electricity is primarily used to power 11 dehumidifiers and 4 industrial water chillers for process
cooling, and the electricity consumption by the rest of the equipment is negligible. The 11
dehumidifiers run year-round. They have a collective rated power of 500kW, while the actual
power is typically 300kW. The water chillers each has a rated power of 380kW, and the actual
power ranges between 150 kW and 350 kW. Depending on the outdoor temperature, 1~4 chillers
may run at the same time. Steam is exclusively used for electrode drying and dehumidification.
Each process consumes 4~5 metric tons of steam per hour. Dry room operation (i.e.
dehumidification and cooling) and electrode drying are therefore confirmed as the biggest
contributors to energy consumption for LIB manufacturing. Water consumption for the entire
facility is estimated to be 200~300 m3 per day, of which LIB production (both LFP and NMC
cells) accounts for 80%.
The consumed steam is from the municipal steam network of the city where the facility is
located. Although municipal steam in that city is produced in a combined heat and power plant
fueled by coal, to make the LCI more universally applicable, the steam requirement in metric
tons is converted into heat requirement in MJ based on the temperature (250°C) of the municipal
steam, assuming a boiler efficiency of 80%, which is the default in GREET. The estimated
energy consumption for per kWh of cell produced, together with literature values normalized per
kWh battery, is summarized in Table 1.

9
Table 1. Energy demand for LIB manufacturing (MJ/kWh battery produced)
Ellingsen 2014 Wood 2015 Kim 2016 Ahmed 20164 This study
Plant capacity (per year) Pilot plant1 <1000 packs 1M cells
(0.06 GWh)
100,000 packs
(1 GWh)
12M cells2
(2 GWh)
Cell information 20Ah 3.65V 52Ah 3.5V 15Ah 3.7V N/A 43Ah 3.7V
Pack information 26.6 kWh N/A 24 kWh 10 kWh N/A
Total energy demand (MJ/kWh) 586~2318 1941 9903 175 119~168
Total energy demand by source (MJ/kWh)
Electricity demand 586~2318 1941 3403 59 7~26
Heat demand --- --- 6503 116 112~142
Total energy by use (MJ/kWh)
Dry room N/A N/A N/A 10 (2 NG, 8 elec.)a 63~96 (7~26 elec.,
56~71 steam)
Electrode drying
(and NMP recovery) N/A 1129 N/A
152 (114 NG, 38
elec.)b 56~71 (steam)
Cell formation and cycling N/A 812 N/A 13 (Elec.)c N/A
Pack assembly 0.01 N/A 103 (Elec.) N/A N/A
Data source
Battery
manufacturer
(Miljøbil Grenland)
Model
Battery
manufacturer
(LG Chem)
Model
Battery
manufacturing
facility visit 1. The capacity of the Miljøbil Grenland plant was not disclosed in the paper. However, Electrovaya, which acquired Miljøbil Grenland in 2012,
reported an annual revenue of $2.8 million US dollars for 2013 (Electrovaya 2013, Electrovaya 2012). The Miljøbil Grenland plant is therefore
estimated to be pilot-scale.
2. Estimated based on a rated capacity of 40,000 cells per day. The plant operates 300 days per year.
3. Estimated based on reported primary energy consumptions and GHG emissions, with GREET GHG emission factors.
NG is short for natural gas. Elec. is short for electricity.
4. Includes Ahmed et al 2016a, Ahmed et al 2016b, and Ahmed et al 2016c. Superscripts a, b, and c represent separate Ahmed publications.

10
Specific energy consumption was not available for cell formation and charging, nor for
pack assembly from the site visits. For cell formation and cycling, although the battery
manufacturers were not willing to disclose the temperature and duration for their cell formation
process, they provided us the number of charge-discharge cycles they used. One manufacturer
uses 1.5 cycles (charge-discharge-charge), and the other uses 2.5 cycles. Both manufacturers
claim that they reuse electricity from discharge, which makes sense considering their scale of
production, rated at 2 GWh/year for both of them. Therefore, the energy consumption for cell
formation and cycling can be estimated as the amount of electricity needed to charge the battery
once, plus the amount of electricity to make up for discharge loss. Assuming a charging
efficiency of 90%, and a discharge loss of 10%, the energy consumption for cell formation and
cycling is estimated to be 1.2kWh electricity/kWh cell produced. For pack assembly, we noticed
during our visits that it was done manually. Even if the process is automated in the future, to our
knowledge, there are no energy-intensive steps, such as cooling or drying, involved in pack
assembly. Therefore, it can be assumed that the energy consumption for pack assembly is
negligible compared with that for cell production. In other words, the same energy consumption
will be assumed for 1 kWh of battery cell produced and 1kWh of battery pack produced.
In conclusion, energy consumption for LIB manufacturing is estimated to be 170MJ/kWh
battery produced, of which 30 MJ is electricity, and the remaining 140 MJ is heat, assumed from
natural gas. Water consumption for LIB manufacturing is estimated to be 8.6 gallon/kWh battery
produced. Again, water consumption for pack assembly is assumed to be negligible. It should be
noted that in previous versions of our GREET model, environmental impacts for LIB are
calculated using one process energy intensity on a per mass basis (mmbtu/ton battery produced)
for all available LIB chemistries. Since cell production accounts for all of the process energy
demand, while pack configuration can substantially affect the specific energy of a battery pack,
which can skew the process energy intensity on a per mass basis, starting from GREET2017,
process energy intensity on a per kWh basis will be used for LIB environmental impacts
calculations. Although the data we collected represent NMC battery production, and we
understand that for a different cathode chemistry or even a different NMC cell configuration, the
electrode area could be different, and therefore the energy demand for electrode drying, we
contend that the process energy intensity on a per kWh basis will not change significantly across
different LIB chemistries, since energy use of the dry room depends on its size, regardless of its
throughput (Ahmed et al 2016a). In the absence of commercial-scale LIB production process
energy demand data for other chemistries, the same process energy intensity on a per kWh basis
will be used for all available LIB chemistries in GREET. Changes to be incorporated into
GREET 2017 are summarized in Table 2.
Table 2. Changes to LIB manufacturing LCI in GREET
GREET 2016 GREET 2017
Process energy consumption 0.450 mmbtu/ton battery* 0.161 mmbtu/kWh battery
Process energy share 49% NG, 51% electricity 82.4% NG, 17.6% electricity
Process water consumption N/A 8.6 gallon/kWh battery *Equivalent to 0.0025~0.006 mmbtu/kWh battery available in GREET, depending on battery pack specific energy.
11
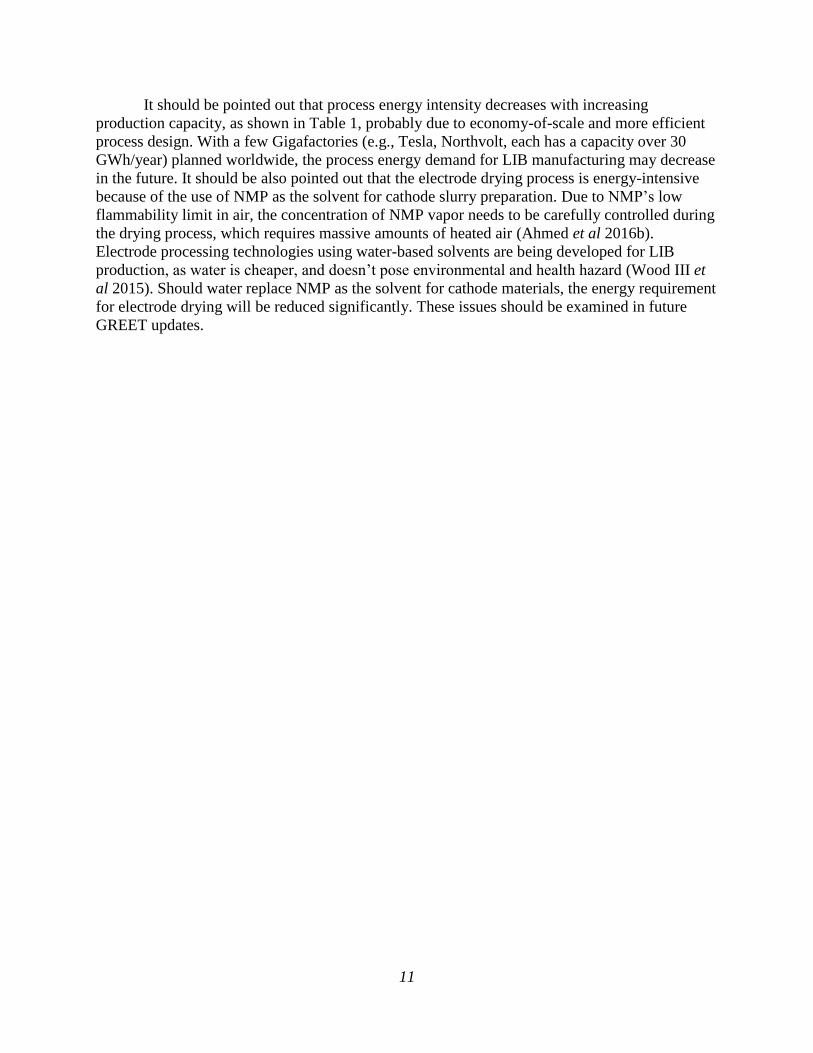
It should be pointed out that process energy intensity decreases with increasing
production capacity, as shown in Table 1, probably due to economy-of-scale and more efficient
process design. With a few Gigafactories (e.g., Tesla, Northvolt, each has a capacity over 30
GWh/year) planned worldwide, the process energy demand for LIB manufacturing may decrease
in the future. It should be also pointed out that the electrode drying process is energy-intensive
because of the use of NMP as the solvent for cathode slurry preparation. Due to NMP’s low
flammability limit in air, the concentration of NMP vapor needs to be carefully controlled during
the drying process, which requires massive amounts of heated air (Ahmed et al 2016b).
Electrode processing technologies using water-based solvents are being developed for LIB
production, as water is cheaper, and doesn’t pose environmental and health hazard (Wood III et
al 2015). Should water replace NMP as the solvent for cathode materials, the energy requirement
for electrode drying will be reduced significantly. These issues should be examined in future
GREET updates.
12
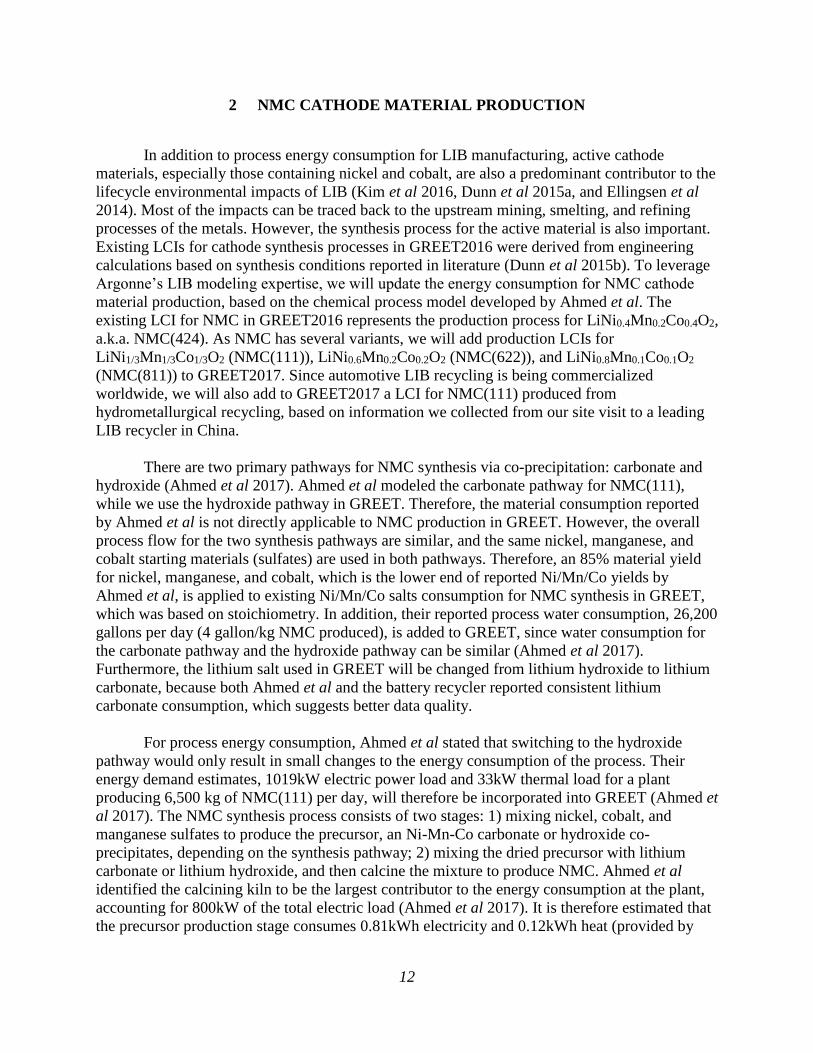
2 NMC CATHODE MATERIAL PRODUCTION
In addition to process energy consumption for LIB manufacturing, active cathode
materials, especially those containing nickel and cobalt, are also a predominant contributor to the
lifecycle environmental impacts of LIB (Kim et al 2016, Dunn et al 2015a, and Ellingsen et al
2014). Most of the impacts can be traced back to the upstream mining, smelting, and refining
processes of the metals. However, the synthesis process for the active material is also important.
Existing LCIs for cathode synthesis processes in GREET2016 were derived from engineering
calculations based on synthesis conditions reported in literature (Dunn et al 2015b). To leverage
Argonne’s LIB modeling expertise, we will update the energy consumption for NMC cathode
material production, based on the chemical process model developed by Ahmed et al. The
existing LCI for NMC in GREET2016 represents the production process for LiNi0.4Mn0.2Co0.4O2,
a.k.a. NMC(424). As NMC has several variants, we will add production LCIs for
LiNi1/3Mn1/3Co1/3O2 (NMC(111)), LiNi0.6Mn0.2Co0.2O2 (NMC(622)), and LiNi0.8Mn0.1Co0.1O2
(NMC(811)) to GREET2017. Since automotive LIB recycling is being commercialized
worldwide, we will also add to GREET2017 a LCI for NMC(111) produced from
hydrometallurgical recycling, based on information we collected from our site visit to a leading
LIB recycler in China.
There are two primary pathways for NMC synthesis via co-precipitation: carbonate and
hydroxide (Ahmed et al 2017). Ahmed et al modeled the carbonate pathway for NMC(111),
while we use the hydroxide pathway in GREET. Therefore, the material consumption reported
by Ahmed et al is not directly applicable to NMC production in GREET. However, the overall
process flow for the two synthesis pathways are similar, and the same nickel, manganese, and
cobalt starting materials (sulfates) are used in both pathways. Therefore, an 85% material yield
for nickel, manganese, and cobalt, which is the lower end of reported Ni/Mn/Co yields by
Ahmed et al, is applied to existing Ni/Mn/Co salts consumption for NMC synthesis in GREET,
which was based on stoichiometry. In addition, their reported process water consumption, 26,200
gallons per day (4 gallon/kg NMC produced), is added to GREET, since water consumption for
the carbonate pathway and the hydroxide pathway can be similar (Ahmed et al 2017).
Furthermore, the lithium salt used in GREET will be changed from lithium hydroxide to lithium
carbonate, because both Ahmed et al and the battery recycler reported consistent lithium
carbonate consumption, which suggests better data quality.
For process energy consumption, Ahmed et al stated that switching to the hydroxide
pathway would only result in small changes to the energy consumption of the process. Their
energy demand estimates, 1019kW electric power load and 33kW thermal load for a plant
producing 6,500 kg of NMC(111) per day, will therefore be incorporated into GREET (Ahmed et
al 2017). The NMC synthesis process consists of two stages: 1) mixing nickel, cobalt, and
manganese sulfates to produce the precursor, an Ni-Mn-Co carbonate or hydroxide co-
precipitates, depending on the synthesis pathway; 2) mixing the dried precursor with lithium
carbonate or lithium hydroxide, and then calcine the mixture to produce NMC. Ahmed et al
identified the calcining kiln to be the largest contributor to the energy consumption at the plant,
accounting for 800kW of the total electric load (Ahmed et al 2017). It is therefore estimated that
the precursor production stage consumes 0.81kWh electricity and 0.12kWh heat (provided by
13
natural gas, assuming an 80% boiler efficiency) per kg of NMC produced, and the calcination
stage consumes 2.95kWh electricity per kg of NMC produced.
For other NMC variants, material consumptions are estimated based on stoichiometry,
adjusted by the 85% material yield for Ni/Mn/Co salts. Since our preliminary calculations
showed that changes in Ni/Mn/Co composition in NMC would not lead to significant changes in
process energy demand or water use, the same energy consumption will be used for all NMC
variants, so is the same water consumption.
The Chinese battery recycler we visited recovers Ni, Mn, and Co from spent LIB
batteries, and produces NMC precursor from these recovered materials. For the produced NMC
precursor, they either supply it to other battery material manufacturers, or ship it to another
facility of theirs to produce NMC cathode material. The overall process for NMC production
from hydrometallurgical recycling of spent LIB is depicted in Figure 2. No specific material and
energy consumption data were provided by the recycler during our site visit. However, they
referred us to a paper they published, which contains LCI information for their process (Xie et al
2015). In their paper, they point out that calcination is the most energy-intensive process,
because it takes place in a pusher furnace, which consumes substantial amounts of electricity.
Overall, for 1 kg of NMC produced, processes starting from LIB disassembly up to solvent
extraction consume 0.12kWh electricity, co-precipitation consumes 0.07kWh electricity, and
calcination consumes 7.6kWh electricity. All processes collectively consume 0.93m3 natural
gas/kg NMC produced (Xie et al 2015).
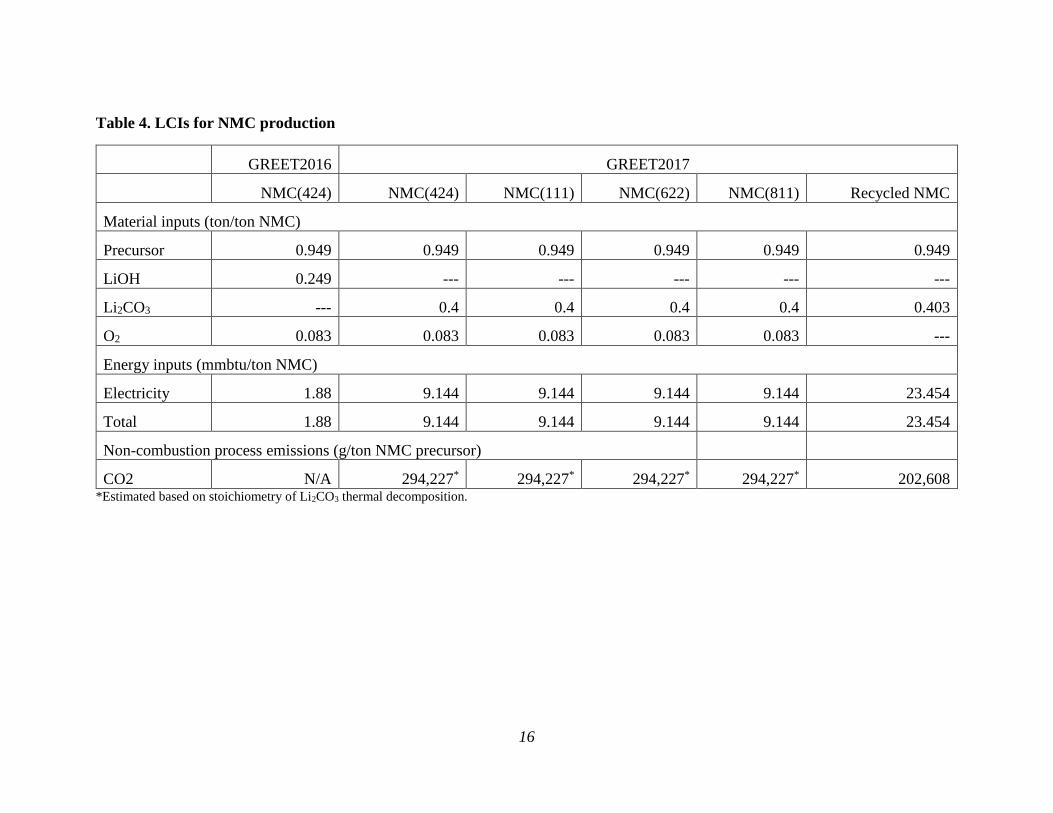
The LCIs for NMC precursors production are summarized in Table 3, and the LCIs for
NMC production are summarized in Table 4. Note that the LCIs for precursors production are
normalized to per ton of precursor produced. Also note that process water consumption is all
attributed to precursor production, since the calcination process does not use water. In addition,
natural gas use is also attributed to precursor production, since the calcination process is powered
by electricity.

14
Figure 2 Process flow diagram for NCM production from hydrometallurgical recycling of
spent LIB
Spent LIB
collection
Second life Disassemble
Casing, electronic components
Crushing
Gas (separator, electrolytes)
Physical separation
Leaching
Solvent extraction
H2SO4, H2O2
P507
Precipitation NaOH, NH4OH
Li2CO3 Calcining
Steel, Al, Cu, solid waste (graphite)
Solid waste (binder, carbon black)
NCM
Gas (CO2)
P507
NH4OH
Wastewater
Battery core, cylindrical cells
Cathode materials
NCM (OH) 2
Battery recycling
Solid waste
Calcining @
ca 500°C

15
Table 3. LCIs for NMC precursors production
GREET2016 GREET2017
NMC(424) NMC(424) NMC(111) NMC(622) NMC(811) Recycled NMC*
Material inputs (ton/ton NMC precursor
NiSO4 0.678 0.798 0.663 1.187 1.577 ---
MnSO4 0.34 0.4 0.664 0.396 0.197 ---
CoSO4 0.662 0.779 0.647 0.386 0.192 ---
NaOH 0.877 0.877 0.874 0.869 0.866 1.971
NH4OH 0.081 0.081 0.081 0.081 0.081 0.110
H2SO4 --- --- --- --- --- 3.787
HCl --- --- --- --- --- 0.042
H2O2 --- --- --- --- --- 1.286
Na2CO3 --- --- --- --- --- 0.074
Process water use (gallon/ton NMC precursor)
--- 3,853 3,853 3,853 3,853 3,367
Energy inputs (mmbtu/ton NMC precursor)
Electricity 0.137 0.497 0.497 0.497 0.497 0.621
Natural gas 8.637 2.638 2.638 2.638 2.638 30.974
Total 8.774 3.135 3.135 3.135 3.135 31.595 *Kerosene and P507 use for solvent extraction is minimal and therefore not included.
16
Table 4. LCIs for NMC production
GREET2016 GREET2017
NMC(424) NMC(424) NMC(111) NMC(622) NMC(811) Recycled NMC
Material inputs (ton/ton NMC)
Precursor 0.949 0.949 0.949 0.949 0.949 0.949
LiOH 0.249 --- --- --- --- ---
Li2CO3 --- 0.4 0.4 0.4 0.4 0.403
O2 0.083 0.083 0.083 0.083 0.083 ---
Energy inputs (mmbtu/ton NMC)
Electricity 1.88 9.144 9.144 9.144 9.144 23.454
Total 1.88 9.144 9.144 9.144 9.144 23.454
Non-combustion process emissions (g/ton NMC precursor)
CO2 N/A 294,227* 294,227* 294,227* 294,227* 202,608 *Estimated based on stoichiometry of Li2CO3 thermal decomposition.

17
REFERENCES
Ahmed, S., Nelson, P.A., Gallagher, K.G., Susarla, N., Dees, D.W., 2017. Cost and energy
demand of producing nickel manganese cobalt cathode material for lithium ion batteries. Journal
of Power Sources 342, 733–740. doi:10.1016/j.jpowsour.2016.12.069
Ahmed, S., Nelson, P.A., Dees, D.W., 2016a. Study of a dry room in a battery manufacturing
plant using a process model. Journal of Power Sources 326, 490–497.
doi:10.1016/j.jpowsour.2016.06.107
Ahmed, S., Nelson, P.A., Gallagher, K.G., Dees, D.W., 2016b. Energy impact of cathode drying
and solvent recovery during lithium-ion battery manufacturing. Journal of Power Sources 322,
169–178. doi:10.1016/j.jpowsour.2016.04.102
Ahmed, S., Gallagher, K.G., Nelson, P.A., Susarla, N., Dees, D.W., 2016c. BatPaC model
development. 2016 DOE Vehicle Technologies Office Annual Merit Review and Peer
Evaluation Meeting, Washington DC, June 6-10, 2016
https://energy.gov/sites/prod/files/2016/06/f32/es228_ahmed_2016_o_web.pdf
ANL, 2017. BatPaC: A Lithium-Ion Battery Performance and Cost Model for Electric-Drive
Vehicles:
http://www.cse.anl.gov/batpac/
Dunn, J., Gaines, L., Kelly, J.C., James, C., Gallagher, K., 2015a. The significance of Li-ion
batteries in electric vehicle life-cycle energy and emissions and recycling’s role in its reduction.
Energy & Environmental Science 8, 158–168. doi:10.1039/C4EE03029J
Dunn, J., James, C., Gaines, L., Gallagher, K., Dai, Q., Kelly, J.C., 2015b. Material and Energy
Flows in the Production of Cathode and Anode Materials for Lithium Ion Batteries.
https://greet.es.anl.gov/publication-anode-cathode-liion
Dunn, J., Gaines, L., Barnes, M., Sullivan, J., Wang, M., 2014. Material and Energy Flows in the
Materials Production, Assembly, and End-of-Life Stages of the Automotive Lithium-Ion Battery
Life Cycle.
https://greet.es.anl.gov/publication-li-ion
Electrovaya, 2013. Electrovaya announces financing of $6.3 million and reports fourth quarter
FY2013 results.
http://www.electrovaya.com/pdf/PR/2013/PR20131230.pdf
Electrovaya, 2012. Electrovaya increases its ownership to 99.6% of the shares of Miljøbil
Grenland AS, an European Lithium Ion Battery Company.
http://www.electrovaya.com/pdf/PR/2012/PR20120913.pdf
18
Ellingsen, L.A.-W., Majeau-Bettez, G., Singh, B., Srivastava, A.K., Valøen, L.O., Strømman,
A.H., 2014. Life Cycle Assessment of a Lithium-Ion Battery Vehicle Pack. Journal of Industrial
Ecology 18, 113–124. doi:10.1111/jiec.12072
Kim, H.C., Wallington, T.J., Arsenault, R., Bae, C., Ahn, S., Lee, J., 2016. Cradle-to-Gate
Emissions from a Commercial Electric Vehicle Li-Ion Battery: A Comparative Analysis.
Environ. Sci. Technol. 50, 7715–7722. doi:10.1021/acs.est.6b00830
Wood III, D.L., Li, J., Daniel, C., 2015. Prospects for reducing the processing cost of lithium ion
batteries. Journal of Power Sources 275, 234–242. doi:10.1016/j.jpowsour.2014.11.019
Xie, Y.H., Yu, H.J., Ou, Y.N., Li, C.D., 2015. Environmental impact assessment of recycling
waste traction battery. Inorganic Chemicals Industry 47, 43-46. In Chinese