upstate comprehensive plan analysis - ten at the...
TRANSCRIPT
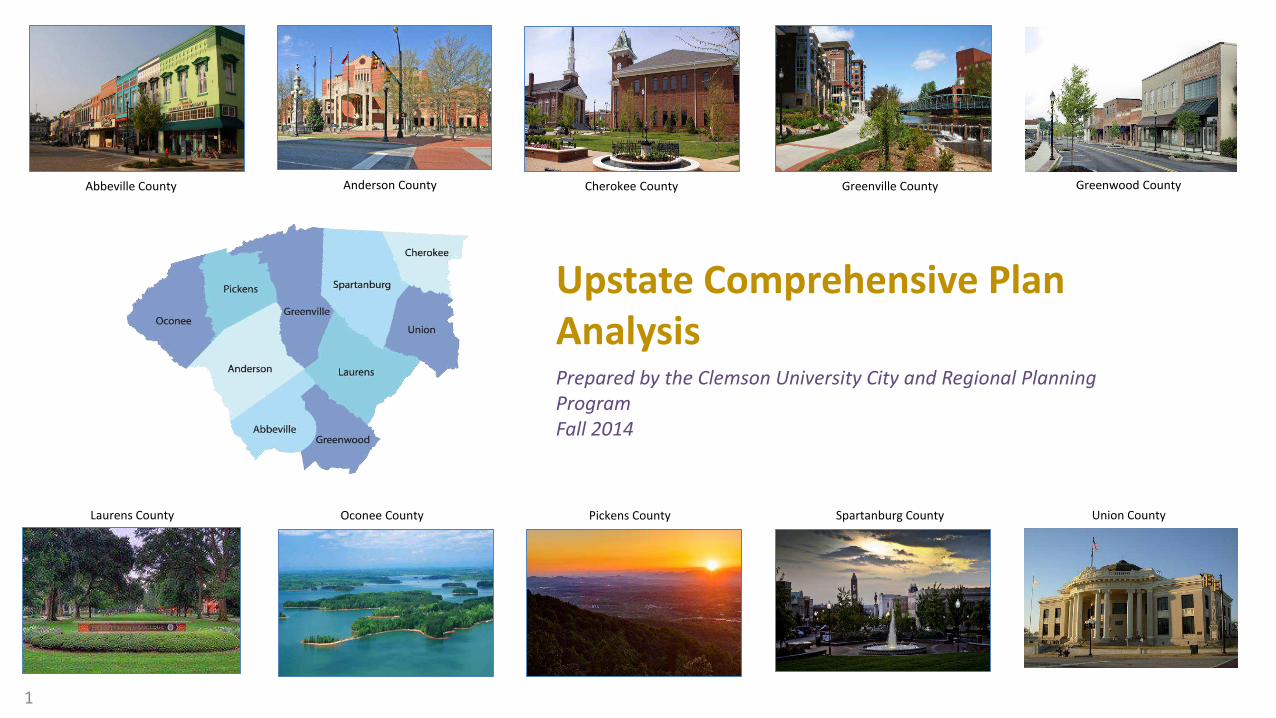
Upstate Comprehensive Plan
AnalysisPrepared by the Clemson University City and Regional Planning
Program
Fall 2014
Greenville County
Pickens CountyOconee County
Abbeville County Greenwood County
Union CountySpartanburg County
Cherokee CountyAnderson County
Laurens County
1
Table of Contents
I t odu tio …………………………………………………….What it Mea s to e the Upstate ……………..….Cou t “ apshots……………………………………………Co p ehe si e Pla A al sis a d Mat i ………Upstate Futu e La d Use……………………………….La d Co e Assess e t…………………………………Regio al “WOT A al sis………………………………..Co lusio s…………………………………………………..P oje t Li itatio s………………………………………..Futu e Resea h……………………………………………Appe di ………………………………………………………
2

IntroductionThe Cit a d Regio al Pla i g Maste ’s p og a at Cle so U i e sit is the o l p ofessio al graduate program accredited by the Planning Accreditation Board in South Carolina. It has produced more than 530 graduates since achieving full accreditation in 1973. With a stated focus on integrating both theory and practice into its curriculum, the program prepares students to engage the critical planning issues that face communities in the 21st century.
During their tenure at Clemson, students apply theoretical knowledge to local issues through projects that integrate both Geographic Information Systems (GIS) technology and fieldwork. Students further engage the Upstate planning context through public assistantships at local agencies and participation in events sponsored by the South Carolina chapter of the American Planning Association. The project team consists of 6 second- ea Maste ’s a didates ith a range of professional backgrounds including Anthropology, Psychology, Public Policy, and Computer Science.
The u e t p oje t is a a al sis of ea h of the te ou t ’s o p ehe si e pla s to highlight regional trends. Although it does not include content of additional planning documents within each county, it can be used in conjunction with those documents as a tool to promote regional o e satio a out o o issues. This stud ’s o lusio s a e li ited the fa t that its
findings are based on comprehensive plans that were written at different points in time, opening up the possibility that some of the plans no longer reflect the reality of their communities. In addition, the study is limited by the fact that one county does not have a comprehensive plan and several counties were unable to provide future land use data.
Nevertheless, we hope this will be a useful product for Ten at the Top and Upstate planners to foster discussion of issues that affect the region as a whole. It is the first effort of its kind to compile data from the Upstate counties and analyze them from a regional perspective.
3
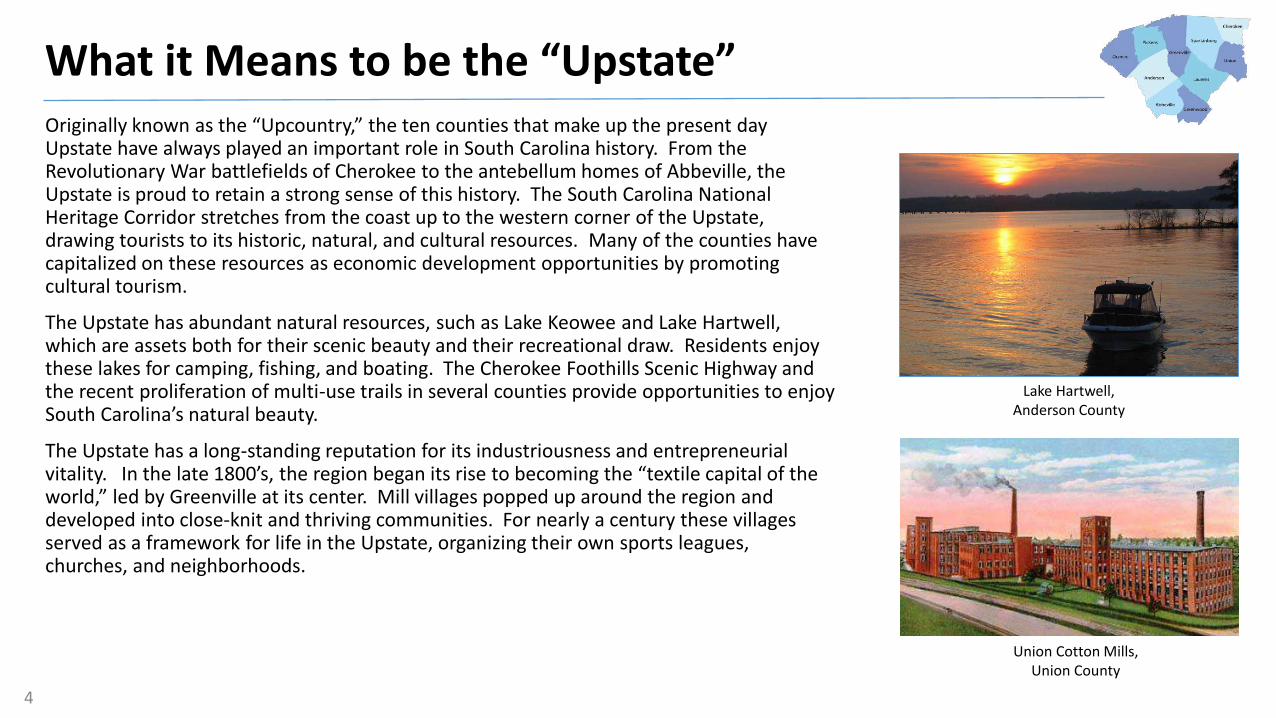
What it Means to be the UpstateO igi all k o as the Up ou t , the te ou ties that ake up the p ese t da Upstate have always played an important role in South Carolina history. From the Revolutionary War battlefields of Cherokee to the antebellum homes of Abbeville, the Upstate is proud to retain a strong sense of this history. The South Carolina National Heritage Corridor stretches from the coast up to the western corner of the Upstate, drawing tourists to its historic, natural, and cultural resources. Many of the counties have capitalized on these resources as economic development opportunities by promoting cultural tourism.
The Upstate has abundant natural resources, such as Lake Keowee and Lake Hartwell, which are assets both for their scenic beauty and their recreational draw. Residents enjoy these lakes for camping, fishing, and boating. The Cherokee Foothills Scenic Highway and the recent proliferation of multi-use trails in several counties provide opportunities to enjoy “outh Ca oli a’s atu al eaut .
The Upstate has a long-standing reputation for its industriousness and entrepreneurial italit . I the late ’s, the egio ega its ise to e o i g the te tile apital of the o ld, led G ee ille at its e te . Mill illages popped up a ou d the egio a d
developed into close-knit and thriving communities. For nearly a century these villages served as a framework for life in the Upstate, organizing their own sports leagues, churches, and neighborhoods.
Lake Hartwell,
Anderson County
Union Cotton Mills,
Union County
4

As economic realities and technology have changed around the country, the Upstate has shown resilience in its ability to adapt. With the influx of international companies such as Robert Bosch in Anderson and BMW in Spartanburg, the Upstate has successfully re-invented itself with a focus on high-tech manufacturing and research. In addition to reviving the economy of the Upstate, these companies have enriched its culture by bringing thousands of international employees to live and work in the region. They have added their own traditions to those that South Carolinians have always celebrated, resulting in a more diverse set of cultural offerings in the Upstate.
Given the strength of its economy and its location along the growth corridor of Interstate 85, the Upstate is poised for continued development in the coming decades. Recently completed projects like the inland port will ensure that the Upstate remains competitive moving forward.
Since the formation of Ten at the Top in 2010, the unique counties and municipalities of the Upstate have begun a renewed effort to share information and ideas to address multi-jurisdictional issues such as the transportation network, air quality, and economic development of the ten upstate counties. This ability to work together comes from an understanding that many of these issues affect the Upstate as a whole. Similarly, a positive change in one of the Upstate’s ou ties is a positive change for the other nine upstate counties.
An Upstate Ma o aptu ed this e spi it pe fe tl he he espo ded to eside ts’ i ui ies a out att a ti g thei it ’s o ase all tea sa i g, We al ead ha e o e, a d its a e is the G ee ille D i e.
What it Means to be the Upstate
Fluor Field,
Greenville County
BMW plant,
Spartanburg County
5

Greenwood should celebrate the opening of a new factory in Laurens. Cleaner air in Pickens means cleaner air in Oconee. This new wave of regional cooperation is a recognition of the interconnectedness of the ten counties. It does not mean that every issue ill ha e a lea o e-size-fits-all app oa h, ut it does ea that the e ti e Upstate benefits when each upstate county shares its point of view and seeks mutual gains with the others.
Ten at the Top has convened many meetings over the past several years to foster discussion among various stakeholders of the ten-county region. These conversations are centered on fi e d i e a eas, hi h ha e ee ide tified as i po ta t fo us a eas fo the Upstate. This project is an important step in continuing these conversations, as it is the first time a g oup of people has gathe ed all the Upstate’s o p ehe si e pla s a d ele a t data i one place to analyze them.
At its heart, the project has been designed to highlight trends and issues facing the Upstate,
based on comprehensive plans and GIS data. It begins with an inventory of each of the
ou t ’s o p ehe si e pla s, hi h is a o je ti e a to displa the t pes of p oje ts and policies that the community would like pursued. The inventory is a quick way to assess
the efforts being made across all ten counties, and what is unique to each county.
What it Means to be the Upstate
Presbyterian College,
Laurens County
Clemson University,
Pickens County
6
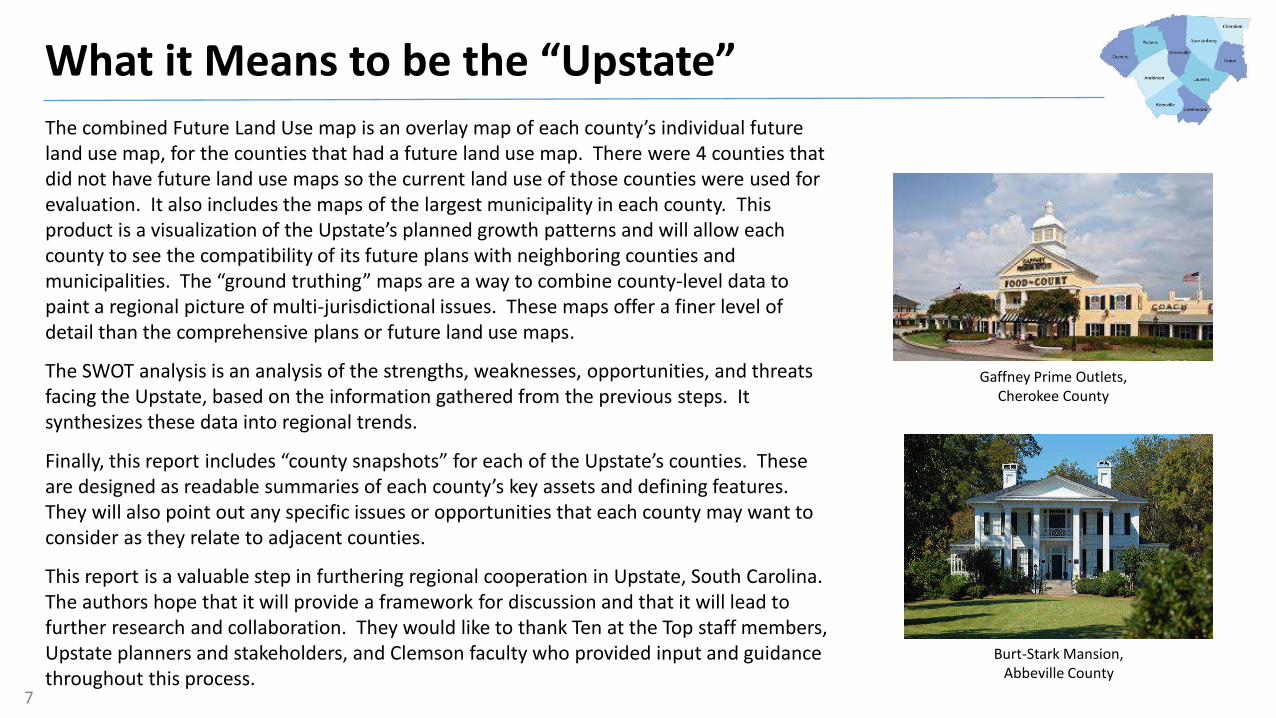
The o i ed Futu e La d Use ap is a o e la ap of ea h ou t ’s i di idual futu e land use map, for the counties that had a future land use map. There were 4 counties that
did not have future land use maps so the current land use of those counties were used for
evaluation. It also includes the maps of the largest municipality in each county. This
p odu t is a isualizatio of the Upstate’s pla ed g o th patte s a d ill allo ea h county to see the compatibility of its future plans with neighboring counties and
u i ipalities. The g ou d truthing aps a e a a to o i e ou t -level data to
paint a regional picture of multi-jurisdictional issues. These maps offer a finer level of
detail than the comprehensive plans or future land use maps.
The SWOT analysis is an analysis of the strengths, weaknesses, opportunities, and threats
facing the Upstate, based on the information gathered from the previous steps. It
synthesizes these data into regional trends.
Fi all , this epo t i ludes ou t s apshots fo ea h of the Upstate’s ou ties. These a e desig ed as eada le su a ies of ea h ou t ’s ke assets a d defi i g featu es. They will also point out any specific issues or opportunities that each county may want to
consider as they relate to adjacent counties.
This report is a valuable step in furthering regional cooperation in Upstate, South Carolina.
The authors hope that it will provide a framework for discussion and that it will lead to
further research and collaboration. They would like to thank Ten at the Top staff members,
Upstate planners and stakeholders, and Clemson faculty who provided input and guidance
throughout this process.
What it Means to be the Upstate
Gaffney Prime Outlets,
Cherokee County
Burt-Stark Mansion,
Abbeville County
7
County Snapshots
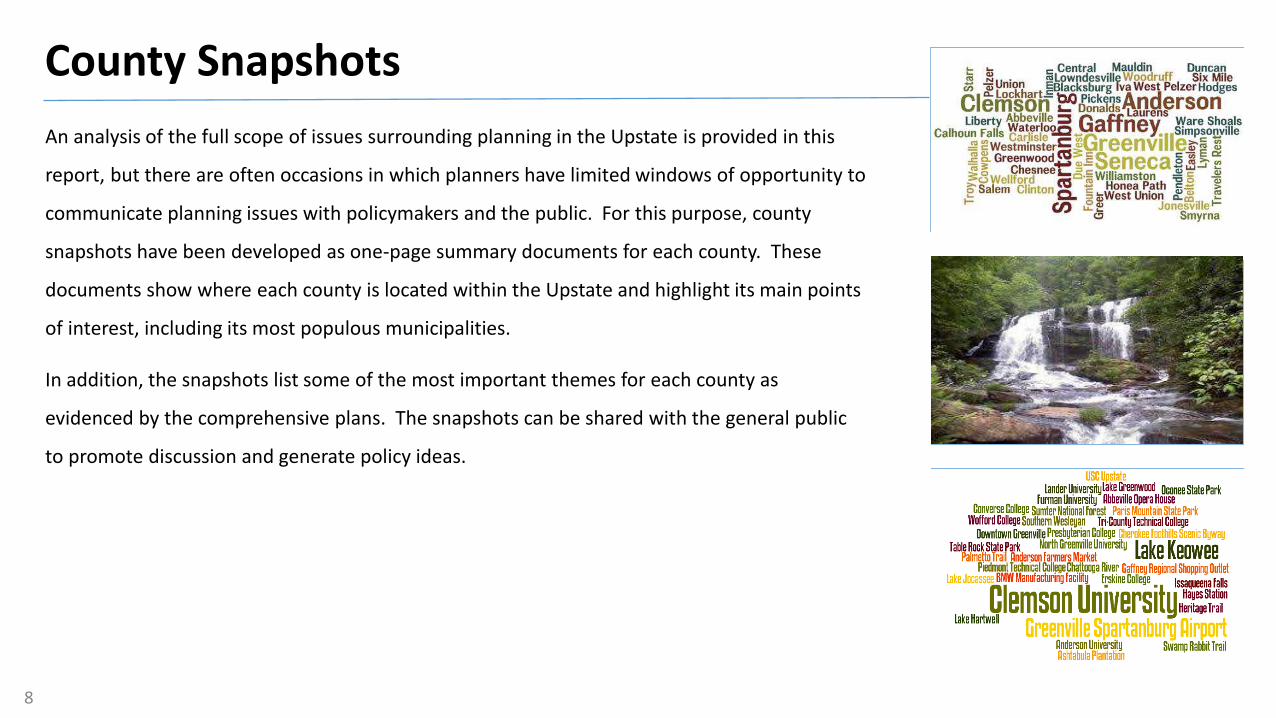
An analysis of the full scope of issues surrounding planning in the Upstate is provided in this
report, but there are often occasions in which planners have limited windows of opportunity to
communicate planning issues with policymakers and the public. For this purpose, county
snapshots have been developed as one-page summary documents for each county. These
documents show where each county is located within the Upstate and highlight its main points
of interest, including its most populous municipalities.
In addition, the snapshots list some of the most important themes for each county as
evidenced by the comprehensive plans. The snapshots can be shared with the general public
to promote discussion and generate policy ideas.
8

County Snapshot: Abbeville County
Key Themes from the Comprehensive Plan
• Desire to retain small-town feel and character
• Takes pride in historic homes and architecture
• Highway 72 near Greenwood is key growth area
• Effectively marketing for industry and tourism
• Land is mostly preserved open space
County Characteristics
County Population: 25,417
County Seat: City of Abbeville
Municipal Populations > 1,000:
• Abbeville – 5,237 (County Seat)
• Calhoun Falls – 2,004
• Due West – 1,247
• Honea Path – 3,597
• Ware Shoals – 2,170
Points of Interest:
• Abbeville Opera House
• Erskine College
• The Civic Center
9

County Snapshot: Anderson County
Key Themes from the Comprehensive Plan*
• Significant growth along Highway 153 near Greenville
• Maintenance of water quality through stormwater management
• Diversification of housing to accommodate young professionals and older adults
• Preservation of agricultural land to support local food production
• Interest in multi-jurisdictional cooperation to address air quality issues
County Characteristics
County Population: 187,126
County Seat: City of Anderson
Most Populous Cities & Towns:
• Anderson – 26,686 (County Seat)
• Belton – 4,134
• Honea Path – 3,597
• Williamston – 3,934
• Pendleton – 2,964
Points of Interest:
• Anderson University
• A de so Fa e ’s Ma ket• Tri-County Technical College, Pendleton
and Anderson Campuses
• Ashtabula Plantation
10 *The Anderson County comprehensive plan analysis was produced using the draft document written in 2010. The document has not been approved by the Anderson County Council to date.

County Snapshot: Cherokee County
Key Themes from the Comprehensive Plan
• Desire to attract industry for job growth
• Historic/scenic corridors and sites
• Ideal location for new businesses based on existing transportation network
• Cultural activities
• Focus on rural land uses
County Characteristics
County Population: 55,342
County Seat: City of Gaffney
Most Populous Cities & Towns:
• Gaffney – 12,414 (County Seat)
• Blacksburg – 1,848
• Chesnee – 868
• Smyrna – 45
Points of Interest:
• Gaffney Regional Shopping Outlet
• Cowpens National Battlefield
• Kings Mountain National Military Park
• Veterans Museum
11

County Snapshot: Greenville County
Key Themes from the Comprehensive Plan
• Most populous county in South Carolina
• Regional hub for medical facilities
• Consistently low unemployment compared to the rest of the State
• Concerned about air quality and congestion levels
• Regional employment hub, attracting 50,000+ in-commuters
• Most farms in the Upstate, 4th most in the State
County Characteristics
County Population: 474,266
County Seat: City of Greenville
Most Populous Cities & Towns:
• Greenville – 60,709 (County Seat)
• Greer – 25,515
• Mauldin– 23,808
• Simpsonville – 19,056
• Fountain Inn – 7,898
Points of Interest:
• Downtown Greenville
• Paris Mountain State Park
• Swamp Rabbit Trail
• Furman University
• North Greenville University
12
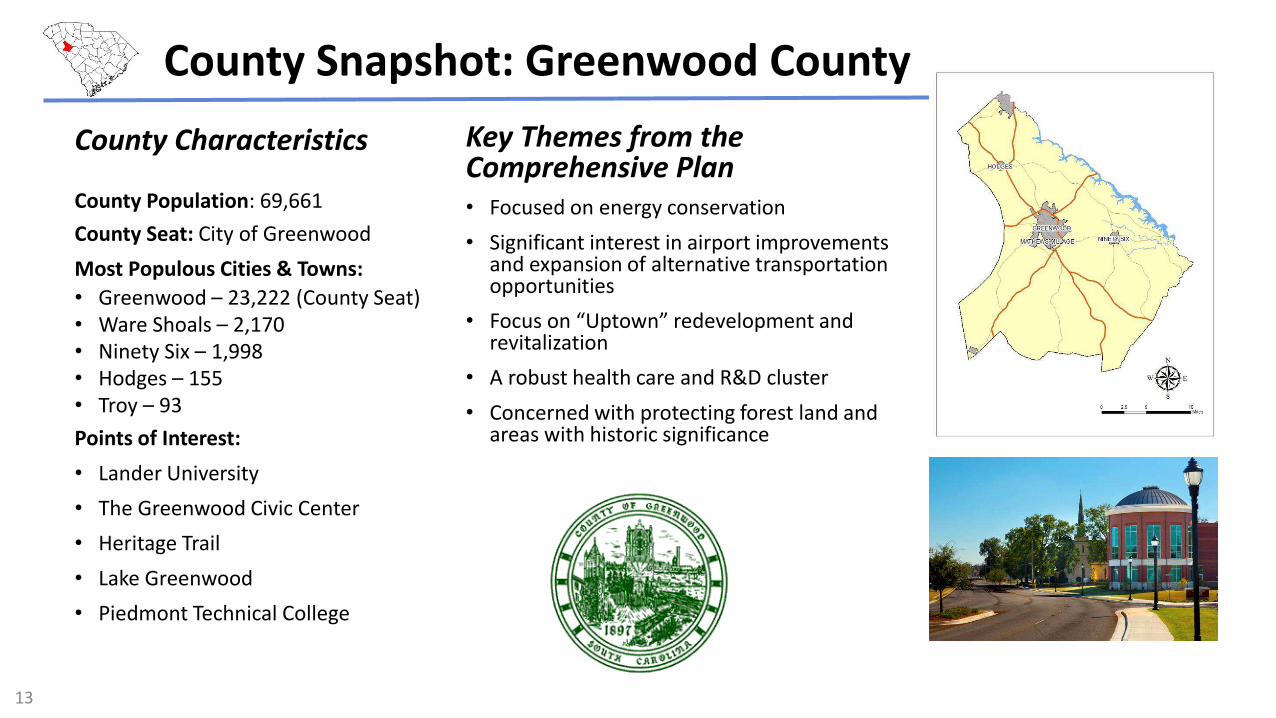
County Snapshot: Greenwood County
Key Themes from the Comprehensive Plan
• Focused on energy conservation
• Significant interest in airport improvements and expansion of alternative transportation opportunities
• Fo us o Upto ede elop e t a d revitalization
• A robust health care and R&D cluster
• Concerned with protecting forest land and areas with historic significance
County Characteristics
County Population: 69,661
County Seat: City of Greenwood
Most Populous Cities & Towns:
• Greenwood – 23,222 (County Seat)
• Ware Shoals – 2,170
• Ninety Six – 1,998
• Hodges – 155
• Troy – 93
Points of Interest:
• Lander University
• The Greenwood Civic Center
• Heritage Trail
• Lake Greenwood
• Piedmont Technical College
13
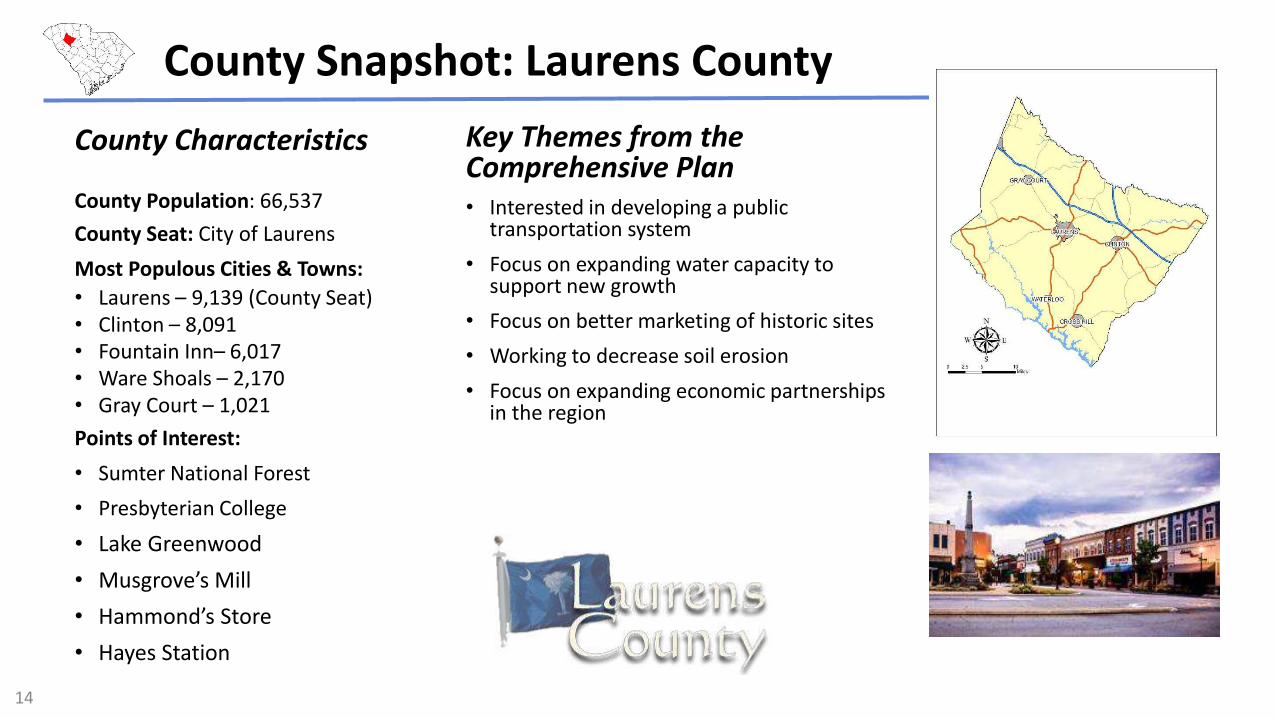
County Snapshot: Laurens County
Key Themes from the Comprehensive Plan
• Interested in developing a public transportation system
• Focus on expanding water capacity to support new growth
• Focus on better marketing of historic sites
• Working to decrease soil erosion
• Focus on expanding economic partnerships in the region
County Characteristics
County Population: 66,537
County Seat: City of Laurens
Most Populous Cities & Towns:
• Laurens – 9,139 (County Seat)
• Clinton – 8,091
• Fountain Inn– 6,017
• Ware Shoals – 2,170
• Gray Court – 1,021
Points of Interest:
• Sumter National Forest
• Presbyterian College
• Lake Greenwood
• Musg o e’s Mill• Ha o d’s “to e• Hayes Station
14

County Snapshot: Oconee County
Key Themes from the Comprehensive Plan
• Interested in regional collaboration through shared initiatives and shared services on projects such as watershed and solid waste management
• Interested in growing public transportation system
• Abundance of recreational and cultural opportunities to support eco-tourism industry
• Concerted effort to use utilities as a guide for development siting
County Characteristics
County Population: 74,273
County Seat: City of Walhalla
Most Populous Cities & Towns:
• Seneca – 8,102
• Walhalla – 3,801 (County Seat)
• Westminster – 2,418
• West Union – 291
• Salem – 135
Points of Interest:
• Oconee State Park
• Lakes Jocassee, Hartwell, and Keowee
• Issaqueena Falls
• Duke Po e ’s Wo ld of E e g• The Chattooga River
15

County Snapshot: Pickens County
Key Themes from the Comprehensive Plan*
• Focusing sewer expansion along US 123 and US 93
• Goal to build off of existing public transportation system to service aging and disabled populations, as well as students
• Desire to coordinate multi-county effort for cultural events and facilities
• Highest percentage of residential land use in the Upstate
• Interested in regional collaboration to improve I-85 corridor
County Characteristics
County Population: 119,224
County Seat: City of Pickens
Most Populous Cities & Towns:
• Easley – 20,098
• Clemson – 13,905
• Central – 5,159
• Liberty – 3,269
• Pickens – 3,126 (County Seat)
Points of Interest:
• Clemson University
• Southern Wesleyan
• Cherokee Foothills Scenic Byway
• Table Rock State Park
• Tri-County Technical College (Easley Campus)
16 *The Pickens County comprehensive plan analysis was produced using the draft document written in 2010. The document has not been approved by the Pickens County Council to date.
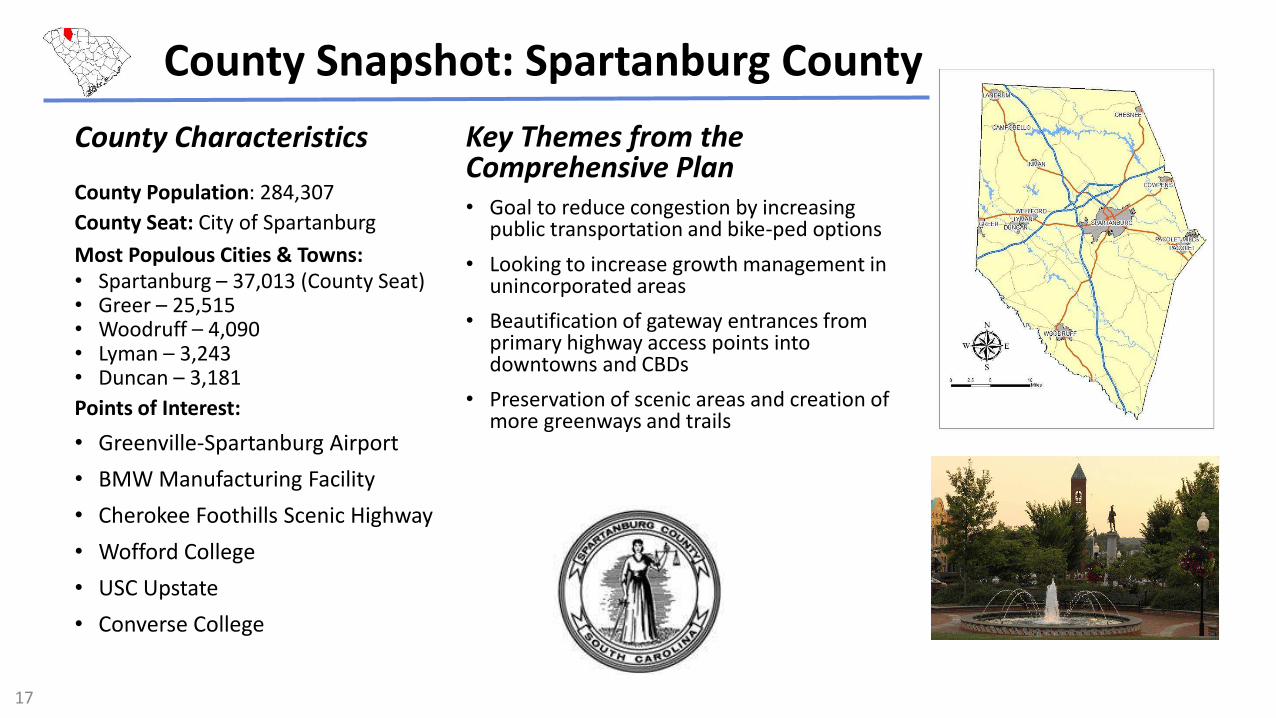
County Snapshot: Spartanburg County
Key Themes from the Comprehensive Plan
• Goal to reduce congestion by increasing public transportation and bike-ped options
• Looking to increase growth management in unincorporated areas
• Beautification of gateway entrances from primary highway access points into downtowns and CBDs
• Preservation of scenic areas and creation of more greenways and trails
County Characteristics
County Population: 284,307
County Seat: City of Spartanburg
Most Populous Cities & Towns:
• Spartanburg – 37,013 (County Seat)• Greer – 25,515• Woodruff – 4,090• Lyman – 3,243• Duncan – 3,181
Points of Interest:
• Greenville-Spartanburg Airport
• BMW Manufacturing Facility
• Cherokee Foothills Scenic Highway
• Wofford College
• USC Upstate
• Converse College
17

County Snapshot: Union County
Key Themes from the Comprehensive Plan
• Union County does not have a current Comprehensive Plan
County Characteristics
County Population: 28,961
County Seat: Union
Most Populous Cities & Towns:
• Union – 8,393 (County Seat)
• Jonesville – 911
• Lockhart – 488
• Carlisle – 436
Points of Interest:
• Sumter National Park
• Rose Hill Plantation State Park
• Rose Hill Mansion
• Broad River
18

Comprehensive Plan Analysis and MatrixTo guide the team assessment of multiple planning documents, as well as to present results in a format that will be simple to navigate for final document users, a matrix for key planning elements will be used to evaluate the extent to which each comprehensive plan supports specific strategies. The plans will be evaluated for the type of coverage they provide for each sub-element. The evaluation criteria are detailed in a legend on the following page.
In order to generate the matrix by which all plans were evaluated, the research team began with eight of the nine elements mandated by the South Carolina legislature, and created sub elements within each according to a review of a diverse selection of comprehensive planning guides. The Priority Investment element was not evaluated given that several of the counties did not include the element in their comprehensive plans, while the counties that did include the element addressed it in different ways. Commonly included information, as well as frequently utilized planning strategies among this literature, became the basis for which the breadth of content of each element within each county plan would come to be evaluated. However, this was an iterative process as each team member, beginning with a baseline of sub-elements for each planning element, would update the sub-elements as new relevant categories emerged throughout the course of the review.
For each individual planning element, a single team member was assigned to complete the analysis. The rationale for this process was to maintain the greatest degree of consistency across the different county plans. Another level of consistency built into the model was the criteria for which each planning sub-element was judged for its level of coverage. To minimize the subjectivity of individual interpretations, criteria were generated for which the team member could judge either their presence or absence within the sub-element, as opposed judging based on a scale or various degrees of completion. These criteria were thoroughly vetted in a group training process to ensure that the team had a uniform understanding of how the criteria were to be applied.
The intended benefit of this system is to make it easier to recognize which elements are in agreement among the majority of plans, and therefore presenting opportunities for collaboration on critical issues between the jurisdictions. Furthermore, if many counties display a lack of support for a key planning element, this may indicate the need for investigation of the issue at regional meetings and conferences.
Planning Elements
Population
Economic
Natural Resources
Cultural Resources
Community Facilities
Housing
Land Use
Transportation
19
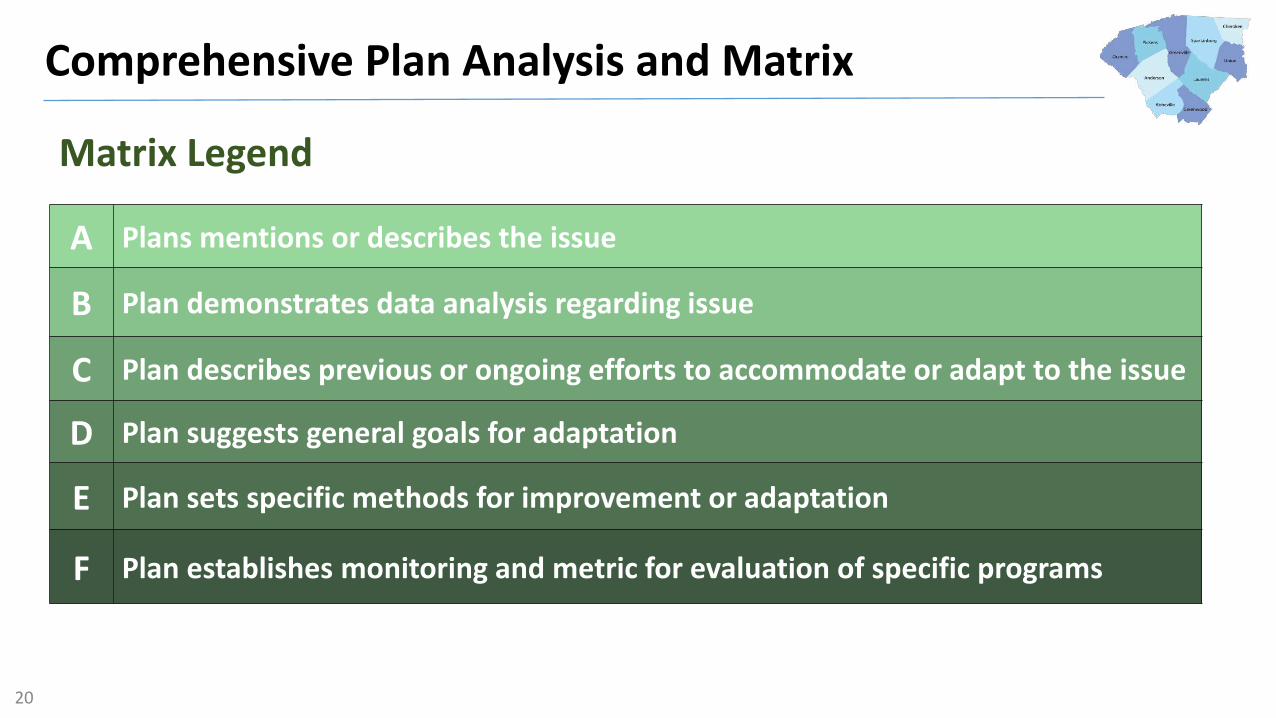
Comprehensive Plan Analysis and Matrix
A Plans mentions or describes the issue
B Plan demonstrates data analysis regarding issue
C Plan describes previous or ongoing efforts to accommodate or adapt to the issue
D Plan suggests general goals for adaptation
E Plan sets specific methods for improvement or adaptation
F Plan establishes monitoring and metric for evaluation of specific programs
Matrix Legend
20
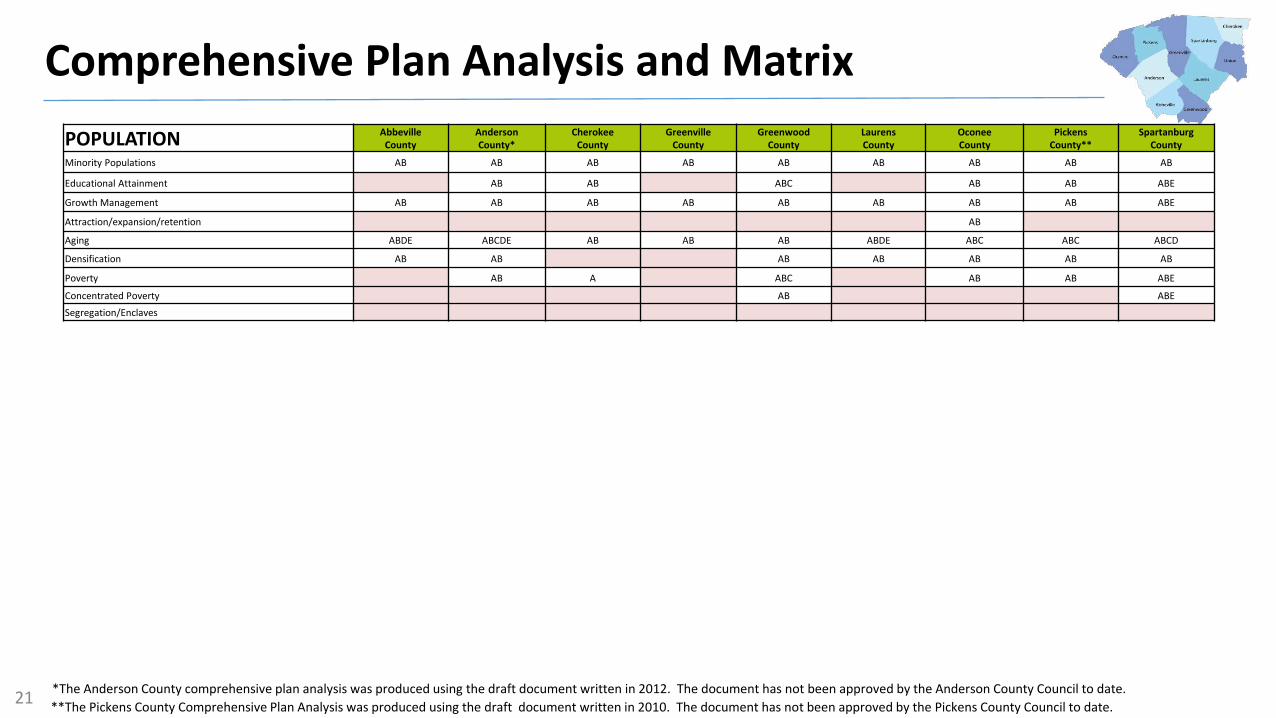
Comprehensive Plan Analysis and Matrix
POPULATIONAbbeville
County
Anderson
County*
Cherokee
County
Greenville
County
Greenwood
County
Laurens
County
Oconee
County
Pickens
County**
Spartanburg
County
Minority Populations AB AB AB AB AB AB AB AB AB
Educational Attainment AB AB ABC AB AB ABE
Growth Management AB AB AB AB AB AB AB AB ABE
Attraction/expansion/retention AB
Aging ABDE ABCDE AB AB AB ABDE ABC ABC ABCD
Densification AB AB AB AB AB AB AB
Poverty AB A ABC AB AB ABE
Concentrated Poverty AB ABE
Segregation/Enclaves
21**The Pickens County Comprehensive Plan Analysis was produced using the draft document written in 2010. The document has not been approved by the Pickens County Council to date.
*The Anderson County comprehensive plan analysis was produced using the draft document written in 2012. The document has not been approved by the Anderson County Council to date.
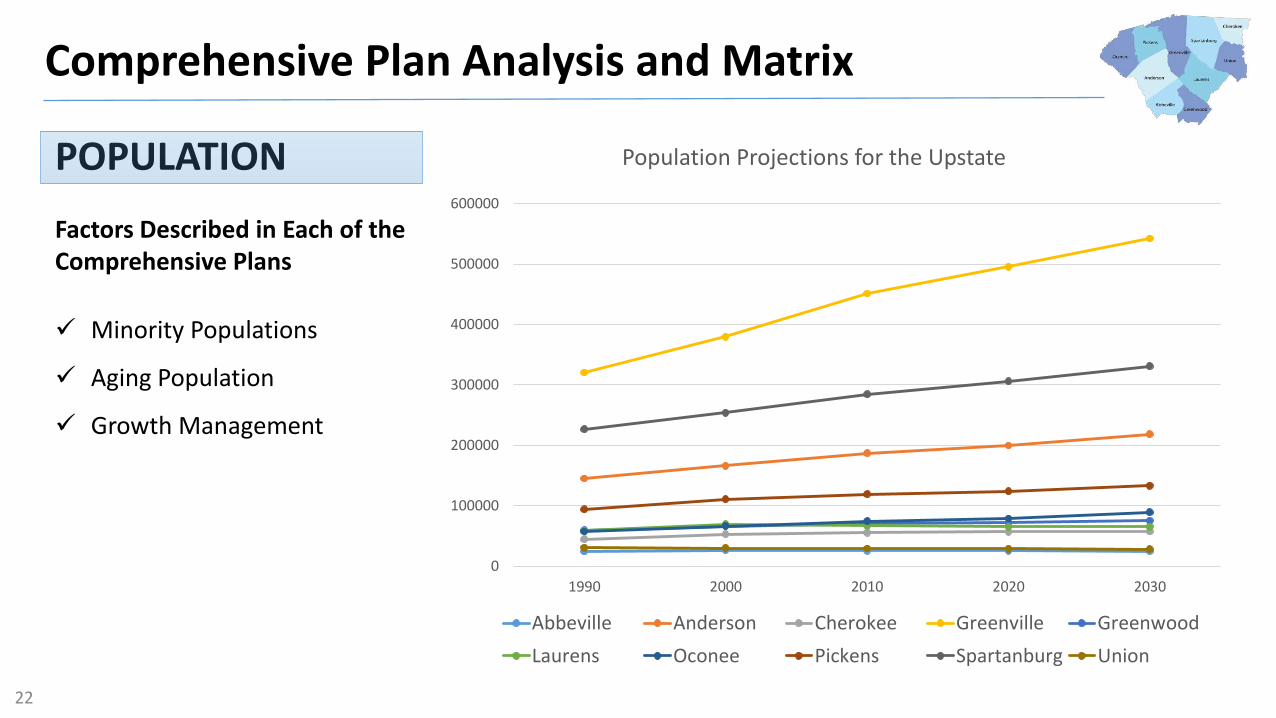
Comprehensive Plan Analysis and Matrix
POPULATION
Factors Described in Each of the
Comprehensive Plans
Minority Populations
Aging Population
Growth Management
0
100000
200000
300000
400000
500000
600000
1990 2000 2010 2020 2030
Population Projections for the Upstate
Abbeville Anderson Cherokee Greenville Greenwood
Laurens Oconee Pickens Spartanburg Union
22

Comprehensive Plan Analysis and Matrix
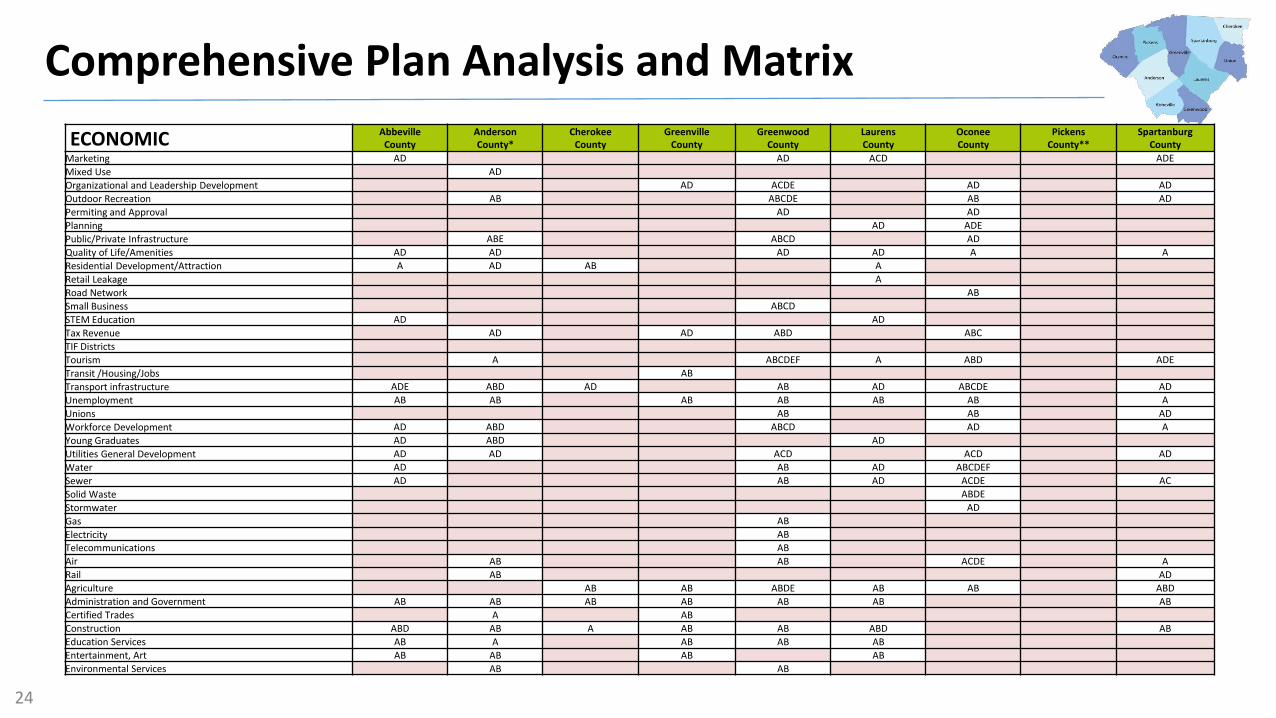
ECONOMICAbbeville
County
Anderson
County*
Cherokee
County
Greenville
County
Greenwood
County
Laurens
County
Oconee
County
Pickens
County**
Spartanburg
County
Aging Workforce AB
Agricultural Development AB AD AD ABCDE AE AD AD
Below Poverty Line AB AB AB AB AB
Brownfield ABCD
Business Retention/Expansion A D AC A AD
Chamber of Commerce AD AB A
Citizen Participation AD
Clusters AB ABD AD
Commercial/Retail Development AB ABD ABCD A AD A
Cost of Living ABD AB AB AB AD
Culture AD ABCDE A
Diversification A ABD AD ABCD A AD AD
Downtown Revitalization A ABCDE A AC
Economic Development Corporations/Organizations ACDE ACD ACD ABC A
Education ABD ADE ABCD ABD ABDE AC
Entrepreneurial Development AD ABCD AD
Equitable Growth A AD AD ACD A AD AB
Executive Housing
Export base ABCD A A ABC AD
Exporting Labor AB AB A
Funds and Grants ADE
Greyfield/Vacancy ABCDE
Hispanic Population AB
GIS A ADE
Growth Impacts AD AE AD ABCDE AD ADE ABDE
Housing/Workforce AD AB ADE
Housing/Jobs Balance A
Infill AD ABCDE AD AD
Importing Labor AB AB
Incentives ABDE ABCDE AD
Incubators ABC
Industrial Recruitment AD ABCD AD ABCD AD AD ABD
Industrial Site Inventory AE ABDE AE AD
Industrial/Business Park ABE AB ABCD AD
Inter-Jurisdictional Partnerships ADE AD ABCDE ACD ABCDE A
Labor Force Participation ABD
Land Use/ Controls/Zoning AD ADE AD ABDE AD ADE AD
Low Income/Wages ABD ABD AB A ABD AB ABD
23
Comprehensive Plan Analysis and Matrix
ECONOMICAbbeville
County
Anderson
County*
Cherokee
County
Greenville
County
Greenwood
County
Laurens
County
Oconee
County
Pickens
County**
Spartanburg
County
Marketing AD AD ACD ADE
Mixed Use AD
Organizational and Leadership Development AD ACDE AD AD
Outdoor Recreation AB ABCDE AB AD
Permiting and Approval AD AD
Planning AD ADE
Public/Private Infrastructure ABE ABCD AD
Quality of Life/Amenities AD AD AD AD A A
Residential Development/Attraction A AD AB A
Retail Leakage A
Road Network AB
Small Business ABCD
STEM Education AD AD
Tax Revenue AD AD ABD ABC
TIF Districts
Tourism A ABCDEF A ABD ADE
Transit /Housing/Jobs AB
Transport infrastructure ADE ABD AD AB AD ABCDE AD
Unemployment AB AB AB AB AB AB A
Unions AB AB AD
Workforce Development AD ABD ABCD AD A
Young Graduates AD ABD AD
Utilities General Development AD AD ACD ACD AD
Water AD AB AD ABCDEF
Sewer AD AB AD ACDE AC
Solid Waste ABDE
Stormwater AD
Gas AB
Electricity AB
Telecommunications AB
Air AB AB ACDE A
Rail AB AD
Agriculture AB AB ABDE AB AB ABD
Administration and Government AB AB AB AB AB AB AB
Certified Trades A AB
Construction ABD AB A AB AB ABD AB
Education Services AB A AB AB AB
Entertainment, Art AB AB AB AB
Environmental Services AB AB
24

Comprehensive Plan Analysis and Matrix
ECONOMICAbbeville
County
Anderson
County*
Cherokee
County
Greenville
County
Greenwood
County
Laurens
County
Oconee
County
Pickens
County**
Spartanburg
County
Finance and Insurance ABD AB AB ABD ABD AB
Headquarters ABE A AD
Knowedge/High tech, Information Technology AB ABD AB ABD AB A AD
Manufacturing AB ABCD AB AB AB A AB ABD
Medical/Health AB AB AB ABCD AB A
Natural Resources/Mining AB AB AB AB
Real Estate AB AB AB ABD AB
Professional Services, Science, Management AB AB AB AB AB AB ADE
Services/Retail/Hospitality ABD AB AB AB ABD ABD AB
Textiles AB AB AB ABD A AB
Transportation/distribution ABD ABD AB AB AB ABD AB
Utilities AB AB AB AB
Wholesale ABD AB AB AB AB ABD AB
25**The Pickens County Comprehensive Plan Analysis was produced using the draft document written in 2010. The document has not been approved by the Pickens County Council to date.
*The Anderson County comprehensive plan analysis was produced using the draft document written in 2012. The document has not been approved by the Anderson County Council to date.

Comprehensive Plan Analysis and Matrix
33%
33%
33%
22%
22%
22%
22%
0% 20% 40% 60% 80% 100%
Growth Impacts
Inter-jurisdictional
Boundaries
Land Use/
Controls/Zoning
Education
Incentives
Tourism
Transport
Infrastructure
Percentage of Upstate Plans With Goals AND
Methods for Adoption by Factor ECONOMIC
Dominant Regional Strategies
Agricultural Development
Diversification
Industrial Recruitment
Transport Infrastructure
Unemployment
Administration and Government
Manufacturing
Transportation and Distribution
Wholesale26
Comprehensive Plan Analysis and Matrix
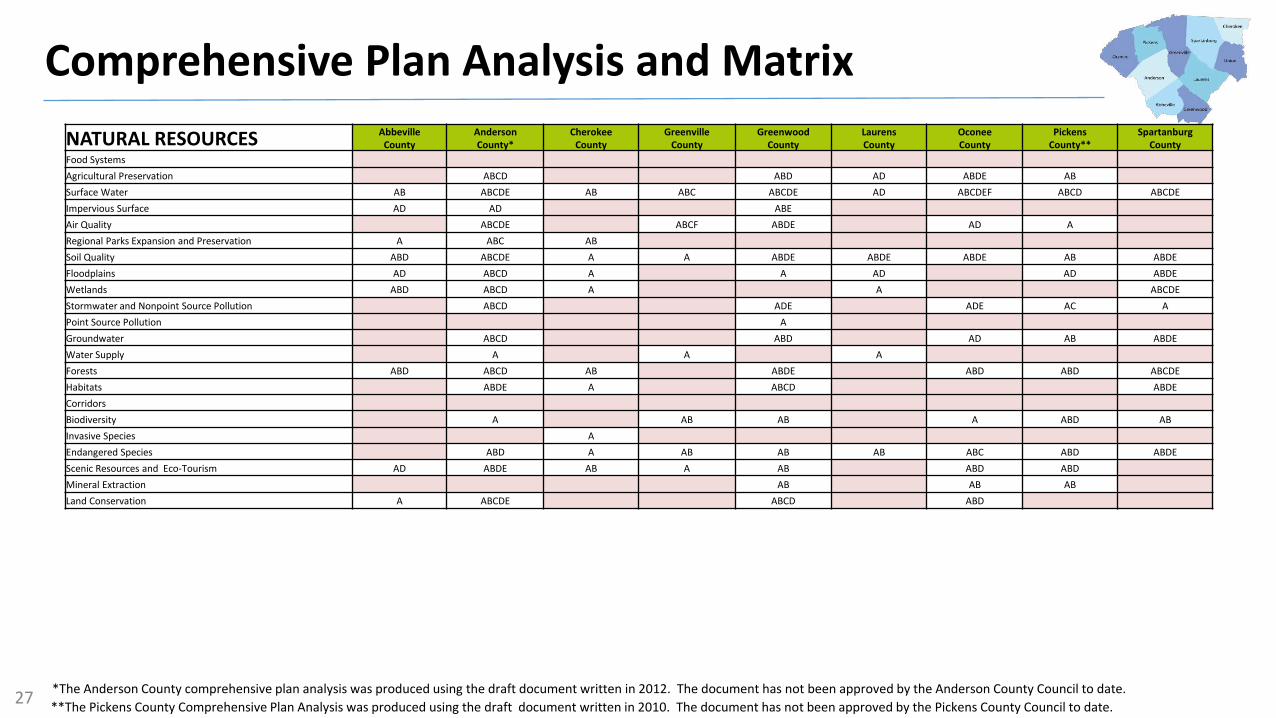
NATURAL RESOURCESAbbeville
County
Anderson
County*
Cherokee
County
Greenville
County
Greenwood
County
Laurens
County
Oconee
County
Pickens
County**
Spartanburg
County
Food Systems
Agricultural Preservation ABCD ABD AD ABDE AB
Surface Water AB ABCDE AB ABC ABCDE AD ABCDEF ABCD ABCDE
Impervious Surface AD AD ABE
Air Quality ABCDE ABCF ABDE AD A
Regional Parks Expansion and Preservation A ABC AB
Soil Quality ABD ABCDE A A ABDE ABDE ABDE AB ABDE
Floodplains AD ABCD A A AD AD ABDE
Wetlands ABD ABCD A A ABCDE
Stormwater and Nonpoint Source Pollution ABCD ADE ADE AC A
Point Source Pollution A
Groundwater ABCD ABD AD AB ABDE
Water Supply A A A
Forests ABD ABCD AB ABDE ABD ABD ABCDE
Habitats ABDE A ABCD ABDE
Corridors
Biodiversity A AB AB A ABD AB
Invasive Species A
Endangered Species ABD A AB AB AB ABC ABD ABDE
Scenic Resources and Eco-Tourism AD ABDE AB A AB ABD ABD
Mineral Extraction AB AB AB
Land Conservation A ABCDE ABCD ABD
27**The Pickens County Comprehensive Plan Analysis was produced using the draft document written in 2010. The document has not been approved by the Pickens County Council to date.
*The Anderson County comprehensive plan analysis was produced using the draft document written in 2012. The document has not been approved by the Anderson County Council to date.
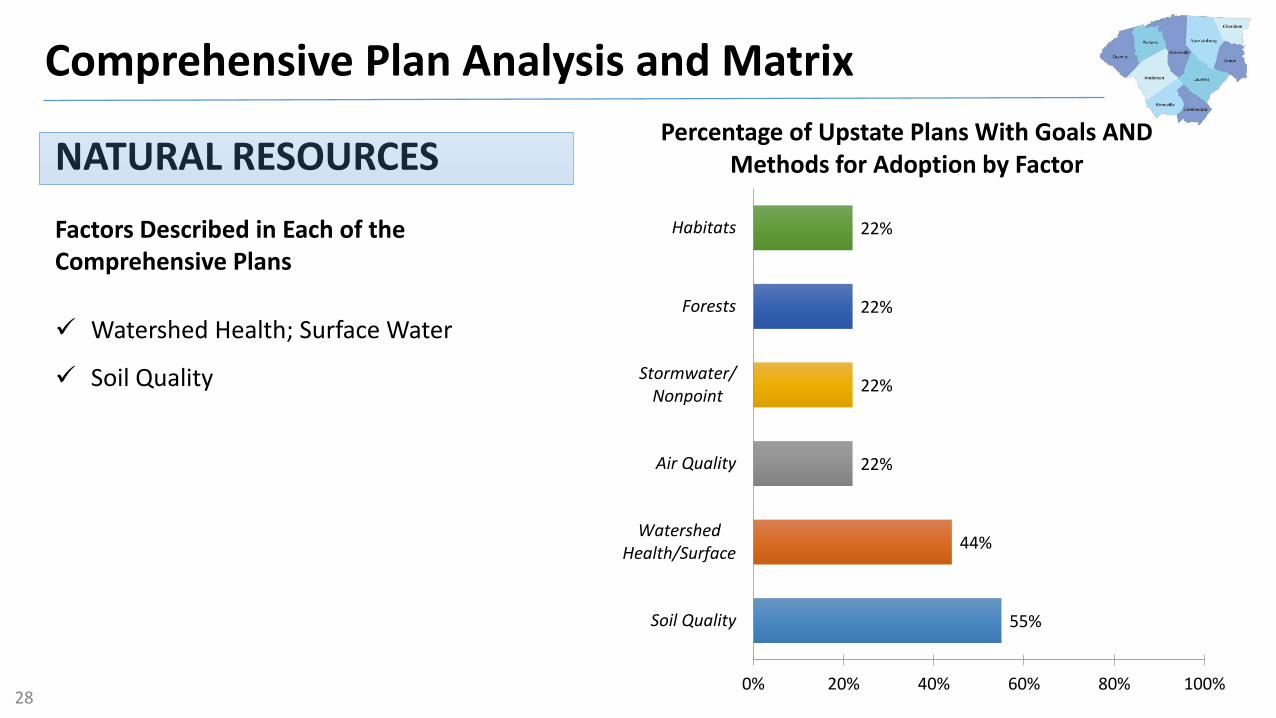
Comprehensive Plan Analysis and Matrix
55%
44%
22%
22%
22%
22%
0% 20% 40% 60% 80% 100%
Soil Quality
Watershed
Health/Surface
Air Quality
Stormwater/
Nonpoint
Forests
Habitats
Percentage of Upstate Plans With Goals AND
Methods for Adoption by Factor NATURAL RESOURCES
Factors Described in Each of the
Comprehensive Plans
Watershed Health; Surface Water
Soil Quality
28

Comprehensive Plan Analysis and Matrix
CULTURAL RESOURCESAbbeville
County
Anderson
County*
Cherokee
County
Greenville
County
Greenwood
County
Laurens
County
Oconee
County
Pickens
County**
Spartanburg
County
Performing Arts AB ABD AB A AB AB AB ABDE
Fine Arts A A AB AE A ABE AB A
Arts Center AB AB AB ABCE AE AB AB
Museum ABC AB ABCDE AE AE AB AE
Library AB ABCD AB ABC AB AE AB
Historic Preservation ABD AE AE ABCD AD ADE ABE ABCDE
Archaeological Resources ABE A
Federal and State Funding AE A ABC A A A
Regional Partnerships D ABE AE A
Community Organizations AB A AE A AD ABC
Community Centers A A
Historic Sites ABE ABCE AB AB ABD ABD ABDE ABCDE AB
Historic Districts ABE ABE ABDE AB AB
Community Festivals AB A ABE ABE A ABE AB
Scenic Byways and Trails AD A ABDE AB
Public Art AE
Arts Incubators
Sports Leagues A
Historic Preservation Overlay Districts A A
29**The Pickens County Comprehensive Plan Analysis was produced using the draft document written in 2010. The document has not been approved by the Pickens County Council to date.
*The Anderson County comprehensive plan analysis was produced using the draft document written in 2012. The document has not been approved by the Anderson County Council to date.

Comprehensive Plan Analysis and Matrix
22%
22%
11%
11%
11%
11%
0% 20% 40% 60% 80% 100%
Historic Preservation
Historic Sites
Performing Arts
Museum
Historic Districts
Scenic Byways/Trials
Percentage of Upstate Plans With Goals AND
Methods for Adoption by Factor CULTURAL RESOURCES
Factors Described in Each of the
Comprehensive Plans
Historic Sites
30

Comprehensive Plan Analysis and Matrix
COMMUNITY FACILITIESAbbeville
County
Anderson
County*
Cherokee
County
Greenville
County
Greenwood
County
Laurens
County
Oconee
County
Pickens
County**
Spartanburg
County
Stormwater Structure ABDE AE ABD AE A AB
EMS ABF ABDEF A AB ABD ABE ABE ABD
Water Quality ABCDEF AE AE A ABDEF ABDF
Water Conservation AE AE ABDE ABE
Water Utilities ABC ABC ABCE ABD ABEF ABCD ABDE ABDE ABCD
Police Service ABF AB A ABF AB ABE ABE ABCDF
Fire Service ABEF ABDF AE AB ABEF ABDF AB ABCDEF
Recreation ABCF ABDE ABDE ABF ABCDF ACE ABE ABDE ABCDEF
Schools K-12 ABD ABCD ABEF ABDEF ABCDE ABC ABEF ABC ABDEF
Higher ED AB ABCD AB ABD ABC AB ABC
Health Systems AB AB AB ABE ABC ABE ABCD
Solid Waste Facilities ABC ABD A AB ABCD AE ABDE AB ABD
Recycling AB ABE A ABF AB AE AE ABC
Sanitary Sewer ABD AB ABE ABDEF ABDE ABCD ABDE ABCD ABDE
Libraries AB ABCDEF AB AB ABC ABCE AB ABD
Public Parks ABDF ABDEF ABD ABF ABCDF AC AE ABCDE AB
Regional Partnerships AD ADE ACE
Prisons AB ABCE ABDE AE A ABDE
Dispatch Centers A ABC A
Emergency Services AB AB
Multi-Use Trails AC AB AD AB ABE ABF
Federal and State Funding A ADE ABE
Courthouses A A AD A AB A ABD
Administrative Buildings A AE ADE AB ABD
Electrical Utility ABE A
Nursing Homes and Assisted Living Facilities ABE
Natural Gas AE ABE
31**The Pickens County Comprehensive Plan Analysis was produced using the draft document written in 2010. The document has not been approved by the Pickens County Council to date.
*The Anderson County comprehensive plan analysis was produced using the draft document written in 2012. The document has not been approved by the Anderson County Council to date.
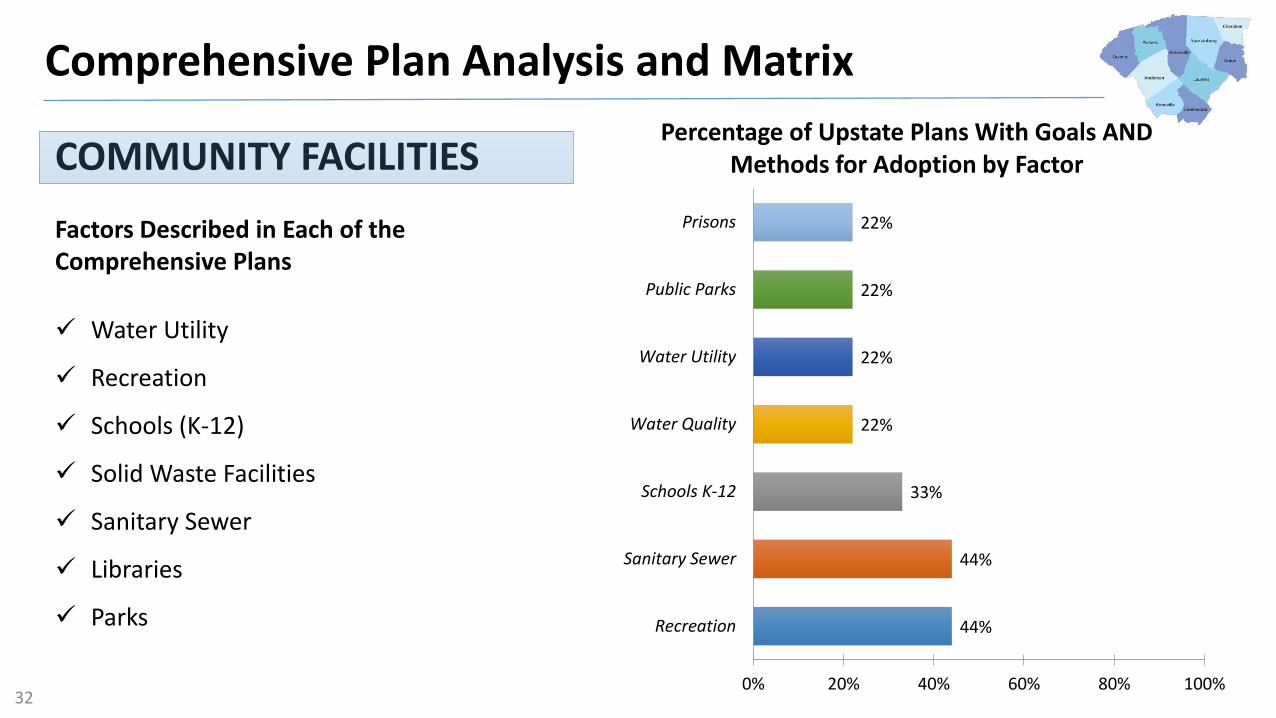
Comprehensive Plan Analysis and Matrix
44%
44%
33%
22%
22%
22%
22%
0% 20% 40% 60% 80% 100%
Recreation
Sanitary Sewer
Schools K-12
Water Quality
Water Utility
Public Parks
Prisons
Percentage of Upstate Plans With Goals AND
Methods for Adoption by Factor COMMUNITY FACILITIES
Factors Described in Each of the
Comprehensive Plans
Water Utility
Recreation
Schools (K-12)
Solid Waste Facilities
Sanitary Sewer
Libraries
Parks
32
Comprehensive Plan Analysis and Matrix
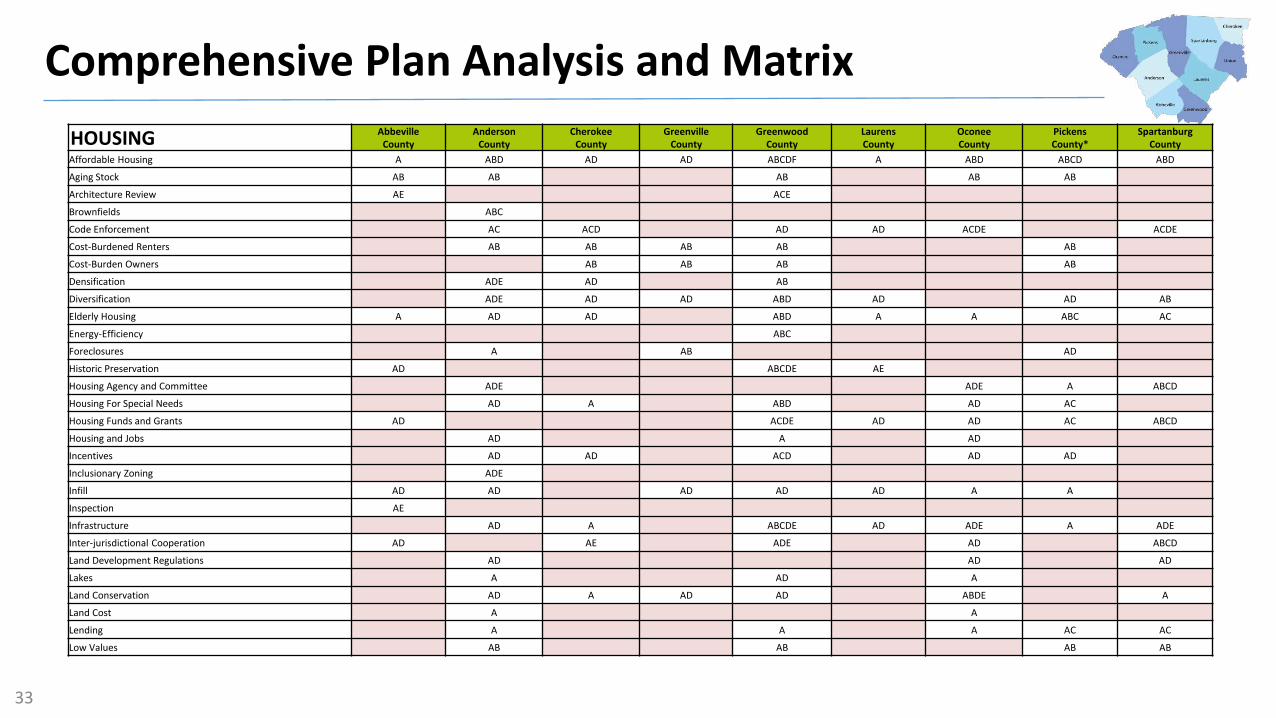
HOUSINGAbbeville
County
Anderson
County
Cherokee
County
Greenville
County
Greenwood
County
Laurens
County
Oconee
County
Pickens
County*
Spartanburg
County
Affordable Housing A ABD AD AD ABCDF A ABD ABCD ABD
Aging Stock AB AB AB AB AB
Architecture Review AE ACE
Brownfields ABC
Code Enforcement AC ACD AD AD ACDE ACDE
Cost-Burdened Renters AB AB AB AB AB
Cost-Burden Owners AB AB AB AB
Densification ADE AD AB
Diversification ADE AD AD ABD AD AD AB
Elderly Housing A AD AD ABD A A ABC AC
Energy-Efficiency ABC
Foreclosures A AB AD
Historic Preservation AD ABCDE AE
Housing Agency and Committee ADE ADE A ABCD
Housing For Special Needs AD A ABD AD AC
Housing Funds and Grants AD ACDE AD AD AC ABCD
Housing and Jobs AD A AD
Incentives AD AD ACD AD AD
Inclusionary Zoning ADE
Infill AD AD AD AD AD A A
Inspection AE
Infrastructure AD A ABCDE AD ADE A ADE
Inter-jurisdictional Cooperation AD AE ADE AD ABCD
Land Development Regulations AD AD AD
Lakes A AD A
Land Conservation AD A AD AD ABDE A
Land Cost A A
Lending A A A AC AC
Low Values AB AB AB AB
33

Comprehensive Plan Analysis and Matrix
HOUSINGAbbeville
County
Anderson
County*
Cherokee
County
Greenville
County
Greenwood
County
Laurens
County
Oconee
County
Pickens
County**
Spartanburg
County
Manufactured Housing Standards ADE ABC ADE AB ACDE
Middle-Income Housing ADE A A AB
Mill Villages ABD
Mixed-Income Neighborhoods AD A
Mixed-Use ACD AD AE
Neighborhood Associations ACD
Neighborhood Plans AD ADE AD
Non-Profits AD AD ABC
Overcrowding AB AB
Ownership A AB AB AB ABD AB AB AB AB
Parks, Open Space Expansion and Development AD AD ADE
Pedestrian Shed AD
Public Housing Assistance AB A A ABCD
Public Housing AB A ABCDE
Regulatory Barriers to Affordable Housing ADE AD ADE
Rental Market AB AB
Regional Partnerships AD AE
Rehabilitation AD AD ACD AD AD ABCD
Road Network A
Sprawl AD AD AD AD AD
Substandard AB ABC ACD AB AB ABD ABD ABD A
Transit AD AD
Utility Service A A ADE
Vacancies ABD AB AB AB AB ABD
Vehicle Ownership AB
Zoning Controls and Compatible Uses ADE AD ADE AD AD
Zoning Controls and Affordable Housing AD AD AD
34**The Pickens County Comprehensive Plan Analysis was produced using the draft document written in 2010. The document has not been approved by the Pickens County Council to date.
*The Anderson County comprehensive plan analysis was produced using the draft document written in 2012. The document has not been approved by the Anderson County Council to date.

Comprehensive Plan Analysis and Matrix
33%
33%
22%
22%
22%
22%
0% 20% 40% 60% 80% 100%
Infrastructure
Manufactured
Housing Standards
Code Enforcement
Housing
Agency/Committee
Regulatory Barriers
to Affordable
Housing
Zoning
Controls/Compatible
Uses
Percentage of Upstate Plans With Goals AND
Methods for Adoption by Factor HOUSING
Factors Described in Each of the
Comprehensive Plans
Affordable Housing
Home Ownership
Substandard Dwellings
35
Comprehensive Plan Analysis and Matrix
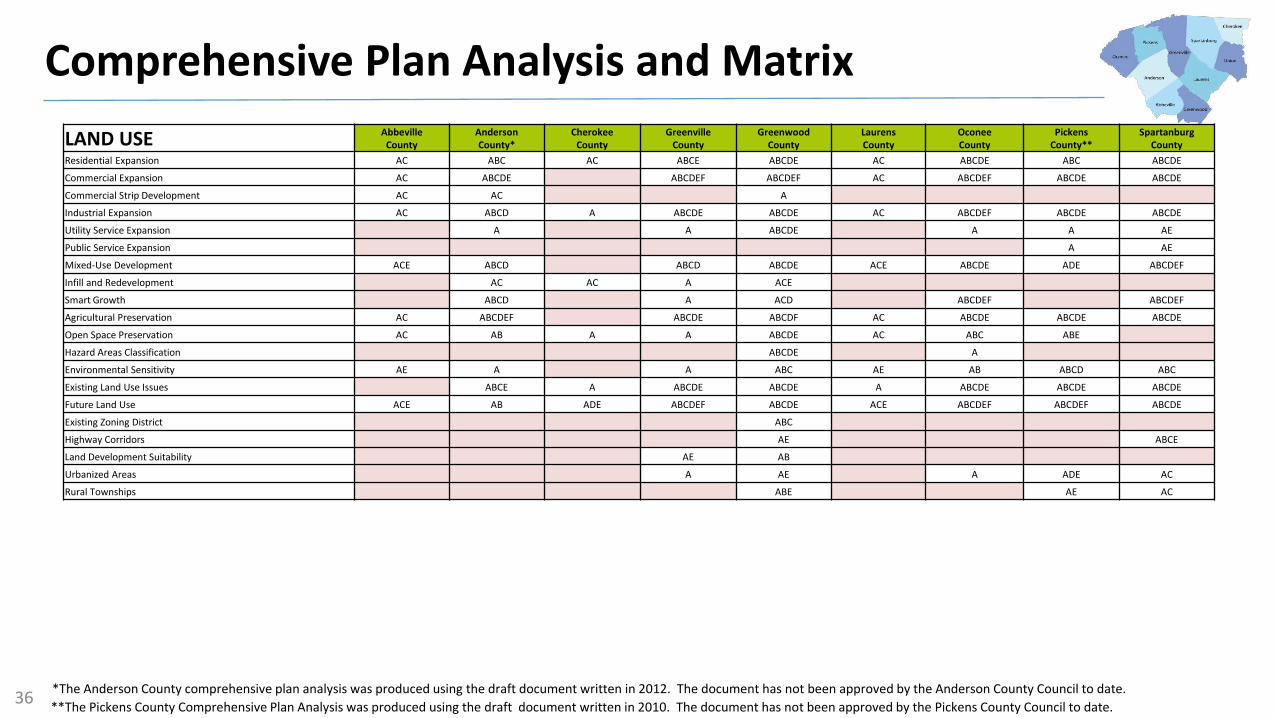
LAND USEAbbeville
County
Anderson
County*
Cherokee
County
Greenville
County
Greenwood
County
Laurens
County
Oconee
County
Pickens
County**
Spartanburg
County
Residential Expansion AC ABC AC ABCE ABCDE AC ABCDE ABC ABCDE
Commercial Expansion AC ABCDE ABCDEF ABCDEF AC ABCDEF ABCDE ABCDE
Commercial Strip Development AC AC A
Industrial Expansion AC ABCD A ABCDE ABCDE AC ABCDEF ABCDE ABCDE
Utility Service Expansion A A ABCDE A A AE
Public Service Expansion A AE
Mixed-Use Development ACE ABCD ABCD ABCDE ACE ABCDE ADE ABCDEF
Infill and Redevelopment AC AC A ACE
Smart Growth ABCD A ACD ABCDEF ABCDEF
Agricultural Preservation AC ABCDEF ABCDE ABCDF AC ABCDE ABCDE ABCDE
Open Space Preservation AC AB A A ABCDE AC ABC ABE
Hazard Areas Classification ABCDE A
Environmental Sensitivity AE A A ABC AE AB ABCD ABC
Existing Land Use Issues ABCE A ABCDE ABCDE A ABCDE ABCDE ABCDE
Future Land Use ACE AB ADE ABCDEF ABCDE ACE ABCDEF ABCDEF ABCDE
Existing Zoning District ABC
Highway Corridors AE ABCE
Land Development Suitability AE AB
Urbanized Areas A AE A ADE AC
Rural Townships ABE AE AC
36**The Pickens County Comprehensive Plan Analysis was produced using the draft document written in 2010. The document has not been approved by the Pickens County Council to date.
*The Anderson County comprehensive plan analysis was produced using the draft document written in 2012. The document has not been approved by the Anderson County Council to date.

Comprehensive Plan Analysis and Matrix
67%
67%
56%
56%
56%
44%
33%
22%
0% 20% 40% 60% 80% 100%
Commercial
Expansion
Future Land Use
Industrial Expansion
Agricultural
Preservation
Existing Land Use
Issues
Mixed Use
Development
Residential Expansion
Smart Growth
Percentage of Upstate Plans With Goals AND
Methods for Adoption by Factor LAND USE
Factors Described in Each of the
Comprehensive Plans
Residential Expansion
Industrial Expansion
Future Land Use
37
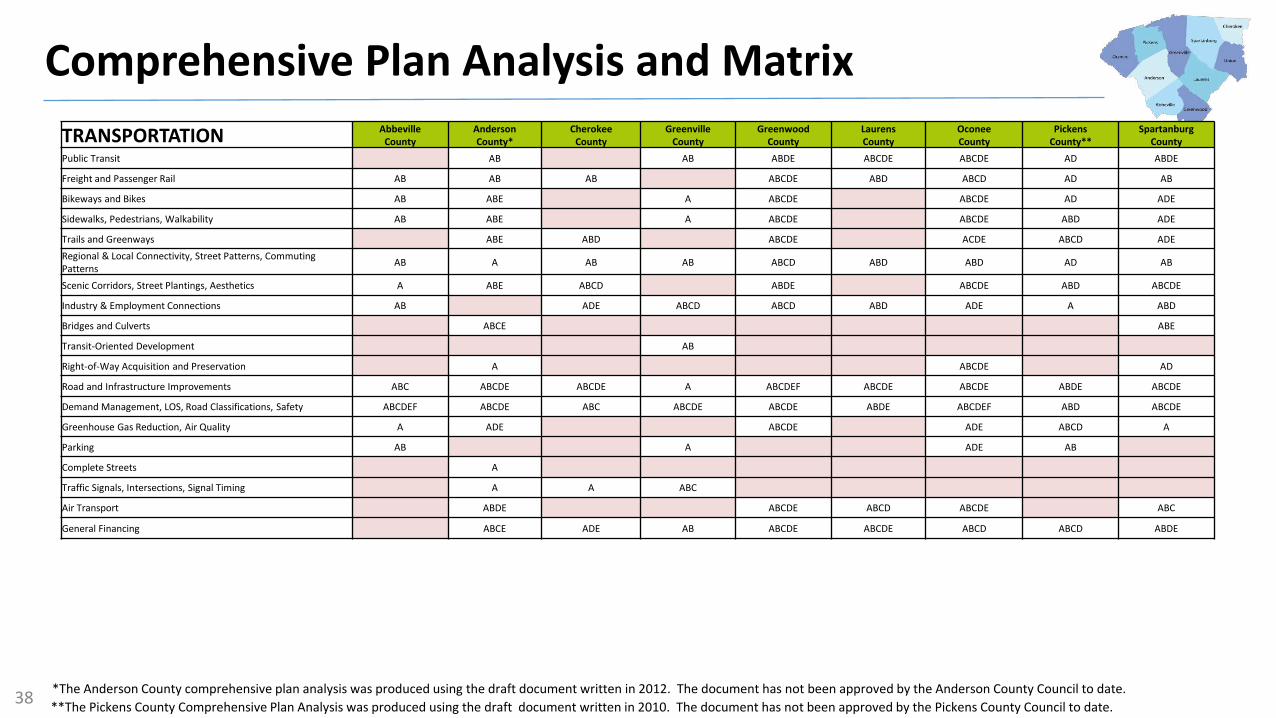
Comprehensive Plan Analysis and Matrix
TRANSPORTATIONAbbeville
County
Anderson
County*
Cherokee
County
Greenville
County
Greenwood
County
Laurens
County
Oconee
County
Pickens
County**
Spartanburg
County
Public Transit AB AB ABDE ABCDE ABCDE AD ABDE
Freight and Passenger Rail AB AB AB ABCDE ABD ABCD AD AB
Bikeways and Bikes AB ABE A ABCDE ABCDE AD ADE
Sidewalks, Pedestrians, Walkability AB ABE A ABCDE ABCDE ABD ADE
Trails and Greenways ABE ABD ABCDE ACDE ABCD ADE
Regional & Local Connectivity, Street Patterns, Commuting
PatternsAB A AB AB ABCD ABD ABD AD AB
Scenic Corridors, Street Plantings, Aesthetics A ABE ABCD ABDE ABCDE ABD ABCDE
Industry & Employment Connections AB ADE ABCD ABCD ABD ADE A ABD
Bridges and Culverts ABCE ABE
Transit-Oriented Development AB
Right-of-Way Acquisition and Preservation A ABCDE AD
Road and Infrastructure Improvements ABC ABCDE ABCDE A ABCDEF ABCDE ABCDE ABDE ABCDE
Demand Management, LOS, Road Classifications, Safety ABCDEF ABCDE ABC ABCDE ABCDE ABDE ABCDEF ABD ABCDE
Greenhouse Gas Reduction, Air Quality A ADE ABCDE ADE ABCD A
Parking AB A ADE AB
Complete Streets A
Traffic Signals, Intersections, Signal Timing A A ABC
Air Transport ABDE ABCDE ABCD ABCDE ABC
General Financing ABCE ADE AB ABCDE ABCDE ABCD ABCD ABDE
38**The Pickens County Comprehensive Plan Analysis was produced using the draft document written in 2010. The document has not been approved by the Pickens County Council to date.
*The Anderson County comprehensive plan analysis was produced using the draft document written in 2012. The document has not been approved by the Anderson County Council to date.
Comprehensive Plan Analysis and Matrix
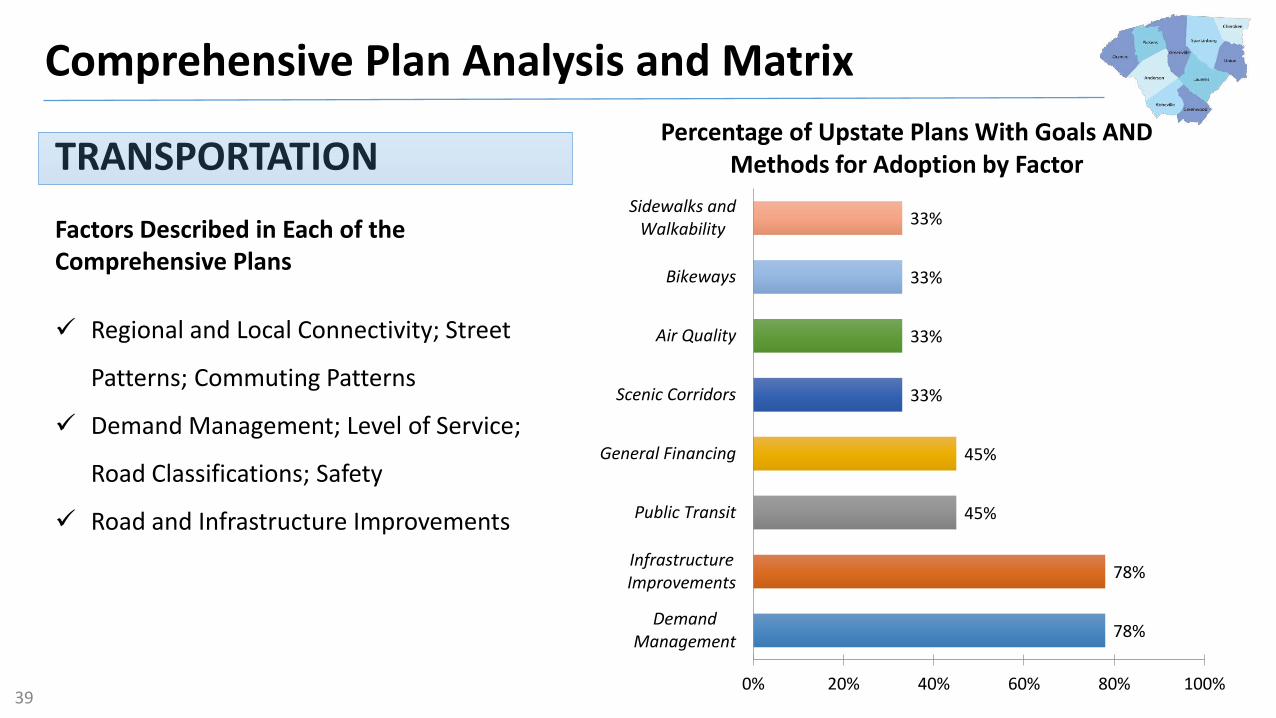
78%
78%
45%
45%
33%
33%
33%
33%
0% 20% 40% 60% 80% 100%
Demand
Management
Infrastructure
Improvements
Public Transit
General Financing
Scenic Corridors
Air Quality
Bikeways
Sidewalks and
Walkability
Percentage of Upstate Plans With Goals AND
Methods for Adoption by Factor TRANSPORTATION
Factors Described in Each of the
Comprehensive Plans
Regional and Local Connectivity; Street
Patterns; Commuting Patterns
Demand Management; Level of Service;
Road Classifications; Safety
Road and Infrastructure Improvements
39

Upstate Future Land Use
The project team retrieved ArcGIS Future Land Use files from the counties that were able to provide them. Each county has a different approach to its future land use map. In order to make the combined map more useful, the tea ollapsed ea h of the ou t ’s u i ue la d use categories into the following:
• Low-Density Residential
• Medium-Density Residential
• High-Density Residential
• Commercial
• Industrial
• Public
• Open Space, Recreation, and Agriculture
• U.S. Forest
• Municipal
Cherokee, Union, Laurens, and Abbeville County did not have future land use maps. The land uses represented in the model are representative of the current land uses for each of those respective counties.
This map allows planners to compare land use patterns across jurisdictional borders and sheds light on current development strategies. It is a tool to identify key challenges and opportunities, such as incompatible development patterns or potential inter-jurisdictional partnerships for community facilities.
40
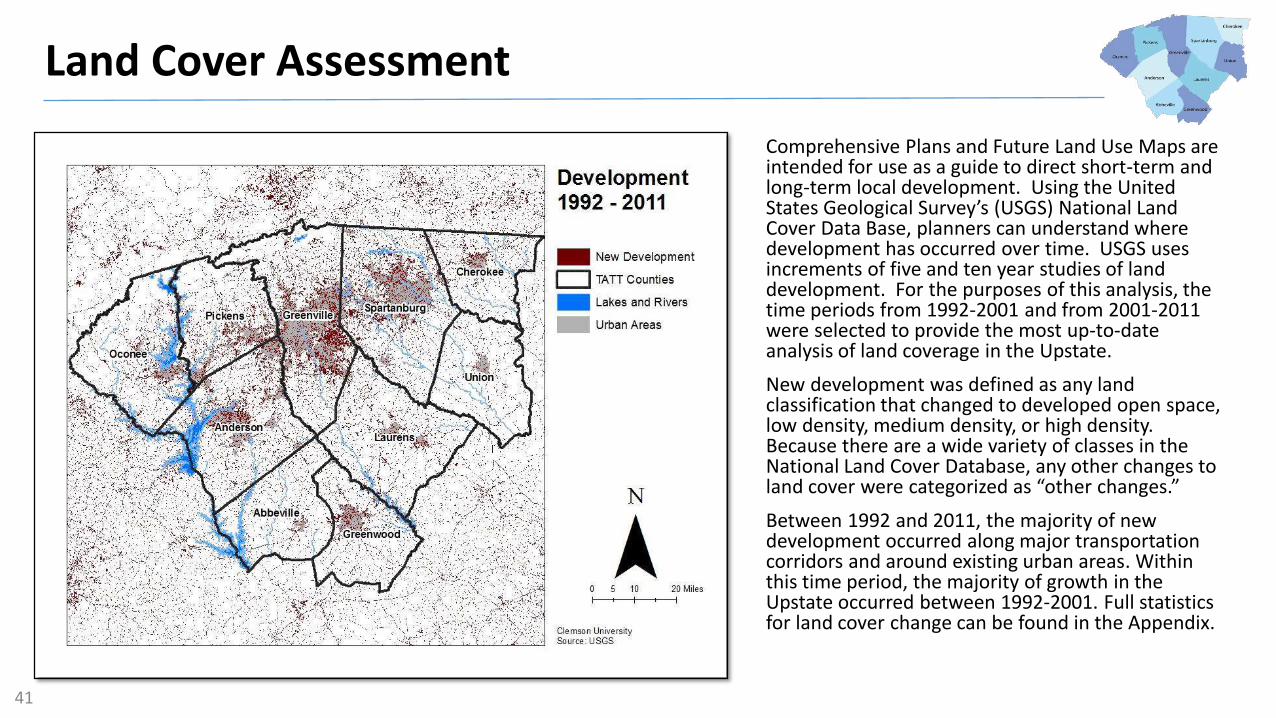
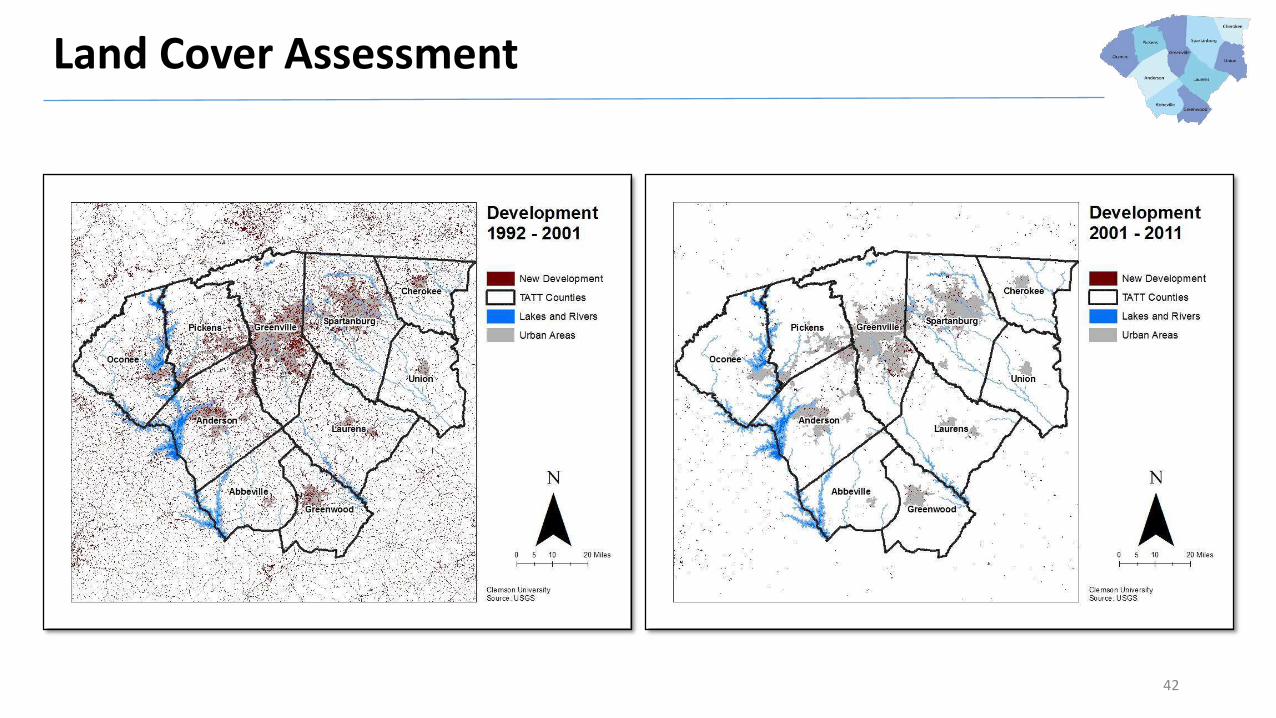
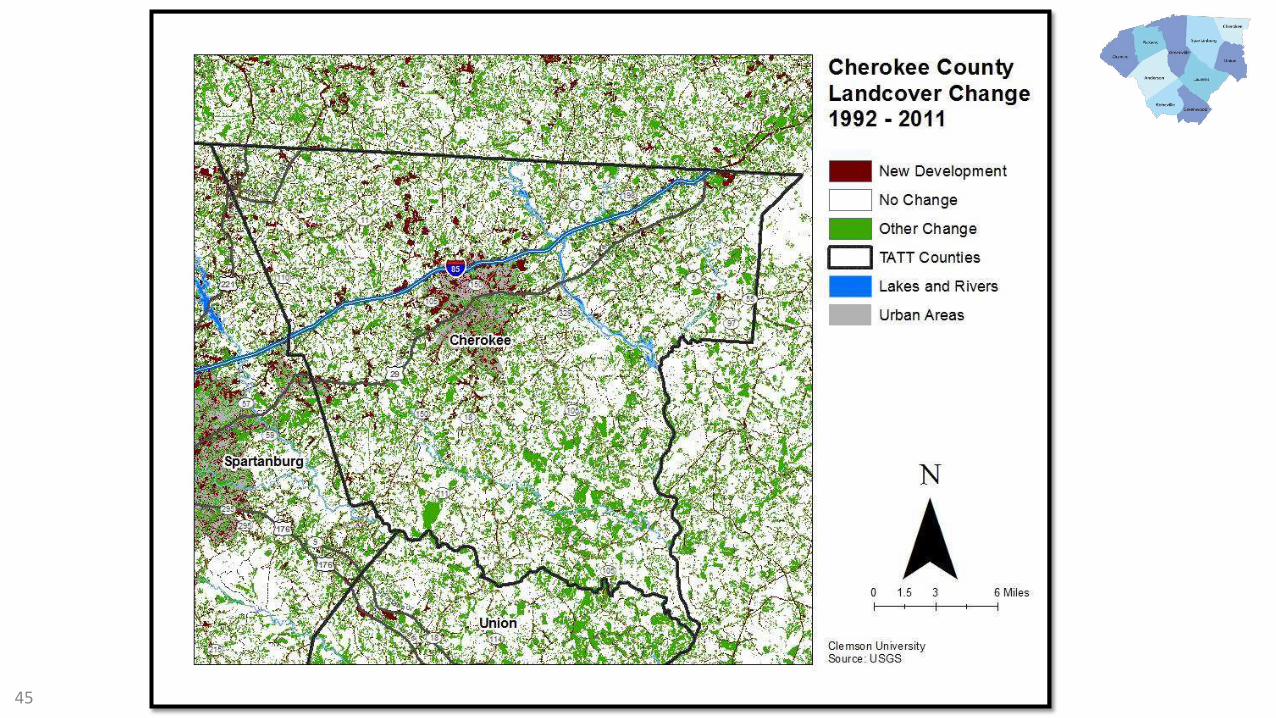
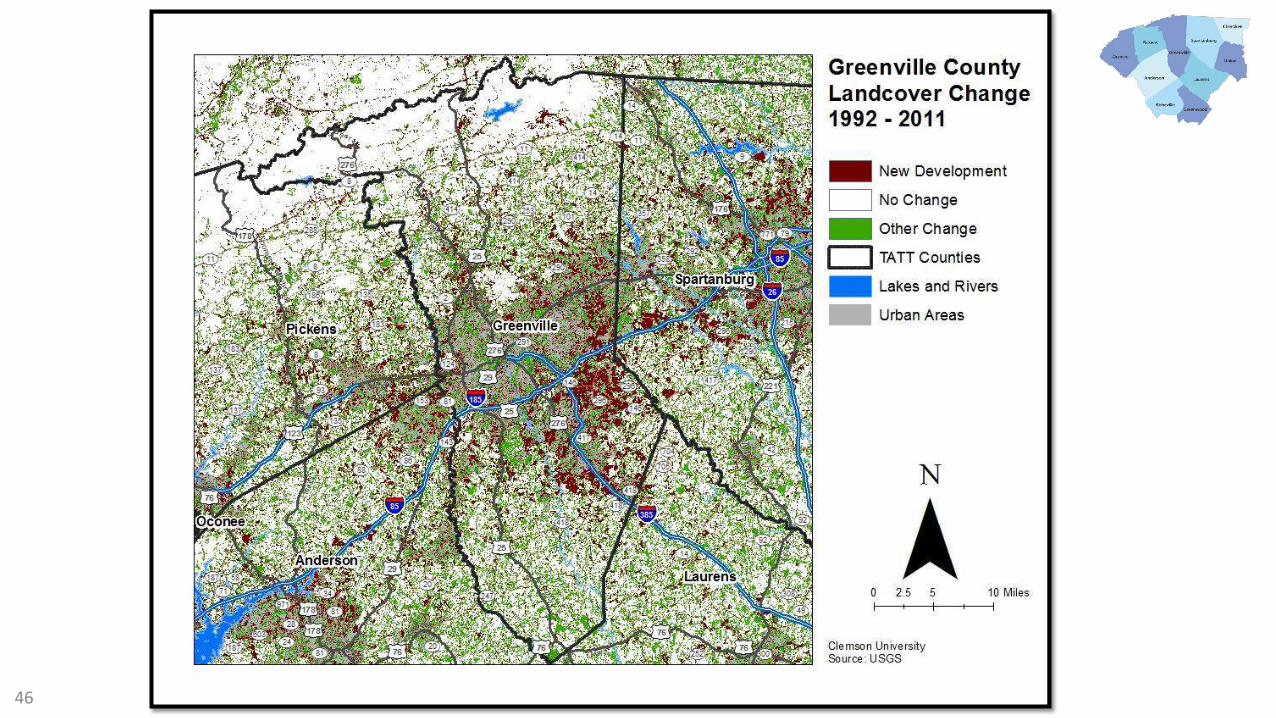
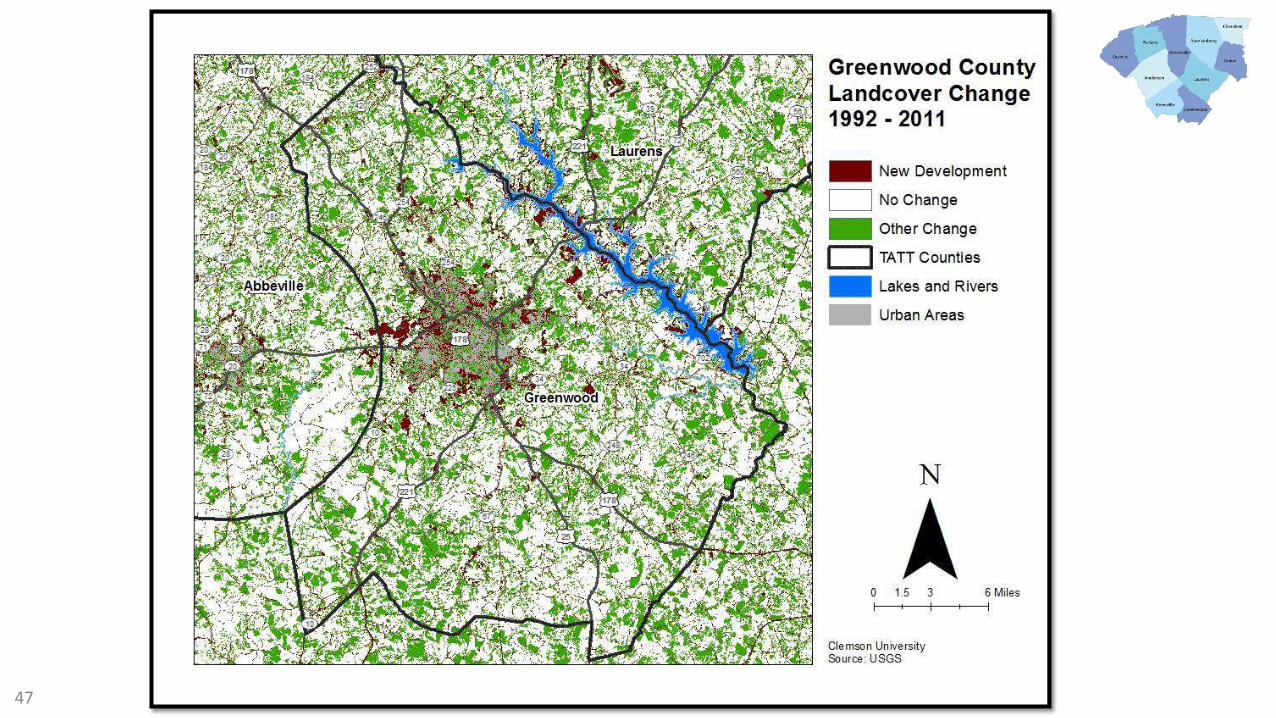
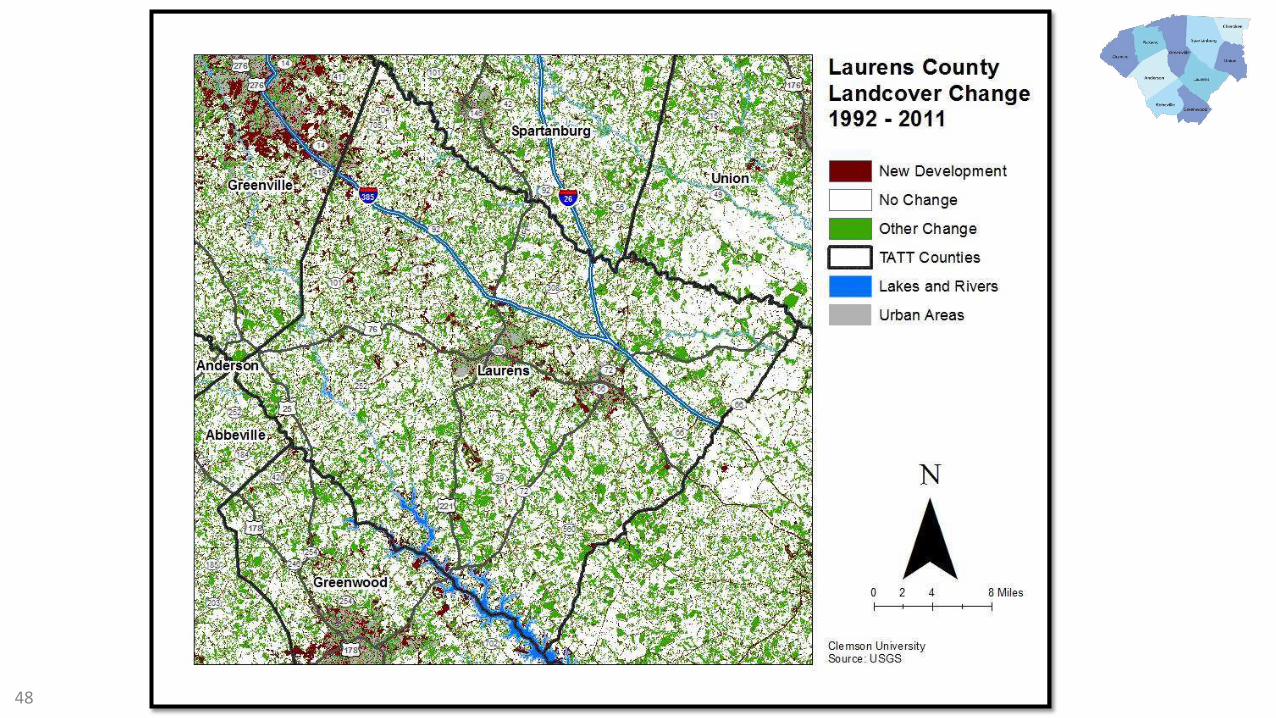
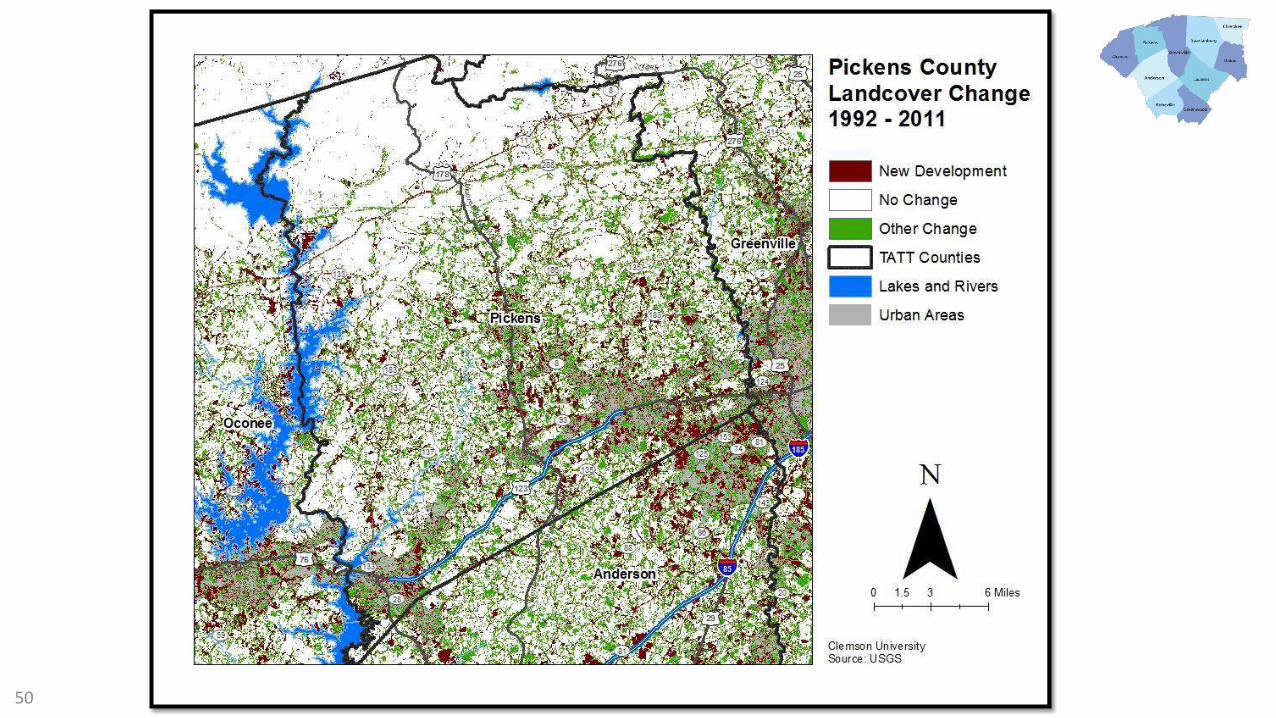
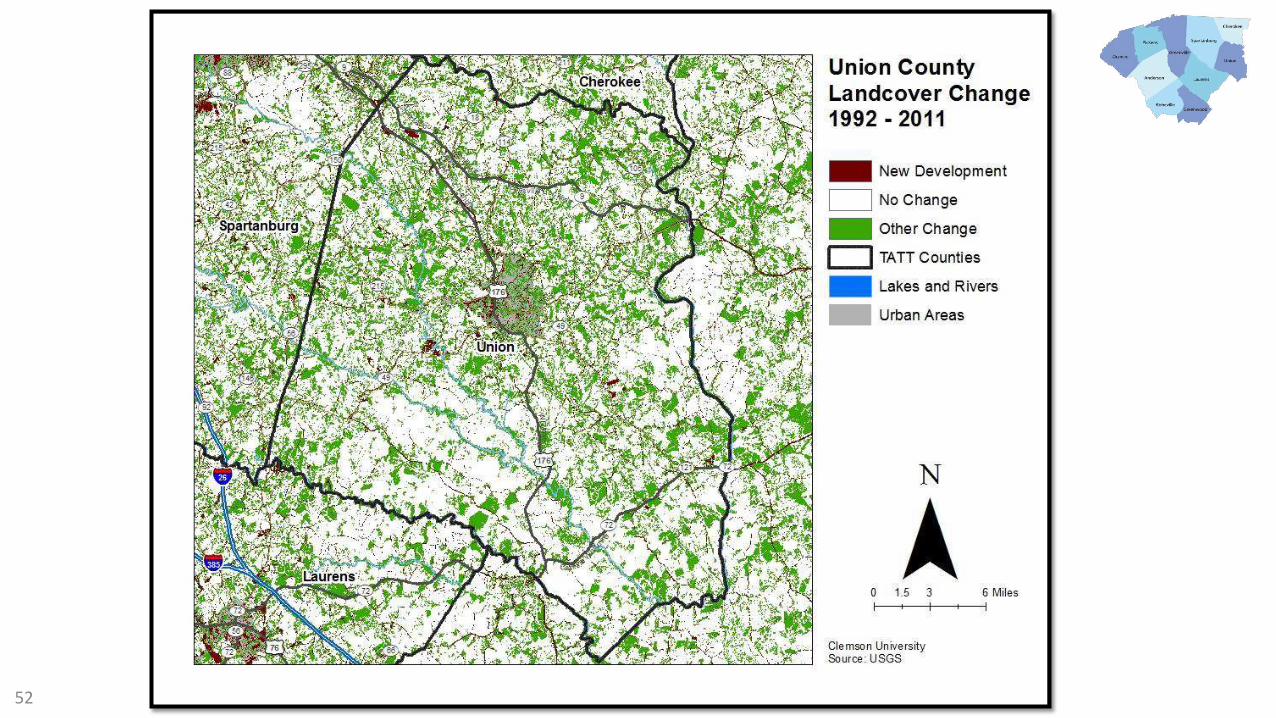
Land Cover Assessment
Comprehensive Plans and Future Land Use Maps are intended for use as a guide to direct short-term and long-term local development. Using the United “tates Geologi al “u e ’s U“G“ Natio al La d Cover Data Base, planners can understand where development has occurred over time. USGS uses increments of five and ten year studies of land development. For the purposes of this analysis, the time periods from 1992-2001 and from 2001-2011 were selected to provide the most up-to-date analysis of land coverage in the Upstate.
New development was defined as any land classification that changed to developed open space, low density, medium density, or high density. Because there are a wide variety of classes in the National Land Cover Database, any other changes to la d o e e e atego ized as othe ha ges. Between 1992 and 2011, the majority of new development occurred along major transportation corridors and around existing urban areas. Within this time period, the majority of growth in the Upstate occurred between 1992-2001. Full statistics for land cover change can be found in the Appendix.
41
Land Cover Assessment
42

43

44
45
46
47
48

49
50

51
52

Regional SWOT Analysis
Using information gathered from the county comprehensive plans and the first four parts of this project as a guide, the team conducted a series of regional analyses to highlight the strengths, weaknesses, opportunities, and threats (SWOT) to the Upstate region by element.
Specifically, the SWOT Analysis focuses on cross-jurisdictional topics such as the transportation network, watershed quality, and economic development strategies. Although some of these topics are more relevant to some counties than others, the current analysis attempts to analyze how some of these trends will positively or negative affect the Upstate.
Co p ehe si e pla s e ist as a efle tio of a o u it ’s olle ti e isio . The “WOT a al sis focuses on the issues that are most consistently identified in the comprehensive plans of the Upstate. It can be used in conjunction with other planning documents and data to inform proactive public policy and to foster regional partnerships.
53
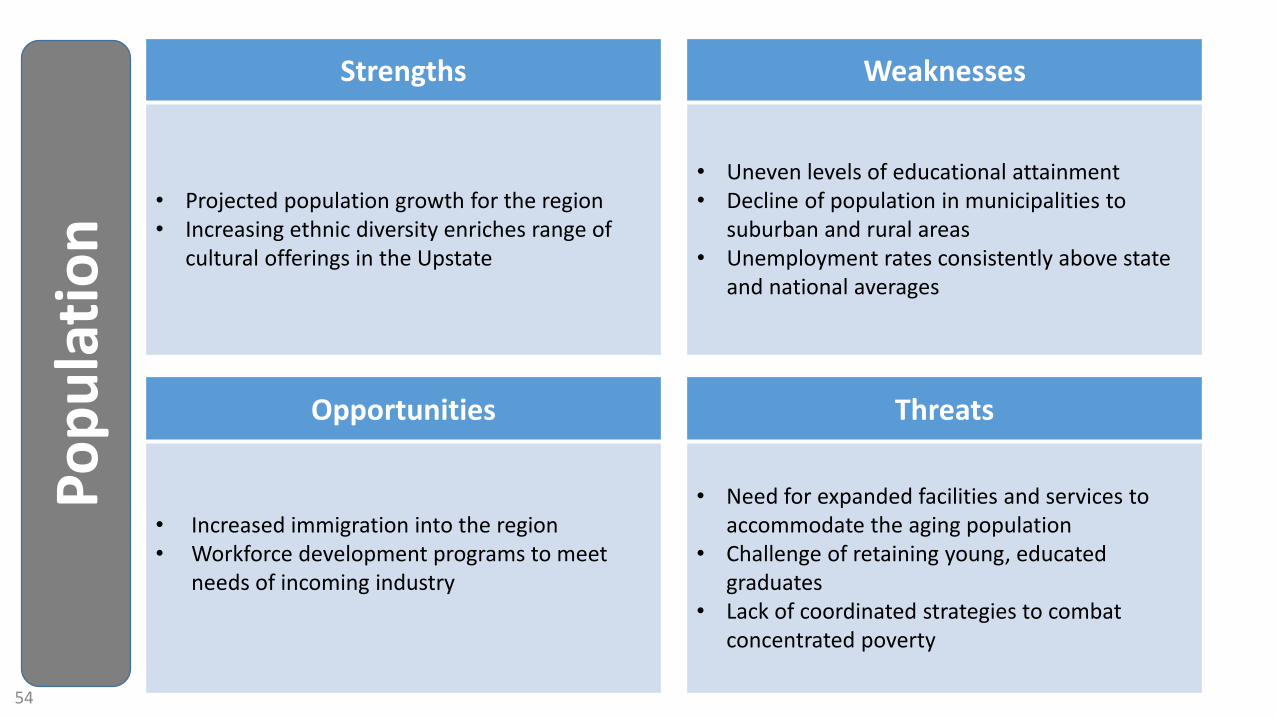
Po
pu
lati
on
Strengths
• Projected population growth for the region
• Increasing ethnic diversity enriches range of
cultural offerings in the Upstate
Weaknesses
• Uneven levels of educational attainment
• Decline of population in municipalities to
suburban and rural areas
• Unemployment rates consistently above state
and national averages
Opportunities
• Increased immigration into the region
• Workforce development programs to meet
needs of incoming industry
Threats
• Need for expanded facilities and services to
accommodate the aging population
• Challenge of retaining young, educated
graduates
• Lack of coordinated strategies to combat
concentrated poverty
54

Eco
no
mic
Strengths
• Strong regional development organizations such as Upstate
Alliance
• Widespread development of local Economic Development
organizations
• Widespread support for industrial recruitment strategies
• Common recognition of the potential impacts of
development
• Public Private partnerships for R&D
• Infrastructure support industrial development
• Strong support for workforce development through
educational strategies
• Quality higher education institutions
Weaknesses
• Little mention of business expansion and retention strategies
• Low wages and income compared to state averages.
• Programs for entrepreneurs/small business fairly absent in
planning elements
• Low retention rate for young graduates
• Lack of housing near places of employment
• Lack of specificity of economic development strategies
Opportunities
• Planning for agricultural development
• Marketing for outdoor recreation and tourism
• Increased land use controls to assure the availability of
industrial/commercial land
• Inter-jurisdictional partnerships for industrial parks
• Attraction of industry based on improved quality of
life/amenities
• Concentration of industry on existing infrastructure/infill
development
Threats
• Uncertain funding for future transportation improvements
• Increased mechanization of industry
• Shrinking manufacturing employment
• Diminished air quality potential impediment to growth
55
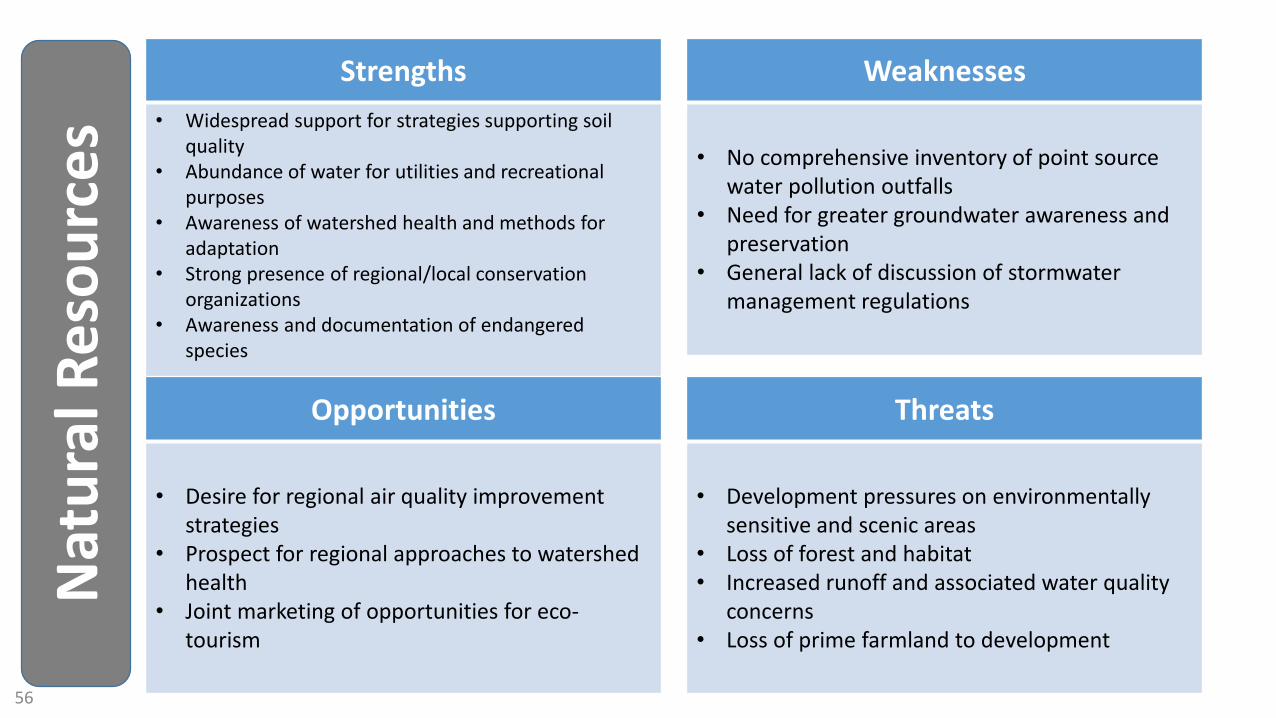
Na
tura
l R
eso
urc
es
Strengths
• Widespread support for strategies supporting soil
quality
• Abundance of water for utilities and recreational
purposes
• Awareness of watershed health and methods for
adaptation
• Strong presence of regional/local conservation
organizations
• Awareness and documentation of endangered
species
Weaknesses
• No comprehensive inventory of point source
water pollution outfalls
• Need for greater groundwater awareness and
preservation
• General lack of discussion of stormwater
management regulations
Opportunities
• Desire for regional air quality improvement
strategies
• Prospect for regional approaches to watershed
health
• Joint marketing of opportunities for eco-
tourism
Threats
• Development pressures on environmentally
sensitive and scenic areas
• Loss of forest and habitat
• Increased runoff and associated water quality
concerns
• Loss of prime farmland to development
56
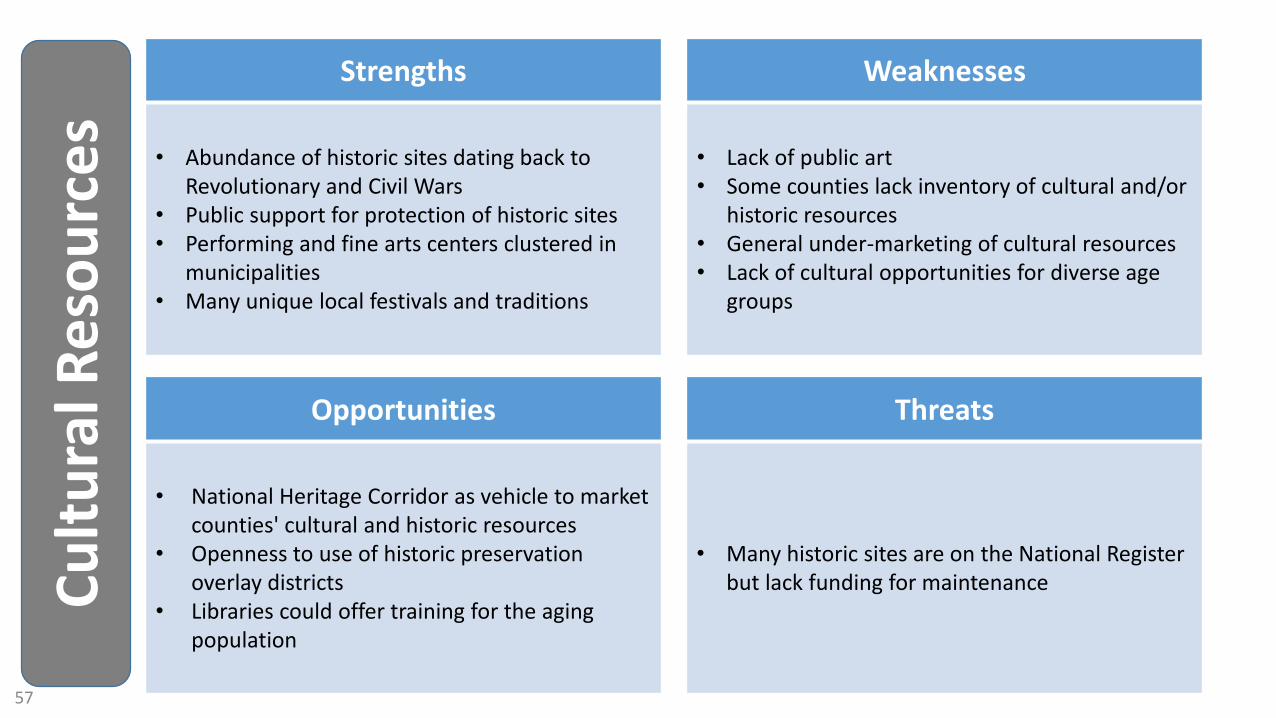
Cu
ltu
ral
Re
sou
rce
sStrengths
• Abundance of historic sites dating back to
Revolutionary and Civil Wars
• Public support for protection of historic sites
• Performing and fine arts centers clustered in
municipalities
• Many unique local festivals and traditions
Weaknesses
• Lack of public art
• Some counties lack inventory of cultural and/or
historic resources
• General under-marketing of cultural resources
• Lack of cultural opportunities for diverse age
groups
Opportunities
• National Heritage Corridor as vehicle to market
counties' cultural and historic resources
• Openness to use of historic preservation
overlay districts
• Libraries could offer training for the aging
population
Threats
• Many historic sites are on the National Register
but lack funding for maintenance
57
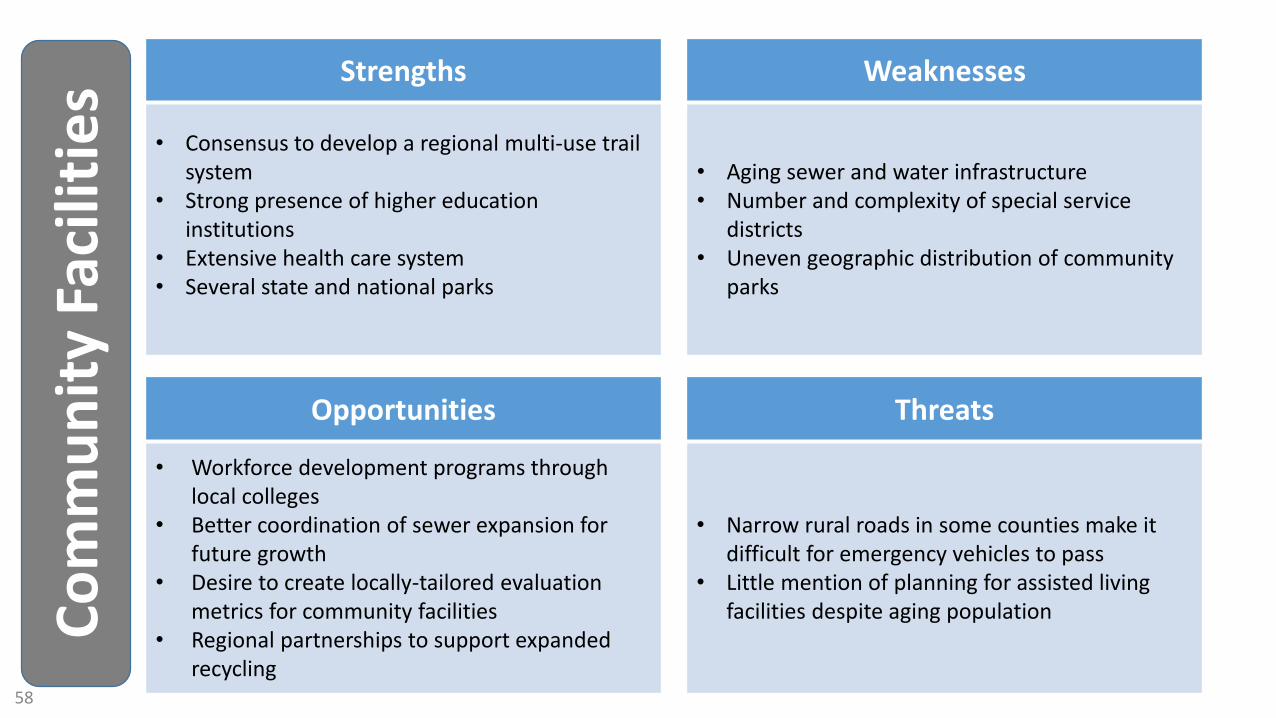
Co
mm
un
ity
Fa
cili
tie
sStrengths
• Consensus to develop a regional multi-use trail
system
• Strong presence of higher education
institutions
• Extensive health care system
• Several state and national parks
Weaknesses
• Aging sewer and water infrastructure
• Number and complexity of special service
districts
• Uneven geographic distribution of community
parks
Opportunities
• Workforce development programs through
local colleges
• Better coordination of sewer expansion for
future growth
• Desire to create locally-tailored evaluation
metrics for community facilities
• Regional partnerships to support expanded
recycling
Threats
• Narrow rural roads in some counties make it
difficult for emergency vehicles to pass
• Little mention of planning for assisted living
facilities despite aging population
58

Ho
usi
ng
Strengths
• Natural resources promote strong residential
growth
• Strong support for equitable housing growth
• Robust home ownership
• Overall support for infill development
• Planners oriented toward land conservation
• Awareness and planning for diverse housing
needs
Weaknesses
• Scarcity of affordable housing
• Lack of housing for the elderly
• Cost burdens (Tenants paying more than 30% of
their income in rent)
• Concentrations of manufactured housing
• Uneven support for mixed use development
• Historical preservation of housing infrequently
emphasized
• Lack of emphasis on credit and lending
Opportunities
• Growing housing market for retirees
• Breadth of support for inter-jurisdictional
partnerships
• Exploring incentives for affordable housing
development
Threats
• Under-regulated residential growth
• Lack of energy efficiency contributing to
housing cost
• Uncertainty of future housing funds/grants
• Low growth in family households
• Regulatory barriers to affordable housing
development
59
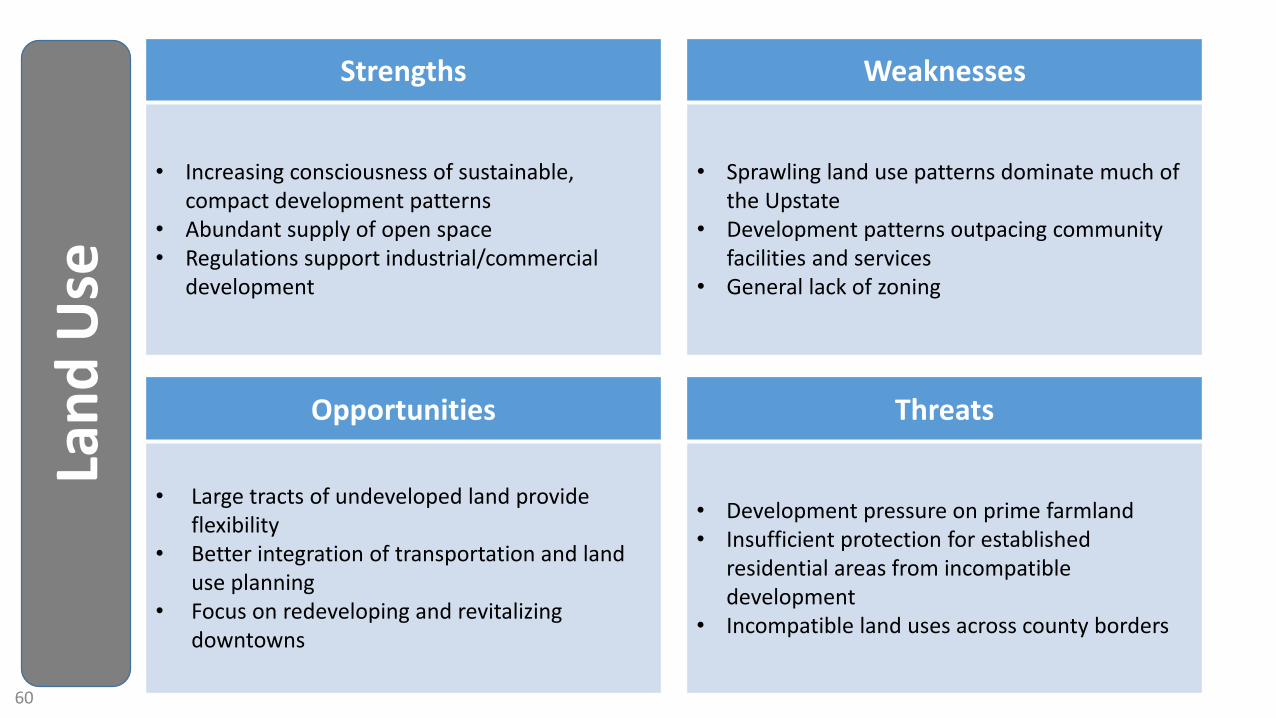
Lan
d U
seStrengths
• Increasing consciousness of sustainable,
compact development patterns
• Abundant supply of open space
• Regulations support industrial/commercial
development
Weaknesses
• Sprawling land use patterns dominate much of
the Upstate
• Development patterns outpacing community
facilities and services
• General lack of zoning
Opportunities
• Large tracts of undeveloped land provide
flexibility
• Better integration of transportation and land
use planning
• Focus on redeveloping and revitalizing
downtowns
Threats
• Development pressure on prime farmland
• Insufficient protection for established
residential areas from incompatible
development
• Incompatible land uses across county borders
60
Tra
nsp
ort
ati
on
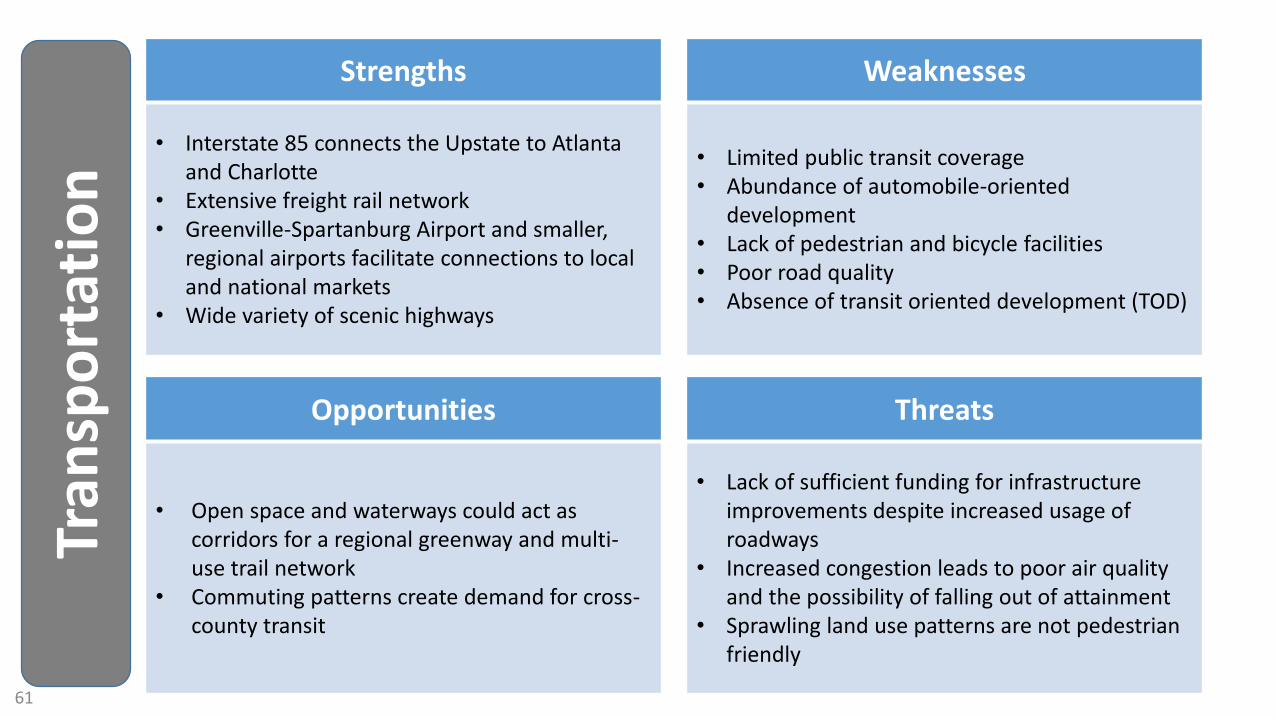
Strengths
• Interstate 85 connects the Upstate to Atlanta
and Charlotte
• Extensive freight rail network
• Greenville-Spartanburg Airport and smaller,
regional airports facilitate connections to local
and national markets
• Wide variety of scenic highways
Weaknesses
• Limited public transit coverage
• Abundance of automobile-oriented
development
• Lack of pedestrian and bicycle facilities
• Poor road quality
• Absence of transit oriented development (TOD)
Opportunities
• Open space and waterways could act as
corridors for a regional greenway and multi-
use trail network
• Commuting patterns create demand for cross-
county transit
Threats
• Lack of sufficient funding for infrastructure
improvements despite increased usage of
roadways
• Increased congestion leads to poor air quality
and the possibility of falling out of attainment
• Sprawling land use patterns are not pedestrian
friendly
61
Conclusions
One of the fundamental goals of this project was to identify trends in the comprehensive plans of the Upstate counties. The first step of this analysis was to distill the content of the plans into the standardized framework of the planning element matrices. The matrices are a quick and easy way to identify the topics that counties are focusing on and the ways in which they discuss them. The team used the details of the matrices to communicate the overarching themes affecting each policy area in the Upstate. There is a substantial amount of overlap between some of the elements, demonstrating the holistic nature of the planning profession. Poor air quality is an environmental concern, but it is equally concerning from a public health and economic development point of view. Promoting infill development over sprawl is efficient in terms of community facilities, but it may also benefit public transit and reduce development pressure on sensitive environmental areas.
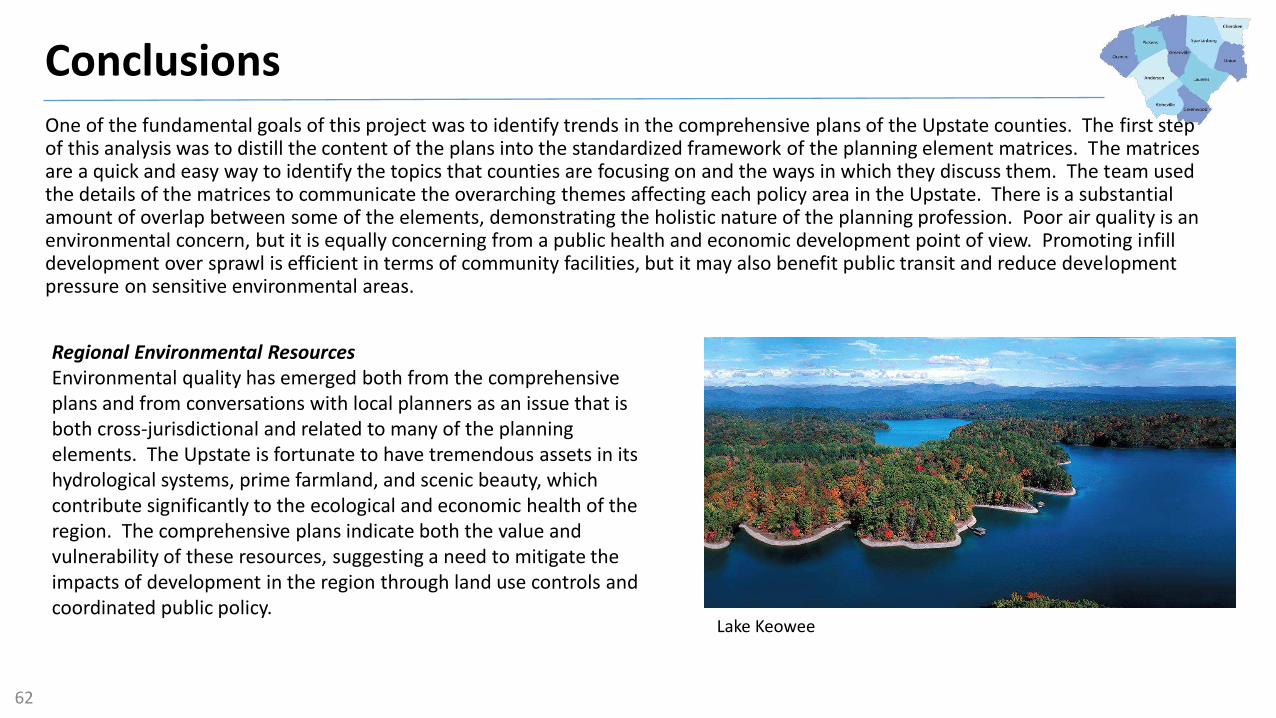
Regional Environmental Resources
Environmental quality has emerged both from the comprehensive
plans and from conversations with local planners as an issue that is
both cross-jurisdictional and related to many of the planning
elements. The Upstate is fortunate to have tremendous assets in its
hydrological systems, prime farmland, and scenic beauty, which
contribute significantly to the ecological and economic health of the
region. The comprehensive plans indicate both the value and
vulnerability of these resources, suggesting a need to mitigate the
impacts of development in the region through land use controls and
coordinated public policy.Lake Keowee
62

Conclusions
All nine of the plans discussed watershed health, with six of the plans describing previous efforts to address the issue and general plans to improve water quality. Four of the plans recommend specific water policy strategies, including land development regulations to reduce stormwater runoff. Watershed health was most thoroughly covered by the counties in the northwest corner of the region, as this is the location of Lakes Jocassee, Keowee, Hartwell, and Greenwood. The quality of these water sources will depend heavily on cross-jurisdictional efforts to reduce the impact of development. Even the counties that are not directly adjacent to a lake must be included in these efforts, as the tributaries extend across political boundaries. A number of counties rely on the lakes for drinking water, and the regional economic impact of their recreational draw is significant.
. The comprehensive plans indicated the need for a comprehensive inventory of point
source pollution outfalls in the area. Five plans address non-point sources of
pollution through stormwater management in their natural resources element. One
plan discusses previous efforts to address the issue and two plans set specific goals
for future remediation. New impervious surfaces such as roads and parking lots
contribute to non-point source pollution by preventing water from naturally filtering
through soil and vegetation before reaching ground and surface water supplies.
Although an increase in impervious surface is inevitable with new development,
there are strategies to reduce runoff. Three plans raised the issue of increasing
impervious surfaces and established goals to address it in the future. For example,
G ee ood Cou t set the e pli it st ateg of i easi g the i pe ious su fa e atio e ui e e ts fo iti al ate sheds of the ou t as ell as e ou agi g
development with pervious surface (Greenwood County, 2011). Any long-term
strategy to improve watershed health will need to include all stakeholders within the
watershed. Planners could help facilitate this process.
Furman University Rain Garden
(Greenville County)
63
Conclusions
Another regional concern that emerged from both the natural resources and economic elements was the wealth of prime agriculturalland, the continuing economic importance of the agricultural sector, and the need to protect prime farmland and soil from theimpacts of unregulated development. All nine plans engaged soil quality, with five of them recommending specific goals. In Anderson Cou t , he e % soils a e lassified as p i e fa la d o fa la d of state ide i po ta e, st ategies ha e e ol ed to e phasize the importance of this resource in land development, such as the maintenance of agricultural districts as well as the future requirement that infrastructure projects minimize their impact on prime agricultural land (Anderson County, 2013). Seven plans discussed agriculture in terms of economic development and six offered goals to support the sector. This topic was covered mostextensively by Greenwood County, which pointed out that its farms have increased in productivity even as the aggregate number offarms has decreased. The increasing consolidation of agricultural markets could create economic challenges for small and mid-size producers. Some counties have begun regional efforts to preserve smaller-scale farmland. For example, Greenwood County describes its five- ou t pa t e ship ith the He itage Co ido Fa e s Asso iatio , a d the o ga izatio ’s effo ts to i t odu e an agriculture component to the National Heritage Corridor. With the regional presence of several major agricultural institutions, the Upstate could create regional partnerships to support agricultural development and the preservation of important soil.
Air quality is a significant issue facing the Upstate, not only for physical health of residents, but the also the economic well-being of the region. If portions of the Upstate fall into non-attainment for EPA air quality standards, as they have done in the past, it will be more difficult for the Upstate to attract industry. Despite the regional importance of the issue, our research found only five counties engaging the topic in comprehensive planning. This may be a reflection of the fact that critical areas for ground level ozone are surrounding the I-85 corridor that intersects five counties in the study area. However, with the regional importance of this corridor and the role it plays in transporting goods and the workforce throughout the region, a broad-based effort to manage travel demand may be one way to reduce emissions. Eight of the plans include goals to reduce congestion through travel demand, with five of these including goals to increase the provision of public transit. The significant level of commuting between counties might be anopportunity to reduce demand through expanded transit service.
64
Conclusions
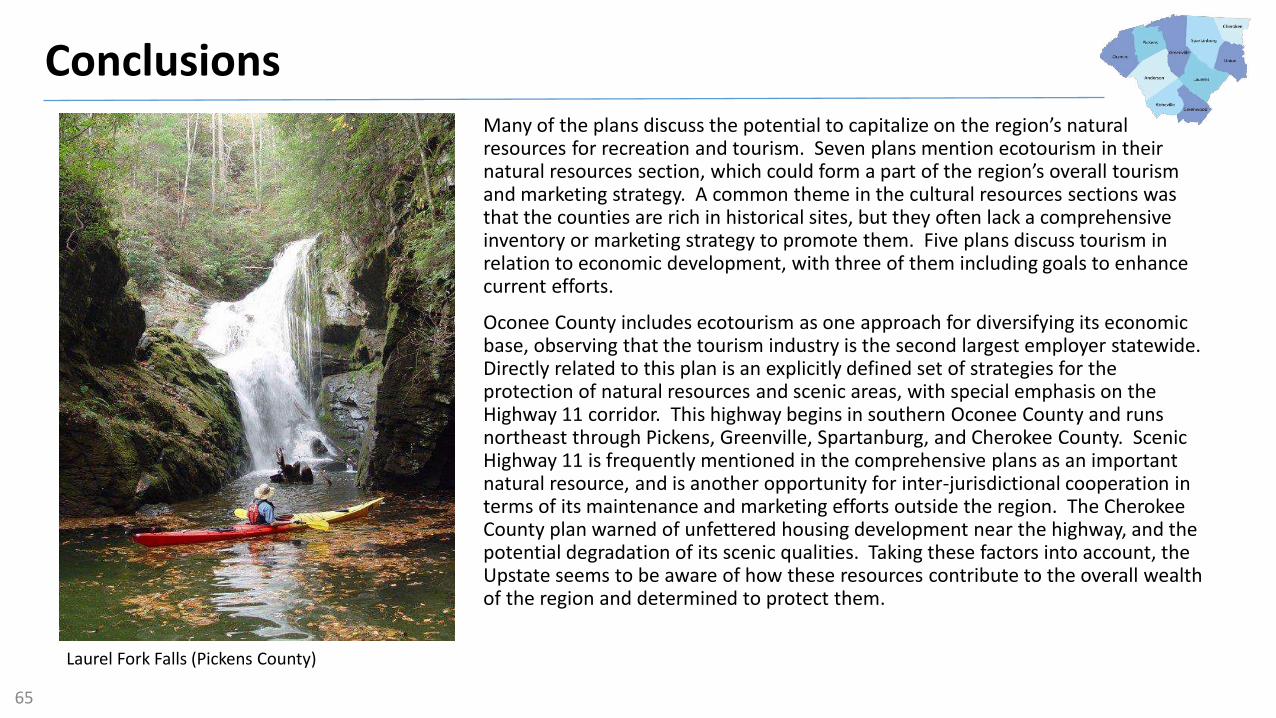
Ma of the pla s dis uss the pote tial to apitalize o the egio ’s atu al resources for recreation and tourism. Seven plans mention ecotourism in their
atu al esou es se tio , hi h ould fo a pa t of the egio ’s o e all tou is and marketing strategy. A common theme in the cultural resources sections was that the counties are rich in historical sites, but they often lack a comprehensive inventory or marketing strategy to promote them. Five plans discuss tourism in relation to economic development, with three of them including goals to enhance current efforts.
Oconee County includes ecotourism as one approach for diversifying its economic base, observing that the tourism industry is the second largest employer statewide. Directly related to this plan is an explicitly defined set of strategies for the protection of natural resources and scenic areas, with special emphasis on the Highway 11 corridor. This highway begins in southern Oconee County and runs northeast through Pickens, Greenville, Spartanburg, and Cherokee County. Scenic Highway 11 is frequently mentioned in the comprehensive plans as an important natural resource, and is another opportunity for inter-jurisdictional cooperation in terms of its maintenance and marketing efforts outside the region. The Cherokee County plan warned of unfettered housing development near the highway, and the potential degradation of its scenic qualities. Taking these factors into account, the Upstate seems to be aware of how these resources contribute to the overall wealth of the region and determined to protect them.
Laurel Fork Falls (Pickens County)
65

Conclusions
Economic and Human Potential
The most frequently cited economic development tools in the Upstate are the diversification of the economic base and strategies for targeted industrial recruitment, with seven plans discussing these approaches. The regional focus on these strategies is attributed to the decline of textile manufacturing over the past few decades. The Upstate has retained its interest in manufacturing, but hasnarrowed its focus to include sectors with advanced technology, high growth potential, and high wages. It has benefited from its location and strong transportation links to the larger regional markets of Atlanta and Charlotte. However, in order to successfully recruit advanced manufacturing firms, professional services, and knowledge-based industries, the Upstate must also prepare its workforce with adequate skills and education to fill the jobs. Six plans mentioned the link between education and economic de elop e t, a d the all eithe des i ed futu e goals o p e ious effo ts to i ease thei ou t ’s edu atio al attai e t. This is encouraging because parts of the Upstate have traditionally lagged in both educational attainment and educational funding per pupil. The increasing presence of higher education institutions and new research and development facilities connected to industry clusters, su h as those e tio ed i A de so a d G ee ood’s pla s, suggest i eased oppo tu ities fo o kfo e de elop e t i the Upstate.
Another component of the regional economic strategy is future land use planning. Seven plans identified land use controls as a critical tool to promote the development of industry. Proactive planning prevents prime industrial land from conversion to other uses and allows for the coordinated development of infrastructure. In addition, this type of planning reduces future conflicts between incompatible land uses. These discussions tended to under represent goals and strategies for small business and entrepreneurialdevelopment. Because a vast number of jobs are created by small businesses, it was surprising not to see a more robust coverage of the area. However, it may be that small business development is relegated to smaller area plans and community development, while county-wide plans focus on a broader view.
66

Limitations
The fundamental focus of the research was the analysis of land use and development strategies in the Upstate region by comparingcomprehensive plans, one of the fundamental documents that guide these processes from a public policy perspective. Certainly, there is significant insight to be derived from an examination of the essential components of these plans, identifying the primary differences and commonalities in order to illuminate the potential for collaboration, as well as possible areas of disagreement as multiple jurisdictions navigate through collective challenges and manage common resources. The team would like to extend our sincerest gratitude to all of the planners and professionals who contributed their time, resources, and expertise to this project.
The majority of the data for this project was derived solely from these documents, while a robust and voluminous trove of regional data and designs, there were limitations in relying solely on comprehensive plans to generalize about regional trends. For example, if a particular strategy or concept is missing from the majority of plans, this may either indicate that it is irrelevant to the upstate planning context, or that it was overlooked or intentionally omitted. Two very different conclusions derive from either scenario, presenting a challenge to the team in interpretation.
There was a significant issue presented by the age of several plans reviewed by the team. With the amount of time elapsed since the drafting of several comprehensive plans, the team was at times concerned in regard to the potential obsolescence of certain data. Comprehensive plans, while in general are future oriented documents, are drafted at a point in time and may heavily reflect the most salient concerns of that particular moment. Therefore, this analysis reflects a synthesis of numerous points in time, which complicates the comparability of these documents. In certain cases the team was tempted to reach beyond the comprehensive plan, to update the data presented with more contemporary information applicable to the material discussed in the document. However, to carry out this process consistently throughout the analysis of all nine plans would have expanded the scope of the project significantly, in addition to fundamentally altering the nature of the inquiry.
67
Limitations
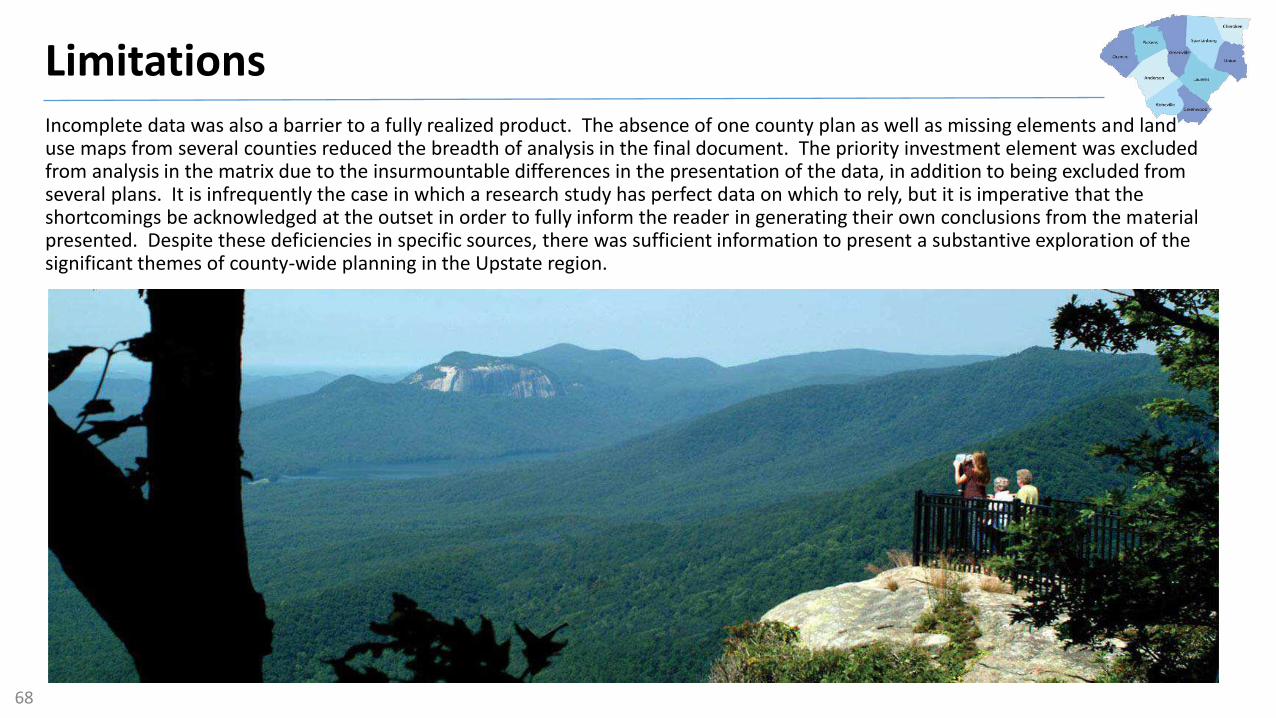
Incomplete data was also a barrier to a fully realized product. The absence of one county plan as well as missing elements and land use maps from several counties reduced the breadth of analysis in the final document. The priority investment element was excluded from analysis in the matrix due to the insurmountable differences in the presentation of the data, in addition to being excluded from several plans. It is infrequently the case in which a research study has perfect data on which to rely, but it is imperative that the shortcomings be acknowledged at the outset in order to fully inform the reader in generating their own conclusions from the material presented. Despite these deficiencies in specific sources, there was sufficient information to present a substantive exploration of the significant themes of county-wide planning in the Upstate region.
68

Future Research
For a more holistic view of comprehensive planning in the ten counties, future research should take into consideration the
comprehensive plans of the major municipalities in the study area, in addition to the county seats. The fact that a significant
amount of the growth in the study area has occurred in unincorporated places, and the vast amount of land is covered in
county planning makes our project a necessary first step to assessing the dominant land use trends and planning issues in the
region. The opportunities for collaboration that were discussed in the county plans were frequently made in reference to
their municipalities. Therefore, the ability to magnify the future land patterns of the county and municipal boundaries would
demonstrate how these partnerships are borne out in reality. As we have drawn in our conclusion, some of the sub-elements
that we have investigated within the nine planning elements could be potentially more oriented toward municipal planning
processes than county wide planning. Taking these factors into account, exploring the plans of the major municipalities in
the ten counties would provide a more robust view of how our sub-elements and associated criteria are represented in the
upstate.
69

Appendix
-
50.00
100.00
150.00
200.00
250.00
Abbeville Anderson Cherokee Greenville Greenwood Laurens Oconee Pickens Spartanburg Union
Urb
an
La
nd
Co
ve
r (m
ile
s2)
TATT Urban Land Cover Change
1992
2001
2011
Source: U.S.G.S.70

Appendix
County 1992 2001 2011 Change (92 – 11)
Abbeville 29.02 34.86 35.67 6.65
Anderson 102.69 130.21 139.71 37.01
Cherokee 36.12 43.95 45.42 9.29
Greenville 170.74 205.38 227.28 56.55
Greenwood 45.80 55.39 57.85 12.04
Laurens 54.69 70.50 73.08 18.39
Oconee 42.26 63.20 68.01 25.75
Pickens 56.42 76.76 80.66 24.25
Spartanburg 144.99 170.57 185.51 40.52
Union 25.67 27.74 28.57 2.90
Total 708.41 878.56 941.75 233.34
TATT Urban Land Cover Change (in miles2)
Source: U.S.G.S.
71
Appendix
0.0%
2.0%
4.0%
6.0%
8.0%
10.0%
12.0%
14.0%
16.0%
18.0%
USA South Carolina TATT
Po
pu
lati
on
Gro
wth
Ra
te
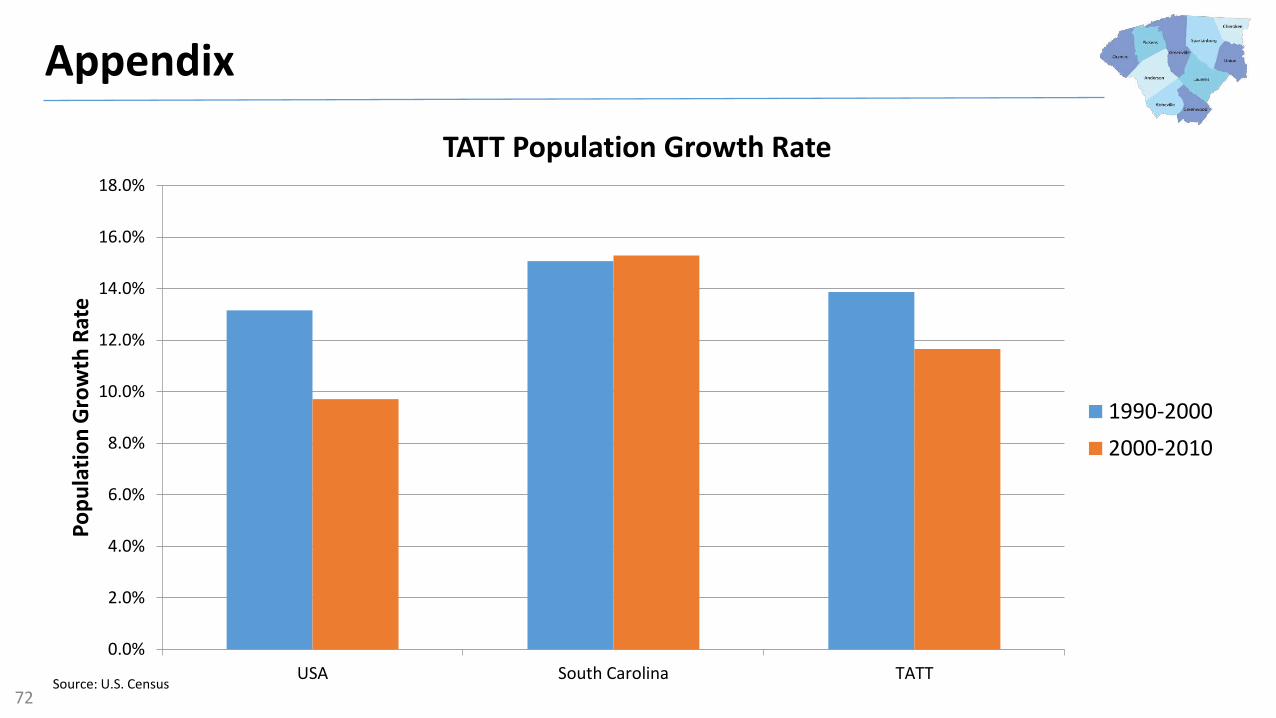
TATT Population Growth Rate
1990-2000
2000-2010
Source: U.S. Census72
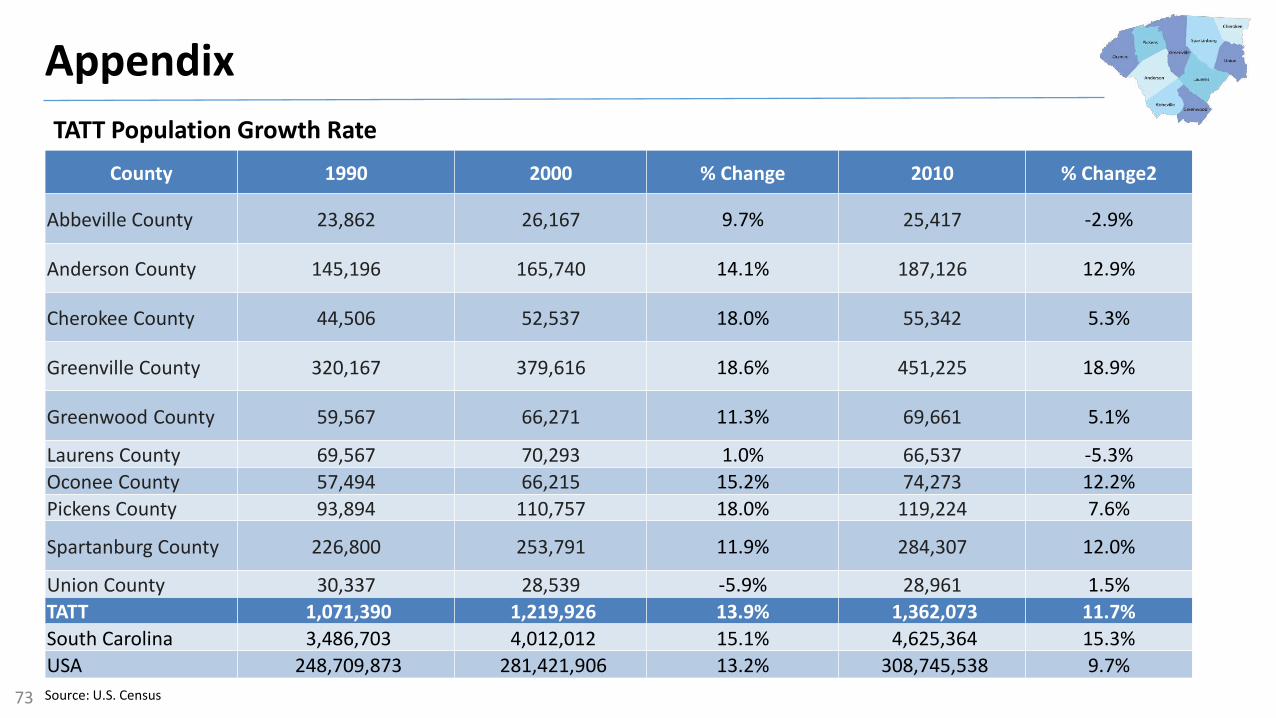
County 1990 2000 % Change 2010 % Change2
Abbeville County 23,862 26,167 9.7% 25,417 -2.9%
Anderson County 145,196 165,740 14.1% 187,126 12.9%
Cherokee County 44,506 52,537 18.0% 55,342 5.3%
Greenville County 320,167 379,616 18.6% 451,225 18.9%
Greenwood County 59,567 66,271 11.3% 69,661 5.1%
Laurens County 69,567 70,293 1.0% 66,537 -5.3%
Oconee County 57,494 66,215 15.2% 74,273 12.2%
Pickens County 93,894 110,757 18.0% 119,224 7.6%
Spartanburg County 226,800 253,791 11.9% 284,307 12.0%
Union County 30,337 28,539 -5.9% 28,961 1.5%
TATT 1,071,390 1,219,926 13.9% 1,362,073 11.7%
South Carolina 3,486,703 4,012,012 15.1% 4,625,364 15.3%
USA 248,709,873 281,421,906 13.2% 308,745,538 9.7%
Appendix
TATT Population Growth Rate
Source: U.S. Census73

Appendix
-
500.0
1,000.0
1,500.0
2,000.0
2,500.0
Po
pu
lati
on
De
nsi
ty (
Pe
rso
ns/
mil
e2)
TATT Population Density Change
1990
2000
2010
Source: U.S. Census74
Appendix
Source: U.S. Census
1,300
1,350
1,400
1,450
1,500
1,550
1990 2000 2010
Po
pu
lati
on
De
nsi
ty (
Pe
rso
ns/
mil
e2)
Year
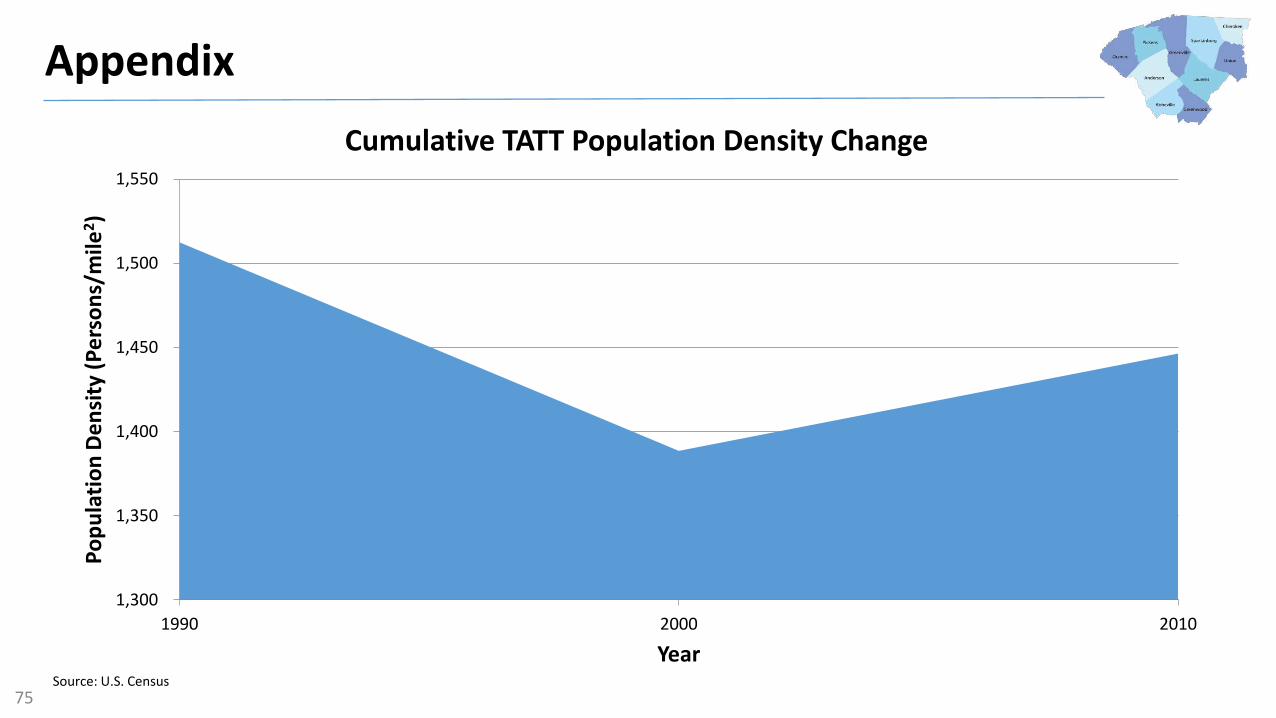
Cumulative TATT Population Density Change
75

County 1990 2000 2010
Abbeville 822.2 750.7 712.6
Anderson 1,413.9 1,272.9 1,339.4
Cherokee 1,232.1 1,195.4 1,218.6
Greenville 1,875.2 1,848.4 1,985.3
Greenwood 1,300.5 1,196.4 1,204.2
Laurens 1,272.1 997.1 910.5
Oconee 1,360.6 1,047.7 1,092.1
Pickens 1,664.3 1,442.9 1,478.0
Spartanburg 1,564.2 1,487.9 1,532.5
Union 1,181.7 1,028.6 1,013.6
Total 1,512.4 1,388.6 1,446.3
Appendix
TATT Population Density (Persons/mile2)
Source: U.S. Census
76

County Last Update
Abbeville County 2007
Anderson County 2012/2007*
Cherokee County 2004
Greenville County 2009
Greenwood
County2011
Laurens County 2011
Oconee County2010
Pickens County2010/2004**
Spartanburg
County1998
Union CountyNone***
77
Upstate County Comprehensive Plans – All comprehensive plans can be accessed by clicking here.
**The Pickens County comprehensive plan analysis was produced using the draft document written in 2010. The document has not been approved by the Pickens County Council to date.
*The Anderson County comprehensive plan analysis was produced using the draft document written in 2012. The document has not been approved by the Anderson County Council to date.
***Union County does not currently have an adopted comprehensive plan for the county.
Appendix