urban effects of chennai on sea breeze induced … effects of chennai on sea breeze induced...
TRANSCRIPT
Urban effects of Chennai on sea breeze inducedconvection and precipitation
Matthew Simpson1,∗, Sethu Raman1, R Suresh2 and U C Mohanty3
1Department of Marine, Earth and Atmospheric Sciences, North Carolina State University,Raleigh, NC 27695-8208, USA.
2India Meteorological Department, Chennai.3Indian Institute of Technology, New Delhi.
∗e-mail: [email protected]
Doppler radar derived wind speed and direction profiles showed a well developed sea breezecirculation over the Chennai, India region on 28 June, 2003. Rainfall totals in excess of 100 mmresulted from convection along the sea breeze front. Inland propagation of the sea breeze frontwas observed in radar reflectivity imagery. High-resolution MM5 simulations were used to investi-gate the influence of Chennai urban land use on sea breeze initiated convection and precipitation.A comparison of observed and simulated 10 m wind speed and direction over Chennai showed thatthe model was able to simulate the timing and strength of the sea breeze. Urban effects are shownto increase the near surface air temperature over Chennai by 3.0 K during the early morning hours.The larger surface temperature gradient along the coast due to urban effects increased onshore flowby 4.0m s−1. Model sensitivity study revealed that precipitation totals were enhanced by 25 mmover a large region 150 km west of Chennai due to urban effects. Deficiency in model physics relatedto night-time forecasts are addressed.
1. Introduction
The city of Chennai has grown into a large urbanregion since its origin as a British colony alongthe southeast coast of India in 1639. An estimated7.5 million people now live within the Chennaimetropolitan area making it India’s fourth largestcity. Chennai’s city limits cover an area of 175 km2
while the metropolitan region covers an area ofroughly 1200 km2. A map showing the location ofChennai along the eastern coast of India is shown infigure 1(a). The Bay of Bengal is located to the eastof Chennai while the western ghats (mountains)dominate the landscape to the west.
A large portion of the annual rainfall overChennai occurs between November and Decemberafter the onset of the Indian northeast monsoon.Less rainfall occurs during the southwest monsoonsince Chennai is in a rain shadow region caused
by mountains along the west coast of India. Rainoccurring during the southwest monsoon is usuallyinitiated by convergence associated with the day-time sea breeze. Simpson et al (2007) showed thatapproximately 75% of the rainfall over Chennaiduring the southwest monsoon is related to thesea breeze induced convection. Understanding theinfluence of large urban areas and sea breeze cir-culations on rainfall along the southeast coast ofIndia is critical to the agriculture and economicinterests in the region during the southwest mon-soon. Studying the strength of the sea breeze is alsoimportant in forecasting the transport of pollutionalong coastal regions (Rhome et al 2002) and forforecasting severe weather episodes (Blanchard andLopez 1985).
Several factors influence the strength of the seabreeze circulation and convection resulting fromconvergence along the sea breeze front. Shape
Keywords. Convection; sea breeze; urban heat island.
J. Earth Syst. Sci. 117, No. 6, December 2008, pp. 897–909© Printed in India. 897

898 Matthew Simpson et al
Figure 1. (a) Map showing the inner and outer domains ofan MM5 simulation centered over Chennai, India. (b) Landuse map of the inner model domain. Urban region of Chennaiis shown in red while irrigated cropland and pasture isshown in yellow. Locations of Kalpakkam, Meenambakkam,Nungambakkam, and the Doppler Weather Radar (DWR)site.
of the coastline has been shown to affect theamount of inland convergence associated with thesea breeze. Convex coastlines have been shown toenhance inland convergence and increase convec-tive development related to the sea breeze (Pielke1974; Boybeyi and Raman 1992). McPherson(1970) showed that increased sea breeze divergenceoccurs along concave coastlines. Numerical mode-ling studies of the interaction between the curva-ture of the coastline and soil moisture variabilityrevealed heavy precipitation to occur along the seabreeze front near the region of highest soil moisture(Baker et al 2001).
Observational and modeling studies show themean wind flow to be important in determining theintensity of the cumulus convection associated with
sea breezes during summer months (Pielke andCotton 1977). When the mean low-level wind is inthe same direction as the sea breeze, weaker conver-gence is observed inland along the sea breeze front(Boybeyi and Raman 1992; Atkins and Wakimoto1997). Gilliam et al (2004) showed sea breeze frontsto propagate the furthest inland when light windflow regimes are present.
Urban environments near the coast have beenshown to influence the timing and evolution ofthe sea breeze. The horizontal wind speed overTokyo is increased by 2.3m s−1 relative to the puresea breeze due to the presence of the urban heatisland (Yoshikado 1992). Regions of enhanced ver-tical motion occur in a convergence zone betweenthe sea breeze front and the urban heat island cir-culation (Yoshikado 1994). Numerical simulationshave shown urban areas enhance convection dueto increased low-level convergence associated withboth sea breeze fronts and synoptic flow (Kusakaet al 2000; Ohashi and Kida 2002; Vukovich andDunn 1978; Hjemfelt 1982; Craig and Bornstein2002). Urban regions have also been shown toincrease precipitation typically 50 to 75 km down-wind of the city (Huff and Vogel 1978; Changnon1979; Braham et al 1981). Rainfall amounts areusually enhanced between 5% and 25% over back-ground values due to urban effects (Changnon et al1981, 1991).
Chennai is one of the ideal places to study urbaneffects on sea breeze induced convection and pre-cipitation because the city is a large urban regionlocated along a straight coastline. Also during thesummer months, large scale weather systems areabsent in this region and the only forcing is bythe sea breeze circulation. The objective of thisstudy is to use a high-resolution numerical modelto investigate urban effects on sea breeze intensityand precipitation along the Chennai coast duringthe Indian southwest monsoon and compare theresults with observations.
2. Model description
The Penn State-NCAR mesoscale model, MM5Version 3.7 (Grell et al 1994), was used in thisstudy to understand the dynamics leading to pre-cipitation events along the east coast of Indiaduring the southwest monsoon. A single nestedmodel domain configuration was used as shownin figure 1(a). The outer domain is oriented tosimulate the synoptic wind direction over Indiaduring the southwest monsoon. The inner domainis centered over the east coast of India nearChennai to study the influence of the daytime seabreeze on convection and precipitation. Horizon-tal grid spacing of the outer domain is 9 km and

Urban effects of Chennai on convection and precipitation 899
consists of 300 × 300 grid points while the innerdomain has a grid spacing of 3 km and 127 × 127grid points. A total of 41 sigma levels with verti-cal stretching were used for the numerical simula-tion. To better resolve boundary layer dynamics,nearly half of the sigma levels were located withinthe lowest 2 km of the atmosphere.
National Center for Environmental Prediction(NCEP) global final analyses (FNL) data wereused to initialize the model simulation. The NCEPglobal analyses are archived on 1 × 1 degree gridsand are available every six hours. Objective analy-sis nudging was performed every three hoursusing surface four-dimensional data assimilation(FDDA) during the entire simulation. The 3-Danalysis was nudged every six hours using upperair data. The model was integrated for a period of60 hours from 05:00 Indian Standard Time (IST)on 27 June to 17:00 IST on 29 June 2003. Thistime period was chosen because of the occurrenceof a well defined sea breeze circulation on 28 June2003 that resulted in precipitation over a large areaalong the east coast of India.
Thirty-second (∼ 0.9 km) USGS global terrainand land use data were used for the inner domain.Land use, including the location of the urban metroarea of Chennai along the east coast of India,within the inner domain is shown in figure 1(b).Location of the urban region of Chennai is shown inred. The dominant land use type surrounding themetro urban area of Chennai is irrigated croplandand pasture. Locations of the Meenambakkam air-port and the Doppler Weather Radar (DWR) siteare also shown in figure 1(b).
The MRF planetary boundary layer (PBL)parameterization scheme was used for the MM5simulations. MRF (Hong and Pan 1996) is a first-order, non-local vertical diffusion scheme basedon the results of large-eddy simulations. Heightof the planetary boundary layer is determinedby the MRF PBL scheme using a critical bulk-Richardson number method where the PBL heightis estimated iteratively starting from the surface.Once the counter gradient correction term hasbeen estimated, it is possible to solve the turbu-lence diffusion equations for prognostic variablessuch as potential temperature, specific humid-ity, and horizontal wind components. The totalflux accounts for the contribution of large-scaleeddies by using a local gradient term. The MRFscheme is widely used in general circulation mod-els and higher resolution numerical weather fore-cast models due to its computational efficiencyand ability to resolve the influence of large-eddyturbulence.
Explicit equations for cloud water, rainwater, iceand water vapor are used by the MM5 model. Sub-grid scale convection is resolved in both domains
Figure 2. Radar derived wind speed and direction profilesover Chennai valid from 09:00 IST until 18:00 IST on 28June 2003. Onshore flow near the surface associated withthe sea breeze was first observed at 10:30 IST.
using the Grell cumulus parameterization (Grellet al 1994). A cumulus scheme was used in theinner domain despite the small grid spacing sincethe convection resulting from the sea breeze occurson a fine scale. An initial simulation with no cumu-lus parameterization in the inner domain producedlittle explicitly resolved precipitation. Multi-levelground temperature and soil moisture are calcu-lated using the NOAH – land surface model (Chenand Dudhia 2001).
3. Observations of sea breezecirculation
Radar derived wind speed and direction profilesfrequently show the presence of a well developedsea breeze circulation along the Chennai coastduring the Indian southwest monsoon. A timeseries of wind speed and direction profiles overChennai derived from Doppler weather radar validfrom 09:00 IST until 18:30 IST on 28 June 2003 isshown in figure 2. A dashed line is shown in figure 2to mark the height of transition from onshore flowassociated with the sea breeze to offshore flow.Northerly winds were observed near the surface at09:00 IST while westerly flow was observed aloftdue to the dominant monsoon flow. Onshore flowwas first observed at the surface around 10:30 ISTindicating a developing sea breeze circulation alongthe Chennai coast. Depth of the onshore flow wasaround 500 m by 13:00 IST with westerly flow stillobserved aloft. The depth of onshore flow associ-ated with the sea breeze reached a maximum ofroughly 1200 m at 17:00 IST. Onshore flow associ-ated with a well developed sea breeze circulationwas still observed at 18:30 IST.

900 Matthew Simpson et al
Figure 3. (a) Doppler Weather Radar (DWR) imagery from site located along the coast of Chennai showing the sea breezefront on 27 June 2003 at 15:30 IST. (b) Radar image valid at 16:00 IST on 28 June 2003 showing the location of the seabreeze front and isolated regions of precipitation.
Inland penetration of the sea breeze front alongthe Chennai coast can be observed in radarimagery of the maximum projection of radar returnsignal in dBz (Suresh and Bhatnagar 2004). Thelocation of a sea breeze front over Chennai on 27June 2003 at 15:30 IST was observed by the maxi-mum projection of radar return signal as shownin figure 3(a). Location of the radar site along thecoast within the Chennai metro limits was shownearlier in figure 1(b). Presence of a sea breeze frontwas observed well inland of the Chennai coast asa narrow line of weak reflectivity values around13 to 19 dBz. Inland penetration of the sea breezefront along the Chennai coast is greatest duringthe southwest monsoon season (June–September)with an average of around 20 km, though penetra-tion up to 100 km has been observed (Suresh 2007).The sea breeze has moved approximately 30 kminland over the urban region of Chennai, while tothe north of the urban area, the sea breeze hasmoved approximately 40 km inland. Pulicat Lake islocated along the coast just north of Chennai andmay explain why the sea breeze front was observedfurther inland north of the city. Presence of thesea breeze front and higher radar reflectivity val-ues due to rainfall were observed over the Chennairegion at 16:00 IST on 28 June 2003 (figure 3b).The sea breeze front was around 35 km inland justwest of Chennai while further to the south the seabreeze front had penetrated nearly 50 km inland.Isolated regions of light rainfall were located inclose proximity to the sea breeze front wherehighest amounts of low-level convergence werepresent.
Highest radar estimated rainfall totals duringthe simulation period occurred during the latehours of 28 June and the early morning of 29June 2003 along the western region of Chennaiand approximately 70 km to the southwest ofthe city. Total radar estimated rainfall over theChennai region valid from 14:30 IST on 28 Juneuntil 02:30 IST on 29 June 2003 is shown infigure 4. Rainfall amounts exceeding 100 mm wereestimated over a large region along the southwestregion of Chennai. Further inland to the west,total rainfall amounts decreased sharply to around40 mm. A large region of rainfall amounts greaterthan 100 mm was also observed about 75 km tothe southwest of Chennai. The locations of highestrainfall totals correspond to the track of convectivecells that moved from west to east as the southwestmonsoon flow began to dominate along the coast.
4. Discussion of results
4.1 Control run
Wind speeds over the city of Chennai during thesimulation period appear to be heavily depen-dant on the wind direction. Low wind speeds areobserved over the city when the wind direction isfrom the south/west and moving over land. Windspeeds are higher when the wind direction is fromthe east and the airmass is transported from overwater. A time series of observed 10 m wind speeds(hollow diamond data points) measured over theMeenambakkam Airport from 06:00 IST on 27

Urban effects of Chennai on convection and precipitation 901
Figure 4. Accumulated radar estimated rainfall along theChennai coast valid from 14:30 IST on 28 June until02:30 IST on 29 June 2003.
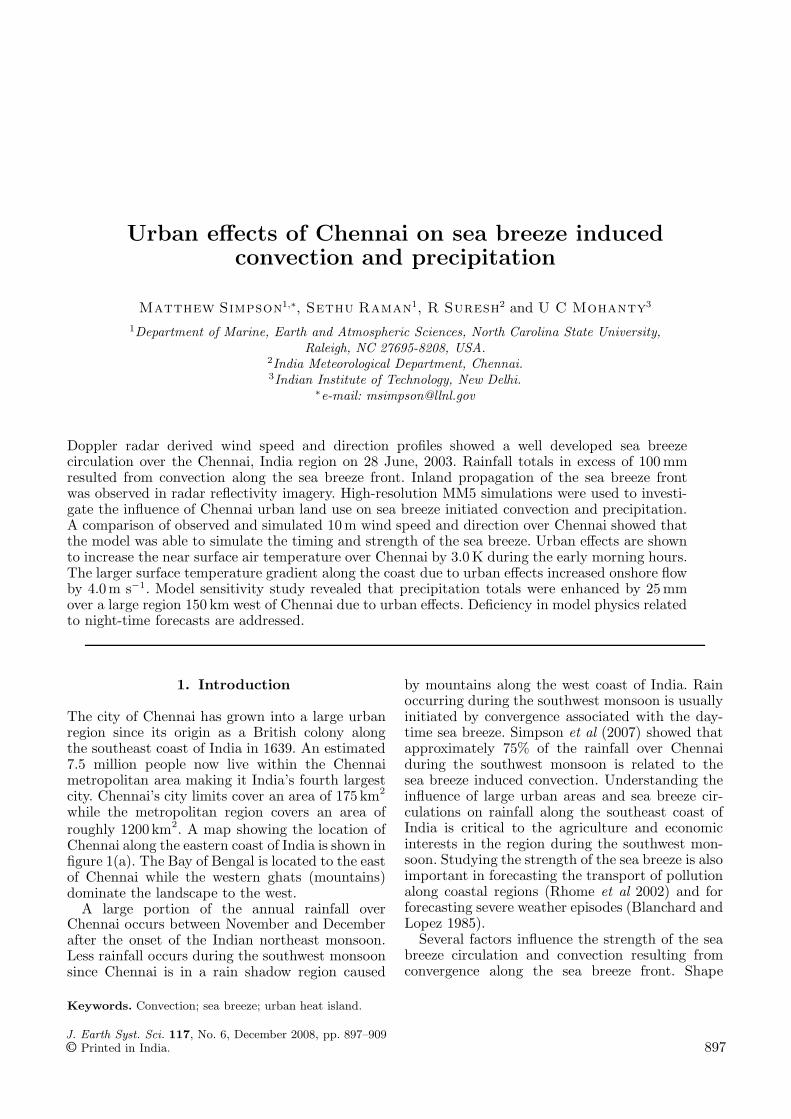
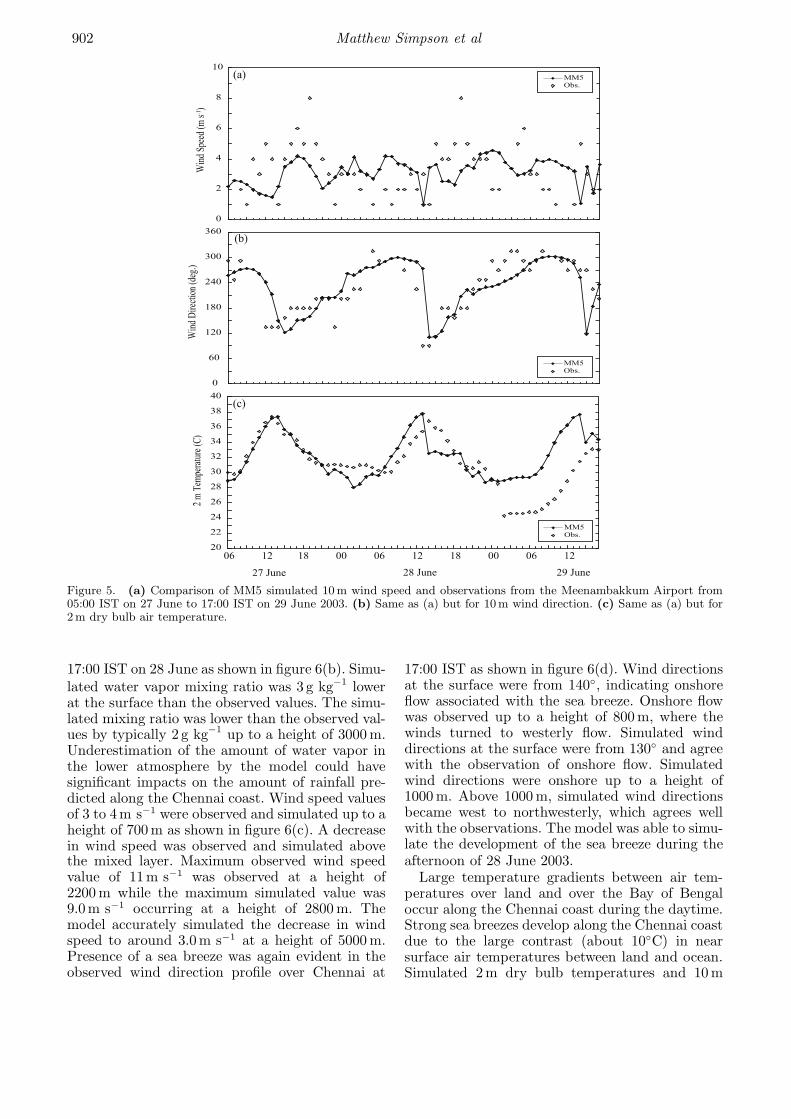
June to 17:00 IST on 29 June 2003 are shown infigure 5(a). Observed wind speeds range from 1 to8m s−1 during this period. Highest wind speeds areobserved at Meenambakkam during the late after-noon when the easterly winds caused by the seabreeze circulation. The lowest wind speeds areobserved during the night and the early morningmost likely related to the presence of the noctur-nal boundary layer. Simulated wind speeds (solid)typically range from 1.0 to 4.5m s−1 during thesimulation period. The model is able to simulateweaker winds during the night and stronger windsduring the afternoon for the first day of the simula-tion. However, wind speeds with a value of around3.0m s−1 are simulated for the rest of the period.The simulated wind speed is more representativeof the preceding hour while the observed windspeed is measured over only a few minutes of aver-aging time.
Since Chennai is located along the east coastof India, large diurnal variations in wind directionare observed due to the development of the seabreeze. Observed wind directions at 10 m heightabove ground (hollow data points) from 06:00 ISTon 27 June to 17:00 IST on 29 June 2003 areshown in figure 5(b). Wind directions were fromthe southwest to west during the late eveningand night-time hours due to the background mon-soon flow. As the sea breeze develops during themorning hours, a wind shift to southeasterly flowoccurs and was observed on all the three days ofthe simulation period. The southeast wind direc-tion turned back to southwesterly by late eveninghours as the sea breeze weakened. Simulated 10 mwind directions (solid) are shown in figure 5(b).
Simulated wind directions were from around 240◦
to 300◦ during the night-time and early morninghours during the simulation period. A wind shiftto around 120◦ was simulated on all three days dueto the developing sea breeze. The model also simu-lates the transition of onshore flow to offshore flowduring the late evening hours typically around mid-night. It was during the transition to offshore flowaround midnight when the majority of rainfall wasobserved over Chennai.
The sea breeze along the east coast of India influ-ences the air temperature over Chennai. Observed2 m dry bulb temperatures (hollow data points)over the Meenambakkam Airport from 06:00 ISTon 27 June to 17:00 IST on 29 June 2003 are shownin figure 5(c). Temperatures during the night arearound 28◦ to 30◦C except for during the night on29 June when the air was cooled to around 24◦Cby precipitation. Peak air temperatures during theday are around 37◦C and occur just after mid-day. The highest temperatures occur around noonjust before the developing sea breeze begins totransport cooler air from over the ocean. Sea sur-face temperatures (SST) over the Bay of Bengaljust offshore of Chennai were around 29◦ to 30◦Cduring the simulation period. MM5 simulated drybulb temperatures (solid data point) at 2m heightabove ground are also shown in figure 5(c). Themodel was able to simulate the diurnal tempera-ture change of 8◦C on 27 and 28 June 2003 reason-ably well. Timing of peak temperatures occurringjust after mid-day due to the influence of the seabreeze was also simulated. Observed rain cooledtemperatures during the night on 29 June were notsimulated by the model because no significant pre-cipitation was modeled over or near Chennai atthat time. Hence, simulated and observed temper-atures during the night of 29 June differ by around4◦C. Daytime temperatures on 29 June are alsooverestimated due to no rain simulated overnight.Except for the morning of 29 June, the model wasable to simulate the diurnal changes in tempera-ture and the influence of the sea breeze on after-noon temperatures.
Atmospheric soundings from the Meenam-bakkam Airport provide additional data to vali-date the model simulation. Observed (solid line)and simulated (dashed line) potential temperatureprofiles over Chennai valid at 17:00 IST on 28 June2003 are shown in figure 6(a). The observed sur-face potential temperature was 306 K while thesimulated temperature was 304 K. A mixed layerup to a height of 700 m was simulated while theobservations did not show a well mixed layerprobably due to coarse resolution of the soun-ding. Both observed and modeled potential tem-peratures increased to 324 K at a height of 5000 m.Modeled water vapor mixing ratios were too low at
902 Matthew Simpson et al
Figure 5. (a) Comparison of MM5 simulated 10 m wind speed and observations from the Meenambakkum Airport from05:00 IST on 27 June to 17:00 IST on 29 June 2003. (b) Same as (a) but for 10m wind direction. (c) Same as (a) but for2m dry bulb air temperature.
17:00 IST on 28 June as shown in figure 6(b). Simu-lated water vapor mixing ratio was 3 g kg−1 lowerat the surface than the observed values. The simu-lated mixing ratio was lower than the observed val-ues by typically 2 g kg−1 up to a height of 3000 m.Underestimation of the amount of water vapor inthe lower atmosphere by the model could havesignificant impacts on the amount of rainfall pre-dicted along the Chennai coast. Wind speed valuesof 3 to 4m s−1 were observed and simulated up to aheight of 700 m as shown in figure 6(c). A decreasein wind speed was observed and simulated abovethe mixed layer. Maximum observed wind speedvalue of 11m s−1 was observed at a height of2200 m while the maximum simulated value was9.0m s−1 occurring at a height of 2800 m. Themodel accurately simulated the decrease in windspeed to around 3.0m s−1 at a height of 5000 m.Presence of a sea breeze was again evident in theobserved wind direction profile over Chennai at
17:00 IST as shown in figure 6(d). Wind directionsat the surface were from 140◦, indicating onshoreflow associated with the sea breeze. Onshore flowwas observed up to a height of 800 m, where thewinds turned to westerly flow. Simulated winddirections at the surface were from 130◦ and agreewith the observation of onshore flow. Simulatedwind directions were onshore up to a height of1000 m. Above 1000 m, simulated wind directionsbecame west to northwesterly, which agrees wellwith the observations. The model was able to simu-late the development of the sea breeze during theafternoon of 28 June 2003.
Large temperature gradients between air tem-peratures over land and over the Bay of Bengaloccur along the Chennai coast during the daytime.Strong sea breezes develop along the Chennai coastdue to the large contrast (about 10◦C) in nearsurface air temperatures between land and ocean.Simulated 2m dry bulb temperatures and 10 m

Urban effects of Chennai on convection and precipitation 903
Figure 6. (a) Comparison of a model simulated (dashed) and observed (solid) potential temperature profile valid 28 June2003 at 12:00 UTC (17:30 LT). (b) Same as (a) but for water vapor mixing ratio profile. (c) Same as (a) but for windspeed profile. (d) Same as (a) but for wind direction profile.
Figure 7. Simulated 2m dry bulb temperatures and 10 mhorizontal wind vectors valid 13:00 IST on 28 June 2003.The x and y axis represent model grid points. A tempera-ture gradient of 10 K was simulated along the Chennai coast.Maximum 10m wind speed were around 8.0 m s−1.
horizontal wind vectors valid at 13:00 IST on 28June 2003 are shown in figure 7. Air temperatures30 km inland from the coast were in the range of
310 to 312 K while temperatures just offshore werebetween 302 and 303 K. An air temperature con-trast of 10 K was simulated over a distance of 30 kmalong the coast. This large temperature gradientled to the development of a sea breeze circula-tion and the onshore flow was simulated at 10 mheight. Onshore wind speeds associated with thesea breeze along the coast were near 8.0m s−1.A region of slightly warmer 2m temperatures weresimulated over the ocean just south of Chennaipossibly due to the coarse initialization of the seasurface temperature.
Strength of the sea breeze and the resultinginland penetration of the sea breeze front vary dailyalong the east coast of India. Simulated 10 m hori-zontal wind vectors and u-components of the hori-zontal wind in color contours valid at 15:30 ISTon 27 June 2003 are shown figure 8(a). Onshoreflow associated with the sea breeze was typicallyaround 2.0m s−1 along the coast near Chennai on27 June. The sea breeze front was located around20 to 25 km inland along the Chennai coast. Tothe north of Chennai, the geography of PulicatLake has influenced the symmetry of the sea breezefront curvature. The inland extent of sea breezeand the curvature of the sea breeze front northof Chennai are in good agreement with radarimagery of the sea breeze front shown earlier in

904 Matthew Simpson et al
Figure 8. (a) Simulated 10 m wind vectors with onshore flow (u-component) in contours valid at 15:30 IST on 27 June2003. The sea breeze front is located along the leading edge of onshore flow. Outline of the Chennai metro area is shown inblack. (b) Same as (a) but valid at 15:30 IST on 28 June 2003.
figure 3(a). Stronger onshore flow was simulatedalong the coast at 15:30 IST on 28 June 2003with values near 5.0m s−1 (figure 8b). Increasedonshore flow resulted in the sea breeze front pene-trating inland to a distance of around 35 to 40 kmalong the Chennai coast. Effects of Lake Pulicatand the urban roughness effect on the symmetryof the inland sea breeze front were minimal on 28June 2003 due to enhanced onshore flow.
Upward (positive) vertical motion occurs alongthe leading edge of the sea breeze front as it movesinland. The location of a sea breeze cross sectionalong the Chennai coast is shown in figure 9(a)as a line extending from X to Y. Simulated cir-culation vectors (u, w) with onshore flow in colorcontours valid at 15:00 IST on 28 June 2003 areshown in figure 9(b). Onshore flow was simulatedup to a height of 700 m along the coast, whichagrees with radiosonde observations shown earlier.The maximum onshore wind values of 8.0m s−1
occur just offshore at a height of 100 m aboveground. A region of positive vertical velocity wassimulated along the leading edge of the sea breezefront. Maximum vertical velocity ahead of the seabreeze front was 1.4m s−1 and occurred at a heightof 1500 m.
Large convergence zone develops as the seabreeze front propagates inland. Simulated 10 mhorizontal wind vectors and 10 m convergence valid07:00 IST on 28 June 2003 are shown in fig-ure 10(a). Westerly flow with maximum values of12.0m s−1 was dominating throughout the modeldomain since the sea breeze has not yet developed.No region of substantial convergence was simu-lated due to the absence of onshore flow associatedwith the sea breeze. By 10:00 IST on 28 June
2003, weak onshore flow was simulated along thecoast with a wind speed of few meters per sec-ond as shown in figure 10(b). The onshore flowwas the result of the developing sea breeze. Smallregions of localized convergence were simulatedalong the sea breeze front with maximum valuesof 42 × 10−5 s−1. Onshore flow has strengthenedto nearly 7.0m s−1 by 13:00 IST as shown in fig-ure 10(c). A well developed sea breeze circulationwas simulated with onshore flow extending well off-shore. Along the sea breeze front, a band of coastalconvergence was simulated along the entire modeldomain. The width of the convergence band wasgenerally 20 km. Maximum values within the con-vergence zone were 50 × 10−5 s−1. The band of con-vergence is not prominent at 16:00 IST due to theoutflow associated with the development of con-vection as shown in figure 10(d). Onshore flowwas still simulated and has strengthened to around9.0m s−1 just offshore. Convergence zones overlandwere more sporadic with maximum convergencevalues of 50 × 10−5 s−1 occurring over only a smallregion.
Convection is frequently initiated by conver-gence associated with the sea breeze circulationduring the southwest monsoon along the south-east coast of India. Large amounts of rainfall occurnear Chennai due to sea breeze induced convection(Simpson et al 2005). Simulated 24-hour rainfallamounts from 05:00 IST on 28 June until 05:00 ISTon 29 June 2003 and the corresponding observedrainfall are shown in figure 11. Range rings areshown in figure 11 to provide a reference scale withthe radar estimated rainfall shown earlier in fig-ure 4. Rainfall is simulated over a large region wellinland. Precipitation totals were typically in the

Urban effects of Chennai on convection and precipitation 905
Figure 9. (a) Map showing the location of a sea breeze cross section over Chennai and the Bay of Bengal. (b) Simulatedcirculation vectors (u, w) with the onshore values of the u-component shown in the color contour valid at 15:00 IST on28 June 2003. Maximum onshore wind speed was 8.0 m s−1 while the max vertical velocity was 1.4 m s−1. The absiccarepresents distance (km) running west to east along the cross section.
Figure 10. (a) Simulated 10m horizontal wind vectors and10 m convergence valid 07:00 IST on 28 June. (b) Same as(a) but valid at 10:00 IST on 28 June. (c) Same as (a) but at13:00 IST on 28 June. (d) Same as (a) but valid at 16:00 ISTon 28 June 2003.
range of 10 to 20 mm with higher amounts occur-ring over only a small region. Maximum simu-lated rainfall was around 50 mm, which occurredwell inland to the west of Chennai. The modelwas unable to simulate precipitation near the coastover Chennai where rainfall amounts of up to100 mm were observed. However, the location ofsimulated inland rainfall compares reasonably well
Figure 11. Simulated total rainfall amounts (mm) from05:00 IST on 28 June until 05:00 IST on 29 June 2003.Corresponding observed rainfall amounts (mm) are overlaid.Range rings are also shown with a scale corresponding tothat of figure 4.
with the location of observed precipitation. Rain-fall amounts of only 5 to 10 mm were simulated tothe southwest of Chennai. The model was able tosimulate the distribution of rainfall related to thesea breeze during the daytime but was unable toaccurately simulate the location and the magnitudeof large rainfall that occurred during the night.
4.2 Urban effects
Larger roughness over urban areas cause morefriction and result in a decrease of near surface

906 Matthew Simpson et al
Figure 12. URBAN minus NOURBAN simulated 2m airtemperatures valid at 05:00 IST on 28 June 2003. Metropoli-tan limits of Chennai are shown in black. Temperatures at2m are up to 3 K warmer over Chennai than the surroun-ding rural regions due to anthropogenic heating.
wind speeds. Anthropogenic heating over urbanregions increases near surface air temperatures anddecreases stability. To study the urban effect ofChennai on the sea breeze circulation and precipi-tation, an MM5 simulation was run excluding theurban region of Chennai, which will be referredto as the NOURBAN simulation. The control runwith the urban land use of Chennai included willbe referred to as the URBAN simulation through-out the following discussion. The urban land use
Figure 13. (a) URBAN minus NOURBAN simulated 10 m wind vectors valid at 11:00 IST on 28 June 2003 with themetropolitan limits of Chennai shown in black. Cool color contours correspond to an increase in offshore flow due to urbaneffects while an increase in onshore flow is indicated by warm colors. Onshore flow is increased by 4.1 m s−1 along the coastby the Chennai urban effect. (b) Same as (a) but valid at 11:00 IST on 29 June 2003 with onshore flow increased by amaximum of 4.3 m s−1.
of the Chennai region was replaced with irrigatedcropland and pasture for the NOURBAN simu-lation. Irrigated cropland and pasture land wasused since it is the primary land use type sur-rounding the Chennai region. By modifying theland use map, the roughness length over Chennaiwas reduced from 0.80 to 0.15 m, the albedo wasincreased from 0.15 to 0.18, and the surface emis-sivity was increased from 0.880 to 0.985. Changingthe Chennai urban land use to cropland increasedsurface thermal inertia and surface moisture avail-ability over the region while it decreased soil heatcapacity.
The near-surface air temperature differencecaused by the urban land use of Chennai doesnot extend far from the city limits during thenight. URBAN minus NOURBAN simulated 2mdry bulb temperatures (K) valid at 05:00 IST on 28June 2003 are shown in figure 12. The net effect ofthe urban land use was to increase 2 m air temper-atures over Chennai by roughly 2 to 3K. Maximumincrease in 2 m temperature by the urban land usewas 3.0 K over a small region near the coastline.A small increase in air temperatures was simulatedup to 15 km offshore due to the transport of warmercity airmass over the ocean by strong southwest-erly monsoon flow. By increasing near surfaceair temperatures over Chennai, the urban effectresults in a larger temperature gradient along thecoast between the air temperatures over land andocean.
Urban land use in Chennai reduces wind speedsover the city due to higher surface roughness. How-ever, the urban land use can have an opposite effecton wind speeds associated with the sea breeze justoffshore. URBAN minus NOURBAN simulated

Urban effects of Chennai on convection and precipitation 907
10 m horizontal wind vectors valid at 11:00 ISTon 28 June 2003 are shown in figure 13(a).Onshore flow associated with the developing seabreeze was enhanced along the Chennai coast bythe urban land use. The maximum increase inonshore winds was 4.1m s−1 and occurred just off-shore of Chennai. Urban land use enhanced the seabreeze onshore flow by more than 1.0m s−1 up to adistance of 60 km offshore. An increase in onshoreflow occurred because URBAN ground tempera-tures were typically 4.0 K warmer over the citythan the NOURBAN simulation, which resultedin a larger land–ocean air temperature gradient.Urban effects also increased onshore wind speedsassociated with the sea breeze along the Chen-nai coast at 11:00 IST on 29 June 2003 (fig-ure 13b). The maximum increase in onshore flowwas 4.3m s−1, which again occurred just offshorealong the coast of Chennai. Enhancement of thesea breeze onshore flow was simulated up to an off-shore distance of 45 km.
Onshore flow associated with the sea breeze isincreased along the Chennai coast over a largedepth due to the urban effect. A cross sectionthrough the urban region of Chennai (same asshown in figure 9a) valid at 11:00 IST on 28 June2003 with URBAN minus NOURBAN circulationvectors (u, v, w) is shown in figure 14(a). Increasedonshore flow was simulated along the coast fromthe surface up to a height of 800 m due to the urbaneffect of Chennai. Onshore flow increased by morethan 2.0m s−1 over a layer of 400 m above the sur-face. Positive vertical motion was also increasedby the urban effect near the coast, most likelydue to the enhanced wind speeds and more con-vergence. The maximum increase in vertical velo-city was 0.30m s−1 at a height of 900 m above thesurface. The majority of the increase in verticalvelocity was isolated to the leading edge of the seabreeze front. Onshore flow associated with the seabreeze was reduced by 2.0 to 3.0m s−1 on the leeside of the city valid at 15:00 IST possibly due tothe combined effect of heat island induced pressuregradient and due to urban roughness (figure 14b).Return flow (offshore) aloft associated with thesea breeze circulation was also reduced by around2.0m s−1 by urban effects. Low-level convergencewas enhanced and the maximum positive verticalvelocity along the sea breeze front was increasedby 1.4m s−1. Increase in upward vertical velocitycould be due to the two sea breeze fronts being indifferent locations.
Changes in the strength of the sea breeze andvertical motion due to urban effects of Chennai areexpected to cause changes in precipitation amountsand patterns. URBAN minus NOURBAN simu-lated precipitation totals from 05:00 IST on 28June to 05:00 IST on 29 June 2003 are shown in
Figure 14. (a) URBAN minus NOURBAN simulated cir-culation vectors (u, v, w) valid at 11:00 IST on 28 June 2003.The cross section was taken over Chennai and the Bay ofBengal, same as figure 9. Difference in horizontal wind speedbetween the URBAN and NOURBAN simulations are shownby colour contours. Positive vertical motion was increased by0.30 m s−1 along the leading edge of the sea breeze front bythe Chennai urban effect. (b) Same as (a) but at 15:00 ISTwith a maximum increase in vertical velocity of 1.4 m s−1.
figure 15(a). Simulated rainfall totals were influ-enced by the urban region in two regions downwindof the city. Approximately 140 km to the south-west of Chennai, there was an increase in rain-fall with a decrease in rainfall also nearby. Rainfallamounts in this region were shifted to the south-west possibly due to the urban effects. However,no direct cause and effect relationship between theurban area and precipitation modification can bemade without a larger dataset of numerical simu-lations. A net gain in rainfall totals was observed160 km to the west of Chennai. Rainfall amountswere increased by the urban effect by up to 25 mmover an area of 400 km2. The increase in simulatedrainfall amounts due to the Chennai urban effectindicates that urban regions along the coast caninfluence convergence patterns and rainfall totals

908 Matthew Simpson et al
Figure 15. URBAN minus NOURBAN simulated totalrainfall from 05:00 IST on 28 June until 05:00 IST on 29 June2003. Metropolitan limits of Chennai are shown in black.
well inland. However, it is important to pointout that the control simulation could not produceprecipitation observed close to Chennai duringnight-time.
5. Conclusions
Observations show a well developed sea breeze cir-culation along the southeastern coast of Chennaion 28 June 2003. A numerical model is able tosimulate the development and timing of the seabreeze propagation along the coast. Predicted diur-nal variation of near surface air temperatures overChennai agrees well with observations during thesimulation period. A maximum temperature gradi-ent of 10 K is simulated along the Chennai coast.Maximum simulated 10 m wind speed values asso-ciated with the sea breeze are 9.0m s−1 and occurjust offshore. Regions of convergence are simu-lated over land along the leading edge of theonshore flow associated with the sea breeze. Posi-tive vertical velocities of 1.4m s−1 are simulated inadvance of the sea breeze front. Rainfall amounts of100 mm are observed in association with the inlandpropagation of the sea breeze front. The modelis able to simulate daytime precipitation resultingfrom the influence of sea breeze convergence. How-ever, the model is not able to accurately simulatethe location of high rainfall amounts observed overChennai during the night-time. Possible reasonsfor the model’s inability to simulate night-timerainfall along the coast include premature dissi-pation of inland clouds and the need for bettercloud-radiation parameterization.
Anthropogenic heating over the urban region ofChennai increased the near surface air temperatureby 3.0 K. Onshore flow associated with the day-time sea breeze was increased by 4.0m s−1 due to
the larger temperature gradient along the Chennaicoast caused by the urban effect. Changes in con-vergence patterns and positive vertical motioncaused by the urban land use along the coastincreased rainfall totals by 25 mm over a largeregion to the west of Chennai.
Acknowledgements
This work was funded by the Atmospheric Sci-ences Division, National Science Foundation undergrants ATM–0233780 and ATM–0342691. Dopplerweather radar imagery and surface meteorologicaldata were provided by the India MeteorologicalDepartment. We thank two anonymous reviewersfor their valuable comments and suggestions.
References
Atkins N and Wakimoto R 1997 Influence of the synoptic-scale flow on sea breezes observed during CaPE; Mon.Wea. Rev. 125 2112–2130.
Baker R, Barry L, Boone A, Tao W K and Simpson J 2001The influence of soil moisture, coastline curvature, andland-breeze circulations on sea-breeze initiated precipita-tion; J. Hydromet. 2 193–211.
Blanchard D and Lopez R 1985 Spatial patterns ofconvection in south Florida; Mon. Wea. Rev. 1131282–1299.
Boybeyi Z and Raman S 1992 A three-dimensional numeri-cal sensitivity study of convection over the Florida penin-sula; Bound. Layer Meteor. 60 325–359.
Braham R, Semonin R G, Auer A H, Changnon Jr S A andHales J M 1981 Summary of urban effects on clouds andrain. METROMEX: A Review and Summary; Meteor.Monogr. 40 141–152.
Changnon S A 1979 Rainfall changes in summer caused bySt. Louis; Science 205 402–404.
Changnon S A, Semonin R G, Auer A H, Braham R R andHales J 1981 METROMEX: A Review and Summary;Meteor. Monogr. Amer. Meteor. Soc. 40 181 pp.
Changnon S A, Shealy R T and Scott R W 1991 Pre-cipitation changes in fall, winter, and spring caused bySt. Louis; J. Appl. Meteor. 30 126–134.
Chen F and Dudhia J 2001 Coupling an advanced land-surface/hydrology model with the Penn State/NCARMM5 modeling system. Part I: Model imple-mentation and sensitivity; Mon. Wea. Rev. 129569–585.
Craig K and Bornstein R 2002 MM5 simulation of urbaninduced convective precipitation over Atlanta; Preprints,Fourth Conf. on the Urban Environment, Norfolk, VA,Amer. Meteor. Soc., 5–6.
Gilliam R, Raman S and Niyogi D V 2004 Observational andnumerical study on the influence of large-scale flow direc-tion and coastline shape on sea-breeze evolution; Bound.Layer Meteor. 111 275–300.
Grell G A, Dudhia J and Stauffer D R 1994 A descrip-tion of the fifth-generation Penn State/NCAR MesoscaleModel (MM5); NCAR Tech. Note NCAR/TN-398+STR,122 pp.
Hjemfelt M R 1982 Numerical simulation of the effectsof St. Louis on mesoscale boundary layer airflow and

Urban effects of Chennai on convection and precipitation 909
vertical motion: Simulations of urban vs. non-urbaneffects; J. Appl. Meteor. 21 1239–1257.
Hong S Y and Pan H L 1996 Nonlocal boundary layer ver-tical diffusion in a medium-range forecast model; Mon.Wea. Rev. 124 2322–2339.
Huff F A and Vogel J L 1978 Urban, topographic and diurnaleffects on rainfall in the St. Louis region; J. Appl. Meteor.17 565–577.
Kusaka H, Kimura F, Hirakuchi H and Mitzutori M 2000The effects of land use alteration on the sea breeze anddaytime heat island in the Tokyo metropolitan area;J. Meteorol. Soc. Japan 78 405–420.
McPherson R D 1970 A numerical study of the effect of acoastal irregularity on the sea breeze; J. Appl. Meteor. 9767–777.
Ohashi Y and Kida H 2002 Local circulations developedin the vicinity of both coastal and inland urban areas:Numerical study with a mesoscale atmospheric model;J. Appl. Meteorol. 41 30–45.
Pielke R 1974 A three-dimensional numerical model of thesea breezes over south Florida; Mon. Wea. Rev. 102115–139.
Pielke R and Cotton W R 1977 A mesoscale analysis overSouth Florida for a high rainfall event; Mon. Wea. Rev.105 343–362.
Rhome J, Niyogi D and Raman S 2003 Assessing seasonaltransport and deposition of agricultural emissions ineastern North Carolina, USA; Pure Appl. Geophys. 160117–141.
Simpson M, Warrior H, Raman S, Aswathanarayana P A,Mohanty U C and Suresh R 2007 Sea breeze InitiatedRainfall over the East Coast of India during the IndianSouthwest Monsoon; Natural Hazards 42 401–413.
Suresh R and Bhatnagar A K 2004 Unusual hail stormsduring May 2002 in Chennai and its suburbs – A studyusing data from a single Doppler Weather Radar;Mausam 55(4) 655–670.
Suresh R 2007 Observation of sea breeze front and itsinduced convection over Chennai in southern peninsularIndia using Doppler weather radar; Pure Appl. Geophys.164 1511–1525.
Vukovich F M and Dunn J W 1978 A theoretical studyof the St. Louis heat island: Some parameter variations;J. Appl. Meteor. 17 1585–1594.
Yoshikado H 1992 Numerical study of the daytime urbaneffect and its interaction with the sea breeze; J. Appl.Meteor. 31 1146–1164.
Yoshikado H 1994 Interaction of the sea breeze with theurban heat islands of different sizes and locations;J. Meteor. Soc. Japan 72 139–142.
MS received 18 December 2007; revised 24 July 2008; accepted 25 July 2008