using sharepoint as a data source for modern reporting · sharepoint business apps | 4 executive...
TRANSCRIPT

Using SharePoint as a data source for
Modern Reporting
White paper

SharePoint Business Apps | 2
Copyright
The information contained in this document represents the current view of Microsoft Corporation on the
issues discussed as of the date of publication. Because Microsoft must respond to changing market conditions,
it should not be interpreted to be a commitment on the part of Microsoft, and Microsoft cannot guarantee the
accuracy of any information presented after the date of publication.
This white paper is for informational purposes only. MICROSOFT MAKES NO WARRANTIES, EXPRESS, IMPLIED,
OR STATUTORY, AS TO THE INFORMATION IN THIS DOCUMENT.
Complying with all applicable copyright laws is the responsibility of the user. Without limiting the rights under
copyright, no part of this document may be reproduced, stored in, or introduced into a retrieval system, or
transmitted in any form or by any means (electronic, mechanical, photocopying, recording, or otherwise), or
for any purpose, without the express written permission of Microsoft Corporation.
Microsoft may have patents, patent applications, trademarks, copyrights, or other intellectual property rights
covering subject matter in this document. Except as expressly provided in any written license agreement from
Microsoft, the furnishing of this document does not give you any license to these patents, trademarks,
copyrights, or other intellectual property.
© 2019 Microsoft Corporation. All rights reserved.
v1.0 June 2019
Microsoft, Azure, Office, Office 365, Excel, Word, PowerPoint, OneNote, OneDrive, SharePoint, Skype for
Business, Teams, Planner, Flow, Graph, Yammer, and Delve are trademarks of the Microsoft group of
companies. The exclusion of a specific trademark herein shall not be constituted as a waiver of Microsoft’s
rights.
All other trademarks are property of their respective owners.

SharePoint Business Apps | 3
Table of Contents Executive Summary .............................................................................................................................................. 4
Data Sources ........................................................................................................................................................... 4
SharePoint Sources for Power Query .............................................................................................................................................. 5
SharePoint Folder ............................................................................................................................................................................... 5
OData ...................................................................................................................................................................................................... 5
SharePoint List and SharePoint Online List .............................................................................................................................. 5
SharePoint Sources for Paginated Reports ................................................................................................................................... 6
Reporting Directly on a SharePoint List ..................................................................................................................................... 6
Caching Data with SQL Server Integration Services .................................................................................................................. 6
Using Power Query ............................................................................................................................................... 7
SharePoint Folder .................................................................................................................................................................................... 7
Extracting File Metadata .................................................................................................................................................................. 8
Extracting File Contents ................................................................................................................................................................. 10
Combining File Contents ............................................................................................................................................................... 10
OData ......................................................................................................................................................................................................... 12
SharePoint Lists and Online Lists .................................................................................................................................................... 14
FieldValuesAsText ............................................................................................................................................................................. 16
Working with the Power BI Service ............................................................................................................. 17
Publishing ................................................................................................................................................................................................. 17
Automatic Refresh ................................................................................................................................................................................ 17
Recap and Recommendations ...................................................................................................................... 19

SharePoint Business Apps | 4
Executive Summary SharePoint is a great organizational data store. SharePoint lists offer a quick and easy way for users to store
and share millions of items, while document libraries have become the industry standard for document
management, supplying secure, reliable storage. SharePoint libraries supply the backbone for document
storage in all of Office 365. When you add documents to Microsoft Teams, or Yammer, they’re stored in a
document library.
In addition to lists, documents can also contain valuable data. For example, where one user may create a list
to store data in rows and columns, another user may choose to do so in Excel, and then save the Excel file to
a document library. Both containers hold valuable data, and as with most data, there will be a need to report
on it.
Once the reporting needs go beyond the features available in a SharePoint view, a different reporting
platform is necessary.
There are several different platforms and technologies for working with SharePoint data, such as Power
Query, Excel, Power BI, SQL Server Reporting Services and SQL Server Integration Services.
Your choice of reporting platform depends on the report type, data, storage, and your skill level. With a
wide variety of choices available, it is important to understand the strengths and weaknesses of different
approaches to choose the right tool for the job.
This white paper examines the different platforms and approaches that can be used to report on SharePoint
data and explains the procedures.
Data Sources There are currently three primary tools available to access SharePoint data for reporting purposes, and each
one serves a different purpose.
Traditional business intelligence solutions employ a process called extract, transform and load (ETL). This
process extracts the data from its source environment, transforms it to support the end use, (filtering,
column removal, data augmentation) and finally load and optimize storage for reporting. This process cuts
reporting load on the source system and improves security and usability.
Power Query is the modern ETL tool and is built into Power BI (the service), Power BI Desktop, Excel, and is
now available online through Power BI Dataflows and Microsoft Flow. Power Query can extract content from
a SharePoint list and cache it into a tabular data model for reporting purposes. Using Power Query Online,
data can be cached in a Power BI Dataflow.
Report Builder is the tool for building paginated reports for SQL Server Reporting Services (SSRS), Power BI
Report Server, and the Power BI service (currently in preview). Report builder can connect directly to
SharePoint list data and report on it in place without the need for an ETL tool. Doing this however places a
significant load on SharePoint and is not recommended for large amounts of list data. To build a paginated
report with a large amount of list data, it is possible to use SQL Server Integration Services (SSIS) to move the
data into a data warehouse and report on it from there.
SQL Server Integration Services is an on-premises enterprise ETL platform that is available as a part of SQL
Server. SSIS has an OData driver, which can be used to connect to SharePoint list data and move it to other

SharePoint Business Apps | 5
repositories such as SQL Server or SQL Data warehouse. Reports can then be run from the destination
source.
SharePoint Sources for Power Query Power Query is an ETL tool that can connect to SharePoint data via several different connectors. Once
connected, it uses a step-based approach to transform the data into the required shape and load it into a
data model for reporting purposes. In the case of Power Query Online, the data is loaded into a Power BI
Dataflow for further modifications and reuse.
There are 4 connectors available in Power Query for connecting to SharePoint data: SharePoint Folder,
OData, SharePoint List and SharePoint Online List.
SharePoint Folder The SharePoint folder connects to a SharePoint site and returns all the documents contained by that site in
all libraries and folders. This connector can be used to report on documents and their metadata. It can also
be used to retrieve document contents. This is useful for connecting to Excel or CSV files stored in
SharePoint or OneDrive.
The native Excel and text connector connect only to the file system, but by using the SharePoint folder
connector Excel and CSV data stored in SharePoint can be easily refreshed by the Power BI service.
If documents have a common schema, they can be combined into a single table. This can be useful in a
logging scenario, when new files are added to a folder periodically.
OData Any SharePoint list since SharePoint 2010 can be expressed as OData. To do so, we use the listdata.svc REST
endpoint by appending /_vti_bin/listdata.svc to the end of a site URL. This URL can be used as a starting
point within Power Query to access list-based data.
SharePoint List and SharePoint Online List The SharePoint list and SharePoint Online list connectors are identical and can be treated as one (and will be
referred to henceforth as SharePoint List). The only fundamental difference between the two is the method
of authentication. One authenticates to SharePoint Online, and the other to an on-premises SharePoint.
The SharePoint List connector is like the OData Connector in that it connects to the root of the SharePoint
site and allows the report designer to import from one or more SharePoint lists. However, the type and
quantity of data returned by this connector is significantly richer than that returned by the more generic
OData connector.
The SharePoint list container returns more metadata about each item, and it provides helpers for use with
complex SharePoint data types. The full breadth of these helpers is beyond the scope of this paper, but it is
detailed in Using Power BI with Complex SharePoint Field Types.
One example of the differences between the two connectors can be seen below. Both examples are
querying the same SharePoint list.
OData connector results

SharePoint Business Apps | 6
SharePoint List connector results
SharePoint Sources for Paginated Reports SQL Server Reporting Services (SSRS) has been in use since 2004, and it has traditionally been the platform
for what is now referred to as paginated reports. Paginated reports are operational in nature and tend to be
pixel and page perfect. They are often also referred to as “RDL” reports.
Paginated reports can be rendered by SSRS, Power BI Reporting Server (PBIRS) and now by the Power BI
service itself. Paginated reports are connected directly to a SharePoint list, and the reports are run directly
against the SharePoint list.
The SharePoint connection for paginated reports is based on the legacy SOAP based web services, which has
several implications, but the most important is authentication. Paginated reports are unable to connect
SharePoint Online data because they are unable to authenticate against Azure Active Directory. This restricts
the data sources to SharePoint on-premises.
Reporting Directly on a SharePoint List
In almost any reporting environment, it is considered a bad practice to report directly against operational
data. It is much more efficient to abstract the data away from its source into some form of cache, typically a
data warehouse or a data mart. This is the process of ETL, defined above.
There are a whole host of reasons for doing this, including security, usability, and flexibility, the chief reason
among them is performance. Using the same database for reporting that people are accessing to get work
done puts added strain on that database, leading to a bad experience for everyone. Warehousing the data
fixes this problem.
This situation is particularly important in SharePoint. Data platforms like SQL Server are designed for high
volume data queries and retrieval and perform significantly better than SharePoint when querying large
amounts of data.
Given that the SSRS connector connects directly to SharePoint data, it should only be used in cases where
the data volume is small, and the need for up to date data is high. If paginated reports are needed for large
volumes of SharePoint data, it is much better to load that data into a data warehouse/mart first, and report
on it from there.
Caching Data with SQL Server Integration Services SQL Server Integration Services (SSIS) is Microsoft’s on-premises ETL platform. It comes with SQL Server and
supplies a rich variety of capabilities for connecting to and transforming data.
SSIS does not have a native connector for SharePoint, but it does have an OData connector. As mentioned
above, SharePoint lists can be expressed as OData feeds. Using the OData connector, data can be extracted
from the SharePoint list, transformed, and combined with other data as required, and then loaded into a
data store more suitable for reporting like SQL Server.

SharePoint Business Apps | 7
The OData connector for SQL server supports several authentication mechanisms including Windows
authentication, and Azure Active Directory. This means that although SSIS is an on premises product, it can
connect to SharePoint lists either on-premises or online in Office 365.
Using Power Query
SharePoint Folder The SharePoint folder connector should be used whenever it is necessary to report on file storage in
SharePoint, or to extract data from files stored in SharePoint. Although there are native connectors for many
different file-based data types (XLSX, CSV, PDF) in Power Query, those connectors expect to find the files
stored in a file system. The SharePoint folder is as a gateway to those files, and in fact, it will load the file
connector for the relevant file type.
To access file-based information, use the Get Data button in either Excel or Power BI Desktop, and choose
SharePoint Folder.
Next, enter in the URL of the site, not the URL of a folder as the title might show.

SharePoint Business Apps | 8
The options on the next screen are Combine and Edit or Edit.
Combine and Edit will extract the contents of all files and merge them into a single table. This action may be
appropriate if all files are of the same format, and they all have the same schema. However, it is more likely
that some additional filtering and transformations will be required before any such combinations. Therefore,
the Edit button should be used in most cases.
Extracting File Metadata The data available here is the file-based metadata for each file. If the goal is to report on the files in the site,
a couple of additional steps should be performed.
First, the Content column contains the binary file content of each file. This data is for metadata reporting and
can be removed. Right click on the column header and select Remove.

SharePoint Business Apps | 9
Next, to access metadata such as file size, etc., the Attributes column must be expanded. Click the expand
icon at the right of the column header and select the columns necessary for the report.
Click the OK button to expand the column.
Power Query will not autodetect the data types of the expanded columns. In this case, it is recommended to
set the data types of the three expanded columns to:
Size: Whole Number
Content Type: Text
Kind: Text

SharePoint Business Apps | 10
At this point, the data can be loaded into the data model using the Close and Apply button on the Home tab,
and the visuals can be built. Once the report is built and published, it can be embedded into a modern
SharePoint page using the Power BI web part to complete the picture.
Extracting File Contents There are many different file types that hold data such as Excel, CSV, and PDF, among others. If the data to
be reported is stored within these files, it can be extracted using this connector. In this case, the Content
column should NOT be removed.
Instead, scroll to the desired file and click on the Binary link in the Content column.
If the site has a lot of files, it can be helpful to use some of the other columns, like Extension, to filter the
results first. Clicking the Binary link will detect the file type in question and load the file contents.
In the case of an Excel file, the next screen will show the different worksheets that can be imported. The
sheet data can be accessed by clicking on the relevant Table link.
Once the worksheet data is loaded, it can be transformed and loaded into the data model just as with any
other data source. It can also be refreshed by the Power BI service, and by using the SharePoint folder
connector, an on-premises data gateway is not needed if the file is stored in SharePoint Online.
Combining File Contents In some cases, it is desirable to import the contents of multiple files simultaneously. An example is a logging
scenario, where new data files are created on a periodic basis in the same folder. These files would all have
the same schema.
It is possible to construct multiple queries using the above approach and to combine the results of those
queries, but Power BI offers a more elegant approach through the SharePoint folder connector.
Using the example above, the Content column is not removed, and the Binary link is not clicked. Since the
folder connector returns the contents of all libraries in the site, it is necessary to first filter the results down
to the target folder. This is done by first filtering the Folder Path column and selecting only the desired
folder.

SharePoint Business Apps | 11
The file contents can then be combined by using the Combine Files button at the right of the Content column
header.
Depending on the type of file, Power Query will prompt for added parameters and construct a series of
functions and parameters that are used to combine the file contents.
In the above example, a series of CSV files were combined. The first file is used as an example, and its
transformations are repeated for all files in the folder. This is seen above as Transform Sample file from
Query1. In many cases, the first transformation will need to be edited, and this can be done by simply
selecting this file and performing the added Power Query steps.

SharePoint Business Apps | 12
For the files in this example, the first 5 lines of the file are informational only and supply no value. They need
to be removed. In addition, line number 6 has the column names. This can be fixed in two steps using the
Remove Top Rows function, and the Use first Row as Headers function.
The final query shows an error because the column names have changed. This can be corrected by selecting
it and removing the final “Changed Type” step in the list of Power Query transformations. Column types can
then be set manually.
At this point, data can be loaded into the model using Close & Apply on the Home tab, and then the report
can be built. Data will be loaded from all files in the folder, and any later changes to the files, or the addition
of new files will be reflected in any future refreshes.
OData SharePoint list data has been available as an OData feed since SharePoint 2010. As a result, the OData
connector can be used for versions of SharePoint that predate the more modern native connectors as shown
below.
The lists for any SharePoint site can be returned as OData by appending /_vti_bin/listdata.svc to the URL for
the site. Therefore, if the URL for a site is https://mysitecollection.mydomain.com/sites/Demos, then the
OData feed is available at https://mysitecollection.mydomain.com/sites/Demos/_vti_bin/listdata.svc . This is
a simple call and can be tested within a web browser.
To build an OData based report in Power BI, first open Power BI Desktop, and select Get Data from either
the splash screen or the ribbon. Next, either type OData in the search box, or select the Other node. Select
OData feed from the list and select the Connect button.

SharePoint Business Apps | 13
Enter the address for the OData feed in the next dialog box. As mentioned above, this is the address of the
site appended by /_vti_bin/listdata.svc .
After selecting OK, if the feed hasn’t been used previously there will be a prompt for credentials. Use an
Organizational Account for SharePoint Online, or Windows Credentials for SharePoint on-premises. Once
signed in, select the Connect button to see the list of lists.
OData will return all the lists in the selected site, whether they are hidden in the SharePoint user interface or
not. This makes Power Query a useful diagnostic tool for SharePoint content. At this stage, select one or
more lists to be imported into the model by selecting the check box beside them. This will render a preview
of the data to be imported.
Selecting the Load button will immediately load all list data into the model and Edit will open the Power
Query editor to perform transformations on the data before loading. The OData connector is verbose and
will likely return far more data than is necessary for a report. Click on the Edit button to shape the data.

SharePoint Business Apps | 14
The OData connector does a good job returning simple field types like text and numbers but has trouble with
some more complex field types like Rich text, and multi-value. Lookup fields display the ID of their lookup
target, and all the target field values are also available through extension columns that can be seen to the
right of the table. In most cases, all the columns will not be used, so any unnecessary columns should be
removed. Extension columns can result in a significant amount of data.
Strong candidates for column removal are any rich text columns, lookup columns returning ID values, system
columns like ContentTypeID and ComplianceAssetID, and any unnecessary extension columns. If an
extension column is to be used, it is a good idea to extract the relevant field as well before loading into the
data model or report.
Once all necessary transforms have been performed, click on the Close and Apply button in the ribbon to
load the data into the model/report.
SharePoint Lists and Online Lists For SharePoint Online, and recent versions of SharePoint on-premises, the native SharePoint connectors for
Power Query are a better choice than the OData connector. The native connectors return more data, have
more options, and are more efficient. They also provide a few helpers that make working with complex data
types straightforward.
The choice to use the SharePoint List or SharePoint Online list connector will be directly related to your
SharePoint deployment. If your SharePoint is in Office 365, you will use the SharePoint Online List. If your
deployment is on-premises, you will use the SharePoint List.
To build reports using these connectors in Power BI, first open Power BI Desktop, and select Get Data from
either the splash screen or the ribbon. Next, either type SharePoint in the search box, or select either Online
Services node (for SharePoint Online List) or the Other node (for SharePoint List). Select the desired
connector and select the Connect button.

SharePoint Business Apps | 15
Enter the address for the SharePoint site, not the list itself, in the next dialog box without the trailing
backslash.
After selecting OK, if the site hasn’t been previously connected, a prompt for credentials will appear. Use an
Organizational Account for SharePoint Online, or Windows Credentials for SharePoint on-premises. Once
signed in, select the Connect button to see the list of lists.
These connectors will return all the lists in the selected site, whether they are hidden in the SharePoint user
interface or not. This makes them useful diagnostic tools for SharePoint content. At this stage, select one or
more lists to be imported into the model by selecting the check box beside them. This will render a preview
of the data to be imported.
Selecting the Load button will immediately load all list data into the model and Edit will open the Power
Query editor to perform transformations on the data before loading. These connectors are very verbose and
SharePoint Business Apps | 16
return much more data than the OData connector. It will almost certainly be more data than is required for
any given report. To control what is loaded and to shape the data, click on the Edit button.
These connectors return not only the basic field types like text and number, but also contain helpers to
extract what is required from more complex field types, like rich text and managed metadata fields. Details
on how these helpers work are beyond the scope of this document but can be found in Using Power BI with
Complex SharePoint Field Types.
Some of these helpers are extension columns that can be seen to the right of the table. Extension columns
contain a lot of data, and if they are not used; they should be removed. If they are to be used, make sure
that only the relevant data is extracted from them.
Strong candidates for column removal are any rich text columns containing HTML (Power BI visuals, with 1
exception do not render HTML), lookup columns returning ID values, system columns like ContentTypeID
and ComplianceAssetID, and as mentioned above, any unnecessary extension columns.
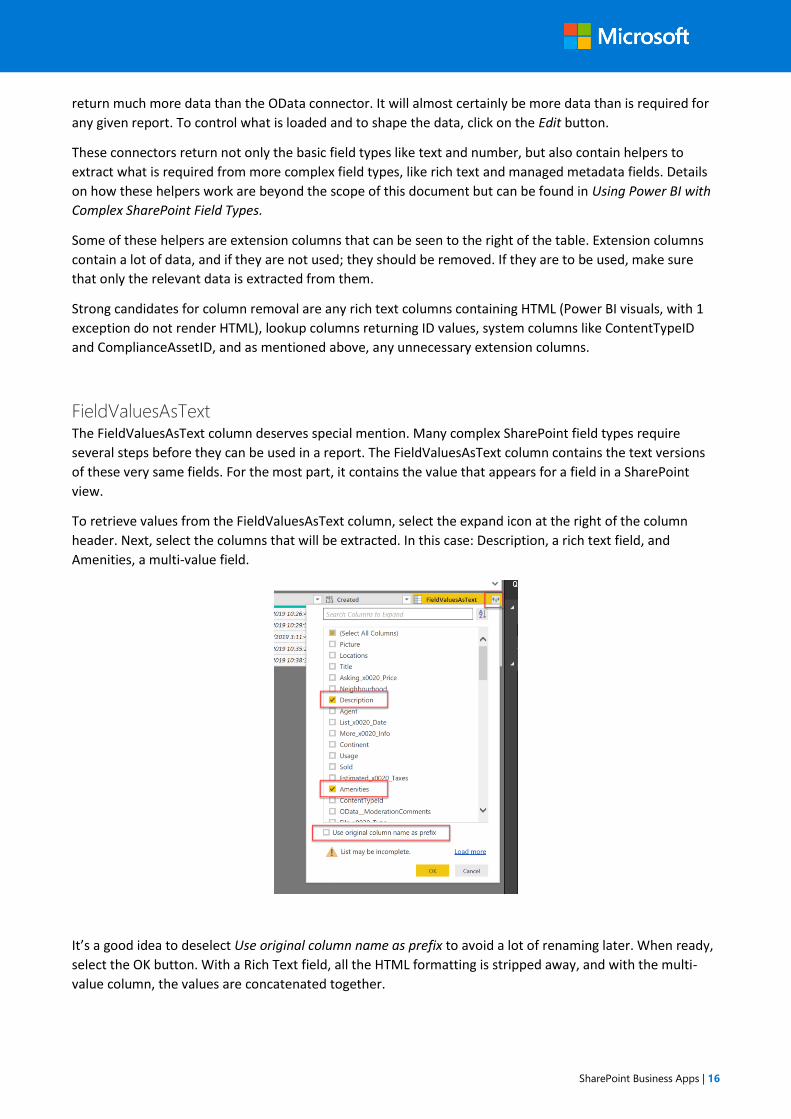
FieldValuesAsText The FieldValuesAsText column deserves special mention. Many complex SharePoint field types require
several steps before they can be used in a report. The FieldValuesAsText column contains the text versions
of these very same fields. For the most part, it contains the value that appears for a field in a SharePoint
view.
To retrieve values from the FieldValuesAsText column, select the expand icon at the right of the column
header. Next, select the columns that will be extracted. In this case: Description, a rich text field, and
Amenities, a multi-value field.
It’s a good idea to deselect Use original column name as prefix to avoid a lot of renaming later. When ready,
select the OK button. With a Rich Text field, all the HTML formatting is stripped away, and with the multi-
value column, the values are concatenated together.

SharePoint Business Apps | 17
I
If all that is needed is the text value of a complex field type, the FieldValuesAsText column is usually the best
way to get it.
Once all necessary transforms have been performed, click on the Close and Apply button in the ribbon to
load the data into the model/report.
Working with the Power BI Service
Publishing Once the report has been built, it can be published to the Power BI service for access through a browser and
for sharing. Publishing is done with the Publish button in the Power BI Desktop ribbon.
If working with multiple tenants through multiple identities, the destination tenant will be determined by
the account which is currently signed in. This can be inspected, and changed, by clicking on the account
name in the upper right of the desktop just above the ribbon.
The report can be published to a personal workspace or to a Power BI app workspace. For sharing purposes,
app workspaces are the recommended choice. Once publishing is complete, there will be two artifacts
available in the destination workspace, a report, and a dataset.
Automatic Refresh In order to keep the data in the report current, automatic refresh must be configured on the dataset from
which the report is connected. Select the workspace from the left navigation, then the Datasets tab, and
finally select the schedule refresh button.

SharePoint Business Apps | 18
Next to appear is the schedule refresh screen. By default, automatic refresh is turned off. To turn it on, open
the Scheduled Refresh section, and turn on Keep your data up to date.
Once turned on, the service will automatically update the dataset from the SharePoint list once per day at a
time of the service’s own choosing. To specify the refresh time, select the Add another time link, and specify
the refresh time. Additional refreshes can be added for the report, up to 8 per day, and 48 per day if your
workspace is in a Power BI Premium capacity.
If this is the first time that Power BI has connected to this list, credentials will need to be added. This is done
by opening the Data source credentials section and selecting the Add credentials or Edit credentials link for
the SharePoint data source.
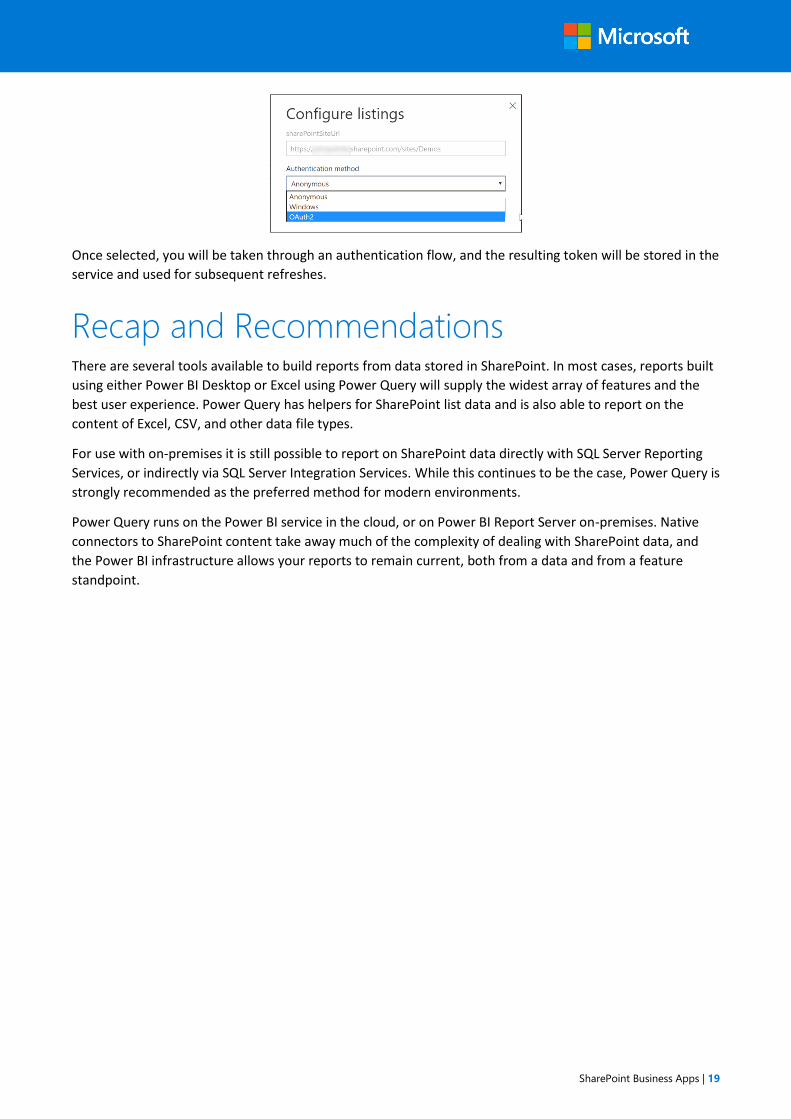
Although there are several authentication options in the resulting dialog box, OAuth2 is the only one that
will work with SharePoint Online.
SharePoint Business Apps | 19
Once selected, you will be taken through an authentication flow, and the resulting token will be stored in the
service and used for subsequent refreshes.
Recap and Recommendations There are several tools available to build reports from data stored in SharePoint. In most cases, reports built
using either Power BI Desktop or Excel using Power Query will supply the widest array of features and the
best user experience. Power Query has helpers for SharePoint list data and is also able to report on the
content of Excel, CSV, and other data file types.
For use with on-premises it is still possible to report on SharePoint data directly with SQL Server Reporting
Services, or indirectly via SQL Server Integration Services. While this continues to be the case, Power Query is
strongly recommended as the preferred method for modern environments.
Power Query runs on the Power BI service in the cloud, or on Power BI Report Server on-premises. Native
connectors to SharePoint content take away much of the complexity of dealing with SharePoint data, and
the Power BI infrastructure allows your reports to remain current, both from a data and from a feature
standpoint.