using the american community survey (acs) to implement a ... · using the american community survey...
TRANSCRIPT

Using the American Community
Survey (ACS) to Implement a
Supplemental Poverty Measure (SPM)
Liana Fox, José Pacas, Brian GlassmanSocial, Economic and Housing Statistics Division
ACS Data Users ConferenceMay 11, 2017
The views expressed in this research, including those related to statistical, methodological, technical, or operational issues, are solely those of the author and do not necessarily reflect the official positions or policies of the Census Bureau. The author accepts responsibility for all errors. This presentation is released to inform interested parties of ongoing research and to encourage discussion of work in progress. This presentation reports the results of research and analysis undertaken by Census Bureau staff. It has undergone more limited review than official publications.
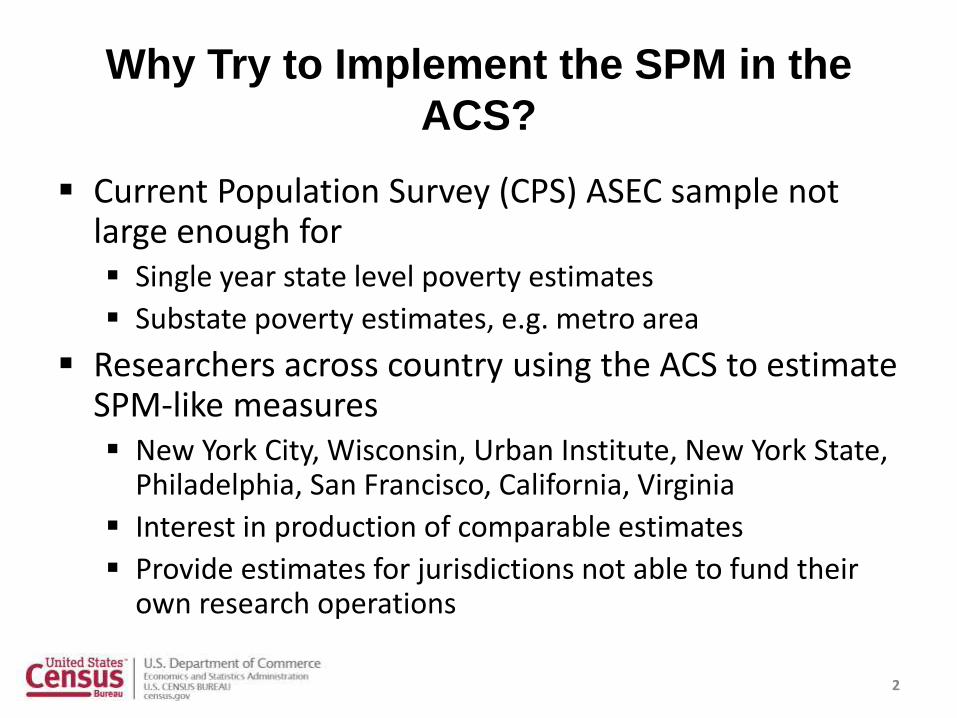
Why Try to Implement the SPM in the
ACS?
Current Population Survey (CPS) ASEC sample not large enough for Single year state level poverty estimates
Substate poverty estimates, e.g. metro area
Researchers across country using the ACS to estimate SPM-like measures New York City, Wisconsin, Urban Institute, New York State,
Philadelphia, San Francisco, California, Virginia
Interest in production of comparable estimates
Provide estimates for jurisdictions not able to fund their own research operations
2

Contribution of Paper
This paper builds off of previous research at Census (Renwick, et al. 2012 and Renwick 2015) regarding implementing the SPM in the ACS.
Tests imputation models for another year of comparison: 2014
Double-coding for accuracy
3

Implementation Challenges: Using the ACS
Unit of analysis – ACS does not identify unrelated subfamilies
Thresholds Inflation adjustment
Geographic unit for cost of living adjustment
Resources Noncash benefits
Necessary expenditures Taxes
Childcare and other work-related expenses
Medical out-of-pocket expenses
4
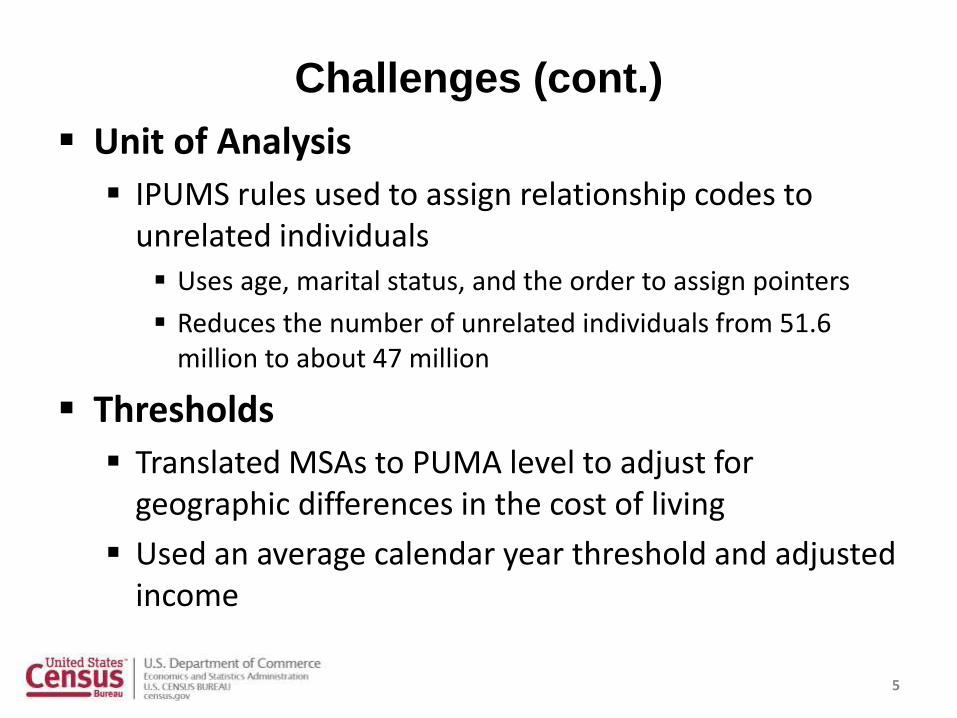
Unit of Analysis
IPUMS rules used to assign relationship codes to unrelated individuals
Uses age, marital status, and the order to assign pointers
Reduces the number of unrelated individuals from 51.6 million to about 47 million
Thresholds
Translated MSAs to PUMA level to adjust for geographic differences in the cost of living
Used an average calendar year threshold and adjusted income
5
Challenges (cont.)
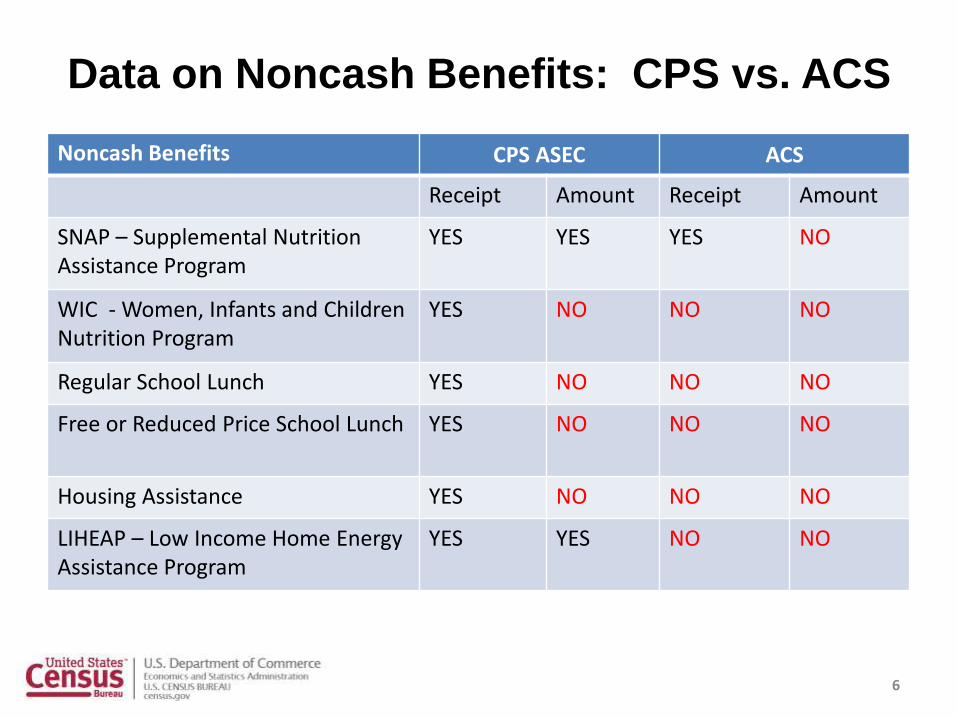
Data on Noncash Benefits: CPS vs. ACS
Noncash Benefits CPS ASEC ACS
Receipt Amount Receipt Amount
SNAP – Supplemental NutritionAssistance Program
YES YES YES NO
WIC - Women, Infants and Children Nutrition Program
YES NO NO NO
Regular School Lunch YES NO NO NO
Free or Reduced Price School Lunch YES NO NO NO
Housing Assistance YES NO NO NO
LIHEAP – Low Income Home Energy Assistance Program
YES YES NO NO
6
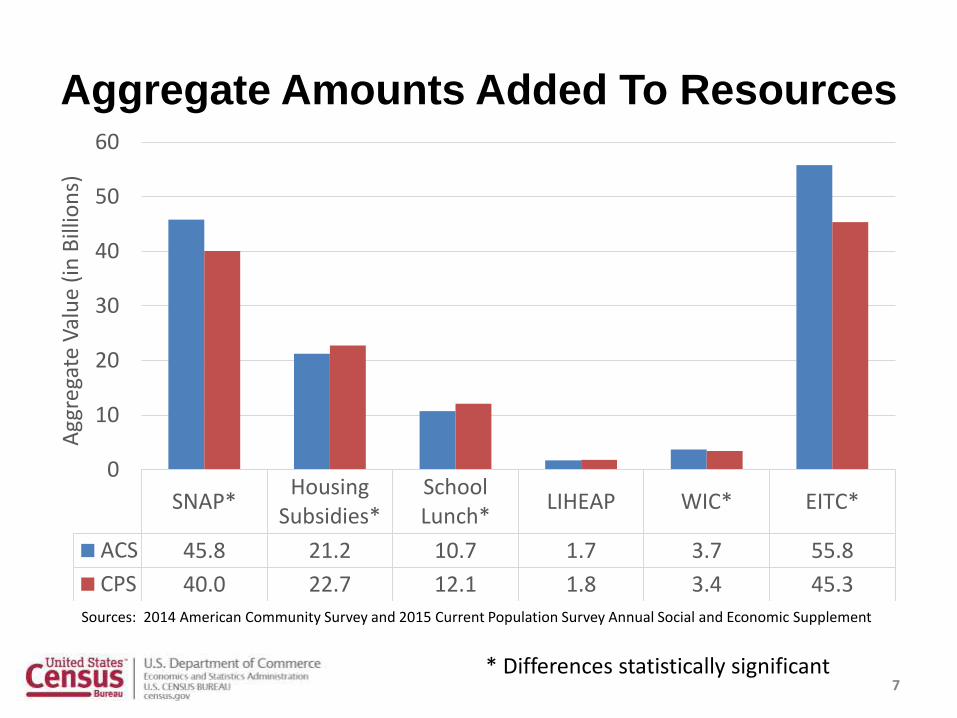
Aggregate Amounts Added To Resources
* Differences statistically significant
SNAP*Housing
Subsidies*SchoolLunch*
LIHEAP WIC* EITC*
ACS 45.8 21.2 10.7 1.7 3.7 55.8
CPS 40.0 22.7 12.1 1.8 3.4 45.3
0
10
20
30
40
50
60
Agg
rega
te V
alu
e (i
n B
illio
ns)
7
Sources: 2014 American Community Survey and 2015 Current Population Survey Annual Social and Economic Supplement
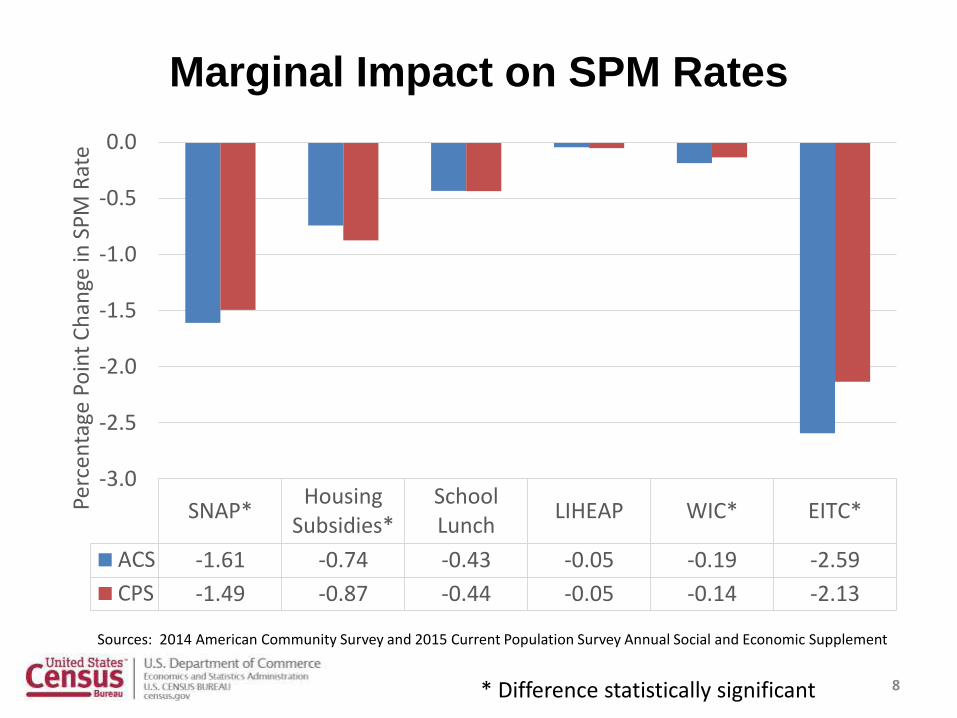
Marginal Impact on SPM Rates
* Difference statistically significant
SNAP*Housing
Subsidies*SchoolLunch
LIHEAP WIC* EITC*
ACS -1.61 -0.74 -0.43 -0.05 -0.19 -2.59
CPS -1.49 -0.87 -0.44 -0.05 -0.14 -2.13
-3.0
-2.5
-2.0
-1.5
-1.0
-0.5
0.0
Perc
enta
ge P
oin
t C
han
ge in
SP
M R
ate
8
Sources: 2014 American Community Survey and 2015 Current Population Survey Annual Social and Economic Supplement
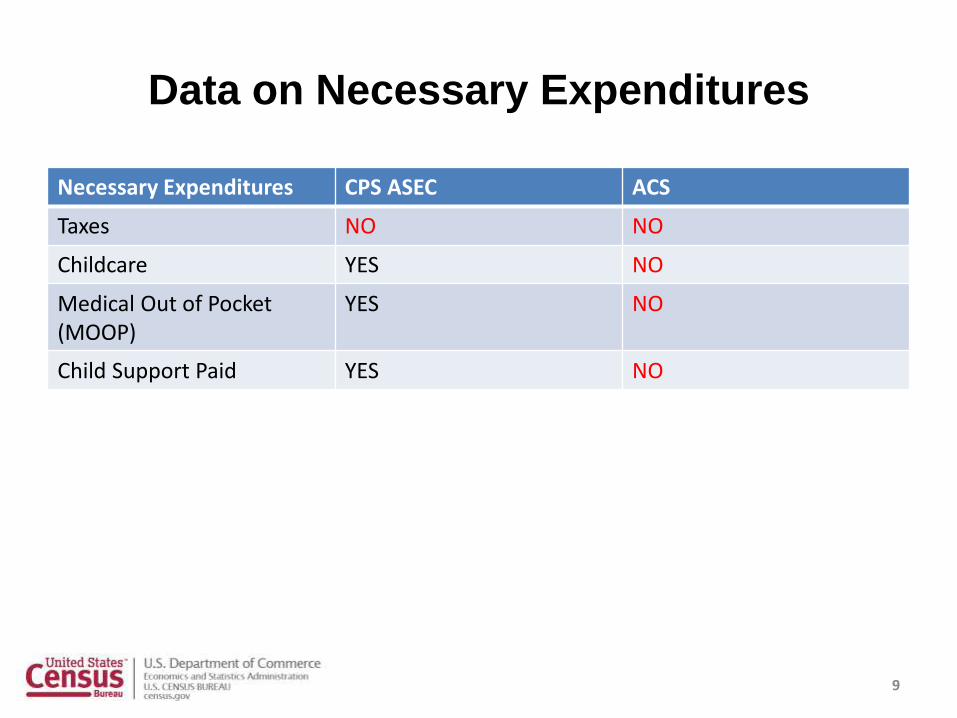
Data on Necessary Expenditures
Necessary Expenditures CPS ASEC ACS
Taxes NO NO
Childcare YES NO
Medical Out of Pocket (MOOP)
YES NO
Child Support Paid YES NO
9

Aggregate Amounts Subtracted From Resources
FederalTaxes*
FICA*State
Taxes*
Work andChildCare*
Medical*Child
Support*
ACS 1,042.4 512.6 256.5 230.2 560.9 0
CPS 1,179.4 552.6 234.3 285.6 567.3 15.8
0
200
400
600
800
1,000
1,200
1,400
ACS
CPS
N/A
Billions
* Differences statistically significant10
Sources: 2014 American Community Survey and 2015 Current Population Survey Annual Social and Economic Supplement
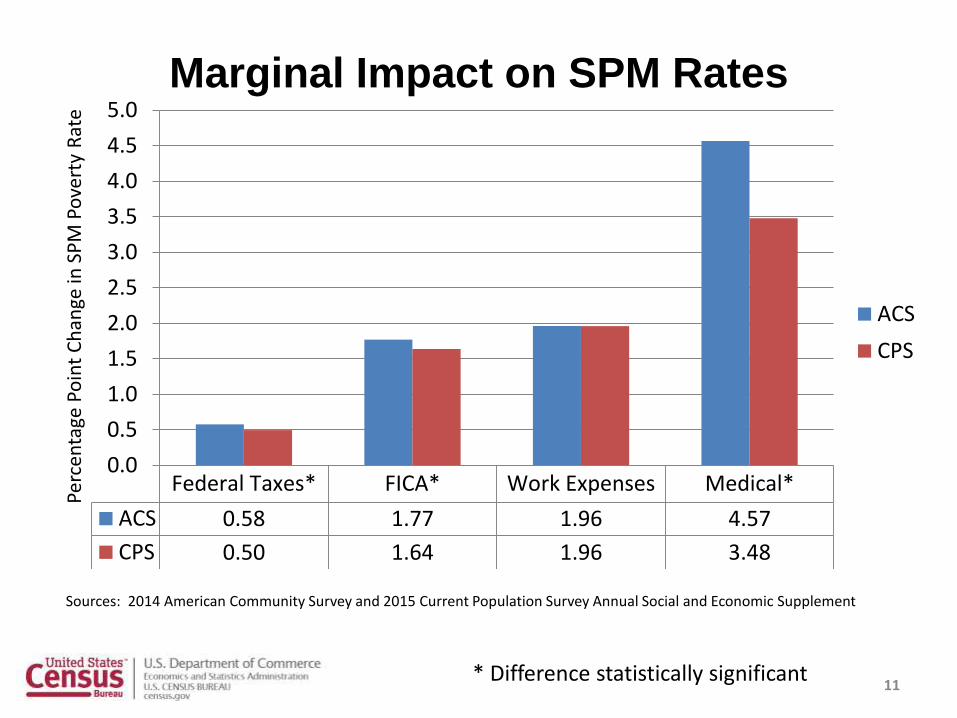
Marginal Impact on SPM Rates
Federal Taxes* FICA* Work Expenses Medical*
ACS 0.58 1.77 1.96 4.57
CPS 0.50 1.64 1.96 3.48
0.0
0.5
1.0
1.5
2.0
2.5
3.0
3.5
4.0
4.5
5.0
ACS
CPS
* Difference statistically significant
Perc
enta
ge P
oin
t C
han
ge in
SP
M P
ove
rty
Rat
e
11
Sources: 2014 American Community Survey and 2015 Current Population Survey Annual Social and Economic Supplement
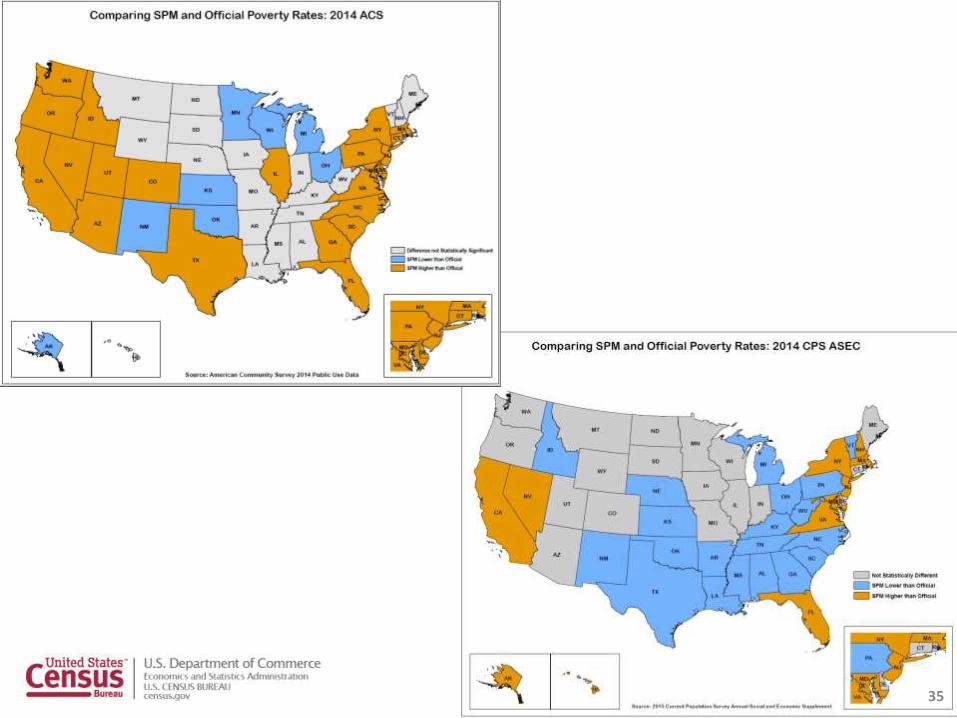
Comparing CPS and ACS Poverty Estimates
Official* poverty estimates from the two sources are not identical
Different reference periods
ACS less detailed income reporting
SPM poverty estimates also impacted by
Lack of relationship pointers
Imprecise imputations
Poverty rates shown here are preliminary
*The CPS ASEC is the source of official poverty estimates for the nation.
12
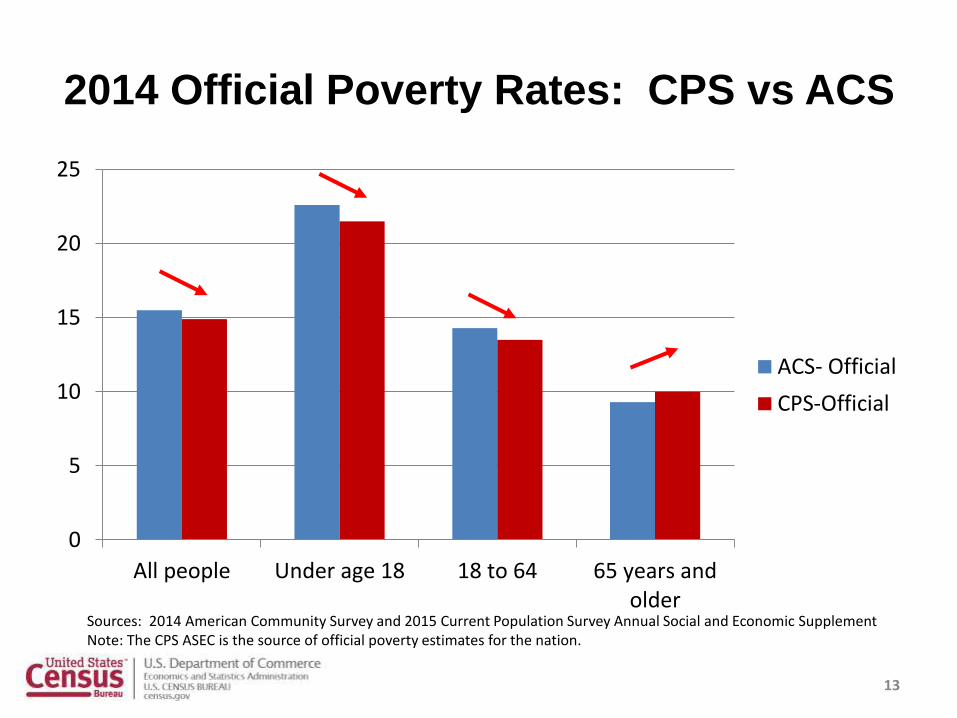
2014 Official Poverty Rates: CPS vs ACS
0
5
10
15
20
25
All people Under age 18 18 to 64 65 years andolder
ACS- Official
CPS-Official
13
Sources: 2014 American Community Survey and 2015 Current Population Survey Annual Social and Economic SupplementNote: The CPS ASEC is the source of official poverty estimates for the nation.

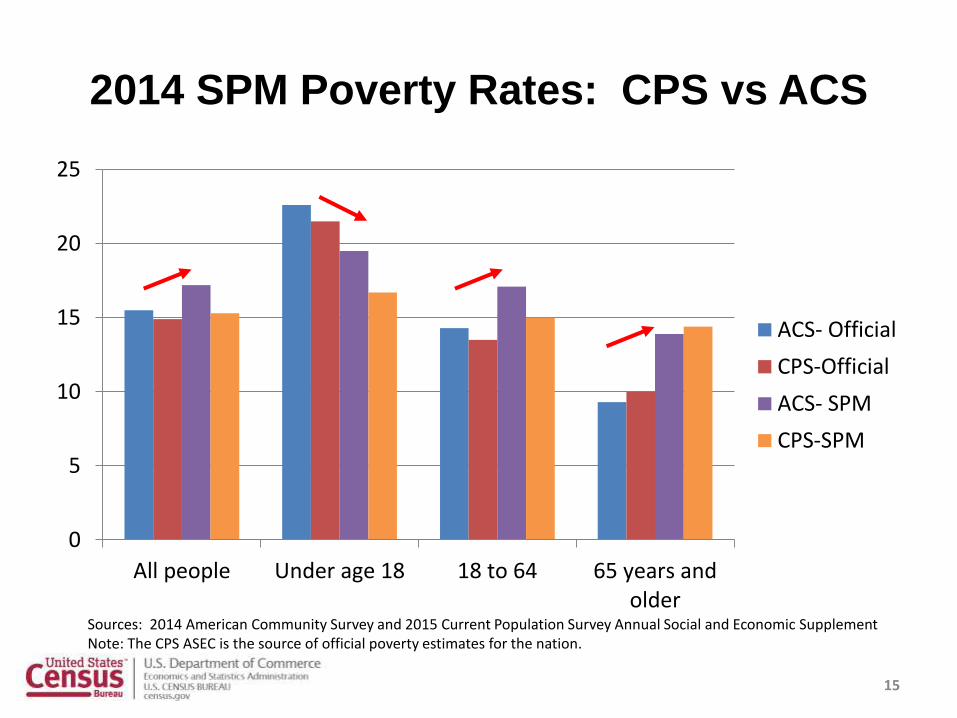
2014 SPM Poverty Rates: CPS vs ACS
0
5
10
15
20
25
All people Under age 18 18 to 64 65 years andolder
ACS- Official
CPS-Official
ACS- SPM
CPS-SPM
14
Sources: 2014 American Community Survey and 2015 Current Population Survey Annual Social and Economic SupplementNote: The CPS ASEC is the source of official poverty estimates for the nation.
2014 SPM Poverty Rates: CPS vs ACS
0
5
10
15
20
25
All people Under age 18 18 to 64 65 years andolder
ACS- Official
CPS-Official
ACS- SPM
CPS-SPM
15
Sources: 2014 American Community Survey and 2015 Current Population Survey Annual Social and Economic SupplementNote: The CPS ASEC is the source of official poverty estimates for the nation.
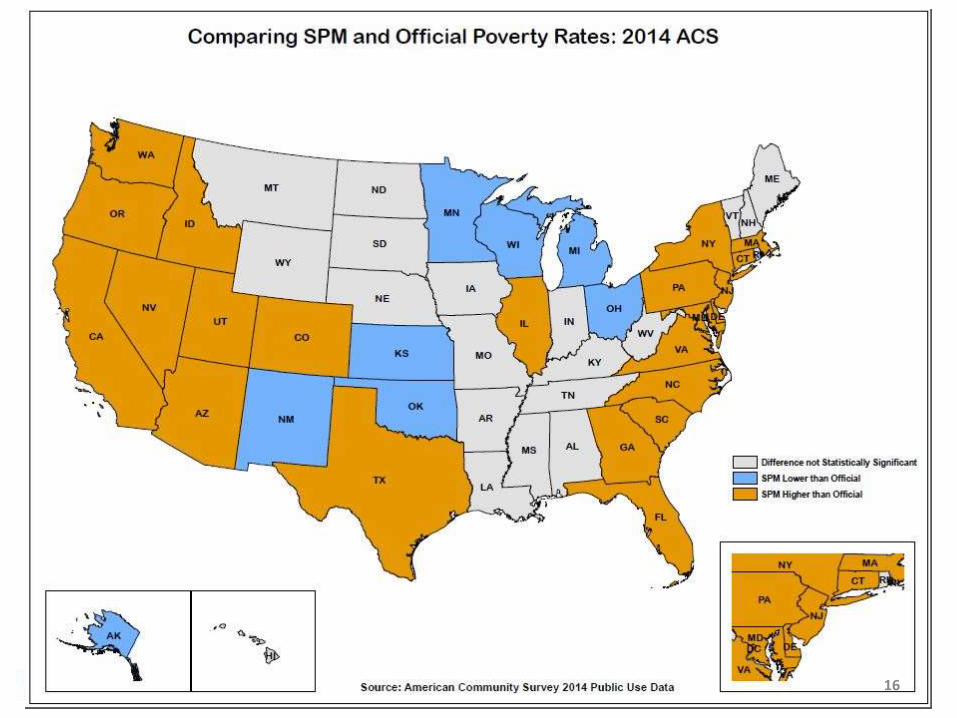
16

17

18
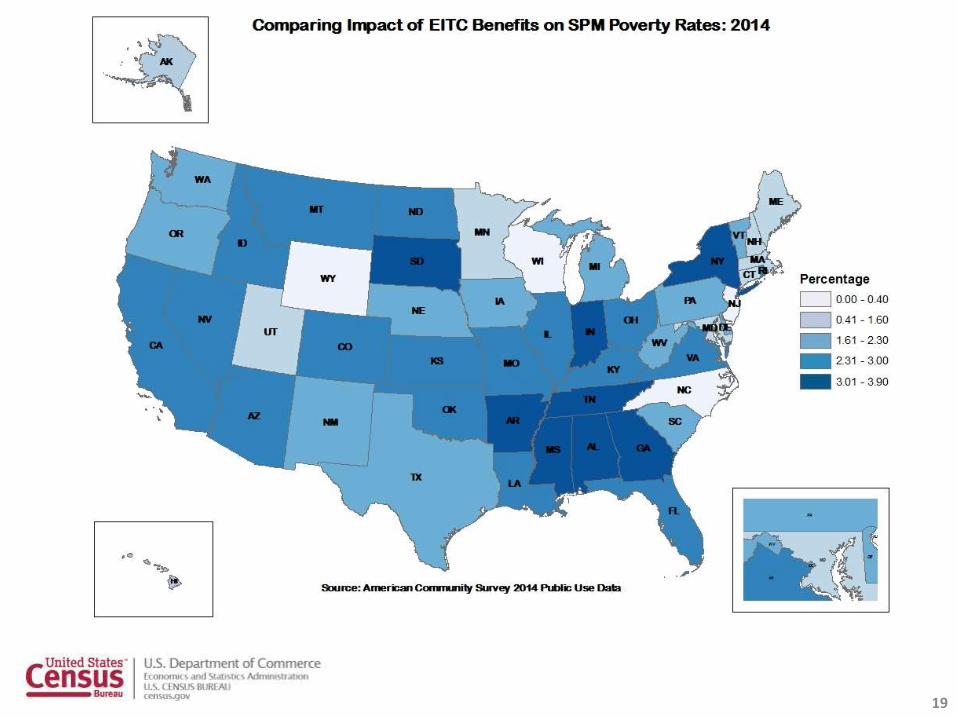
19

20

21

Next Steps
Improve Imputation Models and Methods
Release Public Use Research File Solicit feedback from data users
Extend to Additional Years
22
Contact Information
Liana Fox
Social, Economic and Housing Statistics Division
Bureau of the Census
Department of Commerce
(301) 763-2676
23
Extra Slides
24
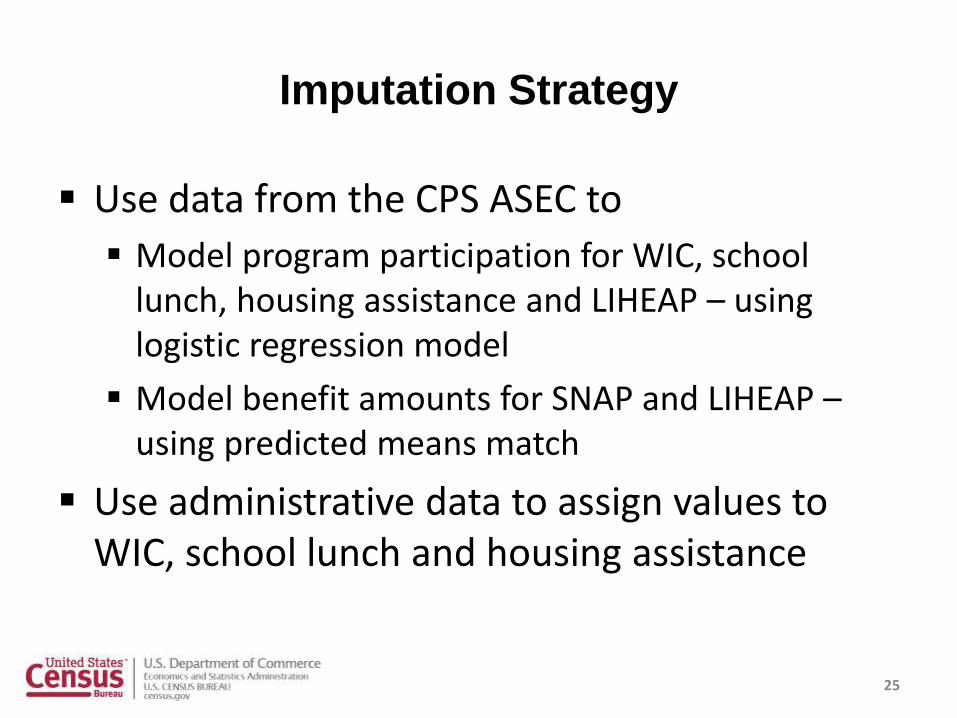
Imputation Strategy
Use data from the CPS ASEC to
Model program participation for WIC, school lunch, housing assistance and LIHEAP – using logistic regression model
Model benefit amounts for SNAP and LIHEAP –using predicted means match
Use administrative data to assign values to WIC, school lunch and housing assistance
25

Imputation Strategy
Taxes – use TAXSIM Limited relationship data to model tax units Less specific data on income sources
Childcare Logistic regression to model whether unit pays for child care Predicted means match to set weekly amount from CPS ASEC Use reports of weeks worked
MOOP Eight groups Predicted means match to model premium amounts for those
reporting private insurance Model other MOOP for different groups by insurance status
using predicted means match
26
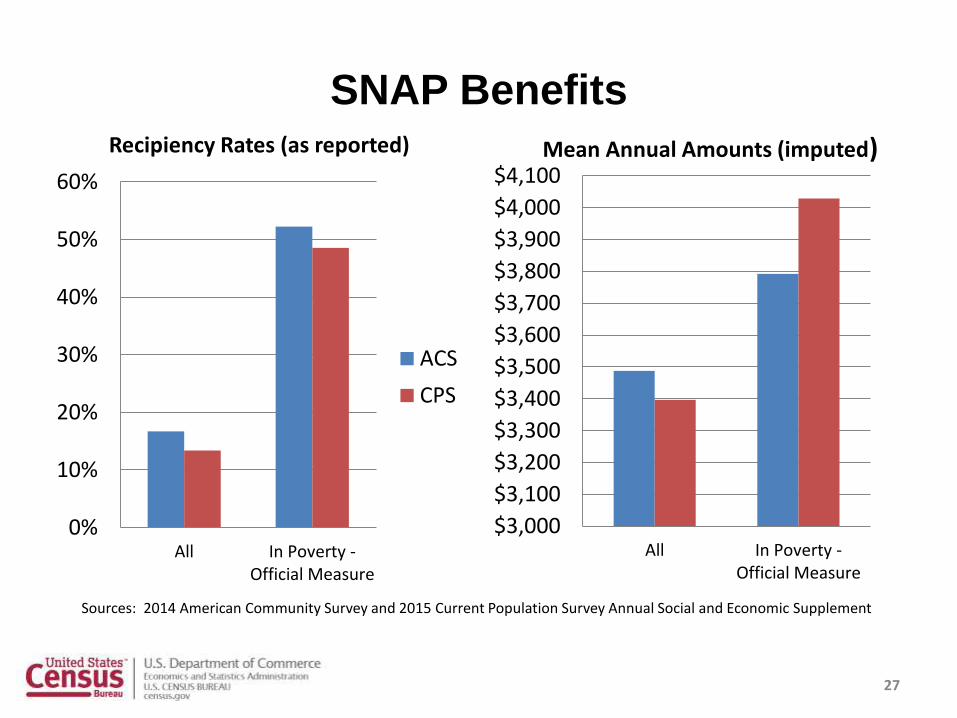
SNAP Benefits
$3,000
$3,100
$3,200
$3,300
$3,400
$3,500
$3,600
$3,700
$3,800
$3,900
$4,000
$4,100
All In Poverty -Official Measure
Mean Annual Amounts (imputed)
27
0%
10%
20%
30%
40%
50%
60%
All In Poverty -Official Measure
Recipiency Rates (as reported)
ACS
CPS
Sources: 2014 American Community Survey and 2015 Current Population Survey Annual Social and Economic Supplement

28

SNAP Benefits
-3.5
-3.0
-2.5
-2.0
-1.5
-1.0
-0.5
0.0
All people <18 18 to 64 65+P
erc
en
tage
Po
int
De
cre
ase
Impact on SPM Poverty Rates
29
$0
$5
$10
$15
$20
$25
$30
$35
$40
$45
$50
All In Poverty -Official Measure
Bill
ion
s
Aggregate Amount Added to Resources
ACS
CPS
Sources: 2014 American Community Survey and 2015 Current Population Survey Annual Social and Economic Supplement

Earned Income Tax Credit
0%
10%
20%
30%
40%
50%
60%
All In Poverty -Official Measure
Recipiency Rate
ACS
CPS
$0
$500
$1,000
$1,500
$2,000
$2,500
$3,000
$3,500
$4,000
All In Poverty -Official Measure
Mean Amounts
30
Sources: 2014 American Community Survey and 2015 Current Population Survey Annual Social and Economic Supplement
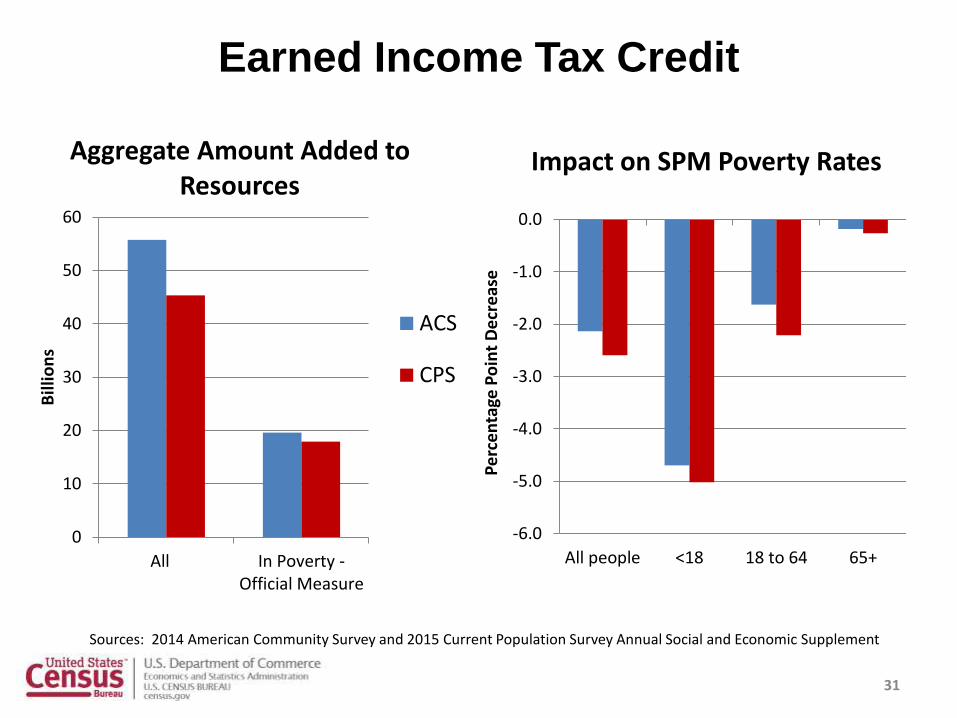
Earned Income Tax Credit
0
10
20
30
40
50
60
All In Poverty -Official Measure
Bill
ion
s
Aggregate Amount Added to Resources
ACS
CPS
-6.0
-5.0
-4.0
-3.0
-2.0
-1.0
0.0
All people <18 18 to 64 65+
Pe
rce
nta
ge P
oin
t D
ecr
eas
e
Impact on SPM Poverty Rates
31
Sources: 2014 American Community Survey and 2015 Current Population Survey Annual Social and Economic Supplement
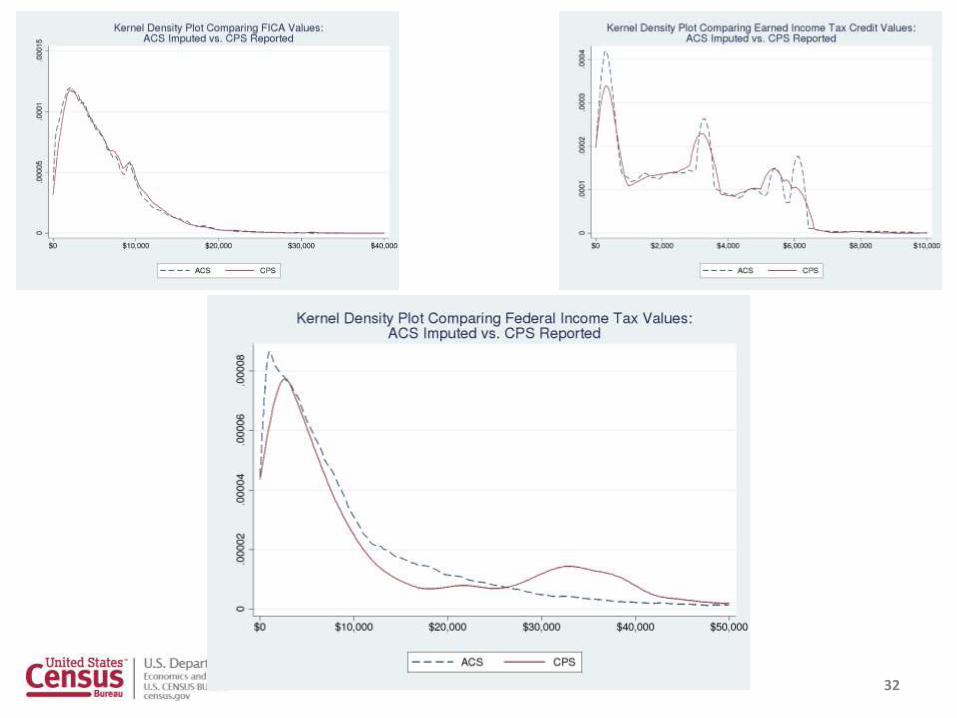
32
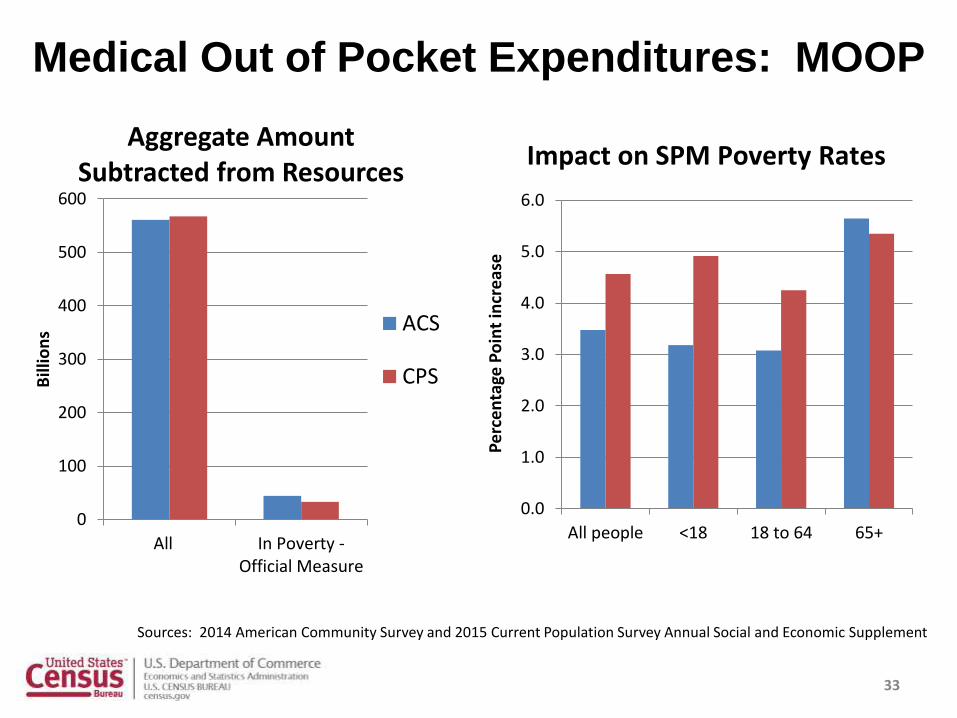
Medical Out of Pocket Expenditures: MOOP
0
100
200
300
400
500
600
All In Poverty -Official Measure
Bill
ion
s
Aggregate Amount Subtracted from Resources
ACS
CPS
0.0
1.0
2.0
3.0
4.0
5.0
6.0
All people <18 18 to 64 65+
Pe
rce
nta
ge P
oin
t in
cre
ase
Impact on SPM Poverty Rates
33
Sources: 2014 American Community Survey and 2015 Current Population Survey Annual Social and Economic Supplement
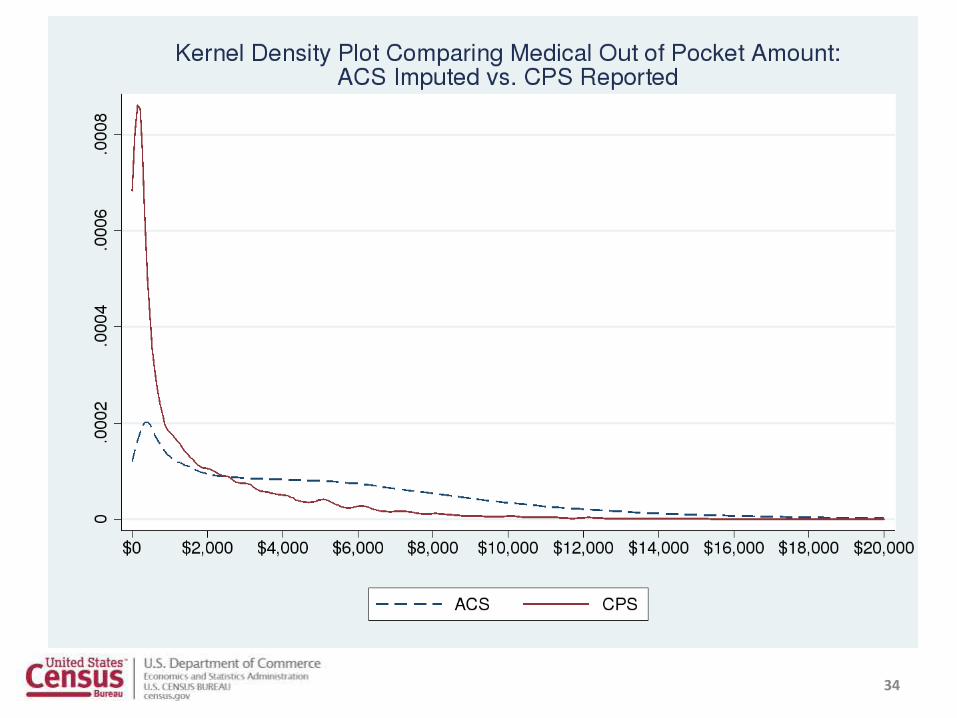
34
35
36