utah department of transportation 2012 strategic direction
TRANSCRIPT

8/2/2019 Utah Department of Transportation 2012 Strategic Direction
http://slidepdf.com/reader/full/utah-department-of-transportation-2012-strategic-direction 1/28
12012 Strategic Direction anD Performance meaSureS
2012 STRATEGIC DIRECTION& P E R F O R M A N C E M E A S U R E S
U T A H D E P A R T M E N T O F T R A N S P O R T A T I OSam White Bridge

8/2/2019 Utah Department of Transportation 2012 Strategic Direction
http://slidepdf.com/reader/full/utah-department-of-transportation-2012-strategic-direction 2/28
Tb Of ContntsIntoduction 2
Th Uth Tnspottion Commission 4
Th Chn 6
STraTegIC gOalS
Ps Infstuctu 8
Optimiz Mobiit 14
Impo Sft 20
Stnthn th econom 23
Diin rsuts 25

8/2/2019 Utah Department of Transportation 2012 Strategic Direction
http://slidepdf.com/reader/full/utah-department-of-transportation-2012-strategic-direction 3/28
3 2012 Strategic Direction anD Performance meaSureS
UDOT REGIONS
80
70
Kris Peterson 801-620-1600
Jason Davis 801-975-4841
Shane Marshall 801-227-8001
Nathan Lee 435-893-4700
Box Elder
Cache
Rich
Weber
Summit
Tooele
Juab
Utah
W a s a t c h
SaltLake
Davis
Duchesne
Daggett
Uintah
Carbon
Grand
Emery
Sanpete
Millard
Beaver Piute
Sevier
Wayne
Garfield
San Juan
Kane
Washington
Iron
M o r g a
n
Region 2
Region 3
Region 4
Region 1
Region Directors

8/2/2019 Utah Department of Transportation 2012 Strategic Direction
http://slidepdf.com/reader/full/utah-department-of-transportation-2012-strategic-direction 4/28
2 utah DePartment of tranSPortation
The 2012 Strategic Direction:
Measuring Progress and Planning or Utah’s Future Every day we interact in some way with Utah’s transportation system.
Whether it’s through the goods we purchase or services we use, the
places we work, the schools our children attend or the recreational areas
we visit, our transportation system is the key to reaching our destination
saely and eciently.
As the custodian o Utah’s roads, bridges and highways, UDOT’s perormance is critical to the health o our
state’s economy and to our quality o lie. In order to chart consistent, measurable progress, we have ocused
on our goals over the past eight years. They have served us well and helped remind us o our responsibilities.
This year, we have revised our goals and included a new and important objective. These new goals are:
• Preserve Infrastructure
• Optimize Mobility
• Improve Safety
• Strengthen the Economy
Government does not in and o itsel create economic prosperity. However, government can acilitate, enable,
stimulate and strengthen the economy. The work we do provides a oundation or a strong economy. As we
ocus on this new goal, I want UDOT to be responsible or a transportation system that enables private sector
growth, promotes prosperity and ultimately strengthens Utah’s economy.
With help rom the outstanding employees here at UDOT and our partners in the contracting industry who work
on our projects, Utah’s transportation system saw some signicant improvements in 2011. Here’s a look at
some transportation highlights:
Major Capacity Projects Underway – Construction on the I-15 CORE project and the Mountain View
Corridor was well underway in 2011. Both will be complete by the end o 2012. No road project the size o I-15
CORE has ever been built in less time. Just as important, its cost per lane mile constructed is less than hal o any other billion-dollar highway project in the country. In addition, very ew brand-new acilities are being built
nationwide, but here in Utah, three miles o the Mountain View Corridor opened in Utah County and 15 more
miles will open in Salt Lake County by year end.
UTaH DeParTMeNT OF TraNSPOrTaTION

8/2/2019 Utah Department of Transportation 2012 Strategic Direction
http://slidepdf.com/reader/full/utah-department-of-transportation-2012-strategic-direction 5/28
3 2012 Strategic Direction anD Performance meaSureS
Employing Innovation – UDOT has long taken pride in the innovative techniques we employ on many o
our projects. Last year was no exception. In March, the world watched as the Sam White Bridge in American
Fork was moved into place over I-15 in just one night, using Accelerated Bridge Construction technology.
At 354 eet, the bridge is the longest two-span bridge ever to be moved in the western hemisphere.
Express Lanes Success – Thousands o Utahns are now taking advantage o the value the Express Lanes
bring. Users o the Express Lanes see the benets o speed that are about 14 miles per hour aster than the
general lanes during peak periods. The lanes are also proving to be saer, accounting or ewer than one percent
o the crashes on I-15. UDOT currently has 80 miles o Express Lanes, and once the I-15 CORE project is
nished, that number will jump to 124 miles, the longest continuous Express Lanes in the country.
New Technology – In December, UDOT launched its rst smart phone app that allows people to get trac,
road conditions and road orecast inormation on the go. Now almost everyone can have the best and most
up-to-date inormation rom UDOT’s Trac Operation Center at their ngertips. Within one month o its release,
nearly 30,000 people had downloaded the UDOT Trac app.
Using the Strategic Direction as an outline, each section o this document explains goals, achievements
and perormance trends. While not exhaustive, this inormation gives an accurate picture o where we stand
and where we need to go. In addition to this publication, supportive inormation can be ound on our website,udot.utah.gov.
We take our responsibility seriously and will continue to work hard to maintain and improve a sae and ecient
transportation system or Utah citizens.
Thank you,
John Njord
Executive Director
801-965-4113
I n t r o d u c t i o n

8/2/2019 Utah Department of Transportation 2012 Strategic Direction
http://slidepdf.com/reader/full/utah-department-of-transportation-2012-strategic-direction 6/28
4 utah DePartment of tranSPortation
The Commission is comprised o seven members. Their roles and responsibilities, as
dened in Utah Code 72-1-303, include:
• Determine priorities and funding levels of projects in the state transportation system
considering a prioritization o needs provided by the Department
• Determine additions and deletions to the state highway system
• Take public comment about transportation matters at scheduled Commission meetings
• Make policies and rules under the Rulemaking Act, §63-46a, necessary to perform the
Commission’s duties
• Approve establishment of tollways for new state highways or new capacity lanes
under §72-6-118
• Advise the Department on state transportation systems policy
• Review administrative rules made, amended or repealed by the Department
• Annually review public transit plans. In addition, one commissioner serves as a
non-voting member o the Board o Trustees or the Utah Transit Authority
To nd more inormation about the commissioners, visit udot.utah.gov/go/commission.
Each commissioner may be contacted directly or through the Commission Secretary.
The Utah Transportation Commission works in partnership with
UDOT to provide a quality transportation system or all o Utah.
Meeting Utah’s Transportation Needs
THe UTaH TraNSPOrTaTIONCOMMISSION

8/2/2019 Utah Department of Transportation 2012 Strategic Direction
http://slidepdf.com/reader/full/utah-department-of-transportation-2012-strategic-direction 7/28
5 2012 Strategic Direction anD Performance meaSureS
T h e U t a h Tr a n s p o r t a t i o n C o m m i s s i o n
UDOT operates its programs rom a combination o ederal, state and local unds. Amounts and
percentages change rom year to year.
NewCapacity75%
Maintenance,Preservation &Rehabilitation
9%
Safety 6%
Bridges 5%
Other 5%
Distribution of Funds for UDOT Projects
Incoming Funds
OtherCounty Sales Tax &
Registration Fees 6%
StateTransportation Funds 31%
Bond Proceeds42%
UTAH TRANSPORTATION COMMISSION
FederalTransportation Funds 21%
Available Transportation Funding 2012

8/2/2019 Utah Department of Transportation 2012 Strategic Direction
http://slidepdf.com/reader/full/utah-department-of-transportation-2012-strategic-direction 8/28
6 utah DePartment of tranSPortation
VMT and population growth exceed
increased transportation capacity,
measured in new lane miles added
to the system. Projections show
growth will continue.
Growth Also Creates Opportunity
Investing in transportation helps meet today’s needs and builds a solid oundation or continued
economic expansion and success. By building a strong and capable transportation system,
UDOT can help acilitate, enable and stimulate economic prosperity.
Population Growth vs. Lane Miles
Between 1990 and 2010, Utah’s population increased by 60 percent and the number o vehicle miles
traveled (VMT*) increased by 82 percent but capacity increased by six percent.
Projections show that by 2015, travel will increase by 85 to 90 percent, population by 70 to 80 percent
and new capacity by seven percent. By 2050 more than ve million people will call Utah home, making it
one o the astest growing states in the country.
*VMT is a measure of the total number of vehicle miles traveled on a specific road segment over a given period of time. In this document,
UDOT is using systemwide numbers calculated yearly.
The demands on Utah’s transportation system continue to be substantial.
Population growth and higher per capita system use have created demand
or increased capacity. Increased system use has also put a strain on scarce
resources to preserve and extend the lie o roads and bridges.
Expanding and preserving our system will require improved e ciency,
careul use o resources and close partnering with decision makers.
Meeting Utah’s Transportation Needs
THe CHalleNge
120
100
80
60
40
20
0
1990 1995 2000 2005 2010 2015
% C
h a n g e f r o m
1 9 9 0
VMT
Population
Estimate
2010-2015
Lane Miles (New)
82%
60%
6%
UTaH STaTeWIDe
grOWTH TreNDS

8/2/2019 Utah Department of Transportation 2012 Strategic Direction
http://slidepdf.com/reader/full/utah-department-of-transportation-2012-strategic-direction 9/28
7 2012 Strategic Direction anD Performance meaSureS
Increased VMT gives rise to:
Trafc Delay: Utahns along the Wasatch Front experience 100,000 hours o systemwide delay per day.
Improvements planned through 2030 will help maintain mobility.
Increased Wear and Tear: UDOT maintains nearly 6,000 centerline* miles o roadways across the state,
an investment worth tens o billions o dollars. In order to protect that investment, the transportation system
must be kept in good condition.
Vehicle-Related Crashes: With increased trac and vehicles, UDOT is working diligently on solutions to
keep atal crashes trending downward toward zero.
T h e C h a l l e n g e
UDOT opened the rst section
of the Mountain View Corridor
(MVC) on September 24,
2011. 2100 North in Lehi
offers drivers a new east-west
connection between I-15 and
Redwood Road. Fifteen miles
of MVC between 5400 South
and 16000 South in Salt Lake
County will open in 2012.
UDOT Can Meet The ChallengeFinding ways to meet transportation needs while
keeping our current system in good condition requires
resourceulness and innovative thinking. The state has
more than $26 billion in unmet highway needs already
identied through 2040. UDOT recognizes that every
transportation need cannot be unded with projected
revenue sources.
To meet the challenge, UDOT is ocusing on its
Final Four Strategic Goals:
•PreserveInfrastructure •OptimizeMobility
•ImproveSafety
•StrengthentheEconomy
*Centerline miles: On a road segment, a measure of distance between
a beginning and ending point.
Lane miles: On a road segment, the centerline measurement times
the total number of lanes.
Crews carefully lower a pre-cast bridge deck panel into position
on the west-bound bridge over the Union Pacic Railroad line on
I-84, at Taggar t in Morgan County. This bridge rehabilitation
project was accomplished during the summer of 2011 and was
selected as UDOT’s Rural Project of the Year.

8/2/2019 Utah Department of Transportation 2012 Strategic Direction
http://slidepdf.com/reader/full/utah-department-of-transportation-2012-strategic-direction 10/28
8 utah DePartment of tranSPortation
Good Roads Cost Less
The most eective way to
preserve the transportation
system is to continue a
regular schedule o upkeep
to prevent deterioration.
Preserving ourinrastructure includes
actions such as:
• Sealing decks, painting
steel and maintaining
joints and bearings on
bridges
• Repairing cracks and
potholes and resuracingasphalt or concrete
pavement
• Repairing or replacing
drainage systems
UDOT’s rst goal is preserving Utah’s existing transportation inrastructure.
The state’s multi-billion dollar investment in roads, bridges and other assets
must be maintained or uture generations.
Keeping Utah’s bridges and pavement in good condition is the most eective
way to extend the lie o the transportation system. UDOT maintains a
multi-billion dollar system by:• Applying well-timed preservation treatments
• Addressing critical needs rst
P a v e m e n t C o n d i t i o n
Pavement Age (Years)
5 10 15 20 25 30
100
80
60
40
20
0
Minor Investments/ Treatments Major Investment/ Treatments
OriginalPavementCondition
Preservation work should begin 7 to 10 years after initial completion.
Once deterioration occurs, taxpayers will shoulder a much higher cost to r epair
or rebuild pavement and bridges.
exTeNDINg PaveMeNT lIFe
Sttic go
PreServe INFraSTrUCTUre

8/2/2019 Utah Department of Transportation 2012 Strategic Direction
http://slidepdf.com/reader/full/utah-department-of-transportation-2012-strategic-direction 11/28
9 2012 Strategic Direction anD Performance meaSureS
Preserving Pavement
UDOT uses a long-term strategy to preserve and maintain the transportation inrastructure. By applying
a combination o routine maintenance, preservation, minor and major rehabilitation and reconstruction
projects, UDOT is able to utilize limited unding to maximize the pavement condition.
Regularly scheduled upkeep is the most cost eective method to preserve and extend the lie o the
state’s pavement asset.
Three dierent maintenance management levels were created in recognition that roads have dierent
values based on the volume o daily trac. The three maintenance levels are:
• Interstate
• Level 1 Roads: More than 2,000 cars per day
• Level 2 Roads: Fewer than 2,000 cars per day
P r e s e r v e I n f r a s t r u c t u r e
I n t e r s t a t e
Miles ~ 935, 16%
Lane Miles ~ 25%
VMT ~ 53%
Combo Truck VMT ~ 63%
Level 1
AADT > 2,000 and/or
Truck Volumes
> 500
Miles ~ 2,180, 37%
Lane Miles ~ 41%
VMT ~ 43%
Combo Truck VMT ~ 32%
Level 2
AADT < 2,000
Miles ~ 2,735, 47%
Lane Miles ~ 34%
VMT ~ 4%
Combo Truck VMT ~ 5%

8/2/2019 Utah Department of Transportation 2012 Strategic Direction
http://slidepdf.com/reader/full/utah-department-of-transportation-2012-strategic-direction 12/28
10 utah DePartment of tranSPortation
UDOT measures the health o the pavement by the percentage o systemwide roads in good and air
condition. By monitoring and maintaining pavement conditions within good and air thresholds, UDOT
is able to increase eciency and reduce the cost o expensive reconstruction projects. Approximately
$145 million in ederal unds and $20 million in state unding are allocated annually to maintain the
overall pavement condition.
P r e s e r v e I n f r a s t r u c t u r e
Crews on the I-15 Dowel Bar Concrete Rehabilitation project in Box Elder County nish a section of roadway near Tremonton by sealing the
dowel bars into slots in the pavement with grout. Installing dowel bars in older concrete pavements can extend the functional life of a sectionof interstate from eight to 10 years, saving taxpayers millions in new construction costs.
Allocation o Pavement Funding
Interstate $60 million
Level 1 NHS $50 million
Level 1 Non-NHS $45 million
Level 2 $10 million

8/2/2019 Utah Department of Transportation 2012 Strategic Direction
http://slidepdf.com/reader/full/utah-department-of-transportation-2012-strategic-direction 13/28
12012 Strategic Direction anD Performance meaSureS
100%
90%
80%
70%
60%
50%
40%
30%
20%
10%
0
2 0 0 8
2005 to 2011 condition based on
measured .1 mile data
2011 to 2018 condition based on
modeled “section level” index
2 0 0 9
2 0 1 0
2 0 1 1
2 0 1 2
2 0 1 3
2 0 1 4
2 0 1 5
2 0 1 6
2 0 0 8
2 0 0 9
2 0 1 0
2 0 1 1
2 0 1 2
2 0 1 3
2 0 1 4
2 0 1 5
2 0 1 6
% o
f M i l e s
% Poor: IRI > 170% Fair% Good: IRI < 95
Thresholds vary in width for each maintenance
management level
Historical Estimated Future Conditions Historical Estimated Future Conditions
100%
90%
80%
70%
60%
50%
40%
30%
20%
10%
0
2 0 0 8
2 0 0 9
2 0 1 0
2 0 1 1
2 0 1 2
2 0 1 3
2 0 1 4
2 0 1 5
2 0 1 6
2 0 0 8
2 0 0 9
2 0 1 0
2 0 1 1
2 0 1 2
2 0 1 3
2 0 1 4
2 0 1 5
2 0 1 6
% o
f M i l e s
Historical Estimated Future Conditions Historical Estimated Future Conditions
INTerSTaTe SySTeM PaveMeNT
CONDITION HISTOrICal/PrOJeCTeDInterstate System Ride -
Forecasted with 60 million/year (935 miles)
level 1 NON-NHS PaveMeNT
CONDITION HISTOrICal/PrOJeCTeDLevel 1 non-NHS System Ride Quality -
Forecasted with 45 million/year (1,175 miles)
For the Interstates and Level 1 (National Highwa y System), the Department model continues to forecast a n upwa rd
trend of the overall pavement condition based on current funding.
For Level 1 (non-National Hig hway System), the Department model continues to forecast a relatively stable
condition while Level 2 continue a downward trend of the overall pavement condition based on current funding.
P r e s e r v e I n f r a s t r u c t u r e
level 1 NHS PaveMeNT CONDITION
HISTOrICal/PrOJeCTeDLevel 1 NHS System Ride Quality -
Forecasted with 50 million/year (1,005 miles)
level 2 PaveMeNT CONDITION
HISTOrICal/PrOJeCTeDLevel 2 System Ride Quality -
Forecasted with 10 million/year (2,735 miles)

8/2/2019 Utah Department of Transportation 2012 Strategic Direction
http://slidepdf.com/reader/full/utah-department-of-transportation-2012-strategic-direction 14/28
12 utah DePartment of tranSPortation
P r e s e r v e I n f r a s t r u c t u r e
2011 Accomplishments include:
• More than 90 preservation and rehabilitation
projects completed
• Approximately 350 miles, or six percent of the
system, received a specic preservation or
rehabilitation treatment
• Overall pavement conditions continue to be
good and air
• During the last year the overall condition of
the state’s biggest investment, Interstates,
continued to improve
• The pavement condition for Level 1 roads
remained constant and Level 2 roads
trended downward
2012 Goals include:
• Complete all preservation and rehabilitation
projects on time and within budget
• Continue modeling to determine the
proper unding mix between maintenance
management levels; Interstate, Level 1 and
Level 2
• Reverse or slow the pavement condition
decline o Level 2 roads
• Continue to maintain the Interstates and
Level 1 roads in good condition
Preserving Bridges
UDOT strives to maintain a sae transportation system by managing the bridge inrastructure. Preservation
activities such as protecting bridge decks, cleaning expansion joints and maintaining bearings, aid in extending
the lie o a bridge or a nominal cost while negligence can increase the rate o bridge deterioration, reduce the
bridge lie expectancy and require major bridge rehabilitation or replacement at a much higher cost.
UDOT measures the health o the bridge system using condition ratings. UDOT’s bridges continue to be sae
with the overall rating o “good” and bridges rated “poor” continue to decrease. However, there are approximately
700 bridges that will need to be xed or replaced in the coming years to prevent long-term problems.
40%
50%
60%
70%
80%
90%
100%
% o
f B r i d
g e s
0%
10%
20%
30%
2004 2005 2006 2007 2008 2009 2010 2011
Poor
Fair
Good
Condition Rating
CONDITION OF UDOT BrIDgeS
Bridges rated in fair condition are
staying static due to preservation
efforts. Bridges rated in g ood
condition are increasing due to
new construction.

8/2/2019 Utah Department of Transportation 2012 Strategic Direction
http://slidepdf.com/reader/full/utah-department-of-transportation-2012-strategic-direction 15/28
12012 Strategic Direction anD Performance meaSureS
UDOT is seeing a boom in the number of 30- to 50-year-old bridges coming due for replacement.
Initial Interstate Construction
Dedicated Capacity Funding
0
100
200
300
400
500
'10s'00s'90s'80s'70s'60s'50s'40s'30s'20s
N u m b e r o f
B r i d g e s
656
31
158
403369
314
187
287
58
2011 Accomplishments Include:
• Seven bridges were built and installed as either new structures or to replace existing bridges
• Bridge preservation and rehabilitation activities were performed on more than 35 bridges
• The bridge condition has remained constant with an overall good condition rating
2012 Goals Include:
• Continue to maintain a bridge system rated in good condition
• Expand bridge management efforts and prepare a plan for every structure based on preservation,
rehabilitation and replacement needs
• Continue to improve the Bridge Asset Management System to project future bridge needs and
unding to eectively manage the structure assets
Because UDOT is experiencing a boom in the number o aging bridges, about 40 older bridges will
need to be replaced each year over the next 30 years. UDOT is planning or the uture and evaluating
means and methods to extend the lie o existing bridges, while reducing uture bridge costs by
keeping them in good condition.
age DISTrIBUTION OF UDOT BrIDgeS
P r e s e r v e I n f r a s t r u c t u r e

8/2/2019 Utah Department of Transportation 2012 Strategic Direction
http://slidepdf.com/reader/full/utah-department-of-transportation-2012-strategic-direction 16/28
14 utah DePartment of tranSPortation
Sttic go
OPTIMIZe MOBIlITy
UDOT works to optimize trac mobility through:
• Adding capacity • Innovative cross roads
• Managed lanes • Signal coordination
Planning or the Future
Trac delay diminishes the quality o lie or all who live and drive in Utah. Thanks to state unding, UDOT
is currently holding back delay. Data rom the Wasatch Front Regional Council (WFRC) shows current
and projected delay with and without capacity improvements starting in 1995. Between 1995 and 2010,
delay is shown to be at a standstill, even with a 50 percent increase in population and VMT.
Even with planned capacity projects, delay will increase ater 2012. However, the increase in delay
would be two times greater by 2015 without capacity projects, according to WFRC’s projections.
UDOT’s past goals o “Make the System Work Better” and “Increase
Capacity” have always been very connected and ocused on providing
mobility on the highway system. Without diminishing either goal, UDOT has
combined them into one comprehensive goal o “Optimize Mobility.”
1995 2000 2005 2010 2015 2020 2025 2030 2035 2040
200,000
400,000
600,000
800,000
1,000,000
1,200,000
All Revenue Assumption
Before 2040 Achieved
T o
t a l H o u r s o f D e l a y P e r D a y
No Capacity Projects
After 1995
No Capacity Projects
After 2015
No Capacity Projects
After 2030
Delay alONg THe WaSaTCH FrONT - DavIS, WeBer, SalT lake & UTaH COUNTIeS
Without capacity improvements, delay
along the Wasatch Front
would have experienced a
three-to ve-fold increase.

8/2/2019 Utah Department of Transportation 2012 Strategic Direction
http://slidepdf.com/reader/full/utah-department-of-transportation-2012-strategic-direction 17/28
12012 Strategic Direction anD Performance meaSureS
O p t i m i z e M o b i l i t y
Since 2006, more than 730 miles have been
added to the state system rom our dierent
programs that und more than 200 projects.
Centennial Highway Fund (CHF), 1998:
This $3.9-billion program unded a number o
projects including I-15 reconstruction in Salt Lake
County and Legacy Parkway. 11400 South was
the last project in the program. Revenue sources
fow to the Transportation Investment Fund.
Transportation Investment Fund (TIF), 2005:
This $2.7 billion program is unding several
projects, including I-15 CORE, Mountain View
Corridor, Southern Corridor in St. George and the
recently completed Pioneer Crossing in American
Fork.
Critical Highway Needed Fund (CHNF), 2007:
This $1.2-billion program unds alternate routes
or I-15 reconstruction, access, congestion and
commercial energy development needs. Projectexamples include Timpanogos Highway (S.R. 92),
Mountain View Corridor, 2100 North, I-15 South
Layton Interchange, I-15 Dixie Drive Interchange
and passing lanes on U.S. 40.
Highway Construction Program (HCP):
This $323-million program unds small-scale
congestion relie projects on state and ederal
highways. Project examples include Hinckley
Drive (S.R. 79) in Weber County; S.R. 9 inHurricane and I-15 rom 9000 South to
10600 South.
Adding Capacity: Lane Miles and Funding Sources
As part of the 11400 South project, a new bridge w as built over the Jordan River providing a new east-west facility
between Bangerter Highw ay and I-15.
8/2/2019 Utah Department of Transportation 2012 Strategic Direction
http://slidepdf.com/reader/full/utah-department-of-transportation-2012-strategic-direction 18/28
16 utah DePartment of tranSPortation
O p t i m i z e M o b i l i t y
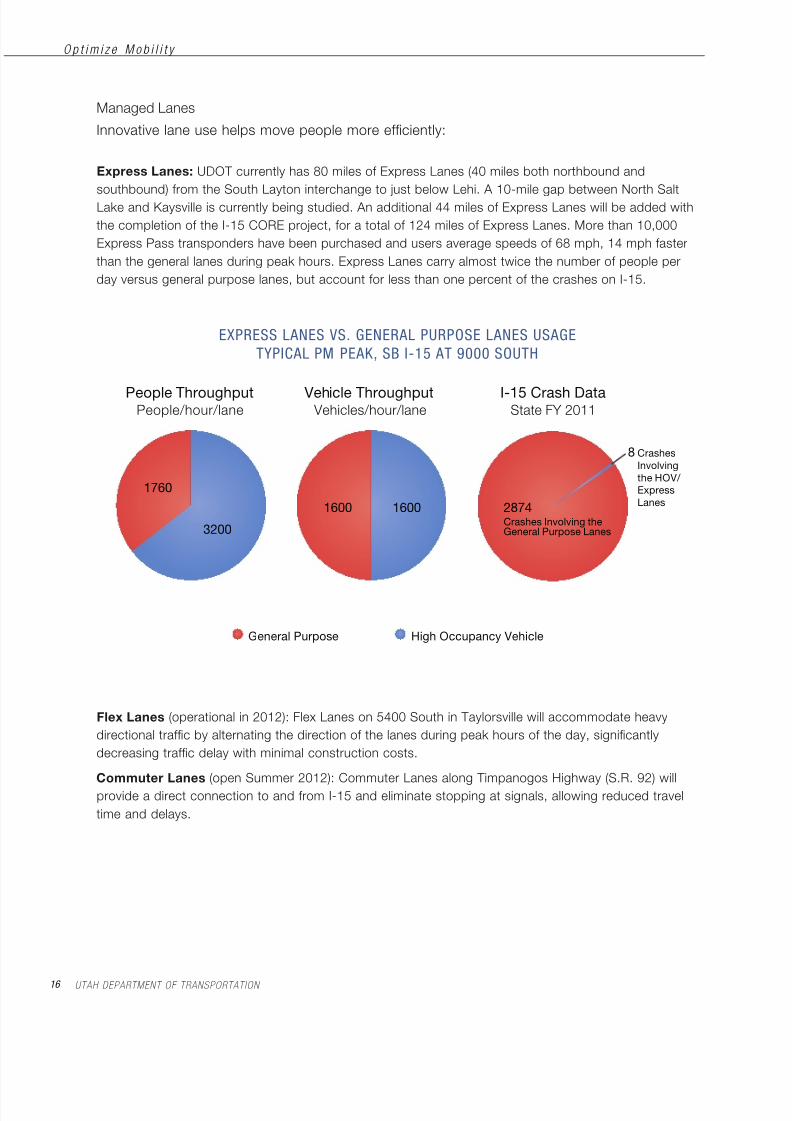
Express Lanes: UDOT currently has 80 miles o Express Lanes (40 miles both northbound and
southbound) rom the South Layton interchange to just below Lehi. A 10-mile gap between North Salt
Lake and Kaysville is currently being studied. An additional 44 miles o Express Lanes will be added with
the completion o the I-15 CORE project, or a total o 124 miles o Express Lanes. More than 10,000
Express Pass transponders have been purchased and users average speeds o 68 mph, 14 mph aster
than the general lanes during peak hours. Express Lanes carry almost twice the number o people per
day versus general purpose lanes, but account or less than one percent o the crashes on I-15.
Managed Lanes
Innovative lane use helps move people more eciently:
Flex Lanes (operational in 2012): Flex Lanes on 5400 South in Taylorsville will accommodate heavy
directional trac by alternating the direction o the lanes during peak hours o the day, signicantly
decreasing trac delay with minimal construction costs.
Commuter Lanes (open Summer 2012): Commuter Lanes along Timpanogos Highway (S.R. 92) will
provide a direct connection to and rom I-15 and eliminate stopping at signals, allowing reduced travel
time and delays.
People ThroughputPeople/hour/lane
Vehicle Throughput Vehicles/hour/lane
I-15 Crash DataState FY 2011
3200
1760
General Purpose High Occupancy Vehicle
2874
Crashes Involving theGeneral Purpose Lanes
8
16001600
Crashes
Involving
the HOV/
Express
Lanes
exPreSS laNeS vS geNeral PUrPOSe laNeS USage
TyPICal PM Peak, SB I-15 aT 9000 SOUTH

8/2/2019 Utah Department of Transportation 2012 Strategic Direction
http://slidepdf.com/reader/full/utah-department-of-transportation-2012-strategic-direction 19/28
12012 Strategic Direction anD Performance meaSureS
Innovative Cross Roads
Thru-Turns Intersections (TTI): The TTI
on 12300 South in Draper and 5400 South
in Kearns will improve trac fow, maintain
access and enhance saety. By eliminating
all let turns at the intersection, the number
and severity o crashes are greatly reduced.
Motorists will instead travel through the
intersection, make a signalized U-turn and
come back to the intersection, where they will
turn right.
Diverging Diamond Interchange (DDI):
DDIs, such as those in Lehi, American Fork
and S.R. 201 at Bangerter Highway, improve
saety and mobility while reducing the
length and cost o construction. UDOT is
looking at other locations where DDIs would
prove benecial.
Continuous Flow Intersections (CFIs):
CFIs improve trac congestion by allowing
vehicles to move more eciently through the
intersection with less delay. UDOT currently
has nine CFIs in operation.
O p t i m i z e M o b i l i t y
Thru-Turns (TTI)
Diverging Diamond Interchange (DDI)
Continuous Flow Intersection (CFI)
Intersection Wait Times in 2030
Beore TTI 2 minutes
Ater TTI 26 seconds
Average Delay Times
DDI Interchange (S.R. 92) 14.4 seconds
Diamond Interchange 47.2 seconds
Single Point UrbanInterchange (SPUI) 23.9 seconds
Benefts o a CFI
Saves Time
Moves More
Vehicles
Four minutes o delay saved
per driver during rush hour
Carries 20 percent more trac
than a standard intersection

8/2/2019 Utah Department of Transportation 2012 Strategic Direction
http://slidepdf.com/reader/full/utah-department-of-transportation-2012-strategic-direction 20/28
18 utah DePartment of tranSPortation
O p t i m i z e M o b i l i t y
Operating Utah’s Roadways
The Trafc Operation Center (TOC):
The TOC is the nerve center o UDOT. Using advanced technologies such as cameras and trac/
weather sensors, operators in the TOC can monitor trac, detect problems and take actions necessary
to return trac fow to normal. The TOC continues to be the key to providing a cost-eective and
ecient solution to help relieve congestion on Utah’s roads and highways.
Signal Coordination
UDOT is committed to making our signal operations world class. We ocus our eorts through the
Trac Management Division, which is responsible or trac signal timing on all state roads and controls
signal timing centrally at the TOC. Eective coordination o trac signals reduces congestion, saves uel,
reduces vehicle emissions, increases saety and sustains the economy. Because o the many benets,
John Njord has the Department marching toward a world-class trac signal system.
In 2011, 10 detailed signal coordination projects took place, including the greater Salt Lake City
central business district. UDOT worked with its partners to time 164 signals and 22 corridors. UDOT is
committed to making even more improvements in 2012.
Benefts o Improved Signal Timing
Travel Time Reduced 5.5 percent
Stops Reduced 11.4 percent
Intersection Delay Reduced 14.7 percent
Estimated Savings to the Public in Reduced Delay $6.2 million

8/2/2019 Utah Department of Transportation 2012 Strategic Direction
http://slidepdf.com/reader/full/utah-department-of-transportation-2012-strategic-direction 21/28
12012 Strategic Direction anD Performance meaSureS
O p t i m i z e M o b i l i t y
Providing Trac Inormation
UDOT uses a variety o methods to provide timely and accurate trac and weather inormation to help
drivers make choices that reduce delay, prevent crashes and improve air quality. By implementing an
extensive Intelligent Transportation System (ITS), UDOT is able to know what is happening on Utah
roads, and provide travelers the inormation they need to plan their routes. UDOT communicates travel
inormation online at udottrac.utah.gov and through:
Variable Message Signs (VMS): UDOT has
160 VMS located on I-15 and on major routes,
telling travelers o upcoming construction,
lane closures, crashes blocking their route,
expected travel times or inormation ahead o
a large weather event.
UDOT Trafc Cameras: Located throughout the state, UDOT trac cameras provide real-time trac
views o current road conditions. These cameras help operators at the TOC know what’s happening on
the roads, are used by news stations to report trac conditions and are readily available to the public at
udottrac.utah.gov
UDOT has more than 730 cameras in operation throughout the state, with more than 75 percent located
in Salt Lake and Utah counties.
Social Media: UDOT uses Twitter, Facebook and YouTube to post inormation and updates on trac
conditions, changes in trac fow, construction activities and weather conditions, as well as educational
materials such as animations and tutorials.
Trafc Mobile Application: This application provides mobile access to inormation about current
trac conditions, accidents, road construction activities, seasonal road closures, trac cameras and
VMS messages.
Reducing Travel Demand with TravelWise
To help make our transportation system work better, UDOTdeveloped TravelWise. The TravelWise program encourages
alternatives to driving alone to help travelers conserve energy,
reduce trac congestion and improve air quality. TravelWise
strategies include ridesharing, carsharing, carpooling, vanpooling,
active transportation (biking, walking), teleworking, e-traveling,
using transit, fexible work hours and compressed work weeks.

8/2/2019 Utah Department of Transportation 2012 Strategic Direction
http://slidepdf.com/reader/full/utah-department-of-transportation-2012-strategic-direction 22/28
20 utah DePartment of tranSPortation
UDOT remains committed to saety. Tra c-related deaths are the
lowest in 37 years.
In 2011, 233 people lost their lives on Utah roads, making 2011 the lowest number of fatalities since 1974.
reDUCINg HIgHWay FaTalITIeS TO ZerO
2000 2001 2002 2003 2004 2005 20072006 2008 2009 2010 2011
0
100
200
300
400
N u m b e r o f F a t a l i t i e s 373
292329 309
296 299276
244 253 233
287282
Traffic Fatalities Down 37%
Sttic go
IMPrOve SaFeTy
2011 Accomplishments Include:
• 503 miles of centerline and shoulder rumble strips installed in various projects
• 26 miles of median cable barrier installed, for a total of 189 miles since 2003
• 14 miles of concrete barrier installed, for a total of 118 miles since 2004
• 10 new trafc signals constructed, 20 signal upgrades constructed
• 10 pedestrian/school crossing improvements
• Construction of 19 safe sidewalk program projects
• Installation of 422 access and replacement ramps
2012 Goals Include:
• Reduce fatalities by two percent each year
Every UDOT project incorporates saety improvements. In 2011, UDOT programmed $21.8 million or
specic saety projects.

8/2/2019 Utah Department of Transportation 2012 Strategic Direction
http://slidepdf.com/reader/full/utah-department-of-transportation-2012-strategic-direction 23/28
22012 Strategic Direction anD Performance meaSureS
The number of serious
injuries and fatal cra shes
on Utah Roads, caused
by vehicles crossing the
median has reduced by
more than 220 incidents
since 1999. To date,
UDOT has installed more
than 180 miles of median
cable barrier.
INTerSTaTe SerI OUS INJUry aND FaTal CraSHeS I NvOlvINg a veHICle THaT CrOSSeD
THe MeDIaN vS TOTal MIleS OF CaBle BarrIer INSTalleD
I m p r o v e S a f e t y
Public Outreach Eorts
UDOT demonstrates its commitment to saety through outreach eorts that help educate the public and
make Utah a sae place or living, traveling and doing business. Much o UDOT’s ocus is on educating
teens and kids. In 2011, UDOT saety programs made more than 500 presentations at schools and
reached more than 90,000 students statewide.
100
120
140
160
180
50
60
70
80
90
100
0
20
40
60
80
0
10
20
30
40
C a b l e B a r r i e r ( m i l e s )
C r a s h e s
Serious Injury & Fatal Crossover Crashes Miles of Cable Barrier Installed
2002 2003 2004 2005 2006 2007 2008 2009 2010 2011
Programs:
Zero Fatalities: Addresses the top
ve behaviors causing crashes on Utah
roads: drowsy driving, distracted driving,
aggressive driving, impaired driving and not
buckling up
Student Neighborhood Access Program
(SNAP): Develops sae routes and saety
education or elementary students
Road Respect: Aims to improve saety and
increase awareness o Utah’s laws or both
cyclists and drivers
Students from Coral Canyon Elementary
walk to school along the SNAP route.

8/2/2019 Utah Department of Transportation 2012 Strategic Direction
http://slidepdf.com/reader/full/utah-department-of-transportation-2012-strategic-direction 24/28
22 utah DePartment of tranSPortation
Controlling Snow and Ice
To clear snow rom 18,000 miles o Utah’s roads, UDOT employs the latest technologies and trains
crews to ensure they are ready. On average, Utah receives more than 20 winter storms each year and
UDOT crews remove more than 65 million tons o snow and ice rom Utah’s roads. To help keep roads
clear around the clock, UDOT employs 503 ull-time snowplow drivers and 85 seasonal sta on its snow
removal team, operating a feet o 500 snowplows. UDOT’s winter operations budget or the 2011-2012
winter season is $22 million, including equipment, salaries, sand, salt, brine and avalanche control.
UDOT continues to make the snow and ice removal process more ecient by:
• Using equipment such as wing plows and tow plows that allow greater control and efciency
• Applying brine before storms and using salt more efciently
• Using technology such as Road Weather Information Systems (RWIS) and weather forecasting
inormation to assess conditions and dispatch plows advantageously
• Evaluating road conditions within one hour of every storm event
• Saving more than 20,000 gallons of diesel fuel per year by training drivers using a snow
plow simulator
Snow removal is a major
component in keeping
Utah’s roadways safe.
UDOT crews clear snow on
S.R. 14, a canyon road from
Cedar City to Cedar Breaks
National Monument.
I m p r o v e S a f e t y

8/2/2019 Utah Department of Transportation 2012 Strategic Direction
http://slidepdf.com/reader/full/utah-department-of-transportation-2012-strategic-direction 25/28
22012 Strategic Direction anD Performance meaSureS
Sttic go
STreNgTHeN THe eCONOMy
For the second year in a row, Forbes Magazine
has named Utah as the best state in the U.S.
or doing business. According to economists,
transportation plays a big role in the state’s
business environment. With major interstates
such as I-15, I-80, I-70 and I-84, Utah is truly
the “Crossroads o the West.” Because o Utah’s
transportation inrastructure, manuacturers
can get their products across the country more
quickly than ever beore.
The Relationship o VMT and GDP
The nation’s highway vehicle miles traveled
(VMT) and the U.S. gross domestic product
(GDP) refect strikingly similar patterns,
indicating the strong relationship between the
nation’s economy and its travel. The graph
shows how closely the two data series track
each other over the past our decades and
demonstrates why keeping Utahns moving
is so important to our economy.
In line with Governor Gary Herbert’s Four Cornerstones, which include
increased job growth and economic development, “Strengthen the Economy”
has been added as a new strategic goal. This new goal recognizes UDOT’s
role in creating and managing a transportation system that enables economic
growth and empowers prosperity. Success in the rst three goals creates a
solid oundation or the economy to grow.
THe relaTIONSHIP OF vMT aND gDP
1960 1965 1970 1975 1980 1985 1990 1995 2000
0
$20
$40
$60
$80
$100
$120
$140
GDP
VMT
Graph courtesy the U.S. Dept. of Energy.

8/2/2019 Utah Department of Transportation 2012 Strategic Direction
http://slidepdf.com/reader/full/utah-department-of-transportation-2012-strategic-direction 26/28
24 utah DePartment of tranSPortation
S t r e n g t h e n t h e E c o n o m y
UDOT’s Projects Aect the Economy:
Trac delay has an intrinsic, measurable cost not only to commerce, but also to users o Utah’s roads
and reeways. By improving roads through key projects, UDOT can create a transportation system that
can minimize those costs and provide economic benets to businesses, tourism and individual drivers.
Beore-and-ater studies on eight capacity projects illustrate how UDOT eectively eliminated hours o delay. User costs, a result o delay, have also been reduced.
How UDOT Does Business Aects the Economy:UDOT can aect the economy not only through the product we deliver, but in how we deliver it.
Examples include:
• Price + Time Bidding (P+T): Every project bid at UDOT uses P+T. With this method, contractors bid
a price and the number o days it will take them to construct each project. Price and time values are
added together to determine the low bid. The contractor with the most aggressive schedule is oten
awarded the contract. When construction time is minimized using the P+T method, the impacts to
businesses and drivers are lessened.
• Accelerated Bridge Construction (ABC): ABC utilizes innovative methods to construct bridges
with minimal impacts to the public. New bridges using this method can now be in place in a matter
o days rather than months. Bridges are constructed on the side o the road and oten moved intoplace overnight. ABC is used where construction impacts to the public and surrounding businesses
are signicant, thus reducing the construction time.
• Number o Jobs Generated: Currently, UDOT is working with more than 650 contractors,
subcontractors and consultants that employ more than 14,000 employees working concurrently
throughout the state. UDOT believes by channeling money back into the economy through job/project
development, Utah’s employment rate is signicantly improved.
aNNUal USer HOUrS aND COST SavINgS
0
50,000
100,000
150,000
200,000
250,000
S. R. 8 9
; P l e a s
a n t G r
o v e
$ 6 3 4 K
S a v e d
S. R. 6 8
; B l u f f d
a l e
$ 4 . 0 6 M
S a v e d
S. R. 6 8
; 6 2 0 0
S o
$ 5 . 7 0 M
S a v e d
S. R. 8 9
$ 2 . 4 5 M
S a v e d
S. R. 7 9
$ 1 . 5 5 M
S a v e d
S. R. 2 6
; R i v e r
d a l e
$ 6 . 2 5 M
S a v e d
S. R. 9 ;
3 0 0 W
t o 8 0 0
N
$ 6 5 4 K
S a v e d
1 - 1 5 ; 9
0 t h A u
x
$ 2 . 4 0 M
S a v e d
Travel time studies by UDOT
show annual sa ved user costs
of more than $23 million per
year on these eight projects.
8/2/2019 Utah Department of Transportation 2012 Strategic Direction
http://slidepdf.com/reader/full/utah-department-of-transportation-2012-strategic-direction 27/28
22012 Strategic Direction anD Performance meaSureS
Project Delivery – Putting Funding to Use
DelIverINg reSUlTS
Preconstruction
Beore any asphalt or concrete is placed, UDOT has to complete all the necessary studies,
roadway design, property and utility agreements and other elements.
The Department prepared 171 projects or construction in 2011 and currently has 202 projects
in design, worth a total o $1.07 billion.
The Department’s construction program is divided into two main parts:
Preconstruction and Construction.
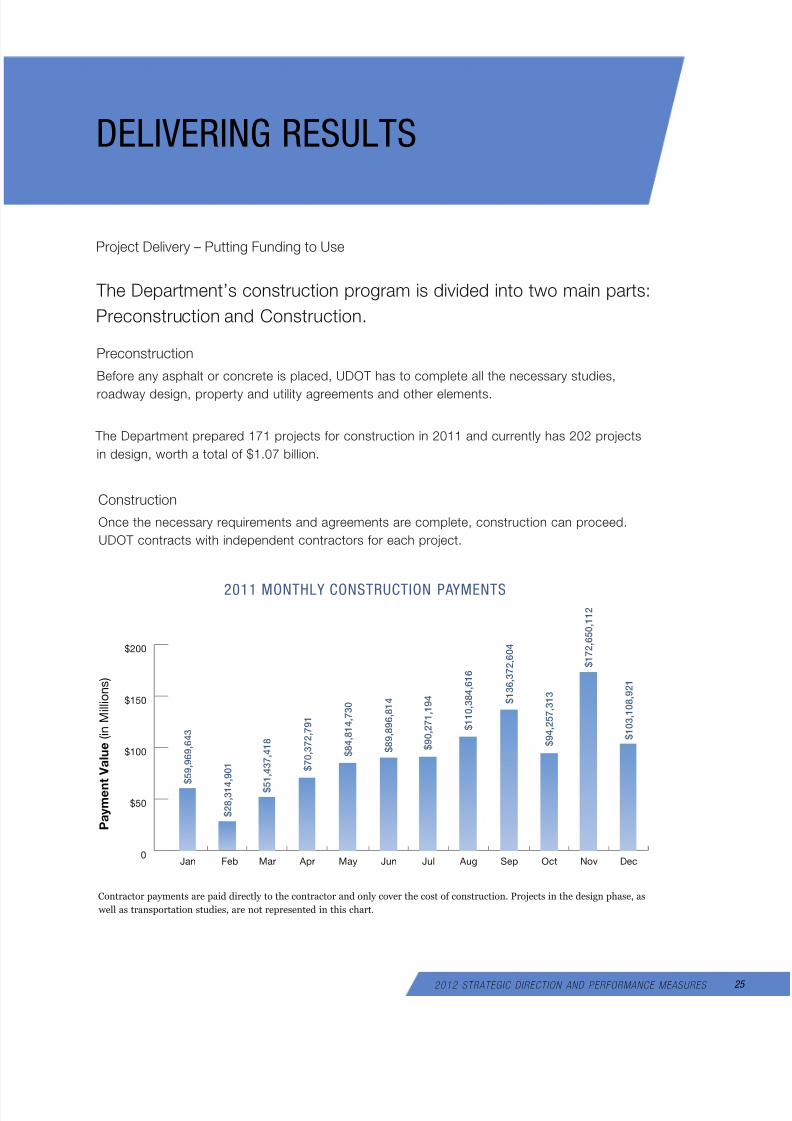
Construction
Once the necessary requirements and agreements are complete, construction can proceed.
UDOT contracts with independent contractors or each project.
Contractor payments are paid directly to the contractor and only cover the cost of construction. Projects in the design phase, as
well as transportation studies, are not represented in this chart.
2011 MONTHly CONSTrUCTION PayMeNTS
0
$50
$100
$150
$200
P a y m e n
t V a l u e ( i n M i l l i o n s )
Oct Nov DecSep AugJulJunMay AprMarFebJan
$ 9 4 ,
2 5 7 ,
3 1 3
$ 1 0 3 ,
1 0 8 ,
9 2 1
$ 1 7 2 ,
6 5 0 ,
1 1 2
$ 1 3 6 ,
3 7 2 ,
6 0 4
$ 1 1 0 ,
3 8 4 ,
6 1 6
$ 9 0 ,
2 7 1 ,
1 9 4
$ 8 9 ,
8 9 6 ,
8 1 4
$ 8 4 ,
8 1 4 ,
7 3 0
$ 7 0 ,
3 7 2 ,
7 9 1
$ 5
1 ,
4 3 7 ,
4 1 8
$ 2 8 ,
3 1 4
, 9 0 1
$ 5 9 ,
9 6 9 ,
6 4 3

8/2/2019 Utah Department of Transportation 2012 Strategic Direction
http://slidepdf.com/reader/full/utah-department-of-transportation-2012-strategic-direction 28/28
S a m W h i t e B r i d g e: The Sam White Bridge in American Fork is the longest two-span bridge ever moved in the Western
Hemisphere. The 354-foot structure was constructed using Accelerated Bridge Construction (ABC) on the side of the freeway and
both spans were moved into place simultaneously in one night using two sets of Self Propelled Modular Transporters (SPMT).