utilizing deep learning to predict the number of panicles
TRANSCRIPT
Utilizing Deep Learning to Predict the Number of Panicles in Wheat (Triticum aestivum)
Anique Josuttes*, Aich Shubra**, Ian Stavness**, Curtis Pozniak*, Steve J. Shirtliffe*Department of Plant Sciences*, Department of Computer Science**
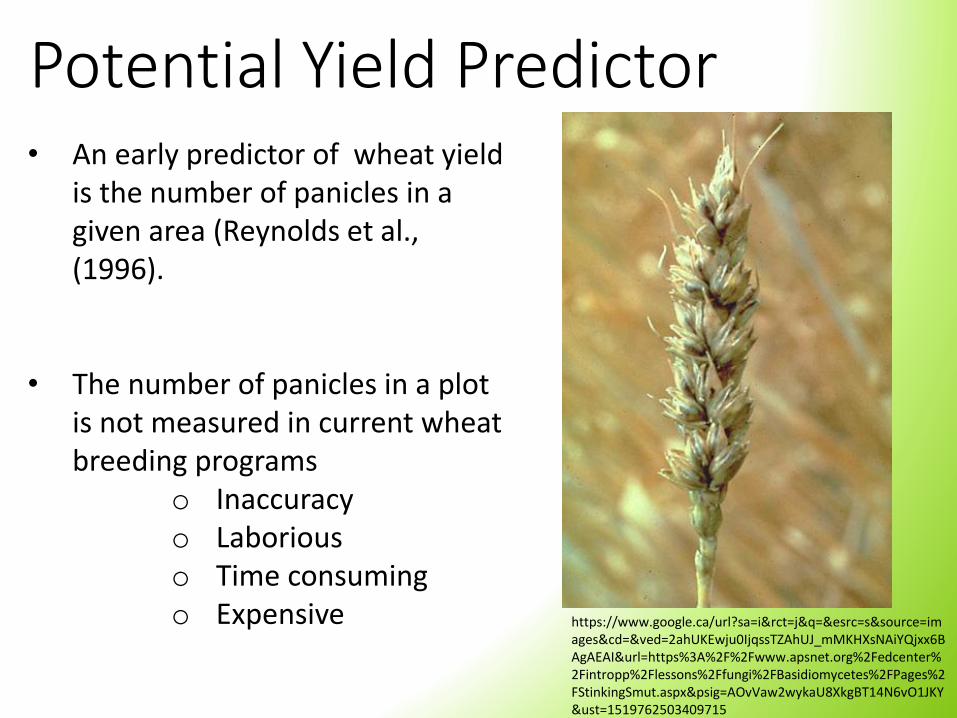
• An early predictor of wheat yield is the number of panicles in a given area (Reynolds et al., (1996).
• The number of panicles in a plot is not measured in current wheat breeding programs
o Inaccuracyo Laboriouso Time consumingo Expensive https://www.google.ca/url?sa=i&rct=j&q=&esrc=s&source=im
ages&cd=&ved=2ahUKEwju0IjqssTZAhUJ_mMKHXsNAiYQjxx6BAgAEAI&url=https%3A%2F%2Fwww.apsnet.org%2Fedcenter%2Fintropp%2Flessons%2Ffungi%2FBasidiomycetes%2FPages%2FStinkingSmut.aspx&psig=AOvVaw2wykaU8XkgBT14N6vO1JKY&ust=1519762503409715
Potential Yield Predictor
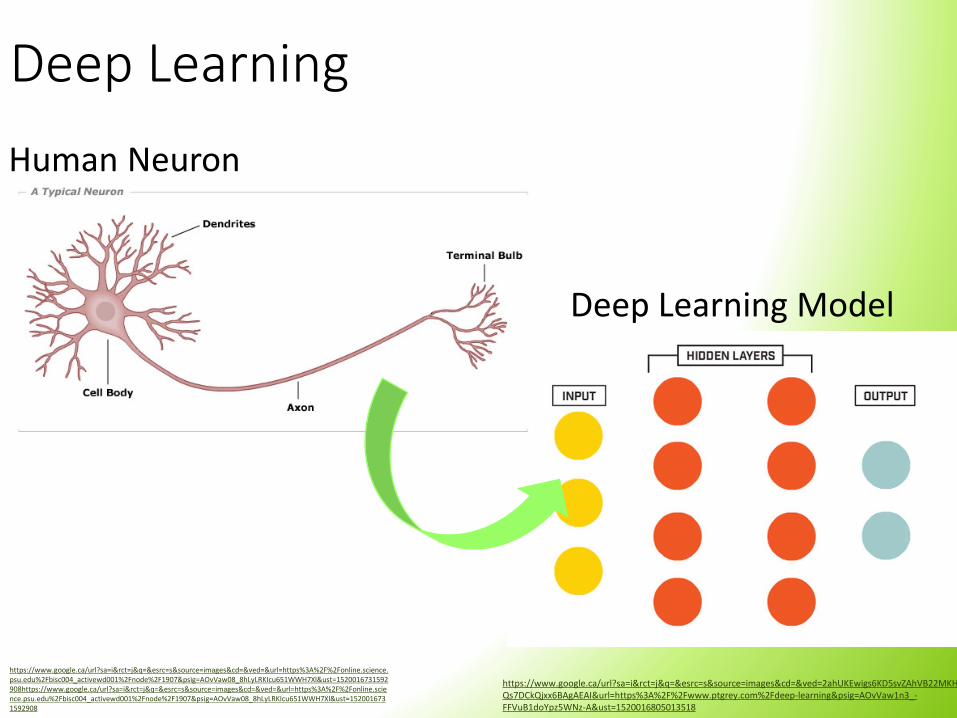
Deep Learning
Human Neuron
Deep Learning Model
https://www.google.ca/url?sa=i&rct=j&q=&esrc=s&source=images&cd=&ved=&url=https%3A%2F%2Fonline.science.psu.edu%2Fbisc004_activewd001%2Fnode%2F1907&psig=AOvVaw08_8hLyLRKIcu651WWH7Xl&ust=1520016731592908https://www.google.ca/url?sa=i&rct=j&q=&esrc=s&source=images&cd=&ved=&url=https%3A%2F%2Fonline.science.psu.edu%2Fbisc004_activewd001%2Fnode%2F1907&psig=AOvVaw08_8hLyLRKIcu651WWH7Xl&ust=1520016731592908
https://www.google.ca/url?sa=i&rct=j&q=&esrc=s&source=images&cd=&ved=2ahUKEwigs6KD5svZAhVB22MKHQs7DCkQjxx6BAgAEAI&url=https%3A%2F%2Fwww.ptgrey.com%2Fdeep-learning&psig=AOvVaw1n3_-FFVuB1doYpz5WNz-A&ust=1520016805013518
Deep Learning Model
• Learns data representations
• classifying images based on the most efficient feature extracted from that image.
• Requirements:o Input image
oBroken down within the hidden layers of the network.
oHidden layers of the network identify the most efficient feature to extract from that image
oOutput is a classification of your input.
LeCun, Y., Bengio, Y., & Hinton, G. (2015)
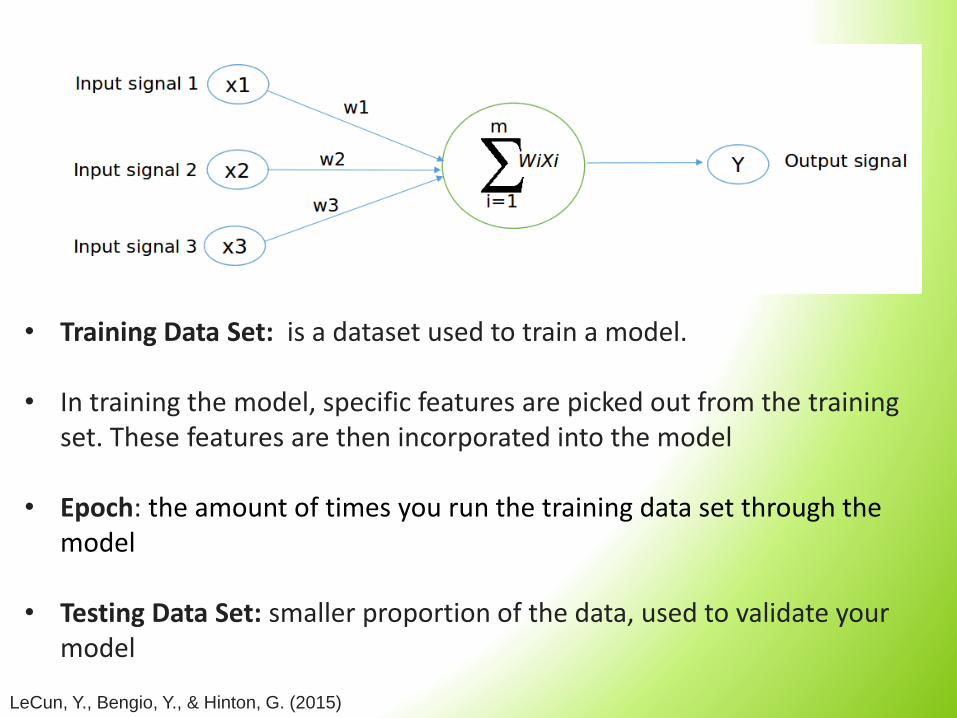
• Training Data Set: is a dataset used to train a model.
• In training the model, specific features are picked out from the training set. These features are then incorporated into the model
• Epoch: the amount of times you run the training data set through the model
• Testing Data Set: smaller proportion of the data, used to validate your model
LeCun, Y., Bengio, Y., & Hinton, G. (2015)
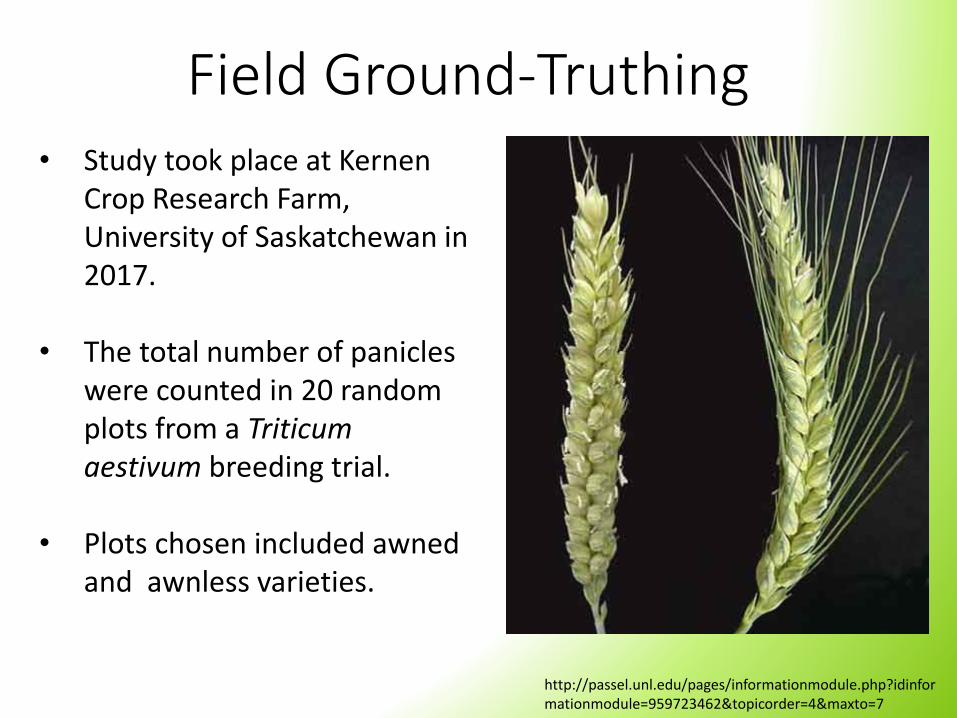
• Study took place at KernenCrop Research Farm, University of Saskatchewan in 2017.
• The total number of panicles were counted in 20 random plots from a Triticumaestivum breeding trial.
• Plots chosen included awnedand awnless varieties.
Field Ground-Truthing
http://passel.unl.edu/pages/informationmodule.php?idinformationmodule=959723462&topicorder=4&maxto=7
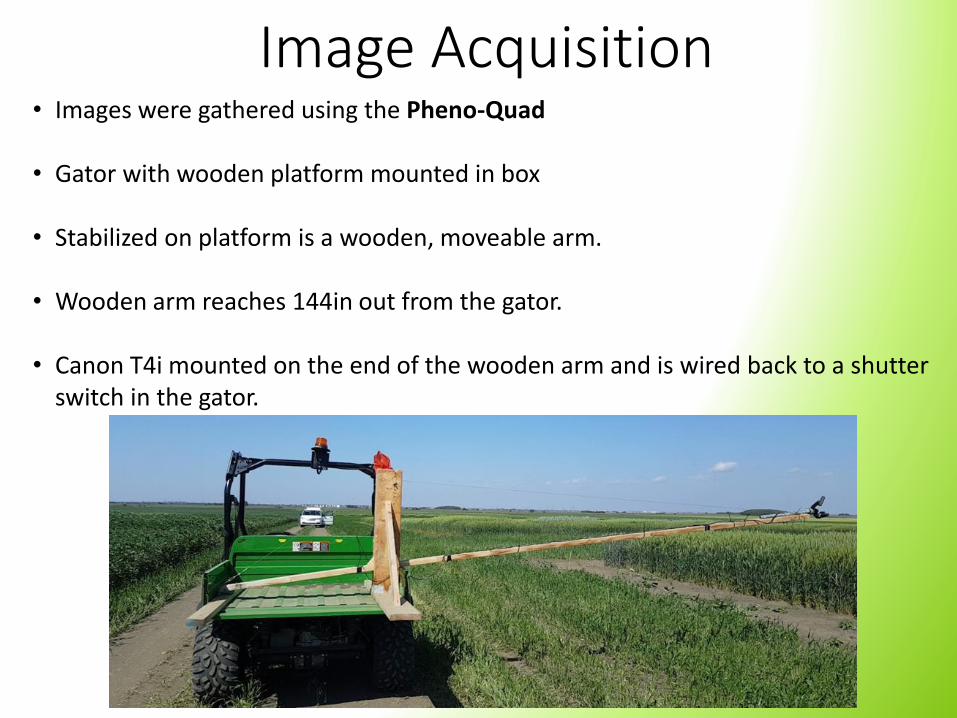
Image Acquisition• Images were gathered using the Pheno-Quad
• Gator with wooden platform mounted in box
• Stabilized on platform is a wooden, moveable arm.
• Wooden arm reaches 144in out from the gator.
• Canon T4i mounted on the end of the wooden arm and is wired back to a shutter switch in the gator.
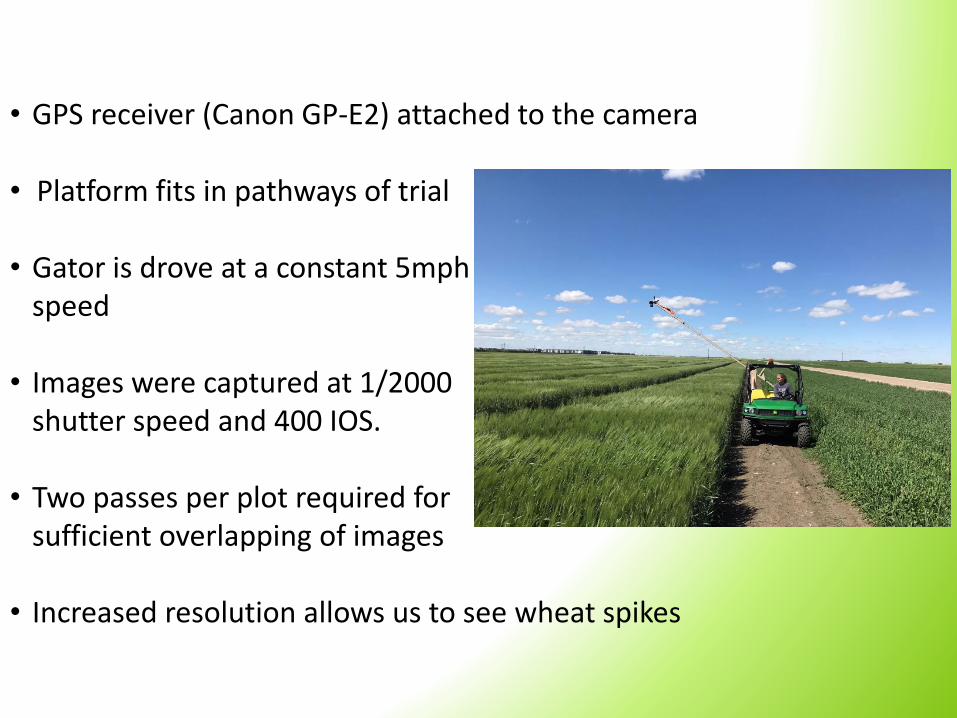
• GPS receiver (Canon GP-E2) attached to the camera
• Platform fits in pathways of trial
• Gator is drove at a constant 5mph speed
• Images were captured at 1/2000 shutter speed and 400 IOS.
• Two passes per plot required for sufficient overlapping of images
• Increased resolution allows us to see wheat spikes
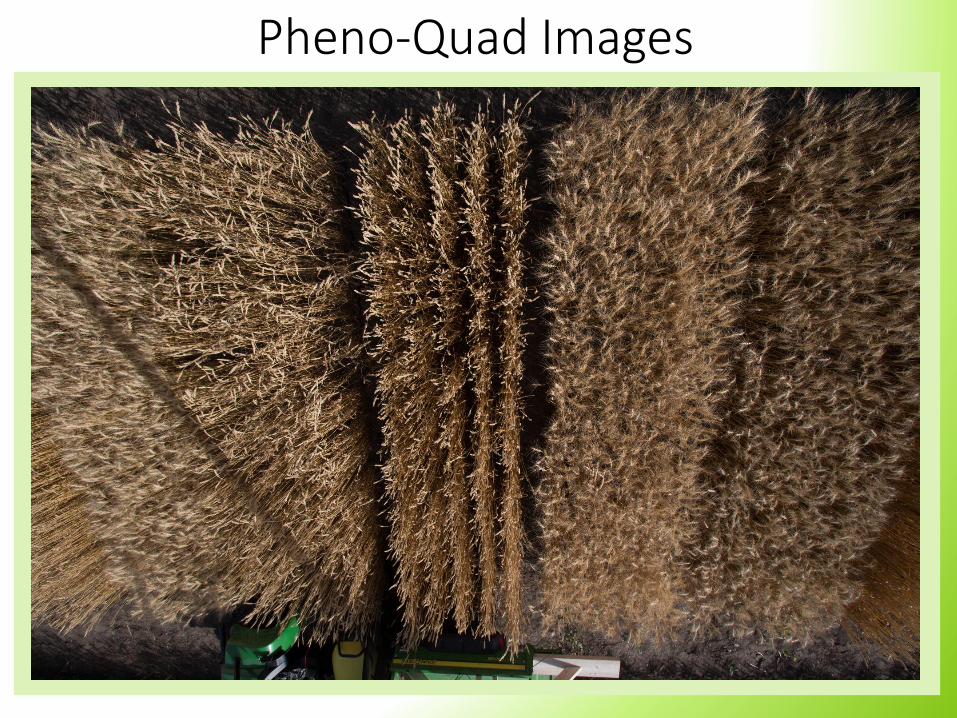
Pheno-Quad Images
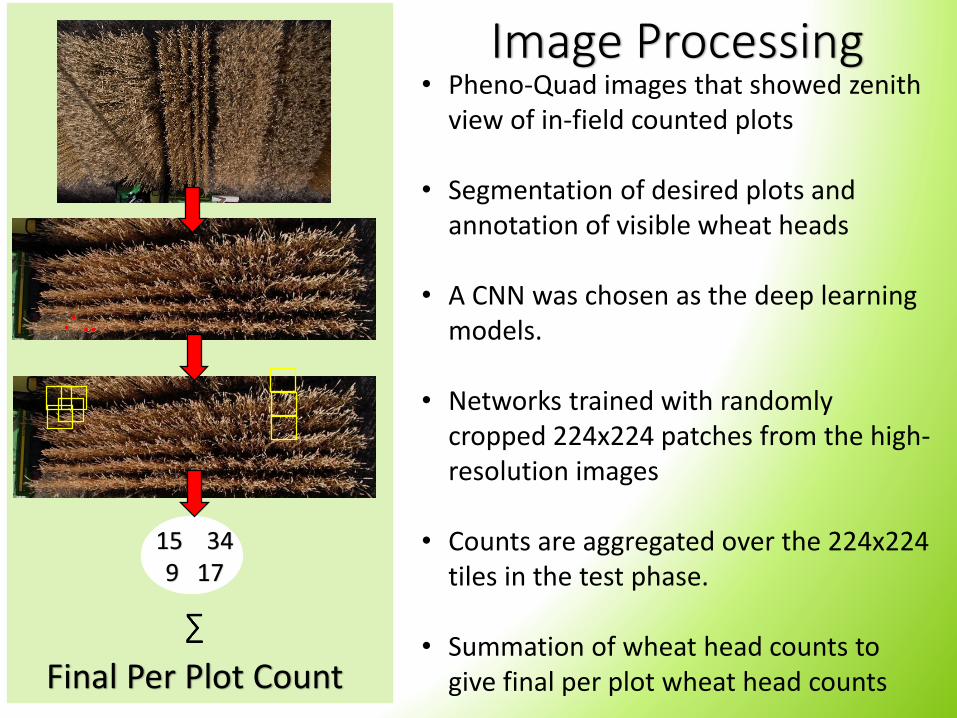
• Pheno-Quad images that showed zenith view of in-field counted plots
• Segmentation of desired plots and annotation of visible wheat heads
• A CNN was chosen as the deep learning models.
• Networks trained with randomly cropped 224x224 patches from the high-resolution images
• Counts are aggregated over the 224x224 tiles in the test phase.
• Summation of wheat head counts to give final per plot wheat head counts
Image Processing
15 349 17
Final Per Plot Count
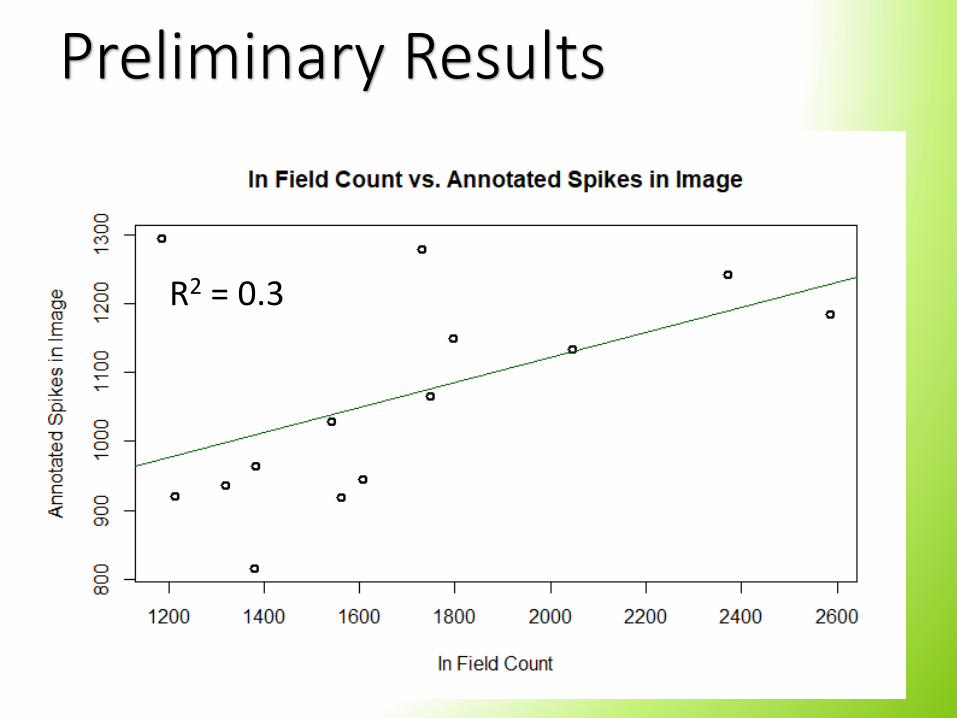
Preliminary Results
R2 = 0.3
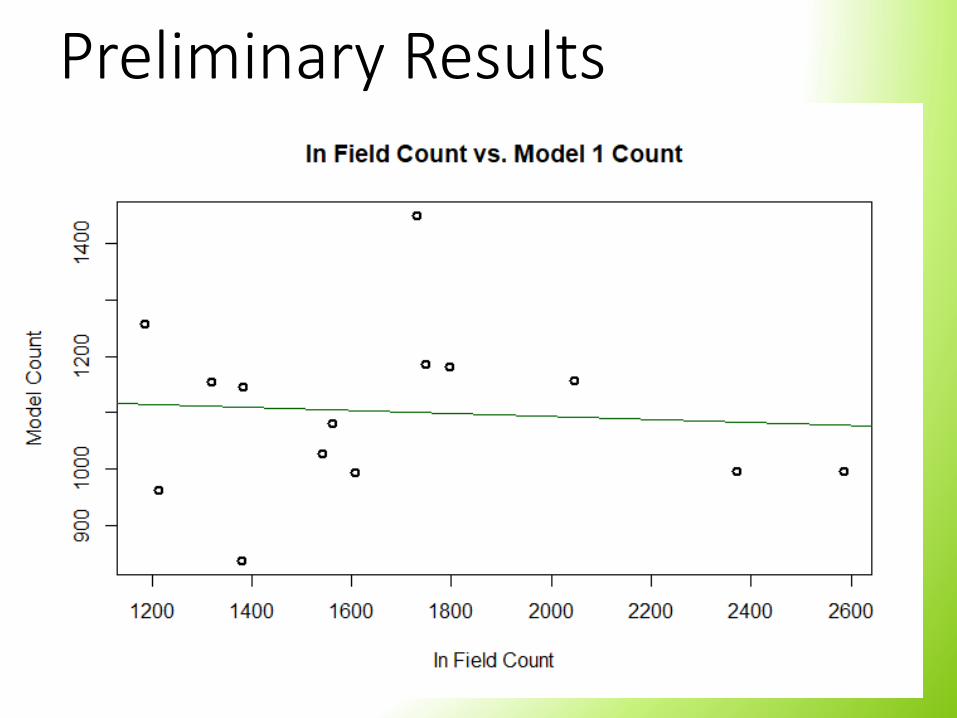
Preliminary Results
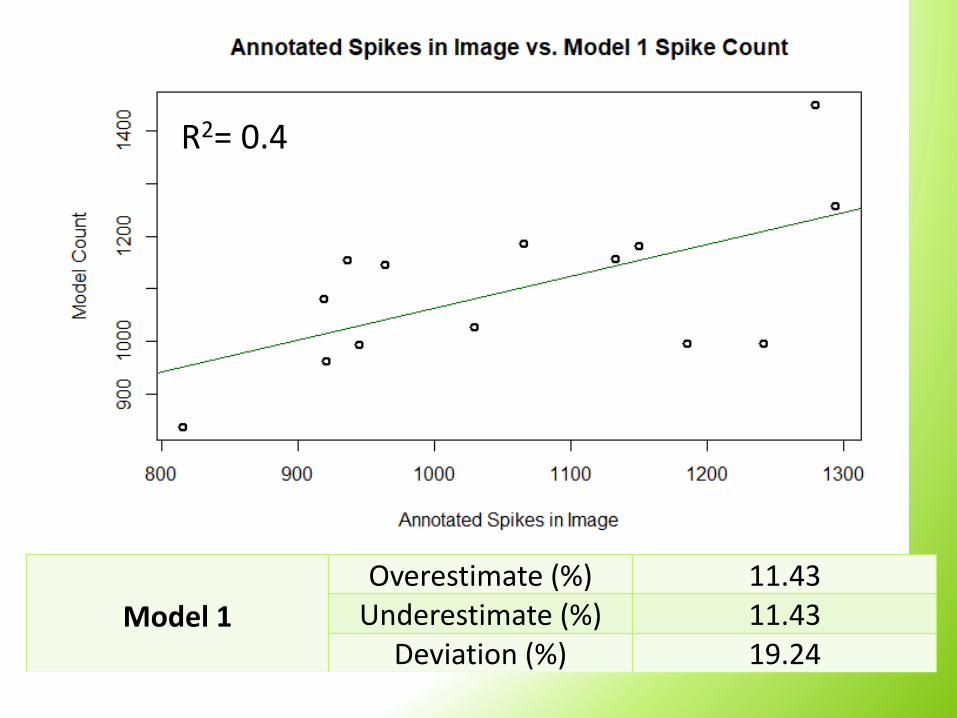
Model 1
Overestimate (%) 11.43Underestimate (%) 11.43
Deviation (%) 19.24
R2= 0.4
• We believe that relationship between identified spikes in the images and the model spike counts will increase with a larger data set and continued adjustments of parameters.
• The non-significant relationship between in-field counts and annotated panicles is due to the large amount of occlusion present. Tillers would have produced spikes that are not visible from the top of the canopy
• Research is continuing in parameter adjustments of both models as well as identifying more suitable image acquisition techniques.
Conclusion

Supervisors: Dr. Steve ShirtliffeDr. Curtis Pozniak
Advisory Committee: Dr. Tim Sharbel (chair)Dr. Mark EramianDr. Rosalind Bueckert
I would also like to acknowledge the Robert P. Knowles Foundation.
Reynolds, M. P. (1996). Increasing yield potential in wheat: breaking the barriers: proceedings of a workshop held in Ciudad Obregón, Sonora, Mexico. CIMMYT.
LeCun, Y., Bengio, Y., & Hinton, G. (2015). Deep learning.nature, 521(7553), 436.
Ubbens, J., Cieslak, M., Prusinkiewicz, P., & Stavness, I. (2018). The use of plant models in deep learning: an application to leaf counting in rosette plants. Plant Methods,14(1), 6.
References