uv-vis spectroscopy - universitas...
TRANSCRIPT

1
UV-VIS Spectroscopy
outline
Background Information • Basics of Ultraviolet Light Absorption• Terminology• Laws of Light Absorption• Measurement of the Spectrum• Presentation of the Spectrum• Solvents for UV/Vis Spectroscopy• UV/Vis Spectroscopy Generalizations

2
Types of Electronic Transitions
• s to s*• p to p*• h to s*• h to p*• Table of Typical Absorptions of Simple
Isolated Chromophores
Empirical Rules for CaluclatingUv/Vis AbsorptionsWoodward-Fieser Rules for Dienes• Woodward's Rules for Conjugated
Carbonyl Compounds• Mono-Substituted Benzene Derivatives• Di-Substituted Benzene Derivatives• Benzoyl Derivatives

3
Problems
• Unknown 1• Unknown 2• Unknown 3• Unknown 4• Unknown 5• Final Note
Basics of UV Light Absorption
Ultraviolet/visible spectroscopy involves the absorption of ultraviolet/visible light by a molecule causing the promotion of an electron from a ground electronic state to an excited electronic state.
• Ultraviolet/Visible light: • wavelengths (l) between 190 and 800 nm

4
• Types of Transitions• There are several types of electronic transitions
available to a molecule including: • s to s* (alkanes) • s to p* (carbonyl compounds) • p to p* (alkenes, carbonyl compounds, alkynes,
azo compounds) • h to s* (oxygen, nitrogen, sulfur, and halogen
compounds) • h to p* (carbonyl compounds)
• Transitions from the highest occupied molecular orbital (HOMO) to the lowest occupied molecular orbital (LUMO) require the least amount of energy and are therefore usually the most important.
• Not all transitions that are possible will be observed. Some electronic transitions are "forbidden" by certain selection rules. However, even forbidden transitions can be observed, but these are usually not very intense.

5
Peak Broadening• UV absorptions are generally broad because vibrational
and rotational levels are "superimposed" on top of the electronic levels.
• Figure 2. Peak broadening.
• For this reason, the wavelength of maximum absorption (lmax) is usually reported.
Terminology • The following definitions are useful in a discussion of
UV/Vis spectroscopy. • chromophore Any group of atoms that absorbs light
whether or not a color is thereby produced. • auxochrome A group which extends the conjugation of
a chromophore by sharing of nonbonding electrons. • bathochromic shift The shift of absorption to a longer
wavelength. • hypsochromic shiftThe shift of absorption to a shorter
wavelength. • hyperchromic effect An increase in absorption
intensity. • hypochromic effect A decrease in absorption intensity.

6
Law of light absorption• Beer-Lambert Law• The ultraviolet spectra of compounds are usually
obtained by passing light of a given wavelength (monochromatic light) through a dilute solution of the substance in a non-absorbing solvent.
• The intensity of the absorption band is measured by the percent of the incident light that passes through the sample:
• % Transmittance = (I / I0) * 100% • where: • I = intensity of transmitted light • I0 = intensity of incident light
• Because light absorption is a function of the concentration of the absorbing molecules, a more precise way of reporting intensity of absorption is by use of the Beer-Lambert Law:
• Absorbance = -log(I / I0) = ecl• where: • e = molar absorptivity• c = molar concentration of solute • l = length of sample cell (cm)

7
Measurement of spectrum• he UV spectrum is usually taken on a very dilute solution (1 mg in
100 ml of solvent). A portion of this solution is transferred to a silica cell. A matched cell containing pure solvent is prepared, and each cell is placed in the appropriate place in the spectrometer. This is so arranged that two equal beams of light are passed, one through the solution of the sample, one through the pure solvent. The intensities of the transmitted light are then compared over the whole wavelength range of the instrument. The spectrum is plotted automatically as a log10(I0/I) ordinate and l abscissa. For publication and comparisons these are often converted to an e vs. l or log(e) vs. l plot. The l unit is almost always in nanometers (nm).
• In general, organic compounds will have molar absorptivities (e) of around 10,000. Therefore, in order to obtain solutions that will have a maximum absorbance of 1, it is most likely that the concentration of the starting solution (the stock) to be 1 x 10⁻⁴ M.
Preparing a sample• Preparing A Sample• The following steps can be followed to produce solutions that will give generally good results in
the UV/Vis experiment. An example for 2-nitroaniline is worked out along the way.• Prepare a concentrated solution that is about 1 x 10⁻³ M. This solution is made concentrated so
that you can weigh out a reasonable amount of material (like 13 mg as opposed to 1.3 mg).
For 2-nitroaniline (MW = 138.13 g/mol), weigh out about 0.0138 g of material. In this example, 0.0132 g were obtained, and diluting this amount of material to 100 mL in water produces a 9.556 x 10⁻⁴ M solution.
• Perform a 10:1 dilution to produce a solution roughly 1 x 10⁻⁴ M. This will be the stock solution.
For 2-nitroaniline, 10 mL of the concentrated solution was transferred to a new 100 mL volumetric flask, and diluted to 100 mL with water.
• Prepare several more solutions that are dilutions of the stock.
For 2-nitroaniline, solutions that are 80%, 60%, 40%, and 20% of the stock concentration are prepared as listed below:

8
• concentrationsolution preparation• 9.556 x 10⁻⁵ Mstock7.654 x 10-5 M20 mL
of stock diluted to 25 mL5.734 x 10-5 M15 mL of stock diluted to 25 mL3.822 x 10-5 M10 mL of stock diluted to 25 mL1.911 x 10-5 M5 mL of stock diluted to 25 mL
http://www.chemistry.ccsu.edu/glagovich/teaching/316/index.html
Presentation of spectrum
The UV/Vis spectrum is plotted automatically as a log10(I0/I) (absorbance) ordinate and l (in nanometers) abscissa. An example spectrum is given below.

9
As you can see from the above spectrum, different concentrations of 2-nitroaniline will give spectra with differing absorbance values. This can make comparing one spectrum of 2-nitroaniline to another spectrum of 2-nitroaniline obtained by someone else difficult. Converting the above plot from an absorbance ordinate to an e ordinate essentially removes concentration dependence from the presentation. The spectrum below illustrates this point. Notice that each spectrum taken at different concentrations are now essentially overlapping each other.
For publication purposes, UV/Vis spectra are often converted to a log(e) vs. l plot. This type of presentation will normalize the absorbance signals so that all are on a similar scale (essentially diminishing intense absorption signals and increasing weak absorption signals).

10
To determine the molar absorptivity (e) for the compound in question, one can produce a Beer's Law plot. This plot shows the linear relationship between absorbance and concentration. The slope of the line is the molar absorptivity.
Choice of solvent• The table below gives a list of common
solvents and the minimum wavelength from which they may be used in a 1 cm cell.
257carbon tetrachloride
237chloroform
220methylenechloride
215ether
204ethanol
201methanol
195hexane
195cyclohexane
191water
190acetonitrile
Minimum Wavelength (nm)Solvent

11
Generalisations• Generalizations Regarding lmax• If the spectrum of a given compound exhibits an absorption band of very low intensity
(e = 10-100) in the 270-350 nm region, and no other absorptions above 200 nm, the compound contains a simple, nonconjugated chromophore containing n electrons. The weak band is due to h to p* transitions.
• If the spectrum of a given compound exhibits many bands, some of which appear even in the visible region, the compound is likely to contain long-chain conjugated or polycyclic aromatic chromophore. If the compound is colored, there may be at least 4 to 5 conjugated chromophores and auxochromes. Exceptions: some nitro-, azo-, diazo-, and nitroso-componds will absorb visible light.
• Generalizations Regarding emax• An e value between 10,000 and 20,000 generally represents a simple a,b-
unsaturated ketone or diene. • Bands with e values between 1,000 and 10,000 normally show the presence of an
aromatic system. Substitution on the aromatic nucleus by a functional group which extends the length of the chromophore may give bands with e > 10,000 along with some which still have e < 10,000.
• Bands with e < 100 represent h to p* transitions.
Type transition
σ to σ*
~ 150alkanes
λmaxChromophore

12
π to π*
~ 188carbonyls
~ 170alkynes
~ 175alkenes
λmaxChromophore
n σ*
~ 195sulfur compounds
~ 195amines
~ 185alcohols, ethers
λmaxChromophore

13
N π*
~ 285carbonyls
λmaxChromophore
<1.0340η to π∗azo<1.0271η to π∗nitro3.0210η to σ∗thiol1.5210η to π∗amide1.5205η to π∗ester1.5205η to π∗acid3.5190η to σ∗amine1.0290η to π∗2.0190π to π∗
aldehyde
1.5280η to π∗3.0180π to π∗
ketone
3.5180η to σ∗ether2.5180η to σ∗alcohol3.0175π to π∗alkene3.0170π to π∗alkyne
<1.0160η to π∗nitrilelog(ε)λmaxTransitionChromophore

14
Empirical Rules for CaluclatingUv/Vis Absorptions
3030-SR6060-NR2
55-Cl, -Br66-OR00-OC(O)CH3
Polar groupings:
55Exocyclic double bond
55Alkyl substituent or ring residue
3030Double bond
extending conjugation
Increments for:
λ=214 nm=217 (acyclic)λ=253 nmParent
Heteroannular(transoid)
Homoannular(cisoid)

15
Example 1:
234 nmObserved:232 nmCalculated:
15 nm3 x 5 =Alkyl groups or ring residues:
217 nmTransoid:
Example 2:
256 nmObserved:263 nmCalculated:10 nm2 x 5 =Alkyl groups or ring residues:
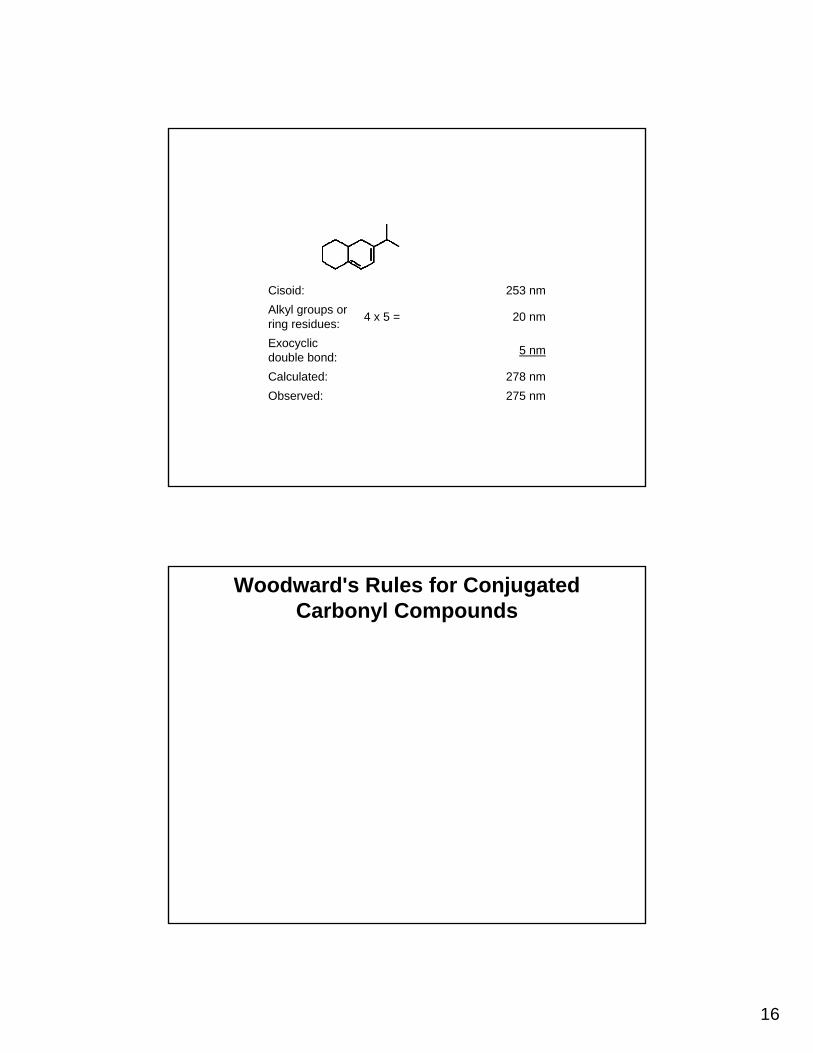
253 nmCisoid:
235 nmObserved:234 nmCalculated:
5 nmExocyclicdouble bond:
15 nm3 x 5 =Alkyl groups or ring residues:
214 nmTransoid:
16
275 nmObserved:278 nmCalculated:
5 nmExocyclicdouble bond:
20 nm4 x 5 =Alkyl groups or ring residues:
253 nmCisoid:
Woodward's Rules for Conjugated Carbonyl Compounds

17
18γ or higher12β
10αAlkyl substituent or ring residue
39Homocyclic diene component
5Endocyclic double bond in a 5- or 7-membered ring for X = OH, OR
5Exocyclic double bond30Double bond extending conjugation
Increments for:λ=195 nmX = OH, ORλ=208 nmX = Hλ=202 nmFive-membered ring parent enone
λ=215 nmSix-membered ring or acyclic parent enone
X = RBase values:
95β-NR2
25α,γ,δ
30β-Br12β,γ,δ
15α-Cl31δ
17γ
30β
35α-OCH3
6α,β,γ,δ-OC(O)CH3
50δ
30β
35α-OHPolar groupings:

18
*Solvent shifts for various solvents:
- 11hexane- 5dioxane- 11cyclohexane- 7ether- 1chloroform+ 8water
λmax shift (nm)Solvent
example
249 nmObserved:249 nmCalculated:
24 nm2 x 12 =β-Alkyl groups or ring residues:
10 nmα-Alkyl groups or ring residues:
215 nmAcyclic enone:

19
226 nmObserved:231 nmCalculated:
5 nmExocyclicdouble bond:
24 nm2 x 12 =β-Alkyl groups or ring residues:
202 nmFive-memberedring parent enone:
300 nmObserved:302 nmCalculated:
18 nmδ-Alkyl groups or ring residues:
39 nmHomocyclicdienecomponent:
30 nmExtended conjugation:
215 nmSix-memberedring or alicyclicparent enone:

20
251 nmObserved:256 nmCalculated:
5 nmExocyclicdouble bond:
24 nm2 x 12 =β-Alkyl groups or ring residues:
25 nmα-Br:
202 nmFive-memberedring parent enone:
217 nmObserved:217 nmCalculated:
12 nmβ-Alkyl groups or ring residues:
10 nmα-Alkyl groups or ring residues:
195 nmCarboxylic acid:

21
222 nmObserved:222 nmCalculated:
5 nm
Endocyclicdouble bond in 7-membered ring:
12 nmβ-Alkyl groups or ring residues:
10 nmα-Alkyl groups or ring residues:
195 nmEster:
242 nmObserved:242 nmCalculated:
24 nm2 x 12 =β-Alkyl groups or ring residues:
10 nmα-Alkyl groups or ring residues:
208 nmAldehyde:

22
302 nmObserved:304 nmCalculated:
18 nmδ-Alkyl groups or ring residues:
10 nmα-Alkyl groups or ring residues:
39 nmHomodienecomponent:
30 nmExtended conjugation:
208 nmAldehyde:
Absorption for Mono-Substituted Benzene Derivatives
Absorption for Mono-Substituted Benzene Derivatives

23
254203-NH3+
258207-I257210-Br257210-Cl254204-F
Electronic Withdrawing Substituents280230-NH2
269217-OR270211-OH262208189-R254204184none
Electronic Donating Substituents(ε~50)(ε~300)(ε~10000)(ε>30000)
RBKESubstituent
330280252-NO2
271224-CN
272226-CO2H
320276238-C(O)R
328280242-CHO
250-C6H5
278248202-CCH
282248-C=CH2
π-Conjugating Substituents

24
25000280para-Ph-Ph44000251meta-Ph-Ph
160003755000229para-NO2-NH2
14800277para-CHO-OR27002935100225para-OH-OH150037316000235meta-NO2-NH2
28003148300252meta-CHO-OR2200277meta-OH-OH
500027516000229ortho-NO2-NH2
400031911000253ortho-CHO-OR26302786000214ortho-OH-OHεmaxλmaxεmaxλmax
BKOrientationR'R
• In disubstituted benzenes, two situations are important: • When electronically complementary groups, such as amines and nitro, are situated
para to each other, there is a pronounced shift to longer wavelength in the main absorption band.
• Alternatively, when two groups are situated ortho or meta to each other or when the para disposed groups are not electronically complementary, then the observed spectrum is usually closer to that of the separate, noninteracting chromophores.

25
Benzoyl derivative
85p
20o,m-N(CH3)2
73p-NHCH3
45p
20o,m-NHC(O)CH3
58p
13o,m-NH2
15p
2o,m-Br
10p
0o,m-Cl
20p
11o,m-O-
25p
7o,m-OH, -OR
10p
3o,m-Alkyl or ring residue
Increment for each substituent:
λ = 230 nmR = OH, OR
λ = 250 nmR = H
λ = 246 nmR = alkyl or ring residue
Base values:

26
253 nmObserved:251 nmCalculated:
2 nmm-Br:3 nmo-Ring residue:
246 nmParent chromophore:
270 nmObserved:269 nmCalculated:14 nm2 x 7 =m-OH:25 nmp-OH:
230 nmParent chromophore:

27
Which of the following isomers has the following spectral data? IR: 3090, 2920, 1622, 1460, 1405, 1369, 705 cm-1.
UV/Vis: lmax=235 nm (emax=9500)
Which of the following isomers has the following spectral data? IR: 3079, 2950, 1625, 1470, 1405, 1100, 810, 715 cm-1.
UV/Vis: lmax=268 nm (emax=11000)

28
What is the structure of the compound having the following spectral data? MS: M+=96
IR: 3095, 2925, 2840, 2760, 1704, 1605, 825 cm-1. UV/Vis: lmax=231 nm (emax=18000)
What is the structure of the compound having the following spectral data? MS: M+=96
IR: 3072, 2950, 1715, 1460, 1372, 1220, 702 cm-1. UV/Vis: lmax=226 nm (emax=18000)
What is the structure of the compound having the following spectral data? Formula: C8H9NO2
IR: 3430, 3027, 2922, 1720, 1345, 1243, 840 cm-1. UV/Vis: lmax=303 nm (emax=1200)
• It is often difficult to extract a great deal of information from a UV spectrum used by itself. It should be clear by now that a UV spectrum is most useful when at least a general idea of the structure is already known; in this way, the various empirical rules can be applied. Nevertheless, several generalizations can serve to guide our use of UV data. These generalizations are a good deal more meaningful when combined with infrared and NMR data - which can, for instance, definitely identify carbonyl groups, double bonds, aromatic systems, nitro groups, nitriles, enones, and other important chromophores. In the absence of infrared or NMR data, the following observations should be taken only as guidelines.

29
A single band of low to medium intensity (e = 100 to 10,000) at wavelengths less than 220 nm usually indicates an h to s* transition. Amines, alcohols, ethers, and thiols are possibilities, provided that the nonbonded electrons are not included in a conjugated system. An exception to this generalization is that the h to p* transition of cyanogroups appears in this region. However, this is a weak transition (e < 100), and the cyano group is easily identified in the infrared. Do not neglect to look for N-H, O-H, C-O, and S-H bands in the infrared spectrum.
• A single band of low intensity (e = 10 to 100) in the region 250 to 360 nm, with no major absorption at shorter wavelengths (200 to 250 nm), usually indicates an h to p* transition. Since the absorption does not occur at long wavelength, a simple, or unconjugated, chromophore is indicated, generally one which contains an O, N, or S atom. Examples of this may include C=O, C=N, N=N, -NO2, -CO2R, -CO2H, or -CONH2. Once again, infrared and NMR spectra should help a great deal.
• Two bands of medium intensity (e = 1,000 to 10,000), both with lmax above 200 nm, generally indicate the presence of an aromatic system. If an aromatic system is present, there may be a good deal of fine structure in the longer-wavelength band (in nonpolar solvents only). Substitution on the aromatic rings increases the molar absorptivity above 10,000, particularly if the substituent increases the length of the conjugated system.
• In polynuclear aromatic substances, a third band appears near 200 nm, a band which in simpler aromatics occurs below 200 nm, where it cannot be observed. Most polynuclear aromatics (and heterocyclic compounds) have very characteristic intensity and band-shape (fine-structure) patterns, and they may often be identified via comparison to spectra which are available in the literature.

30
• Bands of high intensity (e = 10,000 to 20,000) which appear above 210 nm generally represent either an a,b-unsaturated ketone (check the infrared spectrum), a diene, or a polyene. The greater the length of the conjugated system, the longer the observed wavelength. For dienes, the lmax may be calculated using the Woodward-FieserRules.
• Simple ketones, acids, esters, amides, and other compounds containing both p systems and unshared electron pairs show two absorptions: an h to p* transition at longer wavelengths (>300 nm, low intensity) and a p to p* transition at shorter wavelengths (<250 nm, high intensity). With conjugation (enones), the lmax of the p to p* band moves to longer wavelengths and can be predicted by Woodward's Rules. The e value usually rises above 10,000 with conjugation, and, as it is very intense, it may obscure or bury the weaker h to p* transition. For a,b-unsaturated esters and acids, Nielsen's Rules may be used to predict the position of lmax with increasing conjugation and substitution.
• Compounds which are highly colored (have absorption in the visible region) are likely to contain a long-chain conjugated system or a polycyclic aromatic chromophore. Benzenoid compounds may be colored if they have enough conjugating substituents. For nonaromatic systems, usually a minimum of four to five conjugated chromophores are required to produce absorption in the visible region. However, some simple nitro, azo, nitroso, a-diketo, polybromo, and polyiodo compounds may also exhibit color, as may many compounds with quinoid structures.