uva-dare (digital academic repository) experimenting ... · op vrijdag 23 november 2018, te 13.00...
TRANSCRIPT

UvA-DARE is a service provided by the library of the University of Amsterdam (http://dare.uva.nl)
UvA-DARE (Digital Academic Repository)
Experimenting mattersKruit, P.M.
Link to publication
Citation for published version (APA):Kruit, P. M. (2018). Experimenting matters: Learning and assessing science skills in primary education
General rightsIt is not permitted to download or to forward/distribute the text or part of it without the consent of the author(s) and/or copyright holder(s),other than for strictly personal, individual use, unless the work is under an open content license (like Creative Commons).
Disclaimer/Complaints regulationsIf you believe that digital publication of certain material infringes any of your rights or (privacy) interests, please let the Library know, statingyour reasons. In case of a legitimate complaint, the Library will make the material inaccessible and/or remove it from the website. Please Askthe Library: http://uba.uva.nl/en/contact, or a letter to: Library of the University of Amsterdam, Secretariat, Singel 425, 1012 WP Amsterdam,The Netherlands. You will be contacted as soon as possible.
Download date: 26 Feb 2019

EXPERIMENTING MATTERS LEARNING AND ASSESSING SCIENCE SKILLS IN PRIMARY EDUCATION
Patricia Kruit
This dissertation aims to investigate the effectiveness of
instruction methods on students’ science skills in grades 5 and 6 of primary education in
the Netherlands.
To assess the effects, measurement instruments
for evaluating the acquisition of science skills have been
developed.
So, this research provides a
strong argument for including an explicit teaching method for developing science
skills in primary education.
Results indicate that explicit instruction
on science skills is necessary for more
robust acquisition of these skills.
Findings show that science lessons can improve
skills when carefully structured and set up with opportunities to practice skills in scientific inquiry
tasks.
openb
are
ver
dedi
gin
g
door Pat
rici
a Kr
uit
van h
aar pro
efsc
hri
ft
EXPER
IME
NTIN
G MA
TTE
RS
vrijdag
23novem
ber
201
8 13
:00
Aula-
Oude
Luth
ers
e ke
rk
Unive
rsi
teit
van
Am
ster
dam
Singe
l 4
11
Amste
rda
m
aansl
uit
end
een
rec
epti
eop de
zel
fde
loca
tie
`s av
ond
s fe
est!
20:00
Hortu
s B
otan
icus
Plant
age
Mid
denl
aan
2A
Amste
rda
m
vrage
n:
p.m.k
rui
t@hv
a.nl

EXPERIMENTING MATTERS
LEARNING AND ASSESSING SCIENCE SKILLS IN PRIMARY EDUCATION
Patricia Mariam Kruit

The research presented in chapter 3 in this thesis was also supported by a grant
from the National Platform Science & Technology [Stichting Platform Bètatechniek]
in the context of a Call for Proposals Science Skills (2015).
artwork: Adrian Kruit
cover and lay out: Arnold Koopman
printed by: GildePrint
published by: Kenniscentrum Faculteit Onderwijs en Opvoeding HvA
ISBN: 978-94-92497-04-8

EXPERIMENTING MATTERS LEARNING AND ASSESSING SCIENCE SKILLS IN PRIMARY EDUCATION
ACADEMISCH PROEFSCHRIFT
ter verkrijging van de graad van doctor
aan de Universiteit van Amsterdam
op gezag van de Rector Magnificus
prof. dr. ir. K.I.J. Maex
ten overstaan van een door het College voor Promoties ingestelde
commissie, in het openbaar te verdedigen in de Aula der Universiteit
op vrijdag 23 november 2018, te 13.00 uur
door Patricia Mariam Kruit
geboren te Palmerston-North, Nieuw-Zeeland

Promotiecommissie
promotor: prof. dr. R.J. Oostdam Universiteit van Amsterdam
copromotores: dr. E. van den Berg Vrije Universiteit Amsterdam
dr. J.A. Schuitema Universiteit van Amsterdam
overige leden: prof. dr. R.G. Fukkink Universiteit van Amsterdam
prof. dr. Ir. F.J.J.M. Janssen Universiteit Leiden
prof. dr. A.W. Lazonder Radboud Universiteit Nijmegen
prof. dr. M.E.J. Raijmakers Universiteit van Amsterdam
prof. dr. J.M. Voogt Universiteit van Amsterdam
faculteit: Faculteit der Maatschappij- en Gedragswetenschappen

voor mama


CONTENTS
1 GENERAL INTRODUCTION 1
2 AN INSTRUCTIONAL FRAMEWORK FOR TEACHING SCIENCE SKILLS
IN PRIMARY SCIENCE EDUCATION 11
3 ASSESSING STUDENTS’ ABILITY IN PERFORMING SCIENTIFIC INQUIRY:
INSTRUMENTS FOR MEASURING SCIENCE SKILLS IN PRIMARY EDUCATION 31
4 EFFECTS OF EXPLICIT INSTRUCTION ON THE ACQUISITION OF STUDENTS’
SCIENCE INQUIRY SKILLS IN GRADES 5 AND 6 OF PRIMARY EDUCATION 61
5 PERFORMANCE ASSESSMENT AS A DIAGNOSTIC TOOL FOR SCIENCE TEACHERS 89
6 SUMMARY AND GENERAL DISCUSSION 115
APPENDICES 137
REFERENCES 155
CHAPTERS IN THIS THESIS AND CONTRIBUTIONS OF CO-AUTHORS 165
SAMENVATTING 167
DANKWOORD 175


1
1
general introduction

2
Science and technology have been given a prominent position in primary education
curricula in most countries. The aim of education policies (cf. OECD, 2015) is to strengthen
innovation by improving science education and attracting more people to science,
technology, engineering and mathematics (STEM). Since the 1960s, there has been an
increasing emphasis on the acquisition of science skills, which can be described as the skills
involved in generating and validating knowledge through scientific investigations. This
coincided with the growing interest for active learning in schools. Excitement about
conducting experiments and figuring out things was considered a necessity for realizing
active learning and creating a positive attitude towards science and technology. Results of
educational research progressively led to the understanding that, aside from achieving a
positive attitude and acquiring content knowledge, learning science skills is an important
objective in primary science education. This development is reflected in contemporary
frameworks for science education (Dillon & Manning, 2010; National Research Council
(NRC), 2012). Nowadays, the main goal of science education is for students to become
scientifically literate citizens, defined by the Organization for Economic Cooperation and
Development (OECD), 2013) as:
An individual’s scientific knowledge and use of that knowledge to identify
questions, to acquire new knowledge, to explain scientific phenomena, and to
draw evidence-based conclusions about science-related issues, understanding of
the characteristic features of science as a form of human knowledge and
enquiry, awareness of how science and technology shape our material,
intellectual, and cultural environments, and willingness to engage in science-
related issues, and with the ideas of science, as a reflective citizen. (p. 17)
The OECD’s definition implies that attitude, content and science skills need to be addressed
in science education. Students must understand the necessary science concepts in order to
explain phenomena and technology in their environment and develop content knowledge
related to issues such as health, nutrition, environment and sustainability. More generally,
students must appreciate science and understand its essential role in society. Additionally,
they need to have an understanding of the nature of science through experiencing how
knowledge is generated, improved and validated through scientific inquiry.

Chapter 1: general introduction
3
Development of science skills for scientific inquiry is therefore explicitly included as a
learning objective in primary science education. In general, the science skills - also referred
to with terms such as “inquiry skills”, “science process skills”, or “investigation skills” - are
defined based on the activities in which scientists engage during authentic research
(Lederman & Lederman, 2014). In the framework for K-12 science education in the U.S. for
instance, scientific inquiry is represented by three domains of activities: investigating,
developing explanations and solutions, and evaluating data as evidence for the proposed
theories and models (NRC, 2012). The NRC emphasizes that students should learn about
what scientists do while they design and carry out their own inquiries.
From this rationale, not only in the U.S. but also in European countries and Australia,
educational documents and curricula have included learning goals related to conducting
authentic scientific investigations (ACARA, 2010; Crawford, 2014). For instance, in the
National Primary Curriculum for England, the goals aimed at learning to perform a scientific
inquiry include “practical scientific methods, processes and skills” (Department for
Education, 2013, p. 166). In the Next Generation Science Standards (NGSS) which are based
on the framework for K-12 science education (NRC, 2012), the goals are described in the
form of expectations for what students should know and be able to do (NGSS Lead States,
2013). The K-12 Framework and the NGSS refer to the elements addressing scientific
investigation with the term “practices”. Practices are a reflection of the work and thinking
of scientists as they “investigate and build models and theories about the natural world”
(www.nextgenscience.org/three-dimensions). The term practices is used instead of skills to
emphasize that “engaging in scientific investigation requires not only skills but also
knowledge that is specific to each practice” (NRC, 2012, p. 30).
However, a large gap exists between what is specified in the goals of educational
frameworks and the actual practice with regard to implementing science activities in
primary schools. In many countries, little time is spent on science in classrooms due to the
higher priority given to mathematics and language subjects. Even if science is taught, it is
generally of low quality. The focus is on hands-on inquiry activities without paying much
attention to relating the activities to scientific thinking (Roth, 2014). It is problematic that
educators and teachers focus mostly on the practical aspects of scientific inquiry, such as
observing, measuring, recording data, and handling equipment (Osborne, 2014). This
limited operationalization of science skills neglects the teaching and practice of other
important cognitive aspects involved in scientific investigation. For instance, using the skills
in a scientific inquiry in particular demands self-regulation and the knowledge and use of
metacognitive strategies (Zohar & Barzilai, 2013). Students need to acquire metacognitive
skills in order to understand, monitor and evaluate their own higher-order reasoning and

4
thus stimulate scientific thinking (Kuhn, 1989). When designing effective teaching
materials, it is important to define science skills by identifying the cognitive demands
underlying these skills.
There is still an ongoing discussion regarding how science skills are most effectively
taught in primary education. It is often so that inquiry is also presented as an instructional
approach, aimed at learning science concepts as well as acquiring skills. As a result, the
goals and the means to attain these goals are conflated. It is important to distinguish
between learning to conduct a scientific inquiry and inquiry-based learning (IBL). In the
former, learning to conduct an inquiry is the educational goal. In the latter, IBL is a teaching
method in which science skills are prerequisites or are assumed to be acquired along the
way. Using inquiry as an instructional method to teach science does not necessarily mean
that students will learn the skills to perform these inquiries simply by doing it. Although
there is evidence pointing to the acquisition of skills through learning by doing (Dean &
Kuhn, 2007), a growing number of studies indicates that explicit instruction may be
necessary to develop inquiry skills (Klahr & Nigam, 2004; Lazonder & Harmsen, 2016; Toth,
Klahr, & Chen, 2000). Due to their lack of experience and limited mastery of strategies, skills
and knowledge, students in primary education need support and scaffolding to effectively
conduct a scientific inquiry. It may be that explicit skill instruction will lead to more
effective performance of scientific inquiry (Klahr & Nigam, 2004; Kirschner, Sweller, & Clark,
2006).
In this thesis, the focus of the research is on the acquisition of science skills by using
explicit instruction. To our knowledge, few studies have investigated science skills
acquisition by comparing explicit instruction with a teaching approach in which the aspects
of explicit instruction are absent. In this research project, these instructional approaches
are compared. In addition, several studies have investigated the effects of explicit
instruction on skill development in a laboratory-based setting, in particular on the strategy
of controlling variables (CVS). To attain higher ecological validity, the present research has
been conducted in real-life physical classrooms.
With the increased attention toward the implementation of inquiry activities within
primary science classrooms, a growing interest has emerged in assessing students’ science
skills. Research has been concerned with the limitations and advantages of different test
formats. Most tests are paper-and-pencil formats consisting of multiple-choice items. These
tests are easy to administer and score, and students are familiar with the format (Harlen,
1991). However, a disadvantage of paper-and-pencil tests is that they generally do not
reflect the activities of a real-life scientific inquiry (Davey et al., 2015). In line with an
increased understanding of how students learn, performance assessments have been

Chapter 1: general introduction
5
considered as an alternative. With performance assessments, students execute small
experiments which reflect the conditions under which scientists’ work and solve problems
(Shavelson, Solano-Flores, & Ruiz-Primo, 1998). While performance assessments are
considered more authentic (Davey et al., 2015; Ennis, 1993) they are also more cost and
labor-intensive to administer and due to the open format, reliable rating is complicated
(Davey et al., 2015).
Of major concern is the lack of convergence between different test formats (Baxter,
Shavelson, Goldman, & Pine, 1992; Baxter & Shavelson, 1994; Hammann, Phan, Ehmer, &
Grimm, 2008; Lawrenz, Huffman, & Welch, 2001; Roberts & Gott, 2006) and between tests
with similar formats intended to measure the same science skills (Gott & Duggan, 2002;
Pine et al., 2006). The small correlations that were found between tests have been
attributed to differences in students’ content knowledge (Gott & Duggan, 2002; Shavelson,
Baxter, & Pine, 1991), but also to inconsistencies in rating and occasion sampling variability.
Occasion sampling variability occurs when students perform the same task differently on
different occasions (Ruiz-Primo, Baxter, & Shavelson, 1993). These findings imply that
underlying cognitive demands may not be equally evoked (Messick, 1994; Millar & Driver,
1987; Shavelson et al., 1991). In this thesis, we will add to the current understanding by
designing and discussing the validity and reliability of different assessment instruments.
Unlike in previous research, assessments instruments will be designed by taking into
consideration underlying cognitive demands.
Another important matter regarding the assessment of science skills is the usage of
tests in science classrooms. Most of the assessments that are administered in science
classrooms are routinely used written tests for summative evaluation of students’ progress
(Black & Atkin, 2014). Teachers spend a considerable amount of time with summative
assessments but fail to implement formative assessments which could have been used to
guide their instruction and to improve students’ learning. In particular, the use of
performance assessments may be beneficial for formative evaluation of students’ science
skills. By structuring performance assessments according to the various steps involved in
regular scientific experiments, opportunities can be created to provide teachers with
diagnostic information. This diagnostic information is not only important for teachers to
improve their teaching but also to provide (individual) students with adequate feedback.
In the 80s, performance assessments were implemented with the purpose of
obtaining information on students’ performance, such as in the Assessment of Performance
Unit (APU). In the STAR (Science Teachers’ Action Research) project, the aim was to improve
practice in science education at the primary school level (Schilling, Hargreaves, Harlen, &
Russell, 1990). Particular attention was given to students’ performance during practical

6
activities. Here, teachers carried out systematic observations to yield information on
students’ achievement. In a study by Aschbacher and Alonzo (2006), a performance
assessment was used to investigate how teachers use the students’ science notebooks and
how teachers’ feedback and guidance in the classroom was improved by professional
development. The present thesis will add to these findings by highlighting aspects of
performance assessments which are particularly valuable for improving science teaching
practice. As argued by Davey et al. (2015), instruction and assessment are equally important
in students’ learning.
The present thesis
The aim of the present research project is to seek ways to improve both teaching and
assessment instruments in primary science education. It starts with a definition of science
skills in which the various cognitive demands are taken into account. By adding to the
existing body of knowledge relating to the learning, teaching and assessing of science
skills, the present thesis may shed light on more effective teaching and assessments
methods, thus strengthening students’ scientific literacy. Accordingly, instructional
methods were examined which may facilitate the acquisition of science skills for grades 5
and 6 primary school students. Assessment instruments were developed to measure
students’ acquisition of science skills. The following overall research questions were
addressed:
1. What are science skills and how can they be operationalized?
2. What are crucial components of an instructional design for teaching science skills?
3. How can students’ ability in performing scientific inquiry be validly and reliably
measured?
4. What are the effects of explicit instruction on students’ acquisition of skills in
scientific inquiry?
5. What is the added value of performance assessments as a diagnostic tool to guide
instruction in science classroom practice?
The Dutch context
The research of the present thesis was carried out in the Netherlands. Primary education
includes two years of kindergarten starting from the age of 4 and the following six years of
formal education from grade 1 (age 6) through 6 (age 12). In the Netherlands, science &
technology is part of the curriculum domain called world orientation. World orientation

Chapter 1: general introduction
7
includes geography, history, and science & technology (Inspectorate of Education, 2015).
Science & technology aims at developing a positive attitude towards conducting inquiry as
well as developing science skills, content knowledge and knowledge about the nature of
science. In particular, a learning objective in the Dutch primary curriculum is to develop the
skills to perform a scientific inquiry on a variety of natural phenomena. However, the Royal
Netherlands Academy of Arts and Sciences, an advisory body to the Dutch Government,
expressed great concerns about the decreasing amount of time spent on science &
technology in primary schools as well as the students’ decreasing performance.
Furthermore, a mere 16% of the schools monitor the students’ performance of skills
associated with performing a scientific inquiry in the context of science & technology
(Inspectorate of education, 2015). The ministry of Education, Culture and Science has
announced their aim to stimulate the implementation of science & technology in 2020 in all
primary schools (van Graft, Klein Tank, & Beker, 2014).
The outline of this thesis
This thesis consists of six chapters of which four chapters are research articles. The research
articles have either been published in an international journal (chapters 3, 4 and 5) or have
been submitted for publication (chapter 2). Writing a thesis in articles has both advantages
and disadvantages. One advantage is that each chapter can be read separately. A
disadvantage is that there can sometimes be overlap between chapters and that the term
consistency may not always be optimal.
In chapter 2, we present a study in which an instructional design for teaching science
skills is discussed in order to answer research questions 1 and 2. The design is based on the
categorization of science skills into three types of cognitive skills: thinking skills,
metacognitive skills and science-specific skills. It is argued that systematically incorporating
explicit instruction and practice of the separate skills will support students more
adequately in their acquisition of science skills. An outline of an instructional framework
with a detailed lesson example is provided and discussed.
Chapter 3 addresses the third research question. This chapter focuses on measuring
the progress in the acquisition of science skills. For this purpose, different instruments
were constructed including a paper-and-pencil test, three performance assessments and
two metacognitive self-report tests. The results of 128 5th and 6th grade students were
used to discuss the validity and reliability of these tests.
In chapter 4, the fourth research question is addressed. We discuss an intervention
study that examined the effects of explicit instruction on the acquisition of inquiry skills.

8
The intervention and the design of the study were based on insights discussed in chapter 2.
The effects of the intervention were measured using the instruments examined in chapter
3. The effects of the explicit instruction intervention were compared to conditions in which
students either followed their regular science curriculum or received instruction based on
learning by doing. Multi-level analysis was applied to examine effects of both instructional
methods.
Chapter 5 provides a closer look at the results of the performance assessments in
order to gain insight into students’ answers. The study was aimed at discussing the value of
performance assessments as an educational tool for formative assessment of science skills
in the classroom.
Finally, in chapter 6 we discuss the findings of the different studies. Limitations and
suggestions for future research are offered and implications for educational practice are
considered.

Chapter 1: general introduction
9

10

11
2
an instructional framework
for teaching science skills
in primary science education
12
ABSTRACT
The purpose of the study is to develop and discuss an instructional framework for teaching
science skills in primary education. Science skills are usually - if at all - taught by
instructional methods primarily based on learning by doing despite evidence suggesting
that more explicit teaching methods and strategies may be more effective. Most teachers
focus on only the practical aspects of scientific inquiry which results in a disregard of a wide
variety of cognitive abilities called upon in scientific investigations. For this reason, science
skills were defined based on the different cognitive demands which underlie a scientific
inquiry: science-specific skills, thinking skills and metacognitive skills. Due to their lack of
experience and limited mastery of strategies, skills and knowledge, students in primary
education need support and scaffolding to effectively conduct a scientific inquiry. An
instructional framework was developed based on the four-component instructional design
model of Van Merriënboer, Jelsma, and Paas (1992). Accordingly, the lessons included
whole learning tasks and part-task practice to enhance integrated application of skills. It
was demonstrated how to design a high quality explicit instruction for primary school in
which not only the practical but also the cognitive part of scientific inquiry is emphasized.
The demonstration included a description of the form and the content of the lesson design
informed by the literature and a detailed example lesson. Categorizing the general concept
of science skills in thinking skills, metacognitive skills and science-specific skills provided
the opportunity for designing and constructing teaching materials in a systematic way.
Based on
Kruit, P. M., Oostdam, R. J., van den Berg, E., & Schuitema, J. A. (submitted). An instructional
framework for teaching science skills in primary science education.

Chapter 2: an instructional framework for teaching science skills in primary science education
13
2.1 Introduction
In most countries, science and technology have been given a prominent position in primary
education curricula. Since the 1960s, there has been an increasing emphasis on the
acquisition of science skills - the skills involved in generating and validating knowledge
through scientific investigations - which coincided with the growing interest for active
learning in schools. Excitement about doing experiments and figuring out things was
considered a necessity for realizing active learning and creating a positive attitude towards
science and technology. Results of educational research progressively led to the
understanding that, aside from achieving a positive attitude and acquiring content
knowledge, learning science skills is an important objective in primary science education.
This development is reflected in contemporary frameworks for science education (Dillon &
Manning, 2010; National Research Council (NRC), 2012). Nowadays, the main goal of science
education is for students to become scientifically literate citizens, defined by the
Organization for Economic Cooperation and Development (OECD), 2013) as:
An individual’s scientific knowledge and use of that knowledge to identify questions, to
acquire new knowledge, to explain scientific phenomena, and to draw evidence-based
conclusions about science-related issues, understanding of the characteristic features of
science as a form of human knowledge and enquiry, awareness of how science and
technology shape our material, intellectual, and cultural environments, and willingness to
engage in science-related issues, and with the ideas of science, as a reflective citizen. (p. 17)
The definition of the OECD implies that attitude, content and science skills need to be
addressed in science education. Students must understand science concepts which are
necessary in order to explain phenomena and technology in their environment and develop
content knowledge related to issues such as health, nutrition, environment and
sustainability. Additionally, they need to have an understanding of the nature of science
through experiencing how knowledge is generated, improved and validated through
scientific inquiry. More generally, students have to appreciate science and understand its
essential role in society.
In recent policy and curriculum documents, the narrow emphasis on attitude and
content knowledge has shifted to a more balanced concept of science education in which
knowledge about scientific methods, attitude, content knowledge and science skills are
equally important (European Commission, 2007; Next Generation Science Standards (NGSS)

14
Lead States, 2013; Department for Education, 2013; OECD, 2013). Therefore, curricula in
most countries describe the learning objectives for science education not only in terms of
acquiring content knowledge but elaborately for science skills as well.
Science skills are usually - if at all - taught by instructional methods primarily based
on learning by doing (Duschl, 2008; Roth, 2014). In the Netherlands for instance, inquiry-
based learning is advocated in primary education as the preferred method for acquiring
content knowledge, science skills and epistemic knowledge (van Graft & Kemmers, 2007).
The assumption underlying inquiry-based learning is that students learn science the same
way scientists work. However, as remarked by Kirschner, Sweller and Clark (2006) “The
practice of a profession is not the same as learning to practice the profession” (p. 83).
Recent research suggests that different instructional methods and strategies may be more
effective and that science skills need to be taught in a more systematic and explicit manner
(Klahr & Nigam, 2004; Lazonder & Harmsen, 2016).
Furthermore, Osborne (2014) argues that it is problematic that educators and
teachers mostly focus on only the practical aspects of scientific inquiry (e.g., observing,
measuring, recording data, handling equipment), which applies to both primary (Roth,
2014) and secondary education (Osborne, 2014). This limited operationalization of science
skills results in ignoring the wide variety of cognitive abilities called upon in scientific
investigations. For instance, handling a microscope taps into other abilities than identifying
patterns in data. Because of this, science lessons frequently contain activities in which
predominantly the practical side of inquiry is emphasized. For designing effective teaching
materials, it is important to define science skills by identifying the cognitive demands
underlying these skills and to teach these skills in an explicit and systematic manner.
The aim of this study is to illustrate in what way structured lessons can be designed
when taking into account the various cognitive demands and how the various skills can be
taught. For this reason, an instructional framework was designed for developing primary
students’ science skills of which the general concept of science skills is categorized by the
underlying cognitive demands.
In the following sections, the theoretical background of the instructional framework
for designing science lessons for primary education is discussed. First of all, a further
operationalization of science skills is specified and a distinction is made in thinking skills,
metacognitive skills and science-specific skills. In addition, recent theoretical and empirical
research on students’ learning of science skills is explored to substantiate the instructional
framework. Finally, the framework is illustrated by way of describing one particular lesson
out of the total of eight lessons designed for the purpose of an effect study with a pretest-
posttest design.

Chapter 2: an instructional framework for teaching science skills in primary science education
15
2.2 Defining and learning science skills
Science skills - also referred to with terms such as “inquiry skills”, “process skills” or
“investigation skills” (Harlen & Qualter, 2009) - usually indicate a wide variety of activities
related to planning and conducting investigations and interpreting results (Alonzo &
Aschbacher, 2004; Gott & Duggan, 1995; Harlen & Qualter, 2009). Abrahams and Reiss
(2015) additionally make a distinction between skills such as planning, predicting, and
experimenting, as opposed to practical skills which are more specific such as handling a
microscope.
Science skills are generally defined based on the activities scientists engage in
during authentic research (Lederman & Lederman, 2014). In the framework for K-12 science
education, scientific inquiry is represented by three domains of activities: investigating,
developing explanations and solutions, and evaluating data as evidence for the proposed
theories and models (NRC, 2012). The model reflects the notion that research is not a linear
process consisting of fixed steps but that instead scientists go back and forth between the
“three spheres of activity” (p. 44).
Science skills and cognitive demands
Current literature generally encourages the consideration of skill categories in scientific
inquiry (Duschl, Schweingruber, & Shouse, 2007; Schraw, Crippen, & Hartley, 2006) because
it is important to identify and define accurately the cognitive demands underlying the
inquiry activities for teaching science skills. In general, the broad concept of science skills
can be further categorized in science-specific skills, thinking skills and metacognitive skills.
Science-specific skills refer to the ability to apply procedural and declarative
knowledge for correctly setting up and conducting a scientific experiment (Gott & Murphy,
1987). These skills can be classified as lower order thinking (Newmann, 1990), or
reproductive thinking (Maier cited in Lewis & Smith, 1993), and are characterized by recall
of knowledge, comprehension, routine rule using and simple application (Goodson, 2000).
Students performing a scientific inquiry have to recall the facts and rules about how to
conduct scientific experiments, such as identifying and controlling variables, observing and
measuring, using simple measurement devices. They then have to use and apply the
knowledge for, for example, selecting the appropriate procedures and organizing the data
in tables (Gott & Murphy, 1987; OECD, 2017). Science-specific inquiry skills defined as such

16
encompass the practical skills as discussed by Abrahams and Reiss (2015), but pertain to
cognitive processes as well.
In addition to science-specific skills, students use more general thinking skills to make
sense of the data and connect the observations to scientific theories (Osborne, 2015).
Thinking skills include the higher order thinking skills, also frequently referred to as critical
thinking (Moseley et al., 2005). Often a distinction is being made between the philosophical
interpretation of critical thinking (evaluating statements and judging), and the
interpretation made by psychologists who emphasize the problem-solving aspect. The
latter approach is more commonly utilized in scientific inquiry (Lewis & Smith, 1993).
Thinking skills involve manipulating information that is in nature complex because it
consists of more than one element and has a high level of abstraction (Flavell, Miller, &
Miller, 1993). Application of thinking skills involves interpreting, analyzing, evaluating,
classifying and inferring information (Moseley et al., 2005; Newmann, 1990). In
correspondence with Bloom’s taxonomy, thinking skills are considered to have higher levels
of complexity such as analyzing and synthesizing (Bloom, 1956). Many are abundantly
applied in scientific investigations. For example, when making appropriate inferences from
different sources of data (Pintrich, 2002) or identifying features and patterns in data,
thinking skills will predominantly underlie these particular parts of a scientific inquiry.
Zohar and Dori (2003) even argue that science skills - such as formulating hypotheses or
drawing conclusion - can be classified as higher order thinking skills since they share the
same characteristics.
Finally, metacognitive skills are in general considered a particular type of higher
order thinking skill (see for discussion Lewis & Smith, 1993). Metacognitive skills can be
distinguished from general thinking skills in that metacognitive skills involve active
executive control of the mental processes (Goodson, 2000) or “thinking about thinking”
(Kuhn, 1999; Kuhn & Dean, 2004, p. 270). In this study, metacognitive skills refer to self-
regulatory skills and include planning, monitoring and evaluating task performance (Flavell,
et al., 1993; Pintrich, 2002; Schraw & Moshman, 1995).
Planning refers to selecting effective strategies and resources that will improve
performance. Monitoring refers to the ability to make an estimation of how well the
performance of a certain task is going. For instance, checking whether one is still on track
during the task. Evaluating refers to considering the quality of the products and regulating
the learning process such as reinforcing learning gains (Schraw & Moshman, 1995).
Although metacognitive skills are considered to play an important role in many types
of cognitive activities (Zohar & Barzilai, 2013), these skills in particular influence the quality
of the scientific inquiry process, which demands self-regulation and knowledge and use of

Chapter 2: an instructional framework for teaching science skills in primary science education
17
metacognitive strategies (Schraw et al., 2006). For instance, a student who is aware of the
shortcomings of a particular inquiry may be able to improve his performance of the
scientific inquiry the next time. In order to develop scientific thinking, students need to
acquire metacognitive skills in order to understand, direct, monitor and evaluate their own
higher order reasoning (Kuhn, 1989).
Learning science skills
Scientists apply skills and knowledge in an integrated way. Still, this body of knowledge and
proficiency level of skills cannot be translated directly into application in the classroom by
students. Due to their lack of experience and limited mastery of strategies, skills and
knowledge, students in primary education need support and scaffolding to effectively
conduct a scientific inquiry. Engaging in a complex task is particularly challenging for
inexperienced students since their cognitive information processing capacity is still limited
(Flavell, 1992). According to the Cognitive Load Theory (CLT), working memory is limited in
its capacity to process new information that contains multiple elements. Elements have to
be organized in more complex units and stored in long-term memory before they can be
utilized effectively (van Merriënboer & Sweller, 2005). Once this is achieved, information
stored in long-term memory is accessible when needed, aiding the acquisition of science
skills (Kirschner et al., 2006).
In the following subsections, several aspects about the acquisition of skills will be
discussed. These aspects include explicit instruction, the influence of content knowledge
and the transfer of science skills. Then, the four-component instructional design model of
Van Merriënboer et al. (1992) is discussed which is specifically developed for the acquisition
and integration of complex skills in whole tasks.
Explicit instruction
Although there is evidence pointing to the acquisition of skills through learning by doing
(Dean & Kuhn, 2007), a growing number of studies indicates that more effective learning
occurs when inquiry-based learning is accompanied by explicit skill instruction or when
explicit guidance is given (Alfieri, Brooks, Aldrich, & Tenenbaum, 2011; Chen & Klahr, 1999;
Duschl et al., 2007, p. 271; Keselman, 2003; Khishfe & Abd‐El‐Khalick, 2002; Matlen & Klahr,
2013; Sweller, Kirschner, & Clark, 2007; Zohar & Ben David, 2008).
Much of what is known about the effects of explicit instruction comes from studies
on the Control of Variables Strategy (CVS) (Lazonder & Egberink, 2014; Matlen & Klahr,

18
2013). For example, Chen and Klahr (1999)
found in an intervention study with third and
fourth graders that explicit instruction
combined with probing questions (i.e., why they
designed the investigations the way they did
and what they had learned) was an effective
way of learning how to apply CVS. This is in line
with CLT because explicit forms of instruction
put less of a burden on working memory when
learning new information (Kirschner et al.,
2006). Dean and Kuhn (2007) showed that in
particular explicit instruction (in which students
were asked to compare and identify different
features of catalogues) improved students’ CVS
even more when combined with practice. The positive impact of explicit instruction also
seems to apply to other skills. For instance, a study by Keselman (2003) on the use of
effective scientific reasoning strategies showed that students who received practice and
additional explicit instruction outperformed students who were only subjected to practice.
Researchers such as Pintrich (2002) and Tanner (2012) have recommended explicit
instruction of metacognitive skills to enhance task performance. Explicit instruction
concerning metacognitive skills can be addressed by introducing the TASC framework
(Figure 2.1). TASC stands for “Thinking Actively in a Social Context” and aims at providing
students with structure to support their thinking (Wallace, Bernardelli, Molyneux, & Farrell,
2012). Students can be instructed on how to move systematically through the stages of the
TASC framework while performing a task. In each stage several questions can be raised to
make students aware of the need to monitor and evaluate their task execution. For
instance, the students can be asked to think about what they already know about the topic
of an experiment, how much information they already have, and what information they
need (Wallace et al., 2012). These questions may be introduced and eventually withdrawn
gradually until students are familiar with the questions and apply the metacognitive skills
to each following experiment by themselves (White & Frederiksen, 2000).
The influence of content knowledge
Content knowledge is in general referred to as the conceptual understanding of facts,
concepts, theories and principles (Abrahams & Reiss, 2015; Ennis, 1989; French & Buchner,
Figure 2.1 TASC Framework (Wallace et al., 2012)

Chapter 2: an instructional framework for teaching science skills in primary science education
19
1999; OECD, 2017). Research shows that content knowledge is, to a certain extent, a
prerequisite for skill development (Eberbach & Crowley, 2009; Ennis, 1989). Evidence for
the reciprocity of content knowledge and science skills can be derived from studies on
differences in performance level between experts and novices, which shows that different
levels of content knowledge can result in significant differences in skill performance
(French & Buchner, 1999). Even when the level of cognitive abilities is supposed to be a
limiting factor of an individual, for example for a young student, it is still possible to
become an expert in a specific subject area and subsequently perform better in problem
solving tasks compared to adults who know less about the subject (Glaser, 1984).
For this reason, it is important to take into account unfamiliarity with the topic of
the science tasks that are included in science lessons (Pine et al., 2006). For example,
making observations is largely dependent on the theoretical framework students hold and
the knowledge they have on the subject (Millar & Driver, 1987). A student who has no prior
knowledge at all about cells – e.g., what they look like, how big they are – is very unlikely to
be able to see the same things when looking through a microscope compared to a student
with extensive knowledge of cells. This is supported by studies on bird watching which
demonstrated that observations only improved when basic knowledge on that subject was
already developed (Eberbach & Crowley, 2009).
The potential impact of content knowledge on task performance has implications
for the design of lessons aimed at the development of science skills. In designing teaching
materials for science, especially for classrooms in primary education, it is important to make
a clear distinction between learning objectives specific for content knowledge and learning
objectives directed at skill acquisition (Hofstein & Lunetta, 2004). Although some negative
interference between subject knowledge and skill development may not be entirely
unavoidable, instruction needs to be constructed in such a way that skill development of
individuals is not obstructed due to a lack of content knowledge. Only when students
already possess or have developed skills sufficiently, more complex task may be offered in
which skill application and knowledge development is integrated.
Transfer of skills
More robust learning of skills has only been achieved when students are able to apply the
skills in contexts other than the one in which the skills are learned. Although there is not a
clear-cut definition of what different transfer distances entail (Chen & Klahr, 1999), near-
transfer can generally be defined as the application of skills in tasks within a particular
knowledge domain or with a common structure. Far-transfer is defined as the application of

20
skills in tasks in different domains or tasks with an unfamiliar structure (Strand-Cary &
Klahr, 2008).
Contrary to science-specific skills, most thinking and metacognitive skills may not be
exclusively linked to science tasks (Perkins & Salomon, 1989). Millar and Driver (1987) even
claimed that science skills are mere “characteristics of logical thought in general” (p. 41).
Evidence suggests that metacognitive and thinking skills are general abilities and can, at
least partly, be applied across domains (Schraw & Moshman, 1995; Schraw, 1998). A study of
Veenman, Elshout and Meijer (1997) showed that metacognitive skills such as checking the
results of one’s actions and planning and monitoring while performing an activity, can be
acquired in one particular domain and consecutively applied in another. Similar results were
found in studies on programs aimed at development and transfer of thinking skills such as
the program Cognitive Acceleration through Science Education (CASE) (Adey, Robertson, &
Venville, 2002; Oliver, Venville, & Adey, 2012), and the “infusion approach” of Activating
Children’s Thinking Skills (Dewey & Bento, 2009; McGuinness, Eakin, Curry, Sheehy, &
Bunting, 2007).
However, achieving transfer across knowledge domains (i.e., topics) is generally
difficult (Kuhn et al., 1995; Lazonder & Egberink, 2014). Studies on the Control of Variables
Strategy (CVS) indicate that young students tend to fail in using the same strategies for
performing tasks with different topics (cf. Chen & Klahr, 1999). To foster transfer of skills,
explicit skills instruction may be particularly important. Some CVS studies have shown that
explicit instruction can facilitate transfer of skills to other tasks with different topics (Klahr
& Li, 2005). Making students explicitly aware of the strategies and skills that they are
applying to a particular task leads to enhanced mastery which in turn may facilitate transfer
(Adey & Shayer, 1993; Georghiades, 2000).
Four-component instructional design
Most of the difficulty in learning science skills is in applying them simultaneously to a
scientific inquiry. In present design models, it is often assumed that, despite considerable
evidence to the contrary, complex skills acquired in simple tasks will be applied
spontaneously to new and more complex tasks (van Merriënboer, Clark, & de Croock, 2002,
p. 40). The Four Component Instructional Design model (4C/ID), developed originally by Van
Merriënboer et al. (1992), is based on research on instructional design, cognitive
psychology and information processing (Vandewaetere et al., 2015).The fundamental
premise of the 4C/ID-approach is that four interrelated components are essential in
learning to apply and integrate skills within complex tasks: 1) whole learning tasks, 2) part-
task practice, 3) supportive information, and 4) just-in-time information.
Chapter 2: an instructional framework for teaching science skills in primary science education
21
Central principle of the 4C/ID-approach is whole-task practice. In whole learning tasks
knowledge, skills and attitude are intertwined. The underlying idea is that the whole is
more than the sum of the parts, which means that it is not enough to learn to apply all skills
separately, but that skills also need to be simultaneously applied to foster the
interconnections between the separate skills. Whole-tasks are preferably authentic
activities based on real-life scientific inquiry and are sequenced from relatively simple to
complex, in terms of number of skills and interactions involved (van Merriënboer & Sweller,
2005). Research shows that acquisition of skills may be enhanced when learning tasks are
sequenced from relatively simple to complex (Wu & Krajcik, 2006).
Part-task practice consists of smaller and simpler tasks in which parts of the whole-
tasks are trained separately. By breaking down the whole scientific inquiry into smaller and
manageable parts in which students can learn and practice particular skills, performance
can be enhanced (Lazonder & Egberink, 2014). Part-tasks provide additional practice for a
specific skill in order to reach a certain level of automaticity. In the context of science
education, sequencing and combining whole learning tasks and additional part-tasks within
a series of science lessons will involve careful arranging in terms of difficulty level and
complexity. Supportive information bridges the gap between learners’ prior knowledge and
the knowledge necessary for task performance. It involves the use and application of rules
but also includes acquiring strategies to improve performance. Finally, just-in-time (JIT)
information includes the step-by-step information for the routine aspects of learning tasks.
JIT information includes scaffolding, which involves providing students with support in
carrying out a task which they cannot yet do on their own (Duschl et al., 2007; Wood,
Bruner, & Ross, 1976). Examples of types of scaffolds are heuristics and prompts which
should be withdrawn gradually as students gain proficiency in the tasks (Hohenstein &
Manning, 2010; Lazonder & Harmsen, 2014; McNeill, Lizotte, Krajcik, & Marx, 2006). A final
part of supportive information and JIT information includes providing students with
feedback. The feedback may be given immediately or may involve stimulating students to
reflect on their performance.

22
2.3 An instructional framework for teaching science
skills: an example lesson
In this section, the first lesson which was part of the series of eight lessons for the
intervention of the effect study, which showed positive effects (see chapter 4), is
presented. This illustration shows how the various aspects of learning science skills as
discussed above can be applied to a design for systematic skill instruction for primary
science education. The principles of the 4C/ID system are used as a starting point. This
involves the implementation of whole learning tasks, together with part-task practice and
including scaffolding and feedback opportunities (supportive- and JIT information). The
part-tasks are aimed at strengthening the underlying skills which then have to be
simultaneously applied in a whole task scientific inquiry. First, additional principles which
guided the instructional framework will be described. Then, the outline of the instructional
framework is presented followed by a detailed description of a lesson.
General guiding principles for teaching science skills
A generally accepted guiding principle for primary science education is the structuring of
investigations by following the main steps of the empirical cycle: 1) formulating a research
question, 2) formulating a hypothesis, 3) designing an experiment, 4) measuring and
recording data, 5) analyzing data, and (6) formulating a conclusion. The empirical cycle
reflects all aspects of a scientific inquiry that are included in most curricula as learning
objectives. Because of this, most science tasks in primary education are more or less
structured accordingly. Although scientific inquiry is not a linear process (NRC, 2012) and
scientists merely use it as a reporting device (Kind, 1999), the subsequent activities of the
empirical cycle provide a structure that is recognizable for students and their teachers. It
also gives the students an understanding of how the inquiry process can be organized,
which is particularly important for students in primary education who have little experience
with inquiry tasks (Donovan, Bransford, & Pellegrino, 1999; White & Frederiksen, 2000).
In the series of lessons of the intervention, the principle of structuring via the steps
of the empirical cycle is applied in two different ways. First, in each lesson students
perform a scientific inquiry (whole task) structured identically into the six steps that
represent the empirical cycle. Second, one of the steps is explicitly taught and practiced in
each lesson. That is, lesson one is directed at formulating a research question, lesson two at
formulating a hypothesis and so on. In the whole-task, the other steps receive less
Chapter 2: an instructional framework for teaching science skills in primary science education
23
attention because it would be too much of a burden to learn all steps in detail in one
lesson. After six lessons in which all steps receive specific attention, the lessons seven and
eight include tasks in which all steps are incorporated in the sense that instruction on all
steps recurs, albeit less elaborately.
During the course of the series of lessons, on the topic of heat and temperature, the
scientific inquiries gradually increase in difficulty and complexity while at the same time the
explicit attention in the form of direct instruction and prompts are slowly withdrawn. At
the start the teacher is fully responsible for guiding task execution, but toward the end
support of the teacher is fading and the student takes over responsibility (van de Pol,
Volman, & Beishuizen, 2010). For instance, the support by using TASC questions in the
notebook fades away while students get used to applying the metacognitive strategies
when performing scientific inquiries. In the final lesson, all skills which are practiced in
previous lessons, are simultaneously applied independently and without any support to a
scientific inquiry.
An example lesson of the instructional framework
Here follows an elaborate description of the first lesson of the series of eight lessons to
illustrate in more detail how the above described design principles were applied to a
practical example. Although the intervention lessons were taught by trained teaching
assistants (see chapter 4), we will refer to the teaching assistants as teachers.
In the first lesson, the students received a notebook containing information about
the topic of the lesson and the tasks. They were instructed to write down their responses
to the exercises and note their results of the inquiry tasks. In addition, students were given
a booklet with all questions of the TASC model. The students were told to use the booklet
while performing the investigations. The teachers were provided with an extensive
practical guide which contained the learning objectives and detailed lesson plans. In
addition, the teachers used PowerPoint presentations to guide them through the lessons.
The presentations contained examples for classroom discussion, instructional prompts and
explanations of the various skills.
The learning objectives for this lesson included formulating a research question,
activating prior knowledge and evaluating learning gains. In this study, formulating a
research question is considered primarily a science-specific skill. This implies that students
have to apply procedural and declarative knowledge of what is needed for correctly
formulating a research question and then apply it to the context at hand. Activating prior
knowledge and evaluating learning gains are considered to be metacognitive skills which

24
implies a different teaching
approach may be necessary. Each
lesson lasted 90 minutes. The first
half of the lesson was spent on the
explicit instruction and part-task
practice of the skills as mentioned in
the learning objectives. In the last 45
minutes, the whole-task - a scientific
inquiry - was performed by the
students and rounded off with
evaluation tasks (Figure 2.2).
In the first 10-15 minutes of the first lesson, the TASC model was introduced. The teacher
clarified the importance and goal of using TASC questions when performing an
investigation. Additionally, the questions were explained and practiced in the classroom to
ensure the students understood the content of the TASC questions. Then, the students
were shown all steps of the empirical cycle which were printed on a poster which was in
view in the classroom (Figure 2.3). This poster was present throughout the whole series of
lessons. In each lesson, students were made aware of
which step of the empirical cycle the particular lesson
was aimed at. By doing this, the poster functioned as a
scaffold when performing the scientific inquiry tasks.
In the next 30 minutes, the students received
explicit, direct instruction on formulating a research
question combined with part-task practice. The
instruction consisted of explaining the criteria for a
research question and classroom discussion about
example research questions. Criteria were illustrated
by means of flow chart and are based on declarative
and procedural knowledge of how to formulate a
proper research question (Figure 2.4). The application
of this Question Machine (Science Education Hub
Radboud University, 2016) was demonstrated by the
teacher by means of a classroom discussion on a
variety of example research questions. In subsequent
part-task exercises, students used the Question
Machine to help them to formulate a research
15minutes
30minutes
30minutes
15minutes
introduction
explicitinstructionandpracticetasks
whole-task
evaluation
Figure 2.2 lesson outline
Figure 2.3 doorposter with the steps of the empirical cycle

Chapter 2: an instructional framework for teaching science skills in primary science education
25
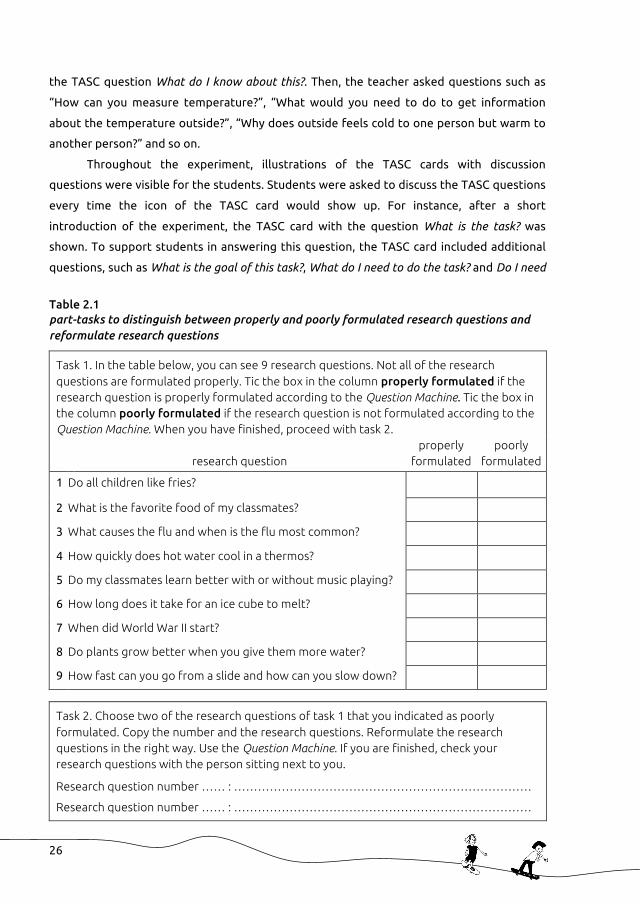
question. For instance, in the first part-task students were asked to distinguish between
properly and poorly formulated research questions. Then, students had to pick two of the
poorly formulated research questions and reformulate them (Table 2.1). Finally, students
formulated a research question as the start of a simple scientific investigation which was
introduced after students had finished the part-task exercises. By including these part-
tasks, the learning of formulating a research questions is practiced in smaller parts with
increasing complexity and difficulty, resulting in enhanced performance (Lazonder &
Egberink, 2014). In the course of the series of lessons, students were expected to be able to
formulate research questions without help. Consequently, scaffolding by means of the
Question Machine was gradually withdrawn.
In the next 30 minutes of the lesson, students performed a relatively simple experiment in
which students examined the difference in measuring temperature with their hands and
with a thermometer (see Appendix A for complete description of the experiment). Students
worked in groups of three. In line with the learning objectives which included formulating a
research question, activating prior knowledge and evaluating learning gains, these skills
were given explicit attention. The attention consisted of introducing the experiment by
discussing what students already knew about the subject of temperature. The teacher
made students explicitly aware of the importance of activating prior knowledge by showing
Figure 2.4 the Question Machine (Science Education Hub Radboud University, 2016)
26
the TASC question What do I know about this?. Then, the teacher asked questions such as
“How can you measure temperature?”, “What would you need to do to get information
about the temperature outside?”, “Why does outside feels cold to one person but warm to
another person?” and so on.
Throughout the experiment, illustrations of the TASC cards with discussion
questions were visible for the students. Students were asked to discuss the TASC questions
every time the icon of the TASC card would show up. For instance, after a short
introduction of the experiment, the TASC card with the question What is the task? was
shown. To support students in answering this question, the TASC card included additional
questions, such as What is the goal of this task?, What do I need to do the task? and Do I need
Table 2.1 part-tasks to distinguish between properly and poorly formulated research questions and reformulate research questions
Task 1. In the table below, you can see 9 research questions. Not all of the research questions are formulated properly. Tic the box in the column properly formulated if the research question is properly formulated according to the Question Machine. Tic the box in the column poorly formulated if the research question is not formulated according to the Question Machine. When you have finished, proceed with task 2.
research question properly
formulated poorly
formulated
1 Do all children like fries?
2 What is the favorite food of my classmates?
3 What causes the flu and when is the flu most common?
4 How quickly does hot water cool in a thermos?
5 Do my classmates learn better with or without music playing?
6 How long does it take for an ice cube to melt?
7 When did World War II start?
8 Do plants grow better when you give them more water?
9 How fast can you go from a slide and how can you slow down?
Task 2. Choose two of the research questions of task 1 that you indicated as poorly formulated. Copy the number and the research questions. Reformulate the research questions in the right way. Use the Question Machine. If you are finished, check your research questions with the person sitting next to you.
Research question number …… : …………………………………………………………………
Research question number …… : …………………………………………………………………

Chapter 2: an instructional framework for teaching science skills in primary science education
27
more information?. Another example included a TASC card that was presented when
students were at the point of starting the actual measurements. The TASC card was aimed
at the metacognitive skill of monitoring and the key question was Let’s do it and how am I
doing?. The additional questions were Am I doing this in the right way? and How can I monitor
my progress?. In addition, students received each a small flip-over booklet including all TASC
cards. Students were encouraged to take out and use this booklet every time they would
perform a scientific inquiry.
During the inquiry, students were provided with information when needed such as
when using a thermometer to measure the temperature of water (just-in-time information).
After students had finished the inquiry, the teacher took 5 minutes to discuss the results of
the inquiry and whether the research questions had been answered. Questions that were
discussed included “What were the results?”, “Are the results the same for everyone and
what could be reason for differences?”, “What is probably the best way to objectively
measure temperature?”. By doing this, students received explicit support in evaluating the
outcomes of the inquiry.
Although the primary focus in the inquiry task was on the application of
metacognitive strategies and on formulating the research question, the students went
through all steps of the empirical cycle in the whole-task. However, the last steps received
less attention as in each subsequent lesson one of the other steps was explicitly taught and
practiced. As a result, this particular experiment was the most structured and scaffolded
while in the course of the subsequent lessons the experiments became more open and
more skills were used simultaneously.
In the final 15 minutes of the lesson,
the students evaluated their learning gains
by formulating a written answer to the
following two questions: What would you do
differently the next time you perform a
scientific inquiry? and What new knowledge
do you now have about doing an inquiry? In
order to support the strategies needed for
answering the questions, students were
provided with two TASC cards including the
additional questions (Figure 2.5). The
students were asked to think about these
questions first before formulating their
answers to the evaluative questions. Figure 2.5 TASC cards including additional questions

28
2.4 Discussion
In this article, an instructional approach was discussed and illustrated for teaching science
skills in primary education. The general concept of science skills was operationalized in
thinking skills, metacognitive skills and science-specific skills. Subsequently, the 4CD/ID-
model combined with explicit instruction was applied for training primary students’ science
skills and providing them with extensive opportunities to implement the acquired skills in
an integrated manner and in a variety of whole inquiry tasks.
Categorizing the general concept of science skills into thinking skills, metacognitive
skills and science-specific skills provided the opportunity for designing and constructing
teaching materials in a more systematic way. Moreover, the categorization may offer
opportunities for integrating science lessons with other subjects such as language and
mathematics. Findings in previous studies support the view that thinking skills and
metacognitive skills are general skills which may be acquired in other school subjects as
well (Dewey & Bento, 2009; Georghiades, 2000; McGuinness et al., 2007). Therefore,
alignment of the curriculum for science education with the curricula of other subjects may
create added value for the acquisition and transfer of thinking and metacognitive skills. In
addition, since science lessons form only a small part of the overall curriculum for primary
education (Martin, Mullis, Foy, & Stanco, 2012; National Academies of Sciences,
Engineering, and Medicine (NASEM), 2015, p. 56), integration with other school subjects
may give science education a more solid and embedded position in curricula of primary
education.
Likewise, distinguishing into three types of underlying skills offers the opportunity
to align measurement instruments. In primary science education in which the underlying
thinking skills, metacognitive skills and science-specific skills are explicitly taught, actual
students’ performance in relation to these skills should be assessed in a similar way. Science
skills are generally assessed without taking into account the complexity of underlying skills
that are simultaneously applied. In other words, students are assessed individually by
observing the actual level of performance on a whole science task without taking into
account the level of mastery of these skills underlying the complex activities. In order to
establish whether a student has reached certain learning goals, it is important to construct
measurement instruments directed to more distinctly assessment of the different skills.
Such instruments can clarify the progress of students more accurately and may have
potential to provide diagnostic information about the level of complex skill mastery.
Chapter 2: an instructional framework for teaching science skills in primary science education
29
The instructional approach was illustrated by describing a lesson used in an intervention
study. This intervention study showed that the merits of the lessons were not limited to the
positive effects on students’ performance of the science skills. Teachers also reported that
students found the lessons generally enjoyable. Most students were involved (in terms of
concentration and focus on the tasks) during instruction and the assignments. In particular
the investigation tasks appealed to many students. This indicates that highly structured
instruction and investigations are not per se detrimental to young students’ enjoyment of
science lessons.
However, some critical comments were put forward by the teachers. For example,
the inquiry activities took sometimes more time than was anticipated. As a result, the
evaluation task was the first activity to be skipped by the teachers. As evaluating the
learning gains is an important aspect of these lessons, an adjustment to the number and
size of some assignments should be considered.
Actually working on challenging, meaningful and authentic small experiments
stimulates students’ understanding of scientific investigation. It is important for the
integrated application of skills but also offers a playful way to familiarize students with the
different steps of the empirical cycle (NASEM, 2015, p. 29). The students participating in
the series of lessons especially enjoyed the experimenting. For the purpose of providing
students with adequate scaffolding, the investigations were highly structured. When
students become more skilled in performance of the scientific inquiries, more open and
more interesting experiments may be preferred.

30

31
3
assessing students’ ability
in performing scientific inquiry :
instruments for measuring
science skills in primary education

Chapter 3: assessing students’ ability in performing scientific inquiry:
32
ABSTRACT
With the increased attention on the implementation of inquiry activities in primary science
classrooms, a growing interest has emerged in assessing students’ science skills. Research
has thus far been concerned with the limitations and advantages of different test formats
to assess students’ science skills. This study explores the construction of different
instruments for measuring science skills by categorizing items systematically on three
subskill levels (science-specific, thinking, metacognition) as well as on different steps of the
empirical cycle. The study included 128 5th and 6th grade students from seven primary
schools in the Netherlands. Seven measures were used: a paper-and-pencil test, three
performance assessments, two metacognitive self-report tests and a test used as an
indication of general cognitive ability. Reliabilities of all tests indicate sufficient internal
consistency. Positive correlations between the paper-and-pencil test and the three
performance assessments show that the different tests measure a common core of similar
skills thus providing evidence for convergent validity. Results also show that students’
ability to perform scientific inquiry is significantly related to general cognitive ability. No
relationship was found between the measure of general metacognitive ability and either
the paper-and-pencil test or the three performance assessments. By contrast, the
metacognitive self-report test constructed to obtain information about the application of
metacognitive abilities in performing scientific inquiry, shows significant - although small -
correlations with two of the performance assessments. Further explorations reveal
sufficient scale reliabilities on subskill and step level. The present study shows that science
skills can be measured reliably by categorizing items on subskill and step level. Additional
diagnostic information can be obtained by examining mean scores on both subskill and step
level. Such measures are not only suitable for assessing students’ mastery of science skills
but can also provide teachers with diagnostic information to adapt their instructions and
foster the learning process of their students.
Based on
Kruit, P. M., Oostdam, R. J., van den Berg, E., & Schuitema, J. A. (2018). Assessing students’
ability in performing scientific inquiry: instruments for measuring science skills in primary
education. Research in Science & Technological Education, 36 (4), 413-439.
DOI: 10.1080/02635143.2017.1421530

instruments for measuring science skills in primary education
33
3.1 Introduction
With the increased attention toward the implementation of inquiry activities within primary
science classrooms, a growing interest has emerged in assessing students’ science skills,
which are the skills involved in generating and validating knowledge through scientific
investigations. Traditionally, most tests, whether intended for small- or large-scale
assessment, have been paper-and-pencil formats consisting of multiple-choice items and/or
open-ended questions (Hofstein & Lunetta, 2004). Examples of such tests are the Test of
Enquiry Skills by Fraser (1980), and the test for assessing science achievement for the Third
Mathematics and Science Study (TIMSS) (Martin et al., 1997).
In line with an increased understanding of how students learn, alternative
assessment formats such as the use of performance assessments (Harmon et al., 1997; NRC,
2012; Shavelson, Baxter, & Pine, 1991) have been considered. In a performance assessment
(PA) students perform small experiments by interacting actively with materials. PAs are
regarded as “investigations that recreate to some extent the conditions under which
scientists work and elicit the kind of thinking and reasoning used by scientists when they
solve problems” (Shavelson, Solano-Flores, & Ruiz-Primo, 1998, p. 172).
Research has been concerned with the limitations and advantages of the different
test formats. A paper-and-pencil test (PPT) can be administered easily, rated reliably and
students are familiar with the format (Harlen, 1991). The major disadvantages are that a
PPT lacks authenticity (Shavelson et al., 1991) or, in other words, the assessment does not
reflect the activities of a real-life inquiry (Davey et al., 2015), and may be influenced
considerably by reading ability (Harlen, 1991). While PAs are considered more authentic
(Ennis, 1993; Davey et al., 2015) they are also more cost and labor-intensive to administer.
Due to the open format, reliable rating is complicated (Davey et al., 2015) and students are
often not familiarized with this test format which may negatively influence test
performance (Kind, 1999).
Prior research shows that different levels of content knowledge - defined by OECD
(2017, p. 74) as “knowledge of the facts, concepts, ideas and theories about the natural
world that science has established” - may affect test performance as well (Eberbach &
Crowley, 2009; Harlen, 1991; Roberts & Gott, 2006;). Content knowledge may have more
influence on a PA than a PPT because a PA is designed around one science topic of which
individual students may or may not possess prior knowledge, while a PPT contains
questions about several topics. Different strategies have been used to mitigate for the
content dependency of items. For example, the TIMSS 2015 Science Framework (Jones,

Chapter 3: assessing students’ ability in performing scientific inquiry:
34
Wheeler, & Centurino, 2013) attempted to minimize the influence of content knowledge by
assessing science skills using content where it was necessary to reason with the concepts.
The Next Generation Science Standards specifically integrated content knowledge and
skills in the goals for the “practices”. The concept of practices is used to integrate the
science process skills and content knowledge to “emphasize that engaging in scientific
investigation requires not only skill but also knowledge that is specific to each practice”
(NRC, 2012, p. 30). The Assessment of Performance Unit (APU) controlled for content
knowledge by minimizing the amount of content in assessments (Harlen, 1986). In the STAR
(Science Teachers’ Action Research) project in the UK, skills were assessed using multiple
items relating back to one theme (Harlen, 1991) which is similar to a PA in which all items
refer to one particular context.
Research that focuses on measuring science skills in both primary and secondary
education has not only shown small correlations between PPTs and PAs (Baxter et al., 1992;
Baxter & Shavelson, 1994; Hammann et al., 2008; Lawrenz, Huffman, & Welch, 2001;
Roberts & Gott, 2006) but also between PAs designed to measure the same science skills
(Gott & Duggan, 2002; Pine et al., 2006). These small correlations between the same and
different test formats have not only been attributed to differences in students’ content
knowledge (Gott & Duggan, 2002; Shavelson et al., 1991), but also to inconsistencies in
rating and occasion sampling variability. Occasion sampling variability occurs when students
perform the same task differently on different occasions (Ruiz-Primo, Baxter, & Shavelson,
1993).
The lack of convergence between different tests intending to measure the same
science skills suggests at the same time that underlying cognitive demands may not always
be equally evoked (Messick, 1994; Millar & Driver, 1987; Shavelson et al., 1991). Research
shows that, for example, correlations between measures of science skills and general
cognitive ability in grade 9 vary from small (Song & Black, 1992; Tamir, 1988) to large
(Baxter et al., 1992; Lawson, 1989) indicating that certain components of science tests may
be related more to general cognitive ability and less to skills specific for science (Gott &
Duggan, 2002; Pine et al., 2006; Roberts & Gott, 2006).
Of major concern in this regard is that science skills are a rather “ill-defined domain”
(Gobert & Koedinger, 2011). Science skills - also referred to with terms such as “science
process skills’ or “investigation skills” (Harlen & Qualter, 2009) - usually indicate a wide
variety of activities related to planning and conducting investigations and interpreting
results (Alonzo & Aschbacher, 2004; Gott & Duggan, 1995; Harlen & Qualter, 2009).
Abrahams and Reiss (2015) make an additional distinction between process skills such as

instruments for measuring science skills in primary education
35
planning, predicting, and experimenting, and practical skills which are more specific such as
handling a microscope.
Science skills are generally defined based on the activities in which scientists engage
during authentic research (Lederman & Lederman, 2014). In the framework for K-12 science
education, scientific inquiry is represented by three domains of activities: investigating,
developing explanations and solutions and evaluating data as evidence for the proposed
theories and models (NRC, 2012). The NRC emphasizes that students should learn about
what scientists do when designing and carrying out their own inquiries. However, for
assessing science skills, it is necessary to more accurately define the cognitive demands
underlying the inquiry activities. In this context, Osborne (2014) argues that part of the
problem lies in the focus that educators and teachers put on only the practical aspects of
scientific inquiry which applies to both primary (Roth, 2014) and secondary education. This
limited operationalization of science skills results in ignoring the wide variety of cognitive
abilities called upon in scientific investigations. For instance, different abilities are
employed when handling a microscope than when identifying patterns in data.
Consequently, science skills are frequently assessed using tests that are not systematically
constructed and based upon a clear operationalization of cognitive demands which underlie
scientists’ actual activities. Furthermore, tests often emphasize the practical side of inquiry
such as controlling variables. For systematic test construction, different types of the
underlying skills need to be distinguished, identified (Sternberg, 1985), and systematically
included in test designs.
The aim of the present study is to explore to what extent structuring assessments
by distinguishing between underlying skills will improve convergence between tests, attain
more validity by including all aspects of inquiry, and offer the possibility of obtaining
diagnostic information on students’ performance. To this end, each activity performed in a
scientific inquiry was classified by determining which of the following skills primarily
underlies the activity: science-specific skills, thinking skills or metacognitive skills.
Science-specific skills refer to the ability to apply procedural and declarative
knowledge for correctly setting up and conducting a scientific experiment (Gott & Murphy,
1987). These skills can be classified as lower order thinking (Newmann, 1990) or
reproductive thinking (Maier cited in Lewis & Smith, 1993), and are characterized by
knowledge recall, comprehension, the routine employment of rules and simple application
(Goodson, 2000). Students performing a scientific inquiry are required to recall the facts
and rules about how to conduct scientific experiments, such as identifying and controlling
for variables, observing and measuring and using simple measurement devices. They must
then use and apply this knowledge to - for example - select the appropriate procedures and

Chapter 3: assessing students’ ability in performing scientific inquiry:
36
organize the data into tables (Gott & Murphy, 1987; OECD, 2017). Science-specific inquiry
skills defined as such include the practical skills as discussed by Abrahams and Reiss (2015)
but they pertain to cognitive processes as well.
In addition to the above-described science-specific skills, students apply more
general thinking skills to make sense of the data and connect the observations to scientific
theories (Osborne, 2015). Thinking skills include the higher order thinking skills, also
frequently referred to as critical thinking (Moseley et al., 2005). A distinction is often made
between the philosophical interpretation of critical thinking (evaluating statements and
judging) and the interpretation made by psychologists who emphasize the problem-solving
aspect. The latter approach is more commonly utilized in scientific inquiry (Lewis & Smith,
1993).
Thinking skills involve manipulating information that is in nature complex because it
consists of more than one element and has a high level of abstraction (Flavell, Miller, &
Miller, 1993). Concepts and rules are put together and applied to a new situation. The
application of thinking skills involves interpreting, analyzing, evaluating, classifying and
inferring information (Moseley et al., 2005; Newmann, 1990). In accordance with Bloom’s
taxonomy, thinking skills such as analyzing and synthesizing are considered to have higher
levels of complexity (Bloom, 1956). Many of these thinking skills are abundantly applied in
scientific investigations. For example, when making appropriate inferences from different
sources of data (Pintrich, 2002) or when identifying features and patterns in data, thinking
skills will predominantly underlie these particular aspects of a scientific inquiry. Zohar and
Dori (2003) even argue that science skills such as formulating hypotheses or drawing
conclusions can be classified as higher order thinking skills since they have the same
characteristics.
Metacognitive skills are in general considered to be a particular type of higher order
thinking skill (see for discussion Lewis & Smith, 1993). What distinguishes metacognitive
skills from general thinking skills is that they involve active executive control of the mental
processes (Goodson, 2000) or “thinking about thinking” (Kuhn, 1999; Kuhn & Dean, 2004, p.
270). In this study, metacognitive skills refer to self-regulatory skills and include planning,
monitoring, and evaluating task performance (Flavell et al., 1993; Pintrich, 2002; Schraw &
Moshman, 1995). Planning refers to selecting effective strategies and resources that will
improve performance. Monitoring concerns being aware of comprehension and task
performance. For instance, checking to see whether one is still on track during the task.
Evaluating refers to the judging the quality of the products and the process of achieving
the goal, such as reflecting on what one could have done differently for better results
(Schraw & Moshman, 1995). Although metacognitive skills are considered to play an

instruments for measuring science skills in primary education
37
important role in many types of cognitive activities (Zohar & Barzilai, 2013), these skills
influence the quality of the scientific inquiry process, which in particular demands self-
regulation and knowledge and use of metacognitive strategies (Schraw, Crippen, & Hartley,
2006). For instance, a student who is aware of the shortcomings of a particular inquiry may
be able to improve his or her performance in a subsequent scientific inquiry. To become a
scientific thinker, students need to acquire metacognitive skills in order to understand,
direct, monitor and evaluate their own higher order reasoning (Kuhn, 1989).
To further reduce the lack of convergence between tests, the following main
activities (‘steps’) within the empirical cycle were used as a general blueprint for test
construction: (1) formulating a research question, (2) designing an experiment, (3)
formulating a hypothesis, (4) measuring and recording data, (5) analyzing data, (6)
formulating a conclusion and (7) evaluating. Although scientists do not move linearly
through the three domains of activity (NRC, 2012) and merely use it as a reporting device
(Kind, 1999), the empirical cycle reflects all of the aspects of a scientific inquiry which are
included as learning objectives in most curricula. Deploying the empirical cycle as a
blueprint for test construction ensures that the same activities of scientific inquiry are
included in each test and thus ensures construct validity (Solano-Flores, Javanovic,
Shavelson, & Bachman, 1999). Furthermore, systematically assembling these activities
within tests may provide a useful scaffold, especially for students in primary education who
have little inquiry experience (Donovan, Bransford, & Pellegrino, 1999; cf. White &
Frederiksen, 2000).
In summary, we explored the construction of different instruments for measuring
science skills in grades 5 and 6 of primary education. In contrast to current measures, we
aimed for a systematic construction of instruments by assigning items to the different
activities of the empirical cycle and by categorizing them in relation to science-specific
skills, thinking skills and metacognitive skills. In this way, we ensured that tests contained
the major aspects of scientific inquiry while doing justice to the different cognitive
demands which are often overlooked by teachers when assessing science skills (Osborne,
2014). Although the underlying skills are not measured directly because the tests aim only
to measure the activities performed in a scientific inquiry, it is still possible to obtain a
reflection of students’ mastery of science-specific skills as well as thinking and
metacognitive skills. In addition, the influence of prior content knowledge is controlled for
as much as possible.
Furthermore, we examined to what extent the different instruments measure
science skills in relation to general cognitive ability and also whether the categorization of
items on underlying skill (subskill) level (science-specific, thinking and metacognition) and

Chapter 3: assessing students’ ability in performing scientific inquiry:
38
step level of the empirical cycle might provide additional diagnostic information. Hence,
the following research questions were addressed:
1. Can students’ ability in performing scientific inquiry be measured in a reliable
manner?
2. To what extent is the measurement of students’ ability in performing scientific
inquiry related to their general cognitive ability?
3. Can students’ ability in performing scientific inquiry be validly measured by means of
different assessment instruments?
4. To what extent do measurements on subskill and step level provide additional
diagnostic information to the overall measurement of students’ ability in performing
scientific inquiry?

instruments for measuring science skills in primary education
39
3.2 Method
Participants
All measuring instruments were administered to 128 students (55% female, 45% male) with
a mean age of 11.4 (SD = .64) from seven primary schools in the Netherlands. Seventy-five
students (59%) were in grade 5 and 53 (41%) were in grade 6. Some students had prior
experience with scientific investigations because of lessons provided within the regular
school science curriculum. Science skills had not previously been assessed by means of a
PPT or a PA at these schools.
Measuring instruments
Paper-and-pencil test
Items for the PPT were selected from large-scale assessments and other sources (e.g.,
SOLpass.org) based on the following criteria. Construct validity was maintained by
assigning items to the different steps of the empirical cycle and by categorizing them in
relation to the primary subskill which underlies the particular activity performed in the item
(Table 3.1). For instance, one of the items contained a short description of an experiment
and the data measured. The students were asked to draw a graph of these data. This item
was categorized as a science-specific skill and simultaneously assigned to the step of
“recording and organizing data”. The PPT contained items that measured thinking and
science-specific skills (see Appendix B for some example items). Items on metacognition
such as choosing alternative strategies or evaluating learning gains were not included
because answers are based on self-assessments and cannot simply be scored as correct or
incorrect (Shavelson, Carey, & Webb, 1990). Limited test time available at schools resulted
in balancing time-consuming open-ended questions, such as providing an explanation or
making a graph, with more time-efficient multiple choice questions.
To ensure content validity, university lecturers in the fields of biology and physics
education assessed all items for correct representation of the phenomena. In addition,
these content experts checked that items were correctly classified to subskill and step
level. Next, primary school teachers verified the formulation of the items and the content
familiarity for grades 5 and 6 students. As a result, minor adjustments were made, such as
substituting relatively unfamiliar words with more commonly used words. Finally, a small
group of five students of similar age were asked to complete the initial draft of the PPT and
to explain their answers in an informal interview to check comprehensibility of content and

Chapter 3: assessing students’ ability in performing scientific inquiry:
40
language. As a result, some items were revised or deleted. For example, one item required
students to look at a drawing of a cat and interpret its mood. However, it turned out that
only students who owned a cat were able to interpret the cat’s behavior as shown in the
drawing. This item was therefore deleted.
The preliminary version of the PPT was piloted in two rounds with, respectively, 117
and 158 students from grades 5 and 6. Based on the results of these pilot studies items
with item total correlations below .15 were deleted, resulting in a final version with 46
items (Table 3.1).
A scoring model was developed for assessing answers to the open-ended questions.
To ensure scoring validity, possible answers were first formulated by content experts and
then fine-tuned based on students’ answers. Criteria for awarding points were based on the
level of complexity of the answers, meaning that the more elements the answer needed,
the more points could be awarded. For instance, drawing a graph involves (a) labeling the
axes, (b) putting the data points in the right place, and (c) drawing a line of best-fit (see
Appendix C for an example of a scoring model).
For administration purposes, the items of the final version of the PPT were divided
into two test booklets based on an optimal split half. Each test booklet contained 18
multiple choice and 5 open-ended items. Administration of each booklet in the present
study took about 45 minutes.
Table 3.1 distribution of multiple choice and open-ended items in the PPT, classified to subskill level
item description number of items
multiple choice
open-ended
Thinking: formulate hypothesis 5 3 2
Thinking: control variables 4 4 -
Thinking: identify features, patterns, contradictions in data 6 3 3
Thinking: make inferences informed by evidence and reason 6 5 1
Thinking: relate conclusion to hypothesis/draw conclusion 7 7 -
Science-specific: formulate research question 6 6 -
Science-specific: observe/measure correctly 6 6 -
Science-specific: organize data 6 2 4
Total number of items for thinking skills 28
Total number of items for science-specific skills 18

instruments for measuring science skills in primary education
41
Performance assessments
Based on PAs in previous large-scale studies for grades 5 and 6, three tasks were developed
with topics suitable for students of this age: Skateboard, Bungee Jump, and Hot Chocolate.
Skateboard was based on the PA Rolling Down Hill (Ahlbrand, Green, Grogg, Gould, &
Winnett, 1993). Bungee Jump and Hot Chocolate were based on task formats in TIMSS
(Martin et al., 1997).
All three PAs concern comparative investigations: students are asked to examine the
relationship between two variables (Shavelson et al., 1998). In Skateboard, students must
roll a marble (the “skateboard”) down a ruler (the “hill”) to examine the relationship
between the distance of the marble on the ruler (slope) and the distance the marble covers
at the end of the ruler while pushing a paper wedge forward. Comparable investigations
must be performed in Bungee Jump (students examine how the length of a rubber band
may change by hanging additional weights) and Hot Chocolate (relationship between the
amount of hot water and the rate of cooling).
Each PA is constructed according to the same template following the various
activities (steps) of the empirical cycle (Table 3.2). Subsequently, the different activities are
categorized as “science-specific”, “thinking”, or “metacognitive”. As mentioned before, this
categorization is based on the prevailing skill of a particular activity. For instance, the
activity of planning an experiment is related to describing the setup of the investigation
and the way in which results will be noted. This activity is therefore categorized as science-
specific, although it requires thinking and metacognition as well.
To reach a high quality of content validity, the university lecturers in the field of
biology and physics education assessed all items regarding clarity of formulation and the
main subskill and activity to be measured. According to Clauser (2000), it should be taken
into consideration that subject-matter experts may be too focused on details not
appropriate for primary school students. Therefore, primary school teachers were also
requested to assess all items on the same characteristics. As a result, minor adjustments
were made. For example, in the empirical cycle, formulating a research question is usually
followed by formulating a hypothesis and then planning the experiment. However, for
primary school students formulating a hypothesis after planning the experiment provides
students with additional scaffolding.
Preliminary versions of all three PAs were piloted with 70 grades 5 and 6 students.
Based on the outcomes several adjustments were made regarding the formulation of
instructions, questions and task structure.
Simultaneously, a scoring rubric was developed for each PA. Scoring validity was
attained in the following ways (Kane, Crooks, & Cohen, 1999). Criteria for awarding points

Chapter 3: assessing students’ ability in performing scientific inquiry:
42
were expressed as detailed descriptions of the elements that should be included in
students’ answers. University teachers as content experts assessed the criteria for
awarding points to the different levels of proficiency of possible answers, meaning that
when the answer contains more elements, a higher level of proficiency is reached.
Depending on the number of elements more points are awarded (Table 3.2). In addition,
teachers considered whether the criteria were feasible for grades 5 and 6 students.
Students’ responses obtained from the pilots were used to fine-tune the scoring criteria
and examples were added to illustrate the different levels of proficiency (see Appendices C
and D for examples of a scoring rubric).
As shown in Table 3.2, each PA contained 14 quantifiable items to be completed in
about 45 minutes. Scoring of items was based on students’ answers which were written
down in notebooks. The rationale behind using students’ answers is that in authentic
inquiry in which all activities are performed, these written responses can be interpreted as
a summary of the actual scientific investigation (Kind, 1999). An important advantage of
using notebooks is that it makes it possible to score and analyze the students’ work after
the event has occurred (Schilling et al., 1990). Furthermore, scoring based on written
answers has proven to be a good alternative for real-time observation (Ruiz-Primo et al.,
1993; Solano-Flores et al., 1999) and is assumed to provide a valid indication of the
students’ potential performance in real life inquiry (Harmon et al., 1997).
Raters were thoroughly trained to interpret the criteria as intended and to award
points to students’ answers. During training sessions scoring rubrics were fine-tuned with
additional examples of possible answers.
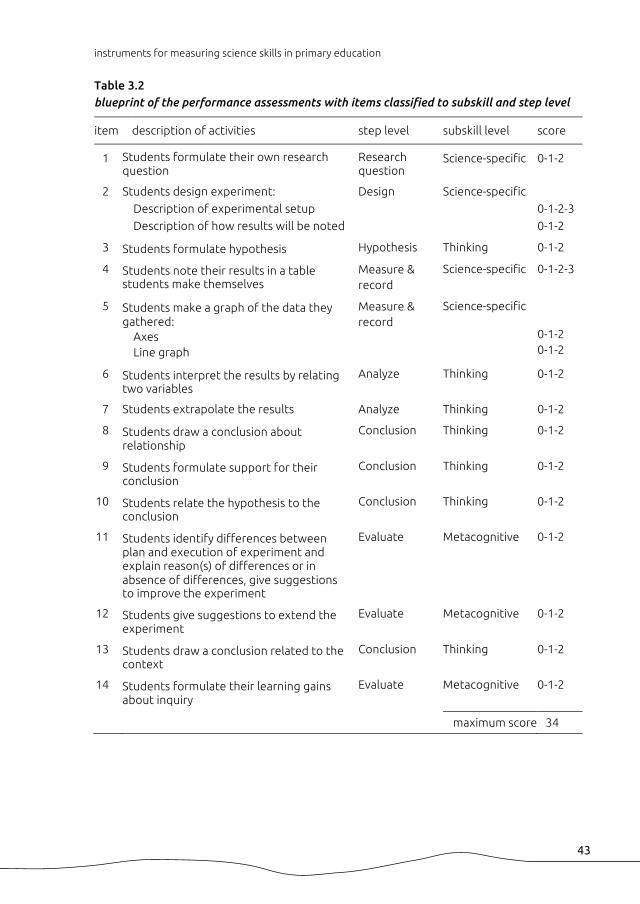
instruments for measuring science skills in primary education
43
Table 3.2 blueprint of the performance assessments with items classified to subskill and step level
item description of activities step level subskill level score
1 Students formulate their own research question
Research question
Science-specific 0-1-2
2 Students design experiment: Design Science-specific
Description of experimental setup 0-1-2-3
Description of how results will be noted 0-1-2
3 Students formulate hypothesis Hypothesis Thinking 0-1-2
4 Students note their results in a table students make themselves
Measure & record
Science-specific 0-1-2-3
5 Students make a graph of the data they gathered: Axes Line graph
Measure & record
Science-specific 0-1-2 0-1-2
6 Students interpret the results by relating two variables
Analyze Thinking 0-1-2
7 Students extrapolate the results Analyze Thinking 0-1-2
8 Students draw a conclusion about relationship
Conclusion Thinking 0-1-2
9 Students formulate support for their conclusion
Conclusion Thinking 0-1-2
10 Students relate the hypothesis to the conclusion
Conclusion Thinking 0-1-2
11 Students identify differences between plan and execution of experiment and explain reason(s) of differences or in absence of differences, give suggestions to improve the experiment
Evaluate Metacognitive 0-1-2
12 Students give suggestions to extend the experiment
Evaluate Metacognitive 0-1-2
13 Students draw a conclusion related to the context
Conclusion Thinking 0-1-2
14 Students formulate their learning gains about inquiry
Evaluate Metacognitive 0-1-2
maximum score 34

Chapter 3: assessing students’ ability in performing scientific inquiry:
44
Metacognitive self-report tests
Two metacognitive self-report tests were used. The first test was based on the Junior
Metacognitive Awareness Inventory (Jr. MAI), a self-report inventory for grades 3-5
developed by Sperling, Howard, Miller, & Murphy (2002). Jr. MAI has been used in other
research and proven to be a valid measure for metacognition (see Sperling et al., 2002 for
discussion). Moreover, Jr. MAI has been validated specifically for measuring metacognition
in young students and is therefore appropriate for our purposes. The test is easy to
administer and score.
Jr. MAI consists of 12 items with a three-choice response (never, sometimes, or
always). Of these 12 items, 6 items evaluate metacognitive knowledge. For example: I know
when I understand something. The other 6 items are directed at assessing regulation of
cognition. For instance, I think about what I need to learn before I start working. For the
present study, the 12 items were translated into Dutch by the researcher, an educational
scientist and a primary school teacher. The translations were then translated back into
English and compared with the original Jr. MAI of Sperling et al. (2002).
The second metacognitive self-report test - Science Meta Test (SMT) - was designed
to measure metacognitive self-regulatory skills, including orientation/planning, monitoring
and evaluation (Schraw & Moshman, 1995). In contrast to the more general Jr. MAI, items
were constructed specifically to obtain information about the extent to which
metacognitive skills are applied in the PAs. For example: While doing measurements, I
continued to verify that I was following my plan. Submitting the items to a small sample of
students showed that no reading or comprehension problems occurred. The final version of
the SMT consisted of 13 items with a three-point scale (not, a little, a lot).
Combined Cito scores
Most primary schools participate in a semi-annual assessment of The National Institute for
Educational Testing and Assessment (Stichting Cito Instituut voor Toetsontwikkeling) to
monitor students’ achievement. Scores are used to advise students for continuing
education. Since Cito scores of Reading comprehension and Arithmetic/mathematics
significantly correlate with other tests measuring general ability, Cito scores can be
considered a valid indication of general cognitive ability (Bartels, Rietveld, van Baal, &
Boomsma, 2002; De Jong & Das-Smaal, 1995; te Nijenhuis, Tolboom, Resing, & Bleichrodt,
2004). Because scores on these reliable standardized tests were available, a separate
cognitive ability test - which would have required additional time and effort for the schools
and students - was not administered.

instruments for measuring science skills in primary education
45
Ability is expressed by different levels which indicate the actual performance level of a
student compared to a norm group (A=upper 25% of all children, B=25% above mean,
C=25% below mean, D=next 15% below C, E=lowest 10%). As a result of the norm-based
interpretation, students’ test scores can be compared within and between grades. For
Reading comprehension and Arithmetic/ mathematics both reliability scores (indicated by
Accuracy of Measurement) are high, >.87 and >.95 respectively for grades 5 and 6 (Janssen,
Verhelst, Engelen, & Scheltens, 2010; Weekers, Groenen, Kleintjes, & Feenstra, 2011). For
this study, the mid-term tests scores were transformed into a five-point scale (A=5 to E=1).
A combined Cito score (CCS) was established by summing the scores of both tests.
Administration procedure
Research assistants administered the PPT to all 128 students in a classroom setting and the
PAs individually in groups of four to a maximum of eight students. Each research assistant
received extensive training and followed detailed protocols for test administration.
Tests were administered to all students on two separate occasions with a time
interval of 8-10 weeks. On each occasion tests were administered in the same order: first
one split half of the PPT followed by a performance assessment. Skateboard was
administered on the first occasion and the other two PAs on the second occasion. To
control for sequencing effects, administration of the PAs on the second occasion was
randomly rotated. The two metacognitive self-report tests were administered on the
second occasion after Bungee Jump.
Scoring procedure
All handwritten answers to open-ended questions for the PPT and PAs were transcribed to
typed text. By doing this, raters were not able to recognize or be influenced by
handwriting.
Three raters, all master students, received separate training for the scoring of open-
ended questions in the PPT and PAs. Before every training session, raters were provided
with the test material, the scoring rubrics and a set of answers of students reflecting
various performance levels. Interrater reliability was estimated by determining intraclass
correlation (ICC, two-way random, absolute agreement) for each rating session on a random
sample of an average of 12% of the scores. To avoid bias, raters were instructed to score
one item for all students before moving on to the next item. In this way, more sensitivity to
different performance levels regarding a particular item was achieved. Depending on the

Chapter 3: assessing students’ ability in performing scientific inquiry:
46
interrater agreement reached, additional discussion of rating differences was initiated.
After establishing satisfactory interrater reliability (varying from.71 to .92, single measures
ICC) administered tests were randomly distributed to be scored by individual raters. On
average, the rating process took 10 minutes per student for the PPT and 20 minutes per
student for a PA.
Method of analysis
The dataset contained the scores on all measures taken of a total of 128 primary school
students. Variables were examined for accuracy of data entry, missing values and
distributions. There were less than 5% missing values on the variables of the metacognitive
self-report tests and the Cito tests. Little’s MCAR test was not significant indicating that no
identifiable pattern exists for the missing data (χ² = 1596.125, df = 1593, p = .47). EM
imputation was performed for missing items of the metacognitive self-report tests.
Imputation for missing items of the Cito tests was not possible because only the overall
test score was available. All underlying assumptions (e.g., normality) were met.
Overall scores and reliabilities were calculated for all measures. In addition, scores
and reliabilities on subskill and step level were calculated for the PPT and PAs. Average
item scores were calculated for Jr. MAI and the SMT. Pearson zero-order and partial
correlations were calculated to examine discriminant and convergent validity.

instruments for measuring science skills in primary education
47
3.3 Results
Descriptive statistics
Table 3.3 presents the means and standard deviations for all measures. Both PPT and PAs
show normal distributions of scores, indicating that no floor or ceiling effects occur. All PAs
show relatively low means indicating a high difficulty level with an average of 31% of the
highest score possible. Four students had a score of 0 for Skateboard and for Bungee Jump,
and for Hot Chocolate, only two students had a score of 0. There is therefore no indication
of a substantial floor effect. A repeated-measures ANOVA revealed significant differences
between the three PAs (Wilks’ lambda = .921, F(2, 126) = 5.40, p = .006, ηp2 = .079). Pairwise
comparisons demonstrated differences between Skateboard and Bungee Jump (mean
difference 1.242, 95% CI [.191, 2.294], p = .015) and between Bungee Jump and Hot
Chocolate (mean difference .977, 95% CI [.102, 1.851], p = .023). When interpreting scores
as a measure of difficulty, these differences indicate that Bungee Jump is somewhat easier
than the other two PAs.
Table 3.3 means and standard deviations for all measures
max score min max M SD
PPT 60 11 49 31.12 8.67
PAs Skateboard 34 0 23 10.07 5.56 Bungee Jump 34 0 24 11.31 5.09 Hot Chocolate 34 0 21 10.34 4.88
Jr. MAI 3 1.50 2.75 2.32 .25 SMT 3 1.23 3.00 2.16 .31
CCS 10 2 10 6.92 2.23
Note: max score = maximum score possible of test min = minimum score of student max = maximum score of student
Scores (indicated by average item scores) on Jr. MAI are relatively high, while scores on the
SMT are more evenly spread. The mean of CCS shows that students perform around
average. For the PPT, Bungee Jump and Hot Chocolate girls outperformed boys. However,
results show that the boys had significant higher scores for Jr. MAI. Except for the PPT on

Chapter 3: assessing students’ ability in performing scientific inquiry:
48
which students in grade 6 scored higher than grade 5 students, there were no differences in
scores between grades.
Test reliabilities
In order to answer the first research question, test reliabilities were calculated. Cronbach’s
α coefficient for the PPT can be considered good (Table 3.4). Deleting items would not
substantially improve the reliability coefficient. The α-coefficients for the three PAs as well
as the metacognitive self-report tests indicate sufficient internal consistency.
Table 3.4 reliability coefficients of all measures (Cronbach’s α)
α
PPT .82
PAs Skateboard .72 Bungee Jump .67 Hot Chocolate .69
Jr. MAI .62 SMT .66
Note: see method section for reliability of the CCS
Relationship between science measures and combined Cito score (CCS)
To examine discriminant validity (research question 2), interdependency between science
measures and CCS was explored. Medium to large correlations (Cohen, 1988) were found
between CCS and respectively the PPT and PAs (Table 3.5). No significant correlations were
found between CCS and the two metacognitive self-report tests.
Relationship between science measures
To find evidence of convergent validity (research question 3), we explored to what extent
the overall scores for the different science measures correlate. Because findings show that
the sciences measures are related to the combined Cito score (Table 3.5) correlations were
controlled for the scores on this test.

instruments for measuring science skills in primary education
49
Table 3.5 correlations (Pearson’s r) between science measures and CCS as a reflection of general cognitive ability (df = 121)
CCS
PPT .67*
PAs Skateboard .51* Bungee Jump .55* Hot Chocolate .42*
Jr. MAI .04 SMT -.01
* correlations are significant at p < .001 (2-tailed)
Medium to large significant positive correlations were found between the PPT and all three
PAs (Table 3.6). Tests for comparing dependent correlations measured on the same
subjects (Steiger, 1980) revealed a significant difference between Bungee Jump and Hot
Chocolate and between Bungee Jump and Skateboard (Z = 1.96, p = .05). The average
correlation between the three PAs is higher (r = .48) than between the PPT and the PAs (r =
.39), indicating that the PAs tap into somewhat different skills than the PPT. Still, the
medium to large correlations between the PPT and the three PAs reinforce that both test
formats measure a common core of similar skills, other than that of general cognitive
ability alone.
Table 3.6 correlations (Pearson’s r) between science measures controlling for CCS (df = 120)
1 2 3 4 5
1. PPT
PAs 2. Skateboard .43* 3. Bungee Jump .34* .42* 4. Hot Chocolate .40* .46* .57*
5. Jr. MAI -.11 .04 .04 .05 6. SMT -.02 .12 .20** .19*** .65*
* correlations are significant at p < .001 (2-tailed) ** p = .029 *** p = .038

Chapter 3: assessing students’ ability in performing scientific inquiry:
50
No significant correlations occurred between Jr. MAI and the PAs. These results may
indicate that the general metacognitive skills measured by the Jr. MAI were not reflected
by the PAs. An alternative explanation may be that the Jr. MAI lacked the sensitivity to
measure metacognitive skills.
The SMT, designed specifically to obtain information about the extent to which
metacognitive skills are applied in the PAs, correlated significantly with Bungee Jump and
Hot Chocolate but not with Skateboard. Although correlations are small, this might indicate
that the metacognitive skills measured in the PAs may be of a more task-specific nature
than those obtained by measuring general metacognitive skills.
Additional diagnostic information on subskill and step level
Descriptive statistics
In order to answer research question 4, we explored whether an analysis on subskill and
step level provided additional diagnostic information about students’ performance levels.
Each item in the assessments was assigned to the subskill that most underlaid the
concerning activity. Then, scores of each scale were obtained, which reflected the main
underlying skill applied to that particular cluster of activities. To explore how students
performed in the particular aspects of the empirical cycle, scores per step level were also
calculated.
Table 3.7 means and standard deviations of standardized scores (0-10) on subskill and step level
PPT PA total
M SD M SD M SD
subskill
Thinking 5.63 1.52 3.00 1.53 4.14 1.33 Science 4.67 1.73 3.26 1.59 3.83 1.49 Meta - - 2.99 1.54 2.99 1.54
step empirical cycle
Research question 7.73 2.28 4.71 2.79 6.22 2.12 Design experiment 3.95 3.24 2.76 1.60 3.01 1.53 Hypothesis 6.22 2.20 4.60 2.52 5.47 1.90 Measure and record 3.84 1.84 3.21 1.98 3.53 1.69 Analyze 6.21 1.64 2.76 2.02 4.62 1.51 Conclusion 4.88 2.13 2.73 1.59 3.21 1.43 Evaluation - - 2.99 1.54 2.99 1.54

instruments for measuring science skills in primary education
51
In Table 3.7 the descriptive statistics on subskill and step level are given for all measures.
To facilitate comparison between tests, scores were converted to standardized scales
between 0 and 10. Means and standard deviations show that on subskill level scores are
somewhat low but similar within tests. Scores on step level are more evenly spread within
tests, indicating differences between steps in terms of difficulty. Examining the scores for
the PPT shows, for instance, that designing an experiment (3.95) seems to be more difficult
than formulating a hypothesis (6.22). In general, scores on step level are higher for the PPT
than for the PAs, suggesting that different test formats elicit the same skills but are
applied in different ways (see also Table 3.3). For instance, formulating a research question
is not the same as identifying a research question from amongst different multiple-choice
options.
Reliabilities on subskill and step level
In Table 3.8, scale reliabilities on subskill level are presented for the PPT and the PAs.
Because the three PAs are similar in respect to format, wording, number of items and
structure, separate scores could be combined to obtain a reliable aggregated score. By
doing so, variance caused by task effects was reduced.
Table 3.8 scale reliabilities of items measuring the same subskill per tests and aggregated for the PPT, PAs, and PAs together (Cronbach’s α)
thinking science meta total
PPT .73 .69 - .82
PAs Skateboard .59 .55 .36 .72 Bungee Jump .58 .31 .37 .67 Hot Chocolate .53 .54 .36 .69
aggregated scores of PAs .77 .74 .64 .86
Note: aggregated scores represent scores for all three performance assessments as one construct
Internal consistency specified by Cronbach’s α indicates coherent scales on subskill level.
In addition to presenting Cronbach’s α for scales on subskill level (Table 3.8), also the
internal consistency on step level was investigated. Table 3.9 presents scale reliabilities on
step level for the PPT and the PAs. The items of the PAs assigned to metacognition
represent the evaluation step as well. Cronbach’s α coefficients are in general weak to
moderate, indicating that ability scores on the level of the steps should be interpreted with
caution.

Chapter 3: assessing students’ ability in performing scientific inquiry:
52
Table 3.9 reliability of the paper-and-pencil test (PPT) and the performance assessments (PA) on empirical step level indicated by Cronbach α
PPT PA
number of items α
number of items α
Research question 6 .53 3 .54 Design experiment 4 .58 3 .56 Hypothesis 5 .26 3 .44 Measure and record 12 .62 6 .59 Analyze 12 .56 6 .47 Conclusion 7 .37 12 .66 Evaluation - - 9 .64
Relationship with combined Cito score (CCS)
To investigate to what extent general cognitive ability influences ability on subskill level,
correlations were calculated for each subskill. Large correlations were found between CCS
and the subskills thinking and science-specific (Table 3.10). For metacognition, the
correlation with CCS is small, indicating that items in which metacognitive skills are called
upon may tap less into general cognitive ability, reflected by CCS, than do thinking and
science-specific items. However, this result might also be explained by the small number of
items used to measure metacognitive skills. Alternatively, a study by Veenman, Wilhelm
and Beishuizen (2004) showed that in this age group, students’ metacognitive skills are
better able to predict learning performance than their intellectual ability. This was
attributed to the fact that the tasks in the experiment were too complex for the students.
The small correlation between the metacognitive items and the CCS may be attributable to
a similar effect.
Table 3.10 correlations (Pearson’s r) between scores on subskill level and CCS (df = 121)
CCS (general cognitive ability)
PPT thinking .59* PPT science .61* PA thinking .51* PA science .55* PA metacognitive .27**
* correlations are significant at p < .001 (2-tailed)** p = .003

instruments for measuring science skills in primary education
53
Table 3.11 shows significant correlations between CCS and scale scores on step level. In
general, correlations are medium for each step of the empirical cycle, with the exception of
“Hypothesis” in the PPT and “Evaluation” in the PA, indicating that general cognitive ability
reflected by CCS substantially influences performance on step level.
Table 3.11 correlations (Pearson’s r) between scores on step level and CCS (df = 121)
CCS (general cognitive ability)
PPT PA
Research question .48* .39* Design experiment .33* .42* Hypothesis .28** .47* Measure and record .57* .48* Analyze .57* .38 Conclusion .46* .42* Evaluation - .27***
* correlations are significant at p < .001 (2-tailed) ** p = .002 *** p = .003
Relationship between subskills and steps of the empirical cycle
For further exploration of the relation between the subskills, correlations were calculated
for the PPT and the aggregated PA-scores and controlled for by CCS (Table 3.12). The SMT
did not correlate significantly with items assigned to thinking skills or to science-specific
skills. However, the SMT did correlate significantly with items assigned to metacognitive
Table 3.12 correlations (Pearson’s r) between subskills, controlled for CCS (df = 120)
PPT
thinking PPT
science PA
thinking PA
science PA
meta Jr. MAI
PPT thinking PPT science .40* PA thinking .29** .20** PA science .38* .45* .45* PA meta .35* .17 .44* .28** Jr. MAI -.14 -.03 .02 .03 .11 SMT -.04 .01 .13 .17 .21** .65*
* correlation is significant at p < .001 (2-tailed) ** correlations are significant at p < .05 (2-tailed)

Chapter 3: assessing students’ ability in performing scientific inquiry:
54
skills, indicating that thinking and science-specific items measure other skills than do the
metacognitive items.
Correlations between the different steps of the empirical cycle were calculated for the PPT
and the aggregated PA scores controlling for CCS (Table 3.13).
Table 3.13 correlations (Pearson’s r) between steps of the empirical cycle, controlled for by CCS (df = 120)
1 2 3 4 5 6 7 8 9 10 11 12
1. PPT research question2. PPT design .03 3. PPT hypothesis .37* .03 4. PPT measure & record .30* .14 .165. PPT analyze .27* .10 .35* .32*
6. PPT conclusion .14 .15 .27** .25** .47** 7. PA research question .22** .12 .19** .17 .18 .028. PA design .20** .05 .22** .39* .31* .17 .25*
9. PA hypothesis .06 .04 .21** .13 .24* .20** .25* .19**
10. PA measure & record .04 -.03 .26** .41* .26* .30* .24* .41* .26*
11. PA analyze .14 .14 .19** .13 .21** .15 .33* .25* .26* .26*
12. PA conclusion .16 -.03 .14 .15 .23** .09 .38* .32* .18** .21** .57*
13. PA evaluation .07 .23** .34* .17 .27* .06 .16 .29* .25* .18** .36* .37*
* correlation is significant at p < .001 (2-tailed) ** correlations are significant at p < .05 (2-tailed)
The positive, significant correlations between all steps of the PAs and between most
corresponding steps of the PPT and PAs indicate mutual cognitive demands of the
activities. In contrast, correlations between steps of the PPT are more erratic. Differences
may be explained by the productive application of skills required for PAs and some items in
the PPT, in contrast to the more receptive way (students are asked to choose between
alternative answers) skills are applied in most items of the PPT. This can be illustrated by
the small correlation of .05 between the PPT and PAs concerning the activity of designing
an experiment.
instruments for measuring science skills in primary education
55
3.4 Conclusion and discussion
The present study shows that science skills can be measured reliably in grades 5 and 6. By
categorizing items systematically on subskill and step level, sufficient reliabilities for the
different science measures (PPT, PAs, and metacognitive self-report tests) can be obtained.
The results of previous research (cf. Pine et al., 2006; Roberts & Gott, 2006), showing that
students’ ability to perform a scientific inquiry is significantly related to their general
cognitive ability, are reaffirmed in this study provided the combined Cito scores are
interpreted as a reflection of general cognitive ability. Correlations between CCS and the
PPT and PAs varied between .42 and .67 indicating that - despite the fact that some overlap
still exists with general cognitive ability - a different construct is being measured. This
implies that the tests primarily measure skills other than general cognitive ability.
Former research gave ample evidence that convergent validity between different
tests for measuring science skills is difficult to establish (cf. Hammann et al., 2008; Pine et
al., 2006). This lack of convergence between tests intending to measure similar science
skills suggests that items within these tests do not equally appeal to underlying cognitive
abilities. As demonstrated in this study, categorization of items in relation to science-
specific, thinking and metacognitive skills results in more systematic test construction and
thus provides evidence for convergent validity. In addition, using the steps (activities) of
the empirical cycle as a blueprint ensures that within tests all aspects of scientific inquiry
are incorporated (Messick, 1994; Mislevy & Haertel, 2006). The added value of this two-way
approach is confirmed by the significant correlations between measurement instruments
found in this study. This shows that lack of convergence between tests can be reduced. It
should be emphasized that this applies to the relation between the PTT and PAs but also to
the mutual relationship between the PAs. Although differences in difficulty level between
PAs exist, the significant correlations provide evidence that inconsistencies as reported in
prior studies (e.g., Pine et al., 2006) can be reduced considerably and that the problem of
occasion sampling variability can be tackled by administering more than one PA. The
implication is that for reliable assessment of science skills, the implementation of multiple
PAs should be considered. Also, instead of using one assessment format to assess students’
performance of a scientific inquiry, a greater variety of test formats may provide a clearer
picture of students’ abilities (Gott & Duggan, 2002).
Previous studies showed that metacognitive skills have a positive influence on
performing scientific inquiry (White & Frederiksen, 1998). In this study, no relations were
found between the Jr. MAI, measuring general metacognitive ability, the PPT and all three

Chapter 3: assessing students’ ability in performing scientific inquiry:
56
PAs. By contrast the SMT, constructed to obtain specific information about application of
metacognitive abilities in performing science tasks, shows significant - although small -
correlations with two PAs. This indicates that it is preferable to assess metacognition in
performing scientific inquiry with items that are related to metacognitive activities in which
students have a clear understanding of both science context and task. For young children,
this may be especially essential.
The low or even lack of consistency between students’ ability in performing
scientific inquiry and their metacognitive self-assessment may be explained by the fact that
students overestimate their own metacognitive skills. The scores on both the Jr. MAI and
the SMT reveal that most students assess their own level of metacognition above the scale
mean. It is therefore conceivable that many students in grades 5 and 6 are not yet able to
utilize these metacognitive abilities while performing science tasks or, alternatively, simply
do not master these skills even though they think they do. The latter seems most likely,
given the low scores on the three items measuring specific metacognitive activities in the
PAs (see Table 3.7). This is in line with Veenman, Van Hout-Wolters, and Afflerbach (2006, p.
9) who argued that scores on questionnaires “hardly correspond to actual behavioral
measures during task performance”. This is also consistent with the science curriculum in
the Netherlands in which little to no attention is being paid to the acquisition of
metacognitive skills in science lessons. The implication is that - when students do not yet
show possession of the metacognitive skills with which to assess their own capabilities - it
may be more appropriate to use other measurement methods such as thinking aloud
methods.
Assessment in primary schools is dominated by recall of procedural knowledge and
the practicalities of an inquiry but typically neglects the critical evaluation of results and
own performance of the tasks (Osborne, 2014; Osborne & Dillon, 2008; Roth, 2014). By
systematically including a more diverse set of items appealing to all cognitive abilities in
both PPT and PAs a more valid representation of all aspects of scientific inquiry was
obtained. In particular in the PAs, students obtained data by handling materials
representing the practical aspects of the scientific inquiry. However, the larger part of the
PAs included items in which students analyzed their own data and evaluated their own
findings and performance, reflecting aspects of all three domains of activities (NRC, 2012).
The last research question concerned the extent to which the measurements may
provide additional diagnostic information on subskill and step level. To that end, each
activity performed in a scientific inquiry was classified by determining the primary skill
underlying the activity. Although all subskills were applied in the assessments in an
integrated manner (van Merriënboer, Clark, & de Croock, 2002), correlations between mean

instruments for measuring science skills in primary education
57
scores of each subskill scale - consequently reflecting the main underlying skill applied in
that particular cluster of activities - between the different measures indicate that a more
precise identification of students’ ability in performing scientific inquiry may be allowed.
The acceptable scale reliabilities on subskill level for the PPT or aggregated across PAs
indicate that scores can be used to obtain diagnostic information in addition to overall test
scores. To illustrate, when scores on subskill level of the PPT (consisting primarily of
multiple-choice items) are compared with the PAs, the scores on subskill level in the PAs
are lower. This may indicate that it is more difficult for students to report their findings and
formulate their own answers than to choose between alternative answers. This is also
demonstrated by the small to medium correlations on subskill level between the different
assessments (PPT and PA) indicating that the assessments on subskill level may differ. Also,
concerning the PAs, it seems that on average students have more difficulty in completing
items in which primarily thinking and metacognitive skills underlie the activities, compared
to science-specific skills.
The systematic assembly of all aspects of a scientific inquiry can also create
opportunities for evaluating students’ scores at a more precise level. Within tests,
differences between students’ performance of the different activities of the empirical cycle
are manifest. For instance, results on empirical step level show that students appeared to
have more difficulty in designing an experiment than in formulating a research question.
Moreover, scores for “measure and record” were low in both the PPT and PA, as were the
scores for “analyze” and “conclusion” in the PA. A possible explanation for these findings
may be that in both the PPT and PA, the step of measure and record included items in
which students had to make a table and a graph. Being novices in performing a scientific
inquiry, students most likely did not have the procedural knowledge to complete these
items.
Nevertheless, it can be suggested that the operationalization of subskills and
activities in the present study is rather indefinite. The subskill thinking, for example, still
comprises a variety of mental processes such as problem-solving, making decisions, or
creative thinking. And although items concerning, for example, designing an experiment
were mainly categorized as science-specific based on the criterion that science-specific
skills prevail in this activity, thinking and metacognitive skills are involved as well. This
notion could also explain the small to medium correlations that exist between the different
subskill scales within the assessments. This, together with the relatively low Cronbach α
coefficients on subskill and step level, implies that estimating students’ development on
scale level should be made with caution. A measurement with more items specifically aimed
at only thinking or other skills may improve test validity and reliability but carries the risk of

Chapter 3: assessing students’ ability in performing scientific inquiry:
58
becoming too detailed. Assessing all single aspects of the science skills separately may not
have the same quality as assessing all aspects together in an integrated manner (Moseley
et al., 2005), or in other words, the whole is more than the sum of its parts.
The constrained and scaffolded PAs seem suitable for students in primary education
who are novices in performing scientific inquiry and do not yet master the required skills,
although previous research shows that there is much variation between students in what
they are capable of in terms of performing a scientific inquiry (Duschl, Schweingruber, &
Shouse, 2007). The relatively low score means of the PAs suggest that, when exposed to
actual teaching and practice of science skills, the PAs have potential to measure progress of
students’ skill ability. Furthermore, the added value of the measures is that by structuring
items by subskill and step level, the opportunity to see how students perform on a
cognitive and more detailed level is provided, as opposed to merely holistically assessing
performance of a scientific inquiry. Such measures are not only suitable for assessing
students’ mastery level of science skills, but they may provide teachers with additional
diagnostic information to adapt their instructions and foster the learning process of their
students.
These measures may also stimulate teachers to implement assessments in their
classrooms. Teachers are mostly concerned with science activities in the curriculum, often
neglecting to assess what students have learned during these activities (Harlen, 1991). To
some extent this may be attributed to lack of confidence with the use of more extensive
tasks than with the easy-to-administer-and-grade tests containing primarily multiple-choice
items (Harlen, 1991). Using a constrained PA may be less of an obstacle for teachers
because of the more structured design and layout of the test. In addition, the particular
format provides the opportunity to implement only parts of the PAs so that testing can be
spread over more than one occasion. Moreover, the PAs can be embedded in science
lessons as part of instruction material. It can be a start for familiarizing teachers with
alternative assessment formats and may lead to greater confidence to implement more
interesting and open inquiry tasks as students develop more skill expertise. Such tasks may
eventually include aspects of scientific inquiry which are more complex and demand more
of students’ skill proficiency and amount of content knowledge. For instance, asking
students to engage in argumentation about different experimental designs and connect
their findings to bigger ideas in science (Osborne, 2014).
In primary education the acquisition of science skills is generally measured without
systematically taking into account the complexity of underlying cognitive demands that
students need to simultaneously apply in relation to different activities when conducting a
scientific inquiry. Categorizing items on both subskill and step level provides more

instruments for measuring science skills in primary education
59
opportunities for systematic test construction and improves concurrence of measurement
instruments with different key content and formats such as a PPT and a PA. Furthermore,
identifying and separating the various cognitive demands in assessments can help to
evaluate and subsequently remedy the shortcomings of the particular skills and may also
increase the emphasis in classrooms on the minds-on part of a scientific inquiry (Kind,
2013). As argued by Roth (2014), assessment of skills is important because it assures that
skills are taught.

60
61
4
effects of explicit instruction
on the acquisition
of students’ science inquiry skills
in grades 5 and 6
of primary education
Chapter 4: effects of explicit instruction
62
ABSTRACT
In most primary science classes, students are taught science inquiry skills by way of learning
by doing. Research shows that explicit instruction may be more effective. The aim of this
study is to investigate the effects of explicit instruction in an inquiry-based learning setting
on the acquisition of inquiry skills for students in primary education. Participants included
705 Dutch 5th and 6th graders (aged 10-12 years). Students in an explicit instruction
condition received an 8-week intervention of explicit instruction on inquiry skills. In the
lessons of the implicit condition, all aspects of explicit instruction were absent. Students in
the baseline condition followed their regular science curriculum. In a quasi-experimental
pretest-posttest design, two paper-and-pencil tests and three performance assessments
were used to examine the acquisition and transfer of inquiry skills. Additionally,
questionnaires were used to measure metacognitive skills. Results of a multi-level analysis
controlling for pre-tests, general cognitive ability, age, gender and grade-level indicated
that explicit instruction facilitates the acquisition of science skills. Even though the paper-
and-pencil test shows no effect, the scores on the performance assessment with a topic
familiar to students show that students in both intervention conditions have significantly
higher scores than students in the baseline condition. When skills are measured by means
of a performance assessment with an unfamiliar topic, only students in the explicit
condition outperform students of both the implicit and baseline condition. Therefore, this
study provides a strong argument for including an explicit teaching method for developing
inquiry skills in primary science education.
Based on
Kruit, P. M., Oostdam, R. J., van den Berg, E., & Schuitema, J. A. (2018). Effects of explicit
instruction on the acquisition of students’ science inquiry skills in grades 5 and 6 of primary
education. International Journal of Science Education, 40 (4), 421-441.
DOI: 10.1080/09500693.2018.1428777

on the acquisition of student's science inquiry skills in grades 5 and 6 of primary education
63
4.1 Introduction
Scientific inquiry in primary classrooms generally involves designing, conducting and
interpreting results of scientific investigations (National Research Council (NRC), 2012).
These investigations are intended to teach skills that are considered important in science,
such as formulating a research question and analyzing data. One of the intended outcomes
is that students develop an understanding of why and how scientific investigations are
done (Crawford, 2014). Skills for scientific inquiry are usually - if at all - taught by teaching
methods primarily based on learning by doing (Duschl, 2008; Roth, 2014). In the
Netherlands for instance, inquiry-based learning is advocated in primary education as the
preferred method for acquiring content knowledge, science skills and epistemic knowledge
(van Graft & Kemmers, 2007). In inquiry-based learning, students are encouraged to
discover scientific knowledge and inquiry skills by performing authentic tasks (Kirschner,
Sweller, & Clark, 2006). Proponents of inquiry-based learning argue that students learn best
by actively constructing knowledge. Also, performing authentic inquiries is generally
believed to be motivating for students (Gott & Duggan, 1995). As a result, many educators
and curriculum developers have strongly recommended inquiry-based learning for science
lessons (Kuhn, Black, Keselman, & Kaplan, 2000; Osborne & Dillon, 2008).
There is a growing body of research showing that explicit instruction is necessary to
develop inquiry skills (Klahr & Nigam, 2004; Lazonder & Harmsen, 2016; Toth, Klahr, & Chen,
2000). Several studies have investigated the effects of explicit instruction on skill
development in the laboratory setting, in particular on the strategy of controlling variables
(CVS). Only a few studies have compared the effects of inquiry-based learning using explicit
instruction with an inquiry-based approach absent of explicit instruction. The aim of this
study is to investigate the effects of explicit instruction in an inquiry-based learning setting
on the acquisition of inquiry skills for students in primary education.
Categorization of skills
In order to understand how students learn and how to support learning, the current
literature generally encourages the consideration of skill categories in scientific inquiry
(Duschl, Schweingruber, & Shouse, 2007; Schraw, Crippen, & Hartley, 2006; Zohar & Dori,
2003).
In this study, the notion science-specific inquiry skills is used to denote a student’s
ability to design and execute scientific investigations. A distinguishing feature of these

Chapter 4: effects of explicit instruction
64
inquiry skills is that they are directed to a correct application of rules, principles or
conventions about the set-up and execution of an investigation (Millar & Lubben, 1996).
Planning and performing an investigation requires explicit knowledge about how to
conduct scientific experiments such as identifying and controlling variables, observing and
measuring, using simple measurement devices, and recording, organizing and analyzing
data (Gott & Murphy, 1987; NRC, 2012).
While engaging in scientific inquiry, students apply more general thinking skills to
make sense of the data and connect observations to scientific theories (Osborne, 2015).
Thinking skills refer to mental activities such as problem solving, decision-making, inductive
versus deductive reasoning and evaluating solutions (Sternberg, 1986). Thinking skills are
employed in scientific inquiry when making appropriate inferences from various sources of
data and by drawing adequate samples for making inferences (Pintrich, 2002).
Knowledge and application of metacognitive strategies may regulate students’
thinking and learning, thus supporting science inquiry (for overview, see Zimmerman, 2007).
Metacognitive skills include planning, monitoring and evaluating task performance.
Research shows that students do not apply metacognitive strategies spontaneously.
Making students aware of such helpful strategies has shown to improve performance of
inquiry activities (White & Frederiksen, 1998).
For science education it is relevant to consider the reciprocity of skill development
and content knowledge. Content knowledge is most often referred to as a conceptual
understanding of facts, concepts, theories and principles (Sternberg, 1986; OECD, 2017). A
number of studies have shown that content knowledge is, to a certain extent, a
prerequisite for skill development (Eberbach & Crowley, 2009; Kuhn, Schauble, & Garcia-
Mila, 1992). In particular, when students generate hypotheses, make observations, evaluate
evidence and draw conclusions, prior content knowledge can have a major effect on skill
development (Duschl et al., 2007; Millar & Driver, 1987).
Explicit skill instruction
Although there is evidence pointing to the acquisition of skills through learning by doing
(Dean & Kuhn, 2007), a growing number of studies indicates that more effective learning
occurs when inquiry-based learning is accompanied with explicit skill instruction (Duschl et
al., 2007; Kirschner et al., 2006; Lazonder & Harmsen, 2016). Due to limited experience,
most students in primary education lack sufficient mastery of strategies and knowledge to
effectively conduct a scientific inquiry. Without explicit skills instruction, this leads to
ineffective performance of scientific inquiry (Kirschner et al., 2006; Klahr & Nigam, 2004).

on the acquisition of student's science inquiry skills in grades 5 and 6 of primary education
65
Engaging in a complex task of scientific inquiry without explicit skills instruction is
particularly challenging for inexperienced students since their cognitive information
processing capacity is still limited (Flavell, 1992). According to the Cognitive Load Theory
(CLT), working memory is limited in its capacity to process new information that contains
multiple elements. Elements have to be organized in more complex units and stored in
long-term memory before the information can be used effectively (van Merriënboer &
Sweller, 2005). Once this is achieved, information stored in long-term memory is accessible
when needed, aiding the acquisition of inquiry skills (Kirschner et al., 2006).
Much of what is known about the effects of explicit instruction comes from studies
on CVS (Lazonder & Egberink, 2014; Matlen & Klahr, 2013). For example, Chen and Klahr
(1999) found in an intervention study with third and fourth graders that explicit instruction
combined with probing questions (i.e., why they designed the investigations the way they
did and what they had learned) was an effective way of learning how to apply CVS. This is in
line with CLT because explicit forms of instruction put less of a burden on working memory
when learning new information (Kirschner, et al., 2006). Dean and Kuhn (2007) showed that
in particular explicit instruction (in which students were asked to compare and identify
different features of catalogs) improved students’ CVS more when combined with practice.
The positive effects of explicit instruction may also apply to the acquisition of
metacognitive skills. Explicit attention to awareness of the task and the metacognitive
strategies may facilitate skill development (Pintrich, 2002; Tanner, 2012; Zohar & Dori,
2003).
Explicit skills instruction seems to be particularly important for fostering transfer of
learning. More robust learning of skills has only been achieved when students are able to
apply the skills in contexts other than the one in which the skills are learned. Although
there is not a clear-cut definition of what different transfer distances entail (Chen & Klahr,
1999), near-transfer can generally be defined as the application of skills in tasks within a
particular knowledge domain or with a common structure. Far-transfer is defined as the
application of skills in tasks in different domains or tasks with an unfamiliar structure
(Strand-Cary & Klahr, 2008).
While achieving transfer across knowledge domains (i.e., topics) is generally difficult
(Kuhn et al., 1995; Lazonder & Egberink, 2014), some CVS studies have shown that explicit
instruction can facilitate transfer of skills to other tasks with different topics (Klahr & Li,
2005; Kuhn et al., 1995). Likewise, research indicates that young students tend to fail in
using the same strategies for performing tasks with different topics (cf. Chen & Klahr,
1999). Making students explicitly aware of the strategies and skills that they are applying to

Chapter 4: effects of explicit instruction
66
a particular task leads to enhanced mastery which in turn may facilitate transfer (Adey &
Shayer, 1993; Chen & Klahr, 1999; Georghiades, 2000).
Four-component instructional design
When designing science lessons aimed at the development of science skills, the four-
component instructional design (4C/ID) model can be applied. The model may be in
particular suitable because the model focuses on the integration and performance of skills,
as opposed to content knowledge (van Merriënboer, Jelsma, & Paas, 1992). Furthermore,
the model recommends a combination of tasks in which skills are first practiced separately
and then applied in more complex tasks in an integrated manner (van Merriënboer, Clark, &
de Croock, 2002). Most of the difficulty in learning complex skills such as science skills is in
applying them simultaneously. In existing design models, it is often assumed that complex
skills acquired in simple tasks will be applied spontaneously to new and more complex tasks
despite considerable evidence to the contrary (van Merriënboer et al., 2002, p. 40).
According to the 4C/ID model, therefore, the following components are essential for
developing skills: (1) whole learning tasks, (2) part-task practice, (3) supportive information,
and (4) just-in-time information.
Whole-tasks represent authentic and meaningful scientific inquiries. Students
receive explicit instruction and additional skills practice in part-tasks. The acquired skills can
then be directly applied to more complex whole-tasks. This enables students to see the
interrelationships between part-tasks and the task as a whole, stimulating the integration
of skills (van Merriënboer et al., 2002). By segmenting the complex scientific inquiry activity
into manageable smaller and structured part-tasks in which students can learn and practice
skills, performance can be enhanced (Lazonder & Egberink, 2014; Lazonder & Kamp, 2012).
Whole-tasks and part-tasks are preferably combined and sequenced from relatively simple
to more complex (van Merriënboer & Sweller, 2005; Wu & Krajcik, 2006).
The structuring of the whole-tasks and part-tasks can be effectuated in science
lessons by using the different steps of the empirical cycle as a design principle: (1)
formulating a research question, (2) formulating hypotheses, (3) designing an experiment,
(4) measuring and recording data, (5) analyzing and interpreting data, and (6) evaluating the
outcomes in relation to the research question and hypotheses. Although it is generally
acknowledged that scientific inquiry is not a linear process (NRC, 2012), the subsequent
activities of the empirical cycle provide a structure that is recognizable for students. It also
gives an understanding of how the inquiry process may be organized, which is particularly

on the acquisition of student's science inquiry skills in grades 5 and 6 of primary education
67
important for students in primary education who have little experience with scientific
inquiry (Donovan, Bransford, & Pellegrino, 1999; White & Frederiksen, 1998).
Another aspect of the 4C/ID model is supportive information, which comprises the
information students do not possess needed for performing a particular scientific inquiry.
Finally, just-in-time information refers to essential clues, knowledge or feedback students
have access to the moment they need it during task performance. Just-in-time information
can consist of prompts which are gradually withdrawn as students gain proficiency (McNeill
et al., 2006). Prompts can take the form of generic ‘probing questions’ or hints to
encourage reflection which helps students to set goals and monitor their understanding
(Sahin & Kulm, 2008). Eventually, prompts can gradually be withdrawn until students can
apply the acquired skills independently (White & Frederiksen, 2000).
An example of implementing prompts for explicit instruction of metacognitive skills
is the application of the TASC framework. TASC stands for “Thinking Actively in a Social
Context” and aims to give young students structure to support their thinking (Wallace,
Bernardelli, Molyneux, & Farrell, 2012). Students can be instructed on how to move
systematically through the stages of the TASC
framework while performing a task. In each stage,
several questions can be raised to stimulate
students to monitor and evaluate their
performance (Figure 4.1). For instance, the
students are asked to think about what they
already know about the topic of an experiment,
how much information they already have, and
what information they need (Wallace et al., 2012).
These questions are introduced and eventually
withdrawn gradually until students are familiar
with the questions and apply the metacognitive
skills in each following experiment by themselves
(White & Frederiksen, 2000).
The present study
The present study adds to the current discussion by investigating the effects of explicit
instruction on the acquisition of inquiry skills in classroom settings in grades 5 and 6.
Furthermore, it examines to which extent the acquired skills are utilized in tasks with
Figure 4.1 TASC Framework

Chapter 4: effects of explicit instruction
68
content different from the tasks used in the science lessons. Contrary to most studies
(Shavelson et al., 1991), skills were not only evaluated by a paper-and-pencil test, but also
by more authentic performance assessments. Additionally, questionnaires were used for
evaluating improvement in metacognitive skills.
The following research questions concerning explicit skill instruction in grades 5 and
6 were addressed: (1) What are the effects on students’ skills in scientific inquiry?, and (2)
What are the effects on transfer of students’ skills across science tasks with unfamiliar
content?
In line with current knowledge on enhancing skill development, it was hypothesized
that receiving explicit skill instruction would positively affect students’ science skills and
that the merits of explicit instruction would also extent to transfer of students’ skills.

on the acquisition of student's science inquiry skills in grades 5 and 6 of primary education
69
4.2 Method
Participants
This study was conducted at 12 schools for primary education in the Netherlands. It
involved schools that were part of the school network with which the teacher training
education of the Amsterdam University of Applied Sciences cooperates. As a result, the
schools were located in the urbanized part of the Netherlands. Schools were willing to
participate on the basis of several pragmatic factors including permission of school
authorities, interest of teachers, willingness to do something with science and available
time.
To ensure that the reading and writing abilities of students would not be a limiting
factor in relation to the acquisition of science skills, only students in upper grades were
included. In total, 705 students participated in the study (51.3 % boys and 48.7 % girls) with
a mean age of 11,5 (SD = .69) from 31 grade 5 and 6 classes (53.3 % in grade 5 and 46.7 % in
grade 6).
Research design
The research constituted a quasi-experimental study with pretest-posttest design,
implemented in grades 5 and 6 of primary schools, designed to investigate the effects of
explicit instruction on students’ acquisition of inquiry skills (explicit condition). A control
condition was included with lessons in which skills were taught in an inquiry-based
approach without explicit instruction on inquiry skills so that information about the added
value of explicit instruction could be obtained. To contrast both controlled conditions with
regular science lessons at schools, a baseline condition was added. Randomization was
carried out within schools at class level.
A total of 705 students participated in the pre-test sessions. Pre-testing included
three different measures: a paper-and-pencil-test (PPT), a performance assessment (PA)
and a metacognitive self-report test (Jr. MAI). After an 8-10 week period students of all
three conditions were tested again with a PPT, two PAs (PA-related-content with a topic
discussed in lessons of both interventions and PA-transfer with an unfamiliar topic designed
to measure transfer of skills), Jr. MAI and an extra metacognitive self-report test (SMT).
Additional measures for the explicit and implicit conditions included an implementation
checklist on class level and a questionnaire for evaluating how enjoyable the lessons were
perceived by the students.

Chapter 4: effects of explicit instruction
70
PAs were administered in small groups of students outside of the regular classroom, which
required additional time and effort for the schools and students. Therefore, to reduce the
burden, a subsample (n = 467) was randomly selected to partake in the post-test PAs. The
subsample was created by random selection of students in each class. To enable
comparison between tests, only students who had completed all tests were included for
final analysis. Of the subsample, 62 students were excluded due to having been absent
from one of the test sessions. Finally, one class which consisted of only two students was
dropped from the analysis to prevent estimation bias in multilevel analysis (Maas & Hox,
2005). The final sample consisted of 403 students (Figure 4.2).
Figure 4.2 overview of the study design
Intervention
The lessons for the intervention were developed by the first author and a primary school
teacher. The aim was to enhance development of skills associated with scientific inquiry.
Each intervention consisted of eight lessons of 90 minutes each. In general, one lesson was
given per week. During this time, students in the baseline group followed their regular
curriculum and did not receive any formal instruction on scientific inquiry.

on the acquisition of student's science inquiry skills in grades 5 and 6 of primary education
71
Explicit condition
The lessons for the explicit condition were designed based on the 4C/ID model of Van
Merriënboer et al. (1992). The whole-tasks and part-tasks were structured according to the
different steps of the empirical cycle. The topic was heat and temperature. The content
knowledge was minimized in the sense that it was addressed at such a low level such that it
could be assumed that it would pose no obstacle in skill application. For instance, students
at grade levels 5 and 6 are aware of the fact that hot water cools down and that
temperature can be measured by using a thermometer.
Explicit instruction concerned clarifying the rationale of inquiry skills by the teacher
followed by examples and classroom discussions about how to apply the skills. In part-tasks,
the newly learned skills were then practiced with the support of written prompts. For
example, in learning how to formulate a research question, the teacher gave explicit
instruction about the criteria for formulating research questions with the help of a flow
chart (Figure 4.3). In subsequent part tasks where students were asked, for instance, to
distinguish between properly and poorly formulated research questions, students were
Figure 4.3 flow chart with criteria for formulating a research question

Chapter 4: effects of explicit instruction
72
reminded of the flow chart. Next, students performed a whole-task: an authentic,
structured inquiry in which students had to apply all skills in an integrated manner. In these
whole-tasks, prompts were explicitly incorporated as well. Development of metacognitive
skills was supported by the use of probing questions from the TASC framework prior to and
during each whole-task (Wallace et al., 2012).
During the course of the intervention, the whole-task inquiries gradually increased in
difficulty and complexity while at the same time, the prompts were withdrawn. In the final
lesson students performed a scientific inquiry independently.
Implicit condition
The lessons of the implicit condition were structured based on the 4C/ID model as well.
Students in the implicit condition also performed inquiry tasks that were structured
according to the different steps of the empirical cycle. All aspects of explicit instruction
were absent which entailed that the teacher refrains from explaining the rationale behind
the skills and that in part-tasks and whole-tasks, skills were practiced without explicit
probing questions or prompts. Rather than giving explicit attention to separate skills first
and then part-task practice on skill level, all skills were applied and practiced
simultaneously. To control for time on task, the implicit intervention contained part-tasks
about content and additional topics were included (see Appendix E for both explicit and
implicit example tasks). Two lessons concerned growth and development of plants, two
lessons on heart and lungs followed by the main topic of heat and temperature (four
lessons). Ultimately, the implicit intervention comprised similar numbers of scientific
investigations and assignments (Table 4.1).
Both interventions were piloted in several grade 5 and 6 classrooms which did not
participate in the main study. Adjustments were made where necessary, which in general
concerned length of assignments or difficulty level of scientific inquiry tasks.
Baseline condition
In Dutch primary schools, science lessons are primarily textbook-based. Developing inquiry
skills has low priority in science primary education, indicated by the lack of implementation
of instruments to measure progress of skills (Inspectorate of Education, 2015). Inquiry tasks
are included at most once a month or less and only by 50% of the teachers (Kneepkens, Van
Der Schoot, & Hemker, 2011). Students in the baseline condition did not receive formal and
structured instruction on inquiry skills during the intervention period.

on the acquisition of student's science inquiry skills in grades 5 and 6 of primary education
73
Table 4.1
similarities and differences between the explicit and implicit condition
aspect explicit condition implicit condition
similarities duration Eight lessons of 90 minutes Eight lessons of 90 minutes
whole-task Authentic investigations Authentic investigations
differences
structure of investigations
Investigations explicitly structured for the students
according to steps of empirical cycle
Investigations implicitly structured for the students
according to steps of empirical cycle
part-task Part-tasks for skill training
Part-tasks for acquisition of content knowledge
just-in-time information Prompts No prompts
metacognition
Explicit attention to planning, monitoring and
evaluation
No attention to planning, monitoring and evaluation
instruction Direct instruction on skills No direct instruction on skills
content of lessons Heat and temperature
Heat and temperature, growth and development of
plants, heart and lungs
Applying the hypothesis to the experimental design, it was predicted that students in the
explicit condition would improve their ability to perform a scientific inquiry more than
students in the baseline condition. Furthermore, it was expected that students in the
explicit condition would also outperform students in the implicit condition since the
benefits of explicit instruction, including prompts, task-structuring and direct instruction
have been well-established (Lazonder & Egberink, 2014; van Merriënboer & Sweller, 2005;
Zohar & Dori, 2003). Furthermore, it was predicted that the explicit instruction combined
with part-task practice aimed at skill acquisition would be specifically beneficial for skill
performance in the transfer task (Chen & Klahr, 1999). However, since practicing and
applying skills in whole scientific inquiry tasks alone can also enhance skill development to
some extent (Dean & Kuhn, 2007), we expected that students in the implicit conditions
would also improve science skills more in comparison to students in the baseline group.

Chapter 4: effects of explicit instruction
74
Procedure
The lessons of both interventions were taught by research assistants who had been
recruited and trained specifically for this purpose. All assistants had either graduated or
were in the final year of an elementary teacher education program. The students’ regular
teacher was asked to assist in each lesson. The presence of a familiar teacher would help
maintain a good working atmosphere while teaching. All lessons were taught in the
students’ regular classroom and with their regular classmates.
The research assistants were trained in a 4-hour training session to teach either one
of the interventions. Training included instruction, discussion and practice of parts of
lessons. In addition, assistants were trained in how and when to provide feedback during
tasks. The assistants were provided with a practical guide containing a description of the
rationale behind the intervention, detailed lesson plans and information on the skills and
content to be covered in the lessons. In addition, to ensure that all assistants would stay on
the same track (and no parts would be skipped), PowerPoint presentations were developed
for each lesson. In that way, it was assured that all assistants would implement the lessons
in a similar way.
To check the faithfulness of the implementation, the regular teacher was asked to
monitor the degree of implementation of the activities of each lesson. In addition, the
research assistants were monitored by two of the authors by observing a randomly chosen
lesson. Throughout the intervention, research assistants and the main author kept in close
contact by discussing lessons regularly. Furthermore, each research assistant was asked to
film lesson 7 of which random parts were watched by the author for a fidelity check.
Additionally, information on student level was collected documenting lesson attendance
and to what degree the students found the lessons enjoyable, because both may influence
students’ participation and scores.
Teachers in the baseline group did not receive any of the materials used in the
interventions. However, to be assured of cooperation, they could choose to complete one
of the two interventions with materials and trained assistants after the experiment.
Measurement instruments
Paper-and-pencil test
Students’ inquiry skills were measured by means of a paper-and-pencil test (PPT). The test
comprised a total of 46 items (36 multiple choice and 10 open-ended), which were based on
items selected from large-scale assessments commonly used in the Netherlands (Cito.com)
and other sources (e.g., SOLpass.org). Content varied from item to item and was considered

on the acquisition of student's science inquiry skills in grades 5 and 6 of primary education
75
to be familiar for grade 5/6 students. The 10 open-ended questions were scored by trained
raters.
For pretest-posttest purposes, the items were divided into two test booklets to give
two optimal split half tests. A total score for each test was calculated with a maximum
possible score of 30 points. The Cronbach’s alpha coefficients of the pre-test and post-test
were .63 and .70 respectively (n = 403).
Performance assessments
Students were additionally assessed by three PAs. All three PAs concerned comparative
investigations: students are asked to examine the relationship between two variables
(Shavelson, Solano-Flores, & Ruiz-Primo, 1998). Each PA was constructed according to the
same template, following the different activities of the empirical cycle and allowing for
comparison of students’ scores between PAs. PAs differed only in topic of investigation. In
the PA-pre-test Skateboard, students roll a marble down a ruler to examine the relation
between the distance of the marble on the ruler and the distance the marble covers at the
end of the ruler while pushing forward a paper wedge (Ahlbrand, Green, Grogg, Gould, &
Winnett, 1993). The PAs Hot Chocolate and Bungee Jump, based on tasks in TIMSS (Martin
et al., 1997), were deployed for post-testing. Hot Chocolate (PA-related-content) concerns
the relationship between an amount of hot water and its rate of cooling, which corresponds
to the topic of heat and temperature addressed in both intervention groups. In Bungee
Jump (PA-transfer) students investigate the changing length of a rubber band as additional
weights are added, a topic unfamiliar to both groups. This last test served to assess the
transfer of skills to a new task.
Each PA contained 14 quantifiable items with a maximum score of 34 points (see
Appendix F for PA-pre-test Skateboard). Scoring of items was based on students’ answers
written down in worksheets. The Cronbach’s alpha coefficients of PA-pre-test, PA-related-
content and PA-transfer were .67, .70 and .67 respectively (n = 403).
Metacognitive self-report tests
Metacognitive skills were measured by means of two different self-report tests. For pre-
and post-testing purposes, the Junior Metacognitive Awareness Inventory (Jr. MAI), a self-
report inventory for grades 3-5 developed by Sperling, Howard, Miller and Murphy (2002)
was administered. Jr. MAI consisted of 12 items with a three-choice response (never,
sometimes, or always). The mean score was calculated to obtain a measure of general
metacognitive ability. The pre-test and post-test Cronbach’s alpha coefficients were .54 and
.64 respectively.

Chapter 4: effects of explicit instruction
76
The second metacognitive self-report test - Science Meta Test (SMT) - measures
metacognitive self-regulatory skills including orientation/planning, monitoring and
evaluation (Schraw & Moshman, 1995). In contrast to the more general Jr. MAI, items were
constructed to obtain information about the extent to which metacognitive skills are
applied specifically in the PAs in post-testing. A mean score was calculated of the total of
13 items with a three-point scale (not, a little, a lot) and an alpha of .77 (n = 403).
General cognitive ability
To be able to control for general cognitive ability, students’ scores were obtained for
Reading comprehension and Arithmetic/mathematics from a semi-annual assessment of
The National Institute for Educational Testing and Assessment. For Reading comprehension
and Arithmetic/mathematics, reliability scores indicated by MAcc (Accuracy of
Measurement) are >.87 and >.95 respectively for grades 5 and 6 (Janssen, Verhelst,
Engelen, & Scheltens, 2010; Weekers, Groenen, Kleintjes, & Feenstra, 2011). Ability is
expressed by different levels which indicate the actual performance level of a student
compared to a norm group (A=upper 25% of all children, B=25% above mean, C=25% below
mean, D=next 15% below C, E=lowest 10%). The scores, provided by the participating
schools, were transformed into a five-point scale (A=5 to E=1). A student’s general
cognitive ability score was constructed by means of summing up the scores of both tests.
Intervention-related measures
Integrity of implementation
Degree of implementation was measured by the percentage of instruction and activities of
each lesson actually carried out. A class level variable representing the degree of
implementation was calculated by averaging the percentages of the number of lessons of
each class.
Lesson enjoyment
Students were asked to fill out a short questionnaire of 7 items with a five-point Likert
scale at the end of the final lesson of the intervention. The original questionnaire was
developed for measuring enjoyment of math lessons by Martinot, Kuhlemeier, and Feenstra
(1988). The items were adapted for primary science lessons and an extra item was added. A
final score was calculated by summing the scores (maximum of 28) of each item (α = .84).

on the acquisition of student's science inquiry skills in grades 5 and 6 of primary education
77
Administration procedure
The PPT-pre-test, PA-pre-test and Jr. MAI-pre-test were administered in this specific order
just before the start of the intervention. Post-testing comprised the PPT-post-test, PA-
related-content, PA-transfer and the two metacognitive self-report tests. To control for
sequencing effects, administration of PA-related-content and PA-transfer was randomly
alternated. Post-Jr. MAI and SMT were administered directly after PA-transfer, taking just a
few minutes to complete.
All tests were administered by trained test leaders who followed detailed protocols for test
administration. The PAs were administered individually in groups of 4-8 students. The PPT
and PA each took 45 minutes to complete.
Scoring
Trained raters scored the open-ended questions for the PPTs and PAs. Interrater reliability
was calculated by determining intra-class correlation after a training session on a random
sample of 11% of the tests. Additionally, another average of 19% of the scores per rating
session were scored by two raters so that additional interrater reliability could be
estimated during the process of individual rating. First round ICC ranged from .80 to .94
(ICC, two-way random, absolute agreement), and second round from .66 to .93. Finally, for
each rater, stability of scoring was estimated which ranged from .81 to 1.00.
Analysis
An a priori power analysis indicated that a sample of 68 students would be sufficient to test
a main intervention effect of medium size with a statistical power of β = .80 at the
conventional alpha level of .05 with multiple regression analysis. The sample of more than
400 students allows a test of small-to-medium effect sizes, also taking into account
intracorrelations (ICC values between .10 - .30).
The dataset included one independent variable (condition: explicit instruction,
implicit instruction, baseline) and five dependent variables (Post-PPT, PA-related-content,
PA-transfer, Post-Jr. MAI and SMT). Because of the nested structure of the data, multilevel
models were used to investigate the effects of the conditions on the five dependent
variables. MLwiN for multilevel analysis (Rasbash, Steele, Browne, & Goldstein, 2009) was
used to fit five different models (one for each dependent variable) with two levels
(students within classrooms). Adding a third level for school did not significantly improve
the fit of the models.

Chapter 4: effects of explicit instruction
78
The student variables (age, gender and general cognitive ability), grade level and pre-test
scores were included as control variables since they might influence students’ scores.
Variables were examined for accuracy of data entry, distributions and missing values. All
underlying assumptions (i.e., normality) were met.
As explained above, 64 students were not present at one or more test sessions.
These students were excluded from further analysis (Figure 4.1). There were no missing
values on individual items in the PPTs and PAs. There was a maximum of 6.7 % missing
values on items of all three metacognitive self-report tests. Little’s MCAR test including all
variables was not significant, indicating that no identifiable pattern existed in the missing
data (χ² (5552) = 5470.73, p = .78). Of the students who were present for all test sessions,
the expectation-maximization (EM) imputation method was performed for the missing
items of each metacognitive self-report test separately.
Ultimately, the Jr. MAI test was not included in the analysis because of insufficient
reliability of the pre-test (α = .54) and a serious lack of variance at the post-test.
For the benefit of interpretation of the intercept, all continuous control variables were
centered around the grand mean.

on the acquisition of student's science inquiry skills in grades 5 and 6 of primary education
79
4.3 Results
Descriptive statistics
Table 4.2 presents the effects of randomization on the composition of the three conditions.
Conditions were comparable with regards to gender (χ2 (2) = 2,3, n = 403, p = .319), but not
to grade level, with more students in grade 6 in the implicit condition compared to the
other conditions (χ2 (2) = 8,10, n = 403, p = .017). ANOVA analyses indicated that students
between conditions did not differ significantly on general cognitive ability (F (2, 400) = .77,
p = .465). There was a significant difference in age (F (2, 400) = 5.13, p = .006), with students
in the baseline condition being somewhat younger than students in the implicit condition
(Mean Difference = -.26, CI = -.46 to -.07). Of the pre-tests, conditions did not differ in
scores for the PPT-pre-test (F (2, 400) = 1.20, p = .302). However, analysis showed significant
differences between scores on the PA-pre-test (F (2, 400) = 3.54, p = .030) with a lower
score for the explicit condition.
Table 4.2 comparison of conditions in terms of the control variables
condition n gender % grade %
boy girl 5 6
explicit 144 46.5 53.5 54.9 45.1 implicit 138 54.3 45.7 42.0 58.0 baseline 121 46.3 53.7 58.7 41.3
condition general ability age PPT pre-test PA pre-test
mean (SD) mean (SD) mean (SD) mean (SD)
explicit 7.15 (2.35) 11.44 (.65) 15.04 (4.21) 9.69 (4.29) implicit 6.80 (2.46) 11.61 (.72) 15.52 (4.51) 11.24 (5.07) baseline 6.92 (2.24) 11.34 (.62) 15.88 (4.51) 10.14 (5.64)
Note: maximum possible score of PPT-pre-test is 30 and of PA-pre-test is 34 points
Descriptive statistics of intervention-related measures
Of the total of 168 lessons in the explicit and implicit condition taught in 21 different
classrooms, an implementation score was missing from 4 lessons. For the classes with
missing scores, an average score was calculated on the basis of the lessons scored.

Chapter 4: effects of explicit instruction
80
Multilevel regression analysis showed that the degree of implementation for the implicit
condition (n = 144) was not significantly different to that of the explicit condition (n = 138),
(B = 2.38, SE = .176, p = .174).
An independent-samples t-test showed no significant difference in enjoyment
(t(237) = 1.56, p = .121, equal variances not assumed) between students of the implicit
condition (M = 18.11, SD = 5.40) and those of the explicit condition (M = 16.88, SD = 7.20).
Finally, an independent-samples t-test indicated that students’ number of attended
lessons did not differ significantly between the explicit condition (M = 7.60, SD = .73) and
the implicit condition (M = 7.70, SD = .64), t(280) = -1.12, p = .264.
Descriptive statistics of post-tests and correlations
Table 4.3 presents the means and standard deviations for all post-tests. Because scales of
the scores are different for each test, the means are not comparable one-on-one.
Table 4.4 shows the correlations (Pearson’s r) between tests. No significant
correlations were found between the SMT and other tests, other than PA-transfer. Results
show that general cognitive ability is considerably correlated with pre-tests as well as the
PPT-post-test, whereas correlations with post-PAs are smaller.
Table 4.3 means and SD for post-tests
explicit (n = 144)
implicit (n = 138)
baseline (n = 121)
max score M SD M SD M SD
PPT 30 16.56 4.59 16.52 4.94 15.40 5.02 PA-transfer 34 13.72 4.69 12.53 5.59 11.30 5.07 PA-related-content 34 13.67 4.74 13.49 5.50 10.39 4.88 SMT 3 2.12 .41 2.11 .35 2.16 .31
Note: max score = maximum score possible of test; Mean and SD of SMT are indicated by average item scores
Effects of interventions on skills in scientific inquiry
Table 4.5 presents the results of the multilevel analysis on the effects of condition on skills
in scientific inquiry, controlling for pre-tests, general cognitive ability, age, gender and
grade level. Results show that the effects of age and grade level were not significant. The
two pre-tests and general cognitive ability positively contributed to the scores of all three
post-tests. There was also an effect of gender: girls scored significantly higher on the tests
than did boys. Adding the condition variable did not significantly increase model fit for the

on the acquisition of student's science inquiry skills in grades 5 and 6 of primary education
81
Table 4.4 correlations between all tests (n = 403)
1 2 3 4 5 6
1 PPT-pre-test 2 PPT-post-test .60* 3 PA-pre-test .54* .52* 4 PA-transfer .39* .47* .52* 5 PA-related-content .36* .45* .43* .63* 6 SMT .02 -.03 .04 .15* .01 7 General cognitive ability .58* .57* .49* .35* .34* -.04
* correlations are significant at p < .01 (2-tailed)
PPT (∆ IGLS = 3.64, df = 2, p = .162). Effect sizes in terms of Cohen’s d (Cohen, 1992) were
small for both the explicit condition (d = 0.27) and implicit condition (d = 0.20). These results
indicate that there was no significant effect due to the interventions on the ability of
students to apply skills in the PPT. In contrast, condition did have a positive significant
effect on scores of the dependent variable PA-related-content (∆ IGLS = 15.84, df = 2, p = <
.001). Students of both intervention conditions did significantly better than students in the
baseline condition with medium effect sizes d = 0.66 for the explicit condition and d = 0.58
for the implicit condition. The interventions also contributed to a significant better model
fit for PA-transfer (∆ IGLS = 8.09, df = 2, p = .018). However, in contrast to PA-related-
content, only the estimate for the explicit condition was significantly higher than the
baseline condition (B = 2.48, SE = .82, p = .003) with medium effect size d = 0.48. The effect
size for the implicit condition was small (d = 0.18). In other words, only explicit instruction
had a positive effect on the ability to perform an investigation with a new and unfamiliar
topic.
To further explore the difference between the two intervention conditions,
multilevel analysis was performed on a subsample of students (n = 282) who had received
either explicit or implicit instruction. In addition to the pre-tests, general cognitive ability,
age, gender and grade, the treatment fidelity variable ‘implementation’ was added as class-
level control variable. Only on the performance assessment PA-transfer, the model fit
improved significantly by adding condition (∆ IGLS = 4.98, df = 1, p = .026). Specifically, the
students who received explicit instruction performed significantly better (B = 2.00, SE = .86,
p = .016) than students in the implicit condition. The magnitude of the effect could be
considered moderate with d = 0.40.
For the metacognitive skills evaluated by the students with the SMT, no additional
variance was explained by condition, indicating that condition had no effect on scores.

Chapter 4: effects of explicit instruction
82
Tabl
e 4.
5 re
sult
s of
th
e m
ulti
leve
l ana
lyse
s fo
r ea
ch d
epen
dent
var
iab
le (
n =
403
)
PP
T-p
ost
-tes
t P
A-c
ont
ent-
rela
ted
p
ost
-tes
t P
A-t
rans
fer
po
st-t
est
SMT
coef
f SE
p
co
eff
SE
p
coef
f SE
p
co
eff
SE
p
inte
rcep
t 14
.83
0.6
1 <
.001
8.
90
0.7
3 <
.001
9.
87
0.7
3 <
.001
2.
18
0.0
6 <
.001
P
PT-
pre
-tes
t 0.
33
0.0
5 <
.001
0.
14
0.0
7 .0
28
0.1
3 0.
06
.04
2 P
A-p
re-t
est
0.1
9 0.
05
< .0
01
0.2
1 0.
06
< .0
01
0.3
5 0.
05
< .0
01
gene
ral a
bili
ty
0.6
1 0.
10
< .0
01
0.4
5 0.
12
< .0
01
0.3
5 0.
12
.00
3 0.
00
0.0
1 n.
s.
age
-0.0
8 0.
39
n.s.
4-0
.08
0.4
8 n.
s.
0.5
5 0.
45
n.s.
0.
02
0.0
4 n.
s.
gend
er1
0.7
9 0.
35
.02
1 2.
65
0.4
2 <
.001
2.
73
0.3
9 <
.001
-0
.02
0.0
4 n.
s.
grad
e2 0.
35
0.6
1 n.
s.
0.1
5 0.
74
n.s.
0.
07
0.7
1 n.
s.
-0.0
3 0.
06
n.s.
cond
itio
n
exp
licit
co
ndit
ion3
1.3
1 0.
68
.05
5 3.
48
0.8
1 <
.001
2.
48
0.8
2 .0
03
-0.0
4 0.
07
n.s.
im
plic
it c
ond
itio
n3 0.
98
0.7
0 n.
s.
3.0
5 0.
83
< .0
01
0.9
1 0.
84
n.s.
-0
.05
0.0
7 n.
s.
exp
lain
ed v
aria
nce
%
grou
p le
vel
61.0
7 65
.86
60.5
0 .0
0
stud
ent
leve
l 45
.39
26.9
4 34
.22
.00
IC
C
.12
.11
.14
.09
Not
e: 1
refe
renc
e ca
tego
ry: b
oys;
2 re
fere
nce
cate
gory
: gra
de 5
; 3 r
efer
ence
cat
egor
y: b
asel
ine
cond
itio
n; 4
not
sig
nific
ant

on the acquisition of student's science inquiry skills in grades 5 and 6 of primary education
83
4.4 Discussion
Results of this study confirm that both experimental interventions facilitate the acquisition
of skills for performing scientific inquiry. The scores on the PAs show that students in both
intervention conditions have significantly higher scores than students in the baseline
condition. In particular, when skills are measured by means of a PA with a topic familiar to
the content of the lessons, substantial effects are found. This finding is consistent with
former research on the influence of content knowledge on developing skills (Duschl et al.,
2007).
Furthermore, comparison of the two experimental conditions reveals that students
of the implicit condition were almost just as able to perform the scientific inquiry on a
familiar topic as students who received explicit instruction. Although most studies (on CVS)
show more effective learning by explicit instruction, this finding suggests that in a carefully
structured setting the opportunity to practice skills alone can already improve skill
application which concurs with former findings (Dean & Kuhn, 2007).
On a PA with an unfamiliar topic, scores are particularly interesting. Indicated by a
medium effect size, students in the explicit condition clearly outperform students in the
implicit condition. In both conditions, students had been practicing the same number and
variety of inquiries but only students subjected to explicit instruction were able to apply
inquiry skills in a PA with unfamiliar topic. This indicates that explicit instruction facilitates
(near) transfer of skills, which seems concordant with findings in CVS studies (e.g., Chen &
Klahr, 1999; Klahr & Li, 2005). In the present study, systematic and explicit attention (i.e., by
prompts) to skills in new tasks may have promoted more robust acquisition of these skills.
Increased awareness of strategies applied in the tasks by means of probing questions may
have further strengthened skills acquisition. The decontextualization of skills has possibly
contributed to students’ ability to apply the skills they acquired by practicing tasks with
different science content, albeit in the same domain (near-transfer). This implies that
students were not only able to use these skills, but actually understood how to apply them,
which has been shown to be difficult to accomplish in a classroom setting (cf. Klahr & Li,
2005).
The improvement of skills measured by the PPT was much smaller - though almost
significant - for students in the explicit condition and as such did not match the outcomes
of performance measured by the PAs. This discrepancy may be due to the different test
format. Skills measured by the PPT were elicited in a more passive manner in contrast to
applying skills actively in a PA which is considered a more authentic way of assessing skills

Chapter 4: effects of explicit instruction
84
(Shavelson et al., 1998), thus measuring actual skill proficiency. For instance, formulating a
research question for a “real” inquiry is not the same as identifying a research question
among different multiple-choice options. Accordingly, a PPT may not be the most
appropriate way to assess skill performance. The structure of the items in the PPT were less
similar to the tasks in the interventions lessons and as a result students could depend less
on skills learned in the lessons. Instead, students had to rely more on general abilities in the
PPT than in the PAs, which is supported by the small/medium correlation found between
post-test PAs and general cognitive ability (r = .35 and .34) and the medium/large
correlation between the PPT and general cognitive ability (r = .57).
Results show no significant difference in scores between students in grade 5 and 6,
even when age was removed from the model. Upon first glance, this is a surprising outcome
as students are likely to have improved their skills just by growing older and acquiring more
general skills by the time they are in grade 6 (Duschl et al., 2007). This may indicate that
students participating in this study had very little prior experience with scientific inquiry,
thus were novices regardless of what grade they were in. The implication may be that both
the design of the instructions as well as the implemented assessment formats are suitable
for students of both grade levels, provided that all students share the same (lack of)
experience with scientific inquiry.
Despite the improvement of skill proficiency, the SMT failed to elicit development of
metacognitive skills. However, it is very unlikely that students - as the high scores above the
scale mean suggest - already possess the ability to apply metacognitive skills to scientific
inquiry and therefore could not improve their metacognitive skills at all, regardless of any
instruction. A more plausible explanation could be that students overestimate their
metacognitive skills. This is in line with Veenman, Van Hout-Wolters and Afflerbach (2006)
who stated that scores on questionnaires “hardly correspond to actual behavioral measures
during task performance” (p. 9). It is therefore conceivable that many students in grades 5
and 6 do not yet have a mastery of these skills even though they thought they did.
Nevertheless, it may be that the metacognitive skills did improve and - although not
directly measured by the SMT - are indirectly reflected in higher scores on the PAs
(Georghiades, 2000).
Limitations and suggestions for future research
An important limitation of this study is that teaching assistants were using the lesson
materials for the first time. In a repeat teaching, assistants may be more efficient and
effective which could result in greater gains compared to the baseline condition.

on the acquisition of student's science inquiry skills in grades 5 and 6 of primary education
85
A second limitation in the design of this study is that only two post-PAs were included.
Assessing skill proficiency with more PAs would be preferable in order to reduce occasion
sampling variability, i.e., students performing the same task differently on different
occasions (Ruiz-Primo, Baxter, & Shavelson, 1993). However, the PAs in this study were
made quite elaborate in a bid to resemble authentic research. Deploying more of such
extensive assessments in real classroom settings would be laborious for students and
require too much testing time.
Furthermore, in this study the PAs are highly structured and not, as such,
representative of scientific inquiry, which is not generally a linear process. However, for
students who are novices, open investigations may be too challenging. In further research,
students could be assessed as their proficiency increases, using more open and interesting
investigations. Along the same lines, although the PPT was easy to administer and less
difficult to score, it may not have been the best choice for measuring progress of skills of
the novice learners in this study. The PAs provided a more elaborate and detailed picture of
the acquired skills and may have been as such more sensitive to change.
Finally, the post-tests were administered directly following the intervention. This
implies that only the short-term effects on inquiry skills of the explicit and implicit teaching
method were measured. A retention test was not included in the design because the grade
6 students were no longer available for another round of post-testing. Future research
might examine retention and/or transfer by using tasks with a different or more open
structure.
Implications for educational practice
The current study has several practical and scientific implications. For students in primary
school who have little experience with scientific inquiry, systematic, explicit instruction
should be considered and incorporated as a starting course for developing skills. As
students gain more proficiency in both skills and content knowledge, more open and
interesting inquiry activities may be implemented. Ultimately, the skills can also be
deployed for inquiry-based learning of content in addition to learning inquiry skills.
Furthermore, the 4C/ID system of Van Merriënboer et al. (1992) has proved to be
useful in designing structured lessons for teaching inquiry skills. The task-centered
approach provided ample opportunity to systematically incorporate important design
principles such as explicit instruction and additional skills practice. The whole-tasks were
not only pleasurable and motivating for students, but also provided the possibility to apply
the inquiry skills in an integrated manner, supporting development of the skills.

Chapter 4: effects of explicit instruction
86
To conclude, the present findings have provided additional information to the discussion of
effective ways to teach inquiry skills to young students. In this study, the method of explicit
instruction was not only compared with a baseline condition, but also with the implicit
method of teaching skills. Therefore, this study provides a strong argument for
implementing an explicit teaching method to promote and develop inquiry skills in primary
science education.
on the acquisition of student's science inquiry skills in grades 5 and 6 of primary education
87

88

89
5
performance assessment as a
diagnostic tool
for science teachers

90
ABSTRACT
Information on students’ development of science skills is essential for teachers to evaluate
and improve their own education, as well as to provide adequate support and feedback to
the learning process of individual students. The present study explores and discusses the
use of performance assessments as a diagnostic tool for formative assessment to inform
teachers and guide instruction of science skills in primary education. Three performance
assessments were administered to more than 400 students in grades 5 and 6 of primary
education. Students performed small experiments using real materials while following the
different steps of the empirical cycle. The mutual relationship between the three
performance assessments is examined to provide evidence for the value of performance
assessments as useful tools for formative evaluation. Differences in response patterns are
discussed and the diagnostic value of performance assessments is illustrated with examples
of individual student performances. Findings show that the performance assessments were
difficult for grades 5 and 6 students but that much individual variation exists regarding the
different steps of the empirical cycle. Evaluation of scores as well as a more substantive
analysis of students’ responses provided insight into typical errors that students make. It is
concluded that performance assessments can be used as a diagnostic tool for monitoring
students’ skill performance as well as to support teachers in evaluating and improving their
science lessons.
Based on
Kruit, P. M., Oostdam, R. J., van den Berg, E., & Schuitema, J. A. (2018). Performance
assessment as a diagnostic tool for science teachers. Research in Science Education.
DOI: 10.1007/s11165-018-9724-9

Chapter 5: performance assessment as a diagnostic tool for science teachers
91
5.1 Introduction
With the increased attention towards the implementation of inquiry activities within
primary science classrooms, educators have emphasized the importance of including
assessments in science classroom practice (Duschl, Schweingruber, & Shouse, 2007;
National Research Council (NRC), 2012). Information relating to students’ development of
science skills is essential for teachers to evaluate and improve their own education, as well
as to provide adequate support to the learning process of individual students (Germann &
Aram, 1996; Roth, 2014). In addition, including assessments of science skills is important
because it ensures that these skills are taught (Harlen et al., 2012; Vogler, 2002).
Performance assessments have been considered to be an alternative to paper-and-pencil
tests for the assessment of science skills (Harmon et al., 1997; NRC, 2012; Shavelson,
Baxter, & Pine, 1991). In a performance assessment students perform small investigations
by interacting with real materials. Students’ performance is evaluated on the basis of the
actions they take and subsequently report on regarding their investigations. The present
study explores and discusses the use of performance assessments as a diagnostic tool for
formative assessment to inform teachers and guide instruction of science skills in primary
education.
Skills and scientific inquiry
Science skills - also referred to as “inquiry skills”, “process skills” or “investigation skills”
(Harlen & Qualter, 2009) - usually indicate a wide variety of activities related to planning
and conducting investigations and interpreting results (Alonzo & Aschbacher, 2004; Gott &
Duggan, 1995; Harlen & Qualter, 2009). In current literature, it is generally acknowledged
that scientific inquiry activities in science classrooms should be based on the actual work of
scientists (Lederman & Lederman, 2014; Pellegrino, 2014). Within the framework of K-12
science education, the NRC (2012) argues that students should learn about what actual
scientists do when designing and carrying out inquiries. One of the aims is to understand
how knowledge about issues such as health and environment is obtained and validated.
Authentic research involves three domains of activities in which scientists go back
and forth: investigating, developing explanations and solutions, and evaluating data as
evidence for the proposed theories and models (NRC, 2012). This implies that in performing
a scientific inquiry, a wide variety of cognitive abilities are invoked. For example, different
abilities are employed when handling a microscope than when identifying patterns in data.

92
Consequently, the consideration of different skill categories underlying the inquiry
activities has been generally acknowledged (cf. Schraw, Crippen, & Hartley, 2006; Zohar &
Dori, 2003). In particular, three categories which underlie performing a scientific inquiry
may be involved: science-specific skills, thinking skills and metacognitive skills.
Science-specific skills can be classified as lower order thinking (Newmann, 1990)
which is defined by knowledge recall, routine employment and simple application of rules
(Goodson, 2000). These skills include practical skills such as taking measurements and using
a microscope (Abrahams & Reiss, 2015), but relate to cognitive processes as well. That is, in
performing a scientific inquiry, students must recall the facts and rules which are specific
for the science domain and then apply this knowledge in the appropriate manner (Gott &
Murphy, 1987; OECD, 2017). For example, converting data into tables and graphs can be
regarded as a science-specific skill..
Thinking skills include the higher order skills, also frequently referred to as critical
thinking (Moseley et al., 2005). Thinking skills involve manipulating complex information
which consists of more than one element and has a high level of abstraction (Bloom, 1956;
Flavell, Miller, & Miller, 1993). In a scientific inquiry, thinking skills are applied to make sense
of the data and connect the observations to scientific theories (Osborne, 2015). These
include, for example, formulating hypotheses, interpreting, analyzing, and evaluating data,
drawing a conclusion, and classifying and inferring information (Moseley et al., 2005;
Newmann, 1990; Pintrich, 2002; Zohar & Dori, 2003). Also, metacognitive skills such as
planning, monitoring and evaluating task performance are considered key in promoting the
quality of scientific inquiry (Schraw et al., 2006). For instance, evaluating their plan while
performing the inquiry helps students to rethink what they are doing and adjust the plan if
necessary (Michaels, Shouse, & Schweingruber, 2007). As argued by Kuhn (1997), the
essence of scientific thinking is coordinating theory and evidence which specifically
demands metacognitive skills.
For science education, the influence of content knowledge on skill development is
generally considered to be of paramount importance (Duschl et al., 2007). Content
knowledge is generally referred to as a conceptual understanding of facts, concepts,
theories and principles (OECD, 2017). Many studies have shown that the level of content
knowledge has substantial impact on skill development (Eberbach & Crowley, 2009; Kuhn,
Schauble, & Garcia-Mila, 1992). Particularly, prior content knowledge influences the quality
of students’ inquiry performance when they generate hypotheses, make observations,
evaluate evidence, and draw conclusions (Duschl et al., 2007; Millar & Driver, 1987).

Chapter 5: performance assessment as a diagnostic tool for science teachers
93
Performance assessment
As an alternative to standardized paper-and-pencil tests, performance assessments (PAs)
are considered to be valid instruments when assessing students’ science skills (NRC, 2012;
Shavelson et al., 1991). In PAs, students perform small experiments by interacting with real
materials. The small experiments in PAs are typically organized according to the different
steps of the empirical cycle which include: (1) formulating a research question, (2) designing
an experiment, (3) formulating a hypothesis, (4) measuring and recording data, (5) analyzing
data, (6) formulating a conclusion, and (7) evaluating. As is generally acknowledged,
scientists do not follow these steps linearly during actual research (NRC, 2012). However,
the steps provide a structure that is recognizable for students which is particularly
important for students in primary education who have little experience with scientific
inquiry (Donovan, Bransford, & Pellegrino, 1999). Therefore, the different steps provide a
suitable framework for systematic (formative) evaluation of students’ science skills.
A PA generally consists of three components: a task, a response demand and a
scoring system (Shavelson, Solano-Flores, & Ruiz-Primo, 1998). A PA can be considered to
be a test on a particular topic which contains a set of items. The main characteristics of
what defines a PA is that it is a complex task set in a context reflecting real-life experiences
and in which different skills and knowledge are interconnected (Davey et al., 2015). The
response demand may be verbal which requires observation measures in order to properly
score it. It may also be written, for example, by means of a worksheet or a notebook. For
measurement of skills involved in a scientific inquiry, a scientific report may be considered a
valid reflection of authentic research since scientists use reports to communicate their
findings. The nature of a scoring system depends on the type of task used. For example, for
tasks in which students use worksheets to note results and write down answers to
questions, a scoring rubric may be used to rate the students’ responses.
PAs were implemented for large-scale testing such as in The Third International
Mathematics and Science Study of TIMSS in 1995, and in the National Assessment of
Educational Progress (NAEB) of 2009 (Britton & Schneider, 2014). Research up until now has
been concerned with the limitations and advantages of implementing PAs for summative
assessment. Previous studies showed low correlations between different PAs designed to
measure the same science skills (Gott & Duggan, 2002; Pine et al., 2006). The main problem
of using PAs for testing is that students perform differently on similar PAs from one
occasion to the other (Ruiz-Primo, Baxter, & Shavelson, 1993; Solano-Flores, Javanovic,
Shavelson, & Bachman, 1999). Various reasons for this occasion sampling variability have
been put forward. For instance, the PAs generally differ in the context (the topic which
reflects a real-life phenomenon) in which they are set. Students actual task performance

94
depends on the knowledge they have about the topic of the task as well as how well they
are able to apply that knowledge (Klassen, 2006). This implies that, although the PAs call
upon similar science skills, students perform differently for each PA due to the knowledge
the student has of the particular topic of the PAs (Gott & Duggan, 2002; Shavelson et al.,
1991). Accordingly, Ruiz-Primo et al. (1993) suggested that a reliable measurement of
science skills may only be obtained by administering a substantial number of PAs.
Scoring of students’ responses is generally considered a substantial challenge when
implementing PAs. The scoring can either be based on directly observing the performance
itself or on students’ written responses which are evaluated after the event (Clauser, 2000).
In science education, it is generally acknowledged that observing is not practical for large-
scale and classroom testing (e.g., Klassen, 2006). Therefore, research has been concerned
with evaluating students’ written answers. An important advantage with written answers is
that it lends the possibility of analyzing and scoring responses after the event has taken
place (Schilling et al., 1990). Because PAs elicit skills similar to those that scientists apply
when they perform a scientific inquiry and subsequently report the results, scoring the
answers after the event is assumed to provide a valid indication of students’ potential
performance in real-life inquiry (Davey et al., 2015; Harmon et al., 1997; Kind, 1999).
However, it can be argued that a response format requiring extensive written
answers demands a certain level of writing abilities. Harlen et al. (2012) argued that the
response format may influence students’ scores. The implication is that it may be more
difficult to determine what exactly is being measured (Klassen, 2006; Stecher et al., 2000).
On the other hand, in a study by Baxter and Shavelson (1994) addressing the
exchangeability of observational and written scoring, results indicated that scoring written
responses provides a satisfactory alternative to observation. It is nevertheless important
that when developing PAs, attention should be paid to the “verbal demands of tasks”
(Stecher et al., 2000, p. 154).
It has also been noted that scoring criteria and rubrics may be difficult to interpret
by raters and therefore require extensive training to ensure that rating between raters and
occasions be consistent (Davey et al., 2015). According to Clauser (2000), reliable rating is
influenced by a number of different conditions such as the extent of detail of the scoring
criteria and the level of training of raters. Rating may be improved when scoring rules are
described in detail with examples of possible student answers. On the other hand, the
scoring criteria may get too specific which limits generalizability across tasks (Messick,
1994). Also, raters may be influenced by students’ handwriting and turns of phrase, or
assess students’ responses differently on different occasions. Although score variation
caused by rater effects can be reduced considerably by thorough training (e.g., Ruiz-Primo

Chapter 5: performance assessment as a diagnostic tool for science teachers
95
et al., 1993), the training and rating procedure is cost and labor-intensive (Davey et al.,
2015; Klassen, 2006).
All of this said, it is still the case that, in contrast with paper-and-pencil tests, PAs
have the important advantage of measuring skills more comprehensively because students
actually apply these skills to a real-life scientific inquiry (Davey et al., 2015; Ennis, 1993). The
issues of reliability previously discussed have less of an impact when used for formative
assessment in the classroom (Harlen, 1999). In addition, as argued above, a major
advantage of PAs is that students perform small experiments in which they systematically
follow the various steps within the empirical cycle. This provides an opportunity to separate
the various steps when determining students’ performance levels. Furthermore, although a
reliable rating of written responses is complicated due to the open format (Davey et al.,
2015), teachers who score PA items find it considerably valuable to be required to focus on
particular aspects of students’ written answers rather than merely regarding them as right
or wrong (Harlen, 1991). Aschbacher and Alonzo (2006) argued that notebooks can reveal
students’ thought processes which teachers can use to guide instruction. As a result, this
use of PAs can provide ample opportunity to collect information on students’ performance
for not just summative but also for formative evaluation.
Formative assessment
The primary purpose of formative assessment is to observe progress made and to collect
information to guide subsequent teaching and learning (Harlen et al., 2012). Formative
assessment elicits evidence of student performance and thus provides the teacher with
information which can be used to modify teaching and classroom activities (Black, Harrison,
Lee, Marshall, & Wiliam, 2004; Wiliam & Thompson, 2007). In a science classroom, the
assessments may be spontaneously incorporated in the lesson by asking questions and
starting discussions, or they may take the form of planned activities which are part of the
curriculum (Loxley, Dawes, Nicholls, & Dore, 2013). Information on science skill acquisition
can be gathered by observing students while prompting them to explore their ideas and
reasoning. Also, students can be asked to communicate their thinking by using drawings
and writing (Harlen, 1999).
When implementing PAs in the science classroom, students are provided with
opportunities to use skills and are encouraged to think critically about their performance,
which promotes students’ learning. In particular, by structuring PAs to include the steps of
the empirical cycle, more detailed information can be gathered on all aspects of a scientific
inquiry. Teachers can provide adequate feedback on the students’ work, engage students in

96
metacognitive discussion about the procedures applied in the PA and give them examples
of a well-performed inquiry. Finally, teachers can provide students with the techniques and
the language needed to perform a scientific inquiry (Davey et al., 2015; Harlen, 1999).
The present study
The NRC (2014) has argued that assessments other than those currently used should be
implemented in classrooms to reflect the contemporary vision of science education. An
important aspect of the assessments is that they should be “. . . specific enough to be useful
for helping teachers understand the range of student responses and provide tools for
helping teachers decide on next steps in instruction” (NRC, 2014, p. 3). In general, in daily
classroom practice, teachers will spend most of their time and effort on summative
assessments rather than formatively assessing their students’ progress (Black et al., 2004;
Black & Wiliam, 2003). Even if they do implement formative assessments, this will generally
not be aimed towards improving their teaching or the learning process of the students but
mainly on “deciding the level of achievement” (Harlen, 1999, p. 137).
The aim of the present study is to explore and discuss in what way PAs can be used
to provide teachers with diagnostic information to rate group or individual student
performance. When developing PAs for summative assessment, their structure should also
provide opportunities to use them for formative assessment in the classroom. This way, a
more fine-grained picture of students’ acquired skills may be obtained and used by the
teacher to gain information about students’ learning (Pellegrino, 2012). Therefore, in this
study, the utility of the more specific information that may be obtained by structuring the
PAs according to the different steps of the empirical cycle is discussed. Furthermore, the
way PAs are structured and scored creates opportunities to monitor students’ learning
progress. This diagnostic information is not only important for teachers to improve their
teaching but also to provide (individual) students with adequate feedback. As a result, the
present study may add to the understanding of using performance assessments as a tool
for formatively assessing students in science classrooms. The main research question within
this present study is as follows: in what way can a PA be used as a diagnostic tool to
evaluate students’ progress and to guide instruction in science classroom practice? To
answer this question, we discuss design principles of PAs and the corresponding scoring
rubrics based upon the steps of the empirical cycle. Furthermore, we analyze and discuss
the different levels of student performance on the three PAs: the mean scores, students’
response patterns and illustrative examples of and trends in students’ responses. Finally,
we examine the relationship between the PAs per step to search for evidence for the
usefulness of PAs for formative evaluation.

Chapter 5: performance assessment as a diagnostic tool for science teachers
97
5.2 Method
Sample
The responses on three PAs of 403 primary students (aged 10-12, 50.9% girls) were used.
Of these students, 51.6% were in grade 5 and 48.4% in grade 6. The students were from 12
primary schools located in urban areas of the Netherlands. Schools were willing to
participate on the basis of several pragmatic factors including permission of school
authorities, interest of teachers, willingness to do something with science and available
time.
The students in the present study were participants in an effect study with an
experimental, a control, and a baseline condition. Students in the experimental condition
received an intervention lasting 8 weeks in which regular explicit instruction in the use of
inquiry skills was provided during regular science class. Explicit instruction involved the
teacher clarifying the rationale behind these inquiry skills followed by examples and
classroom discussions about how to apply the skills. Then, students performed a scientific
inquiry in which they received guiding questions and specific feedback. In the lessons within
the control condition, all aspects of explicit instruction were absent. Instead, skills were
merely encountered and practiced while performing scientific investigations. Students in
the baseline condition followed their regular science curriculum, meaning that they did not
receive formal and structured instruction on inquiry skills during the intervention period.
The PAs were implemented as summative measurement instruments.
Description and development of the performance assessments
Three tasks were developed with topics suitable for grades 5 and 6 students: Skateboard,
Bungee Jump and Hot Chocolate. Skateboard was based on the PA “Rolling Down Hill”
(Ahlbrand, Green, Grogg, Gould, & Winnett, 1993). Bungee Jump and Hot Chocolate were
based on tasks used in TIMSS (Martin et al., 1997).
All three PAs appertain to comparative investigations in which students explore the
relationship between two variables (Shavelson et al., 1998). In Skateboard, students roll a
marble (the “skateboard”) down a ruler (the “hill”) to investigate the relationship between
the distance that the marble covers on the ruler (slope) and the distance the marble covers
at the end of the ruler while pushing a paper wedge forward. Similarly, students investigate
in Bungee Jump the changing length of a rubber band as additional weights (metal rings)

98
are added, and in Hot Chocolate, students examine the relationship between the amount of
hot water and its rate of cooling.
Each PA was constructed according to the same template following the various
activities (steps) of the empirical cycle (Table 5.1). In each PA the topic was introduced by a
description of the context of the experiment. The context for Skateboard comprised a
cartoon in which skateboarding children were wondering who would roll farther at the
bottom of the hill. A cartoon for Bungee Jump represented children of different weights
bungee jumping off a bridge and for Hot Chocolate a scenario was described of a cup of tea
or hot chocolate that was still too hot to drink. The students’ first task was to formulate a
research question in line with the topic presented. In the following task, students were
provided with a pre-formulated research question. Based on this research question,
students were asked to design an experiment. This task feature ensured that the
subsequent investigation designed by students was not contaminated by a flawed research
question or that the designs would not become too divergent to be properly compared.
The subsequent items followed the remaining steps of the empirical cycle and referred to
the pre-formulated research question (see also Table 5.1).
University lecturers in the field of biology and physics education assessed the items
regarding clarity of formulation, activity to be measured and suitability for young students.
Minor adjustments were then made to the items. To provide students with additional
scaffolding, students were asked to formulate a hypothesis after designing the experiment
whereas it is typically the other way round.
Prior to implementing the PAs as summative assessments in the effect study,
preliminary versions of all three PAs were piloted with 70 grades 5 and 6 students. Based
on the outcomes, several adjustments were made regarding the formulation of
instructions, questions and task structure.
The scoring rubric
To obtain a fine-grained picture of the students’ ability to perform a scientific inquiry, a
rubric was developed for scoring all 14 items of the PAs. Since generally speaking, existing
rubrics are specifically designed to match a particular task, a new scoring rubric for the PAs
was developed.
First, the activities were operationalized by specifying what a student’s response
should entail. The elements of the specifications were derived from resources in which
goals and learning progressions for science skills are described (e.g., Next Generation
Science Standards (NGSS), 2013; https://pals.sri.com). For example, for designing an
Chapter 5: performance assessment as a diagnostic tool for science teachers
99
experiment, the following goal was formulated for the scoring rubric of the PAs used in this
study:
The goal is that students learn to construct a design consisting of several
elements. The design is aimed at finding a relationship between two variables
and is described in a structured manner, which entails that the steps are at
least in chronological order. There is sufficient information to replicate the
experiment.
Next, the criteria for different levels of proficiency were formulated as detailed
descriptions of the elements required to appear within students’ answers. University
lecturers in the field of biology and physics education were employed as content experts to
assess the criteria for awarding points to the different levels of proficiency of possible
answers. An answer containing more elements is considered to demonstrate a higher level
of ability. Depending on the number of elements, more points are awarded (see the score
column in Table 5.1). Primary school teachers then reviewed the criteria to determine its
feasibility for grades 5 and 6 students.
Students’ responses obtained from the pilots were used to evaluate and adjust the
scoring criteria. Characteristic responses were added as examples to illustrate the different
levels of proficiency. The criteria descriptions and examples of all three PAs were
equivalent and differed only in their context-specific elements.
Within each PA items were assigned to one of the steps of the empirical cycle (Table
5.1). For some steps, more than one item was assigned. For example, the step “measure and
record data” included two items while four items were assigned to the step “formulate a
conclusion”. Scores for each step were obtained by summing up the scores of the assigned
items. As a result, the 14 items were reduced to separate scores for each of the seven steps
of the empirical cycle.

100
Table 5.1
blueprint of items of the performance assessments
item description of activities step empirical cycle score
1 Formulate research question Research question 0-1-2
2 Design experiment: Design Description of experimental set-up 0-1-2-3Description of how results will be noted 0-1-2
3 Formulate hypothesis Hypothesis 0-1-2
4 Note results in a table students make themselves Measure & record 0-1-2-3
5 Make a graph: Axes Line graph
Measure & record 0-1-20-1-2
6 Interpret results by relating two variables Analyze 0-1-2
7 Extrapolate results Analyze 0-1-2
8 Draw conclusion about relationship Conclusion 0-1-2
9 Formulate support for conclusion Conclusion 0-1-2
10 Relate hypothesis to conclusion Conclusion 0-1-2
11 Identify differences between plan and execution of experiment and explain reason(s) of differences or in absence of differences, give suggestions to improve the experiment
Evaluate 0-1-2
12 Give suggestions to extend the experiment Evaluate 0-1-2
13 Draw conclusion related to the context Conclusion 0-1-2
14 Formulate learning gains about inquiry Evaluate 0-1-2
Maximum score 34
Note: maximum score per step: Research question: 2; Design: 5; Hypothesis: 2; Measure & record: 7; analyze: 4; Conclusion: 8; Evaluate: 6
Scoring procedure
All students’ hand-written answers to the PAs were scored after having been transcribed
into typed text and grouped by item. Raters were trained to interpret the criteria as it was
intended and to award points to students’ responses in a consistent manner. During
training sessions, the scores of each item were compared separately and interpretations of
the criteria and students’ responses were discussed. This enabled the fine-tuning of the
criteria. After establishing satisfactory interrater reliability for the total score of a random
sample of an average of 12% of the responses (varying from .82 to .92, single-measures ICC,
two-way random, absolute agreement), administered tests were randomly distributed to be

Chapter 5: performance assessment as a diagnostic tool for science teachers
101
scored by individual raters. Finally, for each rater, stability of scoring was estimated. This
ranged from .81 to 1.00. To provide more detailed information on the rating process, the
interrater reliability per individual item is shown in Table 5.2. The low correlations of item 3
in all PAs indicate that raters may not have had a common understanding of the
formulation of a hypothesis. On average, the rating process of a PA took 20 minutes per
student.
Table 5.2 intra-class correlations (α) of raters after training per item
Skateboard
Bungee Jump
Hot Chocolate
item 1 Formulate research question .83 .74 .88 item 2 Design experiment .74 .69 .82 item 3 Formulate hypothesis .56 .61 .65 item 4 Make a table .86 .88 .81 item 5 Make a graph .89 .82 .90 item 6 Interpret results .92 .72 .57 item 7 Extrapolate results .88 .73 .75 item 8 Draw conclusion .86 .72 .85 item 9 Formulate support for conclusion .77 .60 .61 item 10 Relate hypothesis to conclusion .78 .67 .69 item 11 Identify differences between plan and execution .59 .59 .77 item 12 Give suggestions to extend the experiment .80 .83 .88 item 13 Draw conclusion related to the context .53 .51 .76 item 14 Formulate learning gains .88 .89 .83
Administration procedure
Individual research assistants administered the PAs in groups of four to a maximum of eight
students outside of the regular classroom. It took about 45 minutes to complete the test
administration of one PA. Each research assistant received extensive training and followed
detailed protocols for test administration. Each student completed three PAs on two
different occasions with a time interval of 8 to 10 weeks. On the first occasion, all students
completed the same PA (Skateboard). On the second occasion administration of the two
other PAs (Bungee Jump, Hot Chocolate) was randomly rotated. About half of the students
completed the PA Bungee Jump, while the other half completed Hot Chocolate and vice
versa. This rotation for the second occasion made it possible to determine whether both
PAs map student performance in the same way, allowing us to conclude that they are
equivalent diagnostic tools.

102
5.3 Findings
Descriptive statistics
Table 5.3 presents the mean scores and standard deviations of the PAs per step. To
facilitate comparison between the steps, the total scores for each step were converted into
a standard scale ranging from 0 (lowest) to 10 (highest). In Table 5.3 and in most of the
following tables, the scores of Skateboard are shaded gray to emphasize that this PA was
administered on a different occasion than the other two PAs. The mean scores on step level
indicate differences between steps in terms of difficulty. For instance, designing an
experiment seems in general to be more difficult than formulating a hypothesis.
Differences are also visible between PAs. For example, in Bungee Jump and Hot Chocolate
the mean scores for “measure and record” are higher than those fosterin Skateboard.
Table 5.3 means and standard deviations on converted standard scales (0-10) for the different steps of the empirical cycle (N= 403)
Skateboard Bungee Jump Hot Chocolate
Mean SD Mean SD Mean SD
Research question 2.47 3.82 5.97 4.04 6.46 3.32 Design 2.64 2.06 3.31 2.51 3.83 2.49 Hypothesis 5.32 3.74 4.85 3.52 4.08 3.72 Measure and record data 2.97 2.63 4.47 2.75 4.82 2.74 Analyze 2.93 2.80 3.36 3.09 2.99 2.97 Conclusion 2.96 2.26 2.82 1.98 2.93 2.06 Evaluate 3.10 2.03 3.40 2.12 3.25 2.05
Note: the gray-shaded column represents the scores on the first occasion
Overall, scores of the steps in all PAs show relatively low means indicating that the PAs
were in general difficult for grades 5 and 6 students. The highest score is a 6.46 for
formulating a research question. However, the large standard deviations reflect a high
amount of variation within the sample.
In Table 5.4 the relationship between the PAs per individual step is displayed.
Although significant, most correlations are small to medium with the exception of the step
of “measure and record data” between Bungee Jump and Hot Chocolate which can be
considered large (r = .83) (Cohen, 1988). These moderate correlations may have been
caused by task differences. Although the PAs were similar in structure and items, the topics

Chapter 5: performance assessment as a diagnostic tool for science teachers
103
Table 5.4 correlations (Pearson’s r) between the PAs per step of the empirical cycle (N = 403)
Skateboard /
Bungee Jump Skateboard /
Hot Chocolate Bungee Jump / Hot Chocolate
Research question .15** .25* .24* Design .22* .24* .44* Hypothesis .06 .17** .19* Measure and record data .37* .33* .83* Analyze .25* .08 .24* Conclusion .32* .16** .34* Evaluate .29* .29* .39*
* correlations are significant at p < .001 (2-tailed) ** p < .05
between the PAs varied. As previously discussed, familiarity with the topic can influence
application of skills considerably, resulting in variations between PAs within student
performance.
Furthermore, these correlations between PAs as presented in Table 5.4, show that
for most steps, correlations between Bungee Jump and Hot Chocolate are slightly larger
than correlations of either of these PAs with Skateboard which was administered 8 weeks
before the other two. Several reasons may account for these results. In the 8 weeks
preceding administration of Bungee Jump and Hot Chocolate, about two third of the
students had received lessons in which they had been performing small investigations
similar to the PAs. In addition, all students had experience with the Skateboard experiment
on the first testing occasion. As a result, students were more familiar with the testing
format on the second occasion which may explain the difference in performance.
Response patterns
Tables 5.5 to 5.11 show in more detail how students performed in each step of the
empirical cycle by presenting the response pattern of scores. In each table, the scores of
Skateboard are shaded gray to emphasize that this PA was administered on a different
occasion than the other two PAs. To demonstrate how the response patterns may provide
diagnostic information to teachers, the trends in the student responses per step will be
discussed in more detail and illustrated with examples.

104
Formulating a research question
Scores presented in Table 5.5 for formulating a research question clearly show a shift from
the majority of students scoring 0 points in the PA Skateboard to more than 75% of
students scoring 1 or 2 points in PAs of the second occasion.
The research questions formulated by students awarded with 0 points in Skateboard
were in general either unrelated to the goal of the experiment of finding a relationship
between two variables (“What happens when the marble does not roll against the paper
wedge?”) or were impossible to investigate (“Why do Jake or Ying go faster?”). In the PAs
on the second occasion more students were accurately able to formulate a research
question which described the relationship between the two variables. For instance, “Does
the rubber band stretch more when people are heavier?” in Bungee Jump or “Does the
amount of water influence the cooling rate?” in Hot Chocolate.
Interestingly, for Hot Chocolate, the research questions frequently addressed the
issue of what makes hot drinks turn cold (“How does the drink cool faster: by blowing or
just waiting?” or “Can a hot drink cool down in different ways?”). A possible explanation is
that students may have been more familiar with the topic of the cooling of hot drinks than
with skateboarding or bungee jumping.
Table 5.5 response pattern of PA scores for the step of formulating a research question (N = 403)
score Skateboard Bungee Jump Hot Chocolate
n % n % n %
0 271 67.2 100 24.8 47 11.7 1 65 16.1 125 31.0 191 47.4 2 67 16.6 178 44.2 165 40.9
Note: the gray-shaded column represents the scores on the first occasion
Designing an experiment
Students’ combined scores on the two items representing the step of designing an
experiment (Table 5.6) are spread in the lower regions of scores.
Typically, low overall scores were mainly the result of students having failed to
describe how they intended to communicate their results. Also, their descriptions were in
general not very specific (“Attach the weights and see how far it stretches.”), or they
presented a design that did not relate to the research question (“I will see how fast the
marble goes. We need cubes, a card and a ruler.”), or they paid too much attention to
details which were not relevant (“1. Put the cube on one side; 2. Put the green paper on the

Chapter 5: performance assessment as a diagnostic tool for science teachers
105
Table 5.6 response pattern of PA scores for the step of designing an experiment (N = 403)
score Skateboard Bungee Jump Hot Chocolate
n % n % n %
0 81 20.1 66 16.4 47 11.7 1 184 45.7 154 38.2 120 29.8 2 83 20.6 83 20.6 112 27.8 3 41 10.2 65 16.1 81 20.1 4 12 3.0 23 5.7 30 7.4 5 2 0.5 12 3.0 13 3.2
Note: the gray-shaded column represents the scores on the first occasion
other side; 3. Put the ruler on the cube; 4. Put the green paper on the card; 5. Roll the
marble.”). Designs awarded with higher scores were in general more extensive descriptions
and included relevant details, such as the number of planned measurements (“Needed: 8
rings, clipboard, rubber band, a paper clip. First time measuring I put 4 rings on the
paperclip, second time measuring 3 rings and third time 1 ring. Every time I measure how
far it goes down. I note the results in a table.”).
Formulating a hypothesis
To support the formulation of a hypothesis, students were provided with a sentence
starter: “I think that …, because …” . As shown in Table 5.7, for each PA the scores for
formulating a hypothesis are spread in similar ways with most students scoring not higher
than 1 point.
In general, most students were able to formulate a prediction and were awarded
with 1 point, but they typically failed to substantiate their prediction (“I think the rubber
band will stretch more with a heavier person, because the person is heavier”) or (referring
Table 5.7 response pattern of PA scores for the step of formulating a hypothesis (N = 403)
score Skateboard Bungee Jump Hot Chocolate
n % n % n %
0 100 24.8 106 26.3 155 38.5 1 177 43.9 203 50.4 167 41.4 2 126 31.3 94 23.3 81 20.1
Note: the gray-shaded column represents the scores on the first occasion

106
to the research question: “I think it is true, because the heavier, the more it stretches.”).
Students with full scores provided an explanation for their prediction, for instance “I think
that the heavier thing goes down, because the rubber band needs more strength to hold
the heavier thing up.” In some instances, students managed to use more abstract concepts,
such as “I think that it will stretch more, because more mass, more weight, more gravity.”
An interesting finding is the relatively low interrater reliability score (see Table 5.2) in each
PA of this particular step. Apparently, the raters found it difficult to distinguish between a
well-formulated hypothesis and a poorly formulated hypothesis.
Measuring and recording data
The step of measure and record data included making a table for noting the results and
drawing a line graph. The pattern of the scores presented in Table 5.8 show that students
performed better in the second occasion PAs when students in the experimental and
control conditions had more experience with graphs. The response patterns further
indicate that students differ considerably in their ability to measure and record data. For
instance, around 12% of the students did not succeed at all in scoring points for this step,
but the same proportion of students scored as many as 6 or 7 points.
The most common approach of recording measurements was in a more or less
structured way (see Figure 5.1). Full credits were only awarded if a student recorded the
data in a table indicating rows and columns (Figure 5.2).
The graphs in each PA were pre-labeled to offer students some support. In
Skateboard many students made a bar graph instead of a line graph, indicating they did not
have the specific knowledge on the concept of a line graph (Figure 5.3). Furthermore, many
Table 5.8 response pattern of PA scores for the step of measuring and recording data (N = 403)
score Skateboard Bungee Jump Hot Chocolate
n % n % n %
0 109 27.0 51 12.7 44 10.9 1 69 17.1 37 9.2 29 7.2 2 77 19.1 66 16.4 63 15.6 3 47 11.7 75 18.6 63 15.6 4 53 13.2 66 16.4 73 18.1 5 28 6.9 52 12.9 69 17.1 6 17 4.2 50 12.4 54 13.4 7 3 0.7 6 1.5 8 2.0
Note: the gray-shaded column represents the scores on the first occasion.

Chapter 5: performance assessment as a diagnostic tool for science teachers
107
Figure 5.1 noted results of measurements by a student in Skateboard
Figure 5.2 table awarded with full credits made by a student in Bungee Jump
Figure 5.3 example of a bar graph made by a student in Skateboard
Figure 5.4 example of a graph with the units not inserted properly made by a student in Skateboard
Figure 5.5 example of a graph with wrong scaling of units made by a student in Bungee Jump
students had difficulty to insert the units and the proper interval of units on both axes
(Figure 5.4) and using units with the right scaling resulting in graphs showing too little
change (Figure 5.5). However, some students were able to draw quite sophisticated graphs
of their data, and one particular student even included a legend.

108
The examples provide information on how instruction on making graphs may improve
scores for this particular step in the empirical cycle. For instance, students in the explicit
condition received instruction on the purpose of different types of graphs and on how to
decide on the units to put on the axis. To illustrate, Figure 5.6 shows the progress in
drawing graphs of one particular student in Skateboard and after 8 weeks in which the
student had received instruction on drawing graphs in Bungee Jump.
Figure 5.6 example of progress in drawing a graph of one of the students (Skateboard, left, and Bungee Jump, right)
Analyzing data
Finally, the steps of analyzing data, formulating a conclusion and evaluating show more or
less similar patterns of scores between the three PAs. For analyzing data (see Table 5.9),
full credits were only awarded if students explicitly mentioned the two variables and their
relationship and if the conclusion was consistent with their own measurements. For
instance: “If more rings are added, the rubber band gets longer.” or “As more rings are
added, it gets heavier so the rubber band stretches more.” And for Skateboard: “The higher
up the marble starts, the farther it rolls.”
Students were in general able to describe the relationship between the two
variables. However, although many students succeeded in describing the connection
between variables, this relationship was not always supported by their own measuring and
recording of data. Based on logical thinking, interdependence between variables was
assumed by students, even if their own data did not match this reasoning. It was also
regularly found that students indicated a relationship but failed to describe the

Chapter 5: performance assessment as a diagnostic tool for science teachers
109
Table 5.9 response pattern of PA scores for the step of analyzing data (N = 403)
score Skateboard Bungee Jump Hot Chocolate
n % n % n %
0 153 38.0 141 35.0 165 40.9 1 86 21.3 78 19.4 68 16.9 2 118 29.3 112 27.8 109 27.0 3 34 8.4 48 11.9 48 11.9 4 12 3.0 24 6.0 13 3.2
Note: the gray-shaded column represents the scores on the first occasion
relationship properly. For example, “More weights is more centimeters.” In Skateboard,
students often referred to the speed of the marble as a reason for rolling farther away at
the end of the ruler, such as “The higher it is, the faster it goes down.”
In extrapolating the results - also an element of analyzing results - much variation of
students’ responses existed. No points were awarded if students simply mentioned an
outcome. Students sometimes added an explanation but not substantiated with data. For
instance, “I think 170 cm because it builds up much speed because of the length.” The
following answer was awarded with full credits because the student had found a linear
relationship between the two variables and used his own measurements: “2 meters far
because if the slope is 20 cm it goes 10 cm far and two meters if 10 times as much as 20 cm,
so 10 x 10 = 100 and that is 100 cm = 1 m.”
Formulating a conclusion
The step of formulating a conclusion combined several aspects. First students were asked
to give an answer to the research question and to support their answer with an explanation
explicitly based on their own data. Then, students were required to relate the conclusion to
the hypothesis as well as to the context of the PA. Table 5.10 shows how students’ scores
were spread.
In all three PAs approximately one third of the students were able to formulate a
correct conclusion (“The higher you stand on the hill, the longer you can roll.”) but only an
average of 9% of students achieved the maximum score of 2 points by supporting their
conclusion with data.
When students were asked to relate the results to the specific context of the
investigation, around 44% of the students in both Skateboard and Bungee Jump, and 25%
of students in Skateboard formulated a conclusion which related to the context (“With the

110
Table 5.10 response pattern of PA scores for the step of formulating a conclusion (N = 403)
score Skateboard Bungee Jump Hot Chocolate
n % n % n %
0 79 19.6 62 15.4 60 14.9 1 68 16.9 84 20.8 79 19.6 2 75 18.6 81 20.1 88 21.8 3 70 17.4 93 23.1 72 17.9 4 52 12.9 44 10.9 63 15.6 5 38 9.4 27 6.7 28 6.9 6 18 4.5 12 3.0 9 2.2 7 3 0.7 0 0 4 1.0 8 0 0 0 0 0 0
Note: the gray-shaded column represents the scores on the first occasion
heavier person the rubber band stretches more.”). In Bungee Jump and Hot Chocolate,
hardly any students were able to substantiate their conclusion by referring to the data.
Remarkably however, 18% of students scored full credits for this particular item in
Skateboard. During unstructured conversations after having completed the PAs on the
second occasion, students told the researcher that they felt they were repeating their
answers and therefore did not bother explaining their conclusion again, especially since it
was their second and third PA.
Evaluating
The scores regarding the final evaluating step show that only three students obtained full
credits (see Table 5.11). In particular, an average of 9% of the students was able to give
suggestions to extend the experiment by describing which relationship they would like to
investigate (“To see whether the height on the hill also influences speed”). Most students
receiving 1 point suggested additional experiments (see Table 5.1, item 12), but did not add
an explanation (“I would do the experiment with longer distances”).
Furthermore, about 80% of the students failed to formulate their learning gains
resulting from the experiment in response to item 14 (see Table 5.1). For example,
although students referred to having learned about the relationship between the variables
which is considered a learning gain related to content, they did not answer the explicit
question regarding what they had learned about performing an inquiry. However, the
answers of the students who had received 1 or 2 points on item 14 were diverse and
interesting. For instance: I have learned ...”that there are more ways to start an
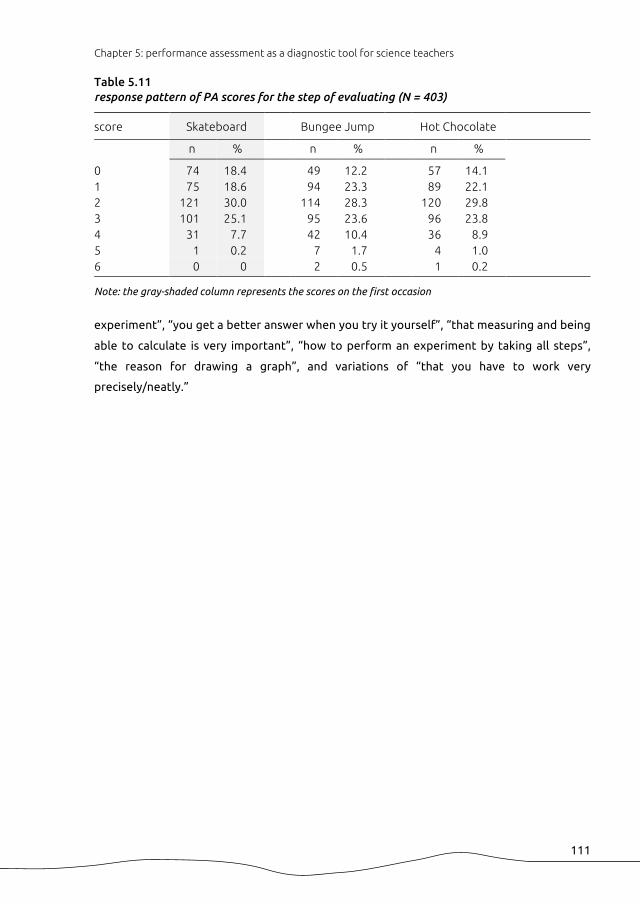
Chapter 5: performance assessment as a diagnostic tool for science teachers
111
Table 5.11 response pattern of PA scores for the step of evaluating (N = 403)
score Skateboard Bungee Jump Hot Chocolate
n % n % n %
0 74 18.4 49 12.2 57 14.1 1 75 18.6 94 23.3 89 22.1 2 121 30.0 114 28.3 120 29.8 3 101 25.1 95 23.6 96 23.8 4 31 7.7 42 10.4 36 8.9 5 1 0.2 7 1.7 4 1.0 6 0 0 2 0.5 1 0.2
Note: the gray-shaded column represents the scores on the first occasion
experiment”, “you get a better answer when you try it yourself”, “that measuring and being
able to calculate is very important”, “how to perform an experiment by taking all steps”,
“the reason for drawing a graph”, and variations of “that you have to work very
precisely/neatly.”

112
5.4 Discussion
The present study aimed to answer the question whether a performance assessment can be
used as a diagnostic tool to evaluate students’ progress and to guide instruction in science
classroom practice. Findings show that PAs have potential as a diagnostic tool for
monitoring students’ performance of skills, hence adjusting instruction and activities to
enhance learning. In particular, the structuring of PAs by assigning items to the different
steps of the empirical cycle, combined with the extensive descriptions of performance
expectations for each item, has shown to be useful in evaluating students’ responses.
This structured approach makes it possible for teachers to analyze the responses of
students on various levels and use the findings to adjust their instruction. For instance, the
means per step provide information on how students perform as a group at the classroom
level. Response patterns per step indicate that there is considerable variation, indicating
that the measurements are suitable for mapping individual differences. In particular, the
response patterns of the steps reveal where students show particular difficulty and in
which steps students perform more successfully compared with the average classroom
performance. This information will help the teacher to obtain an overall picture of how
students are progressing and subsequently adjust instruction as well as make informed
decisions regarding the choice of science activities. Finally, looking at students’ responses
in more detail provides insight into the common mistakes the students make and reveals to
some extent students’ thinking processes (Davey et al., 2015). As a result, teachers are able
to not only adjust their instruction to remedy shortcomings but also give specific feedback
to individual students (Black et al., 2004; Harlen, 1999).
Similarly, the rubric may have additional value for implementing PAs as a diagnostic
tool. The results of analyzing interrater reliability and consistency of scoring suggest that
the scoring rubric can be used effectively by trained raters. In particular, the high
consistency of scoring shows that the raters were able to apply the rubric to score
students’ written answers reliably. This implies that for teachers it is possible to assess
students’ answers to different PAs consistently over time by using the rubric.
In addition, the rubric can play an important role in the professional development of
science teachers. Because of the extensive description of the learning objectives, of which
teachers do not always have a clear understanding (Aschbacher & Alonzo, 2006), and the
different levels of proficiency, teachers may become more explicitly aware of the learning
objectives of scientific inquiry, while at the same time gaining better understanding of the
skills they are scoring. Emphasis on scoring is particularly important, since in the

Chapter 5: performance assessment as a diagnostic tool for science teachers
113
Netherlands only in 16% of primary schools (grades 4-6) the progress of students’ learning
of science is monitored by teachers (Inspectorate of Education, 2015).
The diagnostic value of PAs may also prove to have more value than just of an
assessment tool. Davey et al. (2015, p. 9) state that “A good assessment task is a good
teaching task and vice versa.”, which stresses the importance of alignment between
curriculum and assessment. Because of the structuring of the PAs in steps of the empirical
cycle, a PA can be split and administered in more than one lesson as a component of a
regular science lesson. In this way, teachers can monitor performance through the
workbooks of students which provides the opportunity to give feedback during the course
of several lessons (Harlen, 1999). Furthermore, it addresses the problem of the limited time
assigned for science instruction in most primary schools (Martin, Mullis, Foy, & Stanco, 2012;
NASEM, 2015). Finally, adding the rubric as part of the instruction may also create
awareness and understanding of the science skills and students’ own learning process,
which is perhaps the most important purpose of formative assessment (Harlen, 1999).
There is one limitation that should be addressed when implementing the PAs. The
response patterns of the scores vary between the PAs as revealed by the low and moderate
correlations between PAs per step. This may be attributed to the different topics used for
the PAs. Students may find one topic more interesting or less difficult than another.
Teachers may choose PAs with topics with which students are familiar (either by own
experience or being taught about the content of the PA topic ) or in which they are
interested. In addition, inconsistencies in rating may have influenced variation between
steps of the PAs (Ruiz-Primo et al., 1993). As discussed above, although interrater reliability
was high on total scores as well as on most individual items, a few items proved more
difficult to score such as formulating a hypothesis. This suggests that although formatively
evaluating on step level is useful for teachers to monitor (a group of) students, the scores
on step level may not be reliable enough for summative assessment. For reliable
summative assessment, more items per step should be included or more PAs with a range
of different topics should be used.
In summary, this study shows that a PA structured according to the steps of the
empirical cycle, is a useful tool to inform teachers on students’ science skills at a detailed
level. It does not require intensive preparation to administer in a science classroom and
fairly simple materials can be used. Implementation of the PAs need not necessarily be
limited to grades 5 and 6 but may also be used for students in grades 7 or higher.
Professional development of teachers should address the learning objectives for scientific
inquiry and how to use students’ responses for evaluation. Future research will have to
determine to what extent science teachers will be willing and able to implement the PAs as
a diagnostic tool in their classroom.

114
115
6
summary and general discussion

116
The aim of the present research project was to examine the effects of instruction methods
facilitating the acquisition of science skills of primary school students of grades 5 and 6. To
assess the effects, measurement instruments for reliable and valid evaluation of the
acquisition of science skills were developed. Accordingly, the following five research
questions were addressed:
1. What are science skills and how can they be operationalized?
2. What are crucial components of an instructional design for teaching science skills?
3. How can students’ ability in performing scientific inquiry be validly and reliably
measured?
4. What are the effects of explicit instruction on students’ acquisition of skills in
scientific inquiry?
5. What is the added value of performance assessments as a diagnostic tool to guide
instruction in science classroom practice?
In the preceding chapters, results of various sub-studies were discussed and answers were
formulated to the five above-mentioned central research questions. In this concluding
chapter, we give a brief summary of all the findings and relate the results to the theoretical
frameworks with regard to learning and teaching science skills. Subsequently, we examine
the limitations of the different studies and discuss suggestions for future research. Finally,
implications for educational practice are discussed.
Brief overview of the research project
The studies presented in this thesis were focused on the acquisition and measurement of
science skills of students in primary education. The central aim of the studies presented in
chapters 2 and 4 was to improve understanding of the teaching and learning of science
skills. The main aim of the research presented in chapters 3 and 5 was to explore the
construction of different assessment instruments for summative as well as formative
evaluation. The findings of the study reported in chapter 2 provided a categorization of
various aspects of science skills and a teaching model. This was used to design lessons
aimed at acquisition of science skills and in chapter 3 to construct instruments to measure
the acquisition of students’ science skills. Furthermore, the effects of these lessons were
explored and measured with these assessment instruments in chapter 4. In chapter 5, the
responses of students and the potential of performance assessments as a diagnostic tool
for teachers was further explored.

Chapter 6: summary and general discussion
117
6.1 Summary
Operationalization of science skills
In chapter 2 we addressed the first research question by discussing the definition and
operationalization of science skills. Despite their prominence, science skills remain a rather
“ill-defined domain” (Gobert & Koedinger, 2011). In most curriculum frameworks science
skills are defined by the activities which are intended to reflect the work of actual scientists
(Lederman & Lederman, 2014). The rationale is that knowing and experiencing how
scientists work will enable students to develop an idea of the methodological toolbox of a
scientist. The underlying assumption in many teaching programs is that by carrying out a
scientific investigation, students will learn science skills naturally and at the same time
develop an understanding of how scientists work. Within that context, Osborne (2014)
argues that engaging in scientific practice can improve the quality of students’ learning.
However, the way scientists work is different from the way students learn. Students in
primary education are still novices with regard to scientific inquiry. Science skills need to be
acquired in a systematic manner (Metz, 2011). When designing effective instructional
methods with the purpose of stimulating the development of science skills, it is essential to
acknowledge the cognitive demands underlying these science skills. We argued that three
different skills underlie the general concept of science skills. These are defined as science-
specific skills, thinking skills and metacognitive skills.
In the context of performing a scientific inquiry, science-specific skills refer to the
ability to apply procedural and declarative knowledge which is needed for properly setting
up and conducting an inquiry (Gott & Murphy, 1987). Examples of these skills include taking
measurements, organizing data into tables, making graphs, or using measurement devices.
Science-specific skills are classified as lower order thinking (Newmann, 1990) or
reproductive thinking (Maier cited in Lewis & Smith, 1993), and are characterized by
knowledge recall, comprehension, the routine employment of rules, and simple application
(Goodson, 2000). Science-specific skills defined as such include the practical skills as
discussed by Abrahams and Reiss (2015), but they pertain to cognitive processes as well.
Thinking skills include the higher order skills, also frequently referred to as critical
thinking (Moseley et al., 2005). Thinking skills involve manipulating information that is in
nature complex because it consists of more than one element and has a high level of
abstraction (Bloom, 1956; Flavell, Miller, & Miller, 1993). In a scientific inquiry, thinking skills
are applied to make sense of the data and to connect the observations to scientific theories

118
(Osborne, 2015) such as formulating hypotheses, making inferences from different sources
of data, identifying features and patterns in data, or drawing a conclusion (Millar & Driver,
1987; Pintrich, 2002; Zohar & Dori, 2003).
Metacognitive skills include planning, monitoring and evaluating task performance
(Flavell et al., 1993). These skills influence the quality of the scientific inquiry process which
in particular demands self-regulation and use of metacognitive strategies (Schraw, Crippen,
& Hartley, 2006). What distinguishes metacognitive skills from thinking skills is that they
involve active executive control of the mental processes (Goodson, 2000) or the “thinking
about thinking” (Kuhn, 1999; Kuhn & Dean, 2004, p. 270).
Finally, we discussed the influence of content knowledge on skill development and
performance. Content knowledge is most often referred to as conceptual understanding of
facts, concepts, theories and principles (OECD, 2017). Previous studies have shown that
content knowledge is, to a certain extent, a prerequisite for skill development (e.g.,
Eberbach & Crowley, 2009; Kuhn, Schauble, & Garcia-Mila, 1992). Different levels of content
knowledge can result in significant differences in skill performance (French & Buchner,
1999). Even when the level of cognitive abilities is supposed to be a limiting factor for a
given individual such as a young student, it is still possible to become an expert in a specific
subject area (for example “dinosaurs”) and subsequently perform better in problem solving
tasks compared to adults who know less about the subject (Glaser, 1984).
Components of an instructional framework
To answer the second research question of identifying the crucial components of an
instructional design for teaching science skills, we developed an instructional framework
for teaching science skills based on the operationalization of science skills into three
different underlying skills (or subskills) (chapter 2). Grounded on the design principles of
this framework, a series of eight lessons was constructed, piloted and used for the
intervention of the quasi-experimental pretest-posttest study (chapter 4).
Skills for scientific inquiry are usually taught by instructional methods primarily
based on learning by doing (Duschl, 2008; Roth, 2014) despite evidence suggesting that
more explicit teaching methods and strategies may be more effective (Klahr & Nigam, 2004;
Lazonder & Harmsen, 2016). Most teachers focus on only the practical aspects of scientific
inquiry which results in the disregard of the wide variety of cognitive abilities called upon in
scientific investigations. Due to limited experience and instruction, students in primary
education often lack sufficient mastery of strategies and knowledge to effectively use and
Chapter 6: summary and general discussion
119
apply the skills to a scientific inquiry in an integrated way. In addition, the working memory
capacity of students who are novices at performing a scientific inquiry may limit their ability
to conduct a complex task. For this reason, we argued that an instructional framework
based upon a cognitive approach aimed at acquiring science skills by means of an explicit
instruction method may support students’ learning process more adequately than an
approach based on learning by doing, and offers educators and teachers guidance in
designing and conducting lessons.
Explicit instruction aims to make students explicitly aware of the skills they should
learn and apply. Making students explicitly aware of the strategies and skills that they are
applying to a particular task leads to enhanced mastery which in turn may facilitate
transfer, which is considered an indication of more robust learning. Near-transfer can
generally be defined as the application of skills to tasks within a particular knowledge
domain or with a common structure. In this study, explicit instruction included explanations
from the teacher and classroom discussions on how and when to apply the skills. In each
lesson, attention was paid to one particular step within the empirical cycle. Explicit
guidance was included in the form of probing questions and prompts provided during task
performance.
Explicit instruction concerning metacognitive skills was addressed by introducing
the TASC model throughout the lessons. TASC stands for “Thinking Actively in a Social
Context” and aims at giving students structure to support their thinking (Wallace,
Bernardelli, Molyneux, & Farrell, 2012). The TASC model consists of a series of questions
which can be used to make students aware of the need to monitor and evaluate task
execution which is intended to improve metacognitive skill application. In each lesson,
students were instructed to think about and discuss the TASC questions with the teacher
and with each other.
An instructional framework for explicit instruction of skills was developed by
applying two structuring principles. The first involved using the principles of the four-
component instructional design (4C/ID) model as a starting point (van Merriënboer, Jelsma,
& Paas, 1992; van Merriënboer, Clark, & de Croock, 2002). This involves the implementation
of whole learning tasks, together with part-task practice, and includes scaffolding and
feedback opportunities. The part-tasks were aimed at strengthening the subskills which
were then simultaneously applied to a whole task scientific inquiry. This stimulated the
integration of the skills that were practiced separately. A series of lessons structured
according to the 4C/ID model involves a careful sequence of part-tasks and whole tasks
which gradually increase in difficulty and complexity. The second structuring principle of
the instructional framework concerned incorporating the steps of the empirical cycle. For

120
primary science education, a generally accepted guiding principle is structuring
investigations by following the main steps of the empirical cycle which include: (1)
formulate a research question, (2) formulate a hypothesis, (3) design an experiment, (4)
measure and record data (5) analyze results, and (6) formulate a conclusion. The empirical
cycle reflects all aspects of a scientific inquiry that are included in most curricula as learning
objectives. Most science tasks in primary education are more or less structured accordingly.
In the instructional framework, the principle of structuring via the steps of the empirical
cycle was applied in two different ways. First, in each lesson, students performed a
scientific inquiry (whole task) structured identically into the six steps that represent the
empirical cycle. Second, in each lesson, the main focus was on one of the steps only.
In this study, the feasibility and usefulness of the instructional framework including
the above described crucial components was demonstrated on the basis of a fully
developed lesson. This detailed example lesson illustrated an approach for systematically
designing science lessons for primary education according to the principles of the 4C/ID
model combined with aspects of explicit instruction.
The implementation of the lessons in a variety of classrooms showed that teachers
found the lessons to be feasible to accomplish within their daily practice and the school
curriculum for science education. Students found the lessons interesting and stimulating. It
was therefore concluded that the instructional framework and the operationalization of
science skills into science specific, thinking and metacognitive was not only feasible but
provided ample opportunities to construct science lessons which could be aligned with the
regular science curriculum in schools.
Measuring students’ ability to perform a scientific inquiry
In the third chapter, we explored the construction, the validity and the reliability of
different instruments for measuring science skills. The instruments included a paper-and-
pencil test, three performance assessments, and two metacognitive self-report tests.
Previous research showed that it is generally difficult to attain convergence between tests
with different test formats. The problems have been mainly attributed to differences in
students’ level of content knowledge, inconsistencies in rating and occasion sampling
variability (students perform the same task differently on different occasions). To examine
whether convergence may be improved as well as to assure that all aspects of scientific
inquiry were included, the paper-and-pencil test and the performance assessments were

Chapter 6: summary and general discussion
121
systematically constructed based on the three subskills (science-specific, thinking,
metacognition) as well as on the different steps of the empirical cycle.
The paper-and-pencil test consisted of a total of 46 items that were subdivided into
10 open-ended and 36 multiple choice questions. For administration purposes, the paper-
and-pencil test was split into two optimal split-halves. In the performance assessments,
students were asked to conduct a small investigation and formulate their findings and
answers on a worksheet. All three performance assessments (Skateboard, Bungee Jump
and Hot Chocolate) differed in topic but were each constructed according to the same
template which consisted of a total of 14 items. One of the metacognitive questionnaires
was based on the Junior Metacognitive Awareness Inventory (Jr. MAI) (Sperling, Howard,
Miller, & Murphy, 2002) and consisted of 12 items with a three-choice response. The second
metacognitive self-report test - Science Meta Test (SMT) - was designed to measure self-
regulatory skills and was specifically aimed at obtaining information regarding the
application of metacognitive skills in the performance assessments. Because previous
research indicated that general cognitive ability is often related to students’ ability in
performing scientific inquiry (Pine et al., 2006; Roberts & Gott, 2006), the results of a
standardized test were collected as well. This test is conducted every year in Dutch primary
schools within the context of a student monitoring system and provides an indication of
students’ general cognitive ability.
The results of the tests which were administered to 128 grades 5 and 6 students
showed that the tests were sufficiently reliable. Results also indicated that students’ ability
to perform scientific inquiry was significantly related to general cognitive ability. Positive
correlations between the paper-and-pencil test and the three performance assessments
showed that the different test formats measured a common core of similar skills, thus
providing evidence for convergent validity. By contrast, we found no relationship between
the measure of general metacognitive ability and either the paper-and-pencil test or the
three performance assessments. However, the metacognitive self-report test constructed
to obtain information about the application of metacognitive abilities in performing
scientific inquiry, showed significant - albeit small - correlations with two of the
performance assessments.
Additionally, we explored to what extent scores on both subskill and empirical step
level can be used to obtain valid and reliable diagnostic information in addition to overall
test scores. Each item in both the paper-and-pencil test and the performance assessments
was classified by determining the primary skill underlying that particular item. These items
were also assigned to one of the steps of the empirical cycle. Then, on subskill and step
level, the mean scores, reliabilities and correlations between scores were obtained and

122
discussed. The results showed that scale reliabilities were acceptable on subskill level for
the paper-and-pencil test as well as aggregated across performance assessments. In
addition, the correlations between the mean scores of each subskill scale indicated that a
more precise identification of students’ ability in performing scientific inquiry can be
realized.
On empirical step level the results showed weak to moderate reliabilities on average
and erratic correlations between steps of both the paper-and-pencil test or aggregated
across performance assessments. Because of this, we concluded that ability scores on
empirical step level should be interpreted with caution, especially when used for
summative assessment purposes.
From this study we concluded that with the paper-and-pencil test and the three
performance assessments, measurement of science skills can be attained in a reliable and
valid manner by systematically constructing items directed to subskills and different
empirical steps.
Furthermore, although reliability of skills measured per subskills and step level is
limited, we demonstrated that additional diagnostic information for formative purposes
can be obtained by examining mean scores on both subskill and step level. By contrast, we
concluded that self-report questionnaires were less suitable for measuring metacognitive
skills in this group of primary school students and results obtained from these self-report
tests need to be interpreted with caution.
Effects of explicit instruction
The fourth research question that we tried to answer in this thesis concerned the effects of
explicit skill instruction on students’ acquisition of skills in scientific inquiry. In chapter 4, we
described the results of a quasi-experimental study with pretest-posttest design on the
effects of explicit versus implicit instruction on the acquisition and transfer of science skills.
This study was conducted at 12 schools for primary education in the Netherlands. The
participants included a total of 705 students (aged 10-12 years) from 31 grades 5 and 6
classes. The study was designed to investigate the effects of an 8-week intervention with
explicit instruction on students’ acquisition of inquiry skills (explicit condition). The eight
lessons of 90 minutes each of the explicit instruction condition were developed according
to the instructional framework described in chapter 2. A control condition was included
with lessons in which skills were taught using an inquiry-based approach without explicit
instruction on inquiry skills so that information about the added value of explicit instruction
Chapter 6: summary and general discussion
123
could be obtained. All lessons were piloted in a total of three grade 5 and 6 classes in two
different schools before using the lessons for the intervention. To contrast both controlled
conditions with regular science lessons at schools, a baseline condition was added in which
students followed the regular curriculum. Within schools, classes were randomly assigned
to conditions (see for overview Figure 4.2).
To obtain information on the acquisition of science skills, all students were tested
with the measurement instruments described in chapter 3. In the pre-test session, the
measures included the optimal split-half of the paper-and-pencil test, a performance
assessment (Skateboard) and the Jr. MAI self-report test. After the intervention period (8 -
10 weeks), a subsample of the students (n = 467) were tested again with the other split-half
of the paper-and-pencil test, two performance assessments (Bungee Jump and Hot
Chocolate) and both metacognitive self-report tests (Jr. MAI and SMT). Specifically, the
topic of the performance assessment Hot Chocolate corresponded with the topic heat and
temperature addressed in both intervention conditions, while the topic of the performance
assessment Bungee Jump was unfamiliar to all students. The last test served to assess the
near-transfer of skills to a similar task with a new and unfamiliar topic.
In addition, we included measures to obtain information about the integrity of the
implementation of the intervention lessons and whether or not students enjoyed the
lessons. The results indicated that there were no significant differences between the two
intervention conditions on either of these measures. In both conditions the lessons were
taught as intended and in general, students enjoyed the lessons.
Multi-level models with two levels were used to analyze the data of a total of 403
students. The scores on the pre-tests (paper-and-pencil test and the performance
assessment Skateboard), general cognitive ability, age, gender and grade level were
included as control variables. The scores of the Jr. MAI were not included because of
insufficient reliability and lack of variance in post-testing. Results of the analysis of the
paper-and-pencil test and the performance assessments showed significant effects for the
pre-tests, general cognitive ability and gender. Conversely, grade level did not affect the
scores on the post-tests. There was no significant effect of condition on the paper-and-
pencil test. However, students of both intervention conditions did significantly better than
students in the baseline condition on Hot Chocolate, which was the performance
assessment with a familiar topic. Only the explicit instruction condition had a significant
positive effect on the ability to apply science skills in a performance assessment (Bungee
Jump) with an unfamiliar topic, thus providing evidence for transfer of skills. Students who
received explicit instruction not only performed better than did students in the baseline
condition, but they also outperformed students of the implicit instruction condition.
124
These findings indicated that science lessons can improve skill application in a carefully
structured setting with opportunities for students to practice skills in scientific inquiry
tasks. The results also showed that systematic and explicit instruction on science skills may
be necessary for more robust acquisition of these skills. Increased awareness of
metacognitive strategies applied in the tasks by means of probing questions from the TASC
model may have further strengthened skills acquisition. However, we did not find
improvement for the paper-and-pencil test and the SMT and as such did not match the
outcomes of performance measured by the performance assessments. For the paper-and-
pencil test, this lack of progress may be attributed to the test format: the paper-and-pencil
test consisted of primarily multiple choice items. Accordingly, the paper-and-pencil test was
less similar to a real-life inquiry than it was to the performance assessments, and the tasks
that were carried out in the lessons. For instance, formulating a research question for a
“real” inquiry is not the same as identifying a research question from amongst different
multiple-choice options.
The SMT failed to elicit development of metacognitive skills, which may be due to
limited sensitivity of the test. An alternative plausible explanation could be that students
overestimated their metacognitive skills. It is therefore conceivable that many students in
grades 5 and 6 did not yet have a mastery of these skills even though they thought that
they did.
Performance assessment as a diagnostic tool
In the final study we discussed the research question which focused on whether
performance assessments have added value as a diagnostic tool to guide instruction in
science classroom practice. In chapter 5, we explored and discussed the use of performance
assessments for formative assessment to inform teachers and guide instruction of science
skills in primary education.
In general, in daily classroom practice, teachers will spend more time and effort on
summative assessments rather than on formatively assessing their students’ progress.
However, the information on students’ development of science skills is essential for
teachers in order to evaluate and improve upon their own instruction, as well as to provide
adequate support and feedback on the learning process of individual students. When
developing performance assessments, the structure of these assessments should also
provide opportunities for formative evaluation in the classroom. This way, a more fine-
grained picture of students’ acquired skills may be obtained and used by the teacher to

Chapter 6: summary and general discussion
125
guide students’ learning. In this study, we explored and discussed the utility of the more
specific information that may be obtained by structuring the performance assessments
according to the different steps of the empirical cycle.
To this end, we examined the mean scores of the 403 students who had participated
in all three performance assessments (Skateboard, Bungee Jump and Hot Chocolate) on
“step level”. In addition, we analyzed the response patterns and illustrated these patterns
with examples of students’ responses.
In general, mean scores showed that the performance assessments were difficult for
most 5 and 6 grade students. However, the difficulty seemed to depend on the step-level
of the empirical cycle. For instance, designing an experiment appeared in general to be
more difficult than formulating a hypothesis. Differences were also visible between
performance assessments. For example, in Bungee Jump and Hot Chocolate the mean
scores for “measure and record” were higher than those in Skateboard. The response
patterns revealed that much individual variation existed regarding the different steps of
the empirical cycle. That is, scores were spread within almost each step, although most
students scored in the lower regions of the points awarded. In particular for the steps of
designing an experiment, analyzing results and formulating a conclusion, most students
attained low scores. In addition, the examples of student responses provided insight into
typical errors that students made. For instance, students’ experiment designs were in
general not specific and missed the relevant detailed information needed to understand
exactly how the experiment should be executed. Common errors found in the step of
analyzing results involved neglecting to base the conclusion on the actual data collected by
the students.
Based on these findings, we argued that the approach of implementing performance
assessments and analyzing students’ responses can be used by teachers to obtain
information on how students perform as a group at the classroom level. This approach also
reveals the steps with which students have particular difficulty. Because of this, teachers
can use this information to adjust their instruction and activities in the classroom. Students’
responses may enable teachers to provide individual students with specific feedback. We
were able to conclude that performance assessments may be useful as a diagnostic tool for
monitoring students’ skill performance as well as to support teachers in evaluating and
improving their science lessons.

126
6.2 Discussion
Theoretical contribution
This thesis contributes to previous research by showing that categorizing science skills into
three different types (science specific, general thinking and metacognitive) adds to a more
structured approach when designing science lessons as well as when designing assessment
instruments. Although the idea that the general concept of science skills is related to
various cognitive abilities has been acknowledged in previous research (e.g., Duschl,
Schweingruber, & Shouse, 2007), limited attention has been paid to the application of these
concepts of underlying skills to the design of science lessons. In this research project, we
not only operationalized science skills into three types of skills, but we went a step further
and systematically applied the categorization of skills in order to design an instructional
framework aimed at the acquisition of these different skills. We also applied the categories
of science-specific, thinking and metacognition to the design of measurement instruments.
As a result, we ensured the alignment of instruction and evaluation and contributed to a
reliable assessment of science skills.
Instruction of science skills
The results in the first place confirmed previous research by showing that teaching
methods with explicit instruction support the acquisition of science skills and can therefore
improve students’ ability to perform an investigation (Klahr & Nigam, 2004; Lazonder &
Harmsen, 2016). In this research project, explicit instruction was not limited to direct
instruction, which is often perceived as primarily teacher-centered where the teacher
explains how things should be done. Instead, we included a range of different aspects to
shape explicit instruction based on theories and previous research on, for example, the
effectiveness of feedback and the use of prompts and probing questions (McNeill, Lizotte,
Krajcik, & Marx, 2006; Sahin & Kulm, 2008; White & Frederiksen, 2000).
One important aspect of explicit instruction concerned the teaching of the
metacognitive skills. Previous research established that metacognitive skills such as
monitoring and evaluating one’s own performance, may enhance the quality of task
performance (Schraw et al., 2006). For this reason, we used the TASC model to support the
development of students’ metacognitive skills (Wallace et al., 2012). The TASC model

Chapter 6: summary and general discussion
127
includes probing questions which we used to explicitly direct students to apply a certain
strategy to the process of the scientific inquiry. This explicit instruction by using the TASC
model was implemented in the following ways: first, by the teacher explaining how to use
the probing questions; second, by including the TASC questions in the student material to
encourage the students to apply the strategies at certain crucial phases of the inquiry
process; and third, by supplying the students with a booklet which they could access and
use at any time during the lessons.
The second main aspect of explicit instruction included attention to the way in which
teaching and learning scientific inquiry could be structured. For this research project, we
structured all inquiry tasks using the steps of the empirical cycle. The sequence of steps of
the empirical cycle provided a structure that was recognizable for students and helped
them to understand how the inquiry process can be organized. This is particularly important
for students in primary education who have little experience with inquiry tasks (Donovan,
Bransford, & Pellegrino, 1999; White & Frederiksen, 2000). This structure was made clear to
the students by including visible illustrations in the classroom (in the form of a poster) and
in the student material. In each subsequent lesson, one of the steps was explicitly taught
and practiced.
We found that the application of explicit teaching methods aimed at science skills
development led to more effective development of students’ ability to perform a scientific
investigation, hence adding to the discussion of the role of explicit versus implicit
instruction regarding the skills in performing a scientific inquiry in science education.
Another contribution of this research project is that we showed how to integrate
these features of explicit instruction into an instructional framework with skill acquisition
as its focus. The instructional framework was structured based on the steps of the empirical
cycle as well as on the categorization into the three types of skills. As discussed above, the
principle of structuring by means of the steps of the empirical cycle was twofold: 1) to
ensure a consistent structure of each inquiry task and 2) to direct the sequence of the
intervention lessons. The categorization into underlying skills led to systematically
incorporating activities aimed at developing each of the skills. For instance, each lesson
consistently included an evaluation of the skills that were taught and practiced, thereby
stimulating students’ metacognitive skills.
We further showed that the theoretical model of the four-component instructional
design (4C/ID) of Van Merriënboer, Jelsma, and Paas (1992) contributed to systematically
addressing skills in the various stages within science lessons and in particular to the
integrated use of the skills. To our knowledge, the 4C/ID model had never before been
applied to developing science skills for primary education. In this research project, we

128
applied the model to our instructional framework because of its usefulness for designing
lessons aimed at skill acquisition. In particular, an important asset was the opportunity to
incorporate small part-tasks for practicing skills and then to apply all skills simultaneously
in more complex scientific investigations, thus stimulating integration of the skills.
Moreover, the 4C/ID model offered the possibility to design lessons for both the explicit
and implicit instruction condition. In this thesis, we have shown that the lessons based on
our instructional framework led to positive outcomes and as such may add to the body of
knowledge about skill development of primary school students.
It should be noted however, that although positive effects of explicit instruction
were established on students’ overall ability to perform a scientific inquiry, positive effects
were not found on their metacognitive skills as measured by the self-report questionnaires.
A first possible explanation for this result could be that our intervention which comprised a
total of eight 90-minutes lessons was not long enough to cause metacognitive skills to
become more deeply engrained. Considering the complexity and amount of skills these
inexperienced students had to acquire, the metacognitive skills may have received too little
attention in the lessons. This is in line with previous research showing that developing
metacognitive skills takes time and effort to fully develop (see also Mahdavi, 2014;
Veenman, van Hout-Wolters, & Afflerbach, 2006). Secondly, it is possible that our
assessment instruments were not adequate and sufficiently fine-grained to reliably
measure the underlying skills separately.
Another conclusion that can be drawn from this research project is that the implicit
teaching method also supports skills acquisition when performing a scientific inquiry, albeit
to a lesser extent than that of explicit instruction. The lessons of the implicit condition
lacked all aspects of what constitutes explicit instruction such as direct instruction of the
teacher, the use of prompts and probing questions, and explicit attention to the steps of
the empirical cycle. However, this does not mean that students had to find out everything
for themselves. Instead, the lessons were also carefully organized and included scientific
experiments that were structured in accordance with the different steps of the empirical
cycle. In addition, the science experiments increased in difficulty level and complexity
throughout the course of the eight lessons. Hence, our finding suggests that in a carefully
structured setting, the opportunity to practice skills alone can already improve skill
application. This is in line with results of previous research indicating that learning by doing
can promote the development of skills, such as of the Control of Variables Strategy (CVS)
(Dean & Kuhn, 2007).
Interestingly, we did find evidence suggesting that only explicit instruction may
facilitate transfer of science skills. One of the two post-test performance assessments

Chapter 6: summary and general discussion
129
implemented to measure science skills, namely the performance assessment Bungee Jump,
was designed specifically to measure (near) transfer of skills. That is, the topic of Bungee
Jump was different from the main topic of heat and temperature that was dealt with
during the lessons. The results showed that the students who had received explicit
instruction outperformed the students who had merely acquired the skills though the
learning-by-doing method. The conclusion that can be drawn from this finding is that
explicit instruction as it was shaped in our instructional framework may have promoted
more robust comprehension of the acquired skills. Although this result confirms findings of
previous research in CVS studies (Klahr & Li, 2005; Kuhn et al., 1995), we now established
that this may be the case for a broader array of skills.
Overall, an important contribution of this research project is that we learned how to
design effective explicit instruction at the primary school level and that the outcome is not
primarily declarative knowledge - which is common in science classrooms - but also
procedural knowledge as represented in the performance assessments. The implication
here may be that not only can students learn to apply skills when hypothesizing, devising an
investigation or manipulating equipment, but they may also be able to concurrently
develop an understanding of the value of the procedures and activities involved in scientific
inquiry (Gott & Duggan, 1996).
Finally, applying our theoretical instructional framework to design lessons which
were taught in a real-life classroom setting added to the significance of our results. We
were able to show that the positive effects of explicit instruction can also be established
within a classroom setting. Moreover, we have shown that the lessons based on this model
can be implemented in many different schools and by many different teaching assistants,
thus realizing high ecological validity.
Assessment of science skills
In contrast to previous studies (e.g., Pine et al., 2006), we attained somewhat greater
alignment between different test formats (paper-and-pencil test and performance
assessments) and between the three different performance assessments. Alignment was
realized in various ways. First, items were included that represented the various underlying
skills. As a result, all tests provoked similar cognitive demands. This means that not only
were practical aspects such as recording measurements included but also those aspects
which demand higher order thinking such as analyzing results. Second, the steps of the
empirical cycle were used as a general blueprint for test construction. By doing this, all
tests comprised items for measuring students’ ability to, for example, formulate a research
130
question. Third, each performance assessment was constructed according to the same
template. All items were identical and differed only when referring to the specific topic of
the performance assessment. Nevertheless, as was also reported in previous research, we
still found considerable differences between scores of the tests intended to measure the
same skills (Baxter & Shavelson, 1994; Pine et al., 2006). In addition, the correlations
between tests and scores on general cognitive ability showed that general cognitive ability
influenced the test scores. This was especially the case for students in the baseline
condition, who did not receive lessons specifically aimed at the acquisition of science skills.
In addition, pre-tests showed more shared variance with general cognitive ability than did
the post-test performance assessments. These findings are in line with previous research in
which general cognitive ability was found to have a major impact when skills were
measured, especially in novice learners (e.g., Roberts & Gott, 2006). As argued by Pine et al.
(2006), without powerful instruction, students are forced to rely on their general abilities
and prior knowledge in order to accomplish a task. It may be concluded that, although the
problems concerning convergence between different test formats still existed within our
research project, the findings in this thesis add to the ongoing discussion of assessment of
science skills. Especially given that assessment seems to be a limited innovation in science
pedagogy (cf. Davey et al., 2015; Pellegrino, 2012), it is important to explore and discuss the
issues and problems regarding these kinds of assessments.
In this research project, we constructed the assessment instruments based on the
premise of the categorization of science skills into three underlying types of skills.
Although our results to some extent indicated that the underlying skills are indeed
different abilities, our instruments did not discriminate sharply between the three types of
skills. In the first place, it may be that although we assigned each item in the tests to one of
the three underlying skills, these items did not exclusively assess each particular type of
skill. Indeed, items were assigned to one of each underlying skill which was primarily
expected to influence actual performance on this particular item. For instance, we assigned
items on designing and conducting an experiment to the category of science-specific skills.
However, metacognitive skills may also have influenced performance on this particular
aspect of the test. Therefore, the items in the tests may have measured the integrated
application of the skills and are as such not suitable for assessing one clear demarcated
subskill. A second explanation for this result could be that although we made the division
into three types of skills, these skills may not actually be sharply distinct concepts.
Moreover, the categorization into three underlying skills is still rather general. For instance,
thinking skills can be further classified into problem-solving, reasoning, decision-making,
inductive and deductive thinking, creative thinking (Adey & Serret, 2010; Gubbins, 1985;

Chapter 6: summary and general discussion
131
Sternberg, 1986). However, designing tests with such detail may more adequately test skills
but may at the same time be less valid and useful in assessing actual performance of a
scientific inquiry in which skills are applied in an integrated way.
It can thus be concluded that although operationalization of science skills into the
three categories of skills remains somewhat opaque when trying to identify these
categories within the assessments, using the proposition of the categorization into three
underlying skills to structure assessments did contribute crucially to improved alignment
between tests, as well as provided the opportunity to ensure the incorporation of the
various cognitive demands of a scientific inquiry. We may also conclude that the
intervention succeeded to some extent in teaching students to integrate the skills when
applying them to a scientific inquiry.
The final contribution of this thesis is that we add some important findings to the
current discussion on assessing metacognitive skills in science education. In this research
project, we administered a variety of assessments instruments in an attempt to assess the
acquisition of metacognitive skills. First, we included items in the performance assessments
which were directed to assessing metacognitive skills such as monitoring and evaluating
task performance. We also administered two different self-report questionnaires: Jr. MAI
(Sperling et al., 2002) and the SMT. The Jr. MAI questionnaire was used to measure
metacognitive skills in general in contrast to the SMT which was aimed at measuring
metacognitive skills which were applied in the context of the performance assessments.
Results revealed that progress could not be measured by means of the Jr. MAI and only
somewhat better by means of the SMT. In particular the Jr. MAI showed insufficient
reliability and both the Jr. MAI and the SMT showed very low variance. From this, we may
conclude that self-report questionnaires may not be the proper way to assess young
students’ metacognitive skills which is consistent with previous research (see for discussion
Veenman, van Hout-Wolters, & Afflerbach, 2006). The young and inexperienced students
participating in this research project may have, in particular, appraised their own
metacognitive skills too positively. Another argument that affirms the statement about
using self-report questionnaires is that it is possible that the metacognitive skills did
improve and - although not directly measured by the Jr. MAI or the SMT - are indirectly
reflected in higher scores on the performance assessments (Georghiades, 2000). This is in
line with previous studies showing that metacognitive skills have a positive influence on
performing a scientific inquiry (White & Frederiksen, 1998).
Also a conclusion of this research project is that, in the case of assessing young
students, it may be essential to measure metacognitive skills in a task-specific context. The
SMT which was constructed to obtain specific information about the application of

132
metacognitive skills in performing science tasks, showed significant - albeit small -
correlations with the two performance assessments that were administered after the
intervention period. In contrast, the Jr. MAI which is a general measure of metacognition,
did not relate to any of the performance assessments. This may indicate that, when
performing a scientific inquiry, it is preferable to assess metacognition with items that are
related to metacognitive activities where students have a clear understanding of both
science context and task. In other words, students may be more capable to estimate their
metacognitive skills when they can relate it to a specific task they performed (Schellings,
van Hout-Wolters, Veenman, & Meijer, 2013). Because of this, we would suggest the
implementation of more task-specific instruments to measure metacognitive skills for
primary school students.
Limitations and suggestions for future research
The present thesis has generated two important results. First, an effective approach for
teaching science skills and second, a variety of measures to assess science skills in order to
determine the levels of students’ ability, which were also useful for diagnosing student
problems and informing instruction (formative assessment). The research project had a
quasi-experimental design with a large sample to gain sound evidence regarding empirical
standards of research and high ecological validity at the same time. In total, a great amount
of attention was spent in ensuring objectivity and validity. However, we attach importance
to discuss some critical reflections that can be made concerning the scope of our research
and to suggest some recommendations for future research.
The first limitation to this research project is that we cannot be sure whether all
primary school teachers are able to teach the lessons as intended. We trained research
assistants who had been recruited and trained specifically for the purpose of teaching the
intervention lessons. All assistants had either graduated or were in the final year of an
elementary teacher education program. This way, we were able to control the way the
lessons were taught, hence improving objectivity and thus reliability of the results.
However, to see the extent to which the same results would be attained, we would
recommend having the lessons taught by the students’ regular primary school teachers.
The second limitation in this thesis concerns the use of self-report questionnaires
for measuring metacognitive skills. Using self-report tests has the major advantage that
they are easy to administer and score for large scale testing such as in this research project
with a large sample. A disadvantage was that the young students participating in this

Chapter 6: summary and general discussion
133
research project were not used to filling out self-report tests. They may have lacked the
ability to reliably assess their own abilities. A mix of various methods, such as observations,
teacher ratings, or think-aloud methods may have rendered more insight into students’
metacognitive skills. However, these methods also have limitations, in particular for large
scale use (see for discussion Vandevelde, Van Keer, & Rosseel, 2013). For future research,
we would recommend using other methods along with self-report tests to attain more valid
and reliable measurement of metacognitive skills.
A third limitation regarding the effect study concerns the duration of the
intervention. In this study, the number of lessons was limited to eight. It is generally
acknowledged that skills - and in particular skills in the higher order thinking category -
develop slowly (e.g., Lehrer & Schauble, 2006). Commonly, science curricula allocate several
years for the acquisition of science skills. It would be interesting to see how the students
would perform had they been given more time to develop science skills. Moreover, the
research assistants who taught the lessons did so for the first time. We suggest that future
research should consider implementing lessons for a longer period of time and have the
lessons be taught by experienced teachers who are already familiar with several iterations
of these particular lessons.
A final limitation is that we did not include more open inquiry tasks. In this research
project, we used performance assessments to assess actual real-life performance. These
particular performance assessments were still highly structured and constrained. For
instance, students did not have the opportunity to investigate a research question of their
own choice. Therefore, it may be argued that we did not test the full range of students’
possibilities. For future research, it would be interesting to explore how students would
apply their skills to less structured assessment formats.
Educational implications
This thesis presents an extensive analysis of the measurement issues and instructional
methods needed in order to foster development of science skills. We think that this thesis
may help to inform educators, teachers and other stakeholders when they design and teach
lessons aimed at the acquisition of science skills.
First, it is important that teachers are aware that learning science skills is not only a
matter of incorporating hands-on experiments as just a “fun” part of science lessons.
Instead, learning science skills is as difficult and needs as much attention as acquiring
science content knowledge. We argue that students need carefully structured instruction in

134
which all cognitive aspects regarding a scientific inquiry are purposefully addressed. For
example, we suggest that teachers design and use educational material which provides
students with the opportunity to learn and practice skills separately in smaller part-tasks, in
addition to more complex scientific investigations in which the students apply all skills
simultaneously. These whole-task investigations should also be part of a learning trajectory
from simple to more complex depending of the level of students’ ability to apply science
skills. Furthermore, students need support when performing a scientific inquiry. We would
advise teachers to use more feedback and prompts, and promote students’ metacognitive
skills such as monitoring and evaluating, by implementing explicit questions to help
students develop these skills.
Second, we would recommend not limiting measurement instruments to paper-and-
pencil tests but to include performance assessments as well. The benefits are plentiful: for
instance, by using more than one testing format, a more valid and fine-grained picture of
students’ abilities may be obtained. In addition, the specific structure of the performance
assessments can be used formatively so that teachers are able to design and adjust their
instruction in response to the students’ (lack of) progression. Moreover, the experience of
having administered performance assessments not only makes teachers more attentive
during regular class activities, but also makes them better able to identify learning and to
remedy problems with respect to science skills.
Third, the design of the instructional framework in which science skills are
categorized into three categories can be used by primary science curriculum designers and
educators to integrate science lessons with other subjects such as language and
mathematics (van Graft, Klein Tank, & Beker, 2014; NRC, 2012). Not only will this ensure a
more solid position of science in curricula of primary education but also students could
benefit from the wider selection of occasions in which they can apply the general thinking
and metacognitive skills. We think that the diversity of tasks for which the skills are used
will eventually help foster a deeper understanding and ultimately a more wide-ranging
transfer of these skills throughout the primary school curriculum.
Finally, we illustrated how the theoretical ideas of the 4C/ID model and the TASC
model could be incorporated into an instructional framework and then be used to design
science lessons. The added value is that these lessons were taught in actual primary science
classrooms which offered ecological validity. Furthermore, as an illustration of the
applicability and relevance of the lessons for primary schools, we would like to point out
that upon completion of the research project, one of the participating primary schools
located in Amsterdam built the explicit teaching method into their regular science
curriculum. This school is currently training their teachers to apply this method to other

Chapter 6: summary and general discussion
135
grades besides just grades 5 and 6. Additionally, some grade 6 students at this school are
mobilized to assist students in lower grades in performing scientific inquiries within the
lessons. This example demonstrates that the research project provides a powerful
argument for the use of the instructional framework when designing not only effective, but
also relevant lessons for learning science skills in primary education.

136

137
APPENDICES
APPENDIX A. Experiment in lesson 1
APPENDIX B. Example items of paper-and-pencil test
APPENDIX C. Example of scoring model for making a graph
APPENDIX D. Example of scoring rubric of formulating a research question in
performance assessment Skateboard
APPENDIX E. Examples of tasks of the explicit condition and the implicit condition
APPENDIX F. Example of a performance assessment: Skateboard

138
APPENDIX A
Experiment in lesson 1
Experiment 1 Warm or cold?
Now that you have learned how to formulate a research question, you are going to apply this
in the following experiment. You work together on the experiment.
I am working with: …………………………………………………
Do you feel it is warm or cold outside? It is difficult to tell just by feeling. It also depends on
whether you have been running or calmly playing with your marbles. Ask others and you will
see that everybody has a different opinion.
If you jump into the pool, the water feels cold. If you take a shower afterwards, the water will
feel nice and warm. But how could you know for sure how cold or how warm the water
actually is? The purpose of this experiment is to find this out.
What do you need?
ü A beaker with very cold water
ü A beaker with lukewarm water
ü A beaker with warm water
ü Two thermometers
ü Stopwatch
What are you going to do?
1) Put two fingers of your left hand in the beaker with warm water and two fingers or your
right hand in the beaker with very cold water at the same time.
2) Your classmate sets the stopwatch on 90 seconds.
3) After 90 seconds, you put all four fingers at the same time in the beaker with lukewarm
water.
4) Write down what you felt with the fingers coming from the cold water and what you felt
with the fingers coming from the warm water.
5) Now put a thermometer in the beaker with cold water and a thermometer in the beaker
with warm water. Write down the temperature.
6) Now leave the thermometers for 90 second in the water. After the 90 seconds, put both
thermometers at the same time in the beaker with lukewarm water. Write down the
temperature on both thermometers.
Appendices
139
Formulate a research question for this experiment. Use the Question Machine.
Our research question is:
…………………………………………………………......………………………………………………
Now you can do the experiment.
Go and get the materials you need
and follow the instructions.
Write down the results:
1. What did you feel when you put your fingers in the lukewarm water after the warm water?
…………………………………………....……………………………………………………………
2. What did you feel when you put your fingers in the lukewarm water after the cold water?
……………………………………………....…………………………………………………………
3. What did the thermometer read in the warm water? ……° C
4. What did the thermometer read in the cold water? ……° C
5. What did the thermometer read in the lukewarm water
coming from the warm water? ……° C
6. What did the thermometer read in the lukewarm water
coming from the cold water? ……° C
7. What is the best way to measure the temperature of water, do you think? Explain your
answer.
…………………………………………………………………………………………………………
8. Did you get an answer to your research question? If so, what is the answer?
…………………………………………………………………………………………………………

140
APPENDIX B
Example items of paper-and-pencil test
Figure B.1 Item in which students make inferences informed by evidence and reason, assigned to thinking (SOLpass.org).
Figure B.2 Example item assigned to science-specific: observe/measure correctly (Fraser, 1979).

Appendices
141
Figure B.3 Open-ended item in which students identify patterns, assigned to thinking (Harlen, 1986).
Figure B.4 Example open-ended item in which students record data, assigned to science-specific.

142
APPENDIX C
Example of scoring model for making a graph
For both labeling the axes and drawing the line, points are awarded and subsequently added.
Fill out this score.
0 No numbers at axes / numbers count backwards on one of both axes
1
-numbers are (linearly) and evenly spread on axes-numbers start with 0* (if not mentioned, but space is made)-large part of space used (more than half the space available)
2
Numbers are (linearly) and evenly spread on axes; large part of space used (more than half the space available); numbers start with 0* (if not mentioned, but space is made); all measurements fall into space available.
0 A bar chart is made / there are no data points
1 A line is drawn, but the data points are not correct / data points are correct, but no line is drawn.
2 All data points are correct; a line is drawn through the data points / there is a line of best-fit.
Goal: The student is capable of drawing a graph. The numbers of the axes are correct (starting with zero of space left open in first cell) and the data points are noted correctly. A line has been drawn through the data points. The graph uses most of the space available.
Notes: - No points are deducted when helping lines are drawn.- If a random line is drawn without taking into account the data points: no points are
awarded for line.- If numbers are not on the lines of axes, but instead between lines, no points are
deducted.
* numbering must be sequential between zero and the next number. For instance: (-)-5-10-15or (-)-2-4-6. And not: (-)-50-55-60, unless specifically a cell is left open.
2 out of 3 points

Appendices
143
APPENDIX D
Example of scoring rubric of formulating a research question in performance assessment Skateboard
Item 1 Research question Can you think of a research question you want to find an answer to? Write down your question:
0
Leaves space empty / formulates a question not relevant, understandable or possible to investigate / just refers to illustration.
Who is right?
Who rolls further?
How can they go faster?
Goal: The student is able to formulate a research question relating to the goal of the investigation. Goal of the investigation is to find the relation between the distance on the ruler and the distance the marble covers at the end of the ruler. The research question is relevant if it leads to finding this relation.
Notes: If a relation is mentioned, but speed is included, only 1 point is assigned. In case formulation leads to answering yes/no: no points are subtracted.
1
Formulates a researchable question which can be answered with results of this experiment, but has no connection to relationship between distance on ruler and distance marble rolling. (Question is on itself understandable and relates to the context of skating (or marbles)
Can the marble roll a distance of 15 cm?
How far can the marble push the paper wedge?
Do you go faster when you start higher up the hill?
2
Formulates a researchable question which can be answered with results of this experiment and (explicitly) identifies the relationship between distance on ruler and distance of marble rolling.
Does the marble roll further when the marble starts higher up the hill then when the marble starts at a lower point?
Do you go further when you start higher up the hill?
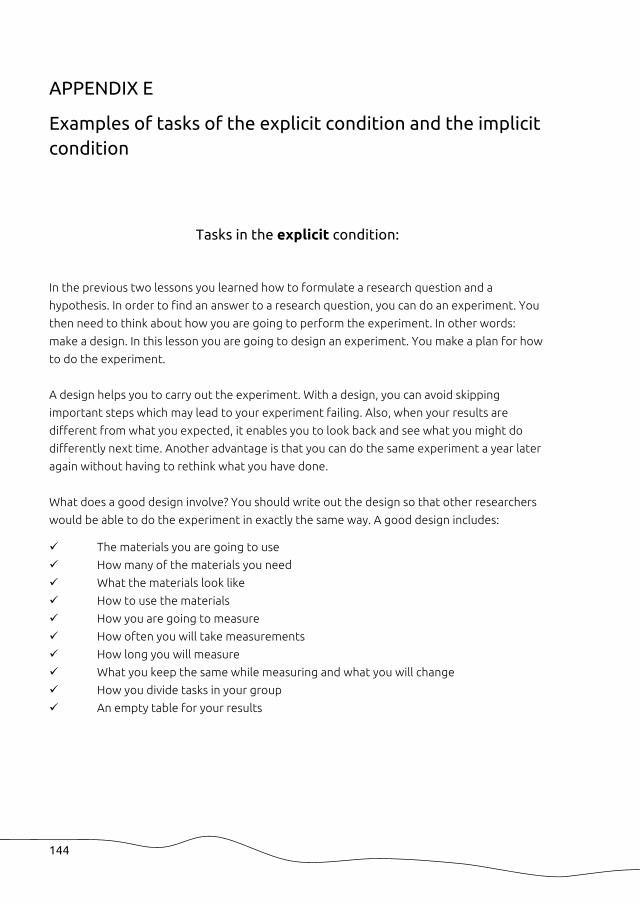
144
APPENDIX E
Examples of tasks of the explicit condition and the implicit condition
Tasks in the explicit condition:
In the previous two lessons you learned how to formulate a research question and a
hypothesis. In order to find an answer to a research question, you can do an experiment. You
then need to think about how you are going to perform the experiment. In other words:
make a design. In this lesson you are going to design an experiment. You make a plan for how
to do the experiment.
A design helps you to carry out the experiment. With a design, you can avoid skipping
important steps which may lead to your experiment failing. Also, when your results are
different from what you expected, it enables you to look back and see what you might do
differently next time. Another advantage is that you can do the same experiment a year later
again without having to rethink what you have done.
What does a good design involve? You should write out the design so that other researchers
would be able to do the experiment in exactly the same way. A good design includes:
ü The materials you are going to use
ü How many of the materials you need
ü What the materials look like
ü How to use the materials
ü How you are going to measure
ü How often you will take measurements
ü How long you will measure
ü What you keep the same while measuring and what you will change
ü How you divide tasks in your group
ü An empty table for your results

Appendices
145
The table is an important aspect of your design because it includes various points in the
design. Take a look at the following example:
Experiment: Tea
Now that you know how to make a design, you are going to make a design for the following
experiment. The goal of the experiment is to find out how quickly water cools in different
containers. An investigation always starts with a research question and a hypothesis.
First think about the following questions:
You work together on the experiment.
I am working with: …………………………………………………

146
Now formulate a research question. Use the Question Machine!
Our research question is:
……………………………………………………………………………………………………………..
Our hypothesis is:
I think that………………………………………………………………………...………, because….
……………………………………………………………………………………………………………..
Make a design and use the list.
You have ten minutes to do the
measurements.
Our design is:
…………………………………………………
…………………………………………………
…………………………………………………
…………………………………………………
……………………………………………………………………………………………………………..
Tasks in the implicit condition:
1. In the previous lessons you learned about conduction and heat transfer. You have
now watched a film about ducks with cold feet. We discussed the film together. Write down
what you have learned from watching the film.
……………………………………………………………………………………………………………..
……………………………………………………………………………………………………………..
……………………………………………………………………………………………………………..

Appendices
147
2. Also, the teacher explained that fluids and air are poor heat conductors. But heat
can flow to its surroundings by convection through water or air. This is a different kind of
heat transfer where moving hot water or hot air transports the heat.
What are heat sources in your home and at school? Make a list. Measure or make an estimate
of the temperature of each heat source and write it down in the table below.
Heat source Temperature
1. radiator 70° C
2. ….° C
3. ….° C
4. ….° C
5. ….° C
3. How does heat transfer in the following examples? After each sentence, write down
‘conduction’ or ‘convection’.
The stone floor feels cold with bare feet.
You burn yourself on a hot pan.
Your warm bath is getting colder.
A baby has a hot water bottle to keep it warm.
4. Hot tea is an example of a heat source. Because the heat of the tea flows to the
colder air, the tea will get cold. The colder the surrounding air is, the faster the tea will cool
down. There are also other aspects which influence how fast hot tea cools down. Can you
think of other ways to cool tea even faster?
……………………………………………………………………………………………………………..
……………………………………………………………………………………………………………..
……………………………………………………………………………………………………………..
Experiment: Tea
When you have a cup of tea you will notice the tea cools down after a while. The tea you spill
on the saucer cools down even faster than the tea in the cup. What could be the reason? How
would you investigate this? And how would you investigate whether or not the spilled tea
really does cool faster than in a cup?

148
You work together in this experiment.
I am working with: …………………………………………………
What do you need?
ü cup
ü bowl
ü hot water
ü two thermometers
ü stopwatch
ü beaker
ü ruler
1. Formulate a research question for the experiment:
……………………………………………………………………………………………………………..
2. What do you think the answer will be? Write down your answer and the reason why
you think that. My hypothesis is:
I think that………………………………………………………………………...………, because….
……………………………………………………………………………………………………………..
3. Make a design for your experiment. Describe exactly what you will do. Also write
down how you will measure, how often you will measure and how you will record your
measurements (in the table).
……………………………………………………………………………………………………………..
……………………………………………………………………………………………………………..
……………………………………………………………………………………………………………..

Appendices
149
APPENDIX F
Example of a performance assessment: Skateboard
Jaap and Ying want to roll down the hill with their skateboards. Each boy starts at a different
height. Jaap thinks that he will roll farther than Ying at the bottom of the hill. Ying thinks that
he will go farther than Jaap. You are going to investigate this. It is not possible to skateboard
in the classroom, so the experiment will be performed on your school desk.
First, you will be required to complete the following assignments:
Task 1:
Can you formulate a question pertaining to your experiment for which you would like to find
the answer? Write down your question.*
Task 2:
You will carry out an experiment in which you will try to find an answer to the following
question:
Will you roll farther when you start higher up on the slope?

150
There are materials on the table. You will let the marble (= skateboard) roll from the ruler (=
slope). On another table, you will see an example of the set-up you are going to use.
Build the set-up with your own materials.
Now you are going to make a design for your experiment. Describe in steps how you will
perform your experiment. For example, think about what you will measure, how and how
often you will measure it. Also, describe how you will record the results of your experiment.
Task 3:
What do you think the answer will be for the research question: Will you roll farther when you
start higher up on the slope?
I think that………………………………………………………………………...………, because….
……………………………………………………………………………………………………………..
Task 4:
You will execute your experiment following your own design in Task 2. The purpose is to find
an answer to the research question: Will you roll farther when you start higher up on the
slope?
a) Record the results in the space below. Think about how you will write down the results.

Appendices
151
b) Make a line graph of your results:
Leng
th o
f sl
op
e in
cm
Distance rolled after slope
Task 5:
You can answer the following questions by looking at your results and your graph.
a) Describe how the distance the marble rolls on the slope relates to how far the marble
continues to roll beyond the slope.
b) Suppose that you could make a slope that is 2 meters long. How far would the marble be
able to roll beyond the slope? Explain your answer.
Task 6:
a) Reread the research question for task 2. What will your answer be now?
b) Which reasons can you give to show that your answer is correct?

152
Task 7:
a) In Task 3 you described the results you expected. Now that you have done the
experiment, which similarity and/or difference is there between what you expected and
what you found in the investigation? Explain your answer.
In Task 4 you designed your experiment. The following three questions are about the
execution of your investigation.
b) What - if anything - did you end up doing differently than was described in your design?
c) If you did anything differently, what was your reason for doing so?
d) If you carried out your design according to your plan, what would you do differently next
time round in order to improve upon your experiment? Explain your answer.
e) Perhaps your curiosity was piqued after having performed this experiment. Suppose that
you could use different (or more) materials and had more time. What would you
investigate or change about your experiment regarding skateboarding?
f) You investigated the distance travelled on the slope and the distance the marble
continued to roll beyond the slope. What can you now say about the rolling of Jaap and
Ying’s skateboards?
g) What did you learn about doing an experiment?
* In the actual assessment, each question was followed by dotted lines for students to write
their responses on.

Appendices
153

154

155
REFERENCES
A
Abrahams, I., & Reiss, M. J. (2015). The Assessment of Practical Skills. School Science Review. 96(357), 40-44.
ACARA. (2010). Foundation to year 10 Australian curriculum. Retrieved July 17, 2014, from http://www.australiancurriculum.edu.au/science/Curriculum/F-10
Adey, P., Robertson, A., & Venville, G. (2002). Effects of a cognitive acceleration programme on Year I pupils. British Journal of Educational Psychology, 72(1), 1-25.
Adey, P., & Serret, N. (2010). Science teaching and cognitive acceleration. In J. Osborne & J. Dillon (Eds.), Good practice in science teaching: What research has to say, 82-107. McGraw-Hill Education.
Adey, P., & Shayer, M. (1993). An exploration of long-term far-transfer effects following an extended intervention program in the high school science curriculum. Cognition and Instruction, 11(1), 1-29.
Ahlbrand, W., Green, W., Grogg, J., Gould, O., & Winnett, D. A. (1993). Science performance assessment handbook. Edwardsville: Illinois Science Teachers Association.
Alfieri, L., Brooks, P. J., Aldrich, N. J., & Tenenbaum, H. R. (2011). Does discovery-based instruction enhance learning? Journal of Educational Psychology, 103(1), 1.
Alonzo, A. C., & Aschbacher, P. R. (2004, April). Value-added? Long assessment of students’ scientific inquiry skills. Proceedings of assessment for reform-based science teaching and learning. Symposium conducted at the annual meeting of the AERA. San Diego, CA.
Aschbacher, P., & Alonzo, A. (2006). Examining the utility of elementary science notebooks for formative assessment purposes. Educational Assessment, 11(3-4), 179-203.
B
Bartels, M., Rietveld, M. J. H. Van Baal, G. C. M. & Boomsma, D. I. (2002). Heritability of educational achievement in 12-year-olds and the overlap with cognitive ability. Twin Research and Human Genetics 5(6), 544-553.
Baxter, G. P., & Shavelson, R. J. (1994). Science performance assessments: Benchmarks and surrogates. International Journal of Educational Research 21(3), 279-298.
Baxter, G. P., Shavelson, R. J., Goldman, S. R., & Pine, J. (1992). Evaluation of procedure‐based scoring for hands‐on science assessment. Journal of Educational Measurement, 29(1), 1-17.
Black, P., & Atkin, J. M. (2014). The central role of assessment in pedagogy. In S.K. Abell & N.G. Lederman (Eds.), Handbook of research on science education, Vol. 2, (pp. 775-790). Abingdon: Routledge.
Black, P., Harrison, C., Lee, C., Marshall, B., & Wiliam, D. (2004). Working inside the black box: Assessment for learning in the classroom. London, UK: GL Assessment.
Black, P., & Wiliam, D. (2003). In praise of educational research: Formative assessment. British Educational Research Journal, 29(5), 623-637.
Bloom, B. S. ed. (1956). Taxonomy of Educational Objectives: Handbook 1, Cognitive domain. New York: David McKay.
Britton, E. D., & Schneider, S. A. (2014). Large-scale assessments in science education. In S.K. Abell & N.G. Lederman (Eds.), Handbook of research on science education, Vol. 2, (pp. 791-808). Abingdon: Routledge.

156
C
Chen, Z., & Klahr, D. (1999). All other things being equal: Acquisition and transfer of the control of variables strategy. Child Development, 70(5), 1098-1120.
Clauser, B. E. (2000). Recurrent issues and recent advances in scoring performance assessments. Applied Psychological Measurement 24(4), 310-324.
Cohen, J. (1988). Statistical power analysis for the behavioral sciences. Hillsdale, NJ: Lawrence Earlbaum Associates.
Cohen, J. (1992). A power primer. Psychological Bulletin, 112(1), 155-159.
Crawford, B. (2014). From inquiry to scientific practices in the science classroom. In N.G. Lederman & S.K. Abell (Eds.), Handbook of research on science education, Vol. 2, (pp. 515-544). New York: Routledge.
D
Davey, T., Ferrara, S., Shavelson, R., Holland, P., Webb, N., & Wise, L. (2015). Psychometric considerations for the next generation of performance assessment. Washington, DC: Center for K-12 Assessment & Performance Management, Educational Testing Service.
Dean, D. Jr, & Kuhn, D. (2007). Direct instruction vs. discovery: The long view. Science Education, 91(3), 384-397.
De Jong, P. F., & Das-Smaal, E. A. (1995). Attention and intelligence: The validity of the star counting test. Journal of Educational Psychology 87(1), 80-92.
Department for Education. (2013). The National Curriculum in England. Retrieved March 5, 2016 from http://www.education.gov.uk/schools/teachingandlearning/curriculum/primary
Dewey, J., & Bento, J. (2009). Activating children's thinking skills (ACTS): The effects of an infusion approach to teaching thinking in primary schools. British Journal of Educational Psychology, 79(2), 329-351
Dillon, J., & Manning, A. (2010). Science teachers, science teaching. In J. Osborne & J. Dillon (Eds.), Good practice in science teaching: What research has to say (pp. 6-19). New York, NY: McGraw-Hill Education.
Donovan, M. S., Bransford, J. D., & Pellegrino, J. W. (1999). How people learn: Bridging research and practice. Washington, DC: National Academies Press.
Duschl, R. (2008). Science education in three-part harmony: Balancing conceptual, epistemic, and social learning goals. Review of Research in Education, 32, 268-291.
Duschl, R. A., Schweingruber, H. A., & Shouse, A. W. (2007). Taking science to school: Learning and teaching science in grades K-8. Washington, DC: National Academies Press.
E
Eberbach, C., & Crowley, K. (2009). From every day to scientific observation: How children learn to observe the Biologist’s world. Review of Educational Research, 79(1), 39-68.
Ennis, R. H. (1989). Critical thinking and subject specificity: Clarification and needed research. Educational Researcher, 18(3), 4-10.
Ennis, R. H. (1993). Critical thinking assessment. Theory Into Practice, 32(3), 179-186.
European Commission (2007). Science education now: A renewed pedagogy for the future of Europe. Office for Official Publications of the European Communities.
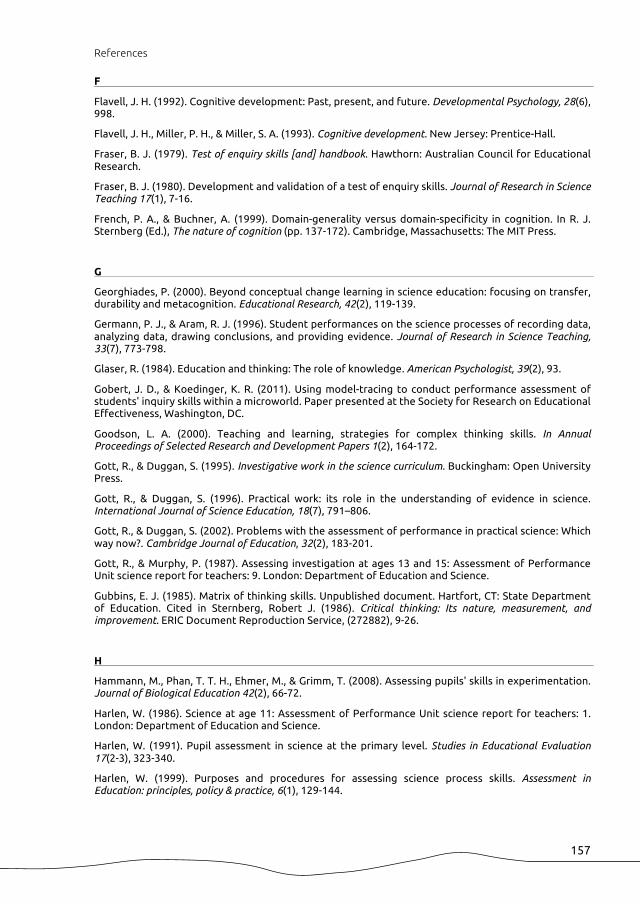
References
157
F
Flavell, J. H. (1992). Cognitive development: Past, present, and future. Developmental Psychology, 28(6), 998.
Flavell, J. H., Miller, P. H., & Miller, S. A. (1993). Cognitive development. New Jersey: Prentice-Hall.
Fraser, B. J. (1979). Test of enquiry skills [and] handbook. Hawthorn: Australian Council for Educational Research.
Fraser, B. J. (1980). Development and validation of a test of enquiry skills. Journal of Research in Science Teaching 17(1), 7-16.
French, P. A., & Buchner, A. (1999). Domain-generality versus domain-specificity in cognition. In R. J. Sternberg (Ed.), The nature of cognition (pp. 137-172). Cambridge, Massachusetts: The MIT Press.
G
Georghiades, P. (2000). Beyond conceptual change learning in science education: focusing on transfer, durability and metacognition. Educational Research, 42(2), 119-139.
Germann, P. J., & Aram, R. J. (1996). Student performances on the science processes of recording data, analyzing data, drawing conclusions, and providing evidence. Journal of Research in Science Teaching, 33(7), 773-798.
Glaser, R. (1984). Education and thinking: The role of knowledge. American Psychologist, 39(2), 93.
Gobert, J. D., & Koedinger, K. R. (2011). Using model-tracing to conduct performance assessment of students' inquiry skills within a microworld. Paper presented at the Society for Research on Educational Effectiveness, Washington, DC.
Goodson, L. A. (2000). Teaching and learning, strategies for complex thinking skills. In Annual Proceedings of Selected Research and Development Papers 1(2), 164-172.
Gott, R., & Duggan, S. (1995). Investigative work in the science curriculum. Buckingham: Open University Press.
Gott, R., & Duggan, S. (1996). Practical work: its role in the understanding of evidence in science. International Journal of Science Education, 18(7), 791–806.
Gott, R., & Duggan, S. (2002). Problems with the assessment of performance in practical science: Which way now?. Cambridge Journal of Education, 32(2), 183-201.
Gott, R., & Murphy, P. (1987). Assessing investigation at ages 13 and 15: Assessment of Performance Unit science report for teachers: 9. London: Department of Education and Science.
Gubbins, E. J. (1985). Matrix of thinking skills. Unpublished document. Hartfort, CT: State Department of Education. Cited in Sternberg, Robert J. (1986). Critical thinking: Its nature, measurement, and improvement. ERIC Document Reproduction Service, (272882), 9-26.
H
Hammann, M., Phan, T. T. H., Ehmer, M., & Grimm, T. (2008). Assessing pupils' skills in experimentation. Journal of Biological Education 42(2), 66-72.
Harlen, W. (1986). Science at age 11: Assessment of Performance Unit science report for teachers: 1. London: Department of Education and Science.
Harlen, W. (1991). Pupil assessment in science at the primary level. Studies in Educational Evaluation 17(2-3), 323-340.
Harlen, W. (1999). Purposes and procedures for assessing science process skills. Assessment in Education: principles, policy & practice, 6(1), 129-144.

158
Harlen, W., Bell, D., Devés, R., Dyasi, H., de la Garza, G. F., Léna, P., & Yu, W. (2012). Developing policy, principles and practice in primary school science assessment. London: Nuffield Foundation.
Harlen, W., & Qualter, A. (2009). The teaching of science in primary schools. Abingdon: Routledge.
Harmon, M., Smith, T. A., Martin, M. O., Kelly, D. L., Beaton, A. E., Mullis, I., Gonzalez, E. J., & Orpwood, G. (1997). Performance assessment: IEA's Third International Mathematics and Science Study (TIMSS). Chestnut Hill, MA: TIMSS & PIRLS International Study Center, Boston College.
Hofstein, A., & Lunetta, V. N. (2004). The laboratory in science education: Foundations for the twenty‐first century. Science Education, 88(1), 28-54.
Hohenstein, J., & Manning, A. (2010). Thinking about learning: learning in science. In J. Osborne & J. Dillon (Eds.), Good practice in science teaching: What research has to say. 68. (pp. 68-81). New York, NY: McGraw-Hill Education.
I
Inspectorate of Education (2015). Wereldoriëntatie. De stand van zaken in het onderwijs. [World orientation. The present state of education]. Utrecht: Inspectie van het Onderwijs.
J
Janssen, J., Verhelst, N. D., Engelen, R. J. H., & Scheltens, F. (2010). Wetenschappelijke verantwoording van de toetsen LOVS Rekenen-Wiskunde voor groep 3 tot en met 8 [Scientific Justification of Tests Arithmetic-Math for Grades 1 to 6]. Arnhem: Cito.
Jones, L. R., Wheeler, G., & Centurino, V. A. S. (2013). TIMSS 2011 science framework. In TIMSS 2015 assessment frameworks, edited by I. V. S. Mullis and M. O. Martin, 49–90. Chestnut Hill, MA: TIMSS & PIRLS International Study Center, Boston College.
K
Kane, M., Crooks, T., & Cohen, A. (1999). Validating measures of performance. Educational Measurement: Issues and Practice 18(2), 5-17.
Keselman, A. (2003). Supporting inquiry learning by promoting normative understanding of multivariable causality. Journal of Research in Science Teaching, 40, 898–921.
Kirschner, P. A., Sweller, J., & Clark, R. E. (2006). Why minimal guidance during instruction does not work: An analysis of the failure of constructivist, discovery, problem-based, experiential, and inquiry-based teaching. Educational Psychologist, 41(2), 75-86.
Kind, P. M. (1999). Performance assessment in science-what are we measuring?. Studies in Educational Evaluation, 25(3), 179-194.
Kind, P. M. (2013). Establishing assessment scales using a novel disciplinary rationale for scientific reasoning. Journal of Research in Science Teaching 50(5), 530-560.
Khishfe, R., & Abd‐El‐Khalick, F. (2002). Influence of explicit and reflective versus implicit inquiry‐oriented instruction on sixth graders' views of nature of science. Journal of Research in Science Teaching, 39(7), 551-578.
Klahr, D., & Li, J. (2005). Cognitive research and elementary science instruction: From the laboratory, to the classroom, and back. Journal of Science Education and Technology, 14(2), 217-238.
Klahr, D., & Nigam, M. (2004). The equivalence of learning paths in early science instruction: Effects of direct instruction and discovery learning. Psychological Science, 15(10), 661-667.
Klassen, S. (2006). Contextual assessment in science education: Background, issues, and policy. Science Education, 90(5), 820-851.

References
159
Kneepkens, B., Van der Schoot, F., & Hemker, B. (2011). Balans van het natuurkunde-en techniekonderwijs aan het einde van de basisschool, 4. Arnhem: Cito.
Kuhn, D. (1989). Children and adults as intuitive scientists. Psychological Review 96(4), 674-689.
Kuhn, D. (1997). Constraints or guideposts? Developmental psychology and science education. Review of Educational Research, 67(1), 141-150.
Kuhn, D. (1999). A developmental model of critical thinking. Educational Researcher 28(2), 16-46.
Kuhn, D., Black, J., Keselman, A., & Kaplan, D. (2000). The development of cognitive skills to support inquiry learning. Cognition and Instruction, 18(4), 495-523.
Kuhn, D., & Dean, D., Jr. (2004). Metacognition: A bridge between cognitive psychology and educational practice. Theory Into Practice 43(4), 268-273.
Kuhn, D., Garcia-Mila, M., Zohar, A., Andersen, C., White, S. H., Klahr, D., & Carver, S. M. (1995). Strategies of knowledge acquisition. Monographs of the society for research in child development, i-157.
Kuhn, D., Schauble, L., & Garcia-Mila, M. (1992). Cross-domain development of scientific reasoning. Cognition and Instruction, 9(4), 285-327.
L
Lawrenz, F., Huffman, D., & Welch, W. (2001). The science achievement of various subgroups on alternative assessment formats. Science Education 85(3), 279-290.
Lawson, A. E. (1989). Research on advanced reasoning, concept acquisition and a theory of science instruction. In Adolescent development and school science, edited by P. Adey, 11-36. London: Falmer Press.
Lazonder, A. W., & Egberink, A. (2014). Children’s acquisition and use of the control-of-variables strategy: Effects of explicit and implicit instructional guidance. Instructional Science, 42(2), 291-304.
Lazonder, A. W., & Harmsen, R. (2014). Supporting inquiry learning: A meta-analysis. Paper presented at the EARLI SIG 20 Conference on Computer-Supported Inquiry Learning.
Lazonder, A. W., & Harmsen, R. (2016). Meta-analysis of inquiry-based learning: Effects of guidance. Review of Educational Research, 86(3), 681-718.
Lazonder, A. W., & Kamp, E. (2012). Bit by bit or all at once? Splitting up the inquiry task to promote children's scientific reasoning. Learning and Instruction, 22(6), 458-464.
Lederman, N., & Lederman, J. (2014). Research on teaching and learning of nature of science. In N. G. Ledermann & S. K. Abell (Eds.), Handbook of research on science education, Vol. 2, (pp. 600-620). Abingdon: Routledge.
Lehrer, R., & Schauble, L. (2006). Scientific thinking and science literacy. In W. Damon, R. M. Lerner, & N. Eisenberg (Eds.), Handbook of child psychology (pp. 153-196). New York: Wiley.
Lewis, A., & Smith, D. (1993). Defining higher order thinking. Theory Into Practice 32(3), 131-137.
Loxley, P., Dawes, L., Nicholls, L., & Dore, B. (2013). Teaching primary science: Promoting enjoyment and developing understanding. Harlow, England: Pearson Education.
M
Maas, C. J., & Hox, J. J. (2005). Sufficient sample sizes for multilevel modeling. Methodology, 1(3), 86-92.
Mahdavi, M. (2014). An overview: Metacognition in education. International Journal of Multidisciplinary and Current Research, 2, 529-535.
Martin, M. O., Mullis, I. V., Beaton, A. E., Gonzalez, E. J., Smith, T. A., & Kelly, D. L. (1997). Science Achievement in the Primary School Years. IEA's Third International Mathematics and Science Study (TIMSS). Chestnut Hill, MA: TIMSS & PIRLS International Study Center, Boston College.

160
Martin, M. O., Mullis, I. V., Foy, P., & Stanco, G. M. (2012). TIMSS 2011 international results in science. Chestnut Hill, MA: TIMSS & PEARLS International Study Center, Boston College.
Martinot, M. J., Kuhlemeier, H. B., & Feenstra, H. J. M. (1988). Het meten van affectieve doelen: de validering en normering van de belevingsschaal voor wiskunde (BSW). Tijdschrift voor Onderwijsresearch 13(2), 65-76.
Matlen, B. J., & Klahr, D. (2013). Sequential effects of high and low instructional guidance on children’s acquisition of experimentation skills: Is it all in the timing? Instructional Science, 41(3), 621-634.
McGuinness, C., Eakin, A., Curry, C., Sheehy, N., & Bunting, B. (2007). Building thinking skills in thinking classrooms: ACTS in Northern Ireland. Paper presented at the 13th International Conference on Thinking Norrköping, Sweden. June 17-21; 2007 (No. 021, pp. 109-114. Linköping University Electronic Press.
McNeill, K. L., Lizotte, D. J., Krajcik, J., & Marx, R. W. (2006). Supporting students' construction of scientific explanations by fading scaffolds in instructional materials. The Journal of the Learning Sciences, 15(2), 153-191.
Messick, S. (1994). The interplay of evidence and consequences in the validation of performance assessments. Educational Researcher 23(2), 13-23.
Metz, K. E. (2011). Disentangling robust developmental constraints from the instructionally mutable: Young children's epistemic reasoning about a study of their own design. The Journal of the Learning Sciences, 20(1), 50-110.
Michaels, S., Shouse, A. W., & Schweingruber, H. A. (2007). Ready, set, science!: Putting research to work in K-8 science classrooms. Washington, D. C.: National Academies Press.
Millar, R., & Driver, R. (1987). Beyond processes. Studies in Science Education, 14(1), 33-62.
Millar, R., & Lubben, F. (1996). Knowledge and action: Students’ understanding of the procedures of scientific enquiry. Research in Science Education in Europe, 191-199.
Mislevy, R. J., & Haertel, G. D. (2006). Implications of evidence‐centered design for educational testing.Educational Measurement: Issues and Practice 25(4), 6-20.
Moseley, D., Baumfield, V., Elliott, J., Gregson, M., Higgins, S., Miller, J., & Newton, D. P. (2005). Frameworks for thinking: A handbook for teaching and learning. Cambridge: Cambridge University Press.
N
National Academies of Sciences, Engineering, and Medicine [NASEM]. (2015). Science Teachers Learning: Enhancing Opportunities, Creating Supportive Contexts. Committee on Strengthening Science Education through a Teacher Learning Continuum. Board on Science Education and Teacher Advisory Council, Division of Behavioral and Social Science and Education. Washington, DC: The National Academies Press.
National Research Council [NRC]. (2012). A framework for K-12 science education: Practices, crosscutting concepts, and core ideas. Washington, DC: The National Academies Press.
National Research Council. (2014). Developing assessments for the next generation science standards. Committee on Developing Assessments of Science Proficiency in K-12. Board on Testing and Assessment and Board on Science Education, J. W. Pellegrino, M. R. Wilson, J. A. Koenig, and A. S. Beatty, Editors. Washington, DC: National Academies Press.
Newmann, F. M. (1990). Higher order thinking in teaching social studies: A rationale for the assessment of classroom thoughtfulness. Journal of Curriculum Studies 22(1), 41-56.
NGSS Lead States (2013). Next generation science standards: for states, by states. Washington, DC: The National Academies Press.

References
161
O
OECD (2013). PISA 2012 assessment and analytical framework: Mathematics, reading, science, problem solving and financial literacy. Paris: OECD Publishing.
OECD (2015). OECD science, technology and industry scoreboard 2015: Innovation for growth and society. Paris: OECD Publishing. http://dx.doi.org/10.1787/sti_scoreboard-2015-en
OECD. (2017). PISA for development assessment and analytical framework: Reading, mathematics and
science, preliminary version. Paris: OECD Publishing.
Oliver, M., Venville, G., & Adey, P. (2012). Effects of a cognitive acceleration programme in a low socioeconomic high school in regional Australia. International Journal of Science Education, 34(9), 1393-1410.
Osborne, J. (2014). Teaching scientific practices: Meeting the challenge of change. Journal of Science Teacher Education 25(2), 177-196.
Osborne, J. (2015). Practical work in science: Misunderstood and badly used? School Science Review, 96(357), 16-24.
Osborne, J., & Dillon, J. (2008). Science education in Europe: Critical reflections (Vol. 13). London: The Nuffield Foundation.
P
Pellegrino, J. W. (2012). Assessment of science learning: Living in interesting times. Journal of Research in Science Teaching, 49(6), 831-841.
Pellegrino, J. W. (2014). Assessment as a positive influence on 21st century teaching and learning: A systems approach to progress. Psicología Educativa, 20(2), 65-77.
Perkins, D. N., & Salomon, G. (1989). Are cognitive skills context-bound?. Educational Researcher, 18(1), 16-25.
Pine, J., Aschbacher, P., Roth, E., Jones, M., McPhee, C., Martin, C., Phelps, S., Kyle, T., & Foley, B. (2006). Fifth graders' science inquiry abilities: A comparative study of students in hands‐on and textbookcurricula. Journal of Research in Science Teaching, 43(5), 467-484.
Pintrich, P. R. (2002). The role of metacognitive knowledge in learning, teaching, and assessing. Theory Into Practice, 41(4), 219-225.
R
Rasbash, J., Steele, F., Browne, W. J., Goldstein, H. (2009). A user’s guide to MLwiN. London: Institute of Education.
Roberts, R., & Gott, R. (2006). Assessment of performance in practical science and pupil attributes. Assessment in Education: Principles, Policy & Practice, 13(1), 45-67.
Roth, K. J. (2014). Elementary science teaching. In N. G. Ledermann & S. K. Abell (Eds.), Handbook of research on science education, Vol. 2, (pp. 361–393). New York: Routledge.
Ruiz‐Primo, M. A., Baxter, G. P., & Shavelson, R. J. (1993). On the stability of performance assessments.Journal of Educational Measurement, 30(1), 41-53.
S
Sahin, A., & Kulm, G. (2008). Sixth grade mathematics teachers’ intentions and use of probing, guiding, and factual questions. Journal of mathematics teacher education, 11(3), 221-241.
Science Education Hub Radboud University (WKRU) (2016). The Question Machine. Retrieved June 28, 2016 from http://www.ru.nl/wetenschapsknooppunt/english/materials/

162
Schellings, G. L., van Hout-Wolters, B. H., Veenman, M. V., & Meijer, J. (2013). Assessing metacognitive activities: The in-depth comparison of a task-specific questionnaire with think-aloud protocols. European journal of psychology of education, 28(3), 963-990.
Schilling, M., Hargreaves, L., Harlen, W., & Russell, T. (1990). Assessing science in the primary classroom: Written tasks. London: Paul Chapman Publishing.
Schraw, G. (1998). Promoting general metacognitive awareness. Instructional Science, 26(1-2), 113-125.
Schraw, G., Crippen, K. J., & Hartley, K. (2006). Promoting self-regulation in science education: Metacognition as part of a broader perspective on learning. Research in Science Education, 36(1-2), 111-139.
Schraw, G., & Moshman, D. (1995). Metacognitive theories. Educational Psychology Review, 7(4), 351-371.
Shavelson, R. J., Baxter, G. P., & Pine, J. (1991). Performance assessment in science. Applied Measurement in Education, 4(4), 347-362.
Shavelson, R. J., Carey, N. B., & Webb, N. M. (1990). Indicators of science achievement: Options for a powerful policy instrument. Phi Delta Kappan, 71(9), 692-697.
Shavelson, R. J., Solano-Flores, G., & Ruiz-Primo, M. A. (1998). Toward a science performance assessment technology. Evaluation and Program Planning, 21(2), 171-184.
Solano-Flores, G., Javanovic, J., Shavelson, R. J., & Bachman, M. (1999). On the development and evaluation of a shell for generating science performance assessments. International Journal of Science Education 21(3), 293-315.
Song, J., & Black, P. J. (1992). The effects of concept requirements and task contexts on pupils’ performance in control of variables. International Journal of Science Education 14(1), 83-93.
Sperling, R. A., Howard, B. C., Miller, L. A., & Murphy, C. (2002). Measures of children's knowledge and regulation of cognition. Contemporary Educational Psychology, 27(1), 51-79.
Stecher, B. M., Klein, S. P., Solano-Flores, G., McCaffrey, D., Robyn, A., Shavelson, R. J., & Haertel, E. (2000). The effects of content, format, and inquiry level on science performance assessment scores. Applied Measurement in Education, 13(2), 139-160.
Steiger, J. H. (1980). Tests for comparing elements of a correlation matrix. Psychological Bulletin, 87, 245-251.
Sternberg, R. J. (1985). Beyond IQ: A triarchic theory of human intelligence. New York: Cambridge University Press.
Sternberg, R. J. (1986). Critical thinking: Its nature, measurement, and improvement. Washington, DC: National Institute of Education (ED).
Strand-Cary, M., & Klahr, D. (2008). Developing elementary science skills: Instructional effectiveness and path independence. Cognitive Development, 23(4), 488-511.
Sweller, J., Kirschner, P. A., & Clark, R. E. (2007). Why minimally guided teaching techniques do not work: A reply to commentaries. Educational Psychologist, 42(2), 115-121.
T
Tamir, P. (1988). Science practical process skills of ninth grade students in Israel. Research in Science & Technological Education, 6(2), 117-131.
Tanner, K. D. (2012). Promoting student metacognition. CBE-Life Sciences Education, 11(2), 113-120.
te Nijenhuis, J., Tolboom, E., Resing, W., & Bleichrodt, N. (2004). Does cultural background influence the intellectual performance of children from immigrant groups?: Validity of the RAKIT intelligence test for immigrant children. European Journal of Psychological Assessment 20(1), 10-26.

References
163
Toth, E., Klahr, D., & Chen, Z. (2000). Bridging research and practice: A cognitively based classroom intervention for teaching experimentation skills to elementary school children. Cognition and Instruction, 18(4), 423-459.
V
van de Pol, J., Volman, M., & Beishuizen, J. (2010). Scaffolding in teacher–student interaction: A decade of research. Educational Psychology Review, 22(3), 271-296.
Vandevelde, S., Van Keer, H., & Rosseel, Y. (2013). Measuring the complexity of upper primary school children’s self-regulated learning: A multi-component approach. Contemporary Educational Psychology, 38(4), 407-425.
van Graft, M., & Kemmers, P. (2007). Onderzoekend en ontwerpend leren bij natuur en techniek. Basisdocument over de didactiek voor onderzoekend en ontwerpend leren in het primair onderwijs. Enschede: SLO.
van Graft, M., Klein Tank, M., & Beker, T. (2014). Wetenschap & technologie in het basis – en speciaal onderwijs. Enschede: SLO.
Vandewaetere, M., Manhaeve, D., Aertgeerts, B., Clarebout, G., van Merriënboer, J., & Roex, A. (2015). 4C/ID in medical education: How to design an educational program based on whole-task learning: AMEE Guide No. 93, Medical Teacher, 37(1), 4-20.
van Merriënboer, J. J. G., Jelsma, O., & Paas, F. (1992). Training for reflective expertise: A four-component instructional design model for complex cognitive skills. Educational Technology Research and Development, 40(2), 23-43.
van Merriënboer, J. J. G., Clark, R. E., de Croock, M. B. M. (2002). Blueprints for complex learning: The 4C/ID-model. Educational Technology Research and Development, 50(2), 39-61.
van Merriënboer, J. J. G., & Sweller, J. (2005). Cognitive load theory and complex learning: Recent developments and future directions. Educational psychology review, 17(2), 147-177.
Veenman, M. V., Elshout, J. J., & Meijer, J. (1997). The generality vs domain-specificity of metacognitive skills in novice learning across domains. Learning and Instruction, 7(2), 187-209.
Veenman, M. V., Van Hout-Wolters, B. H., & Afflerbach, P. (2006). Metacognition and learning: Conceptual and methodological considerations. Metacognition and learning, 1(1), 3-14.
Veenman, M. V., Wilhelm, P., & Beishuizen. J. J. (2004). The relation between intellectual and metacognitive skills from a developmental perspective. Learning and Instruction, 14(1), 89-109.
Vogler, K. E. (2002). The impact of high-stakes, state-mandated student performance assessment on teachers' instructional practices. Education, 123(1), 39-56.
W
Wallace, B., Bernardelli, A., Molyneux, C., & Farrell, C. (2012). TASC: Thinking actively in a social context. A universal problem-solving process: A powerful tool to promote differentiated learning experiences. Gifted Education International, 28(1), 58-83.
Weekers, A., Groenen, I., Kleintjes, F. G. M., & Feenstra, H. (2011). Wetenschappelijke verantwoording papieren toetsen Begrijpend lezen voor groep 7 en 8. Arnhem: Cito.
White, B. Y., & Frederiksen, J. R. (1998). Inquiry, modeling, and metacognition: Making science accessible to all students. Cognition and Instruction, 16(1), 3-118.
White, B., & Frederiksen, J. (2000). Metacognitive facilitation: An approach to making scientific inquiry accessible to all. In J. Minstrell & E. van Zee (Eds.), Inquiring into inquiry learning and teaching in science (pp. 331-370).Washington, DC: American Association for the Advancement of Science.

164
Wiliam, D. & Thompson, M. (2007). Integrating assessment with instruction: What will it make it work?. In CA. Dwyer (Ed.), The future of assessment: Shaping teaching and learning. Mahwah, N.J.: Lawrence Erlbaum Associates.
Wood, D., Bruner, J. S., & Ross, G. (1976). The role of tutoring in problem solving. Journal of Child Psychology and Psychiatry, 17(2), 89-100.
Wu, H., & Krajcik, J. S. (2006). Inscriptional practices in two inquiry‐based classrooms: A case study ofseventh graders' use of data tables and graphs. Journal of Research in Science Teaching, 43(1), 63-95.
Z
Zimmerman, C. (2007). The development of scientific thinking skills in elementary and middle school. Developmental Review, 27(2), 172-223.
Zohar, A., & Barzilai, S. (2013). A review of research on metacognition in science education: Current and future directions. Studies in Science Education, 49(2), 121-169.
Zohar, A., & Ben-David, A. (2008). Explicit teaching of meta-strategic knowledge in authentic classroom situations. Metacognition and Learning, 3(1), 59-82.
Zohar, A., & Dori, Y. J. (2003). Higher order thinking skills and low-achieving students: Are they mutually exclusive?. Journal of the Learning Sciences, 12(2), 145-181.

165
CHAPTERS IN THIS THESIS
AND CONTRIBUTIONS OF
CO-AUTHORS
Chapter 2 is based on:
Kruit, P. M., Oostdam, R. J., van den Berg, E., & Schuitema, J. A. (submitted). An instructional
framework for teaching science skills in primary science education.
Contributions:
Patricia Kruit is the first author of this article. She reviewed literature, collected and
analyzed the data, and drafted the various versions of the paper. The research team further
consisted of Ron Oostdam, Ed van den Berg and Jaap Schuitema, who were the supervisors
of Patricia Kruit. This research team collaboratively conceptualized and designed the study.
In addition, the research team discussed all the steps in the process of the design and
outcomes. The supervisors reviewed the manuscript and provided feedback.
Chapter 3 is published as:
Kruit, P. M., Oostdam, R. J., van den Berg, E., & Schuitema, J. A. (2018). Assessing students’
ability in performing scientific inquiry: instruments for measuring science skills in primary
education. Research in Science & Technological Education, 36 (4), 413-439.
DOI: 10.1080/02635143.2017.1421530
Contributions:
Patricia Kruit reviewed the literature, collected and analyzed the data and drafted the
various versions of the paper. The research team further consisted of Ron Oostdam, Ed van
den Berg and Jaap Schuitema, who together supervised Patricia Kruit. The research team
collaboratively conceptualized and designed the study and discussed the various steps of
the research. The supervisors contributed to the interpretation of the outcomes, and
reviewed and checked the paper.

166
Chapter 4 is published as:
Kruit, P. M., Oostdam, R. J., van den Berg, E., & Schuitema, J. A. (2018). Effects of explicit
instruction on the acquisition of students’ science inquiry skills in grades 5 and 6 of primary
education. International Journal of Science Education, 40 (4), 421-441.
DOI: 10.1080/09500693.2018.1428777
Contributions:
Patricia Kruit is the first author of this article. She reviewed the literature, collected and
analyzed the data and drafted the various versions of the manuscript. The research team
for this article further consisted of Ron Oostdam, Ed van den Berg and Jaap Schuitema,
who were the supervisors of Patricia Kruit. The research team collaboratively
conceptualized and designed the study, deliberated about the data analysis and its
outcomes. The supervisors audited the analysis and interpretation of the data and
contributed to reviews and revisions of the manuscript.
Chapter 5 is based on:
Kruit, P. M., Oostdam, R. J., van den Berg, E., & Schuitema, J. A. (2018). Performance
assessment as a diagnostic tool for science teachers. Research in Science Education.
DOI: 10.1007/s11165-018-9724-9
Contributions:
As the first author, Patricia Kruit reviewed the literature, collected and analyzed the data
and drafted the various versions of the manuscript. The research team for this article
further consisted of Ron Oostdam, Ed van den Berg and Jaap Schuitema, who were the
supervisors of Patricia Kruit. The research team collaboratively conceptualized and
designed the study, discussed the data analysis and its outcomes. The supervisors
contributed to the analysis and interpretation of the data and reviewed and revised the
manuscript.

167
SAMENVATTING
Inleiding
Wetenschap & Techniek (W&T) neemt in het primair onderwijs in de meeste landen een
belangrijke plaats in. Doel van onderwijsbeleid is innovatie te versterken door het W&T
onderwijs te verbeteren en meer mensen naar banen te trekken in de wetenschap, techniek
en wiskunde. W&T onderwijs is erop gericht leerlingen te ontwikkelen tot wetenschappelijk
geletterde burgers. Dat betekent onder andere dat leerlingen natuurwetenschappelijk
denken ontwikkelen door te ervaren hoe kennis wordt gegenereerd, verbeterd en
gevalideerd door middel van natuurwetenschappelijk onderzoek. In het basisonderwijs is er
daarom toenemende aandacht voor het aanleren van onderzoeksvaardigheden in de W&T
lessen en is het aanleren van deze vaardigheden als leerdoel opgenomen in de
schoolcurricula.
In de praktijk blijkt het echter lastig om de leerdoelen voor onderzoeksvaardigheden
concreet te implementeren in de lessen W&T. De focus ligt vaak op de praktische aspecten
van onderzoek, zoals observeren en metingen doen, maar veel minder op de cognitieve
aspecten, zoals het trekken van conclusies gebaseerd op resultaten. Daarnaast worden in
het basisonderwijs de onderzoeksvaardigheden doorgaans onderwezen door middel van
onderzoekend leren. De aanname die hieraan te grondslag ligt, is dat leerlingen door het
zelf uitvoeren van een experiment gaandeweg onderzoeksvaardigheden aanleren en
tegelijkertijd leren begrijpen hoe de wetenschap in elkaar zit. Alhoewel er bewijs is dat
leerlingen ook onderzoeksvaardigheden leren door doen, lijkt steeds meer onderzoek erop
te wijzen dat expliciete instructie effectiever is. Dat betekent dat met name bij
basisschoolleerlingen die op het gebied van onderzoek doen onervaren zijn,
onderzoeksvaardigheden beter op systematische wijze kunnen worden aangeleerd.
In dit promotieonderzoek is nagegaan in hoeverre een expliciete instructiemethode
effectiever is dan leren door doen, wat de gangbare praktijk is in de meeste W&T lessen op
basisscholen. Om de effecten van beide methodieken te onderzoeken zijn verschillende
meetinstrumenten ontwikkeld en is de psychometrische kwaliteit onderzocht.
Er worden in dit proefschrift vier verschillende studies beschreven. De eerste studie
betreft een beschrijving van het instructieraamwerk (een set ontwerpprincipes) dat
gebruikt is om experimentele lessenseries te ontwerpen. De tweede studie bespreekt de
betrouwbaarheid en validiteit van de verschillende meetinstrumenten waaronder
zogeheten ‘performance assessments’. In de derde studie worden de effecten van de
168
experimentele interventies geanalyseerd en besproken. Ten slotte gaat de vierde studie in
op het gebruik van performance assessments als diagnostisch instrument voor de docent.
Studie 1: het instructieraamwerk
In de eerste studie is een instructieraamwerk ontwikkeld waarmee lessen ontworpen
kunnen worden voor het aanleren van onderzoeksvaardigheden via expliciete instructie. In
het instructieraamwerk wordt uitgegaan van drie verschillende vaardigheden die ten
grondslag liggen aan het toepassen van onderzoeksvaardigheden, namelijk
natuurwetenschappelijk-specifieke vaardigheden (zoals het maken van een grafiek),
algemene denkvaardigheden (zoals het analyseren van data) en metacognitieve
vaardigheden (zoals het monitoren en evalueren van de taakuitvoering).
Eerder onderzoek liet zien dat het lastig is voor leerlingen om de verschillende
typen vaardigheden in complexe W&T taken geïntegreerd toe te passen. Om die reden
maakten we gebruik van de uitgangspunten van het 4C/ID model (van Merriënboer, Jelsma,
& Paas, 1992): grote, complexe leertaken worden gecombineerd met kleinere eenvoudige
deeltaken. De deeltaken hebben als doel specifieke vaardigheden aan te leren en te
versterken, alvorens deze geïntegreerd toe te passen in een complexe taak. In de loop van
een lessenserie worden de deeltaken en de complexe taken zorgvuldig opgebouwd qua
moeilijkheidsgraad. Naarmate leerlingen de vaardigheden beter beheersen, wordt de
ondersteuning en feedback tijdens de uitvoering van de taken langzaam afgebouwd tot het
moment dat leerlingen een complexe taak geheel zelfstandig kunnen uitvoeren.
Om leerlingen voldoende structuur te bieden, wordt de opbouw van de lessen
vormgegeven volgens de stappen van de empirische onderzoekscyclus:
1. het formuleren van een onderzoeksvraag
2. het formuleren van een hypothese
3. het opzetten van een experiment
4. het meten en noteren van data
5. het analyseren van resultaten
6. het trekken van een conclusie
In elke les voeren de leerlingen een compleet experiment uit dat gestructureerd is volgens
de empirische onderzoekscyclus. Daarnaast krijgen zij in elke les steeds expliciete
verdiepende instructie ten aanzien van een bepaalde stap en oefenen zij de betreffende
stap (bijvoorbeeld het formuleren van een goede onderzoeksvraag) ook in de deeltaken

Samenvatting
169
waarin eveneens aandacht is voor de verschillende typen vaardigheden die zij daarbij
moeten toepassen.
De expliciete verdiepende instructie bestond uit uitleg van de docent, gevolgd door
een klassengesprek over de wijze waarop de onderzoeksvaardigheden moeten worden
toegepast. Tijdens het uitvoeren van de complexe experimenten kregen leerlingen
begeleiding in de vorm van hulpvragen en geheugensteuntjes. De metacognitieve
vaardigheden werden aangeleerd door telkens terugkerende vragen in het werkboek
welke leerlingen stimuleren deze vaardigheden toe te passen. Bijvoorbeeld: Wat is het doel
van dit experiment?, Volg ik nog steeds mijn planning?, Hoe is het gegaan?
Het instructieraamwerk biedt de mogelijkheid om op systematische wijze lessen te
ontwerpen waarin onderzoeksvaardigheden expliciet onderwezen kunnen worden. In een
pilotstudie bleken de lessen goed uitvoerbaar te zijn voor docenten in combinatie met hun
dagelijkse lespraktijk. De leerlingen gaven aan de lessen bovendien leuk te vinden.
Studie 2: het meten van onderzoeksvaardigheden
Eerder onderzoek liet zien dat het lastig is om onderzoeksvaardigheden betrouwbaar en
valide te toetsen. Vaak wordt gebruik gemaakt van schriftelijke toetsen, maar deze hebben
als nadeel dat ze het toepassen van specifieke onderzoeksvaardigheden bij een ‘echt’
experiment niet kunnen toetsen. Performance assessments (toetsen op basis van
individuele mini-onderzoeken en een leerlingverslag) worden beschouwd als een meer
valide manier om onderzoeksvaardigheden te meten, maar de scores op deze toetsen zijn
niet altijd consistent.
In deze studie werd onderzocht in hoeverre de verschillende typen onderzoeks-
vaardigheden betrouwbaar en valide gemeten kunnen worden. Er werden verschillende
meetinstrumenten ontwikkeld met uiteenlopende formats: een schriftelijke toets, drie
performance assessments met elk een ander onderwerp (Skateboard, Bungee Jump en Hot
Chocolate) en vragenlijsten waarbij leerlingen het toepassen van hun eigen metacognitieve
vaardigheden ten aanzien van het uitvoeren, bewaken en evalueren van
onderzoeksactiviteiten moeten beoordelen op een 3-puntsschaal (nooit, soms, altijd). Het
betrof de metacognitieve vragenlijsten ‘Junior Metacognitive Awareness Inventory’ (Jr.
MAI) (Sperling et al., 2002) en ‘Science Meta Test’ (SMT).
Om te onderzoeken of convergentie tussen verschillende toetsvormen kan worden
verbeterd, zijn de schriftelijke toets en de performance assessments systematisch
opgebouwd volgens de principes van de onderliggende vaardigheden en de stappen van de
empirische onderzoekscyclus.

170
De resultaten na afname van de toetsen met 128 leerlingen uit groep 7 en 8 lieten zien dat
de schriftelijke toets en de drie performance assessments voldoende betrouwbaar waren.
Uit de samenhang tussen de scores van de schriftelijke toets en de drie performance
assessments kon tevens worden afgeleid dat met deze toetsen dezelfde vaardigheden
worden gemeten. Dit laat zien dat convergentie tussen verschillende toetsvormen
verbeterd kan worden door dezelfde onderliggende systematische opbouw te hanteren.
Daarnaast kon uit de resultaten worden afgeleid dat het door de systematische opbouw
mogelijk is om in meer detail te kijken naar het vermogen van leerlingen om bepaalde
onderzoeksvaardigheden toe te passen. Dit geeft gelegenheid om de toetsen ook
formatief te gebruiken.
De twee vragenlijsten bleken wel voldoende betrouwbaar, maar minder geschikt om
bij basisschoolleerlingen hun metacognitieve vaardigheden gedifferentieerd in kaart
brengen: de gemiddelde score was hoog met zeer weinig spreiding. Dit is waarschijnlijk te
wijten aan het beperkte vermogen van jonge leerlingen om hun eigen metacognitieve
vaardigheden in te schatten. Het is denkbaar dat de groep 7 en 8 leerlingen de
metacognitieve vaardigheden nog niet of onvoldoende beheersen, ook al denken ze zelf
van wel. Een alternatieve verklaring is dat de 3-puntsschaal te weinig gelegenheid biedt
voor de leerlingen om genuanceerd hun vaardigheden te beoordelen.
Studie 3: effect van expliciete instructie
In deze studie werden de effecten onderzocht van twee verschillende lessenseries
ontworpen op basis van het instructieraamwerk zoals beschreven in studie 1. Het
onderzoek is uitgevoerd bij 705 leerlingen verdeeld over 31 groepen 7 en 8 van 12
basisscholen. De studie was opgezet om het effect te meten van een interventie waarbij
leerlingen 8 weken lang expliciete instructie over onderzoeksvaardigheden kregen versus
een conditie waarin de onderzoeksvaardigheden werden onderwezen volgens het principe
van leren door doen zonder expliciete instructie. Hierdoor kon informatie over de
toegevoegde waarde van expliciete instructie worden verkregen. Ten slotte werd een
conditie toegevoegd met leerlingen die tijdens de interventie periode hun reguliere W&T
lessen volgden. Binnen scholen werden de groepen willekeurig verdeeld over de drie
condities (zie voor overzicht Figuur 4.2).
Bij de leerlingen werden de onderzoeksvaardigheden gemeten door middel van de
toetsen die ontwikkeld zijn in studie 2. In de voormeting werd een schriftelijke toets, een
performance assessment (Skateboard) en een vragenlijst (Jr. MAI) voor het meten van
metacognitieve vaardigheden afgenomen. Na de interventie periode waarin 8 lessen

Samenvatting
171
werden gegeven kreeg een deel van de leerlingen (n = 467) een schriftelijke toets, twee
performance assessments (Bungee Jump en Hot Chocolate) en beide metacognitieve
vragenlijsten (Jr. MAI en SMT) voorgelegd. Het onderwerp van de performance assessment
Hot Chocolate kwam overeen met het onderwerp Warmte & Temperatuur van de
interventielessen. Met het onderwerp van de performance assessment Bungee Jump waren
de leerlingen onbekend.
De resultaten lieten zien dat de lessen van beide experimentele condities hebben
gezorgd voor een verbeterde toepassing van onderzoeksvaardigheden in het performance
assessment Hot Chocolate. Echter, de leerlingen die les hadden gekregen via expliciete
instructie bleken het ook beter te doen bij het performance assessment Bungee Jump
waarvan het onderwerp niet in de lessen aan bod kwam. Deze resultaten wijzen erop dat
lessen het toepassen van onderzoeksvaardigheden kunnen verbeteren als er op
systematische wijze voldoende mogelijkheden voor leerlingen worden ingebouwd om de
vaardigheden te oefenen, maar dat systematische en expliciete instructie nodig is om
dieper leren van de vaardigheden te bewerkstelligen, waaronder het toepassen van de
vaardigheden in andere contexten.
Er is geen grote vooruitgang gemeten met de schriftelijke toets. Dit zou kunnen
samenhangen met de toetsvorm: de schriftelijke toets bestond uit voornamelijk
meerkeuzevragen en enkele open vragen. Dit betekent dat de schriftelijke toets minder
lijkt op de uitvoering van een echt onderzoek zoals het geval was bij zowel de performance
assessments als bij de experimenten die in de lessen van de interventie werden uitgevoerd.
Hierdoor waren de leerlingen wellicht minder goed in staat het geleerde toe te passen in
de schriftelijke toets.
De vragenlijsten lieten geen toename van de metacognitieve vaardigheden zien. Een
mogelijke verklaring is dat leerlingen hun eigen metacognitieve vaardigheden bij de
voormeting mogelijk hebben overschat waardoor er geen vooruitgang is gemeten.
Desalniettemin zou het kunnen dat hun metacognitieve vaardigheden wel degelijk zijn
verbeterd en hebben gezorgd voor hogere scores van de performance assessments in de
nameting.
Studie 4: performance assessment als diagnostisch instrument
In de laatste studie werd de bruikbaarheid voor docenten onderzocht van de performance
assessments als diagnostisch middel om instructie in de klas richting te geven. In het
algemeen besteden docenten meer tijd en inspanning aan summatieve toetsing dan aan
het formatief volgen van de vooruitgang van hun leerlingen. Informatie over de

172
vooruitgang die hun leerlingen maken is belangrijk voor het evalueren en het bijstellen van
hun eigen instructie in de klas en voor het ondersteunen en het geven van feedback op het
leerproces van de leerlingen.
De performance assessments zijn steeds systematisch opgebouwd aan de hand van
de stappen uit de empirische onderzoekscyclus. Door naar de scores te kijken die leerlingen
behaald hebben kan een gedetailleerd beeld worden verkregen van de leerlingprestaties
voor de afzonderlijke stappen. Om een beeld te krijgen van typische fouten die gemaakt
worden, is vervolgens gekeken naar voorbeelden van antwoorden door individuele
leerlingen.
In het algemeen lieten de scores zien dat de performance assessments voor deze
groep 7 en 8 leerlingen moeilijk waren. Niet elke stap uit de cyclus was voor hen even
moeilijk. De leerlingen vonden het bijvoorbeeld moeilijker om een onderzoeksopzet te
maken dan om een hypothese te formuleren. Er waren ook verschillen tussen de
performance assessments zelf: in Bungee Jump en Hot Chocolate waren de gemiddelde
scores voor de stap van het meten en noteren van data hoger dan in Skateboard. Alhoewel
leerlingen over het algemeen relatief laag scoorden, was er binnen elke stap uit de cyclus
wel veel variatie in de scores. Dit was vooral het geval bij het opzetten van een experiment,
het analyseren van resultaten en het formuleren van een conclusie. De antwoorden lieten
zien dat het ontwerp voor de experimenten niet erg gedetailleerd was en belangrijke
informatie miste die nodig is om te begrijpen hoe het experiment uitgevoerd zou moeten
worden. Bij het analyseren van de data hadden leerlingen moeite om hun conclusies
daadwerkelijk te baseren op de door henzelf gemeten data.
Op basis van deze bevindingen kan geconcludeerd worden dat de manier waarop
performance assessments geïmplementeerd en geanalyseerd worden, door de docent
gebruikt kan worden om informatie te krijgen over de ontwikkeling van de leerling. Deze
aanpak laat zien met welke stappen leerlingen met name veel moeite hebben. Hiermee
kunnen docenten hun instructie en activiteiten in de klas aanpassen. De antwoorden van
leerlingen kunnen gebruikt worden om meer specifieke en gerichte feedback te geven.
Deze studie laat zien dat het inzetten van performance assessments als diagnostisch
middel in de klas van toegevoegde waarde kan zijn voor zowel in kaart brengen van
vooruitgang van de leerlingen als om docenten te ondersteunen bij het evalueren en
verbeteren van hun W&T onderwijs.

Samenvatting
173
Beperkingen, suggesties voor verder onderzoek en aanbevelingen voor de
onderwijspraktijk
In het laatste hoofdstuk worden de belangrijkste bijdragen van dit proefschrift
gepresenteerd, gevolgd door beperkingen van het onderzoek en suggesties voor
vervolgonderzoek. Ten slotte worden aanbevelingen voor de onderwijspraktijk besproken.
Het proefschrift heeft twee belangrijke opbrengsten. Ten eerste een effectieve
aanpak om onderzoeksvaardigheden aan te leren en ten tweede verschillende toetsvormen
waarmee de onderzoeksvaardigheden gemeten kunnen worden. Een van de toetsvormen,
performance assessment, is ook bruikbaar om problemen van leerlingen te diagnosticeren
en daarmee instructie in de klas te optimaliseren. In het onderzoek wordt een quasi-
experimentele opzet toegepast met een groot aantal leerlingen in reguliere
onderwijscontext. Hierdoor voldoet het onderzoek aan empirische standaarden met
tegelijkertijd een hoge ecologische validiteit.
Beperkingen en suggesties voor verder onderzoek
In het onderzoek zijn onderzoeksassistenten (studenten van de universitaire pabo en
afgestudeerde docenten) getraind om de lessen te geven. Het voordeel daarvan is dat de
uitvoering van de lessen beter kon worden gecontroleerd dan wanneer de eigen docenten
het zouden geven. In vervolgonderzoek zou gekeken kunnen worden naar het effect van de
lessen als ze gegeven zouden worden door de reguliere groepsdocenten van scholen.
Een ander punt van aandacht betreft het gebruik van vragenlijsten om de
metacognitieve vaardigheden te meten. De vragenlijsten waren eenvoudig af te nemen bij
deze grote groep leerlingen, maar zij bleken niet in staat om een goede inschatting te
maken van hun eigen vaardigheden. In vervolgonderzoek zou gekeken kunnen worden naar
andersoortige methodieken om metacognitieve vaardigheden van leerlingen te meten,
zoals observaties, docentbeoordelingen of hardop-denken protocollen.
Ten slotte is gebruik gemaakt van performance assessments die zeer gestructureerd
waren. Voor vervolgonderzoek is het interessant om onderzoeksvaardigheden eveneens te
trainen en te meten met behulp van open onderzoeksopdrachten waarbij leerlingen
zelfstandig keuzes moeten maken en meer inbreng hebben in de keuze van onderwerp en
uitvoering van een experiment.

174
Aanbevelingen voor de onderwijspraktijk
Ten eerste adviseer ik docenten om leerlingen niet alleen experimenten te laten uitvoeren
puur als leuk en motiverend onderdeel van W&T lessen, maar om net zoveel aandacht te
besteden aan het aanleren van onderzoeksvaardigheden als er nu besteed wordt aan
inhoudelijke kennis over natuurwetenschappelijke fenomenen. Het is belangrijk om
deeltaken en steeds complexere experimenten zorgvuldig op te nemen in het W&T
programma, tot de leerlingen in staat zijn om alle vaardigheden zelfstandig en
geïntegreerd toe te passen. Daarnaast adviseer ik docenten feedback te geven en gerichte
vragen te stellen waarmee de leerlingen hun taakuitvoering kunnen monitoren en
evalueren, zodat de metacognitieve vaardigheden van leerlingen ontwikkeld worden.
De tweede aanbeveling betreft het instructieraamwerk. Het instructieraamwerk
biedt een handzame leidraad voor docenten en onderwijsontwikkelaars om lessen te
ontwerpen en onderwijzen waarin onderzoeksvaardigheden aangeleerd worden.
Bovendien biedt de categorisatie van onderzoeksvaardigheden in drie onderliggende
vaardigheden mogelijkheden om de lessen te integreren met het reken- en taalonderwijs
op de scholen. Algemene denkvaardigheden en metacognitieve vaardigheden zijn immers
belangrijke vaardigheden die niet alleen in de lessen W&T, maar ook bij andere vakken
geleerd en toegepast kunnen worden. Niet alleen zal dit bij kunnen dragen aan een
stevigere positie van W&T onderwijs in de basisschool, maar leerlingen zullen er mogelijk
ook baat bij hebben als algemene denkvaardigheden en metacognitieve vaardigheden in
meer verschillende vakken worden toegepast en geoefend. Een breder aanbod aan taken
waarin de vaardigheden worden toegepast zou kunnen leiden tot een beter begrip en
toepassing ervan in leertaken in het gehele curriculum.
Ten derde adviseer ik docenten om het toetsen van de onderzoeksvaardigheden
niet te beperken tot schriftelijke toetsen met uitsluitend meerkeuze of open vragen.
Performance assessments zijn niet alleen meer valide, maar kunnen tevens dienen om de
vooruitgang op de diverse onderzoeksvaardigheden beter zichtbaar te maken. Dit heeft als
voordeel dat docenten hun instructie kunnen aanpassen en specifieke problemen bij het
leren kunnen aanpakken.
Ten slotte wil ik opmerken dat één van de deelnemende scholen in Amsterdam de
expliciete instructiemethode in hun eigen W&T curriculum heeft opgenomen. De school
heeft eigen docenten getraind om de lessen te geven en leerlingen uit groep 8 worden
ingezet om leerlingen uit lagere groepen te helpen bij het uitvoeren van de experimenten
in deze lessen. Dit laat zien dat het proefschrift heeft bijgedragen aan kennis over de
effectiviteit van lessen gericht op de ontwikkeling van onderzoeksvaardigheden, maar
daarnaast ook relevant en bruikbaar is voor de echte onderwijspraktijk.

175
DANKWOORD
De grootste dank gaat natuurlijk uit naar alle kinderen die zo enthousiast hebben
deelgenomen aan dit onderzoek. Hun docenten wil ik bedanken voor de gastvrijheid en het
vertrouwen dat zij ons gegeven hebben om hun leerlingen les te geven.
Ilse Wassenaar, bedankt voor je goede ideeën bij het ontwerpen van de lessen. Anke
van der Veen en Miranda Wolse, dank voor het uitproberen van alle lessen en jullie
feedback. Dieneke Blikslager, bedankt voor het zo enthousiast uitzetten van de lessen in je
school. Leuk om zulke topdocenten aan het werk te zien met mijn materiaal!
Mijn bijzondere dank gaat uit naar alle onderzoeksassistenten die met veel
toewijding en inspanning de lessen hebben gegeven en toetsen hebben afgenomen en
beoordeeld. Anke, Lykke, Suzanne van den Bergh, Jamie, Jill, Layla, Sara, Manon, Romy,
Samira, Sander, Simone, Daan, Zinzi, Jaël, Suzanne Arends, Wesley, Ramona, Simone en
Dieneke, jullie hebben met engelengeduld en pedagogisch inzicht met de kinderen gewerkt
en daarnaast is het jullie gelukt om je te houden aan de vereisten die bij experimenteel
onderzoek komt kijken. Dankzij jullie enthousiasme, betrokkenheid en flexibiliteit was het
mogelijk om het onderzoek op deze schaal uit te voeren.
Ruben Fukkink, jouw methodologische ondersteuning heb ik bijzonder gewaardeerd.
Ik heb je vaak lastig gevallen met allerlei vragen en altijd nam je de tijd voor een
uitgebreide en zeer heldere uitleg.
Mijn lieve kamergenoten en mede-promovendi Eline, Aisa, Hessel, Liz, Rosa, Jannet,
Fiona, Huub en Marloes wil ik bedanken voor alle steun, hulp en een luisterend oor in de
moeilijke momenten, maar vooral voor jullie vriendschap en de luide gesprekken in de
“stiltekamer”.
Lieve Eline en Rosa, ik ben blij en vereerd dat jullie mijn paranimfen willen zijn. Mee
buffelen tot het eind!
Het secretariaat van het kenniscentrum dank ik zeer voor alle ondersteuning. Irene
en nichtje, bedankt voor het inpakken van al die dozen met materialen voor de scholen. Een
enorme klus die ik nooit in mijn eentje gedaan zou kunnen hebben.
Mijn bio-collega’s, dank voor het meejuichen bij belangrijke mijlpalen tijdens het
onderzoek. Freke, dank voor je geduld, begrip en het meedenken op momenten dat ik het
onderzoek voorrang moest geven. Marco, fijn dat je weleens een extra les kon overnemen.
Evelien, bedankt voor het vertalen van toetsvragen. Wouter, dank voor het besteden van je
tijd aan het meedenken over de toetsen. Jouw inbreng is van grote waarde geweest.

176
Mijn promotor Ron Oostdam en copromotoren Ed van den Berg en Jaap Schuitema wil ik
bedanken voor hun kundige begeleiding. Zonder jullie grote betrokkenheid bij mijn
onderzoek en het delen van jullie expertise en ervaring zou dit proefschrift niet geworden
zijn zoals het nu is.
My dear sister-in-law Natasha, I am very grateful for the time you invested to
thoroughly read and revise my thesis. Adrian, heel veel dank dat ik gebruik mocht maken
van je tekentalent. Emma en Laura, fijn dat jullie vele uren achter het kopieerapparaat
wilden staan om alle werkboekjes in te scannen. Arnold, bedankt voor je immer kritische
kijk op zo’n beetje alles. Pap, bedankt dat je geen moment onbetuigd laat om te laten
merken dat je trots op mij bent.
Arnold, Emma en Laura, jullie zijn de enige echt constante variabele geweest in het
hele onderzoek. Dank daarvoor!