validating estimates of merchantable volume from … · validating estimates of merchantable volume...
TRANSCRIPT
Validating estimates of merchantable volume from airborne laser scanning (ALS)
data using weight scale data
Joanne C. White1,
*, Michael A. Wulder1, Glenn Buckmaster
2
1 Canadian Forest Service (Pacific Forestry Centre), Natural Resources Canada, 506 West Burnside
Road, Victoria, British Columbia, V8Z 1M5, Canada
2
Hinton Wood Products, A Division of West Fraser Mills Ltd, 756 Switzer Drive, Hinton Alberta,
T7V 0A2, Canada
*Corresponding author:
E-Mail: [email protected]
Keywords: remote sensing, airborne laser scanning; LiDAR; forest inventory; area-based
approach; merchantable volume; weight scale; validation
Pre-print of published version
White, J.C., Wulder, M.A., Buckmaster, G. 2014. Validating estimates of merchantable volume from
airborne laser scanning (ALS) data using weight scale data. The Forestry Chronicle, 90(9): 378–385.
DOI:
http://dx.doi.org/10.5558/tfc2014-072
Disclaimer:
The PDF document is a copy of the final version of this manuscript that was subsequently accepted by
the journal for publication. The paper has been through peer review, but has not been subject to any
additional copy-editing or journal specific formatting (so will look different from the final version of
record, which may be accessed following the DOI above depending on your access situation).

2
2
Abstract
There is increasing interest in the use of airborne laser scanning (ALS; also referred to as
airborne Light Detection and Ranging or LiDAR) for forest inventory purposes in Canada.
Timber volume is one of the key inventory attributes that is commonly estimated using ALS
data, and estimates of volume can be validated using post-harvest measures. ALS data and the
area-based approach were used to develop an enhanced forest inventory for the Hinton Forest
Management Area (FMA) in central Alberta, Canada. Weight scale measures of coniferous
merchantable volume from 272 stands harvested between 2008 and 2010 were used as validation
data for both conventional and ALS-based estimates. Overall, conventional estimates of
coniferous merchantable volume derived from cover type adjusted volume tables were found to
underestimate weight scale volumes by 19.8%. Conversely, estimates generated from the ALS
data overestimated weight scale volumes by 0.6%. ALS-based estimates provide wall-to-wall,
spatially explicit estimates of merchantable volume, enable within-stand variability in
merchantable volume to be characterized, and are beneficial for strengthening linkages between
strategic and operational forest planning.
3
3
Introduction
Airborne laser scanning (ALS) data, also referred to as Light Detection and Ranging (LiDAR), enables
the accurate three-dimensional characterization of forest vertical structure (Wulder et al. 2008). ALS
data have become an important asset for forest managers, providing highly detailed bare earth digital
elevation models (DEMs) and enabling the estimation of a range of forest inventory attributes (e.g.
height, basal area, volume) (Evans et al. 2006; Hyyppä et al. 2008; Lim et al. 2003, Reutebuch et al.
2005, Wulder et al. 2008). The integration of ALS into operational forest inventories was pioneered in
Scandinavian countries such as Norway, Finland, and Sweden (Næsset et al. 2004). Several
jurisdictions and licensees in Canada are exploring the use of ALS data to produce enhanced forest
inventories (e.g., Woods et al. 2011), with strong interest shown by the forest inventory and
management communities in a range of ALS applications (Pitt and Pineau 2009).
The area-based prediction of forest inventory attributes (hereafter referred to as the area-based
approach) is based on empirical relationships between predictor variables derived from ALS data, and
response variables measured from ground plots (Næsset 2002). The successful application of the area-
based approach is based on accurate measurements of forest height from ALS data, and on the
availability of quality ground plot measurements (Frazer et al 2011). The goal of the area-based
approach is to generate wall-to-wall estimates and maps of inventory attributes such as basal area or
volume. When compared to conventional stand-level inventories, the foremost advantages of the area-
based approach are the exhaustive spatial coverage of ALS data and the derived inventory attributes,
the increased precision with which certain forest attributes may be estimated, and the capacity to scale
estimates to the stand level (Woods et al. 2011; White et al. 2013). Forest attributes, such as biomass,
stem volume, basal area, mean diameter, mean height, dominant height, and stem number, are often
estimated with better or comparable quality to traditional field inventories (Næsset 2007). For
example, reported accuracies of stand or plot level ALS-based mean volume estimates range from 10
to 27% (Næsset 1997, 2002, 2004; Holmgren et al. 2003; Lim et al. 2003; Packalén and Maltamo
4
4
2008; Woods et al. 2011). By comparison, errors for mean stand-level estimates of volume from
traditional field inventories in Finland are reported to be between 16 and 38% (Holopainen et al.,
2010).
When implementing the area-based approach using co-located ALS and field data, the validation
of model estimates is a critical step. How accurate are the estimates of volume derived using the area-
based approach? For the purposes of validation, it is typical for a certain proportion of ground plots to
be reserved (Woods et al. 2011), or for cross-validation methods to be applied (Næsset 2002, 2004,
2009). Other studies have used harvester-measured volumes for validation (Peuhkurinen et al. 2007,
2008; Korhonen et al. 2008; Holopainen et al. 2010.) Weight scaling data represent a standardized and
accepted measure of merchantable volume used by several provincial and territorial governments in
Canada to calculate stumpage, that is, the payment that changes hands between the licensee and the
Government to compensate the public for the extraction of timber from Crown lands. Confidence in
the quality of weight scale merchantable volumes is high (Moss 1966), providing for a robust and
independent source of validation data that is also well understood by forest inventory and management
practitioners. The objective of this communication is to report on the use of weight scale volume data
to validate estimates of coniferous merchantable volume generated using spatially coincident ALS and
ground plot data in an area-based approach, and to compare these outcomes to those from conventional
methods of estimating merchantable timber volume using cover type adjusted volume tables.
Data and methods
Study area
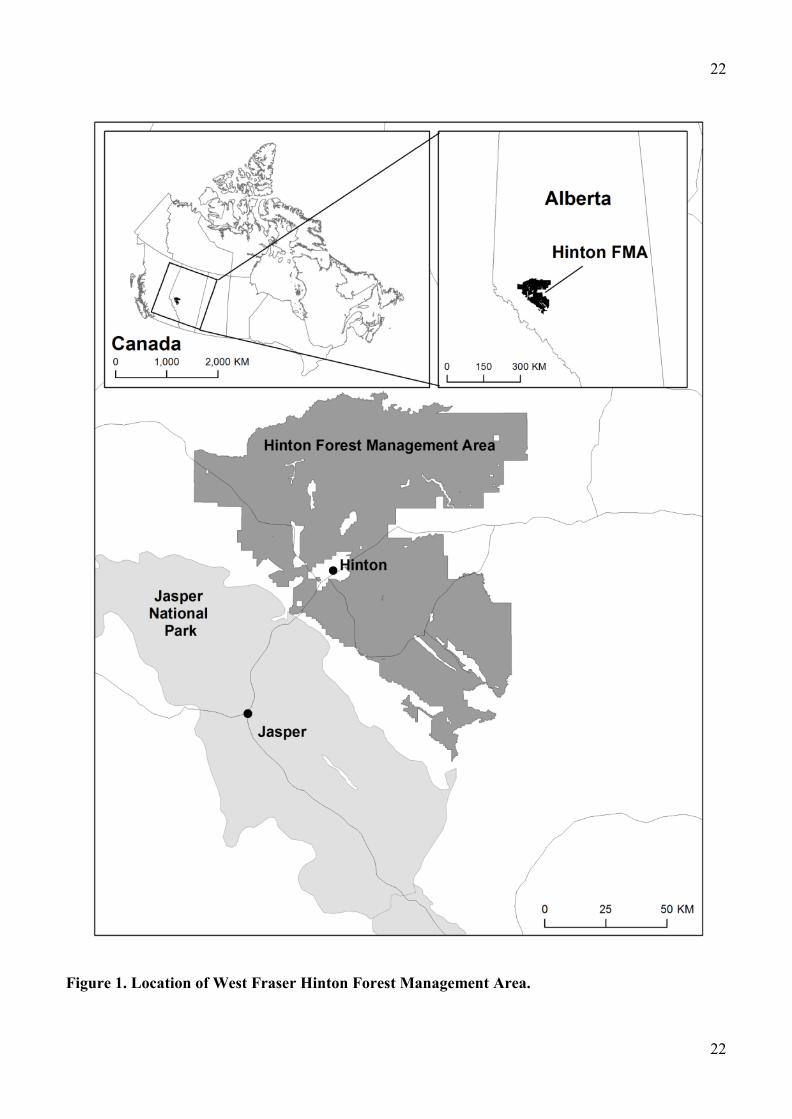
The Hinton Forest Management Area (FMA) (Figure 1), established in 1951, is the oldest FMA in
Alberta, and is located in the foothills of the Rocky Mountains in west-central Alberta, Canada.
Approximately one million hectares in size, elevation in the FMA ranges from 830 to 2400 m. Located
predominantly within the Foothills Natural Region (Natural Regions Committee 2006), the FMA is
5
5
influenced by a moist, cool climate with high annual precipitation, and provides important habitat for
species such as woodland caribou and grizzly bears. The area is managed by Hinton Wood Products, a
division of West Fraser Mills Ltd., and is dominated by pure coniferous stands (80% by area).
Lodgepole pine (Pinus contorta var. latifolia) is the dominant coniferous species, comprising
approximately 65% of the merchantable volume within the FMA. Other dominant tree species in the
FMA include black spruce (Picea mariana), white spruce (Picea glauca), and trembling aspen
(Populus tremuloides). Timber harvested from the FMA is primarily used to supply two Hinton
manufacturing facilities: a sawmill with an annual capacity of 281 million board feet, and a northern
bleached softwood kraft pulp mill with an annual capacity of 365,000 air-dried tonnes (Hinton Wood
Products 2010). Currently, the annual allowable cut for the coniferous timber type in the FMA is
approximately 1.7 million cubic metres (Government of Alberta 2010).
Ground reference data
The permanent growth sample (PGS) program in Hinton was established in the 1950s to support long-
term studies of growth and yield, sustainable forest management, and determination of the annual
allowable cut (AAC) volume. Over time, a total of 3,202 fixed-area PGS plots have been established
across the FMA. Ground-reference data (individual tree measures) from 788 PGS plots were selected
to support the area-based approach. Individual PGS plots were selected based on date of re-
measurement (i.e., ≥ 2002 to minimize temporal gap with ALS data acquisition), and known
planimetric error in GPS plot positioning (i.e., error in plot placement was known to be < 5 m). Each
tree in the ground reference data was associated with a unique plot identification number, plot size,
diameter at breast height, stem height, species code, crown-class code, and other mensurational data.
Plots were assigned to one of three cover types according to species composition: coniferous (> 80%
coniferous species by basal area; n = 572); deciduous (> 80% deciduous species by basal area; n = 87);
or mixed (<80% coniferous or deciduous species by basal area; n = 129). Merchantable and total stem
volumes (m3ha
−1) for individual trees were estimated through the procedure outlined by Huang (1994)
6
6
for all live trees >= 7.1 cm in DBH (n = 55,652 trees). Tree-level estimates of stem volume were
compiled to compute plot-level estimates of merchantable stem volume (m3ha
−1) assuming the
following utilization standard: a 15 cm stump height, a 15 cm minimum stump diameter, and a 12 cm
minimum top height. Cut-to-length harvesting was assumed with acceptable bolt lengths of 4.98 m,
4.37 m, 3.76 m, and 3.16 m (with production of 4.98 m bolt lengths maximized). Relevant
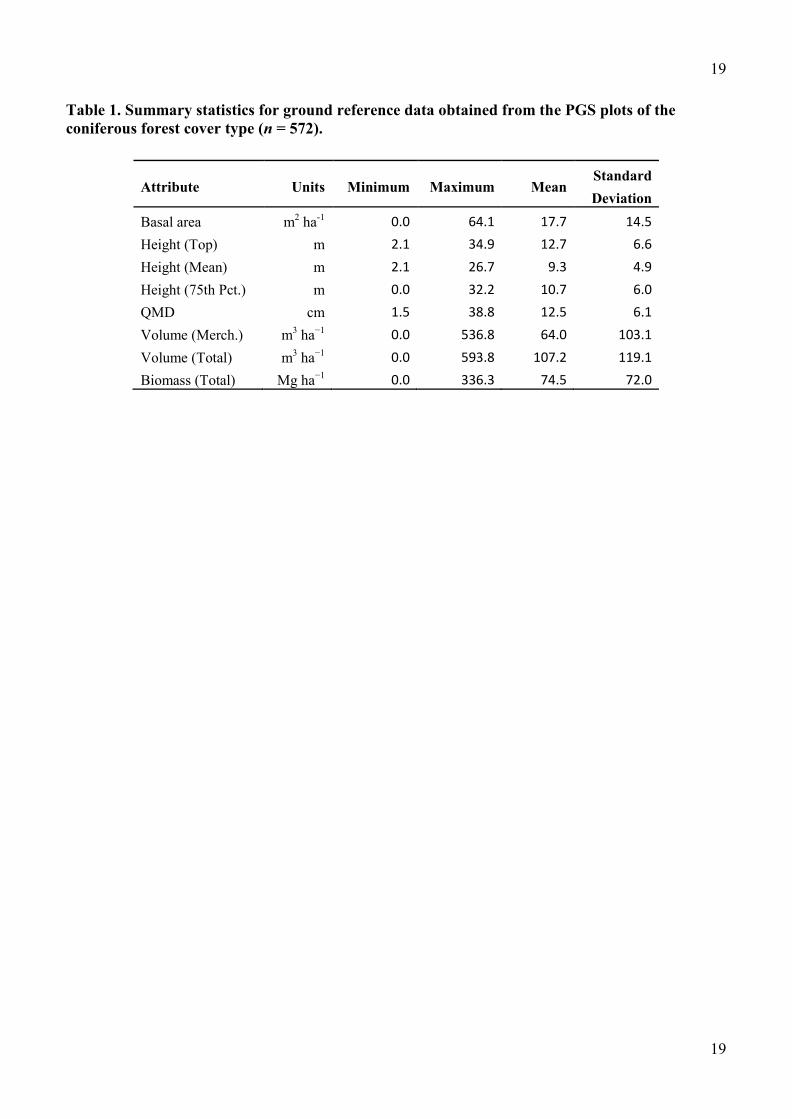
mensurational data for coniferous PGS plots are summarized in Table 1.
Airborne laser scanning (ALS) data and derived metrics
Discrete return, small-footprint (< 30 cm) ALS data were collected by fixed-wing aircraft for all areas
of the Hinton FMA between 2004 and 2007 using an Optech 3100 sensor at an average flying altitude
of 1400 m above ground level. The sensor had a pulse rate of 70 kHz and the capability to record 4
returns per outbound laser pulse. The estimated positional accuracy of the sensor was 0.45 m in the
horizontal direction and 0.30 m in the vertical direction. Data were acquired with an average point
spacing of 0.75 m with a 50% overlap between flight lines. All ALS x, y, z points were georeferenced
using a UTM Zone 11 North projection, and NAD83 (horizontal) and CGVD28 (vertical) datums. The
final point clouds were delivered in .LAS file format (American Society for Photogrammetry and
Remote Sensing 2011). Each georeferenced point was subsequently classified as ground or non-ground
using TerraScan v0.6 software (Terrasolid, Helsinki, Finland) using an algorithm based upon Kraus
and Pfeifer (1998). Ground points were then used to construct a 1-m bare-earth digital elevation model
(DEM).
A freeware program (FUSION/LDV) developed by the United States Department of Agriculture
(USDA), Forest Service, Pacific Northwest Research Station (McGaughey 2009) was used to tile, grid,
and compute ALS canopy height and density metrics. FUSION generates a suite of 58 gridcell metrics
and similar to the approach presented by Li et al. (2008), we used principal component analysis to
determine a smaller subset of metrics for model development. The first three principal components
accounted for 92% of the total variation found in the Hinton ALS data. Metrics that were found to be
7
7
strongly positively correlated with the first three principal components (i.e., r > 0.6) were selected for
model development (Table 2).
FUSION uses the ALS-based DEM to normalize the ALS point cloud elevations of non-ground
objects to above-ground heights. To support model development, the ALS point cloud files were
clipped to the area corresponding to each of the ground plots, and FUSION was used to calculate ALS
canopy height and density metrics for these clipped point clouds. This process of clipping the ALS
point cloud to the spatial extent of each ground plot is intended to aid in the establishment of strong
empirical relationships between response variables (ground plot measures) and predictors (ALS-based
metrics). To support the application of the developed model, the same suite of ALS canopy and density
metrics were computed for the wall-to-wall ALS data at a grid cell resolution of 25 × 25 m and stored
in GeoTIFF format. The total number of grid cells found within the bounds of the Hinton FMA was
13,885,234.
Area-based approach: model development using Random Forest
A non-parametric regression approach known as Random Forest (RF) (Breiman 2001), implemented
using the randomForest package in R (R Core Team 2012), was used to estimate coniferous
merchantable volume. RF is a regression-based decision tree approach and the most common non-
parametric method used for ALS-based forest inventories (White et al., 2013). The 572 PGS plots
identified as being of the coniferous forest type and the spatially coincident clipped ALS data metrics
were used for model development. To spatially extend the model of coniferous merchantable volume
across the conifer-dominated areas of the Hinton FMA, grid cells within the FMA were first identified
as being of the coniferous forest type using the Alberta Vegetation Inventory (AVI) data (Alberta
Sustainable Resource Development 2005). Conifer-dominated stands were identified as those stands
with ≥75% coniferous species by basal area. Individual grid cells within the coniferous type were then
populated with values of merchantable volume using the average estimate obtained from 500
independently trained RF regression trees. Finally, the merchantable volumes for individual grid cells
8
8
(in m3ha
-1) within each stand were multiplied by the area of the grid cell (0.0625 ha) and summed to
derive a stand-level estimate of merchantable volume, in cubic metres.
Conventional estimates of merchantable volume: cover type adjusted volume tables
In the Hinton FMA, merchantable volume projections for operational planning activities are commonly
derived from empirical cover-type adjusted volume tables, which have been developed from Hinton’s
large PGS plot network (n = 3202). Individual tree volumes were projected (Huang 1994) and
compiled at the plot level, applying the same utilization standard as the weight scale data. The cover
type adjusted volume tables were derived from non-linear regression analysis by fitting merchantable
coniferous PGS plot volumes as a function of height, cover type, and crown closure—as derived from
the inventory data. Using the same criteria (height, cover type, crown closure), individual stands are
assigned to a stratum. The cover type adjusted volume tables are then used to assign a volume to each
stand in the stratum (all stands within a stratum are assigned the same volume). The volume estimates
generated from the cover type adjusted volume tables are what Hinton Forest Products have
traditionally used for strategic and operational planning.
Validation: weight scale estimates of coniferous merchantable volume
Using standardized procedures and tools, scaling is the measurement of timber to estimate its volume
and quality (Avery and Burkhart, 2002). Weight scaling is a form of sample scaling that is based on
weight-to-volume ratios. In order to estimate the volume of timber harvested from a specific harvested
stand, the weight of every load of logs that is taken from the stand is measured, but only a
representative random sample of loads are scaled (Alberta Sustainable Resource Development 2006).
A weight-to-volume ratio (conversion factor) is calculated from the scaled sample loads. This
conversion factor is used to convert the total weight of the timber harvested from the stand to a
merchantable volume, in cubic metres.
9
9
A total of 272 coniferous forest stands were harvested in the Hinton FMA between 2008 and
2010. Merchantable weight scale volumes were based on the cut-to-length harvesting practices used at
that time (i.e., a 15 cm stump height, a 15 cm minimum stump diameter, and a 12 cm minimum top
height with acceptable bolt lengths of 4.98 m, 4.37 m, 3.76 m, and 3.16 m with production of 4.98 m
bolt lengths maximized). The weight scale estimates of merchantable volume provide an accurate,
industry relevant, independent data source for validating the estimates generated from the ALS-based
model of merchantable volume. Weight scale estimates of merchantable volume were compared to
estimates of merchantable volume derived from the ALS data and the cover type adjusted volume table
method. Comparisons were made for all stands, and by stand volume size class (i.e., <5000 m3, 5000–
10000 m3, 10000–15000 m
3, 15000–20000 m
3, >20000 m
3).
Results
The RF model of coniferous merchantable volume developed using spatially coincident PGS plots and
ALS data had a pseudo-R2 of 0.90, an RMSE of 36.4 m
3ha
-1, and a relative RMSE (RMSE% = RMSE
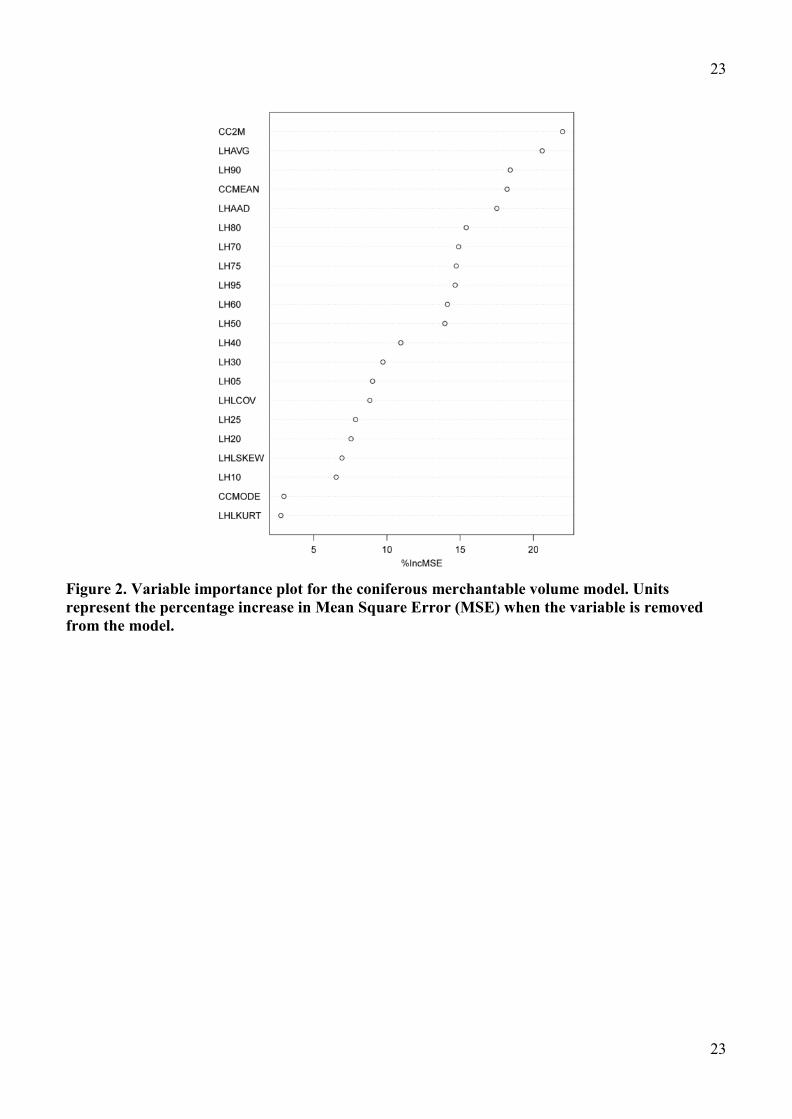
as a percentage of the mean value being predicted) of 26%. The relative importance of each of the ALS
metrics in the RF model is shown in the variable importance plot (Figure 2), which indicates the
percentage increase in Mean Square Error (MSE) when the variable is removed from the model.
Percent canopy cover at 2 m (CC2M) and the average ALS height (LHAVG) were the most important
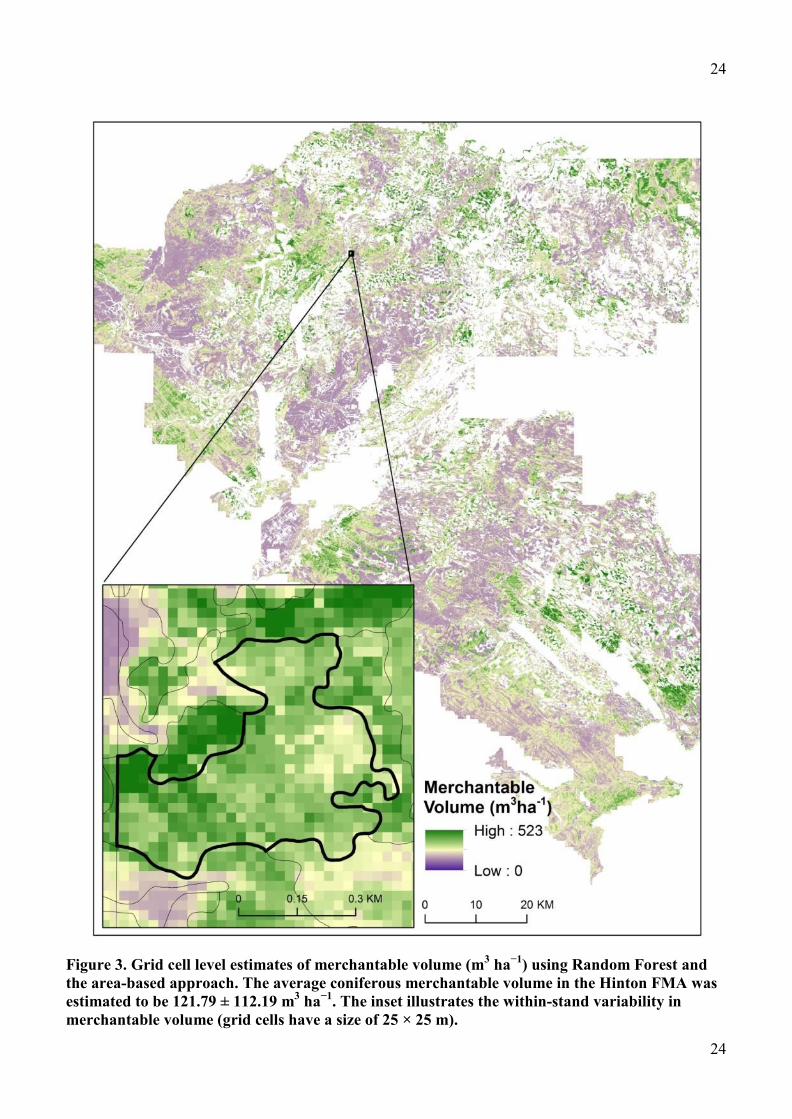
predictor variables. The developed model was applied to the grid cells in the Hinton FMA that were
identified as being of the coniferous type using the wall-to-wall ALS metrics (Figure 3). The mean and
standard deviation for resulting grid-cell level predictions of coniferous merchantable stem volume
were 121.8 ± 112.2 m3ha
-1. The differences between ALS and conventional estimates of merchantable
volume relative to the weight scale data, by volume size class, are shown in Figure 4 and summarized
in Table 3. Overall for the 272 stands considered, the ALS-based estimates overestimated coniferous
merchantable volume by 0.6%, while conventional methods using cover type adjusted volume tables
underestimated merchantable volume by 19.8%. When considered by stand volume size class,
10
10
conventional methods consistently underestimated coniferous merchantable volumes, whereas the
ALS-based estimates both over and underestimated coniferous merchantable volumes. The greatest
discrepancy between ALS-based and conventional estimates and the weight scale data was for stands
in the smallest volume size class (< 5000 m3). In these stands, the ALS and conventional approaches
both underestimated the average stand-level coniferous merchantable volume by -6.7% and -23.7%,
respectively.
Discussion
Merchantable volume is an important attribute used by industry and government to determine fees paid
for timber removed from Crown lands through tenure agreements. The ability to make accurate
predictions of merchantable volume provides useful information to both government and industry, and
both parties benefit when there is agreement between allocated and harvested volumes. For example,
governments can make more accurate projections of expected timber volumes and associated stumpage
fees for tenure allocations, and as indicated above, industry can improve strategic and operational
planning, allowing for appropriate resources to be allocated to harvesting activities and milling
operations. In the Hinton FMA example presented herein, there is strong agreement between the ALS-
based and weight scale estimates of coniferous merchantable volume.
The performance of the ALS-based coniferous merchantable volume model developed for the
Hinton FMA (pseudo-R2 = 0.9, RMSE = 36.4 m
3ha
-1, RMSE% = 26%) is in keeping with model
performance reported in other studies. For example, Holmgren et al. (2003) reported model
performance for a site in southern Sweden dominated by Norway spruce (Picea abies L. Karst.), Scots
pine (Pinus sylvestris L.) and birch (Betula spp.): R2
= 0.9, RMSE = 37 m3ha
-1, RMSE% = 22%).
Woods et al. (2011) reported estimates of gross merchantable volume for black spruce (Picea mariana
[Mill.] BSP) (RMSE = 30.1 m3ha
-1, RMSE% = 25.0%) and jack pine (Pinus banksiana Lamb.) (RMSE
= 25.4 m3ha
-1, RMSE% = 21.8%) dominated stands. Woods et al. (2011) also reported that ALS-based
estimates of merchantable volume were, on average, found to be within 10% of actual scaled volumes
11
11
(n = 31). Korhonen et al. (2008) concluded that although ALS data were suitable for pre-harvest
estimation of sawlog volume, the authors noted that the actual volumes harvested from a stand may be
overestimated in the presence of defects such as disease, and therefore the actual volume removed
from the stand may be less than what is estimated from the ALS data if no adjustments for defects are
applied to the ALS-based estimates. Moreover, it is rare that all of the volume is taken from a stand
during harvest, with trees left behind for wildlife retention, a perceived lack of merchantability, or for
some other management-relevant consideration.
The accuracy of volume estimates derived from cover type adjusted volume tables will similarly
be impacted if substantial defects are found in the stand. There are, however, several additional issues
associated with the use of cover type adjusted volume tables to estimate merchantable volume. First,
PGS plots, which are used to generate volume tables, may be located in a portion of a stand that is
largely unrelated to the overall stand-level inventory call (i.e., the plot is located within a patch of
deciduous that is found within a conifer dominated stand), and as a result, estimates derived from
cover type adjusted volume tables may not accurately represent stand conditions. Second, it is assumed
that conditions within strata are homogenous, meaning stands with a similar height, cover type, and
crown closure in the inventory data will be assigned the same estimate of merchantable volume from
the cover type adjusted volume tables. In reality, conditions within strata are typically not
homogenous. Third, there is an assumed consistent relationship between photo interpreted stand
heights and PGS field measurements across the entire inventory area which may not hold true. For
example, within the Lower Foothills region of the Hinton FMA (where there is minimal topographic
relief), photo interpreted stand heights typically agree more closely with true stand heights, which
means stands are more likely to be associated with PGS data that represent similar stand conditions,
thereby resulting in a more accurate volume assignment from the cover type adjusted volume tables.
Contrast this with the Upper Foothills region of the Hinton FMA, where we have found, through
operational experience in the area, that photo interpreted stand heights typically underestimate true

12
12
stand heights, often as a result of topographic effects (i.e., steeper terrain). As a result, stands will be
associated with PGS data representing stand heights that are greater than the true stand height,
resulting in an overestimation of stand volume from the cover type adjusted volume tables for these
stands. Fourth, estimates from cover type adjusted volume tables are made at the stand level (i.e., one
volume estimate per stand) and therefore do not enable the characterization of actual within-stand
variability in merchantable volume.
The outcomes reported herein indicate that in the Hinton FMA, conventional methods
consistently underestimate coniferous merchantable volumes relative to weight scale volumes. In part,
this is caused by a systematic bias that is introduced when a harvesting plan is operationalized. For
example, consider two stands that are sequenced for harvest based on an inventory height call of 18 m.
If the operational planner visits both stands and discovers that one of the stands is actually 22 m and
the other is 14 m, the 22 m stand will likely remain in the harvest sequence (with an underestimated
stand volume), but the 14 m stand will likely be deferred and will not be harvested. In other words,
stands that are found to have heights that are decidedly less than the inventory estimated height will
rarely be harvested, whereas stands with heights that meet or exceed the inventory height will
generally always be harvested. Thus, the merchantable volumes for the stands that are harvested will
frequently be greater than what was projected (provided there are no other biases present) by the cover
type adjusted volume table.
Accurate pre-harvest estimates of merchantable volume that are more closely related to actual
post-harvest measures of merchantable volume are very useful for improving synergies between
strategic and operational planning. For example, if accurate, high-resolution inputs derived from ALS
data are used in timber supply analysis and spatial harvest sequencing, operational planners are able to
do more of their preliminary work in the office prior to heading out for field reconnaissance. Likewise,
when operational planners have increased confidence that stands are actually ready for harvest, the
ALS-derived high resolution DEM can be used to optimize road and harvest layout before field crews
13
13
are dispatched. When ALS-based estimates of merchantable volume are combined with ALS-based
predictions of quadratic mean diameter, it is possible to estimate merchantable volume by size class,
which is useful for matching contractors and equipment to site requirements. This capacity to validate
office-optimized scenarios in the field rather than having to collect raw data during field visits
represents a significant opportunity for cost savings. Furthermore, the ability to scale wall-to-wall ALS
estimates to the stand level allows ALS data to be seamlessly integrated into existing conventional
stand-level inventories, while at the same time providing additional information on within-stand
variability. Robust predictions of merchantable volume for every 25 × 25 m grid cell in a forest
management unit provides novel opportunities for both management and planning, while not
precluding the implementation of standard—and often mandated—practices.
Conclusions
Government and industry require accurate and reliable estimates of merchantable stand volume. These
estimates are used for a range of activities, including fees paid for the extraction of timber from Crown
lands, planning of future harvest operations, and annual allowable cut determinations. These are
financially relevant activities that impact the operational success of forest companies, as well as the
sustainable management of the forest resource. Improved estimates of merchantable volume are of
direct benefit to both government and industry and enable improved decision making. In this study,
conventional methods were found to underestimate coniferous merchantable volume by 19.8%,
whereas ALS-based estimates were found to overestimate coniferous merchantable volume by 0.6%.
The correspondence between ALS-based and weight scale estimates of coniferous merchantable
volume in the Hinton FMA demonstrates the potential of incorporating ALS-based estimates into
enhanced forest inventories, resulting in improved information for forest management and planning
activities.
14
14
Acknowledgments
This research was supported by through the collaboration of West Fraser Hinton and the Canadian
Wood Fibre Centre (CWFC) of the Canadian Forest Service, Natural Resources Canada. We thank Dr.
Gordon Frazer (GWF LiDAR Analytics) for his contributions to developing the ALS-based models for
the Hinton Forest Management Area and Geordie Hobart (Canadian Forest Service) for providing GIS
support. We also thank Roger Whitehead, of the CWFC, and Richard Briand of Hinton Wood Products
for their support of our work and two anonymous reviewers for their constructive feedback.
References
Alberta Sustainable Resource Development. 2005. Alberta Vegetation Inventory Standards. Version
2.1.1. Chapter 3: Vegetation Inventory Standards and Data Model Documents. 2005. Resource Information
Management Branch, Edmonton Alberta. 91 p. [online]. Available from:
http://srd.alberta.ca/LandsForests/documents/AVI-ABVegetation3-InventoryStan-Mar05.pdf [accessed 18
July 2013].
Alberta Sustainable Resource Development. 2006. Mass Scaling. Chapter 4 in Alberta Timber
Scaling Manual [online]. Available from:
http://srd.alberta.ca/LandsForests/ForestHarvestOperations/documents/Mass%20Scaling.pdf [accessed
June 17, 2013].
American Society for Photogrammetry and Remote Sensing. 2011. LAS specification, Version
1.4–R12. 10 June 2012 [online]. Available from:
http://asprs.org/a/society/committees/standards/LAS_1_4_r12.pdf [accessed July 18, 2013].
Breiman, L. 2001. Random Forests. Machine Learning, 45: 5-32.
Avery, T.E., Burkhart, H.E. 2002. Forest Measurements (5th
Edition). McGraw-Hill, New York, NY.

15
15
Evans, D.L., S.D. Roberts and R.C. Parker. 2006. LiDAR–A new tool for forest measurements. The
Forestry Chronicle 62(2): 211–219.
Frazer, G.W., Magnussen, S., Wulder, M.A., Niemann, K.O. 2011. Simulated impact of sample
plot size and co-registration error on the accuracy and uncertainty of LiDAR-derived estimates of
forest stand biomass. Remote Sensing of Environment, 115: 636–649.
Government of Alberta. 2010. Forest Management Plan Amendment: Mountain Pine Beetle
Addendum Approval Decision. August 18, 2010. 20 p. [online]. Available from:
http://srd.alberta.ca/LandsForests/ForestManagement/ForestManagementPlans/documents/WestFraser
MillsLtd/WFMLH-ApprovalDecision-August182010.pdf [accessed June 7, 2013].
Hinton Wood Products. 2010. Forest Management Plan: 2010 Mountain Pine Beetle Amendment.
FMA 8800025-0.C. 565/2007. April 30, 2010 [online]. Available from:
http://srd.alberta.ca/LandsForests/ForestManagement/ForestManagementPlans/documents/WestFraser
MillsLtd/WFMLH-VolI-Section1-4.pdf [accessed June 12, 2013].
Holmgren, J., M. Nilsson, H. Olsson. 2003. Estimation of tree height and stem volume on plots using
airborne laser scanning. Forest Science 49(3): 419–428.
Holopainen, M., M. Vastaranta, J. Rasinmäki, J. Kalliovirta, A. Mäkinen, R. Haapanen, T.
Melkas, X. Yu, J. Hyyppä. 2010. Uncertainty in timber assortment estimates predicted from forest
inventory data. European Journal of Forest Research 129(6): 1131–1142.
Huang, S. 1994. Ecologically based individual tree volume estimation for major Alberta tree species –
Report #1: Individual tree volume estimation procedures for Alberta: methods of formulation and
statistical foundations. Alberta Environmental Protection, Lands and Forest Service, Forest
Management Division. Pub. No. T/288, Edmonton, Alta., Canada
16
16
Hyyppä, J., H. Hyyppä, D. Leckie, F. Gougeon, X. Yu and M. Maltamo. 2008. Review of methods
of small-footprint airborne laser scanning for extracting forest inventory data in boreal forests.
International Journal of Remote Sensing 29(5): 1339–1366.
Kraus, K., N. Pfiefer. 1998. Determination of terrain models in wooded areas with airborne scanner
data. ISPRS Journal of Photogrammetry and Remote Sensing 53:193–203.
Korhonen, L., J. Peuhkurinen, M. Jukka, A. Suvanto, M. Maltamo, P. Packalen and J. Kangas.
2008. The use of airborne laser scanning to estimate sawlog volumes. Forestry 81(4): 499–510.
Li, Y, H.-E. Andersen, R. McGaughey. 2008. A comparison of statistical methods for estimating
forest biomass from Light Detection and Ranging data. Western J. Appl. For. 23(4): 223-231.
Lim, K., P. Treitz, M. Wulder, B. St-Onge and M. Flood. 2003. LiDAR remote sensing of forest
structure. Progress in Physical Geography 27(1): 88–106.
McGaughey, R. J. 2009. FUSION/LDV: Software for LIDAR Data Analysis and Visualization. U.S.
FUSION Version 2.70. Department of Agriculture, Forest Service, Pacific Northwest Research
Station, University of Washington.
Moss, A. 1966. A field trial of weight-scaling. The Forestry Chronicle, 42(1): 62–68.
Næsset, E. 1997. Estimating timber volume of forest stands using airborne laser scanner data. Remote
Sensing of Environment 61(2):246–253.
Næsset, E. 2002. Predicting forest stand characteristics with airborne scanning laser using a practical
two-stage procedure and field data. Remote Sensing of Environment 80(1):88–99.
Næsset, E. 2004. Practical large-scale forest stand inventory using a small-footprint airborne scanning
laser. Scandinavian Journal of Forest Research 19: 164–179.
17
17
Næsset, E. 2007. Airborne laser scanning as a method in operational forest inventory: Status of
accuracy assessments accomplished in Scandinavia. Scandinavian Journal of Forest Research, 22:
433–442.
Næsset, E. 2009. Effects of different sensors, flying altitudes, and pulse repetition frequencies on
forest canopy metrics and biophysical stand properties derived from small-footprint airborne laser data.
Remote Sensing of Environment 113: 148–159.
Næsset, E., T. Gobakken, J. Holmgren, H. Hyyppä, J. Hyyppä, M. Maltamo, M. Nilsson, H.
Olsson, Å. Persson and U. Söderman. 2004. Laser scanning of forest resources: The Nordic
experience. Scandinavian Journal of Forest Research 19: 482–499.
Natural Regions Committee. 2006. Natural Regions and Subregions of Alberta. Compiled by D.J.
Downing and W.W. Pettapiece. Government of Alberta. Pub. No. T/852 [online]. Available from:
http://www.tpr.alberta.ca/parks/heritageinfocentre/docs/NRSRcomplete%20May_06.pdf [accessed
July 18, 2013].
Packalén, P., Maltamo, M. 2008. Estimation of species-specific diameter distributions using airborne
laser scanning and aerial photographs. Canadian Journal of Forest Research 38(7): 1750–1760.
Pitt, D., and J. Pineau. 2009. Forest inventory research at the Canadian Wood Fibre Centre: Notes
from a research coordination workshop, June 3-4, Point Claire, QC. The Forestry Chronicle, 85(6):
859–869.
Peuhkurinen, J. M. Maltamo, J. Malinen, J. Pitkänen, P. Packalén. 2007. Preharvest measurement
of marked stands using airborne laser scanning. Forest Science 53(6): 653–661.
18
18
Peuhkurinen, J. M. Maltamo, J. Malinen. 2008. Estimating species-specific diameter distributions
and saw log recoveries of boreal forests from airborne laser scanning data and aerial photographs: a
distribution-based approach. Silva Fennica 42(4): 625
R Core Team. 2012. R: A language and environment for statistical computing. R Foundation for
Statistical Computing, Vienna, Austria. ISBN 3-900051-07-0, URL http://www.R-project.org/.
Reutebuch, S. E., H.-E. Andersen and R.J. McGaughey. 2005. Light detection and ranging
(LiDAR): an emerging tool for multiple resource inventory. Journal of Forestry 103: 286–292.
White, J.C., Wulder, M.A., Varhola, A., Vastaranta, M., Coops, N.C., Cook, B.D., Pitt, D,
Woods, M. 2013. A best practices guide for generating forest inventory attributes from airborne laser
scanning data using the area-based approach. Information Report FI-X-10. Natural Resources Canada,
Canadian Forest Service, Canadian Wood Fibre Centre, Pacific Forestry Centre, Victoria, BC. 50 p.
Woods, M., D. Pitt, M. Penner, K. Lim, D. Nesbitt, D. Etheridge, P. Treitz. 2011. Operational
implementation of a LiDAR inventory in boreal Ontario. The Forestry Chronicle 87(4):512–528.
Wulder, M.A., C.W. Bater, N.C. Coops, T. Hilker and J.C. White. 2008. The role of LiDAR in
sustainable forest management. The Forestry Chronicle 84(6): 807–826.
19
19
Table 1. Summary statistics for ground reference data obtained from the PGS plots of the
coniferous forest cover type (n = 572).
Attribute Units Minimum Maximum Mean Standard
Deviation
Basal area m2 ha
-1 0.0 64.1 17.7 14.5
Height (Top) m 2.1 34.9 12.7 6.6
Height (Mean) m 2.1 26.7 9.3 4.9
Height (75th Pct.) m 0.0 32.2 10.7 6.0
QMD cm 1.5 38.8 12.5 6.1
Volume (Merch.) m3 ha
−1 0.0 536.8 64.0 103.1
Volume (Total) m3 ha
−1 0.0 593.8 107.2 119.1
Biomass (Total) Mg ha−1
0.0 336.3 74.5 72.0
20
20
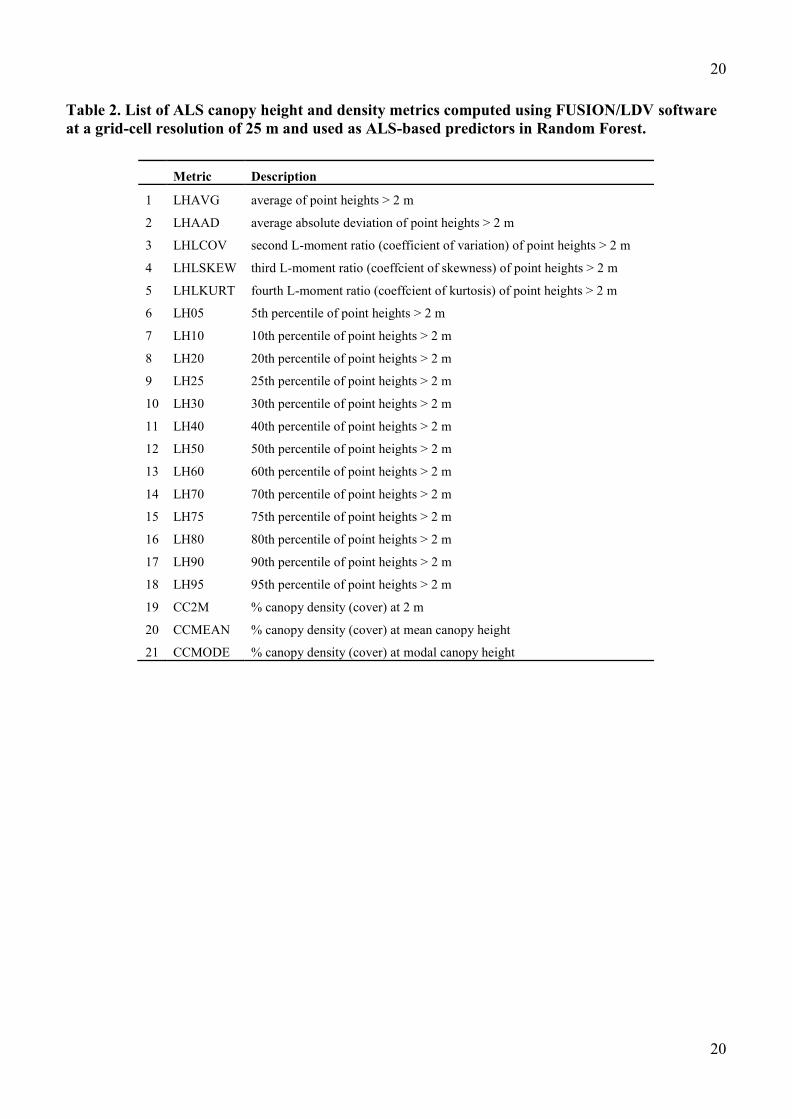
Table 2. List of ALS canopy height and density metrics computed using FUSION/LDV software
at a grid-cell resolution of 25 m and used as ALS-based predictors in Random Forest.
Metric Description
1 LHAVG average of point heights > 2 m
2 LHAAD average absolute deviation of point heights > 2 m
3 LHLCOV second L-moment ratio (coefficient of variation) of point heights > 2 m
4 LHLSKEW third L-moment ratio (coeffcient of skewness) of point heights > 2 m
5 LHLKURT fourth L-moment ratio (coeffcient of kurtosis) of point heights > 2 m
6 LH05 5th percentile of point heights > 2 m
7 LH10 10th percentile of point heights > 2 m
8 LH20 20th percentile of point heights > 2 m
9 LH25 25th percentile of point heights > 2 m
10 LH30 30th percentile of point heights > 2 m
11 LH40 40th percentile of point heights > 2 m
12 LH50 50th percentile of point heights > 2 m
13 LH60 60th percentile of point heights > 2 m
14 LH70 70th percentile of point heights > 2 m
15 LH75 75th percentile of point heights > 2 m
16 LH80 80th percentile of point heights > 2 m
17 LH90 90th percentile of point heights > 2 m
18 LH95 95th percentile of point heights > 2 m
19 CC2M % canopy density (cover) at 2 m
20 CCMEAN % canopy density (cover) at mean canopy height
21 CCMODE % canopy density (cover) at modal canopy height

21
21
Table 3. Comparisons of weight scale merchantable volumes to predictions from ALS data and
cover type adjusted volume tables (CVT).
Stand size
(m3)
Source of
Prediction
Mean stand-
level estimate
of coniferous
merchantable
volume (m3)
Predicted Volume
– Scaled Volume
<5000 Weight scale 2641
n = 138 ALS 2463 -6.7%
CVT 2029 -23.7%
5000–10000 Weight scale 7021
n = 76 ALS 7146 1.8%
CVT 5802 -17.4%
10000–15000 Weight scale 11886
n = 25 ALS 11739 -1.2%
CVT 9234 -22.3%
15000–20000 Weight scale 16236
n = 15 ALS 15524 -4.4%
CVT 12425 -23.5%
> 20000 Weight scale 34868
n = 18 ALS 37167 6.6%
CVT 28788 -17.4%
OVERALL Weight scale 7597
n = 272 ALS 7641 0.6%
CVT 6089 -19.8%
22
22
Figure 1. Location of West Fraser Hinton Forest Management Area.
23
23
Figure 2. Variable importance plot for the coniferous merchantable volume model. Units
represent the percentage increase in Mean Square Error (MSE) when the variable is removed
from the model.
24
24
Figure 3. Grid cell level estimates of merchantable volume (m
3 ha
−1) using Random Forest and
the area-based approach. The average coniferous merchantable volume in the Hinton FMA was
estimated to be 121.79 ± 112.19 m3 ha
−1. The inset illustrates the within-stand variability in
merchantable volume (grid cells have a size of 25 × 25 m).
25
25
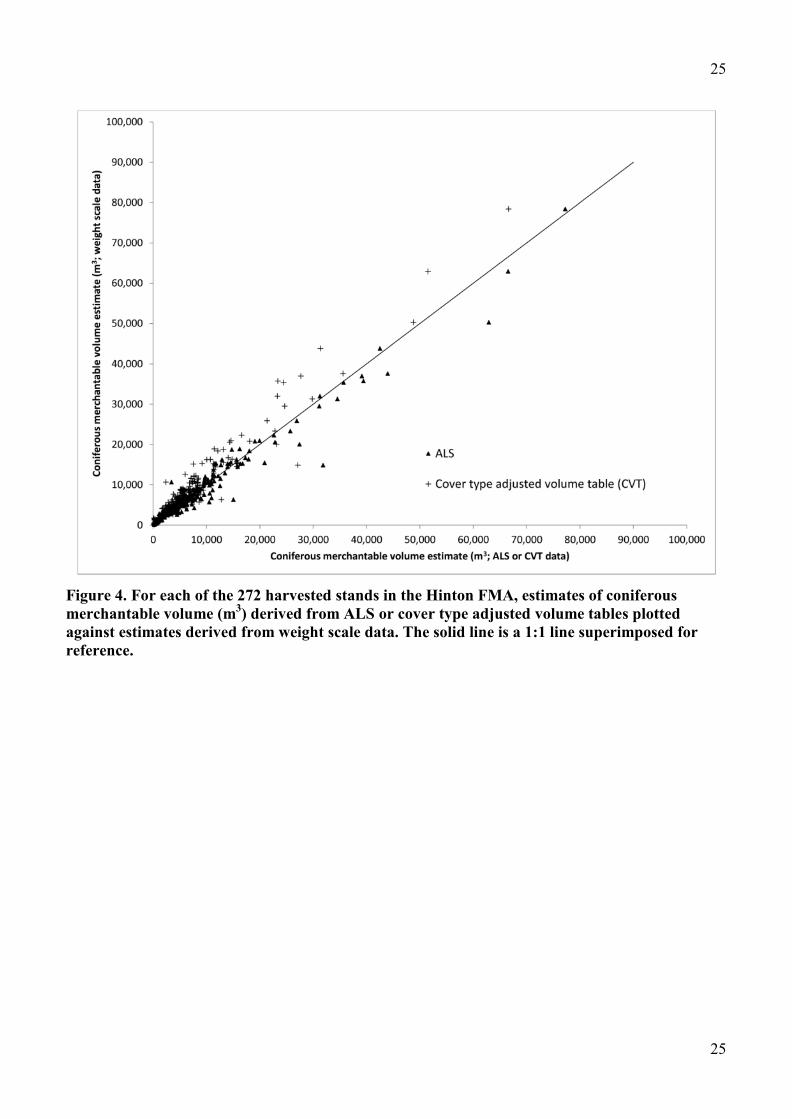
Figure 4. For each of the 272 harvested stands in the Hinton FMA, estimates of coniferous
merchantable volume (m3) derived from ALS or cover type adjusted volume tables plotted
against estimates derived from weight scale data. The solid line is a 1:1 line superimposed for
reference.