validation of aircraft noise prediction models at low
TRANSCRIPT

NASA / CR-2000-210112
Validation of Aircraft Noise Prediction
Models at Low Levels of Exposure
Juliet A. Page, Christopher M. Hobbs, Kenneth J. Plotkin, and Eric Stusnick
Wyle Laboratories, Arlington, Virginia
April 2000

The NASA STI Program Office ... in Profile
Since its founding, NASA has been dedicated tothe advancement of aeronautics and spacescience. The NASA Scientific and Technical
Information (STI) Program Office plays a keypart in helping NASA maintain this importantrole.
The NASA STI Program Office is operated byLangley Research Center, the lead center forNASA's scientific and technical information. The
NASA STI Program Office provides access to theNASA STI Database, the largest collection ofaeronautical and space science STI in the world.The Program Office is also NASA's institutionalmechanism for disseminating the results of itsresearch and development activities. Theseresults are published by NASA in the NASA STIReport Series, which includes the followingreport types:
TECHNICAL PUBLICATION. Reports ofcompleted research or a major significantphase of research that present the results ofNASA programs and include extensivedata or theoretical analysis. Includescompilations of significant scientific andtechnical data and information deemed to
be of con_uing reference value. NASAcounterpart of peer-reviewed formalprofessional papers, but having lessstringent limitations on manuscript lengthand extent of graphic presentations.
TECHNICAL MEMORANDUM. Scientific
and technical findings that are pr"ehminaryor of specialized interest, e.g., quick releasereports, working papers, andbibliographies that contain minimalannotation. Does not contain extensive
analysis.
CONTRACTOR REPORT. Scientific and
technical findings by NASA-sponsoredcontractors and grantees.
CONFERENCE PUBLICATION. Collected
papers from scientific and technicalconferences, symposia, seminars, or other
meetings sponsored or co-sponsored byNASA.
SPECIAL PUBLICATION. Scientific,technical, or historical information from
NASA programs, projects, and missions,
often concerned with subjects havingsubstantial public interest.
TECHNICAL TRANSLATION. English-language translations of foreign scientificand technical material pertinent to NASA'smission.
Specialized services that complement the STIProgram Office's diverse offerings includecreating custom thesauri, building customizeddatabases, organizing and publishing researchresults ... even providing videos.
For more information about the NASA STI
Program Office, see the following:
• Access the NASA STI Program Home Pageat http:llwww.sti.nasa.gov
E-mall your question via the Internet [email protected]
Fax your question to the NASA STI HelpDesk at (301) 621-0134
Phone the NASA STI Help Desk at(301) 621-0390
Write to:
NASA STI Help DeskNASA Center for AeroSpace Information7121 Standard Drive
Hanover, MD 21076-1320

NASA/CR-2000-210112
Validation of Aircraft Noise Prediction
Models at Low Levels of Exposure
Juliet A. Page, Christopher M. Hobbs, Kenneth J. Plotkin, and Eric Stusnick
Wyle Laboratories, Arlington, Virginia
National Aeronautics and
Space Administration
Langley Research CenterHampton, Virginia 23681-2199
Prepared for Langley Research Centerunder Contract NAS1-20103, Task 22
April 2000

Available from:
NASA Center for AeroSpace Information (CASI)7121 Standard Drive
Hanover, MD 21076-1320
(301) 621-0390
National Technical Information Service (NTIS)
5285 Port Royal Road
Springfield, VA 22161-2171(703) 605-6000

Validation of Aircraft Noise Prediction Models at Low Levels of Exposure
Table of Contents
Chapter
1 Introduction 1-1
2 Measurement Program and Data Acquisition
2.12.22.32.42.52.62.72.8
Introduction
Airport SelectionMeasurement Site SelectionNoise Monitor Installation and Instrumentation
Measurement Program ExecutionInstrumentationSite Visit
Analysis
3 Presentation of Data Acquired
4
3.13.23.33.43.53.6
Weather and Atmospheric DataRadar Tracking DataNoise Monitoring DataAirline Operational InformationAircraft and Engine Performance and Power DataLateral Array
Data Analysis.
4.1 Radar Data Processing4.2 Noise Event Extraction4.3 Thrust Prediction .
4.3.1 Departure Thrust Prediction Based on Operational Procedures.4.3.2 Alternate Thrust Prediction Techniques .4.3.3 Comparison of Thrust Prediction Techniques
4.4 INM Analysis4.5 Noise Measurement and INM Prediction Data Correlation
Results
5.1 Geometrical Parameter Results
5.2 Atmospheric Conditions5.3 Operational Statistic Results .5.4 Multiple Regression Analysis.
6 Conclusions and Recommendations.
2-1
2-12-12-22-62-62-82-112-12
3-1
3-13-63-73-83-83-15
4-1
4-14-24-74-74-144-164-204-21
5-1
5-85-145-215-27
6-1
References R-1
iii

Validation of Aircraft Noise Prediction Models at Low Levels of Exposure
2-12-22-32-42-52-6
3-13-2
4-14-24-34-4
5-15-25-35-45-55-65-75-85-95-105-115-125-135-145-155-165-175-185-195-205-215-22
Table
1-11-2
2-12-2
List of Figures
Noise Monitoring Locations at Denver International Airport .Sample Site LogTypical Site Instrumentation SetupCo-located Denver Site 6 and Wyle Site 11Example Time Records for Co-located Denver Site S06 and Wyle Site Wl 1Sample Monitor Summary Report
Time History for Monitoring Site W02.Lateral Array Noise Measurements
One Day of Departure Flight Tracks and Profiles (Power Mode 6) .Sample Flight Track and Correlated Noise Event for S05Selected Departure Altitude and Velocity Profiles From Runway 08Power Profiles for Selected Departure From Runway 08
Prediction Accuracy- Power Mode 1Prediction Accuracy - Power Mode 2Prediction Accuracy- Power Mode 5Prediction Accuracy- Power Mode 6Prediction Accuracy - Power Mode 8Altitude Sensitivity - Power Mode 6Elevation Angle Sensitivity - Power Mode 6Slant Range Sensitivity - Power Mode 6.Airport Temperature Sensitivity - Power Mode 6Airport Atmospheric Pressure Sensitivity - Power Mode 6Point of Closest Approach Outside Air Temperature Sensitivity - Power Mode 6Point of Closest Approach Atmospheric Pressure Sensitivity - Power Mode 6.Point of Closest Approach Wind Speed (knots) Sensitivity - Power Mode 6Takeoff Gross Weight Sensitivity - Power Mode 6Takeoff Thrust Level (Ibs) - Power Mode 6Maximum Allowable Weight Margin - Power Mode 6Derate Assumed Temperature - Power Mode 6.Thrust Derate Temperature Differential - Power Mode 6Aircraft Speed Knots at Point of Closest Approach - Power Mode 6Mach Number at Point of Closest Approach - Power Mode 6Thrust Level (Ibs) at Point of Closest Approach - Power Mode 6Thrust Factor at Point of Closest Approach - Power Mode 6
List of Tables
Aircraft Noise Prediction Data Requirements.Data Availability for the Current Noise Study.
Airport Site Selection Criteda.DIA and Wyle Noise Monitor Site Distances.
2-32-72-82-92-102-11
3-73-16
4-34-44-174-18
5-35-45-55-65-75-115-125-135-165-175-185-195-205-225-235-245-255-265-285-295-305-31
1-11-2
2-12-4
iv

Validation of Aircraft Noise Prediction Models at Low Levels of Exposure
Table
2-3
3-13-23-33-43-53-63-73-83-93-103-11
4-14-24-34-44-5
4-64-74-84-94-104-114-12
5-15-25-35-4
List of Tables (Continued)
Noise Monitor Site Coordinates and Elevations .
Summary Data From Radar TrackingDIA Hourly Surface Weather DataDenver, Stapleton AP Upper Air Weather DataARTS IliA Radar Tracking Data SummaryUnited Airlines Operational Data.Delta Airlines Operational DataUnited Airlines Fleet Data
Available FN/5 Data Airframe/Engine CombinationsAvailable Maximum Allowable Takeoff Weight ChartsUnimatic Thrust Prediction Printout for a B757-200 .United Airlines Historical Derate Data
Extracted Noise Correlations.
Sample Noise Correlation RecordTakeoff Thrust Prediction Methodology FlowchartMaximum Allowable Takeoff Weight Chart for the B737-500, Flaps 5, Bleeds ONMaximum Takeoff Thrust - PMC ON 737-300 (BI/C1-20K)
Reduced Takeoff Thrust - 737-300 (B1).Climb Thrust Table
Updated DIA Performance CoefficientsThrust Prediction Methods
Sample INM Detailed Grid OutputIndependent Variables for Correlation AnalysesIndependent Variables for Correlation Analyses
Predicted-Measured SEL for All Power Modes
Overall UAL Fleet Data Based on May 1997 DataSummary of Correlated Events by Site and by QuadrantMultiple Regression Analysis Results
Paae
2-5
3-23-43-53-63-93-103-113-123-123-133-14
4-54-64-74-94-11
4-124-134-154-194-214-224-23
5-25-25-95-33


1 Introduction
For purposes of community planning and environmental assessments, the trend is towardprediction and analysis of aircraft noise at increasing distances from airports. Noise levelsaround airports and airbases in the United States are computed using the Federal AviationAdministration's (FAA's) Integrated Noise Model (INM) 1'2"3or the Air Force's NOISEMAP(NMAP) software 4. Historically, noise contours are expressed in terms of day-night averagesound level (DNL or Ldn) in the vicinity of the airport. The aforementioned noise models wereconceived and developed for use within the 65-dB L_n contour. However, environmentalassessments, community planning, and even en-route noise issues are forcing the use ofthese models to and beyond the 55-dB Ldncontour line. For a medium or large airport, the 55-dB Ldn contour line can be as much as 15 miles away from the runway threshold.
Previous studies 5 undertaken by Wyle Laboratories considered the accuracy of INM andNOISEMAP out to the 55-dB L_n contour line, or approximately six to seven miles away from
the airport. Statistical analysis of more than 300 correlated noise events, using INM and fieldmeasurements, demonstrated the applicability of the fundamental acoustic methodologiesbetween the 65- and 55-dB L_n contours. The current study considers noise prediction well
beyond the 55-dB Ldn contour at Denver International Airport 6 (DIA) for distances up to25 miles from the runway threshold.
Several significant analysis improvements were made during the course of this study, namelythe development of a thrust prediction methodology and an improved "track first" noisecorrelation process. The basic premise is to model the aircraft in the exact location, with themost accurate representation of speed and power possible, allowing the only remaining issuesto be the acoustic and atmospheric modeling and the noise source data utilized by the noise
model. During the course of this study DIA, United Airlines (UAL) and Delta Airlines (DL)cooperated extensively, allowing Wyle Laboratories to develop a power predictionmethodology, as well as obtain detailed flight information such as position, speed, takeoffgross weights and historical airframe/engine equipment usage.
Table 1-1 itemizes the required information for prediction of aircraft noise:
Aircraft Noise Prediction Data Requirements
Aircraft PositionAircraft Speed
Aircraft Enoine StateNoise Source Data as a Function of Power. Speed. and Distance
Atmospheric Conditions Between Source and ReceiverTerrain and Ground Cover States
Table 1-1
1-1

Validationof Aircraft NoisePredictionModelsat LowLevelsof Exposure
For the current study, data was gathered in sufficient detail to fulfill all of the above noiseprediction requirements (Table 1-2).
Data Availability for the Current Noise Study
Requirement Data Obtained
AircraftPosition
AircraftSpeedAircraft EngineState
(Power Setting)Percentof FlightsNot Derated
Noise Source Data
ARTS IliA Radar Data
DetailedPerformanceand
Histodcal OperationalData fromUnitedAidinesand Delta Airlines
INM Intemal Noise DatabaseN-P-D Curves
Atmospheric Conditions HoudyGroundWeather Data andBetweenSource andReceiver Twice-DailyUpperAir Data
Terrainand Ground Cover States USGS* Terrain and ElevationDataand Noise MonitoringSite Surveys
Note:*U.S.GeologicalSurvey
Table 1-2
During the study, the following assumptions and simplifications were made due to dataunavailability or task scope restrictions:
• Vertical atmospheric profile parameters were linearly interpolated from twice-dailyballoon launch data.
• A given aircraft departure was assumed to perform a derated thrust takeoff if suchoption was available, based on the local current atmospheric information andtakeoff gross weight of the aircraft. Historical derate percentiles were applied onlyto the final analysis correlation parameters.
• Power schedules and net corrected installed thrust were calculated based on flight-specific atmospheric conditions, although INM allows only one set of atmosphericconditions per study.
• Estimation of thrust levels was only performed for departures. Arrivals, where pilotsare often "jockeying" the throttles, were not considered in the current study, sinceexisting simple thrust from velocity or descent gradient methods do not addresssuch significant random pilot throttle variations.
Chapter2 of this report documents the measurement planning and the decisions maderegarding airport selection and site location as well as details of the measurementsthemselves and the data acquisition process. Presentation of the acquired data is given inChapter 3. Analysis of the data correlation between predicted and measured noise levels anddocumentation of the power prediction methodology is contained in Chapter 4. Interpretationof the results is contained in Chapter 5, while conclusions and recommendations for futurework are made in Chapter 6.
1-2

2 Measurement Program and Data Acquisition
2.1 Introduction
Building on experiences gained in the previous Dulles Noise Study s, a high priority wasplaced on the enlistment of airline cooperation to ensure that accurate power and throttlesettings could be evaluated for all points in the profile. Airline cooperation was alsodeemed critically necessary for obtaining detailed actual "as-flown" fleet airframe/enginecombinations as well as takeoff weights. Assumptions were made regarding equipment
usage in the prior study and were based on fleet average assessments with destinationsbased on the Official Airline Guide (OAG). For this study, we considered it necessary toobtain exact detailed, indisputable airframe/engine information directly from the FAA-mandated airline maintenance archives, as well as detailed takeoff and climb thrust
performance data.
2.2 Airport Selection
During the planning phase for this study, the following criteria shown in Table 2-1 weredeveloped to aid in the selection of the measurement airport.
Airport Site Selection Criteria
1. Availability of ARTS Radar Data
2. Cooperationof Airlineswitha significantnumberof opera-tions atthe airport.
3. Lowbackgroundnoiselevelsinthe surroundingcommunity,especiallyinareas beyondthe 55-dB _n contourline.
4. Cooperation withthe localnoiseabatementofficeandaccessto existingnoisemonitoringsystemdata.
Table 2-1
After research and coordination efforts, Denver International Airport (DIA) was selectedand approved by NASA as the study site. 6
2.3 Measurement Site Selection
The DIA Noise Abatement Office provided to Wyle Laboratories a series of official _n
contours surrounding the airport (Figure 2-1). Several days of sample radar tracking datawere also provided to aid in the monitor location selection process. As shown inFigure 2-1, DIA has an extensive noise monitoring system in place, to which access was
2-1

Validationof AircraftNoisePredictionModelsat Low Levelsof Exposure
granted for obtaining noise measurement data. Additional temporary monitoring stationswere selected to supplement the DIA permanent monitoring system.
Supplementary site locations were identified after consideration of the following:
• expected Ldnnoise contour locations
• flight track-based analysis of sample radar data
• likelihood and levels of background noise
• equipment security
• location accessibility
An on-location survey of the proposed sites led to the final selection. This surveyidentified specific locations and considered local noise sources such as automobile traffic,construction, as well as site accessibility and security. Permission from the landowners toinstall and maintain equipment was obtained for all locations.
All but one of the supplementary sites were located outside or near the 65-dB I._ncontour.The monitors installed by Wyle were located east of Runway 08/26 and south of theairport. Using flight tracks as a guide, the noise monitors were located under the densestair traffic. The distances between the airport origin and the DIA and Wyle noisemonitoring sites are listed in Table 2-2.
2-2

Validation of Aircraft Noise Prediction Models at Low Levels of Exposure
I
I
m
° o
O O
I;I
o
2-3

Validationof Aircraft NoisePredictionModelsat LowLevelsof Exposure
DIA(S)andWyle(W)NoiseMonitorSiteDistancesMonitor Distance, Monitor Distance, Monitor Distance,
Site nmi Site nmi Site nmi$10 5.18 $27 21.90 W04 18.49
$11 7.22 $28 5.77 W05 22.39
$12 9.10 $29 3.56 W06 9.36
$13 9.12 $30 7.55 W07 10.86
$14 11.74 $31 22.57 W08 11.03
$15 10.70 S01 3.51 W09 12.21
$16 11.95 S02 5.14 W10 13.91
$17 10.28 S03 7.14 Wll 8.89
$18 10.81 S04 5.96 W12 21.88
$19 10.46 S05 9.02 W13 5.63
$20 10.95 S06 8.89 W14 24.49
$21 9.09 S07 5.63 W15 24.55
$22 9.60 S08 6.58 W16 24.70
$23 7.87 S09 2.00 W17 24.98
$24 9.88 W01 6.58 W18 25.36
$25 9.15 W02 10.68 W19 25.89
$26 6.78 W03 14.34
Table 2-2
2-4
Validationof Aircraft NoisePredictionModelsat LowLevelsof Exposure
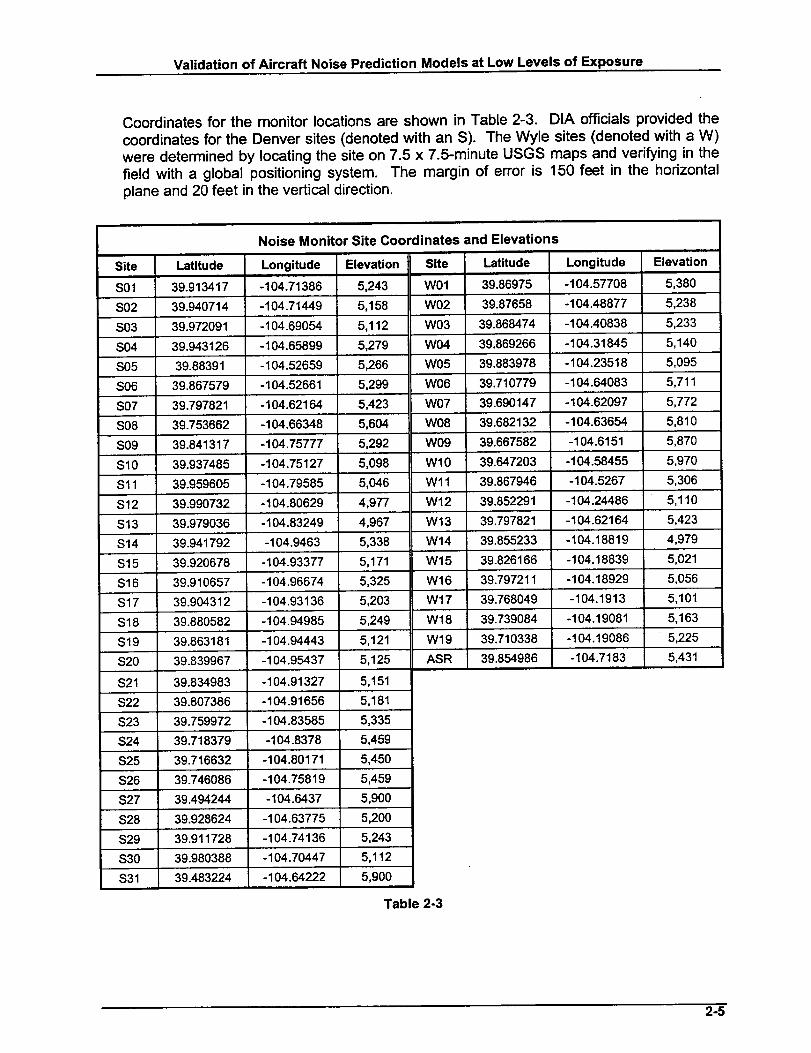
Coordinates for the monitor locations are shown in Table 2-3. DIA officials provided the
coordinates for the Denver sites (denoted with an S). The Wyle sites (denoted with a W)
were determined by locating the site on 7.5 x 7.5-minute USGS maps and verifying in the
field with a global positioning system. The margin of error is 150 feet in the horizontal
plane and 20 feet in the vertical direction.
Noise Monitor Site Coordinates and Elevations
Site
S01
S02
Latitude
39.913417
39.940714
S03 39.972091
S04 39.943126
S05 39.88391
S06
S07
S08
S09
Sl0
Sll
S12
$13
$14
$15
$16
$17
S18
S19
S20
S21
S22
$23
S24
S25
S26
S27
S28
S29
S30
$31
Longitude
-104.71386
-104.71449
-104.69054
-104.65899
-104.52659
-104.5266139.867579
39.797821 -104.62164
39.753662 -104.66348
39.841317 -104.75777
39.937485
39.959605
39.990732
39.979036
39.941792
39.920678
39.910657
39.904312
39.880582
39.863181
39.839967
39.834983
39.807386
39.759972
39.718379
39.716632
39.746086
39.494244
39.928624
39.911728
39.980388
39.483224
-104.75127
-104.79585
-104.80629
-104.83249
-104.9463
-104.93377
-104.96674
-104.93136
-104.94985
-104.94443
-104.95437
-104.91327
-104.91656
-104.83585
-104.8378
-104.80171
-104.75819
-104.6437
-104.63775
-104.74136
-104.70447
-104.64222
Elevation Site
5,243 W01
5,158 W02
5,112 W03
5,279 W04
5,266 W05
5,299 W06
5,423 W07
5,604 W08
5,292 W09
5,098 W10
5,046 Wll
4,977 W12
4,967 W13
5,338 W14
5,171 W15
5,325 W16
5,203 Wl 7
5,249 W18
5,121 W19
ASR5,125
5,151
5,181
5,335
5,459
5,450
5,459
5,900
5,200
5,243
5,112
5,900
Latitude Longitude
39.86975 -104.57708
Elevation
39.690147
5,380
39.87658 -104.48877 5,238
39.868474 -104.40838 5,233
39.869266 -104.31845 5,140
39.883978 -104.23518 5,095
39.710779 -104.64083 5,711
-104.62097
39.682132
39.667582
39.647203
39.867946
39.852291
39.797821
39.855233
39.826166
39.797211
39.768049
5,772
-104.63654 5,810
-104.6151 5,870
-104.58455 5,970
-104.5267 5,306
-104.24486 5,110
-104.62164 5,423
-104.18819 4,979
-104.18839 5,021
-104.18929 5,056
-104.1913 5,101
39.739084 -104.19081 5,163
39.710338 -104.19086 5,225
39.854986 -104.7183 5,431
Table 2-3
2-5

Validation of Aircraft Noise Prediction Models at Low Levels of Exposure
Note that use of the current L_n contours in Figure 2-1 was for the purpose of providing areference noise environment to aid in the selection of the noise monitoring locations. The
_n contours are an interpretation of the official contours in that they were digitized fromthe original exhibit and registered in a geographic information system (GIS). Thesemodified contours are a good representation of the originals so far as the shape andextent of the footprint; however, due to the digitization process, the contour lines are notas smooth as the originals. These contours should not be considered the official L_,contours for DIA nor should they be used for any land-use planning purposes. AsFigure 2-1 indicates, most of the noise monitoring sites span and exceed the spacebetween the 55- and 65-dB contours, consistent with the main objective of the study: to
examine the predictive capabilities of INM at low-levels of exposure, out to and beyond the55-dB Ld, contour.
2.4 Noise Monitor Installation and Instrumentation
Noise monitoring was conducted during the period from 13 May through 13 June 1997.DIA operates 30 noise monitors in and around the metropolitan area. They are noted asexisting noise monitors in Figure 2-1 and their coordinates are denoted with an S inTables 2-2 and 2-3. Wyle installed an additional 12 monitors (denoted as SupplementaryMonitors in Figure 2-1 and with a W in Tables 2-2 and 2-3) for the duration of themeasurements. Six additional monitors, numbered 14 through 19 in Figure 2-1, were put
in place the afternoon of 12 June and ran for approximately 24 hours. The purpose of thislateral array was to assess the data quantity and quality over extremely long slant rangesand low elevation angles. Decisions regarding future long-range lateral attenuationstudies can make use of this data. Two sets of site numbers side by side in Figure 2-1
(6/11 and 7/13) indicate that a Wyle monitor was placed next to a Denver monitor. Thiswas an effort to ensure that the data gathered from the two different systems, utilizingdifferent brands of monitors, microphones, and calibration techniques, agreed witheach other.
2.5 Measurement Program Execution
Each site chosen for noise monitoring was serviced every two to three days. Thisschedule was sufficient to ensure near continuous operation from 13 May to
13 June 1997. The only down time occurred during the approximately 20-minute monitorsite servicing. Visits to a site included downloading the field data directly to a laptopcomputer, checking and replacing the external batteries, and calibrating to ensure thesystem was operating within tolerance. Records of the visit were made in a site log. Asample site log entry is shown in Figure 2-2.
Immediately following field data collection, the binary files downloaded from the monitorswere transmitted via modem to the home office for analysis.
2-6

Validation of Aircraft Noise Prediction Models at Low Levels of Exposure
Date:
DENVER MONITORING PROGRAM (J/N 19110)
¢
Site #.____ Serial #
FreeMemory
NO.Exc=dances -"
'Threshold
External Bate
Internal Batt
CalibraUon Check _D.I ot_
Changed? Yes__ No ___C./ Nev_ Threshold __
BLnary Data File S 6q _Z_ . I,;,,_a" "-
Wind '_._._bL_ Temp _°F' Prccip _o_{
Comments: /'I,_ A ,[,,, . I /,e_.,_', t_,.-/L ._/ _'_ls_ .+ I lo, t.z_0 _o_'P /_,_ "_,_
•R.,. ,_÷) + I Io_'_. t.,,,..,,;,,__ _.,,.L_' _ //_ _,_÷4 I
/ # u (!
s,te._L__Free Memory
No. Exceedances
"threshold _" Changed?
Internal_t_ 10_ R_p_=_?
Yes __ No
Yes__ No
•Yes__ No
New Threshold __
Calibration Check _(, J_#
Wind I/. _ _,,L Temp _, _;._ OF Precip l,,o._
_Cornment_.- _ o_ ,..o,'.I,-r.,._ _. _e/_u-?/_._, .t._._cu_J ._ _
'_ " I t 0 " Ol
I f r,, - • t'/
Figure 2-2. Sample Site Log
2-7
Validation of Aircraft Noise Prediction Models at Low Levels of Exposure
2.6 Instrumentation
Larson Davis Model 820 sound level meters were used to collect one-second, slowresponse, A-weighted equivalent sound levels (L_s) with single-digit precision. Bruel &Kjaer Model 4176 (type I) microphones attached to Larson Davis Model 827 preamplifierswere covered with a windscreen and secured so that the microphone face was four feet
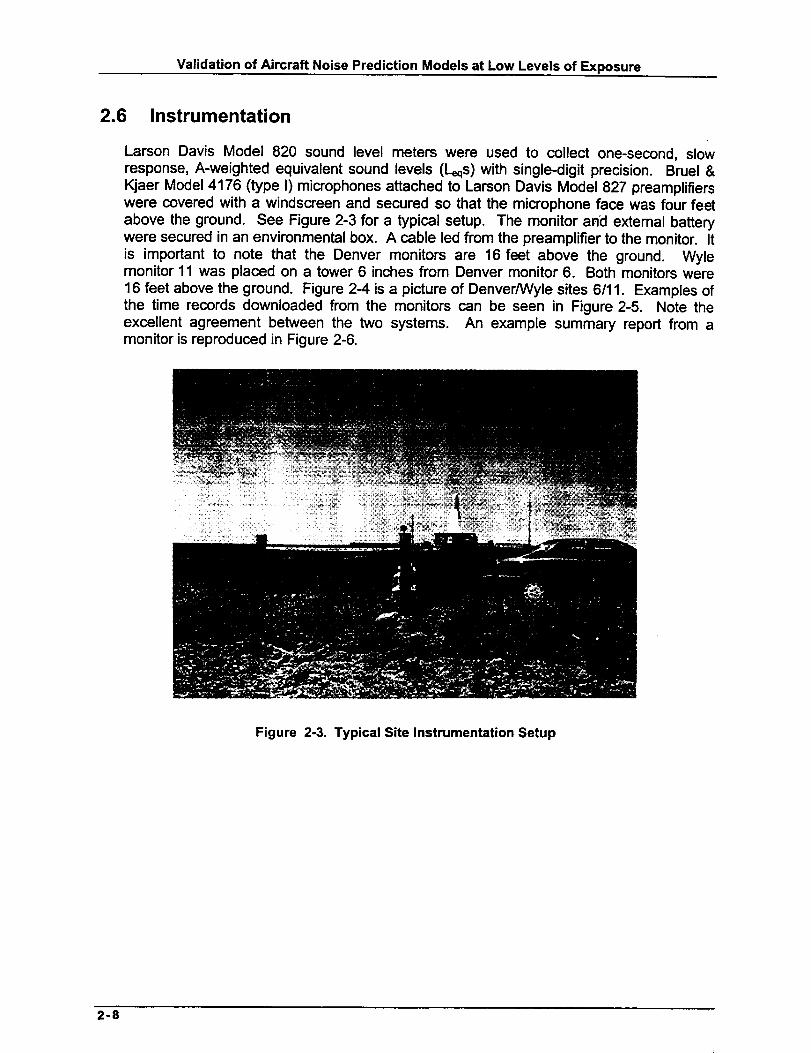
above the ground. See Figure 2-3 for a typical setup. The monitor and extemal batterywere secured in an environmental box. A cable led from the preamplifier to the monitor. It
is important to note that the Denver monitors are 16 feet above the ground. Wylemonitor 11 was placed on a tower 6 inches from Denver monitor 6. Both monitors were
16 feet above the ground. Figure 2-4 is a picture of Denver/Wyle sites 6/11. Examples ofthe time records downloaded from the monitors can be seen in Figure 2-5. Note theexcellent agreement between the two systems. An example summary report from amonitor is reproduced in Figure 2-6.
Figure 2-3. Typical Site Instrumentation Setup
2-8

Validation of Aircraft Noise Prediction Models at Low Levels of Exposure
Figure 2-4. Co-located Denver Site 6 and Wyle Site 11
2-9

Validation of Aircraft Noise Prediction Models at Low Levels of Exposure
21
1001
90
80
70
gO
$0
40
2010:3B:00
my 1997, 5ire 0G Lmx = $300 SEL= 102.7Time 10.'39:38to 10'.41:0G
I
10:41:00 10:A_:00
21 max1997, 5ire 11
160
Lmax= 93.0 5EL= 102.6Time 10:39:35 to 10:41:06
90
70
GO
40
J
r I
2010:3G:_ 10:41:00 10:4G:_
Figure 2-5. Example Time Records for Co-located Denver Site SO6 and Wyle Site Wll
2-10

Validation of Aircraft Noise Prediction Models at Low Levels of Exposure
Site: 0 Model: 820
Location:
Date: 25May 97 11:22:51
Run Time
Start Time
Leq
SEL
Lmax
Lmax Time
Lmin
Lmin Time
Peak
Peak Time
Unweighted Peak
Uwpk Time
Dose
Projected Dose
Threshold
Criterion
Lnvalues
L 1 = 82.7
L50 = 43.3
Overal i Current
51:25:27.3 00:00:00.0
25May 97 11:22:51 27May 97 14:50:26
72.1 Leq 0.0
124.7 0.0
104.4 0.0
27May 97 10:50:10 31Jan 00 00:00:00
21.7 0.0
27May 97 01:36:05 31Jan 00 00:00:00
121.2 0.0
25May 97 19:31:40 31Jan 00 00:00:00
124.2 0.0
25May 97 19:31:40 31Jan 00 00:00:00
0.0 0.0
0.0 0.0
0 0
0 0
LI0 = 62.6 L33 = 48.3
L90 = 26.6 L99 = 23.7
Ldn 72.5 Event Leq 72.1
Cnel 73.4 Event Time 50:37:38.5
Sound Exposure 0.3 Background Leq 65.7
Overloads 0 Background Time 00:47:48.8
Pause Time 00:00:00.0
Records:
Run/Stop 2 Daily 0
Event 0 Calibration 1
Interval 52 Time History 185130
Figure 2-6. Sample Monitor Summary Report
2.7 Site Visit
When visiting a monitor site, the temperature and wind speed were recorded. Theseweather records agreed with the surface data measured at the airport. The condition ofthe external battery was checked. If the voltage was low, it was replaced with a newlycharged battery. The amount of memory used since the last download was recorded.The calibration was checked with a Bruel & Kjaer Model 4231 calibrator. Any deviation ofthe measured level of the calibration tone from what it should be was recorded. Themonitor's clock was reset to the correct time. The difference between the correct time and
the monitor's clock time, if any, was recorded. Generally, it was found that the monitor'stime differed from the correct time by less than three seconds. The correct time was takenas that transmitted by the Naval Observatory.
2-11

Validation of Aircraft Noise Prediction Models at Low Levels of Exposure
2.8 Analysis
All data were received at each site continuously with few exceptions. The monitor atDenver site 7/Wyle site 13 was moved to Denver site 6/Wyle site 11 on 20 May. The roadleading to this site was treacherous. Were there any rains, it would have beenimpassable. A monitor at site 9 on 21 May was not operating because of equipmentfailure. It was replaced. During a period of approximately two hours on 4 June none ofthe monitors were operating. Their memories were filled and data had ceased to betaken. Otherwise, one-second Leqs were being recorded by the Wyle monitors at all timesduring the measurement period except during each 20-minute monitor-servicing period.
From 13 May to 21 May, the windscreens of all monitors were covered with plastic toprotect the microphones from moisture. Laboratory measurements showed no change insound levels between a wrapped and unwrapped windscreen. After 21 May, the wrapswere not replaced over the windscreen because they were deemed unnecessary. None ofthe microphones exhibited adverse effects from exposure. The unwrapped windscreensprotected the microphones from the rain. There was no equipment failure as a result ofthis action; therefore.
2-12

3 Presentation of Data Acquired
Data were obtained from several sources and required the cooperation of numerousorganizations and agencies. This cooperation enabled Wyle Laboratories to accumulate anextremely detailed, broadly comprehensive set of acoustic, atmospheric, and operational data.Data gathering fell into five general areas:
1. weather and atmospheric conditions
2. radar tracking data
3. noise monitoring data
4. operational information
5. performance and power data
Table 3-1 provides a summary of overall operations at DIA during the measurement period.
Sections 3.1 to 3.5 give descriptions of each of these data types. Section 3.6 includes,in addition to the basic measurement program, data from a mini-lateral array at sites W14to W19, as described in Section 2.4.
3.1 Weather and Atmospheric Data
Two types of atmospheric data were acquired:
• hourly surface weather data from DIA
• vertical profile data from twice-daily balloon launches at Denver-StapletonAirport
Airport surface weather data was geared to pilot requirements and includedinformation as:
• wind speed and direction
• gust information
• temperature
• barometric pressure
• dew point
• relative humidity
• precipitation
• atmospheric observations such as cloud cover and visibility
such
3-1

Validation of Aircraft Noise Prediction Models at Low Levels of Exposure
Summary Data From Radar Tracking
Aircraft Type
B727B737
B757
B767
B757
B777
BA46
DC10
DC8
DC9
MD80
MD88
GA & other
Total
Start Date: 19970515Ending Date: 19970613
Total Tracks: 14,992
Total Number I ] Operator
-H-- II
4,790 II American
1,335 II Delta80 II General Aviation
101 II NorthWest
119 I] TWA
274 II United
317 II UPS67 II US Air
101 IJ Other
682 II108 II
5,115 -H-- _ Total
Runway/O )erations
Runway Operations
7/Arrival 2497/Departure 2
8/Arrival 0
8/Departure 4,486
16/Arrival 420
16/Departure 517L/Arrival
17L/Departure17R/Arrival
17R/Departure
26/Arrival
26/Departure
3
611
243
2,077
115
25/Arrival 0
25/Departure 1,414
34/Arrival
34/Departure35L/Arrival
35L/Departure
35PJArrival
35PJDeparture
ASR/An-ival
ASPJDeparture
Overfl_htsTotal
0
1,673
186535
791
226
2,703
" 63
14,992
# Operations -Arrival and
Departure
427
415
2,069213
129
6,306
61
140
5,232
14 992
Table 3-1
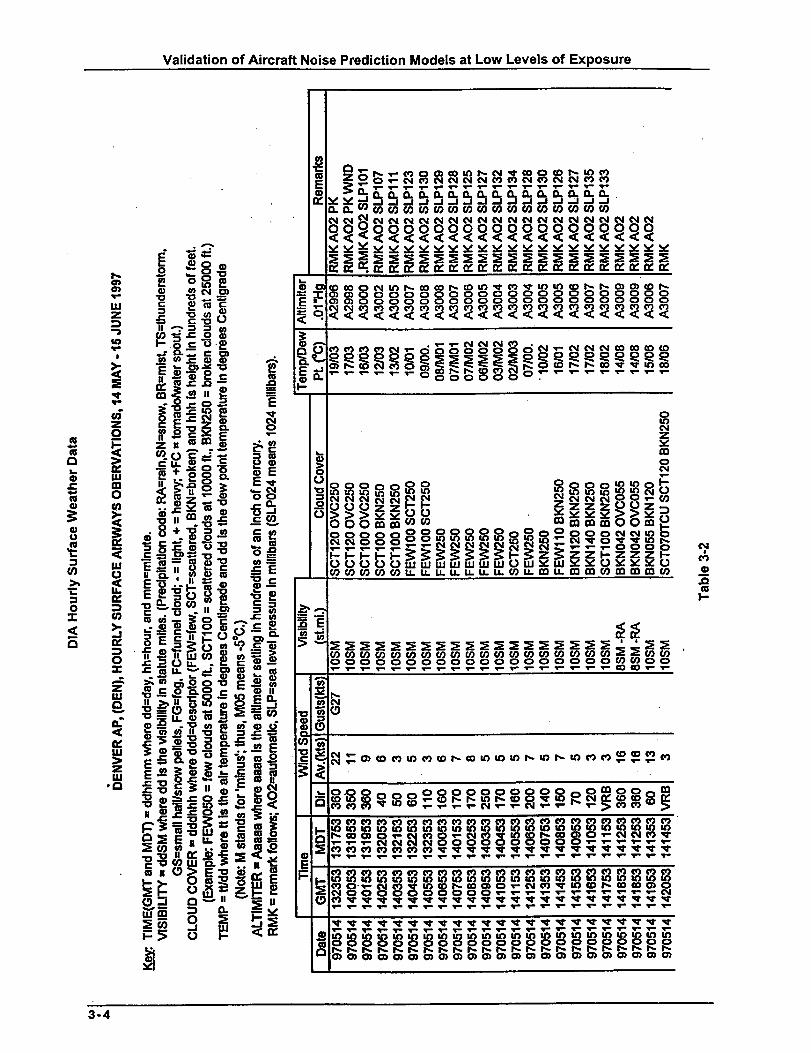
Table 3-2 contains a partial report of hourly surface weather data. Barometric pressuresreported in this data are actually the reference pressure or altimeter setting for the pilots.
3-2

Validation of Aircraft Noise Prediction Models at Low Levels of Exposure
This is the setting, in inches of mercury, at which the airplane's altimeter will read actualgeometric airport altitude for the given atmospheric conditions.
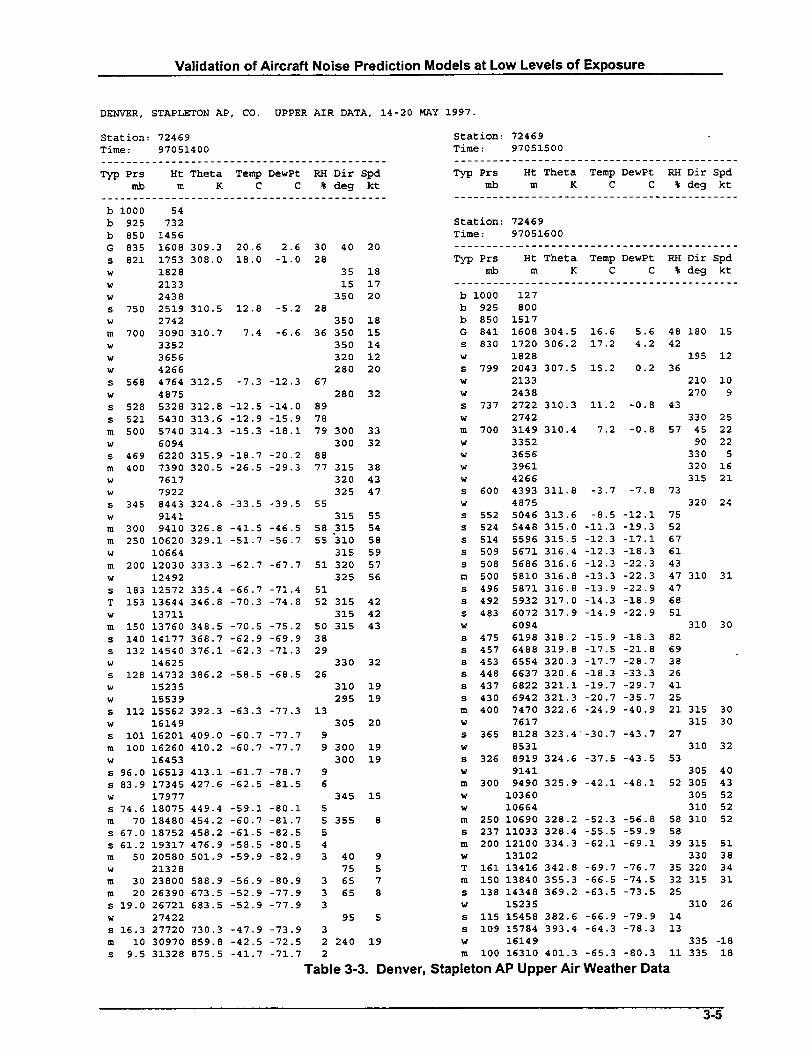
Sample upper air weather data from the balloon launches is presented in Table 3-3.Contained within these reports for the reporting altitudes is the atmospheric pressure inmillibars, wind speed and direction, temperature, dew point, and humidity. As the balloonrises, data is reported at irregular intervals.
3-3
Validation of Aircraft Noise Prediction Models at Low Levels of Exposure
r_
or.
qiI
o
oum1:
U)
i
0-r
<I
r_
mJ_t_I-
3-4
Validation of Aircraft Noise Prediction Models at Low Levels of Exposure
DENVER, STAPLETON AP, CO. UPPER AIR DATA, 14-20 MAY 1997.
Station: 72469
Time: 97051400
............................................
Typ Prs Ht Theta Temp DewPt RH Dir Spd
mb m K C C % deg kt
............................................
b I000 54
b 925 732
b 850 1456
G 835 1608 309.3 20.6 2.6 30 40 20
s 821 1753 308.0 18.0 -i.0 28
w 1828 35 18
w 2133 15 17
w 2438 350 20
s 750 2519 310.5 12.8 -5.2 28
w 2742 350 18
m 700 3090 310.7 7.4 -6.6 36 350 15
w 3352 350 14
w 3656 320 12
w 4266 280 20
s 568 4764 312.5 -7.3 -12.3 67
w 4875 280 32
s 528 5328 312.8 -12.5 -14.0 89
s 521 5430 313.6 -12.9 -15.9 78
m 500 5740 314.3 -15.3 -18.1 79 300 33
w 6094 300 32
s 469 6220 315.9 -18.7 -20.2 88
m 400 7390 320.5 -26.5 -29.3 77 315 38
w 7617 320 43
w 7922 325 47
s 345 8443 324.8 -33.5 -39.5 55
w 9141 315 55
m 300 9410 326.8 -41.5 -46.5 58 315 54
m 250 10620 329.1 -51.7 -56.7 55 "310 58
w 10664 315 59
m 200 12030 333.3 -62.7 -67.7 51 320 57
w 12492 325 56
s 183 12572 335.4 -66.7 -71.4 51
T 153 13644 346.8 -70.3 -74.8 52 315 42
w 13711 315 42
m 150 13760 348.5 -70.5 -75.2 50 315 43
s 140 14177 368.7 -62.9 -69.9 38
s 132 14540 376.1 -62.3 -71.3 29
w 14625
s 128 14732 386.2 -58.5 -68.5 26
w 15235
w 15539
s 112 15562 392.3 -63.3 -77.3 13
w 16149 305 20
s i01 16201 409.0 -60.7 -77.7 9
m 100 16260 410.2 -60.7 -77.7 9 300 19
w 16453 300 19
s 96.0 16513 413.1 -61.7 -78.7 9
s 83.9 17345 427.6 -62.5 -81.5 6
w 17977 345 15
s 74.6 18075 449.4 -59.1 -80.1 5
m 70 18480 454.2 -60.7 -81.7 5 355 8
s 67.0 18752 458.2 -61.5 -82.5 5
s 61.2 19317 476.9 -58.5 -80.5 4
m 50 20580 501.9 -59.9 -82.9 3 40 9
w 21328 75 5
m 30 23800 588.9 -56.9 -80.9 3 65 7
m 20 26390 673.5 -52.9 -77.9 3 65 8
s 19.0 26721 683.5 -52.9 -77.9 3
w 27422 95 5
s 16.3 27720 730.3 -47.9 -73.9 3
m i0 30970 859.8 -42.5 -72.5 2 240 19
s 9.5 31328 875.5 -41.7 -71.7 2
330 32
310 19
295 19
Station: 72469
Time: 97051500
............................................
Typ Prs Ht Theta Temp DewPt RH Dir Spd
mb m K C C % deg kt
............................................
Station: 72469
Time: 97051600
............................................
Typ Prs Ht Theta Temp DewPt RH Dir Spd
mb m K C C % deg kt
............................................
b 1000 127
b 925 800
b 850 1517
G 841 1608 304.5 16.6 5.6 48 180 15
s 830 1720 306.2 17.2 4.2 42
w 1828 195 12
s 799 2043 307.5 15.2 0.2 36
w 2133 210 i0
w 2438 270 9
s 737 2722 310.3 11.2 -0.8 43
w 2742 330 25
m 700 3149 310.4 7.2 -0.8 57 45 22
w 3352 90 22
w 3656 330 5
w 3961 320 16
w 4266 315 21
s 600 4393 311.8 -3.7 -7.8 73
w 4875 320 24
s 552 5046 313.6 -8.5 -12.1 75
s 524 5448 315 0 -11.3 -19.3 52
s 514 5596 315
s 509 5671 316
s 508 5686 316
m 500 5810 316
s 496 5871 316
s 492 5932 317
s 483 6072 317
w 6094
5 -12.3 -17.1 67
4 -12.3 -18.3 61
6 -12.3 -22.3 43
8 -13.3 -22.3 47 310 31
8 -13.9 -22.9 47
0 -14.3 -18.9 68
9 -14.9 -22.9 51
S 475 6198 318 2 -15.9 -18.3 82
s 457 6488 319
s 453 6554 320
s 448 6637 320
s 437 6822 321
S 430 6942 321
m 400 7470 322
w 7617
310 30
8 -17.5 -21.8 69
3 -17.7 -28.7 38
6 -18.3 -33.3 26
1 -19.7 -29.7 41
3 -20.7 -35.7 25
6 -24.9 -40.9 21 315 30
315 30
S 365 8128 323.4 -30.7 -43.7 27
w 8531 310 32
S 326 8919 324.6 -37.5 -43.5 53
w 9141 305 40
m 300 9490 325.9 -42.1 -48.1 52 305 43
w 10360 305 52
w 10664 310 52
m 250 10690 328.2 -52.3 -56.8 58 310 52
s 237 11033 328.4 -55.5 -59.9 58
m 200 12100 334.3 -62.1 -69.1 39 315 51
w 13102 330 38
T 161 13416 342.8 -69.7 -76.7 35 320 34
m 150 13840 355.3 -66.5 -74.5 32 315 31
s 138 14348 369.2 -63.5 -73.5 25
w 15235 310 26
s 115 15458 382.6 -66.9 -79.9 14
s 109 15784 393.4 -64.3 -78.3 13
w 16149 335 -18
m I00 16310 401.3 -65.3 -80.3 ii 335 18
Table 3-3. Denver, Stapleton AP Upper Air Weather Data
3-5

Validation of Aircraft Noise Prediction Models at Low Levels of Exposure
3.2 Radar Tracking Data
Radar data from the ARTS IlIA 7 was obtained for the duration of the measurement
program. The DIA Noise Abatement Office provided FAA ARTS IliA radar system files in
*.REL format. These data files consist of Beacon hits as well as interfacility messages.
Interfacility messages contain one-time information relays such as:
• airline flight number
• aircraft beacon code
• arrival or departure
• destination airport and first fix
• scheduled arrival or departure time
Radar Beacon data contains aircraft location information assembled in radar sweep
sequence. Radar receivers at DIA rotate at approximately 13 revolutions per minute
(RPM), representing one radar hit every 4.5 seconds.
Table 3-4 contains an itemization of the raw radar data provided to Wyte Laboratories.
During periods indicated, radar-tracking data was not available due to ARTS III interface
system problems.
ARTS IliA Radar Tracking Data Summary
Date File Size(Bytes)
970513 23896716
970514 26607552
970515 30759528
970516 28910088
970517 23191700
970518 24283532
970519 22945616
970520 26633636
970521 26597100
970522 19858528
970523 28094792
970524 26923196
970525 18135972
970526 16824096
970527 22325084
970528 28722224
970529 8102708
Note: *lncom)le_ due
Date File Size(Bytes)
970530 29572836
970531 29081600
970601 27231260
970602 20346412
97()603 3284942
970604 34341912
970605 32577320
970606 486932 *
970607 Missing *
970608 21373960
970609 19347572
970610 27526380
970611 35307896
970612 29116276
970613 24155336
970614 27898644
problemsatTRACON
Table 3-4
3-6

Validation of Aircraft Noise Prediction Models at Low Levels of Exposure
3.3 Noise Monitoring Data
As stated in Section 2.3 and shown in Figure 2-1, a total of 50 noise monitors were in
operation during the measurement program. Each monitoring station recordedcontinuous, round-the-clock, one-second, slow response, A-weighted L_qs with single-digitprecision. Care was taken during the monitoring program to ensure that times wereproperly synchronized between the monitors and the radar tracking system. Figure 3-1shows a sample time history for noise monitor #W02. Multiple peaks are visible as severalaircraft pass overhead. The background noise level of approximately 43 dB is alsoapparent. The first, third, fourth, and fifth events are most likely departures fromRunway 08, whereas the second noise event is likely a departure from Runway 17L as
evidenced by the lower peak, longer duration, and unsteadiness caused by longer rangepropagation.
30 I10)'1997, 51te k_2 Lmax= 69,0 5EL= 85,1
100 Time 19:03:33 to 19;13:07
90
80
70
_0
50
40
30
2019:03=2[;
t I
19:eg:21; 19:13:_
Figure 3-1. Time History for Monitoring Site W02
3-7
Validationof Aircraft NoisePredictionModelsat LowLevelsof Exposure
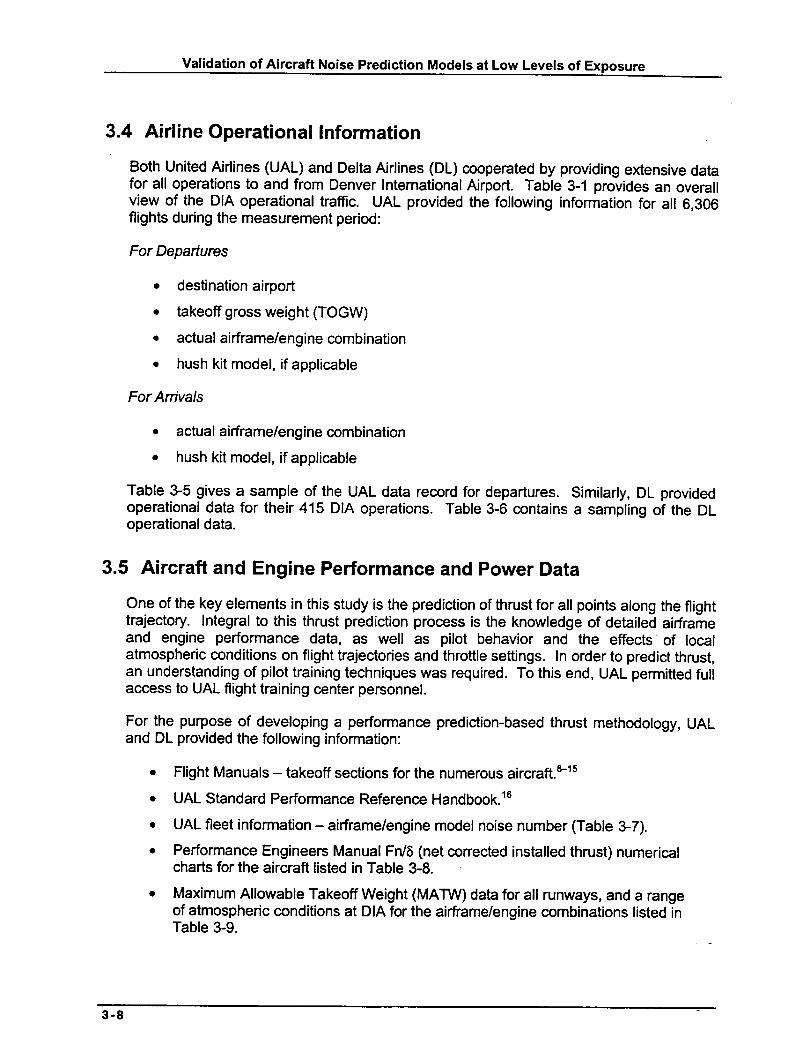
3.4 Airline Operational Information
Both United Airlines (UAL) and Delta Airlines (DL) cooperated by providing extensive datafor all operations to and from Denver International Airport. Table 3-1 provides an overallview of the DIA operational traffic. UAL provided the following information for all 6,306flights dudng the measurement period:
For Departures
• destination airport
• takeoff gross weight (TOGW)
• actual airframe�engine combination
• hush kit model, if applicable
For Arrivals
• actual airframe/engine combination
• hush kit model, if applicable
Table 3-5 gives a sample of the UAL data record for departures. Similarly, DL providedoperational data for their 415 DIA operations. Table 3-6 contains a sampling of the DLoperational data.
3.5 Aircraft and Engine Performance and Power Data
One of the key elements in this study is the prediction of thrust for all points along the flighttrajectory. Integral to this thrust prediction process is the knowledge of detailed airframeand engine performance data, as well as pilot behavior and the effects of local
atmospheric conditions on flight trajectories and throttle settings. In order to predict thrust,an understanding of pilot training techniques was required. To this end, UAL permitted fullaccess to UAL flight training center personnel.
For the purpose of developing a performance prediction-based thrust methodology, UALand DL provided the following information:
• Flight Manuals - takeoff sections for the numerous aircraft, s-is
• UAL Standard Performance Reference Handbook. 18
• UAL fleet information - airframe/engine model noise number (Table 3-7).
• Performance Engineers Manual Fn/5 (net corrected installed thrust) numericalcharts for the aircraft listed in Table 3-8.
• Maximum Allowable Takeoff Weight (MATW) data for all runways, and a rangeof atmospheric conditions at DIA for the airframe/engine combinations listed inTable 3-9.
3-8

Validation of Aircraft Noise Prediction Models at Low Levels of Exposure
United Airlines Operational Data
UNITED AIRLINES TAKE=OFF WEIGHTS SORTED BY DATE AND TIME
ORIGIN
DENDENDENDENDEN
DENDENDENDENDENDENDEN
DENDENDENDENDEN
DENDENDENDENDENDENDENDENDEN
DENDENDENDENDENDENDENDENDEN
DENDENDENDENDENDENDENDENDENDENDENDEN
DEST
SFOlAD
SFODFWLAXMSPPHXORD
LAXLAXLASMCICOSSFO
DENMCOIAH
EWRSMFABQPHXPHLSAN
SNADFWLGAMSP
SLCONTLAXOAKSEALAXSJClADSFOBOSORDPDXBOI
PHXLASSLCORDSANSFOSEA
T.O. DATE FLIGHT TAIL T.O.ACTUAL SCHED. NO. F/I=FT NO. TIME
970514 970514 1793 737 0970514 970514 142 737 N316UA 6.2970514 970514 1279 757 N541UA 6.23
970514 970514 216 737 N984UA 6.43970514 970514 269 320 N412UA 6.45970514 970514 1094 737 N910UA 6.46970514 970514 2751 737 N943UA 6.58970514 970514 610 727 N7462U 7.12
970514 970514 307 737 N986UA 7.15970514 970514 1769 757 N555UA 7.55970514 970514 2701 737 N377UA 8.18970514 970514 484 737 N932UA 8.23970514 970514 1491 737 N395UA 8.23970514 970514 1845 737 N951UA 8.23
970514 970514 1598 737970514 970514 1066 757970514 970514 1145 737970514 970514 1474 727
970514 970514 759 727970514 970514970514 970514 2753 737970514 970514 1660 737970514 970514 1091 727970514 970514 553 737
N983UA 8.24N586UA 8.25N991UA 8.25
N7284U 8.26N7276U 8.27
467 737 N998UA 8.28N373UA 8.29N930UA 8.33N7265U 8.34N352UA 8.35
970514 970514 1598 737 N983UA 8.35970514 970514 1678 737 N340UA 8.35970514 970514 204 737 N920UA 8.36
970514 970514 785 737 N322UA 8.37970514 970514 1029 737 N923UA 8.39970514 970514 817 727 N7445U 8.4970514 970514 221 737 N312UA 8.41970514 970514 293 D10 N1843U 8.43970514 970514 193. D10 N1837U 8.44970514 970514 279 737 N904UA 8.45970514 970514 180 757 N562UA 8.46970514 970514 835 D10 N1812U 8.48970514 970514 1762 737 N363UA 9.03970514 970514 240 777 N775UA 9.12
9.149.4
970514 970514 543 727970514 970514 729 737970514 970514 2755 737970514 970514 2703 737970514 970514 1111 737970514 970514 _ 757970514 970514 1215 727970514 970514 207 737970514 970514 223 737
N7282U
N988UAN905UA 9.41
N375UA 9.45N350UA 9.46N594UA 9.47
N7442U 9.5N353UA 9.58N355UA 10.02
T.O. GROSSWEIGHT
101733110,050172,252
90,849130,869
95,0130
165,53396,713
182,787115,95696,40887,482
114,36899,278
190,72499,372
158,280145,644
97,068112,725105,549148,075105,189
0
114,635103,785109,827100,151
146,394106,831347,972343,531110,652187,rf_363,628116,779449,289161,529
93,0540
99,028194,939152,740117,620
122T349
Table 3-5
3-9

Validation of Aircraft Noise Prediction Models at Low Levels of Exposure,.j ' l_- ' i_
...._,,,, II_-= ]I_
]_,mE,-,
:_-:1,,.;_
• _.
• :* :- i
. -n
r .OLt ,
. _i!¸o_
r_ --.I n.r _
_. '_..___
aea_ '-
z.E
":,'_0,_ ._
•3_*:
!:"_:i
. _ _:
.:;:_ : ._.
ooooo o ooo o =ZZZ Z ZZ_ Zz
m_ m_NN
3-10

Validation of Aircraft Noise Prediction Models at Low Levels of Exposure
United Airlines Fleet Data
• I/I/UnITED AIRLinE5
N# UA# Set.# .
_E IDENTIFICATION' RECORD- "AIR" L11_'I_'_D DISTRYBU_I_ON ISSUE
_'_37-822 (CFPA--_'-8-B1 m--3C-1) ' ' 737-522 (U--_--M56-S-B1 or.3C-1)N # UA# Ser.#
N395UA 93_ 24670
N396UA _96 24671• N397UA _97 246?2
N398UA _98 246_
N399UA _ 246/4
N202UA 9(X_ 24717N203UA 9(XB 247_
--737-322 (CFM56-3-B1 or.SC-1)N # UA# Ser.#
N358UA 1358 24379
N366UA 1366N375UA 1375N376UA 1376 24641N377UA 1377 24642
N381UA ]281 24656
N394UA 1394 24669
737-322 Fleet = 101FAR36 Stg3
Mote: the 13xx UA#'s representthe 737322 Shuttle sub-fleet.
The 94xx and 99xx UA#'sindicate 22,000 lb.engine thrust
rating;, the 13xx, 93xx and 90xxUA#'s indicate 20,000 Ib engine
thrust rating.
¢
N901UA 1701 250_1N902UA 17(_ 250_
Ng03UA 1703 250_
N904UA- 1704 25004Ng05UA 1705 2,5_5
N906UA 1706 25006Ng07UA 1707 25007
Ng08UA 1708N909UA. 1709 25_9N910UA 1710 25254N911UA 1711 25255
N912UA 1712 25290N913UA 1713 25291
N914UA 1714 25381N915UA 1715 25382
N916UA 1716 25383
N917UA 1717 2,5384
N918UA 1718 25385
N919UA 1719 25386
N920UA 1720 25387
N921UA 1721 25388
N922UA 1/22 _o642N923UA 1723 26643
N924UA 1724 26645
N925UA 1725 26646
N926UA 1726 26648N92?UA 1727 26649N928UA 1?28 26651
N929UA 1729 26652
N930UA 1730 26655N931UA 1731 26656
N932UA 1732 26658 '
N933UA 1733 26659N934UA 1734 26662
N935UA 1735 26663
N936UA 1736 2566/
N937UA 1737 26668N938UA 1738 26671N939UA 1739 266?2
N940UA 1740 266/5
N941UA 1741 _-I_N942UA 1742 •266/9
N943UA 1743 26680
N944UA 1744N945UA 1745 26684
N946UA 1746 26687N947UA 1747 26688
This A.LR. is a part of the FAA-Approved UA Operations Specifications, Paragraph D-85.
CONTINUEDMAY 20/97 GENERAL PROCESS MANUAL
GN/MM 8-0.4-0 TABLF.S AND CHARTS
PAGE 4
Table 3-7
3-11

Validation of Aircraft Noise Prediction Models at Low Levels of Exposure
Available FNI8 Data Airframe/Engine Combinations
B727 Advanced JT8D-15 (pod and center engine)
B737-300 CFM-56-3-B1 (20,000 Ibs. rated thrust)
B737-300 CFM-56-3-B2 (22,000 Ibs. rated thrust)
B737-500 CFM-56-3-B1 (20,000 Ibs. rated thrust)
B757-200 PW-2037
MD-80 JTSD-219
Table 3-8
Available Maximum Allowable Takeoff
Weight Charts
Airframe Engine
A319-100 V2522
A320-200 V2527
B727-Advanced JTSD-15
B737-200 ADV-9A JT8D-9A
B737-200 ADV-17 JT8D-17
B737-222 STR-7 JTSD-7 & 7B
B737-300 (CFM 56-3 B1/C1-20K)
B737-300N (CFM 56-3 B2-22K)
B737-500 (CFM 56-3 B1/C1-20K)
B757-200 PW2037
B767-200 JTgD-7R4D
B767-300ER PW 4060
B777-200 PW4077
B777-200B PW 4090
DC10-10 CF6.-6D
DC10-30 CF6-50C2
DC10-30F CF6-50C2
Table 3-9
3-12

Validation of Aircraft Noise Prediction Models at Low Levels of Exposure
For comparison with the Wyle thrust prediction model, the Climb and Throttle Scheduler(CATS code), UAL provided takeoff derated thrust predictions based on their in-housedetailed performance code, accessible via their Unimatic system. Table 3-10 contains asample printout from the Unimatic system for a B757-200 flight. Detailed derated thrusttakeoff predictions such as that shown in Table 3-10 were provided for a total of38 departures, representing six different airframe/engine combinations. DL providedadditional takeoff derated thrust level data for a total of 197 departures representing six
unique airframe/engine combinations.
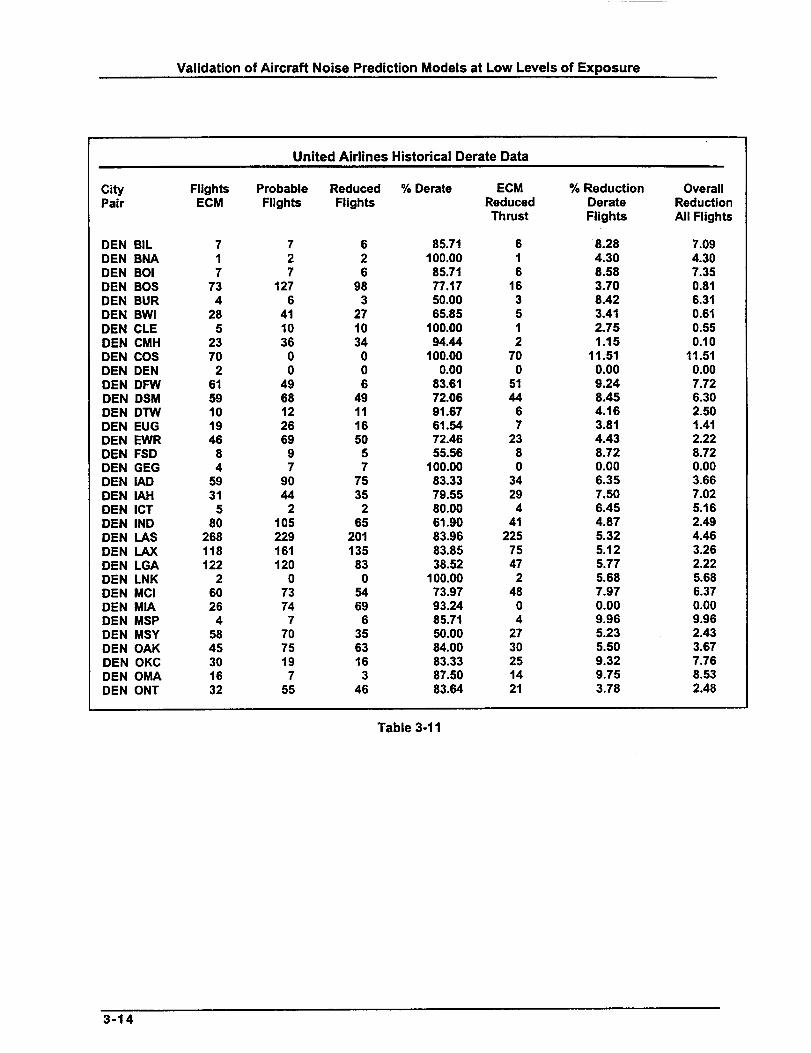
On occasion, a pilot exercises his/her discretionary dght and elects not to perform a noiseabatement derated takeoff. Both UAL and DL record takeoff engine data via the ACARS
engine monitoring system, available on newer commercial jet aircraft. For aircraft withoutthe ACARS system, airlines conduct studies for accurately estimating the percentage ofderated departure flights. Such historical data is recorded both by airframe nose numberand by city-pairs. Table 3-11 contains a sample output from the UAL May historical deraterecords. In addition to the weight and destination information, DL also provided takeoffthrottle settings (N1 or EPR as appropriate for the particular aircraft type) for the initialtakeoff segment. DL calculated these takeoff levels using in-house performance codes inconjunction with available historical engine monitoring system data.
Unimatic Thrust Prediction Printout for a B757-200
GWTG DEN 50 R8 G197945
RNWY DATA-8
*F5 BLEED-NORMAL*
TOG 197.9P ZFW .OP
REDUCED THRUST OPTIONS
TW EPR N1 ATGW ATEMP
0 1.40 86 200.1 102/38
5 1.40 86 200.1 102/38
10 1.40 86 199.3 100/37
MAX EPR: 1.52 NI: 92
R250.0 P242.5 $230.0
T53(II) ALTM 3006I
WIND 0000M
Table 3-10
3-13
Validation of Aircraft Noise Prediction Models at Low Levels of Exposure
United Airlines Historical Derate Data
Flights Probable Reduced % Derate ECM % ReductionECM Flights Flights Reduced Derate
Thrust Flights
cityPair
OverallReductionAll Flights
DEN BIL 7 7 6 85.71 6 8.28 7.09DEN BNA 1 2 2 100.00 1 4.30 4.30DEN BOI 7 7 6 85.71 6 8.58 7.35DEN BOS 73 127 98 77.17 16 3.70 0.81DEN BUR 4 6 3 50.00 3 8.42 6.31DEN BWl 28 41 27 65.85 5 3.41 0.61DEN CLE 5 10 10 100.00 1 2.75 0.55DEN CMH 23 36 34 94.44 2 1.15 0.10DEN COS 70 0 0 100.00 70 11.51 11.51DEN DEN 2 0 0 0.00 0 0.00 0.00DEN DFW 61 49 6 83.61 51 9.24 7.72DEN DSM 59 68 49 72.06 44 8.45 6.30DEN DTW 10 12 11 91.67 6 4.16 2.50DEN EUG 19 26 16 61.54 7 3.81 1.41DEN EWR 46 69 50 72.46 23 4.43 2,22DEN FSD 8 9 5 55.56 8 8.72 8.72DEN GEG 4 7 7 100.00 0 0.00 0,00DEN lAD 59 90 75 83.33 34 6.35 3.66DEN IAH 31 44 35 79.55 29 7.50 7.02DEN ICT 5 2 2 80.00 4 6.45 5.16DEN IND 80 105 65 61.90 41 4.87 2.49DEN LAS 268 229 201 83.96 225 5.32 4.46DEN LAX 118 161 135 83.85 75 5.12 3.26DEN LGA 122 120 83 38.52 47 5.77 2.22DEN LNK 2 0 0 100.00 2 5.68 5.68DEN MCI 60 73 54 73.97 48 7.97 6.37DEN MIA 26 74 69 93.24 0 0.00 0.00DEN MSP 4 7 6 85.71 4 9.96 9.96DEN MSY 58 70 35 50.00 27 5.23 2.43DEN OAK 45 75 63 84.00 30 5.50 3.67DEN OKC 30 19 16 83.33 25 9.32 7.76DEN OMA 16 7 3 87.50 14 9.75 8,53DEN ONT 32 55 46 83.54 21 3.78 2.48
Table 3-11
3-14

Validation of Aircraft Noise Prediction Models at Low Levels of Exposure
3.6 Lateral Array
Between 12 June and 13 June, a lateral array was set up approximately 25 miles east ofthe Runway 08/26 eastbound departure threshold. For a period of 24 hours, noisemonitors, spaced approximately two miles apart, recorded one-second, slow- response, A-weighted sound level data for 24 hours. Measurements were augmented at sites #3, #5,and #11 with digital tape recordings. Approximately 213 departure flights from Runway 08occurred during this 24-hour interval.
A sample of noise monitor data for one particular departure is shown for each of the lateralarray monitors in Figure 3-2. It is interesting to note that visual inspection of the timehistory at monitor W19 would not normally indicate the presence of an aircraft; however,when viewed in sequence with sites W14-W18 an ever-so-slight rise above backgroundnoise levels is indicative of the present and audible aircraft noise.
3-15

Validation of Aircraft Noise Prediction Models at Low Levels of Exposure
e4
ii.
o (KN ¢ In
N ..I
CO ¢ I_.qr
s. Oq.
¢-
• • • • •
N_._,,-I
C
mm_w_
° _w
• H _ I',- II ,.=i ...I ,_
0
_0 0 ¢) •
•.'1 _1
0° 0 • "
! I I I I I !
. ._ .-, , . ? ?
0
el
0e,l
0
I
17I ,,4
II I') I
r-
E
0z
I.-<
Ig
.J
3-16

Validation of Aircraft Noise Prediction Models at Low Levels of Exposure
"1o
t-o_.,,.,,+t,-.o(,,.)
@..}
P
I.IL
3-17

4 Data AnalysisI I
As with any large noise measurement study, significant effort is expended in reducing theavailable data into a useful format for inspection and analysis. Given the huge volume of dataacquired during this study, a program scope decision was made that only May flight tracksand noise events would be correlated and considered in any subsequent analysis. Analysis of
the data consisted of six major steps:
1. Radar Data Processing
2. Extraction of Noise Events
3. Prediction of Thrust
4. INM Analysis
5. Flight Track and Noise Event Correlation
6. Sensitivity Analyses
The following sections document each of these steps.
4.1 Radar Data Processing
During the course of the project, DIA provided radar-tracking data from the FAA's ARTS 17
system at the airport. Data were supplied in the form of files from the DimensionsInternational system TM, which is a PC-based system that collects a subset of ARTS data,and forwards this to the noise monitoring system. The data in this file contains the
following information:
• Flight Plan records, which contain the aircraft flight number, type of aircraft(nominal four-character code), assigned beacon code, scheduled arrival ordeparture time, and initial/final routing information.
• Departure Messages, which mark the time when departing flights reach analtitude of 300 feet above field level and are under air traffic control.
• Terminate Beacon records, which indicate that the aircraft is no longer being
tracked. This corresponds to the hand-off to en-route control for departingflights, and landing for arrivals.
• Target Report records, which contain the raw information returned from theradar and transponder. This consists of the range and bearing to the aircraft,and the beacon code and altitude MSL reported by the transponder.
• Tracking Report records, in which the target report data has been converted tolocal X, Y Cartesian coordinates.
4-1

Validation of Aircraft Noise Prediction Models at Low Levels of Exposure
Records in the Dimensions file appear in the real-time order that they occur. Each recordis marked with a time corresponding to when the record was written onto the PC. Thistime is generally within a few seconds of real time.
Processing consisted of the following steps:
Arriving and departing flights at DIA were identified from Flight Plan records.
For each flight, all Tracking Report records were collected, beginning with theFlight Plan and ending with either the Terminate Beacon or loss of TrackingReports.
Aircraft speed was computed using a local polynomial spline fit to the raw data.
Runway assignment was obtained by matching the early (departure) or final(arrival) tracking points and heading with proximity to the runway ends and therunway headings.
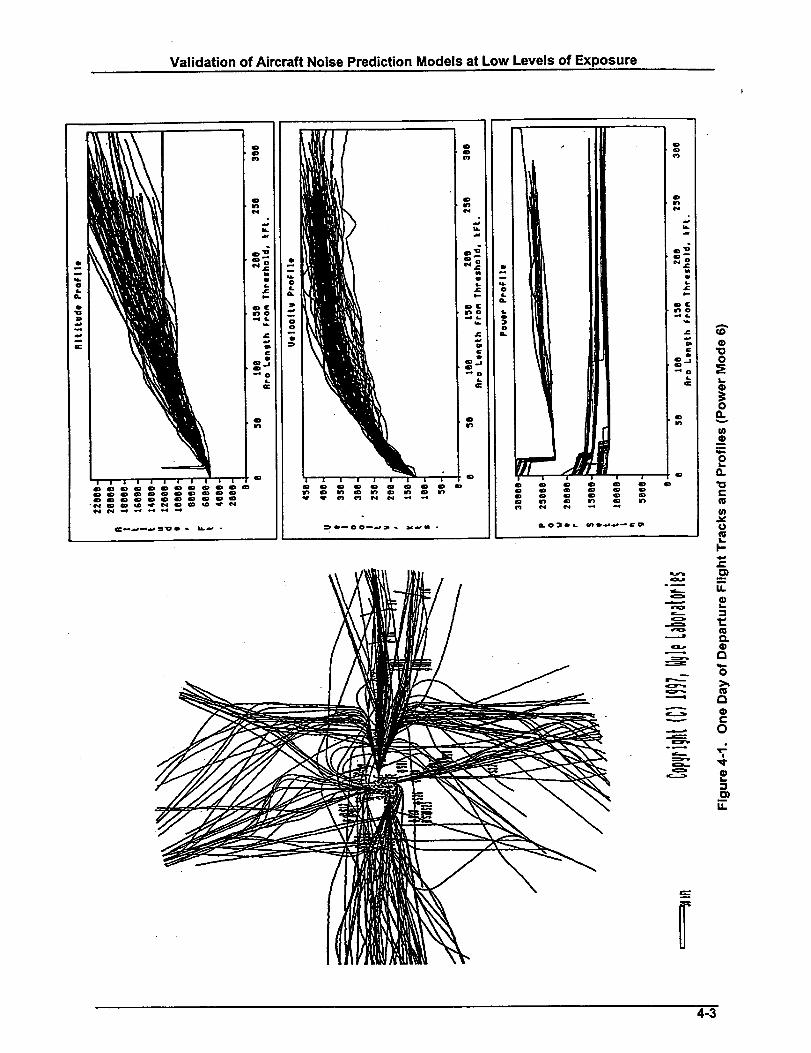
Tracking data for each flight, which included position and speed, were written to individualASCII files for use in the noise analysis. Figure 4-1 contains a sampling of one day ofdeparture data radar flight tracks and flight profiles.
4.2 Noise Event Extraction
Several schools of thought exist on how to identify aircraft noise events within a time-
history record. The traditional method employed by most noise monitoring systems uses apattern recognition approach. Events meeting the aircraft pattern criteda are tagged asaircraft noise events and included in subsequent I_, analyses. Wyle Laboratories hasdeveloped and implemented an alternate approach, which performs a =track first" direct
correlation between flight tracks and noise events. This methodology begins with a radarflight track and, based on synchronized monitor and radar times and the geometric point ofclosest approach, predicts sound event arrival time at the noise monitor. This 'track first'
approach serves two purposes:
1. It accurately identifies noise events as aircraft noise events.
2. It associates such events with actual flight tracks.
During the processing of data, flight track and noise correlations were performed for bothdepartures and arrivals. A graphical program was developed, which allowed rapid semi-automated track correlation while keeping the human in the loop for verification and recordcreation. Figure4-2 shows a sample flight track and correlated noise event formonitor #S05.
During the data analysis phase, the noise-flight track correlations shown in Table 4-1 werecreated. These data records were recorded for both arrivals and departures and repre-sent all airline operations. Flight tracks were pre-screened using weather criteriadeveloped in the Dulles study, namely winds under 10 knots and no appreciable amountsof precipitation. The final subset of data analyzed in INM considered only departures, andUAL and DL operations, and represented only the airframe and engine combinations forwhich accurate thrust predictions could be made. -
4-2
Validation of Aircraft Noise Prediction Models at Low Levels of Exposure
_oo.
_D ar_ IT) It7(_1 _1 ('*4 --4
\
e,.e'*e
o
o
......J
*¢B._
A¢D
4)"10O
OQ.
I/)4)
m
*4-O
Q.
"ot-
u)
I-
J¢
mU.
s.
--I
¢3
O
¢3c)o
O
q;
U.
4-3

Validation of Aircraft Noise Prediction Models at Low Levels of Exposure
tl
15
il
-2|
-15 -11 -5 .I " 5 II 15 21 15
File: tal155h.|t$
IlztTsl 15Ha157
1424 Ihl| (FP)
1717
|lPletltt -I
IIsIZslT
18s3lll|
SLits ( l ne |tea tel
Not lsound SrotJt
|1| Ilzllsli i133.gll II:tlsll IllS.Nil Iiz23:51 ilZS.
Non liar Jneat Z
Sit I1:I1:51 ,1_ II,NIL 18zllsl7 ,1! 1L,NLI 1t:11:51 ,_l IZ.
11
L66
99
89
79-
56
:150
40
39
2999:
25 Ha9.-1997,Site S65 Lmx= 66.6 SEt= 76.9Tine 68:23:J,6to 68:24:52
!
8:56 68:23x56 98,28:56
Figure 4-2. Sample Flight Track and Correlated Noise Event for S05
4-4

Validation of Aircraft Noise Prediction Models at Low Levels of Exposure
Extracted Noise Correlations
Date No. of Flight Tracks No. of Noise Events
5/21/97 235 1,597
5/22/97 585 2,824
5/23/97 575 3,381
5/24/97 321 1,641
5/25/97 285 1,246
5/26/97 248 921
5/27/97 343 1,858
5/28/97 415 1,984
5/29/97 134 573
5/30/97 544 1,170
TOTALS 3,685 17,135
Table 4-1
Table 4-2 illustrates a sample noise correlation record. The point of closest approach isdetermined by calculating the shortest distance to individual flight segments. This will beeither the length of a perpendicular between the monitor and the flight segment calculatedvia a dot product, or the shortest distance to either segment endpoint as required by thetrack curvature and monitor geometry. Vital data written in the noise correlation recordincludes the following:
Global Data
• flight number
• date
• operation type
• runway assignment
• aircraft type (based on ARTS information)
At the Point of Closest Approach to a Given Monitor
• time
• altitude
• track distance from threshold
• speed
• slant range
• elevation angle
• sound arrival time
Based on the Noise Time-History Data
• Lma x
• SEL
• limits of integration for SEL calculation
4.5

Validation of Aircraft Noise Prediction Models at Low Levels of Exposure
"0L_
0o(D
C0
L_
0
o
0zo
Q.E
==oo==oo==o°====°°= °° °==°=======°°===°0==_=====
_0 _
_oo_oo_oooomo_ooooooooooooo__mm_000000__00000000____
• . ...................... • ..... • ...... ,
......... ° ................ ..0,.,.. ....
t I I
...... 0 ....... , . • , . * ...... • ...........
0000000_0o00_0000_0_0_0_0_00_
_ __ 000 O0 O0 _
========,=====_.=_=_=====_="=_==t==_t_.=®® °.° ..
..... ° • ................. • • ............
0
° X:CZ_X_ =¢_X_'==CXX=2:==_ _=¢=:=¢=¢_=¢Z=CXZ:ICZ=_'_
_= === == ==
,Q
I--
4-6
Validation of Aircraft Noise Prediction Models at Low Levels of Exposure
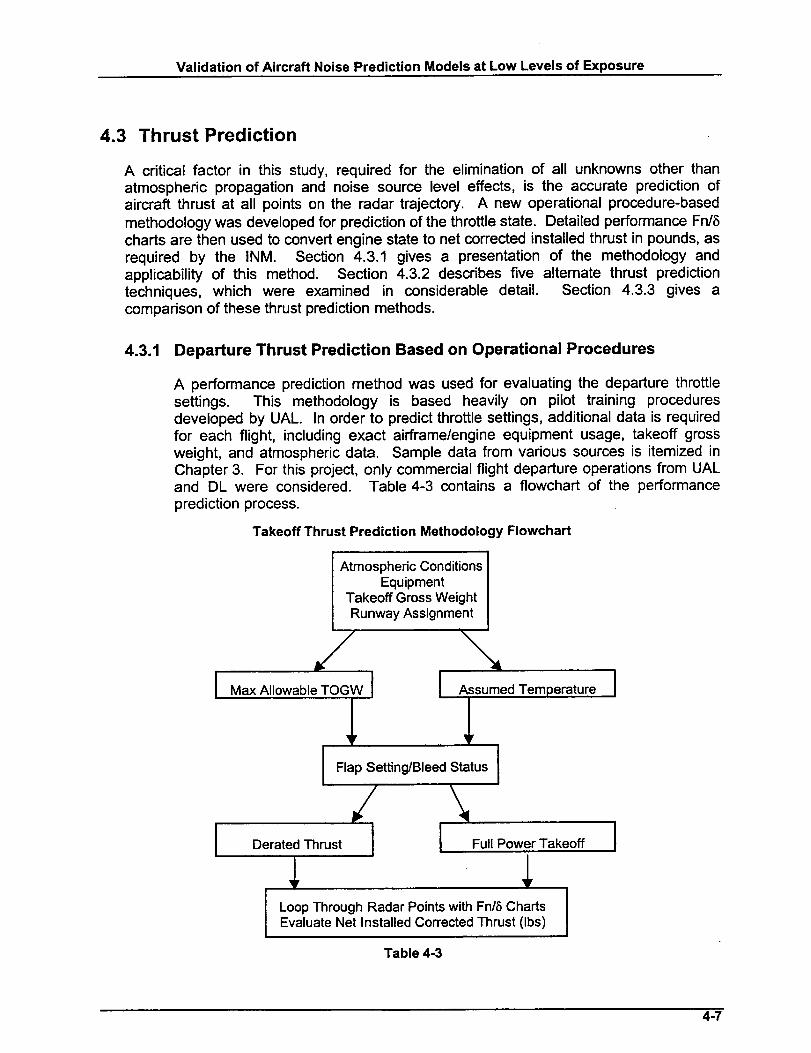
4.3 Thrust Prediction
A critical factor in this study, required for the elimination of all unknowns other thanatmospheric propagation and noise source level effects, is the accurate prediction ofaircraft thrust at all points on the radar trajectory. A new operational procedure-based
methodology was developed for prediction of the throttle state. Detailed performance FrY6charts are then used to convert engine state to net corrected installed thrust in pounds, as
required by the INM. Section 4.3.1 gives a presentation of the methodology andapplicability of this method. Section 4.3.2 describes five alternate thrust predictiontechniques, which were examined in considerable detail. Section 4.3.3 gives acomparison of these thrust prediction methods.
4.3.1 Departure Thrust Prediction Based on Operational Procedures
A performance prediction method was used for evaluating the departure throttlesettings. This methodology is based heavily on pilot training proceduresdeveloped by UAL. In order to predict throttle settings, additional data is requiredfor each flight, including exact airframe/engine equipment usage, takeoff grossweight, and atmospheric data. Sample data from various sources is itemized inChapter 3. For this project, only commercial flight departure operations from UALand DL were considered. Table 4-3 contains a flowchart of the performance
prediction process.
Takeoff Thrust Prediction Methodology Flowchart
i c°n i 'onsITakeoff Gross WeightRunway Assignment
// \I MaxA,,owab,eTOGWI _sume0Tempera,ureI
IF,a0se ,n Bee°s tusI/ \
I Derate0_stI I Fu,,PowerTakeo_II
Loop Through Radar Points with Fn/5 Charts IEvaluate Net Installed Corrected Thrust (Ibs) I
Table 4-3
4-7

Validation of Aircraft Noise Prediction Models at Low Levels of Exposure
The prediction of thrust for a given commercial aircraft departure requiresknowledge of local airfield atmospheric conditions. The pilot decisions regardingdetails of the departure procedures is based on local weather reporting stationinformation, updated at least hourly or as required by changing local conditions.(See Section 3.1 for weather data details.) Key information from an aircraftperformance perspective is Outside Air Temperature (OAT) and atmosphericpressure. Engine performance is affected significantly by changes in both airfieldtemperature and pressure. These effects are even more critical for operationsfrom a high-altitude airport such as DIA. Data from the weather services wereinterpolated linearly to the departure time for the thrust prediction process.
Actual equipment usage, such as the exact airframe and engine models used forthe flight, are also required. This data, obtained directly from the airlines, alloweda more exact knowledge of performance capabilities of the particular aircraft. Theradar interfacility message stream contains only four character descriptors for theaircraft type. As such, the particular model and engine type are not identified. Inaddition, airlines occasionally make equipment substitutions after the initial
automatic flight plan has been logged into the ARTS system. The airlineinformation obtained for this study contains factual historical information from themaintenance records.
Another key parameter required for takeoff thrust prediction is the takeoff grossweight (TOGW) of the aircraft. As with the equipment usage, FAA mandatesrequire all airlines to log such information. This database was also received for themeasurement pedod for UAL and DL departures (see Section 3A).
Runway assignment was based on the actual radar track, as variable wind andtraffic conditions often dictate last-minute departure changes. Assignmentsconsidered the direction and location of the departing flight and the availablerunways. This information, evaluated in the radar-processing phase (Section 4.1),was stored in the output powered flight track and profile RAT file.
Assessment of the Maximum Allowable TOGW (MATOGW) was based on thetables provided by the airlines for each airframe/engine combination on allavailable runways. Detailed performance analyses completed in-house at theairlines considered such variables as headwinds, runway gradients, airframe
aerodynamic performance including a range of flap settings, and detailed engineefficiencies over a range of TOGW and atmospheric conditions. The resultingmatrix of cases was built into tables such as the one shown in Table 4-4, the
MATOGW for the B737-500 CFM-56-3-B1 for 5-degree flaps and bleeds ON. Thischart contains temperatures along the leftmost column, with various runwaysacross the top. The last column reflects the performance-limited case.Performance Limit Weight is defined as the maximum weight at which the airplanecan achieve the minimum FAR-specified climb gradient, usually limited at thebeginning of second-segment climb. The climb gradient required depends on thenumber of engines installed. Contained within each chart element is theMATOGW in thousands of pounds for the particular airframe/engine combinationon the given runway at the selected temperature for the specified flap and bleedsetting. These data tables were created in the flap sequence as specified in theairframe manufacturer performance manuals and the UAL pilot training proceduredocumentation, and contained within the UAL aircraft flight manual. The sequence
4-8

Validation of Aircraft Noise Prediction Models at Low Levels of Exposure
Maximum Allowable Takeoff Weight ChartFor the B737-500, Flaps 5, Bleeds ON
-PART 07. OE.16-PARTSs
B-737-500 C_H56-3-B1
DENVER, CO BENVER INTERNATIONAL
DEN/KDEN: L ELEV 5_31, " 'IV/TAKEOFF-_.BLEEDS.ON --.-...:FLAP5 "
RWYLENGTH
NOTESDEG'F. -20
-100
10203040506070
= 798090
-'100102
• 110
LB/KTHEAD
LB/KT
TAIL
7 8 BE 16 17L 17LF. 17R12000"12000"11700 .12000 12000.11690 12000
• .. E T1.. T1 FT1 TI
17RG PERF1.1670 LIMI.T
OT1 ..
119.7""i24.6
119,4 124.5119.2 124.4
118.9 124.211b.7 124.1
1"18.5 124.0li8.2 123.8
117.9 123.5
117.5 123.1
1"24.-6 124.6".124.6"124.-5 124.5.124:5124.4"i24.4 .1'24.4124.2 124.2 124.2
124,1 124_1 124.1
124.0 124_0 124.0123.8 123.8 123.8123.5 123;5 123.5123.1 123.1 123.1
117..2 122.6
116,9 121.9116.7 121_7
112.0 117.0
107.0 111';1f05.7 109.4
i02.2 104.? 104.7• 60 .... C):_ " 0
_.o o o
380 , Q 0380 0
io4.?o.0
0.-
0 ' O.
122.6 122.6 i22:6121.9 121.9 121.912.1.7 121;7 121._
117,0 117.0 117.0
11"1.1 1!1.1 111.1109.4 I09.4"109_4
104.70
0
0
0
124.6
124.5
124_4124.2
124.1
124.0123.8'123.5
123.1122.6
121.9121.7
"117.0
111_I
i09,4104.7
0
00
•124.6-124.6 118.0
124.5 i24.5 117.9
,124.4 124.4 117.8124.2:124.2 li7.7
124.1 124.1 117.6i24..0 124.0 1.17.5
123.8 123.8 117.4123.5 123.5 117.2123.1 123.1 117.0
122..6 122.6 li6.8
121.9 121.9 116.6121.7 12i.7 116:4
117.0 117.0:111.4"
111.1 .111.1 106.1
109.4 109.4104.7
104.7 104.7 100.6•0 O. OF
O O-.IOOF'0 0 OF..0 O' lOOF
_E _.RWY E: TKOF.FH TWY R9 W/ E I1700FT AvBL
I
_F_ "
R_Y 17L TKOF FM TWY P9 W/ S 11690F_ AVBL
(RWY BE}. "
(RWY 17L_F).
:RWY 17R :KOF FM:TWY HYW/'S ii670FT'AVBL' iRWY 17RG)... ." ":.- • .. .'.-.. • :,... ". •
L • '':• .. • . , -. . .
-TI: "" " "- " '" '' • " • ": •
IN CASE OF ENOINE FAILURE ONTAKEOFF FROM RUNWAYS..' ""
16-17L/R,BEqIN-,LEFT.TURN-.TO O80.DEOMAO AT P4,-O S OF.
DEN DHE.,.. " ., ... ".... . , ... ,.- •END OF PART ;07.0F. 16 .PARTS. ' " . ...._oeb1155 108362 0803 .... .
Table 4-4
4-9

Validation of Aircraft Noise Prediction Models at Low Levels of Exposure
of flap schedules is airframe/engine and airline specific; however, muchcommonality occurs among airframes and airlines. These MATOGW charts arescreened in the appropriate sequence to determine the flap setting. The chart isentered with the actual OAT for the particular runway, and the MATOGW linearlyinterpolated. This value is then compared with the Actual TOGW (ATOG) and theflaps increased if necessary. If the ATOG exceeds the MATOGW for all flapsettings and Bleeds ON, then the analysis proceeds through the Bleeds OFF data.
These charts and specified flap sequences are runway specific and contain thevarious aerodynamic and performance tradeoffs between extra runway length andTOGW. At high altitudes such as DIA, a simple increase in flap setting utilizing theminimum defined field length does not always allow for a gain in TOGW, since theengines are usually operating at their maximum thrust rated limit. Instead the"Improved" flap settings, such as the 1I setting for the B737-200, make use of theextra runway length at DIA for achieving higher V2 speeds. Proceduralrequirements by the airframe manufacturer and/or airline operator may prohibit theuse of derated thrust for these improved flap schedules for higher ATOGs.
During this interpolation process for evaluating the flap setting based on MATOGWand Actual OAT, the ATOG is also considered. If an interpolation at the final flapsetting based on ATOG indicates that a higher temperature departure is possible,this higher temperature becomes the basis for derated thrusts. Physically, thedifference between this higher Assumed Temperature (ATEMP) and the actualOAT represents excess departure performance. According to the UAL StandardPerformance Reference Handbook, the "... rule of thumb, an average thrustreduction of 1% provides a 5% reduction in operating cost, with a like effect onengine failure rate ..." quantifies the benefits of using reduced thrust for takeoff.Note, however, that the interpolation procedure and evaluation of the ATEMPvaries from one airline to the next. For example, UAL allows the ATEMP to bedetermined as a floating value driven by performance margins. DL, on the otherhand, prescribes a standard ATEMP threshold for derated thrusts. The individualairline departure procedures must therefore be considered when predicting deratedtakeoff thrust levels.
Once the ATOG has been evaluated, Table 4-5 is utilized to obtain the required
takeoff N1 throttle setting. This table is entered with the ATOG and interpolatedlinearly to the pressure altitude at the airport. For various airframe/enginecombinations, a Bleed Correction and an N1 adjustment must be applied. Table 4-6 is a sample N1 Adjustment as a function of OAT and ATOG for the B737-300(B1)aircraft.
4-10

Validation of Aircraft Noise Prediction Models at Low Levels of Exposure
MAXIMUM TAKEOFF THRUST -
PMC ON -
737-300 (BtlC1-2OK)
•" NOTE
The heavy line in the table is used forthe Reduced Thrust calculation.
ssume_remp or)AT (°F_
130
120
110
102
100
94
90
88
86
85
82
8O
79
78
76
70
6O
56
50
- 40
30
20
10
0
-10
-20
-40i
1000 SL
)0.0 )0.6
_0.7 91.1
91.3 91.7
91.8 92.2
91.9 92.3
92.0 92.5
92.1 92.6
91.9 92.7
91.8 92.8
91.7 92.7
91.4 92.4
91.3 92.3
91.2 92_
91.1 92.1
90.S 91.9
90.4 91.4
'89.E 90.5
89._ 90_
88.7 -89.'_
.87.E 88.E
87.( -87._
"86: 87.(
85.: 86."
84.: 85."
83.', 84.:
82., 83.:
80._ 81;
Pressure Altitude
1 2
)1.2 )1.9
)1.7 _-__
)'2.2 )2.7
92.6 )3.0
92.7 )3.1
93.0 )3.4
93.1 93.5
93.2 93.6
93.2 93.6
93.2 93.6
93.3 93.7
93.1 93.7
93.0 93.7
92.9 93.E
92.8 93.E
92.2 92.E
91.4 92.1
91.C 91.7
90.E 91._
89.( 90.;
88._ 89.:
87._ 88.,
86.! 87J
85.! 86._
85.( 85.q
84.q 84.
82. 82.
(1000 Feet)
3
NAI NA!
)3.7 NA
_4.0 95.0
_4.2 95.4
94.3 95.6
94.7 96.0
95.0 96.2
95.1 96.3
95.0 96A
94.9 96.5
94.7 96.4
94.E 96.4
94.6 96.4
94.r 96.4
94._ 96.2
93..( 95.7
93._ 94.8
92.1 94.4
92: 93.8
•91 '. 92.9
90._. 92.(:
89., 91.C
88. 90.1
87.1 89.1
86., 88.'1
85. I 87._
83. i 85J
Bleed CorrectionEngine Bleeds off: + .8%'N,
No correction required for engine anti-lce on.
6 7
NA NA
NA NA
95.0 NA
95.4 95.1
95.5 95.1
95.9 95.2
96.1 95.4
96.2 95.5
96.3 95.6
96.4 95.7
96.5 95._
96.7 96.(:
96.7 96.1
96.8 96"--
96.7 96.;
96.1 96.1
95_ 95._
94. ¢, 95,"
94", 94.,
93.," 93.L
92._ 92J
91._ 91._
90.! 90:
89.! 89.
88.l 88.
87.1 .87,
8
NA
NA
NA
94.7
94.6
94.4i
94.6
94.8
94.9
94.9
95.2
95.3
95A
95.5
95.6
96.0
95.4
95.2
94.5
93.6
92.7
91.7
90.7
89.8
88.8
87.E
85.E
Table 4-5
4-11

Validation of Aircraft Noise Prediction Models at Low Levels of Exposure
Reduced Takeoff Thrust - 737-300 (B1)
Assumed %N1 Adjustment
Temp OAT (°F)(°F) -40 0 40 50 60 70 80 90 100120 0 0 -6.7 -5.8 -5.0 -4.0 -3.1 -2.3 -1.6110 0 0 -5.9 -5.1 -4.2 -3.3 -2.4 -1.6 -.8100 -12.5 -8.8 -5.1 -4.3 -3.4 -2.6 -1.7 -.8 090 -11.9 -8.0 -4,4 -3.5 -2.6 -1.7 -.8 0 080 -11.2 -7.3 -3.5 -2.7 -1.7 -.8 0 0 070 -10.5 -6.4 -2.6 -1.8 -.8 0 0 0 060 -9.7 -5.6 -1.8 -.7 0 0 0 0 0
110-.8
000000
Table 4-6
The second segment of the departure profile is the Climb segment. The processby which this throttle setting is determined is considerably easier than for takeoff.The Maximum Climb Thrust table, provided by the airlines, Table 4-7, containsTotal Air Temperature down the left column and pressure altitude across the toprow. A linear interpolation in two dimensions is used to determine the climb N1 orEPR. As before, these charts are a function of the exact airframe/enginecombination.
FAA regulations do not permit takeoff segment derated thrust levels that are lowerthan the climb segment thrust level. After the climb thrust has been calculated forderated takeoffs, the thrust must be increased to the climb thrust if necessary.This requirement applies only to the actual N1 or EPR setting. The net correctedinstalled thrust-in-pounds may in fact be less for second segment whenconsidering altitude and Mach effects, even though the throttle setting is identical.
In the cockpit the pilot sets the throttle level, either N1 or EPR, depending on the
engine type. The onboard control system for virtually all modern commercialaircraft holds the engines at the prescribed throttle position until a commandcontrol change is input. Other than subtle differences between rolling starts andmaximum throttle brake release starts, which primarily affect noise near the start ofthe roll, the throttle setting can be assumed to be constant. A further refinement tothis assumption might be made in the future via speed and rotation point dataanalysis. However, due to the radar system resolution limitations, these detailswere not available at DIA for this particular measurement program. Additionalmeasurements, such as videotape triangulation technologies, would be requiredfor such a study.
4-12

Validation of Aircraft Noise Prediction Models at Low Levels of Exposure
Climb Thrust Table
MAXIMUM CLIMB THRUST (N1}
737-300 (BI/CI-20K)
TAT
=C SL 5 10 15
50 88.9 89.0 89.2 NA
40 89.8 90.0 90.2 90.7
30 89.9 90.4 91.1 91.6
20 88.4 90.5 91.8 92.5
10 86.8 88.9 91.0 92.7
0 85.3 87.4 89.4 91.1
-10 83.7 85.7 87.7 89.4
-20 82.1 84.1 86.0 87.7
-30 80.5 82.4 84.3 8.5.9
-40 78.8 80.7 82.6 84.1
Bleed Correction (%N,)Engine Bleeds off: +.7Packs high: -.5
• Pressure Altitude (1000 Feet)
20 25 30 35 37
NA NA NA NA NA
NA NA NA NA NA
91.9 92.1 NA NA NA
92.8 93.0 93.2 NA NA
93.5 93.8 94.0 94.0 94.0
93.1 94.4 94.6 94.6 94.6
91.3 93.1 94.6 95.2 95.2
89.6 91.3 92.8 95.7 96.0
87.8 89.5 90.9 93.8 94.5
86.0 87.6 89.0 91.9 92.5
Engine anti-ice on: -.9Wing anti-ice on: -1.6
Table 4-7
With this fixed-throttle setting, the manufacturer's Installed Engine Decks (Fn/5) areused to determine the net corrected installed thrust. Thrust in Ibs. was calculatedas a function of Mach number and altitude, and N1 or EPR as appropriate. These
Fn/5 charts are considered manufacturer-proprietary property and as such are not
published in this document.
At this stage of the analysis, each point in the radar track in the initial takeoff
segment is analyzed in sequence. Based on the local atmospheric conditions,Mach number, and NI/EPR, the Fn/(3 is determined for input into the INM. The
atmospheric variations with altitude were based on interpolation of atmosphericweather balloon data to the flight departure time. The local velocity as reported bythe ARTS system was converted to calibrated airspeed and the temperatureconverted to Total Temperature as required by the particular prediction methodand Fn/(3 charts.
Standard departure procedures in place at DIA require climb at takeoff thrust to1,000 feet above ground level (AGL). A scan of the departure profiles and anevaluation of the altitude where the "knee in the curve" occurs, indicated that the
majority of departures were adhering to this guideline.
4-13

Validationof AircraftNoisePredictionModelsat LowLevelsof Exposure
As required by INM, a thrust level needs to be assigned to each flight profile point.In this study both tracks and profiles were treated simultaneously with individualnode points determined by radar returns. As such, the thrust is required at eachradar return. At this point in the analysis process the two NI/EPR settings (takeoffand climb segments) are known. These must then be converted into net corrected
installed thrust-in-lbs, as required by INM. While the NI/EPR settings remainconstant across the flight segments, the Mach number, altitude, and outside air
temperatures are varying at each radar point along the profile. Because of this, thethrust levels vary at each profile point.
The transition between the takeoff and climb was made at the radar point closestto or above 1000 feet AGL. Future refinements to this methodology may include apattern recognition method for determining the transition point between takeoff andclimb throttle settings, as well as a gradual rather than an instantaneous changebetween settings. Discussions with UAL flight training personnel indicated that thethrottle and flap cleanup technique was highly pilot-dependent and could not be
reliably predicted. Guidelines such as X seconds per flap degree of retraction foracceleration before changing throttles, despite detailed airline studies, were notavailable. It might be possible to determine the extent of the transition from flapsto clean and acceleration with change to climb segment thrust based on radardata; however, such methods were not employed in this study.
4.3.2 Alternate Thrust Prediction Techniques
Several other thrust prediction techniques have been presented in otherdocuments. For example, SAE AIR 184519 and the INM 5.1 Technical Manual 2°describe the following procedures:
• thrust as a function of Velocity (Equation A1)
• thrust as a function of EPR (Equation A2)
• thrust as a function of N1 (Equation A3)
• thrust as a function of Flight Path Angle (Equation A8)
In addition, Dr. John-Paul Clarke, from the Charles Stark Draper Labs at theMassachusetts Institute of Technology, has developed an improved physicalequation for the prediction of thrust as a function of NI/EPR. 21 These methodsmay be categorized based on the physics and particular formulation of thetechniques:
A. thrust as a function of velocity
B. thrust as a function of throttle setting (N1 or EPR)
C. thrust as a function of Flight Path Angle
Each of these methods, and their particular implementation in this project, aredescribed below.
A. Thrust as a Function of Velocity. Equation (A1) in SAE-AIR-1845 andexpanded with higher order terms in INM states that:
4-14
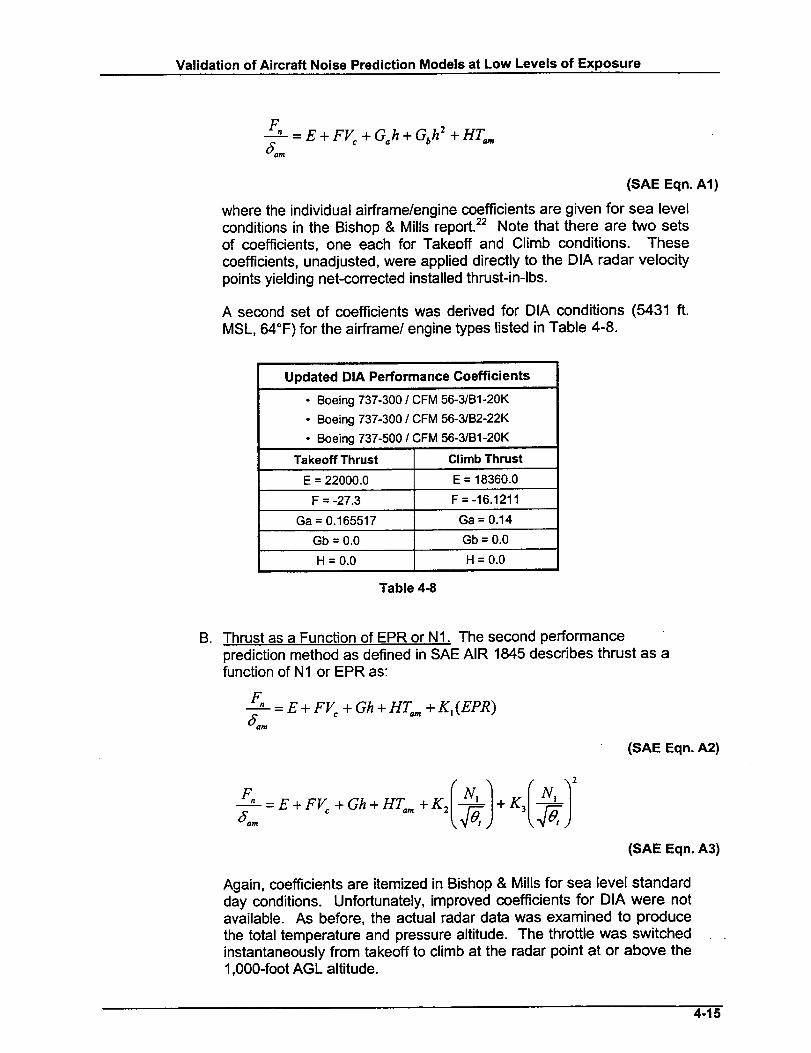
Validation of Aircraft Noise Prediction Models at Low Levels of Exposure
F___.v_,= E + FV¢ + G,,h + Gbh 2 + HT,,=
(SAE Eqn. A1)
where the individual airframe�engine coefficients are given for sea levelconditions in the Bishop & Mills report. _ Note that there are two setsof coefficients, one each for Takeoff and Climb conditions. Thesecoefficients, unadjusted, were applied directly to the DIA radar velocity
points yielding net-corrected installed thrust-in-lbs.
A second set of coefficients was derived for DIA conditions (5431 ft.
MSL, 64°F) for the airframe/engine types listed in Table 4-8.
Updated DIA Performance Coefficients
• Boeing737-300 / CFM 56-3/B1-20K
• Boeing737-300 / CFM 56-3/B2-22K
• Boeing737-500 / CFM 56-3/B1-20K
Takeoff Thrust Climb Thrust
E = 22000.0 E = 18360.0
F = -27.3 F = -16.1211
Ga = 0.165517 Ga = 0.14
Gb = 0.0 Gb = 0.0
H = 0.0 H = 0.0
Table 4-8
B, Thrust as a Function of EPR or NI. The second performance
prediction method as defined in SAE AIR 1845 describes thrust as afunction of N1 or EPR as:
F= E + FV_ + Gh + HT=,,, + K, (EPR)
(SAE Eqn. A2)
(SAE Eqn. A3)
Again, coefficients are itemized in Bishop & Mills for sea level standardday conditions. Unfortunately, improved coefficients for DIA were notavailable. As before, the actual radar data was examined to producethe total temperature and pressure altitude. The throttle was switchedinstantaneously from takeoff to climb at the radar point at or above the1,000-foot AGL altitude.
4-15

Validation of Aircraft Noise Prediction Models at Low Levels of Exposure
C,
An improved thrust prediction method based on physical parameterssuch as local Mach number, with higher order terms, was developed byJ.P.Clarke. 21 The following equation details this technique:
K (N,c) ]oxp2*N, a,,,
Where
and M is the Mach number
This method utilizes the same performance coefficients as forMethod #3, and is currently only available for the following aircraft:
• B737-300 CFM 56-3B1 (20K)
• B737-500 CFM 56-3B1 (20K)
• B737-300 CFM 56-3B2 (22K)
Thrust as a Function of Flight Path Angle, The third physical throttleprediction method itemized in SAEoAIR-1845 utilizes flight path angleas its driving parameter.
7" = arcsin 1.01,
(SAE Eqn. A8)
This prediction method was dropped from the current study whenproprietary Fn/(5 data became available.
4.3.3 Comparison of Thrust Prediction Techniques
As discussed in Section4.3.2, several thrust prediction techniques were
implemented with the available radar data. Figures 4-3 and 4-4 show a singleB737-300/CFM 56-3B1 aircraft departure from Runway 08. The climb and velocityprofile, as given in the ARTS IliA radar data is shown in Figure 4-3. Figure 4-4compares five of the power prediction methods. Table 4-9 itemizes the powermodes and identifies the power prediction method.
4-16

Validation of Aircraft Noise Prediction Models at Low Levels of Exposure
25000.0
23000.0
21000.0
19000.0
17000.0:E
15OOO.0
13O0O.0
11000.0
9000.0
7000.0
5000.0
Power Prediction Comparison
UAL270b - B737-3001CFM56-3B1, indxx--8 (updated)
TOGW--117276 Ibs, OAT=53.6 F
o.0 50000.0 100000.0 150000.0 200000.0
Distance (Ft)
250000.0 300000.0
450.0
400.0
350.0
300.0
ji 250.0200.0
150.0 1
100.0
Power Prediction Comparison
UAL270b - B737-300/CFM56-3B1, indxx=8 (updated)
TOGW=117276 Ibs, OAT=53.6 F
50.0
0.0
0.0
Figure 4-3.
50000.0 100000.0 150000.0 200000.0 250000.0
Distance (Ft)
300000.0
Selected Departure Altitude and Velocity Profiles From Runway 08
4-17

Validation of Aircraft Noise Prediction Models at Low Levels of Exposure
A
"o
_xI IJ-
o.
If,. a
! }-.QOr-.P4--I,<::)
¢O (D tO O4 _'-
"0 10 10 "1_ "00 0 0 0 0
0 0 0 0 0 0
0 0 0 0 0 00 0 0 0 0 00 1.0 0 LO 0 LO0 I_ LO ¢N 0 I_
(sql) _sruq/
oo
oooLo
ooooo03
oooo
cxl
ooooo04
A
14.OOOO e-LO
cI
ooo
-oo
ooooLO
o
o
>
3:e--l
EOL-
N"
e_e_oQ"a
o¢n
p
OB.
4-18

Validationof Aircraft NoisePredictionModelsat Low Levelsof Exposure
PowerMode
61258
ThrustPredictionMethods
Thrustfrom Manufacturers' Fn/d charts
Thrust from Velocity(SAE-Air-1845,EquationA1)
Thrust from N1 and EPR (SAE-AIR-1845, EquationsA2 and A3)
ThrustfromJ.P. Clarke Mach Equations
Thrust from Velocity (SAE-AIR-1845 EquationA1) withcoefficientsadjustedforDIA conditions
Table 4-9
Comparing Power Modes 1 and 8 highlights the effect of updating the performancecoefficients for DIA flight conditions. It is apparent that there is a slight differencein the takeoff and climb thrust levels, and a continuing difference of about 1,000 Ibs
across the remainder of the flight trajectory.
Power Mode2, thrust from N1 or EPR based on SAE-AIR-1845, is an
approximation to the exact actual installed engine performance from themanufacturer's Fn/5 charts, or Power Mode 6. Figure 4-4 illustrates that thetakeoff thrust is underpredicted. All power prediction methods show a drasticunderprediction of thrust as compared with the manufacturer's Fn/5 curves (powermode 6) for second segment climb. This is most likely due to the high DIAdeparture altitude, and hence significantly higher operating altitudes than themethods can handle.
This is most likely a manifestation of using sea level coefficients rather than DIA-specific performance data, but also that the trend with increasing distance, Machnumber, and altitude is to underpredict the thrust. This is possibly an effect due toneglecting compressibility effects and applying the SAE-AIR-1845 equation beyondits original range of intent. Power Mode 5, the improved thrust equation developedby J.P. Clarke, does include higher-order terms and Mach compressibility effects,and one can see from Figure 4-4 that while it more closely approximates thebehavior of the actual Fn/5 installed performance curves at takeoff, at higher Machnumbers the thrust is still underpredicted. As noise studies and impact analysesextend farther away from the airports, into regions where aircraft are traveling athigher Mach numbers and entering into compressibility regions, these Machnumber and compressibility effects predicted by the detailed engine installation
Fn/5 charts effects cannot be neglected.
4-19

Validation of Aircraft Noise Prediction Models at Low Levels of Exposure
4.4 INM Analysis
The INM Version 5.1a 1'2° was an integral part of the data analysis. The INM was used toanalyze individual flight tracks singly and predict the Sound Exposure Level at the noisemonitoring sites. Tools were developed which allowed automated processing of the radardata and direct creation of DBF files. The following information was provided to INM for itsuse in noise prediction:
• Flight Track
• Flight Profile
• Velocity Profile
• Power Profile
• Aircraft Information:
• Noise Power Distance Tables
• Takeoff Gross Weight
• Flight identifier
• Airport Information
• Operating Conditions
• Terrain Characteristics
The Thrust data was calculated via the CATS code in any one of the five implementedpower prediction methods and was fed directly into the INM. Each of the individual trackanalyses considered the actual atmospheric and climatalogical data when determiningthrust levels; however, since INM restricts a given study to one atmosphere andtemperature, some data fidelity was lost. A separate study was created for each day, withindividual flight tracks being represented by individual aircraft with individual profiles. Aspecial console application, which generated a new study.INM file, was used with the newaircraft types. The front-end graphical user interface of INM 5.1 was then used simply toload the case and study and run the analysis. Output was obtained via the detailed gridanalysis, where one single-point-detailed grid was created for each noise monitoringlocation. The detailed grid output file was then saved in ASCII format for future Predictionversus Measurement correlation processing. A sample detailed INM grid output is shownin Table 4-10.
INM has the ability to incorporate terrain effects, in terms of ground altitude offsets (noshielding, or reflective terrain effects) into the noise predictions. The terrain east of DIAgradually slopes downhill, while terrain south of DIA slopes upward (Table 2-3). Thesechanges from fiat terrain manifest themselves as different effective above-ground altitudeswhen terrain considerations are included in the analysis. INM was executed both withterrain calculations included (terrain ON) and terrain calculations ignored (terrain OFF).Subsequent sections of the report compare the effects of terrain on the analysis for DIA.
4-20

Validation of Aircraft Noise Prediction Models at Low Levels of Exposure
Sample INM Detailed Grid Output
METRIC GRD I J ACFT OP PF S RWY TRK SDISTANCE ALT ANG SPEED THRUST
SEL SlO 1 1 UA1495 D U 1 34 1495 0 11735.4 1669 0.0 215.7 11795.97
SEL S10 1 1 UA1566 D U 1 34 1566 0 12237.3 1071 0.0 218.8 11776.91
SEL S10 I I UA451 D U I 34 451 0 14286.5 1269 5.5 229.3 11745.97
SEL $10 1 1 UA295 D U 1 34 295 0 13658.8 1265 5.6 217.0 11804.15
SEL SlO 1 1 UAl157 D U 1 34 1157 0 13762.3 1270 5.7 218.7 11777.94
SEL $I0 I I UA543 D U I 34 543 0 13825.9 1251 5.5 216.6 11768.29
SEL S10 I I UA1629 D U I 34 1629 0 13975.0 1270 5.6 219.8 11766.94
SEL $I0 I I UA522 D U I 34 522 0 13374.8 1171 5.1 208.3 11797.91
SEL S10 I I UA1496 D U I 34 1496 0 13157.1 1249 5.5 231.4 11781.79
SEL $10 1 1 UA1750 D U 1 34 1750 0 19109.5 769 0.0 183.8 13703.00
SEL SlO 1 1 UA759 D U 1 34 759 0 18156.8 1293 4.0 214.6 11770.80
SEL S10 1 1 UA1561 D U 1 34 1561 0 18590.9 1534 4.7 194.4 11831.63
SEL SI0 I I UA740 O U I 34 740 0 21667.2 697 1.5 172.1 13461.58
SEL SIO I I UAT04 D U I 34 704 0 19053.9 869 2.4 177.8 12455.00
SEL S10 I I UA1154 D U I 34 1154 0 21275.2 576 1.2 181.1 13122.84
SEL $10 1 1 UA780 D U 1 34 780 0 22138.9 671 0.0 180.6 13572.62
SEL SlO 1 1 UA436 D U 1 34 436 0 22220.3 700 1.4 174.9 12656.11
SEL SlO 1 1 UA1260 D U 1 34 1260 0 23305.4 471 0.0 174.0 13494.45
SEL SlO 1 1 UA1236 D U 1 08 1236 0 33175.7 -80 0.0 24.0 14725.00
SEL S10 1 1 UA1802 D U 1 08 1802 0 33175.7 -80 0.0 125.0 14005.00
EQUIV ONE ALL .PERCENT
1.0000 73.1 73.1 14.535
1.0000 72.0 72.0 11.531
1.0000 71.2 71.2 9.420
1.0000 71.2 71.2 9.377
1.0000 70.8 70.8 8.699
1.0000 70.3 70.3 7.630
1.0000 69.4 69.4 6.244
1.0000 68.7 68.7 5.378
1.0000 68.7 68.7 5.349
1.0000 66.4 66.4 3.174
1.0000 65.3 65.3 2.456
1.0000 65.1 65.1 2.321
1.0000 64.5 64.5 2.044
1.0000 63.9 63.9 1.770
1.0000 63.8 63.8 1.721
1.0000 63.4 63.4 1.578
1.0000 61.8 61.8 1.080
1.0000 61.6 61.6 1.035
1.0000 56.2 56.2 0.298
1.0000 55.7 55.7 0.265
Table 4-10
4.5 Noise Measurement and INM Prediction Data Correlation
A series of post-processors was developed, which linked together noise measurementrecords, INM predictions, and atmospheric information at the point of closest approach.
These processors interrogated the correlated noise event records (Section 4.2) and theINM noise prediction results (Section 4.4) with the atmospheric conditions (Section 3.1).Although INM does not allow for user-defined atmospheres, for the purposes of datacorrelation and sensitivity studies, and in order to determine any possible atmosphericeffects, this additional step was taken. Once the three data sources were linked by dateand flight number and operational state (Arrival/Departure), the resulting uniquecombination of data was input to a database program for post-processing. Table 4-11shows a sampling of the final correlated output data. Each of the available independentvariables in Table 4-11 is defined below in Table 4-12.
The sources for data contained in Table 4-12 are as follows:
Columns 1 to 16:
Columns 17 to 34:
Columns 35 to 48:
Columns 49 to 54:
Noise Correlation Database and Radar Track Data
INM Output Detailed Grid Report
Power Calculation Analysis
Atmospheric weather analysis for the point of closest approach
4-21

Validation of Aircraft Noise Prediction Models at Low Levels of Exposure
j j /
4-22

Validationof AircraftNoisePredictionModelsat LowLevelsof Exposure
IndependentVariablesfor Correlation Analyses
No. Row Header Definition
Aldine flight number. Letter following the flight number indicates the1 Flight/File
occurrence of that flight. A is usually arrival; B is generally departure.
2 Date Local date.
3 AC Time Local time for the first radar tracking point.
4 Op Operation type - Arrival or Departure.
5 AJt Altitude of the aircraft (feet) at the point of closest approach.
6 TrkDist Ground track distance (feet) traveled to the point of closest approach.
7 Speed Aircraft Speed (knots) at the point of closest approach.
8 Mon Monitor Identifier.
9 Slant Slant range between the monitor and point of closest approach (feet)
Arrival time (local DIA time) of the sound generated by the aircraft at10 Tarrthe point of closest approach.
11 Lmax Maximum A-weighted sound level for the event.
12 SEL Integrated A-weighted Sound Exposure Level for the event.
13 From Limits of integration for SEL calculation.
14 To Limits of integration for SEL calculation.
Elevation Angle between aircraft at point of closest approach and15 Angle noise monitor, 90 ° = overhead
16 Un-identified Internal time stamp record Iocator
17 Metric INM output metric for detailed grid
18 GRD Noise monitor identifier
19 I Output detailed grid index
20 J Output detailed grid index
21 OP Operation Type
22 PF Profile Group Identifier
23 S Profile Stage # (not used)
24 Rwy Runway assignment
25 TRK Identifying Track Label
26 S Sub-Track Number
27 Distance Slant Range from the grid to the point of closest approach (feet).
28 AIt Aircraft Altitude (AFE) at point of closest approach (feet).
Elevation angle (degrees) from the grid point to the aircraft at point of29 ANG
closest approach.
30 SPEED Speed (TAS-Knots) of the aircraft at the point of closest approach.
31 THRUST Thrust Setting (pounds) of the aircraft at the point of closest approach.
32 EQUIV Equivalent # operations
33 ONE Metric value for a single operation
34 ALL Metric value for all operations
35 PERCENT Percent of the total Metric Value that is caused by the flight operation.
36 Operation Flight number and scheduled time.
37 Date Operation date (local).
38 Index Internal unique airframe/engine index assignment.
First data point time in the radar track (seconds after midnight,39 T(1) local time).
40 P(1 ) Takeoff power setting (Ibs)
41 Derate N1 Takeoff N1 or EPR Setting.
Table 4-12 --*
4-23
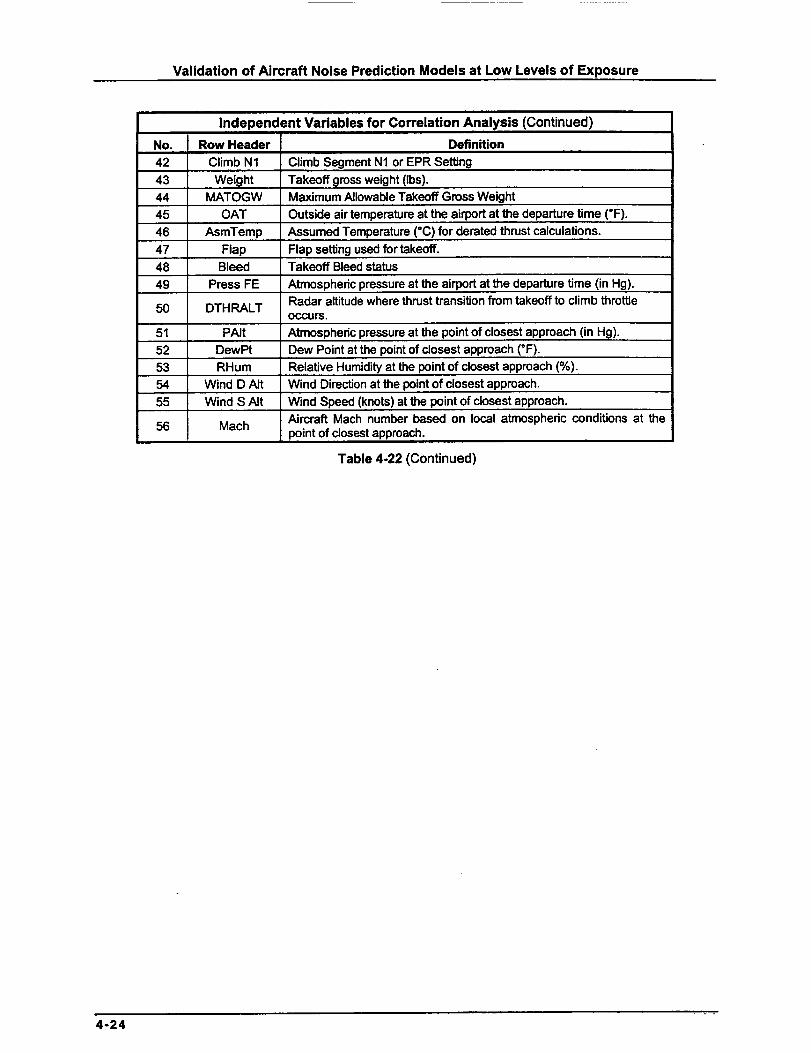
Validationof Aircraft NoisePredictionModelsat LowLevelsof Exposure
IndependentVariablesfor CorrelationAnalysis(Continued)No. RowHeader Definition42 ClimbN1 ClimbSegmentN1orEPRSetting43 Weight Takeoffgrossweight(Ibs).44 MATOGW MaximumAllowableTakeoffGrossWeight45 OAT Outsideairtemperatureattheairportatthe departure time (°F).
46 AsmTemp Assumed Temperature (°C) for derated thrust calculations.
47 Flap Flap setting used for takeoff.
48 Bleed Takeoff Bleed status
49 Press FE Atmospheric pressure at the airport at the departure time (in Hg).
Radar altitude where thrust transition from takeoff to climb throttle50 DTHRALT
OCCURS.
51 PAIt Atmospheric pressure at the point of closest approach (in Hg).
52 DewPt Dew Point at the point of closest approach (°F).
53 RHum Relative Humidity at the point of closest approach (%).
54 Wind D Alt Wind Direction at the point of closest approach.
55 Wind SAlt Wind Speed (knots) at the point of closest approach.
Aircraft Mach number based on local atmospheric conditions at the56 Mach
point of closest approach.
Table 4-22 (Continued)
4-24

5 Results
A total of 14,992 flight tracks were screened for air carrier, weather conditions (Section 5.2)and departure tracks, and analyzed. UAL and DL provided critical takeoff gross weight andhistorical equipment records (Section 5.3). Noise levels were predicted for 50 monitors basedon five power calculation methods. In Section 4.3, the five power prediction methods werecompared. Based on the results of these comparisons given in Table 5-1, only power mode 6with terrain turned ON was used for further detailed sensitivity analysis.
Figures 5-1 through 5-5 illustrate the overall prediction accuracy for the five power modes.Because of the vast number of data points and the semi-automated correlation process, the
occasional large predicted-measured SEL appears below the trend line in Figures 5-1 through5-5. Due to the massive scope of effort that would have been involved in performing adetailed analysis on each and every data point, only significant anomalous discrepancies wereeliminated from the database. Perhaps the focus of a future study might involve more detailedanalyses of a few selected flight tracks, specifically a revisit to the measurement correlationrecords and acoustic one-second noise event time-history data. Section 4.3 documents the
thrust prediction process and highlights the assumption that when available, a derated thrusttakeoff analysis was performed.
Given pilot discretionary options, and a vast number of operators for which ACARS enginemonitoring data was not available, the following approach was developed for estimating which
flights performed derated thrust departures, and which flights did not. The ultimate decisionwhether or not a derated thrust takeoff is performed lies with the pilot. UAL provided the
overall fleet data presented in Table 5-2.
The overall percentage of UAL flights, which executed derated departures from DIA in May1997, was 5173. This represents a 75.4% derate level. Correspondingly, 24.6% ofdepartures were made at full throttle. Based on the derated thrust methodology, only 10.9%of flights were deemed incapable of performing derated departures based on the performanceand atmospheric criteria. This means that an additional 13.7% of the UAL May 1997 flightsperformed full throttle departures. Since we have no direct means for applying thispercentage to the thrust prediction analysis, a post-analysis update technique was utilized.Overall, there was an average of 4.4 noise events per flight. This means that the 13.7% (76flights) with 4.4 events per flight, representing 334 noise events, were predicted based onderated thrust instead of full throttle. After the noise predictions were correlated with the
measurements, they were sorted by predicted-measured levels. Data was sorted incorrelation order, and the 334 maximum INM-measured differential correlation records weredeleted from the analysis on the grounds of over-approximated thrust derate level. Thisanalysis logic allows us to apply the UAL historical derate information globally to the noisecorrelation study.
5-1

Validation of Aircraft Noise Prediction Models at Low Levels of Exposure
Future analysis could possibly develop a feedback loop whereby those tagged flights could be
re-analyzed without a thrust derate, hence remaining in the final statistical analysis. Similarly,
the derate breakdown by individual aircraft in combination with the overall city-pair derates
could be combined to develop a statistical probability of derate for each individual flight track.
Available information from UAL included percentages of operations, which used derated thrust
takeoffs with breakdown by equipment for all city pairs, and by city pairs for all equipment
types. This data was screened to determine the overall UAL-DIA departure fleet average
thrust derate percentiles. Based on the May 1997 data, Table 5-2 was developed.
Predicted-Measured SEL for All Power Modes
PowerMode
5
6
6
8
8
TerrainStatus
ON
OFF
ON
OFF
ON
OFF
ON
OFF
ON
OFF
MeanPrediction
Error
-8.29
-7.47
-6.78
-6.03
-10.65
-9.65
-6.11
-5.17
-11.77
-10.78
Std.Dev
5.68
5.48
6.50
6.44
6.40
6.17
5.01
4.92
6.44
6.23
No. OriginalPoints
2,270
2,947
2,780
2,627
2,297
2,281
2,437
2,461
2,279
2,267
MeanPrediction
Error
-4.44
-3.51
Std.Dev
3.33
3.46
Table 5-1
No. Final
AnalysisPoints
2,013
2040
Overall UAL Fleet Data Based on May 1997 Data
Terrain TerrainON OFF
Total UAL DIA Departures in May 1997 6,854
Total UAL Derated Takeoffs in May 1997 5,173
Percent of Flights Derated 75.4%
Percent of Flights Not Derated 24.6%
Percent of Flights Not Derated in the Thrust Prediction 10.9%
Additional Percent That Should Not Have Been Derated But Were 13.7%
Total Number of Flights in the Analysis 703 698
Number that Should Not Have Been Derated But Were 96 96
Number of Noise Events Per Flight 4.4
Number of Noise Events to be Filtered Out 424 421
Table 5-2
5-2

Validationof AircraftNoisePredictionModelsat LowLevelsof Exposure
e- _r-
E_E=E
==oE
"o
-o=EiT. _"
u_ I--
t_Eoa. o
z_
$
o
oo
(gP) le^e-I eJnsodx=lpunos pa;o!peJd
100
0n
I
o
oo<e-o
°_
10
11.
"7
U.
5-3

Validation of Aircraft Noise Prediction Models at Low Levels of Exposure
(9P) le^e'l eJnsodx=jpunos pe;oipaJd
5-4
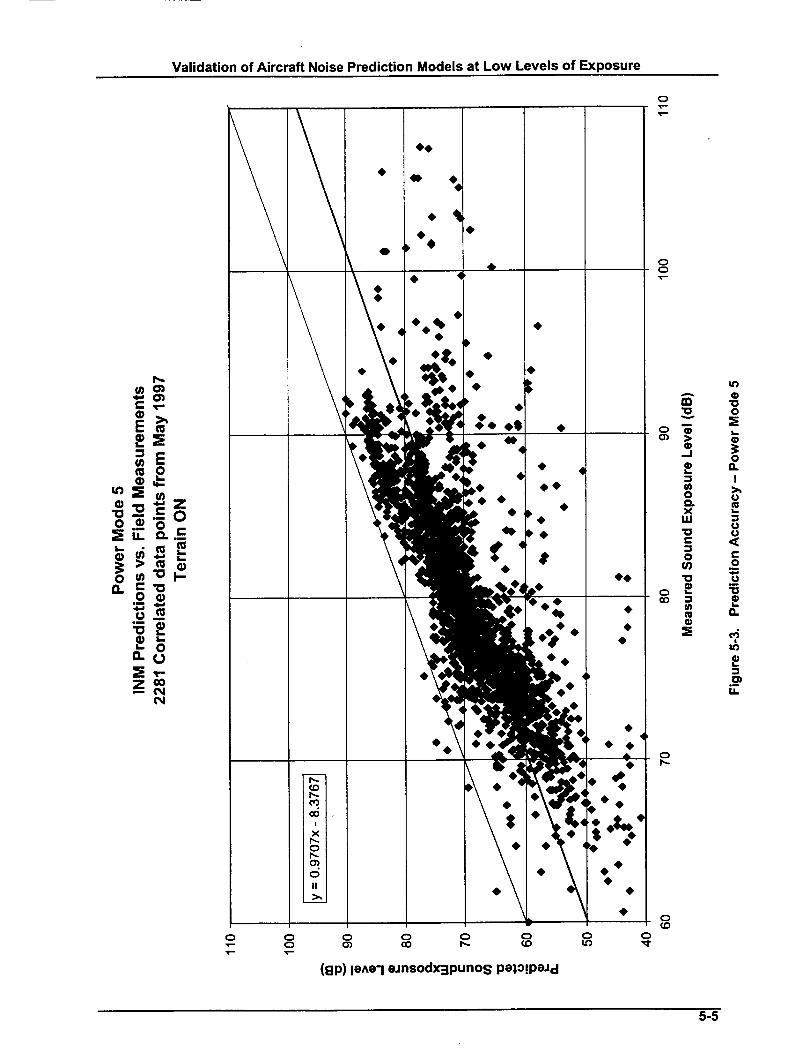
Validation of Aircraft Noise Prediction Models at Low Levels of Exposure
E_
"o_o_
o oo
I'"
I"o _0 •
• 4' •
I'. P •..g|_.- •
/l o
!i '
\* _,'"'¢#
(gp) leAa'i eJnsodx_punos pa_,o!PeJd
¢)
_O0
0
I
o
o
c-O
I1.
o--
5-5

Validation of Aircraft Noise Prediction Models at Low Levels of Exposure
(gP) la^e'l eJnsodx=jpunos pa;o!paJd
"O
P
,T
co
5-6

Validationof AircraftNoisePredictionModelsat LowLevelsof Exposure
=E
E
_ "o
"-o_
e4
• _I_e
• 4
\ _ r_,¢o : .. ==
rt ,-- ,,I_ * ==
1
(ElP) le^a'l eJnsodxapunos palo!peJd
¢o
o"00=E¢_
0O.
I>,,13
L
¢313
r"0
"13
t._
n
.-I
5-7

Validation of Aircraft Noise Prediction Models at Low Levels of Exposure
Within INM there is an algorithm that determines whether or not sound levels at a particulardetailed grid location will be calculated. This noise-significant 2°algorithm, which the INM useris unable to control directly, did not yield a detailed grid output noise prediction for all flighttracks at all monitors. Furthermore, when comparing terrain effects, the noise-significantcriteria yielded different results, and hence changed exactly at which receiver locations noiselevels were predicted. Subsequent correlations yielded a different number of output analysispoints, as can be seen in the No. Original Points column in Table 5-1. From a research pointof view, the ability to control the noise-significant testing algorithms in INM would be mostdesirable. Even though the same flight tracks were analyzed for Terrain ON and Terrain OFF,this feature in INM caused the correlated events to change.
Each of the different power prediction methods shown in Table 5-1 contains a differentnumber of flight tracks. These varied because weights and performance data were notavailable for detailed power predictions for all airframe/engine combinations. Chapter 4explains in more detail the particular equipment considered for each of the power modes.
Analysis of noise correlation data (monitor measurements subtracted from INM-predictedvalues) was divided into three general areas:
1. Geometrical Parameters
2. Atmospheric Conditions at the Noise Source
3. Operational Statistics
4. Aircraft Maneuver Parameters
5.1 Geometrical Parameter Results
Geometrical Parameters at the point of closest approach such as aircraft altitude,elevation angle, and slant range are addressed in the analyses via the direct input of radartracking data to INM. Parameters at the receiver stations were treated by definingreceiver locations and performing a detailed grid analysis, both accounting for terrainelevations (Terrain ON) and by simplifying the predictions using a fiat earth approximation(Terrain OFF).
Upon comparison of the Terrain ON and Terrain OFF Columns in Table 5-1, a meanprediction error difference on the order of one dB is apparent. Further study of thecorrelated data indicates that more than 60% of the analysis points were from monitorseast of Runway 08/26. Table 5-3 lists the breakdown of correlated events by site, and byquadrant. Considering the gently downhill sloping terrain to the east and looking at theground elevation levels found in Table 2-3, those correlated events in the east quadrantwill drive the overall results. Initially, with the reduced ground altitudes andcorrespondingly increased slant ranges, it could be expected that the predicted noiselevels would decrease when accounting for the true terrain. This was indeed the case,and manifests itself as more negative mean prediction error on Table 5-1 for cases withTerrain ON. There was very little change in the standard deviation between the flat earth
and Terrain ON analysis.
Radar data was used to determine the relationship between the difference between modeledand measured SEL and various geometric parameters at the point of closest
5-8

Validation of Aircraft Noise Prediction Models at Low Levels of Exposure
Summarv of Correlated Events bv Site and bv QuadrantNumber of Hits/Site
for Power 6 Terrain OFF/ON
Site Terrain OFF Terrain ON
S01S02S03S04
S05S06
S07S08S09
$10Sll
$12$13S14$15
S16$17$18S19
$20S21$22$23S24
$25S26W01
W02W03W04W05W06W07W08
W09WlOWl 1W12Sum
66
324440
214163
2726134
2912105
881218
19405146
445110
138170153148
107181315710
12383
2040
703246
40199151
2826136
27
129588
101822
395O4849
4210
143172148
1498819
1215710
131
802014
East
South
West
North
Total
Overall Hits/Site by quadrantTerrain OFF Terrain ON
No. Events % Events No. Events !% Events
1299 63.67 :1261 62.61
123
380
238
2040
6.02
18.62
11.66
124
388
241
2014
I
6.15
19.26
11.96
Table 5-3
5-9

Validation of Aircraft Noise Prediction Models at Low Levels of Exposure
approach of the aircraft to the measurement position. Figures 5-6, 5-7, and 5-8 show theleast-squares linear relationship for [SEL(INM)-SEL(Measured)] for power mode 6 andaircraft altitude, aircraft elevation, and aircraft slant range, respectively.
In each case, the average difference between modeled and measured SEL increases withthe independent parameter. By comparing the t-value for the slope parameter with thecritical t-value of 2.576, it is found that this increase is statistically significant at the 99percent level of confidence. The rate of change in the modeled-measured difference isgreatest for the altitude parameter, for which it is 0.61 dB per 1,000 feet, resulting in an 8.5dB increase over the measurement range from about 6,000 feet to 20,000 feet. For theelevation angle measurement, the rate of change of modeled-measured difference is 0.01dB per degree, resulting in a .9 dB increase over the measurement from about 2 to 90degrees. Finally, for the slant range measurement, the rate of change in the modeled-measurement difference is 0.18 dB per 1,000 ft, resulting in a 6-dB increase over themeasurement range from about 2,000 to 38,000 ft.
Note, however, a marked decrease in elevation sensitivity over previous studies, s This is
most likely due to significantly improved flight track - noise event correlation methodologyand more accurate track and profile modeling. It does raise some concerns however,regarding long-range elevation angle effects on noise propagation, specifically lateralattenuation. Statistically, it has been shown that the correlative linear trend line doesindeed conclusively indicate a reduction in prediction accuracy with increasing elevationangle.
5-10

Validation of Aircraft Noise Prediction Models at Low Levels of Exposure
_Em2
a-o_
¢_
on o
Z _
0 I,o o 19
('1=18) paJnsealN - polo!paJd
A.J
U.
L
0
0G.
I
mcoU)
o_D-I
2
°_
5-11

Validationof Aircraft NoisePredictionModelsat LowLevelsof Exposure
(-I=_g)paJnseelN- pa;o!paJd
ocr)
u_r_
o(D
A
O_
"ID
O_
t-O
m
(D
UJ
O¢O
IF),¢--
o
¢O
0
q_
0
I
I/)t-eD
C_
01
t-O
cg
_)
LLI
U.
5-12

Validation of Aircraft Noise Prediction Models at Low Levels of Exposure
co=E"o
o
o
m
U3
!
x
o
o
• _ 4)
"$ :
I
• • 4, • _,*
°•I01
"Tcc)
"T
(-I=IS) peJnsealN - pa;o!peJ¢l
oc_c_c_
oooIJ3o'3
ooooco
o
oLoc_
ooo-
oooo
ooo
o
v
0
013.
I
.>
e-
¢/)
C-
T"¢=
09
o
_mIJ.
5-13

Validation of Aircraft Noise Prediction Models at Low Levels of Exposure
All three of these geometric parameters, obviously related, suggest three potential sourcesfor noise prediction improvements:
1. Possible improvement to the NPD database for large distances.
2. Possible improvements should be made to the acoustical algorithms, whichextrapolate beyond the 25,000-foot maximum distance contained in the INMdatabase.
3. Additional research should be undertaken to address the lateral attenuation
discrepancies for long propagation distances.
Data analysis revealed a stronger relationship between altitude and prediction accuracy
(predicted SEL - measured SEL) than between slant range and prediction accuracy. Thisresult seems to imply that the source levels are being improperly reduced as the aircraftgains altitude. Item 1 will involve extending the INM NPD database to include higheraltitudes and distances. Item 2 focuses on improving the existing INM methodology for
extrapolation beyond the maximum distance contained within the database. Assessmentof the relative magnitude of error due to incorrect noise source levels for aircraft at highaltitudes versus discrepancies due to incorrect noise source levels for aircraft at loweraltitudes yet longer slant ranges should be investigated. One possible approach is tocalculate new NPD data for various combinations of altitude, elevation angle and slant
range, accounting for noise source impedance effects due to varying aircraft altitude.These user-defined NPD curves could then be incorporated into the INM analysis on a
track-by-track and receiver-by-receiver basis. Item 3 will require a more in-depth look atthose data points with low elevation angles and low slant ranges, and perhaps make useof the lateral array DAT recordings. 23
5.2 Atmospheric Conditions
Atmospheric conditions affect both the sound generation at the source and its propagationthrough the atmosphere. Figures 5-9 and 5-10 show the sensitivity of Predicted-Measured SEL with airport air temperature and airport atmospheric pressure. Asindicated in these figures, one would not expect a very strong sensitivity to airport flightconditions since care was taken in the data processing phase to use the best available
atmospheric data for the creation of INM inputs, namely the power setting at the point ofclosest approach. Given the number of monitors at a great distance from the airport, itcould be expected that local atmospheric conditions at the point of closest approach wouldbe a stronger driver on the parametric analysis. This was indeed the case.
At the point of closest approach, from Figures 5-11 and 5-12 a clear trend towards noiselevel underprediction is apparent with decreasing outside air temperatures and decreasingatmospheric pressure. It is important to note that temperature and pressure at the aircraft(at the point of closest approach) are related to each other and to altitude. It is unclear towhat degree variations in temperature or pressure from standard day conditions affect theresults. Similarly, a tendency to underpredict noise levels with increasing wind speed ataltitude is apparent (Figure 5-13). The upper air data used on these correlation analyseswas obtained via linear interpolation of nearby twice-daily NOAA balloon launches atStapleton Airport, and may not reflect the exact atmospheric conditions present at thepoint of closest approach. Nonetheless, these rough atmospheric correlations suggestthat a more detailed upper air atmospheric sensitivity study should be implemented.
5-14

Validationof AircraftNoisePredictionModelsat LowLevelsof Exposure
Within INM, flexibility for user-defined atmospheres and use of actual upper airtemperature, pressure, and wind direction is not currently permitted. The atmosphereused within INM is a Non-International Standard Atmosphere. Although actual power data
was input directly to INM, the non-ISA atmosphere manifests itself in the acousticimpedance algorithms. 2° This adjustment is purely a ground adjustment accounting fornon sea-level level airports and their surrounding terrain. It is not a function ofatmospheric conditions at the point of closest approach.
Noise source effects due to winds present at the aircraft at the point of closest approach
were analyzed. Figure 5-13, a sensitivity of noise correlation, shows a slight effect of windspeed on prediction accuracy. A future analysis should include a comparison of winddirection (relative to the flight path) effects on noise source modifications and atmospheric
propagation. Given the available upper air data and scope of the current study, detailednoise source generation and effects were not considered.
A statistical analysis of two atmospheric parameters revealed a definite dependence ofnoise correlation on both outside air temperature at the point of closest approach and onthe barometric pressure at the point of closest approach. Similarly, as evidenced by thet-value of-9.00, a dependence on wind speed at altitude was also determined.
Atmospheric absorption is not treated as an independent parameter within INM. It isindirectly accounted for using the SAE ARP 866A lateral attenuation algorithms 24 in theNPD database source noise levels.
These atmospheric sensitivity studies suggest several areas for future .analysis and
possible improvements:
1. Evaluate the sensitivity of prediction errors to atmospheric conditions at thepoint of closest approach using more accurate weather data in order todevelop an acoustic impedance correction, which properly accounts for
conditions present at the noise source.
2. Develop alternate atmospheric models or possibly user-definable atmospheresfor incorporation into INM.
Develop a methodology that accurately accounts for wind effects, both magnitude anddirection, on noise source generation.
5-15

Validation of Aircraft Noise Prediction Models at Low Levels of Exposure
G)
U mi
_- 0
Z __ 0
o o
(1=1S) peJnseelN - pe;o!peJd
O
"T
LO00
O00
r_.
¢D
"1o• oE :Ec-- _,
m I
_ °_
O c
P Em I,-
E _
U.
o
5-16

Validation of Aircraft Noise Prediction Models at Low Levels of Exposure
e- __
E_
¢o=E"o
ou _
m
o
Z,r-n 0
0
.. , • _-_. ; =t;e_abt,Or
• ,_m 4_P tql_ ,_,@ • @••
o
o
Eo_
_, 2
0
L°m
<
i._ e=o "_
2w
o
_ ..-
0
!
x
ooII
• e, e_& e*#•0•
• _ ***%• ,,_• •
oo)
o
('1_]S) peJnseelN - pa_o!paJd
o
!
u') o4
"T
"oO=EL=
O
I
>
U_
ffl
n
c-
O
<
0
U.
5-17

Validation of Aircraft Noise Prediction Models at Low Levels of Exposure
O
Z_N
o
4
m
t_ $# •
4
%
('138) I:_JnSROlN - po;o_PeJd
o_D
O
O
Q04
O u'_"T "T
o
A
I.I.
o"ID
<__d¢1
o
EI-¢_
"O
O
¢D
"10O
O
I
._>
e"
L-
I--
in
o
¢.)
O
Oft.
ID
5-18
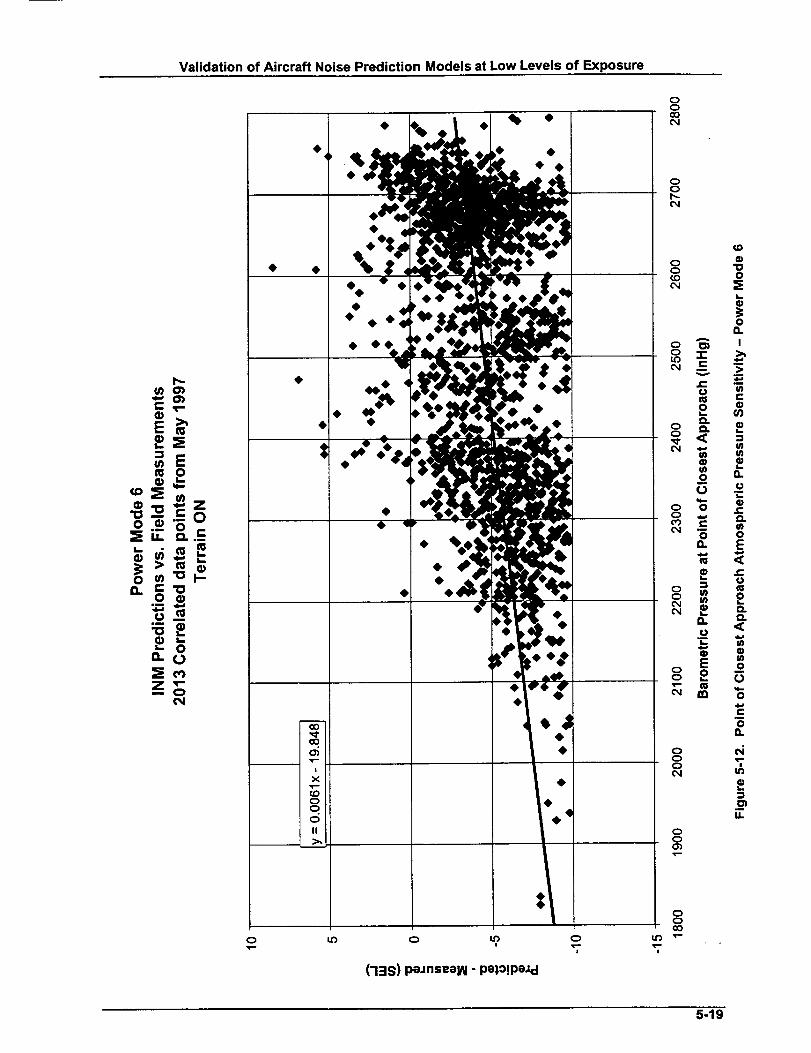
Validation of Aircraft Noise Prediction Models at Low Levels of Exposure
E_
"-0_
o
*%. • " *
• °,i
. -..___."_N-
:g '_%*
o?,-..
"2,
I-INS) peJnseelN - pa;o!peJd
o
_ >
P
o
¢.1
0
coL¢') x-
"T
5-19

Validation of Aircraft Noise Prediction Models at Low Levels of Exposure
E_
.=E
Q
Q_
I1
4 )00 ° •
, '._ Y
•_.V.,_,_ _
• •• -\_I' ___._
• •q !
u'_
('l=lS) paJnsealN - pe;oip0Jd
o
o
LOc_J
oc_J
AIn
o
o"o--i
,m
m.
%---
f0
"O
U)
"Ol-
o%--
ID
Q
LO
"T
(D
"[3O
O
I
OT"
ffl
?
O
O
O
e4
oL-
U.
5-20

Validation of Aircraft Noise Prediction Models at Low Levels of Exposure
5.3 Operational Statistic Results
Operational parameters possibly affecting noise predictions can be placed into twocategories, departure state and maneuver state. Since the majority of noise monitorswere located beyond the transition to second segment climb location, operationalparameters are only indirectly related to the prediction accuracy. Maneuver-stateparameters are those operational parameters present at the point of closest approach(i.e., the noise source characteristics). The following parameters are within the departure-state category:
• Takeoff Gross Weight (Figure 5-14)
• Takeoff Thrust Level (Figure 5-15)
• Maximum Allowable Weight Factor (Figure 5-16)
• Derated Thrust Assumed Temperature (Figure 5-17)
• Thrust Derate Temperature Differential (Figure 5-18)
As expected, for Power Mode 6, calculation of thrust directly from the installed Fn/5 engineperformance curves resulted in little sensitivity to derated thrust parameters. INM wasinput the profiles directly. These profiles were obtained from the radar data. Had theprocedure step calculations of departure profiles been used instead, an additional sourceof error would have been introduced. Since one of the inputs to the procedure stepscalculations is TOGW, additional prediction accuracy sensitivity with TOGW might havebeen introduced. Figures 5-14 through 5-18 document the various departure operationalparameters. The differences between aircraft types are visible in the clustering ofdatapoints for charts with dimensional engine parameters on the ordinate. Normalizedvariables are presented below. Noise monitors focused on areas farther away from theairport, where any detailed departure operational procedures performed on and near therunways are not expected to influence noise predictions. For studies where noise withinan area near the initial departure segment is of concern, this conclusion should not bedrawn.
Normalized takeoff derate thrust, which put the vadous aircraft types on equal footing withone another used the following independent variables:
• Maximum Allowable Weight Factor (%) = MATOGW -TOGWTOGW
(Figure 5-16)
• Derate Assumed Temperature (°F) (Figure 5-17)
• Thrust Derate Temperature Differential (Figure 5-18)
Analysis of the various departure derate parameters did not indicate whether the strongsensitivity was due to atmospheric conditions (Thrust Derate Temperature Differential[Figure 5-18]), or lower takeoff weights (Maximum Allowable Weight Margin [Figure 5-18]).
5-21

Validation of Aircraft Noise Prediction Models at Low Levels of Exposure
E_
==E
"o
o
_i ° _°°° _ ° °°
,, ,"F' t
• AOO _
ev 4_ '_
-• o4
° _ •
o t_
('i=lS) poJnseolN - po;o!poJd
o
"T
=,_ _"
_ _= "_
it.
8
oooo
_T
5-22

Validation of Aircraft Noise Prediction Models at Low Levels of Exposure
E_
.=E
co:E_"o
"-o_
D-O
o
II
o
,I
• • •
•.:,aof ,• ql4Nli_ J ,4041
, °I..o• _LIO-°
"V• t 0•_•
o
(138) paJnsealN - po;o!paJd
c_"7
o
2
o
I--
C3
QL_ ,r-"7
5-23

Validation of Aircraft Noise Prediction Models at Low Levels of Exposure
E_
_E_o
¢0 _"
o
Q
L_
c_
¢0
c_
:=
c_
.p-
al
o
"T
¢D
'100
O
I
E
E1<
q_
d_
L
.__U.
5-24
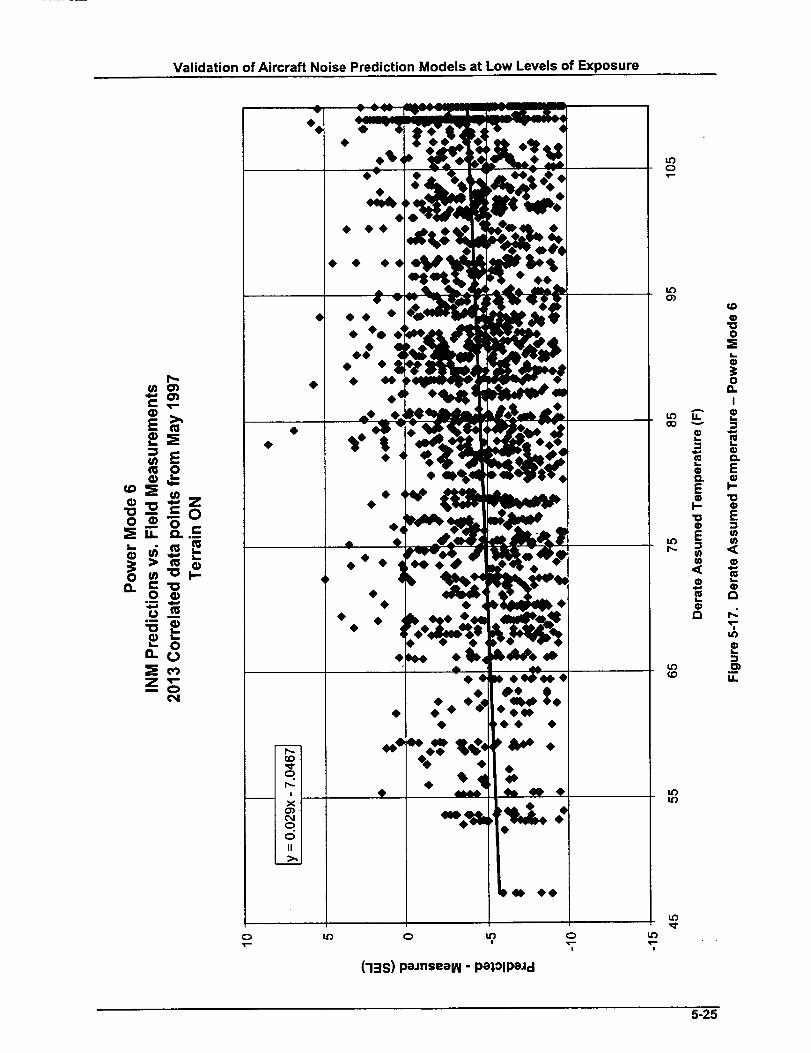
Validation of Aircraft Noise Prediction Models at Low Levels of Exposure
tl--
O
O
Z,r-
0
(-13S) pe, nsealN - pa;o!pa, d
Oqr-
i
*iE
P¢Dr_
U')_O
U'JU')
L_
"T
CD
"OO
I.
O
I
L
E
I-
0
E
0
0
,-,1
.__
5-25

Validation of Aircraft Noise Prediction Models at Low Levels of Exposure
q-
"o_o_
"-0_
o
• @@@
, ,i,,_ _''_''"
"" *-,• ... .4_._,
• . ..,,,_.:__ __
• :. Y .'Y=-_Y', . . 0..:... _..,-
4, @A A A _ _m---
u'_ O u? o"7,
('138) paJnseelN - pe_,o!peJd
® P
P
.=
P
O
L_,¢-*
!
5-26

Validation of Aircraft Noise Prediction Models at Low Levels of Exposure
Maneuver-state parameters are dictated by the aircraft motion and noise-source state atthe point of closest approach, and should not be confused with departure-stateparameters. These parameters include:
• Aircraft Speed (Figure 5-19)
• Compressibility Effects (Mach number) (Figure 5-20)
• Flight Thrust Level (Figure 5-21)
• Thrust Factor (Figure 5-22)
While aircraft speed and Mach number are undeniably related, there are subtle differencesin correlation sensitivities due to local atmospheric conditions. These differences manifest
themselves as a slightly stronger Mach dependence. This can be seen by the highert-values for the Mach number statistical analysis (Section 5.4). This is due tocompressibility and atmospheric effects, and leads to the observations that compressibilityeffects on noise source generation may be important. An investigation into the secondsegment thrust settings resulted in two independent parameters:
Thrust (Ibs) at point of closest approach (Figure 5-21)
Thrust Factor
= Takeoff Thrust - Closest Approach Point ThrustTakeoff Thrust
(Figure 5-22)
Figure 5-21 shows the effects of aircraft type. Nondimensional variables presumablyremove this aircraft type dependence to reveal the true thrust sensitivity shown in Figure5-22.
Attempts to identify trends or effects relating to the initial segment derate condition onceagain indicated the fact that noise predictions farther away from the airport are inde-pendent of takeoff parameters. Similar to the Operational Parameters, a sensitivity tothrust factor- namely a decrease in correlation of decreasing thrust- indicates the
following:
• INM's internal NPD data curves should be examined for accuracy at lower
power settings and greater distances, and possibly expanded to include alarge range of P-D,
• NPD data interpolation and extrapolation schemes should be examined and
possibly improved.
5.4 Multiple Regression Analysis
Previous regression analyses indicated the importance of several variables falling into thefollowing areas:
• Geometrical Parameters
• Atmospheric Conditions at the Source
• Aircraft Maneuvering Parameters
5-27

Validation of Aircraft Noise Prediction Models at Low Levels of Exposure
E_
o_(-
o_ _-=o_
m
d
.I' * IV*
•
4k
. ;,4_ 4
"'.; :: .
4_14_
('FaS) peJnseelN - pa),o!peJd
og
_o
(/)
t_4
0
"T
¢0
4)"00
0n.
I
J¢
o
<4.eU)4)U)
o
0
m0
O.
0
"04)4)
U_
<
o_
U.
5-28

ValidationofAircraft NoisePredictionModelsat LowLevelsof Exposure
"o
=
Z_N
o
m
-t.i0'+
X
!
4
('IgS) paJnseolN - po;o!paJd
o_T
o
c_
t_
o
c_c_
QLD
"T
J¢o
oD.<_*l,,J
(D
O
ori-
O
Or_
*4k._
4,d
I-
J_
E"5z
O
ID
0
0ft.
I_..o
0
O
U.
5-29

Validationof Aircraft NoisePredictionModelsat LowLevelsof Exposure
E_==:E
"o
a.o
o
__ • ._;:8 • _=** =.,
; :,.'. • ..
• O0 _I
O o
° % _t;f
"v "w'V"
•%
('138) peJnseelN - po:io!PeJd
O
I
¢N
8
g_8
0
|
Q
o0LO
"T
0
0
S..
On
I
t_Ok.
Q.D.<
_o
0
r-
O.
.J
I'-
5-30

Validation of Aircraft Noise Prediction Models at Low Levels of Exposure
E_
E
"O
.-/4
x • :
II
t41' /0 _'• • 41, •
¢ */,%
, #oO?'O.,i".'i, _/ °
•';5"i
o -- ,lf¢,t,ll-- +:_o
•i'r l,vlg; "_ _" v
. "i,>oi_ .",.'; liooI,',_,
('F:Ig) paJnsealN - pa;o!peJd
1.13
O
LO
"7
t_COO
O
¢I
O ¢}.<
¢P
ou_ {J
_=O¢p
mI-s,.O
14.
I..
J:}--
1,13T--
o
I.I3o
o
o
_p"IDO
L-
¢p
O
I
p.fJ
OI.
<
_p
O
{JM,-
O
O11.
U.
In
2r-
p-
04
O_o_
1,1.
5-31

Validation of Aircraft Noise Prediction Models at Low Levels of Exposure
A multiple regression analysis counting the following three independent (althoughsomewhat related) parameters was performed:
• Slant Range (feet) (Figure 5-22)
• Outside Air Temperature at the Point of Closest Approach (°F)
• Aircraft Mach Number (Figure 5-20)
(Figure 5-11)
Only one parameter was chosen from each area. Slant range was selected as thegeometrical parameter because it contains both altitude as determined by the sourcelocation, and a propagation distance, the relationship between source and receiver.Altitude only considers the source location with no regard to receiver proximity. Outsideair temperature at the point of closest approach was the most reliable and predictableatmospheric parameter available from the weather balloon data. Atmosphericmeasurements made during the monitoring program execution indicated that ground levelwind speed and direction varied considerably from one site to another. Although it isexpected that this variation is less dramatic at the aircraft altitude, the researchers felt itmore appropriate to use outside air temperature for the multiple regression analysis. Asan aircraft maneuvering parameter, Mach number was selected. Mach includes
compressibility effects due to the aircraft's actual altitude. Since engine operatingconditions and hence the noise generation at the source is heavily dependent onoperating state, Mach number was deemed the appropriate variable.
The results of this analysis are shown in the following regression equation:
INM - MEAS = -9.1683 + -4.71602e- 005 * Slant Range
+ 0.118217 * Outside Air Temperature at Altitude
- 2.38207 * Mach Number
Table 5-4 indicates, via interpretation of the t-value column, that of these threeindependent variables the most critical is Outside Air Temperature (OAT) at altitude. TheMach number parameter indirectly contains some OAT information in the form of thespeed of sound. Also built into this parameter is the aircraft velocity. In this case, sinceMach number is not driving the regression equation, the variation of speed of sound (withaltitude manifesting itself in the aircraft's Mach number) appears to be less important thanthe outside air temperature at altitude. However, one can consider outside air
temperature as a surrogate for altitude. The slant range parameter contains an altitudecomponent. The magnitude of altitude at a particular point of closest approach is oftendiluted by large sideline distances. It would appear from the relative t-value predictionsthat it is the height of the aircraft, not the propagation distance, which is driving the results.
INM is based on NPD curves, which implicitly assume that sound power is independent ofaltitude. The observed effect may be due to altitude effects on engine noise generation, orpossibly the effect of acoustic impedance at higher altitude. The NPD curves also assumeair absorption for standard conditions. Air absorption for vertical propagation can varysignificantly due to temperature/humidity stratifications and density gradients. These twofactors should be investigated.
5-32

6 Conclusions and Recommendations
A noise study was conducted based on four consecutive weeks of noise measurements madeduring May and June 1997 at Denver International Airport in Colorado. Cooperation of Unitedand Delta Airlines and the DIA Noise Abatement Office resulted in the creation of a database
containing detailed information such as TOGW, thrust setting, and actual airframe/engineequipment use historical data. Analysis of numerous independent variables and correlationbetween noise measurements and INM predictions was completed using five power profile
prediction techniques.
Detailed analysis of departure flight tracks using INM, and comparison with correlatedmeasured noise data indicates the following:
• INM underpredicts the SEL for DIA departures by 4 to 10 dB depending on theProfile Power Prediction Method with a standard deviation of approximately 3.3 dB.
• Power Prediction based on actual detailed Installed Engine Fn/(5 tables producesthe most accurate results (Table 5-1).
• Primary independent variables affecting the correlation can be summarized asGeometric, Atmospheric, and Maneuver Parameters.
• Multiple regression analysis indicates that the strongest dependence is on Atmo-spheric Conditions at Altitude (Section 5.5).
Based on the results presented in Chapter 5 and an understanding of INM, the followingrecommendations for future analyses and possible prediction method improvementsare made:
• From certification data, update the noise source data levels contained in the N-P-Ddatabase with improved lateral attenuation algorithms and for greater distances inorder to avoid data extrapolations within INM.
• Atmospheric effects on both noise source generation and long-range propagationshould be investigated in more detail, with a focus on the current atmosphericmodels in INM, and with the intent to develop methodologies for treating acoustic
impedance on the noise source at the point of closest approach.
• Investigate the feasibility of generating improved thrust and performance predictionmethods for use within INM, which more closely model the actual installed engine
performance, considering such variables as local airport conditions, Mach number,and TOGW.
6-1


.
2.
3.
4.
o
6.
,
°
9.
10.
11.
12.
13.
14.
15.
16.
17.
18.
19.
20.
21.
22.
23.
24.
References
Integrated Noise Mode/(INM) Version 5.0 User's Guide, FAA-AEE-95-01, August 1995.
Integrated Noise Mode/(INM) Version 4.11 User's Guide - Supplement, DOT/FAA/EE/93-03,December 1993.
Procedure for the Calculation of Airplane Noise in the Vicinityof Airports, SAE AIR 1845,March 1986
Moulton, C. L., Air Force Procedure for Predicting Aircraft Noise Around Airbases: NoiseExposure Mode/(NO/SEMAP) User's Manual, Wyle Research Report WR 89-20, alsoAAMRL-TR-90-011, February 1990
Page, J., Plotkin, K., Carey, J. and Bradley, K., Validation of Aircraft Noise Models at LowerLevels of Exposure, NASA Contractor Report 198315, February 1996.
Stusnick, E., Plotkin, K. J., Page, J. A., and Bradley, K. Validation of Aircraft Noise PredictionModels at Low Levels of Exposure, Phase 2 Test Plan, VVyleResearch Technical Note TN 97-1, January 1997
National Airspace System Automated Radar Terminal System II/(ARTS///), Department ofTransportation, FAA Aeronautical Center N-9, March 1973.
United Airlines B727-222A Flight Manual, Takeoff Section.
United Airlines B737-200 ( ADV-17, ADV-9, BASIC-7) Flight Manual, Takeoff Section.
United Airlines B737-322/522 Flight Manual, Takeoff Section.
United AirlinesA319-131/A320-232 Flight Manual, Takeoff Section.
United Airlines DC-10-10/DC-10-30/DC-10-30F Flight Manual, Takeoff Section.
United Airlines B757-222/-222ER Flight Manual, Takeoff Section.
United Airlines B767-222/-222ER Flight Manual Takeoff Section.
United Airlines B777-222/222B Flight Manual, Takeoff fSection.
United Airlines, Standard Performance Reference Handbook, DENTK-Chet Collett,Coordinator-Airplane Performance Programs, 12 January 1996.
Air Traffic Training Publication N-9, NAS Operational Equipment, ARTS III, Air Traffic Branch,Federal Aviation Administration Academy, March 1973.
ARTS//I, Collection and Editing System (ACES) for Noise Monitoring,Technical Referenceand User's Manual, Dimensions International, Inc. February 1994.
Procedure for the Calculation of Airplane Noise in the Vicinityof Airports, SAE AIR 1845,March 1986.
Fleming, G.G., Olmstead J.R., D'Aprile, J.R., Gerbi, P.J, Guiding, J.M., and Plante, J.A../ntegrated Noise Mode/(INM) Version 5.1 Technical Manual, Report No. FAA-AEE-97-04,December 1997
Clarke, J.P., and Fleming G., e-mail communication to Page, J., Guilding, J., and Shepherd,K., Thrust Translation, 13 November 1997.
Bishop, D.E., and Mills, J.F., Update of Aircraft ProtTleData for the Integrated Noise Mode/Computer Program, Report No. FAA-EE-91-02, March 1992
Plotkin, K.J., Hobbs, C.M., Stusnick, E., Validation of Aircraft Noise Prediction Models at LowLevels of Exposure, Volume 2: Lateral Array Studies, Wyle Research Report WR 98-11,March 1999
Standard Values of AtmosphericAbsorption as a Function of Temperature and Humidity, SAEARP 866A, 15 March 1975.
R-1

REPORT DOCUMENTATION PAGE FormOMB J_k_.0/04-0188
Publicroporling_ for this colle_n..' 'of infcxmllionille6_n1111odto _ I hourperresponse, includ'.rigthe_time_ mvle_ g in.sl_lctions,searctlinge_'ting datasources,g_he_ng and Wir_ me.data needed,and..,conlpletingandmvk)w_g the _ ol inton'rmbon.5end .©.ornm.e.ntsmglualngthls bur.c_,.eslinm_ or 8rly otheraspectof thiscollectionof iof.o_..t_n, includingsuggest..mnsfor reducingIbis burden,to WashingtonHNdquarters Sennces,D,'octormefor Inf.o_.ationQperabonsandF_. 1215Jeffenmn Davis Highway,Suite 1204, Ar_, VA22202-4302. and to the O(/ice of Mmnagon_mtand B_, l_rk _on Pro_ct {0704-0188),Wash'_on rDC 20503.1. AGENCY USE ONLY (Leave blank) 2. REPORT DATE 3. REPORT TYPE AND DATES COVERED
April 2000 Contractor Report4. TITLE AND SUBTITLE 5. FUNDING NUMBERS
Validation of Aircraft Noise Prediction Models at Low Levels of Exposure
6. AUTHOR(SI
Juliet A. Page, Christopher M. Hobbs, Kenneth J. Plotkin, andEric Stusnick
7. PERFORMING ORGANIZATION NAME(S) AND ADDRESS(ES)
The Boeing Company Wyle Laboratories (Subcontractor)
2401 East Wardlow Road 2001 Jefferson Davis Highway
Long Beach, CA 90807-4418 Arlington, VA 22202-3604
9. SPONSORING/MONITORING AGENCY NAME(S) AND ADDRESS(ES)
National Aeronautics and Space AdministrationLangley Research Center
Hampton, VA 23681-2199
C NAS1-20103, Task 22
WU 538-03-15-01
8. PERFORMING ORGANIZATIONREPORT NUMBER
10. SPONSORING/MONITORINGAGENCY REPORT NUMBER
NASA/CR-2000-210112
11. SUPPLEMENTARY NOTES
Langley Technical Monitor: Kevin P. Shepherd
12a. DISTRIBUTION/AVAILABIUTYSTATEMENT
Unclassified-Unlimited
Subject Category 71 Distribution: NonstandardAvailability: NASA CASI (301) 621-0390
12b. DISTRIBUTION CODE
13. ABSTRACT (Max#hum 200 words)
Aircraft noise measurements were made at Denver International Airport for a period of four weeks. Detailed
operational information was provided by airline operators which enabled noise levels to be predicted using the
FAA's Integrated Noise Model. Several thrust prediction techniques were evaluated. Measured sound exposure
levels for departure operations were found to be 4 to 10 dB higher than predicted, depending on the thrust
prediction technique employed. Differences between measured and predicted levels are shown to be related to
atmospheric conditions present at the aircraft altitude.
14. SUBJECT TERMS
Noise - Aircraft Noise Prediction
17. SECURITY CLASSIFICATIONOF REPORT
Unclassified
18.._t[;UI.I;I I • _I'I_A'[K)NOF THIS PAGE
Unclassified
NSN I_IO-Ul
19. 51_GUHII ¥ CLA_$11"ICATIq_NOF ABSTRACT
Unclassified
15. NUMBER OF PAGES
9716. PRICE CODE
A0520. UMHAI1UN
OF ABSTRACT
UL
_tanaara form z_ lHev. z-syjPrescribed by ANSI Std. Z-39-18298-10_

