validation of icing atlases using scada data -...
TRANSCRIPT

VTT TECHNICAL RESEARCH CENTRE OF FINLAND LTD
Validation of Icing atlases
using SCADA data
Timo KarlssonResearch Scientist, VTT Technical Research Center of Finland
Winterwind 2016,
Åre, Sweden

09/02/2016 2
Aim
Compare existing ice maps to on-site measurements
Use SCADA data from actual, operating wind turbines as ice
detectors for validation
Evaluate how well icing atlases can be used in icing assesment

09/02/2016 3
Ice maps
VENDOR MEASURE SOURCE AREA
FMI Meteorological,
instrumental,
production losses
Numerical
weather model
Finland
Kjeller Vindteknik Meteorological icing Numerical
weather model
Finland, Sweden
VTT Meteorological icing Observations Finland, Sweden
(Global)
DNV-GL Instrumental icing,
Production losses,
Observations Sweden
Weathertec
Scandinavia
Meteorological icing,
Production losses
Numerical
weather model
Sweden, Finland

409/02/2016
Long term outlook
Two of the datasources contain a longer dataset
1979-2015
This allows us to estimate how the years with measurements stack
up to history
Compare the years with measurements to historical averages
See how much icing fluctuates on either site

09/02/2016 5
Turbine icing
Calculated using method published by
IEA wind task 19
Indirect
Observe effects on turbine performance
Power decrease from nominal
Inexplicable stops
Rotor icing
https://www.ieawind.org/task_19/Task19 Ice Loss Method.html

09/02/2016 6
Ice case definition
Output power outside
of P10 of normal
operation in safe
conditions for +30
minutes
Icing induced stop
Outputs:
Production losses
Rotor icing (amount
of hours turbine is
effected by icing)Icing induced stop
09/02/2016 7
Ice classification
Different sources measure different things
Meteorological or rotor icing, production losses
Need common ground for comparison
IEA ice classes used a quite often
Same ice class -> good enough accuracy

09/02/2016 8
IEA ice class
Duration ofMeteorological
icing[% of year]
Duration ofInstrumental
icing[% of year]
Productionloss
[% of AEP]
5 >10 >20 >20
4 5-10 10-30 10-25
3 3-5 6-15 3-12
2 0.5-3 1-9 0.5-5
1 0-0.5 <1.5 0-0.5
¹: IEA Wind Recommended Practices
for wind energy projects in cold
climates edition 2011, Task 19
Ice classes: IEA Ice Classification¹

909/02/2016
Sites
Site SWE
In Northern Sweden
Multiple turbines
Relatively bad icing
conditions
Only turbines, no external
measurements
Site FIN
Finnish developer with
portfolio of several farms
Several projects in pipeline
Case wind farm:
Turbines A & B (3MW,
HH140m, D120m)
A & B close to each other
Ice detector on site
Heated + non-heated
anemometers

09/02/2016 10
SCADA Data and instruments, Site FIN
Icing hours (% of annual)
2 014 2 015
Instrumental icing 11,0 % 11,7 %
Ice detector 2,3 % 3,2 %
Rotor Icing FIN 1 6,2 % 5,6 %
Rotor icing FIN 2 0,0 % 3,3 %
0,0 %
5,0 %
10,0 %
15,0 %
20,0 %
25,0 %

1109/02/2016
SCADA Production losses
Large differences
between two turbine
types
Installed close to
each other on
similar terrain
Production losses (% of expected AEP)
0,00%
2,00%
4,00%
6,00%
8,00%
10,00%
2014 2015
FIN 1 FIN 2
IEA ice class
54321

09/02/2016 12
1 2
AEP losses, long termaverage
5,80% 4,90%
0,00%
1,00%
2,00%
3,00%
4,00%
5,00%
6,00%
7,00%
AEP losses, long term average
Icing Atlases, site FIN
IEA ice class
54321

09/02/2016 13
1 2 3 4
Meteorological icing,long-term average
3,8 % 2,0 % 6,56% 4,5 %
0,0 %
1,0 %
2,0 %
3,0 %
4,0 %
5,0 %
6,0 %
7,0 %
Site FIN, Ice Atlases
Icing atlases, site FIN
IEA ice class
54321

1409/02/2016
Historical outlook, site FIN
source 1 Source 2
Average 4.6 % 6.6 %
Min 2.2 % 4.4 %
Max 8.0 % 9.0 %
35 year datasets differ for the
same site quite substantially
This can be attributed to
differences in methods to
some degree
Both records show large
variance between the best
and worst years
At most ~70%
Annual meteoroligical icing (%)

1509/02/2016
IEA Classification, Site FIN
Set an ice class from all data
sources
7 classifications based on ice
atlases
4 based on measurements
Average ~3
Icing atlases give higher
estimates than measurements
Different turbine brands
behave differently in icing
conditions
Source Ice classes
Icing atlases,
Meteorological
icing
3, 4, 2, 3
Icing atlases,
AEP loss
3, 3
Instruments 2, 2, 3
Production losses 2-3, 2

09/02/2016 16
Results, site SWE
Average loss 9%
Large year-over-year
differences
300% from min to max
6,3 %
4,2 %
11,9 %
13,6 %
0,0 %
2,0 %
4,0 %
6,0 %
8,0 %
10,0 %
12,0 %
14,0 %
16,0 %
2010-2011 2011-2012 2012-2013 2013-2014
Production losses % of AEP
IEA ice class
54321

09/02/2016 17
1 2
AEP losses, long termaverage
7,50% 6,57%
0,00%
1,00%
2,00%
3,00%
4,00%
5,00%
6,00%
7,00%
8,00%
AEP losses, long term average
Ice atlases, site SWE
IEA ice class
54321
Measured
Average
9 %
09/02/2016 18
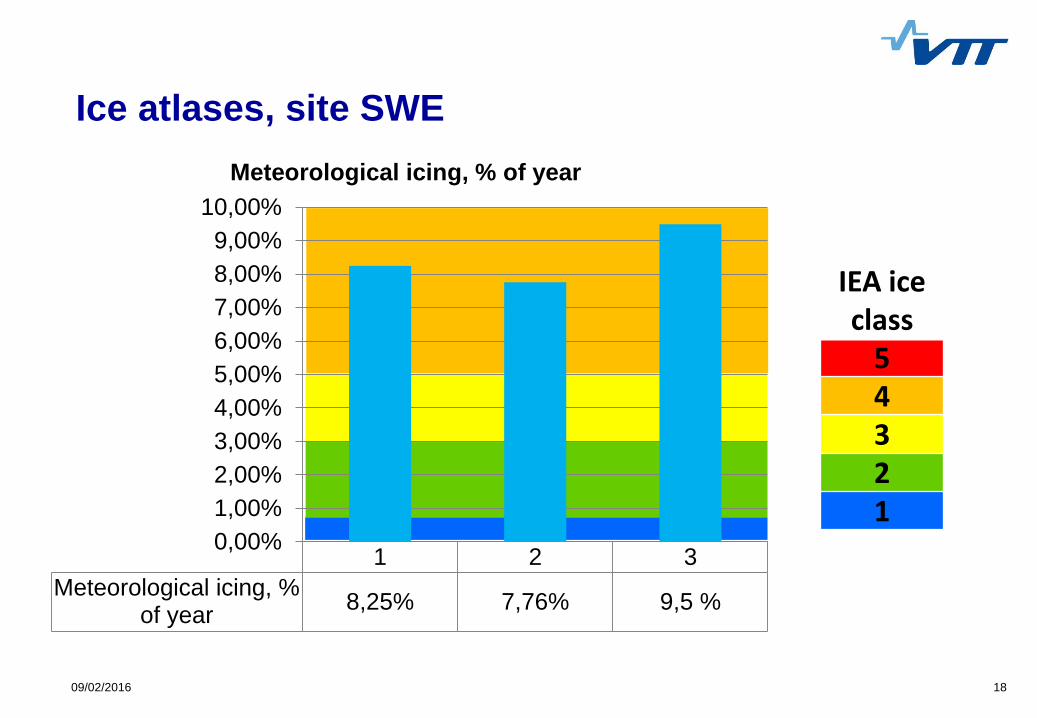
1 2 3
Meteorological icing, %of year
8,25% 7,76% 9,5 %
0,00%
1,00%
2,00%
3,00%
4,00%
5,00%
6,00%
7,00%
8,00%
9,00%
10,00%
Meteorological icing, % of year
Ice atlases, site SWE
IEA ice class
54321

1909/02/2016
Ice classification site SWE
Source Ice class
Turbine losses 3
Ice atlases,
meteorological
icing
4, 4, 4
Ice atlases,
production losses
3, 3
Here the difference is smaller
Estimates of meteorological
icing seem to overshoot the
measurements as well
Is this caused by the loss
counting method?
Total losses more than what
is accounted for icing here
Does the definition need re-
visiting?

2009/02/2016
Historical outlook, site SWE
Large difference between
best and worst years
Site ice class > 3
Individual year results don’t
correlate with measurements
Source 1 Source 2
average 9.5 % 6.0 %
min 6.7 % 3.9 %
max 13.5 % 9.9 %
Annual metorological icing %

09/02/2016 21
Key takeaways
IEA ice classification seems to work
Good ice classification requires
Multiple sources
Multiple years of data
Models and measuremeents agree only on long-term trends

TECHNOLOGY FOR BUSINESS