value-based decision-making: a new …brocas/research/lila1.pdfvalue-based decision-making: a new...
TRANSCRIPT

Value-Based Decision-Making: A NewDevelopmental Paradigm∗
Isabelle BrocasUniversity of Southern California
and CEPR
Juan D. CarrilloUniversity of Southern California
and CEPR
T. Dalton CombsDopamine Labs
Niree KodaverdianUniversity of Southern California
October 2016
Abstract
This study investigates the developmental trajectories of value-based decision-making in the Goods, Social, and Risk domains in children from Kindergartento 5th grade. Consistency in choices develops gradually but differentiallyacross domains which cannot be explained by the development of attentionalcontrol or transitive reasoning alone. In both the Social and Risk domains,the early developmental trajectory is hidden by the centration effect, or thetendency to use heuristic rules. In the Goods domain, children become moreconsistent as they learn to know what they like most and least. In the So-cial domain, children learn what they like most but not what they like least,while in the Risk domain, they learn what they like least and not what theylike most. These results taken together suggest that self knowledge of pref-erences is what solidifies during our window of observation and it does soasymmetrically in the Social and Risk domains.
∗We are grateful to members of the Los Angeles Behavioral Economics Laboratory (LABEL)for their insights and comments in the various phases of the project. We also thank participants atthe 2014 Social Neuroscience retreat (Catalina Island, USC) and at the 2015 Morality, Incentivesand Unethical Behavior Conference (UCSD) for useful comments. All remaining errors are ours.The study was conducted with the University of Southern California IRB approval UP-12-00528.We acknowledge the financial support of the National Science Foundation grant SES-1425062.Address for correspondence: Juan D. Carrillo, Department of Economics, University of SouthernCalifornia, 3620 S. Vermont Ave., Los Angeles, CA 90089, USA, <[email protected]>.

1 Main text
1.1 Introduction
Adults have many abilities that children do not. Multiple paradigms exist to explainwhy these differences exist and change during development. Each of these paradigmsdescribes an important aspect of development, but none of them alone can explainall of the diverse abilities that change as we grow. Here, we present evidence that animportant difference between children and adults cannot be explained by existingparadigms; namely, that adults consistently know what they want but children donot. We can measure the consistency of preferences by testing for transitive choices;if a subject chooses option A over option B, option B over option C, and A over C,then her choices are transitive and that implies that her preferences are consistent.A handful of studies have shown that children are less consistent than adults whenchoosing foods or toys (Smedslund (1960), Harbaugh et al. (2001) Bruyneel et al.(2012), List and Millimet (2008)), while age is less of a predictor of consistency in theSocial (Harbaugh and Krause (2000)) and Risk (Harbaugh et al. (2002)) contexts.This suggests that children’s self knowledge of preferences is imperfect and variesacross domains.
It is intuitive however that differences in transitivity across ages and domainsmay reflect other known aspects of development. Even though children know thatthey prefer A to B and B to C, their choices may not conform to this ranking.This could occur because attentional control, which has previously been associatedwith intransitive behavior in adults for complex choices (Brocas et al. (2016)) isstill underdeveloped in children (Davidson et al. (2006), Astie and Scerif (2009)).Alternatively, it may be because the ability to reason transitively is not yet in place(Piaget (1942), Piaget (1947), Bryant and Trabasso (1971), Rabinowitz et al. (1994),Bouwmeester and Sijtsma (2006)) to support transitive decision-making. Last, itmay result from children’s inability to focus on more than one attribute of an itemat a time, a phenomenon referred to as centration (Piaget (1968), Donaldson (1982),Crain (2011)).
1.2 Specific scope
The objective of this research is to assess the common and domain-specific devel-opmental trajectories of transitive decision-making in the Goods, Social, and Riskdomains and to determine if the dominant developmental paradigms (attentionalcontrol, logical reasoning, and centration) are enough to explain age- and domain-
1

related differences in transitive decision-making. Our study is most closely relatedto the literature on choice consistency. Earlier studies however have relied on theGeneralized Axiom of Revealed Preferences (GARP), an indirect test of transitivitywhich focuses on choices between bundles of options given a budget constraint, asystem of prices, and non satiation assumptions (Samuelson (1948), Varian (1982)).By contrast, our design focuses on transitivity alone and delivers results directlycomparable across domains.
A) Choice Task
B) Ranking Task
C) Goods
D) Social
E) Risk
Opt.1
Opt.2
Figure 1: Decision-making tasks. (A) In each trial of the Choice tasks, par-ticipants were shown one option on the left (Opt.1) and one option on the right(Opt. 2). They touched one of three buttons displayed at the top of their screen toselect an option or to express indifference (middle button). (B) In Ranking tasks,participants ranked options from most preferred (green face) to least preferred (yel-low face). Both types of tasks were conducted in the (C) Goods domain involvingobjects, in the (D) Social domain involving sharing rules for self (hand pointingout) and other (hand pointing right), and in the (E) Risk domain involving lotter-ies consisting of quantities (number of tokens) and probabilities (green share of thepie).
We recruited 134 children from Kindergarten to 5th grade and 51 Undergradu-ate students to participate in three Choice tasks and three Ranking tasks (Figure
2
1). In each Ranking task, we asked participants to provide explicit rankings ofseven items. In each Choice task, we asked them to choose between all 21 pairwisecombinations of those items. The Goods-Choice and Goods-Ranking tasks involvedgoods, the Social-Choice and Social-Ranking tasks involved sharing rules betweenself and other, and the Risk-Choice and Risk-Ranking tasks involved lotteries. Wedetermined whether the pairwise choices in the Choice tasks were transitive and howintransitive choices were distributed over rankings elicited in the Ranking tasks. Weincluded catch trials to assess attentional control, and a reasoning task to measuretransitive reasoning. To assess centration, we determined whether actual choiceswere consistent with attending to single attributes. For analysis, we grouped chil-dren into the age groups K-1st (Kindergarten and 1st grade), 2nd-3rd (2nd and3rd grades), 4th-5th (4th and 5th grades), and U (Undergraduates). The U agegroup was a control for adult level value-based decision-making.
1.3 Findings
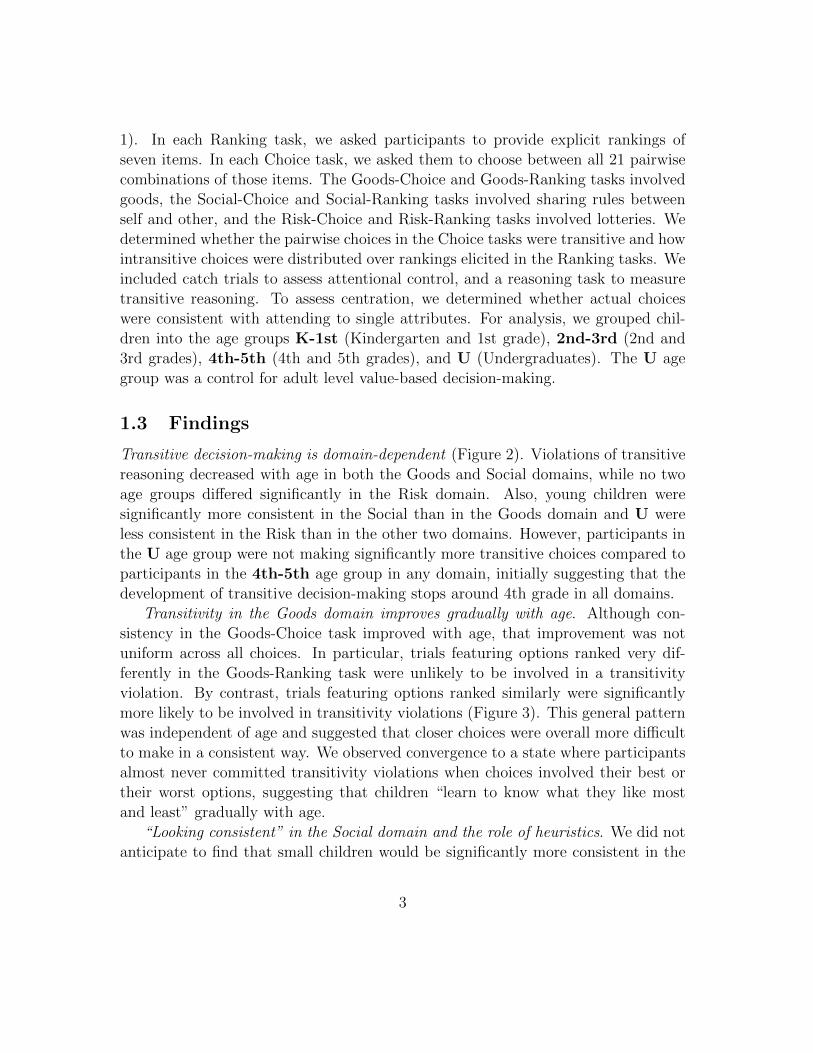
Transitive decision-making is domain-dependent (Figure 2). Violations of transitivereasoning decreased with age in both the Goods and Social domains, while no twoage groups differed significantly in the Risk domain. Also, young children weresignificantly more consistent in the Social than in the Goods domain and U wereless consistent in the Risk than in the other two domains. However, participants inthe U age group were not making significantly more transitive choices compared toparticipants in the 4th-5th age group in any domain, initially suggesting that thedevelopment of transitive decision-making stops around 4th grade in all domains.
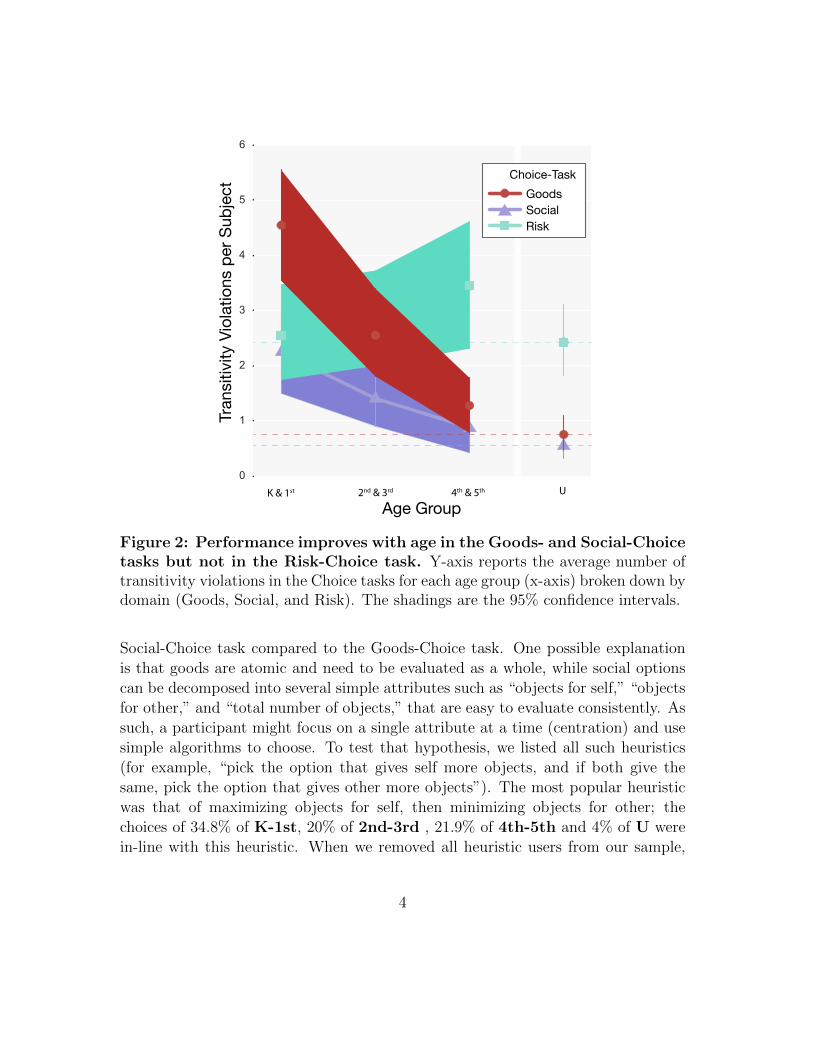
Transitivity in the Goods domain improves gradually with age. Although con-sistency in the Goods-Choice task improved with age, that improvement was notuniform across all choices. In particular, trials featuring options ranked very dif-ferently in the Goods-Ranking task were unlikely to be involved in a transitivityviolation. By contrast, trials featuring options ranked similarly were significantlymore likely to be involved in transitivity violations (Figure 3). This general patternwas independent of age and suggested that closer choices were overall more difficultto make in a consistent way. We observed convergence to a state where participantsalmost never committed transitivity violations when choices involved their best ortheir worst options, suggesting that children “learn to know what they like mostand least” gradually with age.
“Looking consistent” in the Social domain and the role of heuristics. We did notanticipate to find that small children would be significantly more consistent in the
3
K & 1st 2nd & 3rd 4th & 5th U
Age Group
Tran
sitiv
ity V
iola
tions
per
Sub
ject Goods
SocialRisk
Choice-Task
Figure 2: Performance improves with age in the Goods- and Social-Choicetasks but not in the Risk-Choice task. Y-axis reports the average number oftransitivity violations in the Choice tasks for each age group (x-axis) broken down bydomain (Goods, Social, and Risk). The shadings are the 95% confidence intervals.
Social-Choice task compared to the Goods-Choice task. One possible explanationis that goods are atomic and need to be evaluated as a whole, while social optionscan be decomposed into several simple attributes such as “objects for self,” “objectsfor other,” and “total number of objects,” that are easy to evaluate consistently. Assuch, a participant might focus on a single attribute at a time (centration) and usesimple algorithms to choose. To test that hypothesis, we listed all such heuristics(for example, “pick the option that gives self more objects, and if both give thesame, pick the option that gives other more objects”). The most popular heuristicwas that of maximizing objects for self, then minimizing objects for other; thechoices of 34.8% of K-1st, 20% of 2nd-3rd , 21.9% of 4th-5th and 4% of U werein-line with this heuristic. When we removed all heuristic users from our sample,
4

0.7
0.6
0.5
0.8
0.4
0.5
0.3
0.20.1
0.2
0.3
0.4
0.0 0.0
0.1
0.2
0.3
1 2 3 4 5 6 1 2 3 4 5 6 1 2 3 4 5 6 1 2 3 4 5 6
76
54
32
76
54
32
76
54
32
76
54
32
Rank of Higher Ranked OptionRank of Higher Ranked Option Rank of Higher Ranked Option Rank of Higher Ranked Option
Rank
of L
ower
Ran
ked
Opt
ion
Transitivity Violations in Goods-Choice-Task Plotted by Option Ranks in Goods-Ranking-Task for Each Age Group
K and 1st 2nd and 3rd 4th and 5th Undergraduate
Figure 3: Transitivity violations decrease with age differently acrosschoices. Each cell represents the color-coded average number of transitive vio-lations involving a higher ranked option (x-axis) and a lower ranked option (y-axis),as revealed by explicit rankings obtained in the Goods-Ranking task. Lighter colorsreflect more violations. All age groups are more likely to make transitivity violationswhen options have similar ranks. There is convergence to a state where participantsalmost never commit transitivity violations when choices involve their best (darkcolor in left column) or their worst (dark color in bottom row) options. The vectorsin the top right corner of each heat map show the average gradient in the heatmap.Subjects become more consistent if the rank of the higher-ranked option goes up, orif the rank of the lower-ranked option goes down.
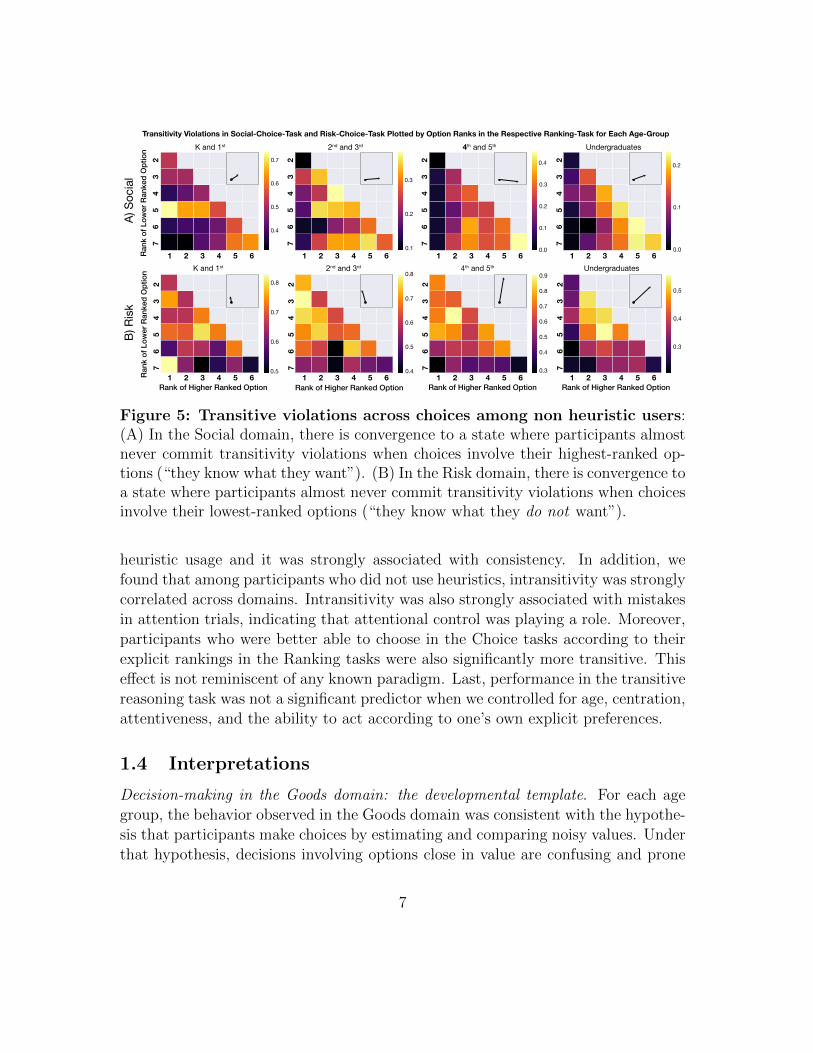
the developmental signature matched that of the Goods domain (Figure 4, leftpanel). A systematic difference persisted however when we looked at how violationsevolved between similarly- and differently-ranked options (Figure 5 (A)). We foundthat children learned to become consistent in choices involving their best options(“they learned to know what they liked most”) but they still committed violationsin choices involving their worst options (“they did not learn to know what they likedleast”), even in the U age group. Last, a noticeable trend was the gradual evolutionof behavior towards more integrative decision rules (such as maximizing efficiency),reflecting trade-offs between the two attributes. This result suggests that as childrenage, they become better able to think in terms of prosociality and social efficiencyconfirming the results from related studies on other-regarding preferences (Fehr etal. (2008)).
Limited development of consistency in the Risk domain. Given lotteries are multi-attribute options (of probabilities and outcomes), we hypothesized that centrationcould be playing a role in the Risk domain as well. We again defined all heuristicscharacterized by the evaluation of one attribute at a time, such as “pick the optionfeaturing the larger number of goods, and if both have the same, choose the most
5

K & 1st 2nd & 3rd 4th & 5th U
Age Group
Tran
sitiv
ity V
iola
tions
per
Sub
ject Goods
SocialRisk
Choice-TaskGoodsSocial
Social
Choice-Task
All Subjects
w/o HeuristicSubjects
K & 1st 2nd & 3rd 4th & 5th U
Age Group
GoodsRisk
Risk
Choice-Task
All Subjects
w/o HeuristicSubjects
Figure 4: Left panel: Social vs. Goods after removing heuristic users.The developmental signature of consistency is comparable in the Goods and Socialdomains among children who do not use heuristics. Right panel: Risk vs. Goodsafter removing heuristic users. The developmental signature of consistency isdifferent in the Goods and Risk domains among children who do not use heuristics.All children are similarly inconsistent and improvements occur later in life.
likely option.” Again one was used dominantly: 44.4% of K-1st, 34.5% of 2nd-3rd, 18.8% of 4th-5th and 7.8% of U chose the lottery offering the larger reward.When we removed all heuristic users, we found that the developmental signaturedid not match that of the Goods and Social domains (Figure 4, right panel). Inparticular, the number of violations was the same across all elementary school agegroups and this was significantly different from that of the U group, indicating thata potential milestone for Risk was outside our window of observation - somewhere inmiddle or high school. Also, children learned to become more consistent in choicesinvolving their worst options (“they learned to know what they liked least”), butless so in choices involving their best options (“they did not learn to know what theyliked most”), a trend opposite to the trend observed in the Social domain (Figure5 (B)). Similar to the Social domain however, older participants were better ableto make integrative decisions, in this case, trade-offs between reward amounts andprobabilities.
Who makes transitive choices? As noted earlier, centration took the form of
6
0.8
0.7
0.6
0.5 0.4
0.5
0.6
0.7
0.8
0.3
0.4
0.5
0.6
0.7
0.8
0.9
0.3
0.4
0.5
0.7
0.6
0.5
0.4
0.1
0.2
0.3
0.0
0.1
0.2
0.3
0.4
0.0
0.1
0.2
1 2 3 4 5 6 1 2 3 4 5 6 1 2 3 4 5 6 1 2 3 4 5 6
1 2 3 4 5 6 1 2 3 4 5 6 1 2 3 4 5 6 1 2 3 4 5 6
Rank of Higher Ranked OptionRank of Higher Ranked Option Rank of Higher Ranked Option Rank of Higher Ranked Option
Rank
of L
ower
Ran
ked
Opt
ion
Rank
of L
ower
Ran
ked
Opt
ion
76
54
32
76
54
32
76
54
32
76
54
32
76
54
32
76
54
32
76
54
32
76
54
32
Transitivity Violations in Social-Choice-Task and Risk-Choice-Task Plotted by Option Ranks in the Respective Ranking-Task for Each Age-GroupK and 1st 2nd and 3rd 4th and 5th Undergraduates
K and 1st 2nd and 3rd 4th and 5th Undergraduates
A) S
ocia
lB)
Ris
k
Figure 5: Transitive violations across choices among non heuristic users:(A) In the Social domain, there is convergence to a state where participants almostnever commit transitivity violations when choices involve their highest-ranked op-tions (“they know what they want”). (B) In the Risk domain, there is convergence toa state where participants almost never commit transitivity violations when choicesinvolve their lowest-ranked options (“they know what they do not want”).
heuristic usage and it was strongly associated with consistency. In addition, wefound that among participants who did not use heuristics, intransitivity was stronglycorrelated across domains. Intransitivity was also strongly associated with mistakesin attention trials, indicating that attentional control was playing a role. Moreover,participants who were better able to choose in the Choice tasks according to theirexplicit rankings in the Ranking tasks were also significantly more transitive. Thiseffect is not reminiscent of any known paradigm. Last, performance in the transitivereasoning task was not a significant predictor when we controlled for age, centration,attentiveness, and the ability to act according to one’s own explicit preferences.
1.4 Interpretations
Decision-making in the Goods domain: the developmental template. For each agegroup, the behavior observed in the Goods domain was consistent with the hypothe-sis that participants make choices by estimating and comparing noisy values. Underthat hypothesis, decisions involving options close in value are confusing and prone
7

to error, while decisions involving options valued differently are easy to make. Thedevelopmental trajectory we observed suggests that the evaluation process becomesless and less noisy over time, reducing the number of confusing decisions, and hencethe number of violations, especially among options ranked very differently (Figure3). This pattern of improvement agrees with previous research on the developmentof consistent decision-making (Harbaugh and Krause (2001)), yet it implies a morefundamental cause: that the ability to make the simplest decisions is what solidifiesin this developmental window. Over time, children learn to know what they likemost and least with more accuracy. In addition, the fact that inconsistency was notassociated with the ability to reason transitively suggests that value-based reason-ing requires the involvement of different brain regions compared to logical reasoning(ventromedial prefrontal cortex in the first case (Levy and Glimcher (2012)) andparietal regions in the second (Hinton et al. (2010)). Furthermore, the associationof inconsistency with age and attentiveness suggests that improvements in decision-making in the Goods domain are partly driven by known age-related changes inattentional control.
Decision-making in the Social domain: the effect of centration. Reasoning overmultiple attributes is known to be a difficult exercise for children 7 years old andyounger, and this ability develops during the concrete operational stage, somewherebetween 2nd and 5th grade (Piaget and Szeminska (1941), Crain (2011)). The highutilization of heuristics we observed by the youngest children is therefore consis-tent with centration. Participants who have not yet overcome centration are morelikely to pick a heuristic that makes them “appear” consistent to the outside ob-server. Among children who do not use heuristics, we observe the same trajectoryas in the Goods domain, suggesting that centration is concealing their underlyingunderdeveloped decision-making system.
Decision-making in the Risk domain: too complex. As in the Social domain,making choices in the Risk domain requires the evaluation of multiple attributes. Itis therefore natural to observe a similar tendency, especially among young children,to act according to heuristics and to “appear” consistent. However, integrativereasoning is largely more complex in the Risk domain and participants who donot use heuristics are not nearly as consistent as in the other two domains. Allchildren were at the same level of performance suggesting that the ability to trade-off probabilities and rewards was not yet developed, perhaps as a consequence ofa still underdeveloped working memory system (Gathercole et al. (2004)). Thisresult complements other studies reporting irrational decisions by children in theRisk domain (Harbaugh et al. (2002)).
8

A different learning trajectory across domains. The results obtained for par-ticipants in the U age group agree with most findings on the literature on choiceconsistency: that by adulthood, people have learned to know their preferences andare largely consistent in the Goods (Battalio et al. (1973), Cox (1997), Sippel(1997)) and Social domains (Andreoni and Miller (2002), Fisman et al. (2007),Visser and Roelofs (2011)). Our findings in the Risk domain are in accordance withprevious transitivity studies (Loomes et al. (1991)), although less optimistic thanprevious GARP studies (Choi et al. (2007), Andreoni and Harbaugh (2009), Choiet al.(2014), Mattei (2000), Fevrier and Visser (2004)), perhaps due to differences indesign. However, our study identifies different learning trajectories in these domains.In the Social domain, children learn to pick their most-preferred option. In the Riskdomain, children learn to not pick their least-preferred option. In the Goods do-main, they learn both. These asymmetries cannot be explained by the developmentof attentional control, which should act similarly across domains, suggesting thatself knowledge of preferences follows its own developmental trajectory.
1.5 Conclusion
We have investigated the developmental trajectories of transitive decision-making inthe Goods, Social, and Risk domains in children from Kindergarten to 5th grade andcompared consistency levels with adult-level performance. We found that transitiv-ity in choices develops gradually, but differentially across domains. In the Goodsdomain, children learn to know what they like most and least and they become moreconsistent over time. In both the Social and Risk domains, the early developmentaltrajectory is hidden by centration that manifests as a tendency to use heuristics thatfacilitate consistency. Children tend otherwise to learn what they like best but notwhat they like least in the Social domain, while they learn why they like least but notwhat they like best in the Risk domain. Even though the development of attentionalcontrol and the development of logical reasoning are candidates to explain the reduc-tion of intransitivity over time, we find that only the former is predictive. However,attentional control only partly explains the development of transitive choice. Thefact that children learn what they want and do not want differently across domainssuggests the role of an ability acquired differentially across domains. The patternswe observe indicate that improved self-knowledge of preferences is that ability whichsupports the development of value-based decision-making.
9

References
1. Andreoni, J., and Harbaugh, W. (2009). Unexpected utility: Experimentaltests of five key questions about preferences over risk. Mimeo, University ofOregon.
2. Andreoni, J., and Miller, J. (2002). Giving according to GARP: An experimen-tal test of the consistency of preferences for altruism. Econometrica, 70 (2),737-753.
3. Astle, D. E. and Scerif, G. (2009). Using Developmental Cognitive Neuro-science to Study Behavioral and Attentional Control”. Developmental Psy-chobiology 51 (2): 107-118.
4. Battalio, R. C., Kagel, J. H., Winkler, R. C., Fisher, E. B., Basmann, R. L.,and Krasner, L. (1973). A test of consumer demand theory using obersvationsof individual consumer purchases. Economic Inquiry, 11 (4), 411-428.
5. Bouwmeester, S. and Sijtsma, K. (2006). Constructing a Transitive ReasoningTest for Six to Thirteen Year Old Children. European Journal of PsychologicalAssessment, 22 (4), 225-232.
6. Bryant P.E. and T. Trabasso (1971). Transitive inferences and memory inyoung children Nature, 232, 456?458.
7. Brocas I., J. Carrillo, D. Combs and N. Kodaverdian (2016). Consistency inSimple vs. Complex Choices over the Life Cycle, Discussion Paper.
8. Bruyneel S., L. Cherchye, S. Cosaert, B. De Rock, S. Dewitte (2012). Are thesmart kids more rational ? Are the smart kids more rational ? DiscussionPaper.
9. Choi, S., Fisman, R., Gale, D., and Kariv, S. (2007). Consistency and hetero-geneity of individual behavior under uncertainty. American Economic Review,97 (5), 1921-1938.
10. Choi, S., Kariv, S., Muller, W., and Silverman, D. (2014). Who Is (More)Rational? American Economic Review, 104 (6), 1518-1550.
11. Cox, J.C. (1997). On Testing the Utility Hypothesis. The Economic Journal,107 (443), 1054-1078.
12. Crain, W. (2011). Theories of Development: Concepts and Applications (6ed.). Saddle River, NJ: Pearson Education.
10

13. Davidson, M. C., Amso, D., Cruess Anderson, L., Diamond, A. (2006). De-velopment of cognitive control and executive functions from 4 to 13 years:Evidence from manipulations of memory, inhibition, and task switching. Neu-ropsychologia, 44 (11), 2037?2078.
14. Donaldson, M. (1982). Conservation: What is the question?. British Journalof Psychology 73, 199-207.
15. Fehr E., H. Bernhard and B.Rockenbach (2008). Egalitarianism in youngchildren. Nature 454, 1079-1083
16. Fevrier, P., and Visser, M. (2004). A study of consumer behavior using labo-ratory data. Experimental economics, 7 (1), 93-114.
17. Fisman, R., Kariv, S., and Markovits, D. (2007). Individual preferences forgiving. American Economic Review, 97 (5), 1858-1876.
18. Gathercole, S. E., Pickering, S. J., Ambridge, B., and Wearing, H. (2004).The structure of working memory from 4 to 15 years of age. DevelopmentalPsychology, 40, 177-190.
19. Harbaugh, W. T., Krause, K., and Berry, T. R. (2001). GARP for Kids: Onthe Development of Rational Choice Behavior. American Economic Review,91 (5), 1539-1545.
20. Harbaugh, W.T., Krause, K., and L. Vesterlund (2002). Risk attitudes ofchildren and adults: choices over small and large probability gains and losses.Experimental Economics 5(1),53-84.
21. Harbaugh, W.T. and K. Krause (2000). Children’s Contributions in PublicGood Experiments: The Development of Altruistic and Free-riding Behaviors.Economic Inquiry, 38(10),95-109.
22. Hinton E.C., S. Dymond, U. Von Hecker and C.J. Evans (2010). Neural Corre-lates of Relational Reasoning and the Symbolic Distance Effect: Involvementof Parietal Cortex. Neuroscience 168, 138-148.
23. Levy D.J. and P.W. Glimcher (2012). The root of all value: a neural commoncurrency for choice. Current Opinion Neurobiology 22(6), 1027-38
24. List J.A. and D.L. Millimet (2008).The Market: Catalyst for Rationality andFilter of Irrationality. Frontiers of Economic Analysis & Policy, 8(1), article47.
25. Loomes G., C. Starmer, and R. Sugden (1991). Observing Violations of Tran-sitivity by Experimental Methods.Econometrica, 59(2), 425-439.
11

26. Mattei, A. (2000). Full-scale real tests of consumer behavior using experimen-tal data. Journal of Economic Behavior and Organization, 43 (4), 487-497.
27. Piaget, J. and A. Szeminska (1941). The child?s conception of number. Trans-lated by Cattegno, C. & Hodgson, F. M. New York, NY. W. W. Norton.
28. Piaget J. (1942) Classes, relations et nombres: essai sur les groupement logis-tique et sur la reversibilie de la pensee, Collin, Paris.
29. Piaget J. (1947). La psychologie de l?intelligence. Collin, Paris.
30. Piaget, J. (1968). Six psychological studies. Translated by Tenzer, Anita andElkind, David. New York, NY: Vintage Books.
31. Rabinowitz F.M. , M. J. Grant, M. L. Howe, C. Walsh (1994). Reasoning inMiddle Childhood: A Dynamic Model of Performance on Transitivity Tasks.Journal of Experimental Child Psychology 52, 252-288
32. Samuelson P.A., (1948) Consumption Theory in Terms of Revealed Preference.Economica, New Series, 15(60), 243-253.
33. Sippel, R. (1997). An Experiment on the Pure Theory of Consumer’s Be-haviour. The Economic Journal, 107 (444), 1431-1444.
34. Smedslund, J. (1960). Transitivity of preference patterns as seen by preschoolchildren. Scandinavian Journal of Psychology, 1, 49-54.
35. Varian H.R. (1982) The Nonparametric Approach to Demand Analysis, Econo-metrica, 50(4), 945-973.
36. Visser, M., and Roelofs, M. (2011). Heterogeneous preferences for altruism:Gender and personality, social status, giving and taking. Experimental Eco-nomics, 14(4), 4490-506.
12

2 Supplementary Materials
2.1 Materials and Methods
2.1.1 Design and procedures
The experiment was reviewed and approved by the IRB of the University of South-ern California. It was conducted through tablet computers and the tasks wereprogrammed with the Psychtoolbox software, an extension of Matlab.
Participants. We recruited 134 children from Lycee International of Los Ange-les, a private school from preschool to 5th grade. We ran 18 sessions, each with 5to 10 subjects and lasting between 1 and 1.5 hours. Sessions were conducted in aclassroom at the school. In all of our tasks, children had to make choices betweenoptions involving goods. To make sure that options were desirable by all partici-pants, we organized sessions by gender and age group: kindergarten to 2nd gradeboys, kindergarten to 2nd grade girls, 3rd to 5th grade boys, and 3rd to 5th gradegirls. Goods included toys and stationary. As a control, we ran 7 sessions with 51undergraduate students. These were conducted in the Los Angeles Behavioral Eco-nomics Laboratory (LABEL) in the department of Economics at the University ofSouthern California. For the undergraduate population, participants were recruitedfrom the LABEL subject pool. Instead of toys or stationary, we used snack foods.A description of the distribution of our participants is reported in Table 1.
Grade Kindergarten 1st 2nd 3rd 4th 5th Undergraduate
Male 12 12 15 20 11 6 22Female 7 16 11 9 8 7 29
Total 19 28 26 29 19 13 51
Table 1: Sample description.
Each participant completed several tasks. In Ranking tasks, participants received7 cards, each with a picture of one of the options. Participants were instructed torank these cards on a ranking board attached to their desk from most to leastpreferred.1 Once a participant was finished ranking the options, an experimenter
1The ranking board had a green smiling face on the far right and a yellow non-smiling faceon the far left, under which they were to place their most and least favorite cards, respectively.
13

transferred her rankings onto her tablet. There were three Ranking tasks. In theGoods-Ranking task, options were toys. In the Social-Ranking task, optionswere sharing rules for oneself and another child of the same age and gender inanother school. The sharing rules contained different amounts of a single good.To ensure this good was desirable, we selected the good that was ranked as firstfavorite in the Goods-Ranking task. Last, in the Risk-Ranking task, options werelotteries. In each lottery, the participant could earn a given number of toys with agiven probability. Probability was represented by a circle with outcomes shown inwhite and green, with the green area corresponding to the probability of winningthe good(s). Each circle corresponded to a spinner wheel.2 Again, to ensure thatoptions were desirable, we chose the good that was ranked second favorite in theGoods-Ranking task.
In Choice tasks, participants were presented with all pairwise combinations ofthe options in the corresponding Ranking task. We will refer to these tasks asGoods-Choice task, Social-Choice task3 and Risk-Choice task. In each trial,one option was displayed on the left side and another on the right of the tablet’sscreen. A participant could select their preferred option (by touching a button abovethe left or right options on their screen), or report to be indifferent between them (bytouching a button between the two options). The 21 pairs were presented randomly,both in terms of trial order and in terms of left-right presentation.4 These tasks arerepresented in Figure 1 and the specific options are displayed in Figures 6, 7, and8. In each Choice task, the 22nd trial was an attention trial. In this trial, subjectswere presented with their most frequently and least frequently chosen options fromthe preceding 21 trials.5
Previous studies have reported successful use of a smiley-face scale (e.g. Roedder et al., 1983;Neelankavil et al., 1985). We explained to subjects that in the case that they liked two or morecards “exactly the same,” they were to place the cards in the same area.
2Previous experiments on risk with children have used a similar design with a spinner wheel(Huber and Huber, 1987; Reyna and Ellis, 1994; Schlottmann and Anderson, 1994; Harbaugh etal., 2002).
3This task is a modified dictator game, similar to those in Andreoni and Miller (1998) orHarbaugh and Krause (2000).
4This was done to ensure that any effects we might have found could not be attributable to theorder of the trials or to the left-right position of the goods.
5As the 21 choices were being made, the computer tallied selections “for” and “against” eachof the options as follows: each time a given option was selected, it received 1 point and the otherreceived 0 point. Each time the indifference button was selected, both options received 0.5 point.At the end of the 21st trial, the tally for each option was summed and the options with the mostand least points were determined. In case of a tie, one of the options was chosen randomly.
14

Figure 6: Options used in the Goods-Choice and Goods-Ranking tasks.
Figure 7: Options used in the Social-Choice and Social-Ranking tasks.Participants were presented with choices involving sharing rules between self andother. For children, each circle represented a toy, personalized for each subject toensure desirability. For undergraduate students, each token represented $2.
For analysis, participants also completed a Transitive Reasoning task. This taskwas designed to measure levels of transitive reasoning. Several tasks have beenproposed in the literature (Bouwmeester and Sijtsma (2006)). It has been estab-lished that tasks with simultaneous presentation of premises are easier than thosewith sequential presentation of premises, and tasks with physical content are atleast as easy as those with verbal content (Bouwmeester and Sijtsma (2004)). Inorder to test the relation between transitive choice and transitive reasoning devoidof memory or operational reasoning requirements, we opted for a new design and weconstructed a test that does not require memory and is visually represented. Thetask consisted of seven questions of varying difficulty. Each of the seven questionsconsisted of two premises represented in two vignettes, and a third vignette with aresponse prompt. For each premise, participants were told that the animals shownin the vignette were at a party and the oldest wore a hat. They had to determinewhich animal in the third vignette should wear the hat. This is illustrated in Figure
15

Figure 8: Options used in the Risk-Choice and Risk-Ranking tasks. Par-ticipants were presented with choices involving lotteries. For children, each circlerepresented a toy, personalized for each subject to ensure desirability. For under-graduate students, each token represented $2.
9. Three of the seven questions did not require transitive reasoning and were in-cluded to test whether participants were paying attention. These are referred to as“pseudotransitivity” trials (Bouwmeester and Sijtsma (2006)). The remaining fourdid require transitive reasoning. Of the four transitivity questions, two of them wereless difficult and two were more difficult.
Figure 9: Transitive Reasoning Task. The animal wearing the hat is the oldestin each vignette on the left. The participant has to answer in the vignette on thebottom right by choosing the animal he thinks is the oldest given the informationon the left, or by reporting it cannot be known (?).
All subjects completed the task in the same order: (1) Goods-Choice task, (2)Goods-Ranking task, (3) Transitive Reasoning task, (4) Social-Choice task, (5)Social-Ranking task, (6) Risk-Choice task and (7) Risk-Ranking task. All taskswere untimed. Upon the completion of a given task by all subjects, instructionsfor the next task were given. To incentivize participants, we told them that it was
16
important to choose options they liked, because their choices would determine whatthey would receive at the end of the experiment. This was explained accessiblythrough a simple analogy.6 From each of the Choice tasks, one choice was randomlyselected by the computer and subjects received their selection in that trial. For theSocial-Choice task, we explained that each participant had been paired with anotherstudent, of their same gender and grade level, from another school in Los Angeles.7
We explained that the selected sharing rule would actually be implemented: wewould go to the other school and deliver to the other student the goods that wererepresented in the selected option.8 For the Risk-Choice task, we explained thattheir choice in the selected trial would be implemented and that the correspondingspinner wheel would be spun by a blindfolded assistant at the end of the sessionthat day. If the spinner arrow landed in the green part of the wheel, the subjectwould win the number of goods (or money, for the case of undergraduates) associ-ated to that choice. Otherwise, they would not win anything from this task. Thiswas implemented at the end of each session. Before leaving, we collected demo-graphic information consisting of “gender,” “grade,” “number of younger siblings,”and “number of older siblings.” All participants also received a fixed show-up fee.Children received their highest ranked item in the Goods-Ranking task while Un-dergraduate students received $5.
2.1.2 Analysis of transitivity violations
We collected data from all participants in the Goods-Choice and Goods-Rankingtasks. The tablets did not record the choices of two subjects in the Risk-Choice andRisk-Ranking tasks and one subject in the Social-Choice and Social-Ranking tasks.In what follows, we group participants into four categories: Kindergarten and 1stgraders in age group K-1st, 2nd and 3rd graders in age group 2nd-3rd, 4th and5th graders in age group 4th-5th, and Undergraduate students in age group U.
Transitivity violations. We measured consistency by counting the number oftransitive violations (TV). A choice is intransitive if a participant reveals to pre-
6Subjects were instructed to make honest choices about which goods they liked, because thecomputer kept track of what they chose and put all of these choices in a bag, after which it did theequivalent of “closing its eyes” and “picking one of the goods from the bag.” In the situation thatthey liked the two goods “exactly the same,” they were instructed to select the button displayedbetween the two goods. As we explained to subjects, this was analogous to telling the computerto make the choice of which good went into the bag on their behalf.
7Undergraduate were paired with a subject of another session, matched for gender.8The shared items were delivered to Foshay elementary school, a public school in LAUSD.
17

fer option A to option B, option B to option C, but not option A to option C.Intransitivity can be detected by considering all possible triplets of options and in-specting the choices made in the Choice-Tasks. Intransitivity is then measured bythe number of triplets that produce a violation. Considering triplets is enough toaccount for all violations of transitivity. Given we allowed participants to expressindifference between options, we allocated 0.5 violation to triplets involving weakviolations, that is when we observed choices such that A was chosen over B, B waschosen over C, but A was indifferent to C. We first counted the number of timeschoices between triplets of items were intransitive for each subject in each Choicetask and then, we computed the average number of violations by age group andChoice task. The results are represented in Figure 2.
In the Goods domain, we found a significant improvement between consecutiveage groups, with 4th-5th being at the same level of performance as U subjects.More specifically, participants in K-1st had significantly more violations than par-ticipants in 2nd-3rd (p-value=0.0050), participants in 2nd-3rd had significantlymore violations than participants in 4th-5th (p-value=0.0355), but violations of4th-5th and U groups were not significantly different (p-value=0.0835). In the So-cial domain, a similar pattern was observed. More specifically, TV were significantlydifferent between the K-1st age group and the 4th-5th age group (p-value=0.0162),between the K-1st age group and U age group (p-value=0.0002) and between the2nd-3rd age group and the U age group (p-value=0.0048), while all other TV werenot statistically significantly different. In the Risk domain however, there was noapparent improvement. No age group of children had significantly more violationsthan U.
When we compared TV across domains, we found that participants in the K-1stage group had significantly more violations in the Goods than in the Social domain(p=0.0009). A similar result held for the 2nd-3rd age group, though it was lesspronounced (p=0.0117). Participants in the U group also had significantly moreviolations in the Risk than in the Goods (p<0.0001) or Social domains (p<0.0001).
Analysis of transitivity in the Goods domain. We used the explicit rankingelicited in the Goods-Ranking task to assess the frequency with which options wereinvolved in transitive violations as a function of their ranking. For each transitivityviolating triplet, we assigned a score of 1 to its 3 corresponding pairwise choices.Each pair of options was then allocated the percentage of times it was involved ina violation (the number of times it obtained a score of 1 over all possible times).By repeating this exercise for all participants and then averaging over all of them,we obtained the percentage of times violations occurred in choices between options
18
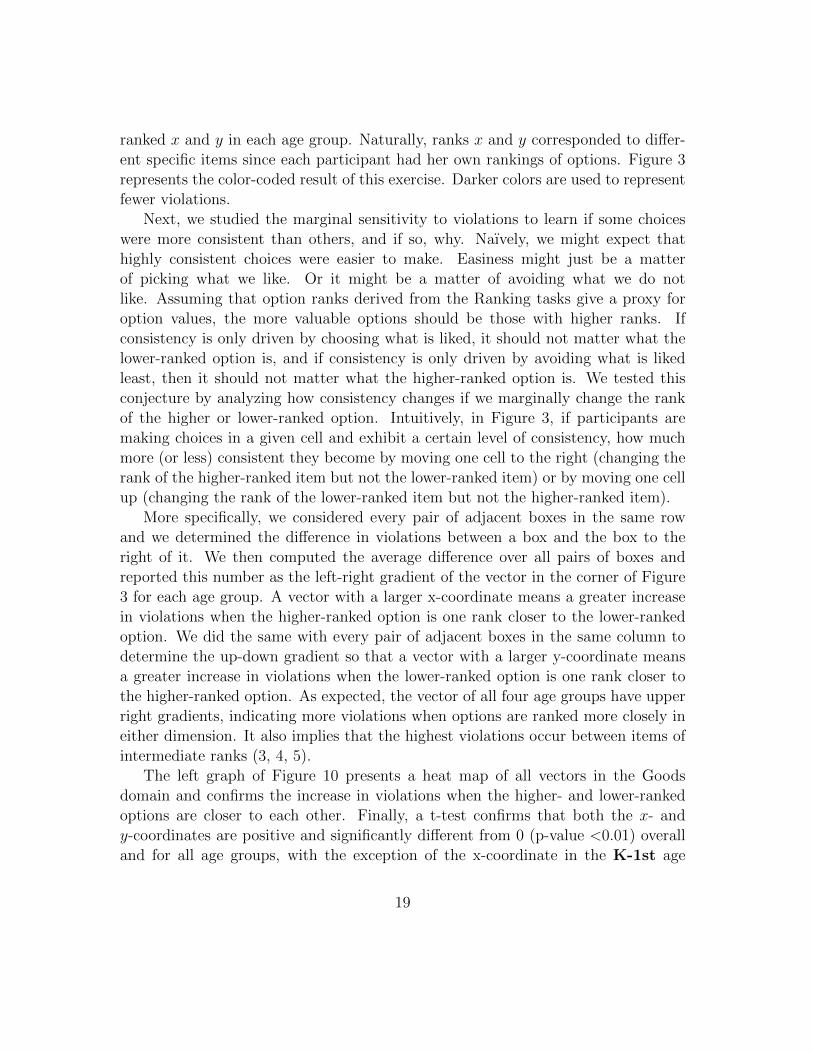
ranked x and y in each age group. Naturally, ranks x and y corresponded to differ-ent specific items since each participant had her own rankings of options. Figure 3represents the color-coded result of this exercise. Darker colors are used to representfewer violations.
Next, we studied the marginal sensitivity to violations to learn if some choiceswere more consistent than others, and if so, why. Naıvely, we might expect thathighly consistent choices were easier to make. Easiness might just be a matterof picking what we like. Or it might be a matter of avoiding what we do notlike. Assuming that option ranks derived from the Ranking tasks give a proxy foroption values, the more valuable options should be those with higher ranks. Ifconsistency is only driven by choosing what is liked, it should not matter what thelower-ranked option is, and if consistency is only driven by avoiding what is likedleast, then it should not matter what the higher-ranked option is. We tested thisconjecture by analyzing how consistency changes if we marginally change the rankof the higher or lower-ranked option. Intuitively, in Figure 3, if participants aremaking choices in a given cell and exhibit a certain level of consistency, how muchmore (or less) consistent they become by moving one cell to the right (changing therank of the higher-ranked item but not the lower-ranked item) or by moving one cellup (changing the rank of the lower-ranked item but not the higher-ranked item).
More specifically, we considered every pair of adjacent boxes in the same rowand we determined the difference in violations between a box and the box to theright of it. We then computed the average difference over all pairs of boxes andreported this number as the left-right gradient of the vector in the corner of Figure3 for each age group. A vector with a larger x-coordinate means a greater increasein violations when the higher-ranked option is one rank closer to the lower-rankedoption. We did the same with every pair of adjacent boxes in the same column todetermine the up-down gradient so that a vector with a larger y-coordinate meansa greater increase in violations when the lower-ranked option is one rank closer tothe higher-ranked option. As expected, the vector of all four age groups have upperright gradients, indicating more violations when options are ranked more closely ineither dimension. It also implies that the highest violations occur between items ofintermediate ranks (3, 4, 5).
The left graph of Figure 10 presents a heat map of all vectors in the Goodsdomain and confirms the increase in violations when the higher- and lower-rankedoptions are closer to each other. Finally, a t-test confirms that both the x- andy-coordinates are positive and significantly different from 0 (p-value <0.01) overalland for all age groups, with the exception of the x-coordinate in the K-1st age
19

group. Overall, in the Goods domain, all groups were significantly driven by therank of the lower-ranked option, and all groups except K-1st were driven by therank of the higher-ranked option.
Goods Social Risk
Figure 10: Sensitivity analysis
Analysis of transitivity in the Social domain. An option in the Social domain canbe decomposed into three attributes that can be visually assessed through counting:the reward to self, the reward to other, and the total reward. When comparingattributes, a participant can use three simple rules: pick the maximum, pick theminimum, or be indifferent. A participant could apply a rule to a single attribute(a policy such as “pick option with maximum reward for self”); a participant couldalternatively apply a rule to one attribute then move to a second attribute andpossibly apply a different rule (a policy such as “pick option with maximum re-ward for self and if they are the same, pick option with maximum total reward”).We defined 16 such policies, but only 3 were used by subjects: “maximize amountfor self, then minimize amount for other,” “maximize amount for self, then maxi-mize amount for other” and “maximize amount for self, irrespective of amount forother.” We counted all participants who complied exactly with any such policy andthose who made exactly one mistake with respect to it. We will call these partici-pants heuristic users, or simple policy users. Among them, 61% chose the heuristic“maximize amount for self, then minimize amount for other.” We removed thesesubjects from our sample, leaving us 125 participants. We computed TV by agegroup and found that the results were now similar to those obtained in the Goodsdomain. The development of consistency followed the same pattern: participants inthe K-1st age group were significantly more inconsistent than all older participants(p-value=0.0060 for the comparison with 2nd-3rd, p-value=0.0080 for the compar-ison with 4th-5th and p-value < 0.0001 for the comparison with U). Participantsin the 2nd-3rd age group had significantly more violations than participants in theU age group (p-value=0.01441) and participants in the 4th-5th age group were notsignificantly different from participants in the U age group (p-value=0.1205). Thisis represented in Figure 4. We repeated the heat map analysis we performed on the
20

Goods-Choice task. The result is represented in Figure 5(A).We also performed the same marginal sensitivity analysis as in the Goods do-
main after removing heuristic users. The x-coordinates were positive and signifi-cantly different from 0 (p-value < 0.01), overall and for all age groups except forparticipants in the K-1st age group. However, and contrary to the Goods domain,the y-coordinates were not significantly different from 0 for any age group. Thissuggests that participants had a very clear idea of what they liked best but a lessclear idea of what they liked least in the Social domain. The result can also be seenin the heat map representation of the vectors (Figure 10). Overall, in the Social do-main, no group was driven by the rank of the higher-ranked option, but all groupsexcept for the K-1st age group were driven by the rank of the lower-ranked option.
Analysis of transitivity in the Risk domain. The procedure to elicit simple poli-cies was the same. In the Risk domain, there are two attributes per option, rewardamount and probability, and three simple rules, pick the maximum, pick the mini-mum, or be indifferent. We defined 6 policies, but only 4 were ever used by subjects:“maximize the amount, irrespective of the probability,” “maximize the probability,then maximize the amount,” “minimize the amount, irrespective of the probability,”and “minimize the probability, irrespective of the amount.” We counted all partici-pants who complied exactly with any such policy as well as those who made exactlyone mistake with respect to a policy. Among those, 89% chose the policy “maximizethe amount irrespective of the probability.” We removed these subjects from oursample, leaving us 128 subjects. We analyzed TV again and found that violationsby the U group were different than those by any younger group (p-value=0.0019 forthe comparison with K-1st, p-value=0.0050 for the comparison with 2nd-3rd, andp-value=0.0153 for the comparison with 4th-5th), but that the children groups allperformed at similar levels. This is represented in Figure 4. We also repeated theheat map analysis. The result is represented in Figure 5(B).
Again, we performed a marginal sensitivity analysis after removing heuristicusers and found the opposite result than in the Social domain: y-coordinates weresignificantly different from 0 overall and for two age groups (4th-5th and U, t-test p-values<0.05), whereas x-coordinates were not different from 0 in any agegroup (see Figure 10). This means that in the Risk domain, participants had moreconsistent rankings when their least favorite option was involved than when theirmost favorite option was involved. Overall, in the Risk domain, no one was drivenby the rank of the lower-ranked option; 4th-5th and U were driven by the rank ofthe higher-ranked option.
Transitivity violations across domains. The aggregate analysis of TV indicated
21
that consistency improves with age. We addressed the question of how individualscores vary across domains to assess whether participants who commited relativelymore violations in one domain were also those who committed relatively more viola-tions in a different domain. Said differently, we wanted to know whether consistencywas driven (at least partially) by a common factor or whether it resulted from thedevelopment of domain-specific skills. When considering the full sample, we foundthat TV in the Goods and Risk domains were not correlated with one another,while TV in the Goods and Social or TV in the Risk and Social domains were(Pearson coefficient=0.38 and 0.3, respectively; p-value <0.0001 for both). Whenwe removed heuristic users, we found that TV were significantly correlated acrossdomains (Pearson coefficient =0.36, p-value=0.0006 between the Goods and Riskdomains, Pearson coefficient=0.43, p-value <0.0001 between the Goods and Socialdomains, and Pearson coefficient=0.49, p-value <0.0001 between the Risk and So-cial domains) suggesting that participants’ consistency was at least partially drivenby the development of a skill useful in all domains.
Comparison with random play. To assess whether participants committing manyviolations might have been acting randomly, we simulated random players. Depend-ing on the probability we assigned to their expressing indifference, the number ofTV was between 8 and 10, substantially above the actual numbers obtained evenamong the most inconsistent participants. This was consistent with earlier literatureon consistency in children (Harbaugh et al. (2001)).
2.1.3 Other measures of choice consistency
Choice reversals and choice removals. We computed two measures of violation sever-ity for each subject. The first of these counts the number of choices that need to bereversed to restore transitivity. To compute that number, an algorithm sequentiallychanges the choices made in each trial, and computes a TV score after each change.If the score is 0 at any point, the algorithm stops. After all single trials have beenexhausted, the algorithm repeats the procedure over pairs of trials, then triplets andso on. We found that choice reversals followed a similar pattern across age groups asTV (Figure 11), and were highly correlated to it in the Goods-Choice task (Pearson= 0.95, Spearman = 0.98, p <0.0001), in the Social-Choice task (Pearson = 0.93,Spearman = 0.98, p < 0.0001), and in the Risk-Choice task (Pearson = 0.92, Spear-man = 0.95, p < 0.0001). The second of these severity measures counts the numberof choices that need to be removed to restore transitivity. We used an algorithmsimilar to that for counting choice reversals. As with choice reversals, this measure
22

also closely reflects the age patterns observed with TV (see Figure 12) and is alsohighly correlated with TV for all three Choice tasks.
Cho
ice
Reve
rsal
s pe
r Sub
ject
K & 1st 2nd & 3rd 4th & 5th U
Age Group
GoodsSocialRisk
Choice-Task
Figure 11: Choice reversals across domains and age.
Implicit ranking and choice noisiness. From a subject’s selections in a Choicetask, it is possible to extract their implicit ranking for the options in that task.We computed this ranking by tallying their selections “for” and “against” eachof the options as follows: each time a given option was selected or indifferencewas expressed, 1 point or 0.5 point was added to the running tally of that option,respectively. The tallied points for each option were summed, and the options wereordered according to this sum, giving the subject’s implicit ranking. The subject’schoices were then checked for inconsistencies against their implicit ranking. For eachchoice, a score of 1, 0.5, or 0 was possible. Suppose the tally of choices producedthe following implicit ranking in order of lowest to highest tally score: C, G, B, A,E, F, D. Now consider the trial offering a choice between options A and B. If A waschosen over B, the subject was consistent with their implicit ranking and received ascore of 0 for that trial. If instead, the indifference button was selected, the subjectwas weakly inconsistent with their implicit ranking and received a score of 0.5 forthat trial. If B was chosen over A instead, the subject was inconsistent with theirimplicit ranking and received a score of 1 for that trial. We called the overall scorea classification error. Notwithstanding the endogeneity issues with this measure (weuse choices to extract a ranking then check that ranking against the very choices
23

K & 1st 2nd & 3rd 4th & 5th U
Age Group
Cho
ice
Rem
oval
s pe
r Sub
ject
GoodsSocialRisk
Choice-Task
Figure 12: Choice removals across domains and age.
that were used to create it), it provides a measure of choice noisiness. As can beseen in Figure 13, the age pattern of choice inconsistencies with implicit rankingsclosely resembles that of TV; participants who make more TV are those who aremore “noisy” (make more mistakes) around their implicit ranking.
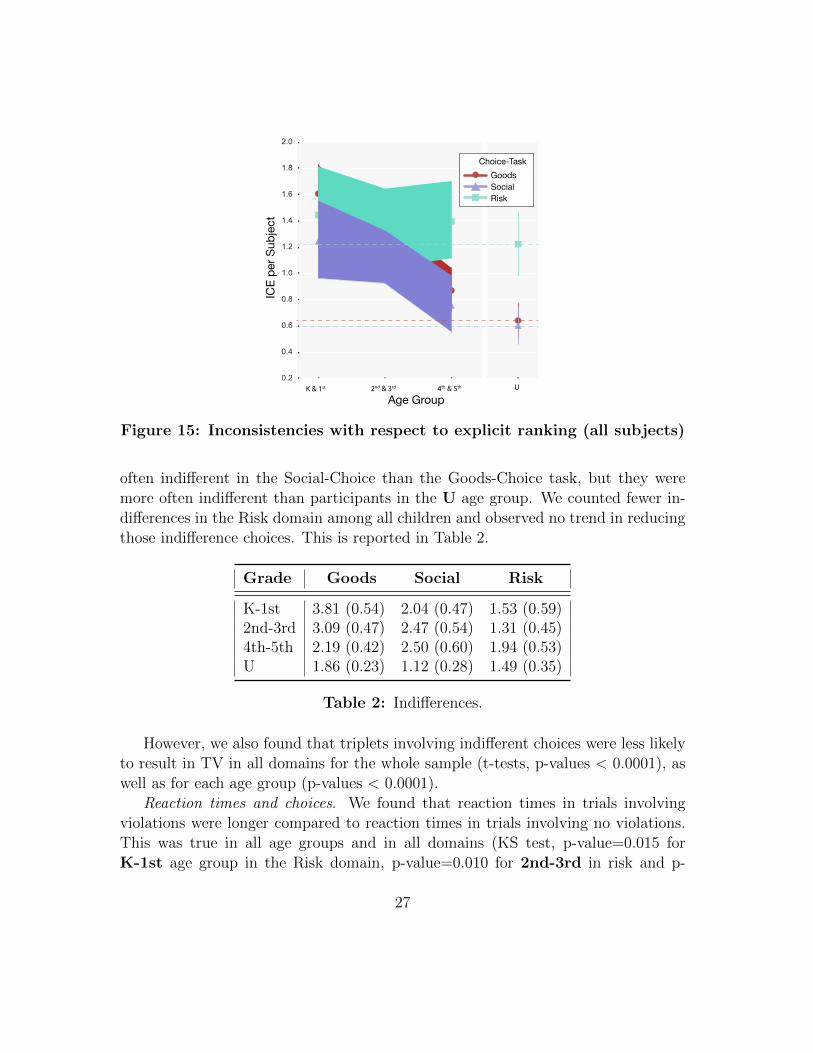
Explicit vs. implicit ranking. The implicit ranking is revealed by choices and doesnot need to coincide with the explicit ranking elicited in a Ranking task. For eachparticipant and task, we computed a measure of distance between those rankings.Suppose for instance that a participant made choices in a Choice task so that theirimplicit ranking for options A-G was 3, 5, 1, 7, 4, 6, 2. Suppose now that theirexplicit ranking was 2, 6,1, 7, 4, 5, 3. We assigned to each option a score representingthe difference between its rank in the implicit and explicit rankings (e.g. option Awas assigned 3-2=1), and then we computed the average of all options’ scores aseach subject’s discrepancy score. Figure 14 describes those scores by domain andage group. As can be seen from the graph, these closely followed the pattern of TV.In the Goods domain, the ability to choose according to one’s explicitly disclosedpreferences was found to gradually develop. The pattern was similar in the Socialdomain. However, discrepancies remained at all ages in the Risk domain, suggestinga persistent inability to draw choices from explicit preferences.
Explicit rankings and choices. As an additional measure, we evaluated inconsis-tencies between choices in Choice tasks and the explicit rankings elicited in Ranking
24

K & 1st 2nd & 3rd 4th & 5th U
Age Group
ICR
per S
ubje
ct
GoodsSocialRisk
Choice-Task
Figure 13: Classification errors (all subjects).
tasks. This measure was computed in a similar fashion as for inconsistencies withrespect to explicit rankings. In the Goods domain, we found that participants inthe K-1st and 2nd-3rd age groups had relatively more difficulty making choicesconsistent with their explicit rankings compared to older participants (p-values <0.0167 for all comparisons). A similar story held qualitatively in the Social domain,except that the participants in the K-1st and 2nd-3rd age groups were not signifi-cantly different from each other, nor were the older participants in groups 4th-5thand U, suggesting a less gradual development of the ability to choose from an ex-plicit ranking. We found that inconsistencies in the Social domain were followingthe same trend as inconsistencies in the Goods domain after removing heuristicusers. In the Risk domain, we found that the level of inconsistencies was high andsimilar across all subjects: they were not able to make choices consistent with theirexplicit rankings. This result changed when we removed heuristic users: they werebecoming more capable over time to express their explicit rankings in their choices.Nevertheless, the level of inconsistencies remained higher than in the Goods domainfor all ages. Inconsistencies are illustrated in Figure 15.
Relationship between measures of consistency. Our measures were all highly cor-related: a high number of TV was associated with a high number of inconsistenciesbetween explicit rankings and choices (Pearson=0.79, p-value<0.0001 in the Goodsdomain, Pearson=0.69, p-value<0.0001 in the Social domain and Pearson=0.72,
25

K & 1st 2nd & 3rd 4th & 5th U
Age Group
Disc
repa
ncy
Scor
e pe
r Sub
ject
GoodsSocialRisk
Choice-Task
Figure 14: Discrepancies between explicit and implicit rankings (all sub-jects).
p-value<0.0001 in the Risk domain), which was captured by a high discrepancybetween implicit and explicit ranking (Pearson=0.61, p-value<0.0001 in the Goodsdomain, Pearson=0.54, p-value<0.0001 in the Social domain and Pearson=0.60, p-value<0.0001 in the Risk domain) and a large misclassification error between actualchoices and the closest ranking consistent with it (Pearson=0.95, p-value<0.0001 inthe Goods domain, Pearson=0.93, p-value<0.0001 in the Social domain and Pear-son=0.93, p-value<0.0001 in the Risk domain). These results were very similarwhen we removed heuristic users.
Overall, although we feel that TV is the best measure of choice consistency,the results presented in the main text are robust to other measures of violations orinconsistent decision-making. Intransitivity was associated to the inability to makechoices consistent with rankings, both implicit and explicit.
2.1.4 Other analysis of choices
Indifference. We checked whether age had an influence on the tendency to be in-different and whether this was associated with TV. In the Goods domain, we foundthat the number of indifferent choices decreased over time from an average of 3.8 inK-1st to an average of 1.9 among U. Participants from K to 5th grades were less
26
K & 1st 2nd & 3rd 4th & 5th U
Age Group
ICE
per S
ubje
ct
GoodsSocialRisk
Choice-Task
Figure 15: Inconsistencies with respect to explicit ranking (all subjects)
often indifferent in the Social-Choice than the Goods-Choice task, but they weremore often indifferent than participants in the U age group. We counted fewer in-differences in the Risk domain among all children and observed no trend in reducingthose indifference choices. This is reported in Table 2.
Grade Goods Social Risk
K-1st 3.81 (0.54) 2.04 (0.47) 1.53 (0.59)2nd-3rd 3.09 (0.47) 2.47 (0.54) 1.31 (0.45)4th-5th 2.19 (0.42) 2.50 (0.60) 1.94 (0.53)U 1.86 (0.23) 1.12 (0.28) 1.49 (0.35)
Table 2: Indifferences.
However, we also found that triplets involving indifferent choices were less likelyto result in TV in all domains for the whole sample (t-tests, p-values < 0.0001), aswell as for each age group (p-values < 0.0001).
Reaction times and choices. We found that reaction times in trials involvingviolations were longer compared to reaction times in trials involving no violations.This was true in all age groups and in all domains (KS test, p-value=0.015 forK-1st age group in the Risk domain, p-value=0.010 for 2nd-3rd in risk and p-
27

value <0.0001 for all other age groups and domains), suggesting that participantswere more confused when they ended up getting a violation. We also found thatreaction times were usually longer when participants pressed the indifference buttoncompared to when they made a left or right selection (KS test, p-value<0.0001 forage groups above the 2nd-3rd age group). However, among trials in which theindifference button was pressed, those involved in a violation took slightly less timethan those not involved in a violation (KS test, p-value=0.053). This was consistentwith the results obtained regarding indifference: participants were spending moretime on those choices where they ended up hitting the indifference button andavoiding a violation. Last, heuristic users were quicker than non-heuristic users(KS test, p-value < 0.0001).
These additional measures confirmed the fact that intransitivity was associatedwith confusion about one’s preferences, which decreased with age.
2.1.5 Heuristic users
From the 59 subjects who used heuristics in the Social domain and the 55 who usedheuristics in the Risk domain, we found that only 19 used heuristics in both domains.We also compared TV in the Goods domain by heuristic users and non-heuristic usersand found no significant difference. Therefore, centration and the development ofthe value-based decision-making system appeared to be uncorrelated. However,we found that heuristic users were very distinguishable from non-heuristic users interms of discrepancies between implicit and explicit rankings (t-test p-value< 0.0001in both Risk and Social). This means that they were explicitly revealing preferencesthat were not supported by their choices (hence, implicit rankings).
2.1.6 Evolution of preferences
Evolution of preferences in the Social domain. We found that lexicographic prefer-ences were common in the Social domain. The most common policy was to maximizethe reward for self, but its usage changed over time. Indeed, the preference for giv-ing seemed to be developing: small children tended to maximize their own rewardsystematically and, other things being equal, they also preferred smaller rewardsfor others. Older participants however selected larger rewards for others. Interest-ingly, we did not find any evidence that participants were using the efficient policy(maximizing social welfare) but we found that they came closer to that policy withage, with participants in the 4th-5th age group being similarly close to the efficient
28

policy as participants in the U group (differences between these two groups werenot significant).
The favorite option, as revealed by implicit rankings, also changed over time.Indeed, for all ages, Option (4,0) and Option (3,3) were the most popular, but thefrequency of (4,0) decreased while the frequency of (3,3) increased with age (Table3). The least favorite option changed over time as well. For all ages, Options (0,4)and (0,5) were the least popular but the frequency of (0,5) tended to decrease whilethe frequency of (0,4) tended to increase.
Option (4,0) Option (3,3)
K-1st 0.65 0.332nd-3rd 0.40 0.584th-5th 0.50 0.50U 0.33 0.73
Table 3: Revealed preferred options in the Social domain (from implicit rankings)
Our Social-Choice task was also rich enough to study the evolution of prosocialbehavior. In particular, we could study whether participants were prosocial (chose(3,3) over (3,1)), willing to share (chose (3,1) over (4,0)) or were envious (chose(0,4) over (0,5)). We could therefore conduct a similar analysis as in Fehr et al.(2008) and determine a type for each subject as a combination of decisions in these3 choices. As in Fehr et al. (2008), a participant was “strongly egalitarian” if shechose (3,3), (3,1), and (0.4) and “weakly egalitarian” if she chose (3,3), (4,0), and(0,4). A participant was “strongly generous” if she chose (3,3), (3,1), and (0,4)and “weakly generous” if she chose (3,3), (4,0), ad (0,4). Last, a participant was“spiteful” if she chose (3,1), (4,0), and (0,5). We found similar results as in Fehr etal. (2008) for the range of ages in common between the two studies: young childrenwere mostly spiteful, consistent with the centration hypothesis, while older childrenwere mostly egalitarian, consistent with greater integrative reasoning. Our oldestparticipants were dominantly generous. This result is represented in Figure 16.
Evolution of preferences in the Risk domain. We found that lexicographic pref-erences were also common in the Risk domain. The most common policy was tomaximize reward but, as in the Social domain, its usage changed over time. Morethan 20% of participants in the K-1st and 2nd-3rd age groups used it against lessthan 10% in the 4th-5th and U age groups. We chose maximization of expectedvalue (E(V)) as a template of integrative reasoning, but strictly speaking no partic-
29

Figure 16: Evolution of Prosocial behavior.
ipant maximized E(V). Only two subjects were one step away from the policy andthey both had positive TV. For each participant, we counted the number of choicesthat maximized E(V) and averaged this count across participants in each Choicetask and each age group. We found that participants in the K-1st, 2nd-3rd and4th-5th age groups were making significantly more choices inconsistent with themaximization of E(V) compared to participants in the U age group. In particular,after removing heuristic users, we found that each group of children used policiesthat were farther away from E(V) compared to participants in the U age group(t-test, p-value <0.0001 for comparison with K-1st, p-value=0.0036 for comparisonwith 2nd-3rd and p-value=0.0029 for comparison with 4th-5th).
When looking at the favorite option revealed by implicit rankings, we found thatchildren were transitioning gradually (Table 4) from the option involving the largestquantity (12, 12.5%) to the option exhibiting the largest expected value (5,50%).Across all ages, option (1,100%) was the least favorite option for most children.Interestingly, we also found that option (12, 12.5%) was the most favorite option ofmany and the least favorite of others at the same time.
Option (12,12.5%) Option (5,50%)
K-1st 0.60 0.132nd-3rd 0.44 0.354th-5th 0.28 0.53U 0.16 0.82
Table 4: Revealed preferred options in the Risk domain (from implicit rankings)
These results taken together showed that behavior was changing from choices
30

consistent with very simple policies to choices resulting from trade-offs and inte-grative thinking. The centration effect observed in young participants made themappear selfish in the Social domain and as risk-loving in the Risk domain. Theseattitudes changed with age.
2.1.7 Catch trials.
Remember, catch trials featured a subject’s most- and least-preferred options fromthe 21 pairwise choices of each Choice task. If a subject was paying attention, theyshould have chosen their most frequently chosen option over their least frequentlychosen option. In that trial, subjects received an attention score of 1, 0.5, or 0 ifthey selected their least frequently chosen option, the indifference button, or theirmost frequently chosen option, respectively. We found that most children wereattentive: 70% in K-1st, 76% in 2nd-3rd, 84% in 4th-5th and 100% U answeredall catch trials correctly. Most of those who failed got a 0.5 attention score, andno children failed all 3. We also found that performance on attention trials andTV was correlated in the Goods-Choice task (Pearson = 0.54, Spearman = 0.43,p-value < 0.0001), in the Social-Choice task (Pearson = 0.40, Spearman = 0.20,p-value < 0.01), and in the Risk-Choice task (Pearson = 0.36, Spearman = 0.32, p-value < 0.0001), suggesting a relationship between the ability to choose consistentlyand attention mechanisms. In the same lines, discrepancies between explicit andimplicit rankings were correlated in all domains with catch trials (Pearson=0.38,Spearman = 0.34, p-value < 0.0001 in the Goods domain, Pearson=0.32, Spearman= 0.21, p-value < 0.01 in the Social domain and Pearson=0.27, Spearman = 0.30,p-value < 0.001 in the Risk domain).
These results suggest that attentiveness as measured by catch trials was a strongpredictor of intransitivity and it was also strongly associated with the ability tochoose according to explicit rankings
2.1.8 Transitive reasoning
We counted for each participant the number of mistakes accumulated in each levelof difficulty of the transitive reasoning task. In all three levels of difficulty of thereasoning task, the K-1st group, 2nd-3rd group, and 4th-5th group accrued signif-icantly more errors on average than the U group (p-value<0.001, p-value<0.05, andp-value<0.05, respectively). Participants in the K-1st group made more mistakeson the most difficult reasoning trials than they did on the easy or medium trials (p-value=0.02 and p-value=0.0001, respectively). Within the other age groups however
31

(with the exception of the 2nd-3rd group which had more mistakes on easy thanon difficult trials (p-value = 0.02)), the average error counts were similar across trialdifficulty. These results are summarized in Figure 17.
We found that performance in the transitive reasoning task was correlated withattentiveness. This was true for all levels of difficulty together (Pearson coeffi-cient=0.22, p-value < 0.01 for all trials and Pearson coefficient=0.20, p-value <0.01 for the most difficult trials). We also found that it was correlated with the levelof discrepancies between implicit and explicit rankings in each domain (Pearsoncoefficient=0.33, p-value < 0.0001 in the Goods domain, Pearson coefficient=0.20,p-value < 0.01 in the Social domain and Pearson coefficient=0.17, p-value < 0.05in the Risk domain). Last, we found that catch trials in the Goods domain andage were predictors of performance in the most difficult transitive reasoning trials(Table 5).
Figure 17: Performance in the transitive reasoning task.
Overall, transitive reasoning was associated with the same explanatory variablesas transitive decision-making.
2.1.9 The determinants of transitive choices
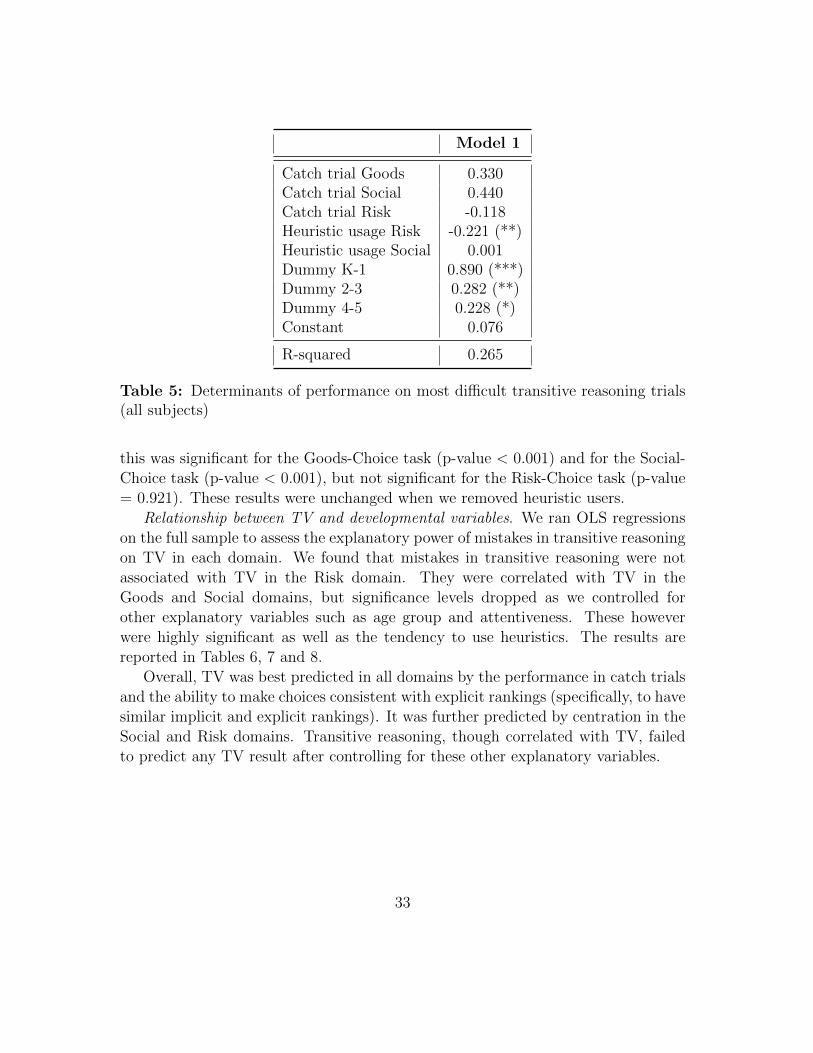
Relationship between TV and demographic variables. Given TV covaries across do-mains, we looked for possible common explanatory variables of intransitivity. Tothis end, we ran OLS regressions treating TV in each domain as the variable tobe explained by demographic characteristics. Those included age group, gender,number of younger siblings, and number of older siblings. We found that the onlysignificant explanatory variable for TV was age group. Moving from one age groupto the next was associated with a decreased number of TV for all three choice tasks;
32
Model 1
Catch trial Goods 0.330Catch trial Social 0.440Catch trial Risk -0.118Heuristic usage Risk -0.221 (**)Heuristic usage Social 0.001Dummy K-1 0.890 (***)Dummy 2-3 0.282 (**)Dummy 4-5 0.228 (*)Constant 0.076
R-squared 0.265
Table 5: Determinants of performance on most difficult transitive reasoning trials(all subjects)
this was significant for the Goods-Choice task (p-value < 0.001) and for the Social-Choice task (p-value < 0.001), but not significant for the Risk-Choice task (p-value= 0.921). These results were unchanged when we removed heuristic users.
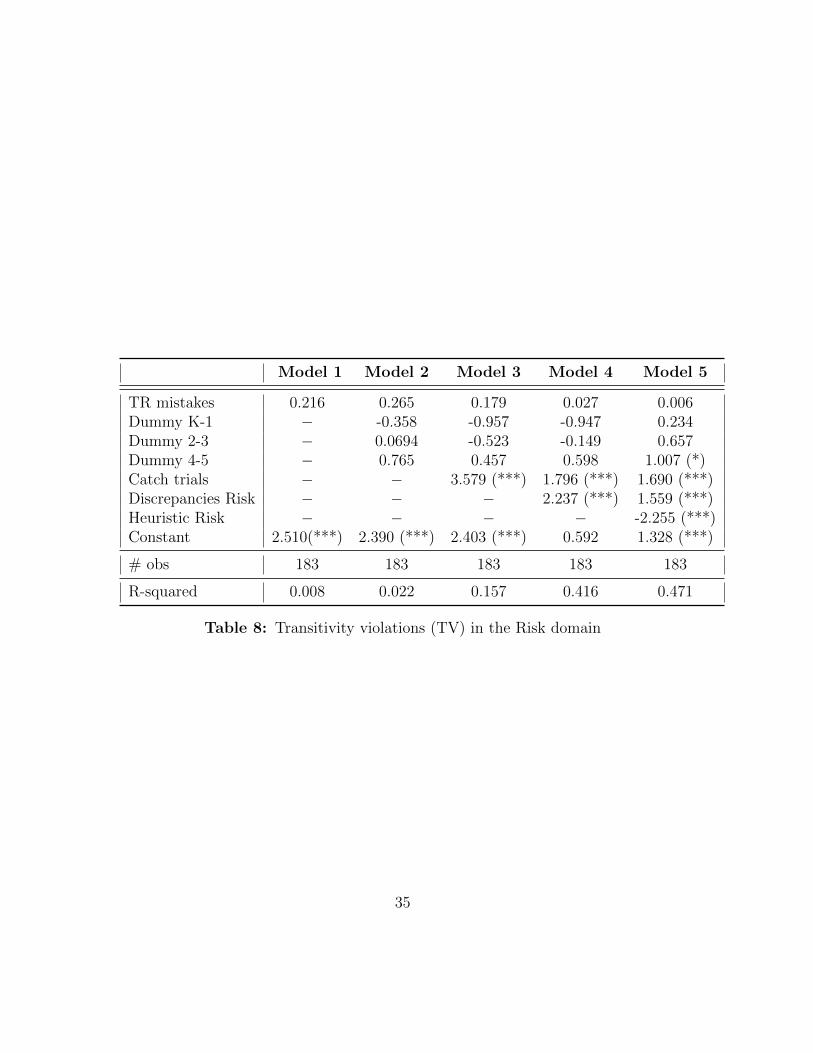
Relationship between TV and developmental variables. We ran OLS regressionson the full sample to assess the explanatory power of mistakes in transitive reasoningon TV in each domain. We found that mistakes in transitive reasoning were notassociated with TV in the Risk domain. They were correlated with TV in theGoods and Social domains, but significance levels dropped as we controlled forother explanatory variables such as age group and attentiveness. These howeverwere highly significant as well as the tendency to use heuristics. The results arereported in Tables 6, 7 and 8.
Overall, TV was best predicted in all domains by the performance in catch trialsand the ability to make choices consistent with explicit rankings (specifically, to havesimilar implicit and explicit rankings). It was further predicted by centration in theSocial and Risk domains. Transitive reasoning, though correlated with TV, failedto predict any TV result after controlling for these other explanatory variables.
33

Model 1 Model 2 Model 3 Model 4
TR mistakes 0.878 (***) 0.393 (**) 0.297 (*) 0.188Dummy K-1 − 3.049 (***) 2.497 (***) 1.376 (**)Dummy 2-3 − 1.383 (**) 0.824 0.221Dummy 4-5 − 0.146 -0.139 -0.275Catch trial − − 3.460 (***) 2.565(***)Discrepancies − − − 2.397 (***)Constant 1.359 (***) 0.693 (*) 0.708 (**) -0.403
# obs 185 185 185 185
R-squared 0.127 0.242 0.359 0.485
Table 6: Transitivity violations (TV) in the Goods domain
Model 1 Model 2 Model 3 Model 4 Model 5
TR mistakes 0.359 (***) 0.115 0.0685 0.0163 -0.0184Dummy K-1 − 1.492 (***) 1.176 (**) 0.775(*) 1.010 (**)Dummy 2-3 − 0.738 (*) 0.418 -0.034 0.023Dummy 4-5 − 0.215 0.0478 0.0312 0.122Catch trial − − 1.937 (***) 1.330 (***) 1.311 (***)Discrepancies − − − 1.654 (***) 1.250(***)Heuristic usage − − − − -1.003 (***)Constant 0.894 (***) 0.531 (*) 0.538 (**) -0.213 0.331
# obs 184 184 184 184 184
R-squared 0.045 0.103 0.187 0.364 0.379
Table 7: Transitivity violations (TV) in the Social domain
34
Model 1 Model 2 Model 3 Model 4 Model 5
TR mistakes 0.216 0.265 0.179 0.027 0.006Dummy K-1 − -0.358 -0.957 -0.947 0.234Dummy 2-3 − 0.0694 -0.523 -0.149 0.657Dummy 4-5 − 0.765 0.457 0.598 1.007 (*)Catch trials − − 3.579 (***) 1.796 (***) 1.690 (***)Discrepancies Risk − − − 2.237 (***) 1.559 (***)Heuristic Risk − − − − -2.255 (***)Constant 2.510(***) 2.390 (***) 2.403 (***) 0.592 1.328 (***)
# obs 183 183 183 183 183
R-squared 0.008 0.022 0.157 0.416 0.471
Table 8: Transitivity violations (TV) in the Risk domain
35