value-based management considerations in the listing of an
TRANSCRIPT

Value-based management considerations in the listing
of an agricultural company on the food producers
sector of the JSE Ltd
W J Jacobs
Dissertation submitted in partial fulfilment of the requirements for the degree Master of
Business Administration at the Potchefstroom campus of the North-West University
Study leader: Prof I Nel
July 2011

i
Abstract
In order for a company to operate effectively it needs to have sufficient capital, structured
to such an extent that capital charge in the form of interest cost and required return is
minimised. A strong capital base lays the foundation for the ability to generate revenue
by implementation and management of a well laid out strategy to trade in either goods or
services. Capital is a depletable resource and usually limited in respect of availability.
The use of capital for income generation will be a process applying the capital to the
most profitable project or venture. The cost of capital can be defined as the possible
profit generated from an alternative application. This cost is defined as opportunity cost
and it is mitigated by the risk involved in its application. Opportunity cost can also be
related to the various investment choices which owners of capital have. Investors will
base a decision on the risk return relationship of possible investments. Should an
investment yield an acceptable return for the perceived risk, an investor will choose that
particular investment. This will obviously depend on whether there are alternatives
producing similar or better yields at similar or lower risk levels.
Having an appropriate strategy will only yield acceptable returns through effective
balance sheet management and decision-making. Balance sheet management entails
the use of debt and equity finance in a way which results in the most profitable financing
method or the lowest cost of capital. Equity finance entails the use of shareholders’
funds for financing capital requirements. This is usually done by issuing and selling
shares over the counter or in the official market in order to finance operating
requirements or to fund investments. For a company to list it means offering its shares to
the public on an open trading system. In essence this means that investors have to be
recruited. In South Africa, this trading system is the Johannesburg Securities Exchange
(JSE)
The purpose of this research is to identify the financial variables or value drivers through
which management of farming product traders or food-producer companies can evaluate
the expected performance of its shares, should it be listed on the JSE. The results were
achieved by defining a comprehensive set of financial diagnostic, accounting and
valuation ratios and testing it against the response of the share price. The test was done
on the basis of developing multiple linear regression models for each relevant year and

ii
all companies listed in the particular sector on the JSE, in the defined period. Net
Operating Profit after Tax (NOPAT) per share emerged as the most reliable measure of
share performance.
Second on the list was residual income calculations and more specifically, derivatives of
EVA® principles as developed by Stern and Steward. Research into factors influencing
share prices resulted in non-financial factors also coming to light. These factors,
however, impact on the long term financial performance.
The end result was a proposal to break down NOPAT into its key elements and identify
the operations where these elements can be managed. A system of incentive driven
measures is to be developed to drive behaviour, possibly through a balanced score card
in order to introduce share value-based management. This will ensure that there are no
surprises by the time shares are introduced to the open market.

iii
Bestuursopsomming
Vir ‘n maatskappy om effektief bedryf te word, moet dit voldoende kapitaal hê wat
sodanig gestruktureer is dat die drakoste in die vorm van rente en vereiste opbrengs
geminimaliseer word. ‘n Sterk kapitaalbasis lê die fondasie vir die vermoë om inkomste
te genereer deur die implementering en bestuur van ‘n weldeurdagte strategie om in
goedere of dienste te handel. Kapitaal is ‘n uitputbare hulpbron en normaalweg beperk
ten opsigte van beskikbaarheid. Die gebruik van kapitaal vir die generering van inkomste
sal ‘n proses wees van die aanwending daarvan tot die mees winsgewende projek of
geleentheid. Die koste van kapitaal kan gedefinieer word as die moontlike wins wat
gegenereer kan word uit alternatiewe aanwending daarvan. Hierdie koste word
gedefinieer as geleentheidskoste en word gemitigeer deur die risiko betrokke by die
aanwending daarvan. Geleentheidskoste kan ook gekoppel word aan beleggingskeuses
wat eienaars van kapitaal het. Beleggers baseer hul besluite op die risiko-opbrengs-
verwantskap van moontlike beleggings. Sou ‘n belegging ‘n aanvaarbare opbrengs
teenoor die ervaarde risiko lewer, sal ‘n belegger in daardie opsie belê. Die keuse sal
bepaal word deur die beskikbaarheid van alternatiewe wat soortgelyke of beter
opbrengste lewer teen soortgelyke of laer risikovlakke.
Deur ‘n toepaslike strategie te hê, sal opbrengste slegs aanvaarbaar wees met
effektiewe balansstaatbestuur en besluitneming. Balansstaatbestuur behels die gebruik
van skuld en ekwiteitsfinansiering tot so ‘n mate dat dit die mees winsgewende
finansieringsmetode of laagste koste van kapitaal meebring. Ekwiteitsfinansiering is die
gebruik van aandeelhouersfondse vir die finansiering van bedryfs- of
beleggingskapitaalbehoeftes of projekte. Dit word normaalweg gedoen deur aandele uit
te reik en oor die toonbank of in ‘n amptelike mark of oop verhandelingstelsel te verkoop.
In wese beteken dit dat beleggers gewerf moet word. In Suid-Afrika is die
Johannesburgse Sekuriteitebeurs (JSB) so ‘n amptelike mark.
Die doel van hierdie navorsing is om finansiële veranderlikes of waardedrywers te
identifiseer waardeur bestuur van boerderyprodukverhandelaars en voedselprodu-
seerders die verwagte prestasie van hulle aandele kon evalueer, sou dit op ‘n openbare
platform soos die JSB verhandel. Hierdie resultaat is bereik deur ‘n omvattende stel
finansiële-, rekeningkundige- en waardasieverhoudings te definieer en te toets teen die

iv
beweging van die aandeleprys. Die toets is gedoen aan die hand van ‘n veelvoudige
liniêre regressiemodel vir elke relevante jaar vir al die maatskappye genoteer in die
bepaalde sektor van die JSB vir die bepaalde periode. Netto bedryfswins na belasting
(NBWNB) het na vore gekom as die mees betroubare maatstaf van aandeleprestasie.
Tweede op die lys was residuele inkomsteberekeninge en meer spesifiek, afgeleides van
ekonomiese waardetoevoeging (EWT) modelle soos ontwikkel deur Stern en Steward.
Navorsing na faktore wat aandelepryse beïnvloed het daartoe gelei dat nie-finansiële
faktore wat aandelepryse beïnvloed, ook aan die lig gekom het. Hierdie faktore
impakteer egter veral op langtermyn finansiële prestasie.
Die eindresultaat was ‘n voorstel om NBWNB af te breek in sleutelelemente en die
bedrywe te identifiseer waar hierdie elemente bestuur kon word. ‘n Sisteem van
insentiefgedrewe maatstawwe moet dan ontwikkel word om gedrag te bestuur, moontlik
deur ‘n gebalanseerde telkaart om bestuur gebaseer op aandeelwaarde in te stel. Dit sal
verseker dat daar geen verrassings is teen die tyd dat die aandele op die oop mark
genoteer word nie.

v
Acknowledgements
It is with great appreciation that the following persons are acknowledged for their
contributions towards completion of this mini-dissertation and a worthwhile MBA degree:
Lord God Almighty, for being my resting place when I got tired and for always giving me
direction through His servants, my fellow students (especially my study group), my wife,
family and friends.
Professor Ines Nel for, inter alia, his effort in laying the foundation for this study and,
possibly, my future.
My wife Renata, for her devoted love and support, advice and encouragement to
complete this study, for placing everything in her life second to my focus on this study
and for the latest addition to the family, Caroli.
My sons Rohann and Lauri, for their patience and acceptance of their father’s studies.
My parents Willie and Dalene, for always encouraging me and believing in me.
Christine Bronkhorst of the Ferdinand Postma Library of the North-West University for the
library support and service during this study.
Dr J du Plessis for the advice and assistance in processing the data.
Lorna Keough for her time spent on the grammatical editing of the mini-dissertation.
Senwes Limited for partially funding this study.
vi
CONTENTS
Abstract ......................................................................................................................... i
Bestuursopsomming .................................................................................................. iii
Acknowledgements ..................................................................................................... v
Table of abbreviations ................................................................................................ ix
CHAPTER 1 .................................................................................................................. 1
1.1 INTRODUCTION ................................................................................................ 1 1.2 BACKGROUND TO THE STUDY ....................................................................... 5
1.3 PROBLEM STATEMENT ................................................................................... 6 1.4 OBJECTIVES OF THE STUDY .......................................................................... 6
1.4.1 Primary objective .......................................................................................... 6
1.5 SCOPE OF THE STUDY .................................................................................... 7 1.6 RESEARCH METHODOLOGY........................................................................... 7
1.6.1 Literature/Theoretical study .......................................................................... 7
1.6.2 Empirical study ............................................................................................. 7
1.7 PARAMETERS OF THE STUDY ........................................................................ 8 1.8 LAYOUT OF THE STUDY .................................................................................. 8
CHAPTER 2 ................................................................................................................ 10
2.1 INTRODUCTION .............................................................................................. 10
2.1.1 Market efficiency ........................................................................................ 11
2.1.2 Risk and return ........................................................................................... 13
2.1.3 Evaluation and measurement ..................................................................... 14
2.1.4 Financial assessment ................................................................................. 19
2.1.5 Share performance .................................................................................... 20
2.1.6 Analysis ...................................................................................................... 22
2.2 INCOME STATEMENT ..................................................................................... 23 2.2.1 Profit margins ............................................................................................. 23
2.3 FROM THE INCOME STATEMENT TO THE BALANCE SHEET .................... 26
2.3.1 Profitability in terms of capital utilisation ..................................................... 26
2.3.2 Activity ratios .............................................................................................. 30
2.4 BALANCE SHEET CONDITION ....................................................................... 33
2.4.1 Solvability and equity measures ................................................................. 34
2.4.2 Liquidity measures ..................................................................................... 35
2.5 INVESTMENT PERFORMANCE ...................................................................... 38 2.5.1 Earnings per share ..................................................................................... 38

vii
2.5.2 Cash and investments on hand .................................................................. 39
2.6 TRENDS ........................................................................................................... 39 2.6.1 Sales/revenue growth ................................................................................ 40
2.6.2 Profitability growth ...................................................................................... 40
2.6.3 EBITDA growth .......................................................................................... 41
2.6.4 Earnings per share growth ......................................................................... 42
2.7 GENERAL COMMENTS ON FINANCIAL VARIABLES .................................... 42 2.8 NON–FINANCIAL VARIABLES ........................................................................ 43
2.8.1 Management credibility .............................................................................. 44
2.8.2 Corporate strategy execution ..................................................................... 44
2.8.3 Quality of corporate strategy ...................................................................... 44
2.8.4 Brand strength ............................................................................................ 45
2.8.5 Corporate governance practices ................................................................ 46
2.8.6 Ability to recruit / retain talent ..................................................................... 48
2.8.7 Quality of internal relations guidance ......................................................... 48
2.8.8 Market share .............................................................................................. 48
2.8.9 Customer satisfaction ................................................................................. 50
2.8.10 CEO leadership style ................................................................................. 50
2.9 VALUE–BASED MANAGEMENT ..................................................................... 50 2.9.1 Economic value added (EVA®) .................................................................. 52
2.9.2 Discounted cash flow (DCF) ....................................................................... 55
2.9.3 Residual income (RI) .................................................................................. 55
2.9.4 Economic profit (EP) .................................................................................. 56
2.9.5 Internal rate of return (IRR) ........................................................................ 56
2.9.6 Cash flow return on investment (CFROI) ................................................... 56
2.10 SUMMARY ....................................................................................................... 56
CHAPTER 3 ................................................................................................................ 58
3.1 INTRODUCTION .............................................................................................. 58
3.2 THE FOOD SECTOR ....................................................................................... 59 3.3 METHOD OF ANALYSIS .................................................................................. 59
3.3.1 Key assumptions ........................................................................................ 61
3.3.2 Model significance ...................................................................................... 62
3.4 RESULTS OF THE ANALYSIS ......................................................................... 63
3.4.1 Analysis year 1 (N=8) ................................................................................. 64
3.3.2 Test for effective use of regression ............................................................ 68
3.5 SUMMARY ....................................................................................................... 71
viii
CHAPTER 4 ................................................................................................................ 73
4.1 INTRODUCTION .............................................................................................. 73 4.2 RESULTS ......................................................................................................... 74
4.3 MODELLING OF A JSE FOOD SECTOR COMPANY SHARE PRICE ............ 75 4.4 MANAGEMENT VALUE .................................................................................. 76 4.5 DISCUSSION AND FUTURE PROSPECTS .................................................... 76 4.6 CONCLUSION .................................................................................................. 77
ANNEXURE A: LIST OF ALL VARIABLES USED .................................................... 81
ANNEXURE B: CORRELATION MATRIX .................................................................. 82
List of diagrams
Diagram 2.1:Level of value drivers .............................................................................. 54
List of Graphs
Graph 3.1:Contribution of the variables to the model ................................................... 67
Graph 4.1:Frequency of variable occurrence in the test sample .................................. 75
List of Tables
Table 2.1: Market Efficiency ........................................................................................ 12
Table 2.2: Marketing goals versus potential outcomes ............................................... 45
Table 3.1: Variables identified through initial regression modelling ............................. 64
Table 3.2: Eliminating Earnings per share .................................................................. 64
Table 3.3: Validity of model 1 ...................................................................................... 65
Table 3.4: Final Model for year 1 ................................................................................ 65
Table 3.5: Multiple regression formulas for the period 1991 to 2009 .......................... 68
Table 3.6: Frequecy of ratios appearing in the models ............................................... 70
ix
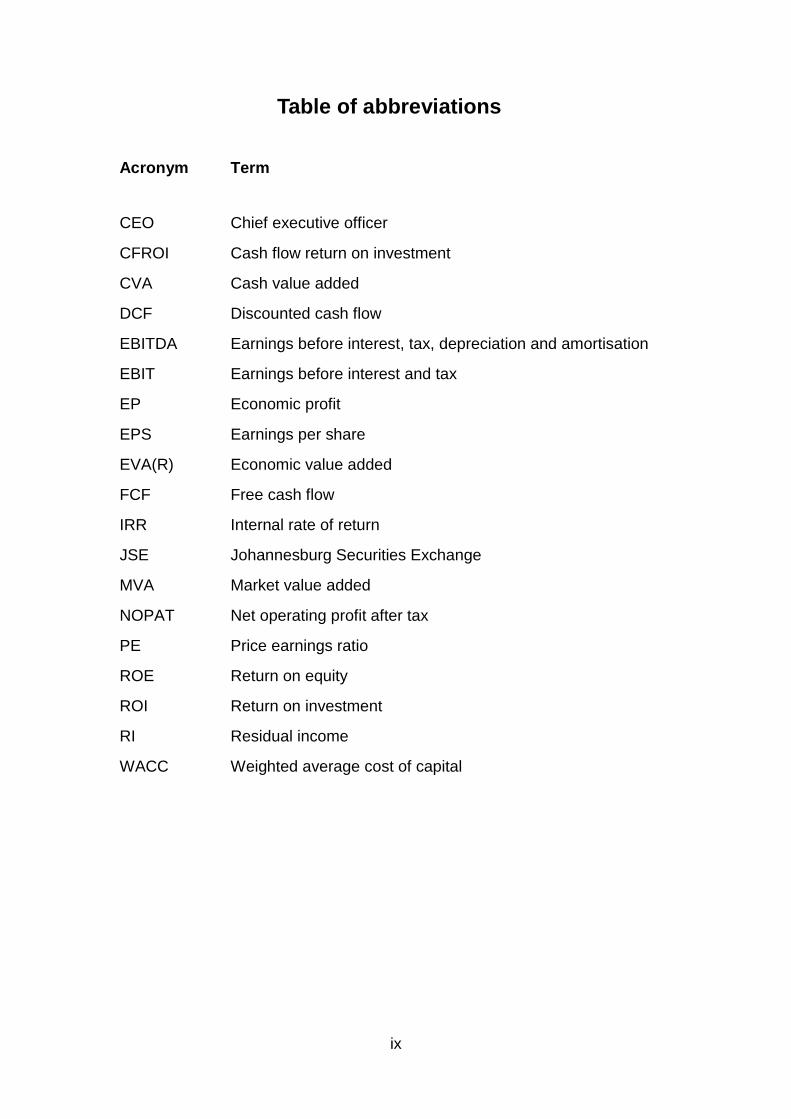
Table of abbreviations
Acronym
Term
CEO Chief executive officer
CFROI Cash flow return on investment
CVA Cash value added
DCF Discounted cash flow
EBITDA Earnings before interest, tax, depreciation and amortisation
EBIT Earnings before interest and tax
EP Economic profit
EPS Earnings per share
EVA(R) Economic value added
FCF Free cash flow
IRR Internal rate of return
JSE Johannesburg Securities Exchange
MVA Market value added
NOPAT Net operating profit after tax
PE Price earnings ratio
ROE Return on equity
ROI Return on investment
RI Residual income
WACC Weighted average cost of capital
1
CHAPTER 1
Food sector share prices: An overview
The objective of this chapter is to present the study. Firstly, the background will be
presented and the subject will be put into perspective, then the problem will be
presented and the study parameters laid-out. Finally the layout of the document is set
in order to provide a clear understanding of the processes followed.
1.1 INTRODUCTION
The study was necessitated by a choice of an agriculture-related business (agri-
business) to list on the Johannesburg Securities Exchange (JSE). This means that
company would stop selling its shares in-house and offer it to an official market as will
be clarified further in this document. To determine whether it will be accepted by
investors on the JSE as a company that will meet or exceed the expectations of the
shareholders, it is important to compare the performance of the company and its
shares with companies it will be joining in the same sector.
Currently there is only one company on the JSE with nearly the same business model.
Unfortunately there is not much correlation between this company’s share price
movement and that of similar unlisted companies. The fact is that some unlisted
shares are currently outperforming certain listed shares in this sector. The concern for
a company with listing in mind is whether investors perceive the risk of similar
companies different than other investments or whether some listed companies really
did not perform as expected by investors. In order for a company to operate effectively
it needs to have sufficient capital. The capital will be used to purchase assets, which in
turn are used to generate income. (Megginson et al. 2007:49).
The company with a strong capital base has the ability to generate revenue by
implementing and managing a well laid out strategy to trade either in goods or services.
Capital is a depletable resource and is usually limited in respect of availability. The use
of capital for income generation will be a process of allocating it to the most profitable

2
project or venture. The cost of capital can be defined as the possible profit generated
from an alternative application. This cost is defined as opportunity cost and it is
mitigated by the risk involved in its application. Opportunity cost can also be related to
the various investment choices which owners of capital have (Megginson et al.
2007:158). Investors will base a decision on the risk return relationship of possible
investments. Should an investment yield an acceptable return for the perceived risk an
investor will choose that particular investment. This will depend on whether there are
alternatives producing similar or better yields at similar or lower risk levels.
Having an appropriate strategy will only yield acceptable returns through effective
balance sheet management and decision-making and whether the effectiveness and
efficiency of companies can be optimised. Balance sheet management entails the use
of debt and equity finance in a way that results in the most profitable financing method
or the lowest cost of capital (Megginson et al. 2007:568). Equity finance entails the use
of shareholder funds for financing capital requirements. This is usually done by issuing
shares and selling it over the counter or in the official market. For a company to list it
means offering its shares to the public in an official market to generate capital to
service operating expenditure or to fund investments or projects. In essence this
means that investors have to be recruited. In South Africa the official market bringing
together investors and firms in need of investment, is the JSE.
Investors will have to be convinced that funds invested will realise decent returns, that
these returns are sustainable and sufficient to justify the risk and also that it has the
ability to enhance the investor’s current portfolio. Investors have certain goals in mind
when choosing investments and it is necessary for the company to understand these
investment goals (Megginson et al. 2007:173). Convincing investors that the required
investment goals are achievable or that a company can add to the achievement of
these goals is of the essence. With regards to the above management of the business,
there must be certainty that the business has a successful growth strategy, which will
enable it to deliver the returns which are expected by the investors. In addition, the
delivery of the returns should be sustainable in order to convince investors to select the
company shares as investment.
Given the importance of an understanding by management of shareholders'
requirements it is necessary to be sensitive to the reaction of shareholders on certain

3
conditions or circumstances and how certain reports delivered by the company are
read and interpreted. Should the company be able to predict the reaction of the
shareholders, the company would streamline its planning and execution of tasks and
would confidently implement projects. This will empower the company's management
to set up a successful communication channel in presenting reports. By effective
communication and offering acceptable results, the management of the company will
be able to lay a solid foundation for share value growth through shareholders'
confidence in the company’s long term sustainability.
In essence this means that a study had to be done to determine the factors influencing
the share price for the companies in a sector by, in this case, doing an analysis of the
companies in the food sector. Specifically important is financial performance and its
influence on share price. By getting a correlation between performance measures,
value drivers and share price movement, it would be possible to establish whether key
drivers can be identified, based on which shareholders or potential investors will make
their buying or selling decision in respect of the trading with shares.
Even though there is a possibility that it will not be possible to manage some of these
measures, will make sense for a company to at least understand the direction which
share trading and share prices will take when certain decisions are made or certain
performance levels are delivered. With the information at hand and understanding the
visible trends, an attempt will be made to model share price behaviour.
The purpose of the research will be to create an understanding of the factors that a
company would have been exposed to if it was listed on JSE over that specific period
and what its share price would have looked like under those circumstances. The final
outcome of this study will be an attempt to create a realistic picture of what the
company can expect as a listed company. The latter will allow for successful strategic
planning, implementation and management, bearing in mind the fact that it will
influence share prices and the way in which the share price will react.
Of the more important financial aspects to be considered is the growth in earnings per
share (EPS), earnings before interest, tax depreciation and amortisation (EBITDA) and
profitability (Megginson et al. 2007:50). A list of possible variables will be developed
from literature and initially included in the study in order to define its influence on the
4
share price. By processes of elimination these measures were narrowed down to only
the most relevant ones determining the share price, using multiple linear regression
analysis.
A study done by Ernst & Young in 2008 indicates that institutional investors base an
average of 60% off their decisions on financial measures, while 40% is based on non-
financial measures. The non-financial measures have a longer term impact on the
sustainability of the investment and can also be seen in the financial results of the
company. The non-financial measures with possible influence on the share price
include, inter alia, the reliability of management, corporate strategy and the strength of
the trademark.
In consideration of the above information the study aims to identify the key elements
which influence share prices (and indirectly shareholders), resulting in a usable guide
for similar companies which aim to list on the JSE. Due to the varying influences on
different sectors the study will be done specifically on the food sector, particularly on
farming and food producers. This particular study is aimed at current unlisted agri-
businesses intending to list in the food producers sector of the JSE, due to its main
operating income being derived from farming and food production.
Although the other companies in the food sector do not have similar business plans,
similar business cycle patterns are indicated. The fact that most of these companies
are low growth, relatively acceptable yielding companies with a low beta against the
rest of the JSE, means that it will suffice as defensive shares for investors looking for
low-risk opportunities. The agri-business will compete against these companies for an
opportunity to be on an investor's portfolio and has to know when and why an investor
will look at a particular share.
The study is split between a literature study on the various ways to measure company
and share price performance and its ability to predict share price movement; and an
empirical study analysing the share price history of companies listed on the JSE in
particular, the food producer sub-sector of the main sector farming and fishing. The
main source of information for listed companies will be information provided by
McGregor BFA.

5
It is important to know what is to be expected in terms of company performance in
order to be the share of preference as well as to anticipate what the share price
reaction will be on certain actions taken by the company. The ability to model these
expected changes will create a good idea of the expected share price.
For purposes of the research, the past 19 years' financial performance ratios of the JSE
listed companies will be used to analyse the share movement in relation to financial
performance.
1.2 BACKGROUND TO THE STUDY
In its aspiration to remain the market leader in the agricultural sector, a company
should continuously investigate opportunities or methods to set up the most effective
delivery platform for the building of shareholder value. Historically agricultural co-
operatives were set up for the purpose of delivering value for the members. By
converting to companies, ownership of agri-businesses has changed from membership
to shareholders. However, the purpose of creating value has not changed.
Managing shareholders value and growing it require effective balance sheet
management - especially a balance between using debt finance and shareholders’
investment (equity finance) as sources of capital for business generation. It also
requires building the confidence of investors in order to grow the investment value
within the company. When considering listing, an investigation as to whether optimal
methods are being used for creating and building value of the company's shares at
listing on the JSE, is necessary.
Due to the low trading volume of unlisted shares as well as limited knowledge of the
existence of these types of companies, it is expected that listing shares on an open
platform will create increased trading volumes and also unlock the perceived inherent
value of the company. Doing this is perceived to be a bold move for companies not
entirely sure of what to expect in a listed environment. In order to shed some light on
what can be expected and how to anticipate the value and price movement shares can

6
experience in a listed environment, it will be attempted to find the value drivers and
model the impact thereof on the shares of unlisted companies when they list.
Based on the above it is currently unsure which variables have to be managed to such
an extent that a realistic share price will be achieved at initial public offering. It appears
as though the most up-to-date topic in the management discussion on financial
management is related to a value-based management (VBM) as part of residual
income theories. Chapter 2 discusses these topics in more detail.
1.3 PROBLEM STATEMENT
To determine what value drivers can be identified which will influence the movement of
share prices for an agri-business company listed on the JSE and what can be done to
ensure share performance.
1.4 OBJECTIVES OF THE STUDY
The following objectives were set in order to confirm whether the study met the
required criteria
1.4.1 Primary objective
The primary objective of the study is to develop a framework for the understanding of
variables influencing share price changes and management of share value.
1.4.1.1 Secondary objectives
Establishing the relevant variables which may have an impact on share price
movement by way of a literature study.

7
Analysing share price movement and the variables influencing it by developing
multiple linear regression models.
Determining which of the variables in the model has the most influence on the
share price.
Developing a framework for management as a tool in the daily operation of the
company.
1.5 SCOPE OF THE STUDY
With an emphasis on financial management, the study will be limited to the fields of
financial strategic and operational management and packaged under value-based
management.
1.6 RESEARCH METHODOLOGY
The methodology used will be a combination of literature and empirical study.
1.6.1 Literature/Theoretical study
The foundation of the study firstly consisted of a theoretical cornerstone of research
into the specific area of financial ratio analysis and residual income theories of value
management and the effect of these forces on the share price movement, especially in
the first three years after listing.
1.6.2 Empirical study
14 companies are currently listed on the JSE Food Sector, but due to the fact that there
were a few which came and went, it will be necessary to include the full group available

8
for the past 19 years since 1990 and to also include the factors which allowed for
introduction as well as de-listing.
The financial history of the food companies as mentioned above will be drawn from
McGregor BFA in order to analyse certain key variables as identified through the
literature study to be possible drivers of share price as well as the measurement of
company performance. By doing multiple regression analysis on share price
movement and comparing it with the key variables, the ability of these measures to
determine and predict the share price will be calculated.
The aim is to identify key financial variables that may influence the share price
movement.
1.7 PARAMETERS TO THE STUDY
The study will be done with all available information from 1991 to 2009 based on
standardised financial records and share trading reports of the companies listed on the
JSE Food Sector as provided by McGregor BFA.
1.8 LAYOUT OF THE STUDY
Chapter 1 Food Sector share prices: An overview
Introduction, problem statement and objectives
Chapter 2 Financial variables, company value and value-based management
Background on accounting ratio analysis and recent developments in the area of
financial management and strategic management. Theories developed in relation to
key elements of share price movements with closer reference to residual income
theories.
9
Chapter 3 Research method and data analysis
Statistical analysis of companies in the Food Sector on the JSE and interpretation of
results.
Chapter 4 Empirical study: recommendations and conclusion.
Results discussion, summary and recommendation
10
CHAPTER 2
Company value and value-based management
The objective of this chapter is put into perspective the factors which may influence
company value with reference to share prices and what can be done to understand the
effect of management influence in determining share value. Financial and accounting
variables are defined and put into perspective. This lays the foundation for the
empirical analysis of financial and accounting variables and its relation to share price,
in order to be used as value based management tools. Value-based management is
defined and discussed in the context of share price management.
2.1 INTRODUCTION
The purpose of a profit orientated company is to ensure sustainable shareholder
investment growth or in other words: “Create shareholder value” (De Wet & Du Toit,
2007:59). From a shareholder's perspective this means that the company should be
able to perform at such a level that it can sustain the underlying value of the share.
Even if most of the value is perceived and not necessarily capital supported,
management needs to be able to understand the origin of value and how to positively
manage it in all instances. This, in essence, means that management needs to know
what drives the value of the share and to develop the tools to measure and manage
these drivers. Bokpin & Abor (2009:1) supports this argument by suggesting that
growing the assets entrusted to management through constant effort is of the essence.
Knowing what the share value drivers are and being able to measure the drivers,
enable management to manage those drivers that may have an impact on value
creation. The focus must be on the underlying operational and managerial actions
required to maintain or improve financial performance, whether it be the choice
investment, financing of assets or working capital management.
From a general financial theory point of view and intuitively one would suspect that
share prices are driven by the same fundamentals that drive the economy (Somoye et
al., 2009:186). Economic supply and demand theory has it that an increase in the

11
demand for a product, given the same level of supply, will increase the price of such a
product. Similarly the price will rise by the same level of demand but reduced supply.
The exact opposite will happen if either the demand decreases or the supply increases,
should the other factors remain constant and should prices decrease. It can also
happen that prices can stagnate due to a lack of supply or demand side forces
(Carbaugh, 2007:43).
To establish a fair share price it is therefore necessary for the shares to firstly be
available for sale and secondly that healthy supply and demand forces are active. In
this regard it is necessary to realise that both the buying and selling decision are driven
by information available on the performance and perceived quality of shares. Choices
based on this information are the same as in the case of contemporary economics
(Carbaugh, 2007:42).
It is necessary to note that the timing and quality of information impact on the true value
created from this information. The latter creates interesting dynamics, because supply
and demand are again driven by perceptions and preferences based on the
interpretation of the available information. The question thus remains: Based on what
information do shareholders/investors sell or buy shares?
2.1.1 Market efficiency
One of the methods managers can use to ensure that investors get an accurate picture
of the company and what management expects will be the outcome of their effort, is by
following the signalling model. To understand signalling one needs to understand the
underlying efficient market hypotheses. Megginson, Smart & Gitman, (2007:382)
expand on three types of market efficiencies and deliver proof to the concept of
overreaction. Market efficiency, according to financial theory, can be divided into weak,
semi-strong and strong form.
The following table depicts the definitions and identification of each of the mentioned
forms of market efficiency.
12
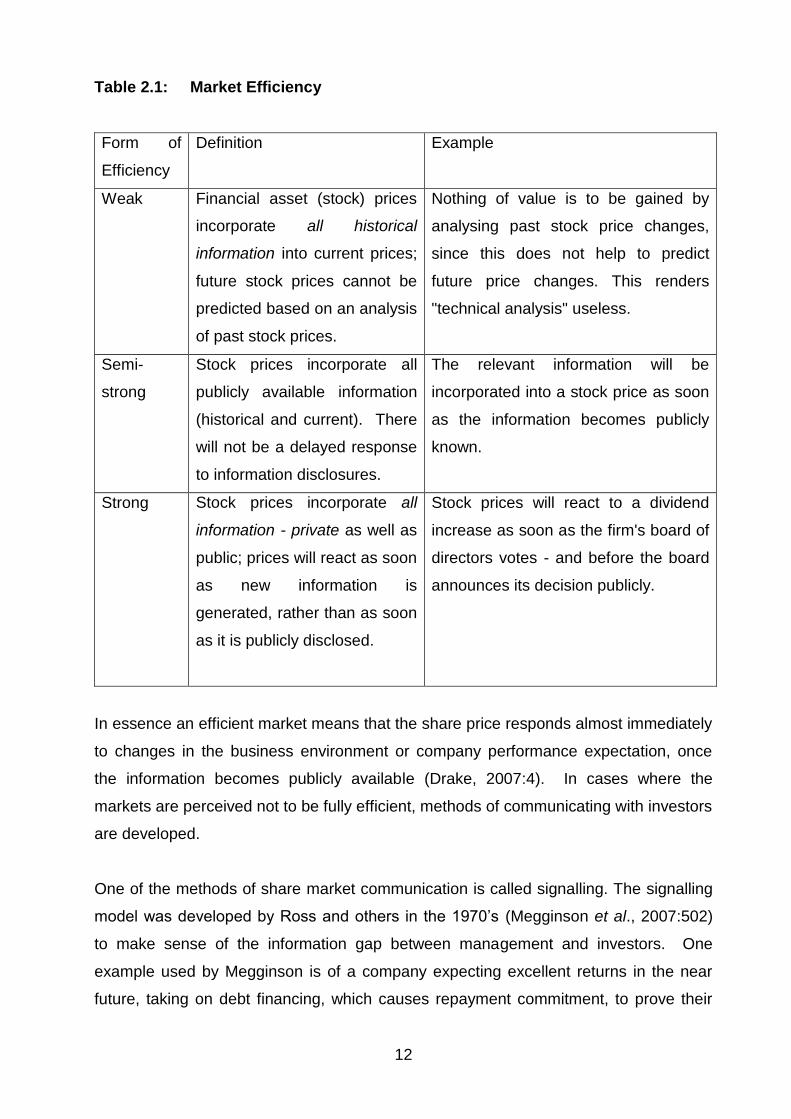
Table 2.1: Market Efficiency
Form of
Efficiency
Definition
Example
Weak Financial asset (stock) prices
incorporate all historical
information into current prices;
future stock prices cannot be
predicted based on an analysis
of past stock prices.
Nothing of value is to be gained by
analysing past stock price changes,
since this does not help to predict
future price changes. This renders
"technical analysis" useless.
Semi-
strong
Stock prices incorporate all
publicly available information
(historical and current). There
will not be a delayed response
to information disclosures.
The relevant information will be
incorporated into a stock price as soon
as the information becomes publicly
known.
Strong Stock prices incorporate all
information - private as well as
public; prices will react as soon
as new information is
generated, rather than as soon
as it is publicly disclosed.
Stock prices will react to a dividend
increase as soon as the firm's board of
directors votes - and before the board
announces its decision publicly.
In essence an efficient market means that the share price responds almost immediately
to changes in the business environment or company performance expectation, once
the information becomes publicly available (Drake, 2007:4). In cases where the
markets are perceived not to be fully efficient, methods of communicating with investors
are developed.
One of the methods of share market communication is called signalling. The signalling
model was developed by Ross and others in the 1970’s (Megginson et al., 2007:502)
to make sense of the information gap between management and investors. One
example used by Megginson is of a company expecting excellent returns in the near
future, taking on debt financing, which causes repayment commitment, to prove their
13
ability to service this debt. The logical reaction will be for investors to trade the share
price to higher levels in expectation of higher investment yields caused by increased
capital. The reason investors will expect a higher yield on investment in the company’s
shares is that an increased capital requirement is most probably a result of investment
in new projects or growth by the company. It can also mean that the company
perceives its share price to be too low and as a result rather takes up debt finance than
equity for the purpose of investment in growth.
It is argued that the weaker the efficiency in the share market in which companies
operate, the higher debt financing it is prepared to take up to signal its future
profitability. Research indicates that a positive correlation exists between an increased
use of debt finance and market efficiency. The relationship is, however, not significant.
(Megginson et al., 2007:503).
Signalling can be used in various ways to inform less informed investors, like using
dividend payouts as a way to communicate to the investment community satisfaction
with the performance of the company or in a “negative" sense to communicate that
viable investment projects in the field of business are not available. The latter may lead
to a perception that a company is moving into a maturity phase, which in turn has
specific implications for the market price of the share. One of the less conspicuous
ways of signalling is using market timing. Market timing means that companies tend to
issue shares at the time when share value is perceived to be at a high and buy in when
the share value is perceive to be low (Megginson et al., 2007:504).
Considering the fact that supply and demand for shares are probably derivatives of
underlying information one has to consider what influence supply and demand have on
share price determination. Another issue constantly referred to regarding investment
decision-making in financial theory is the so-called risk return relationship (Megginson
et al., 2007: 45).
2.1.2 Risk and return
Investors, according to financial theory, will logically be looking for the largest possible
reward (return) on investment and minimal risk of losing any of the capital invested.
14
Risk and reward theoretically, and maybe specifically for risk averse investors, have a
positive correlation, thus the higher the perceived risk, the higher the required return to
entice the investor to invest. The final choice whether to invest in a specific asset or
opportunity seems to be determined by the individual’s risk aversion profile. By being
able to determine the risk in investing, the choice will fall on an investment where the
perceived positive gap between reward and risk is the greatest, in line with the risk
profile of investors (Megginson et al., 2007:180).
2.1.3 Evaluation and measurement
The first step in considering an investment in a company is to understand its business
model. The business model is derived from the identification of certain strategic
drivers, mostly spelled out in the non-financial sections of the annual financial reports.
The management of most companies try to explain the business model followed, using
various methods of breaking down the business into segments and mostly through
schematic illustrations and diagrams of how the units are integrated. The mentioned
can be used to identify the key drivers of the business and eventually allows ways to
analyse the company’s ability to grow core competencies into competitive advantages.
Measures to evaluate the effectiveness of strategy and execution usually can be
derived from comparing efficiency and growth within and amongst companies
(Thompson et al. 2010:107). Regarding future performance expectations it is
specifically important to pay attention to the strategic direction and focus indicators as
spelled out in the chairperson's and other reports contained in the annual financial
report.
Investors' evaluation of companies as prospective candidates often starts by looking
into a company’s financial reports and if available, in the case of a company intending
to list, its prospectus. From the financial reports the financial variables are analysed
and put into perspective, mostly by considering trends within the company but also by
comparison with similar companies. The prospectus explains the investment story of
the company, giving more than just the financial background but also explaining the
reason for listing and value proposition for investors. In the listing prospectus, the
strategy and building blocks for generating future income is expanded on. In
combination with the managing director's and often the financial director’s reports, most

15
of the non-financial issues are discussed. The non-financial issues may include
reference to the effectiveness of execution and relevance of company strategy for the
past period and for the future. It may also include a change of direction and focus and
a variety of other indicators. Other indicators and issues often referred to in the
prospectus and financial reports, may include execution of strategy and the use of
brand, marketing and advertising efforts as well as corporate governance and
compliance issues. Fox (2003:3) suggests that the share price will overall reflect a
more accurate picture of the company value, especially if the disclosure in financial
statements complies with legal requirements.
While non-financial factors are not necessarily clearly visible in the financial reports, the
perception is that the effect of non-financial issues may be visible, derived from, and
can be interpreted from using financial measures. Thompson et al. (2010:103) is
specifically of the opinion that financial measures can clearly indicate strategic direction
and execution. The financial reports are perceived to be the most accurate available
reflection of the operating model and the performance of the company. Due to the
diversity of businesses and operating models, it is recommended not to only look at
one company in isolation. In order to judge a company’s performance it needs to be
benchmarked against companies with similar operating activities. Comparison between
companies unfortunately poses its own challenges since the information and the way it
is presented differ from company to company.
General methods of evaluating share investment returns and company performance
are based on earnings multiples. Earnings multiples, as the term suggests, are ratios
built on the relationship between share price and company earnings as expressed per
issued share. Bringing the share price in perspective with the underlying company’s
results gives an average investor a basis from where to determine the market’s
impression of the company. Many earning multiple metrics currently exist - some of the
most popular methods are discussed.

16
Price-earnings ratio (P/E)
P/E is defined as a company's share price divided by its earnings per share (EPS) in a
specific financial year. EPS is mostly used for the most recent year and it is calculated
as the net profit after tax divided by the number of shares in issue at the end of the year
or the average number of shares in a particular year. Price/earnings is often used in
peer group context, in other words what is an acceptable P/E ratio for a specific
industry or sector. This approach leads to an “assumed relative stable” P/E for a
company. The reason for following this approach is that a fair P/E for a company
cannot be established. The problem is that EPS is the only value in the equation which
is known therefore a fair P/E for a specific company cannot be calculated using the
above equation. Bosman (2007:38) argues that even EPS cannot be considered as a
constant since a variety of factors including changes in capital structure and company
operations can change earnings and should impact on the ratio. Notwithstanding the
above, P/E is currently the most popular valuation measurement (Hillestad & Bank,
2007:127). The popularity of P/E may be due to the fact that it is easy to understand
and calculate. Other calculus exists to calculate a fair P/E. However, due to its own
complexities and underlying assumptions it will not be discussed.
Price-sales ratio (P/S)
P/S is defined as a company's share price divided by the relevant 12 months' sales-per-
share. An advantage of using price to sales is that the source of future income, namely
sales is measured, irrespective of the efficiency of the company’s internal operations.
As a result of measuring pure sales growth, an opinion can be developed about the
market share and growth prospects of the company. This should give an investor a
snapshot of expected growth, especially if price to sales is compared between years
and analysed as a trend. Long term investors will accept that companies may
experience seasons of low sales, but in the long run sales turnover should smooth out,
giving a clear indication of growth trend.
Variation in terms of sales and sales revenue, which might not be directly related to
growth or the lack of growth, is cases where, for instance, sales margins were reduced
to increase market share or compete against a rival firm. In the case of reduced sales
margins, sales revenue may grow, but not necessarily gross profit, possibly creating a
more positive perception of growth than what might actually transpire once the net

17
profit becomes known. Where sales margins are increased to increase profitability it
could result in loss of sales revenue, but not necessarily profitability as a whole. The
perception could be that the company experienced negative growth but the net profit
may even have increased. Sales margin can be increased by decreasing cost-of-sales
or increasing sales price. Similarly sales margins can reduce by reducing selling prices
or increased cost-of-sales. More detail will be provided later in this chapter.
Price-book (P/B)
A company’s net asset value is the net value after all the liabilities are deducted from
the company’s total assets and is equal to its book value, thus its assets less its
liabilities. To calculate the price to book (P/B) ratio one has to divide a company's
share price by its book value per share. P/B ratio is considered a good measure for
value investments. It also gives a clear indication of the market sentiment regarding
the expected value of the share and its possible future profit. A high price to book ratio
indicates that investors perceive the company to be able to be more profitable in future.
The latter means that the current asset value or book value is considered to be too low.
A company’s assets are used to generate income. Indications are that if a company’s
profitability is higher than expected, the additional financial benefit gets discounted by
investors in the share price. In this regard (Hillestad & Bank, (2007:128) indicates that
a high price to book ratio may mean that the investors believe the company will
outperform its normal projected growth. Interestingly Bokpin & Abor (2009 :31) found a
considerable correlation between capital structure and price book ratio, suggesting that
investors discount the debt ratio in the share price. A high debt ratio consistently
resulted in a lower price book ratio. It is derived that investors may be concerned about
the ability of a company to meet financial commitments, amortise debt, compensate
shareholders or to reinvest funds for future growth.
In South Africa the most popular methods of valuation are earnings multiples as
discussed above and the discounted cash flow (DCF) methods, to be discussed later
(Correia & Cramer, 2008:48).
The above variables are used to determine the value of shares but do not necessarily
indicate how the value is created or where it originated from within a company’s
operations. Financial ratios were developed in order to standardise the approach in

18
which company performance is evaluated. Secondly, financial ratios are used as
diagnostic tools to determine whether resources are used effectively and efficiently.
Using standardised ratios allows for comparison across companies, which facilitates
benchmarking. The benefit of benchmarking is the ability to identify inefficiencies or
areas of excellence in a company. The use of financial ratios as indicators of where
share value is generated in a company is perceived not to be a clear science. In this
regard a substantial number of financial ratios and measures were developed in order
to truly measure company performance.
These financial ratios are calculated by analysts and investors from information
provided in financial reports. Financial reports, however, contain historic information
and the investor needs to determine possible future performance of the company in
order to ensure good investment returns. Of these financial ratios the most popular
ones are discussed for possible inclusion in the empirical study. The discussion follows
later on in the chapter. It is also important to remember, as per previous discussion,
that some of the factors influencing a company’s performance are of non-financial
origin. These non-financial factors would be hard to measure in the same way that
financial factors are measured.
In order to include consideration for the effect of non-financial factors on share prices,
the aim is to be able to develop a set of measures which indirectly relate to the
measurement of non- financial factors as well. In other words, one has to find financial
measures from which the influence of non-financial performance results can be
derived. It is suggested that non–financial factors tend to impact on financial measures
at later stages. Impacting at later stages means that the ability to understand the non–
financial drivers of the company can enhance the accuracy of determining the outcome
of the performance in future. Thus, through diagnosis of the financial factors, non-
financial issues can be laid bare. Non-financial issues are discussed and put into
context of company performance later on.

19
2.1.4 Financial assessment
When reporting on financial results, companies tend to produce an own perspective of
performance and this is done by means of comparing history. Accounting standards
GAAP (Generally Accepted Accounting Principles) and IFRS (International Financial
Reporting Standards) prescribe a certain set of financial reports which should always
be part of the annual financial reporting process. Financial details are set out in annual
financial reports to the extent where it most accurately reports the past year’s
performance and the financial position on the last day of the financial year. Investors
use the mentioned reports to make comparisons between companies in order to
determine the best investment from information provided.
Financial reports normally comprise of the following (Megginson et al. 2007:31):
1. Income statement.
2. Cash flow statement.
3. Changes in shareholders’ equity; and
4. Balance sheet.
In order to make financial reports more understandable, each financial statement is
accompanied by notes, allowing readers to see a breakdown of the values or policy
and procedures followed in the compilation of the specific financial report.
The information at hand thus allows the investor to see the company in terms of income
and profit generated, capital availability and deployment of funds.
Companies use resources, popularly known as: Men, Money, Machines and Materials.
Men, referring to the people with certain skill sets to perform tasks in order to achieve a
mutual goal. Money refers to the available capital and the systems used to plan and
monitor its movement. Machines, in the case of production companies, but it can also
refer to the equipment necessary for service companies to deliver service. Material
includes all resources being transformed from an input to a product or service.
The financial results of the business activities are summarised in the income statement
and the use and application of capital are reported on in the balance sheet. The
20
income statement is therefore a measure of effective operation of the company, while
the balance sheet indicates the final movement of capital, mostly to indicate the extent
to which the profit generated by the company contributes to the owner’s equity, but also
to give a breakdown of the distribution of capital to operational activities - the result of
the structure of financing of activities.
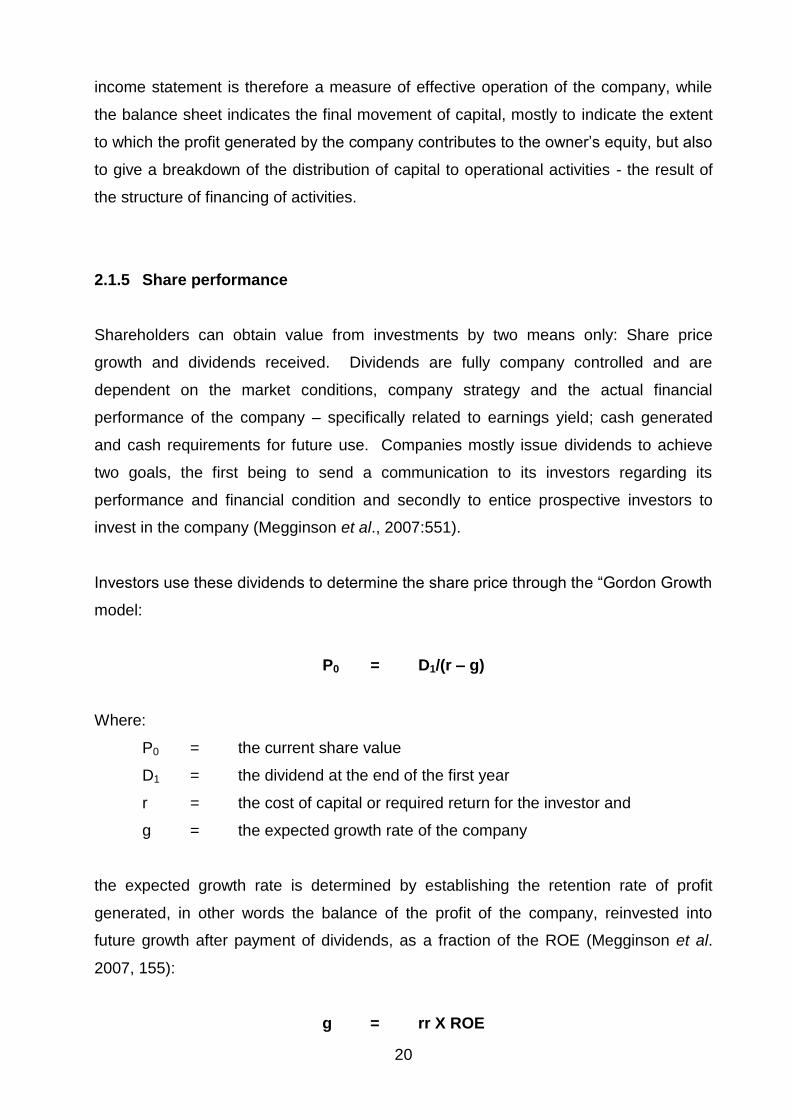
2.1.5 Share performance
Shareholders can obtain value from investments by two means only: Share price
growth and dividends received. Dividends are fully company controlled and are
dependent on the market conditions, company strategy and the actual financial
performance of the company – specifically related to earnings yield; cash generated
and cash requirements for future use. Companies mostly issue dividends to achieve
two goals, the first being to send a communication to its investors regarding its
performance and financial condition and secondly to entice prospective investors to
invest in the company (Megginson et al., 2007:551).
Investors use these dividends to determine the share price through the “Gordon Growth
model:
P0 = D1/(r – g)
Where:
P0 = the current share value
D1 = the dividend at the end of the first year
r = the cost of capital or required return for the investor and
g = the expected growth rate of the company
the expected growth rate is determined by establishing the retention rate of profit
generated, in other words the balance of the profit of the company, reinvested into
future growth after payment of dividends, as a fraction of the ROE (Megginson et al.
2007, 155):
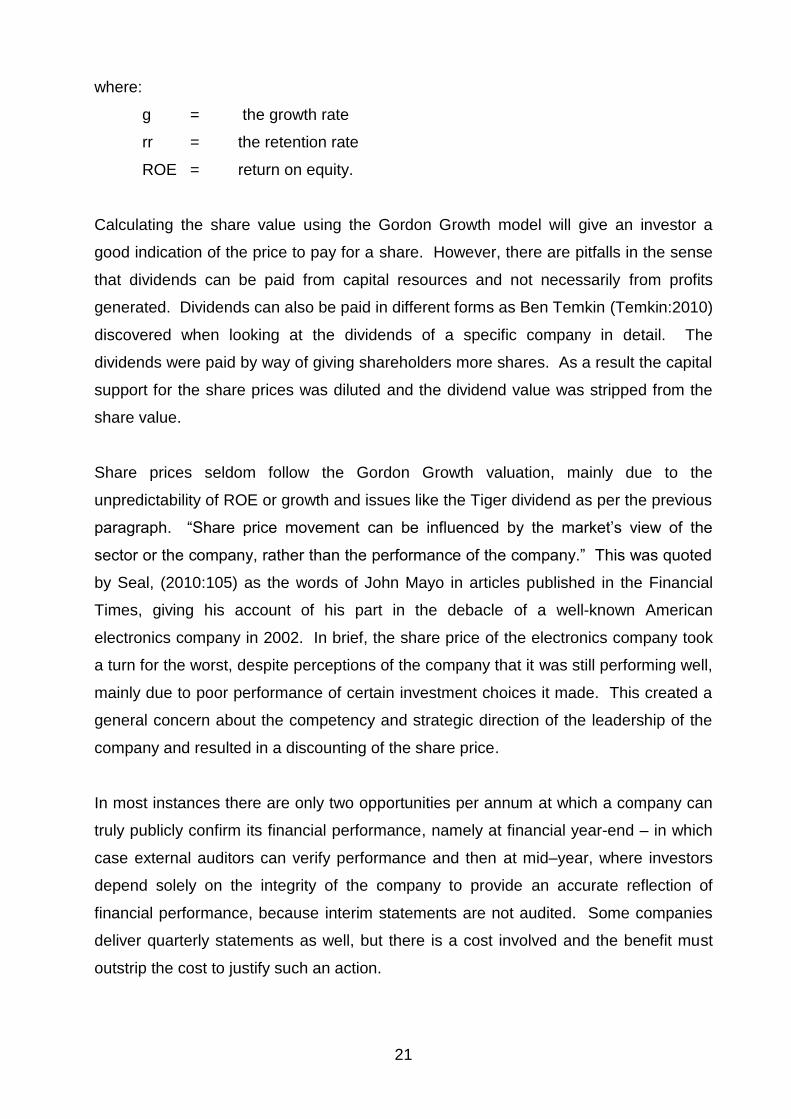
g = rr X ROE
21
where:
g = the growth rate
rr = the retention rate
ROE = return on equity.
Calculating the share value using the Gordon Growth model will give an investor a
good indication of the price to pay for a share. However, there are pitfalls in the sense
that dividends can be paid from capital resources and not necessarily from profits
generated. Dividends can also be paid in different forms as Ben Temkin (Temkin:2010)
discovered when looking at the dividends of a specific company in detail. The
dividends were paid by way of giving shareholders more shares. As a result the capital
support for the share prices was diluted and the dividend value was stripped from the
share value.
Share prices seldom follow the Gordon Growth valuation, mainly due to the
unpredictability of ROE or growth and issues like the Tiger dividend as per the previous
paragraph. “Share price movement can be influenced by the market’s view of the
sector or the company, rather than the performance of the company.” This was quoted
by Seal, (2010:105) as the words of John Mayo in articles published in the Financial
Times, giving his account of his part in the debacle of a well-known American
electronics company in 2002. In brief, the share price of the electronics company took
a turn for the worst, despite perceptions of the company that it was still performing well,
mainly due to poor performance of certain investment choices it made. This created a
general concern about the competency and strategic direction of the leadership of the
company and resulted in a discounting of the share price.
In most instances there are only two opportunities per annum at which a company can
truly publicly confirm its financial performance, namely at financial year-end – in which
case external auditors can verify performance and then at mid–year, where investors
depend solely on the integrity of the company to provide an accurate reflection of
financial performance, because interim statements are not audited. Some companies
deliver quarterly statements as well, but there is a cost involved and the benefit must
outstrip the cost to justify such an action.

22
In the meantime, the share prices fluctuate on a daily basis and produce significant
changes, seemingly without any changes in information regarding their financial
performance. This leads to the question: “What role does the financial results and
performance measurements play in the value of the share, what is recognised as the
major contributors to share price variation and how should these matters be handled by
the management of the company?"
Van den Heever (2007:108) concluded in her dissertation regarding share price
movement and capital structure that net operating profit after tax (NOPAT), net profit
after tax (NPAT) and free cash flow (FCF), of which NOPAT is a building block, have a
significant correlation with share price movement in the industrial sector of the JSE.
This result agrees with the basis of Koller’s (1994:1) argument that generated cash is
the only accurate measure of a company’s value.
2.1.6 Analysis
In order to test the above arguments regarding financial variables correlating with share
price movement and to statistically prove or reject the ability of certain ratios to predict
or at least correlate with share price movement, it is necessary to, within reasonable
logical sequence, present these ratios, define them and argue the reason for their
inclusion in the statistical analysis.
The logical analysis will actually start from a beginning balance sheet, containing all the
capital information needed to understand the base of revenue creation and profit
generation, back to an ending balance sheet, showing the outcome of the combination
of capital and activities in generating further capital.
For the purpose of this presentation, the sequence of discussion will be in line with the
order of appearance of information as contained in financial reports, which starts with
an income statement. What needs to be borne in mind is the fact that it may not
necessarily mean that the share price will move positively with delivery of positive
results. Results which are in line with expectation will hardly ever produce a change in
share price, because it has already been factored in by the time of publication
(Hillestad & Bank, 2007:117).

23
2.2 INCOME STATEMENT
An income statement is a report that reveals the efficiency and effectiveness of the
operations of a company in financial terms. Therefore values in and ratios that can be
calculated from income statement figures may be important, not only in the
management of operations but also in the context of value creation. Some of the
measures considered important in context of the above will be discussed below.
2.2.1 Profit margins
Profit margins are normally expressed as percentages simply because it allows users
to easily compare figures. It should be borne in mind that a variety of profit margin
figures can be calculated using different formulae. For the purpose of this study
attention will be afforded only to gross, operating and net profit margin. If expressed in
percentage terms, the profit margins mentioned above indicate what percentage of
sales is left after the deduction of costs. The purpose of using profit margins is to
establish the quantum of surplus funds generated after subtraction of specified
expenses.
It is important to note that profit margins do not measure cash generated - it only
measures the difference between specified variables in line with generally accepted
accounting practice (Kew et al., 2006:518). When used, it must be considered in
conjunction with the total cash cycle and realising that the cash cycle may have an
influence on margin values. The argument regarding cash cycle emphasises, namely
that care needs to be taken that every aspect which may influence profit margins is
considered when distributable reserves are determined.
The following is a more detailed look at the various profit margins measured.
Gross profit margin
Gross profit is calculated as sales less directly attributable costs; in other words the
amount of money that remains after direct production costs have been subtracted from

24
sales. Direct production costs include the following type of costs: overheads, labour,
office, fuel, resources and other used to operate the company.
The gross profit margin expressed as a percentage measures the percentage
difference between sales and cost of sales. From a management point of view gross
profit margin is an important measure because a positive profit margin indicates that
the company is able to cover direct attributable costs. Naturally the bigger the gross
profit margin the better. Gross profit margin is calculated as:
(Sales - Cost of sales) / Sales X 100
Given that a high gross profit margin is preferable in terms of the goal to create wealth
for shareholders and stakeholders, it is important to understand how management
interventions may influence gross profit. It is for example necessary to understand that
an increase in sales without an increase in costs at a slower rate than the increase in
sales, would not lead to an increase in the gross profit margin. On the contrary, a
decrease in the cost of sales will lead to an increase in the gross profit margin if sales
are kept constant. In this context the important aspects to manage are the factors that
contribute to the cost of sales. Similarly one has to understand that the lowering of the
mark-up percentage to increase sales may lead to an increase in gross profit, but it will
not lead to an increase in gross profit margins if the cost of sales is not reduced
proportionally. One also has to understand that an increase in gross profit will lead to
an increase in operating profit or operating profit margins, provided that the operating
cost is kept constant or increases at a slower rate than the rate at which gross profit
increases.
Correct interpretation and understanding the relationships between the variables that
influence gross profit margin, some of which have been discussed above, afford
management the opportunity to adjust management activities in order to achieve the
goal of wealth creation.
The bigger picture of the gross profit ratio is an indication of the ability of management
to accurately utilise the gap between cost of sales and sales, without negatively
affecting sustainability. Sometimes high margins can be maintained despite a large
competitive market and that could indicate advantageous marketing effort.

25
The formula sales/cost of sales has a complex base because cost of sales is defined
through effective stock control, purchasing and manufacturing efficiency. It can, for
diagnostic purposes, be broken down into its elements but the information may not be
available in the financial reports.
Operating profit margin
After subtracting overhead costs, the operating profit of a firm is calculated, indicating
how much surplus capital is available for repaying external finance charges (interest)
and tax and eventually how much funds are available for distribution to shareholders or
for reinvestment. The purpose of this measure is to isolate operating activities from
financing activities and tax in order to measure operating efficiency (Megginson et al.,
2007:51).
Calculated as
Operating profit/Sales X100
its purpose is to isolate interest and tax from the net profit formula in order to see the
profitability of the company before financing repayments and tax deductions.
Sometimes companies tend to do capital restructuring in order to reduce tax. This has
nothing to do with whether the company operates successfully, and successful
operation is the backbone of sustainability.
Net profit margin
Calculated as:
Net profit after tax/Sales X100
This ration is expressed as a percentage of sales.
After the gross profit measure, operating expenses are subtracted to establish net profit
generated. It is important to note the fact that this ratio does not measure cash
generated (Kew et al., 2006:518). As percentage of total sales, net profit will provide a
way to compare the effectiveness of operations of companies. It can also indicate

26
whether the company generates sufficient gross profit to service the operations
effectively.
2.3 FROM THE INCOME STATEMENT TO THE BALANCE SHEET
While the income statement gives a view of business conducted, the results of
operations are summarised in the balance sheet and movement can be seen in terms
of a beginning and end balance sheet.
2.3.1 Profitability in terms of capital utilisation
Although profitability is a good indication of operational efficiency, it has to be put to
perspective in terms of its relation to capital utilisation. In order to achieve this, net
profit after tax is put into relation to various combinations of capital utilisation and
information is derived as to how effectively assets were utilised.
2.3.1.1 Return on Assets (ROA)
As derivative of invested capital and due to the fact that investors' funds are usually
invested in assets in the company, it is necessary to determine whether the return on
assets have an impact on share price movement. ROA compares income to the total
assets used to earn the income. Managing assets from a value based management
point of view will intuitively result in more effective asset utilisation, followed by
improved return on assets.
The ROA ratio combines the income statement with the balance sheet. It specifically
points to the efficiency of use of assets. ROA is influenced by the profitability of the
company in terms of net profit, with the use of capital in terms of assets. Keeping the
assets at the same level and improving profitability will improve the ROA and vice
versa, while keeping profitability at the same level by utilising less assets will also
improve the ROA.

27
The main problem arising from the use of the ROA ratio is the fact that it reflects the
use of all capital and does not give an indication of which assets are being used less or
more efficiently. Distinguishing between current and non–current assets and
calculating ratios in respect of the effective utilisation of the last two mentioned balance
sheet items are expected to be necessary to truly predict the effectiveness of managing
these ratios in terms of share value.
The research of Alexakis et al., (2010:132) suggested that ROA along with other ratios
did not have a significant impact on share value for companies on the Athens stock
exchange. The mentioned results, however, are contradicted to a certain extent by
Prakash et al., 2003:2), concluding that the adoption of the EVA® consideration in
financial management processes was expected to impact positively on, amongst
others, profitability and debt management, both of these being building blocks of ROA.
The conclusion of the last writer supports the expectation of this report.
Defined as
Net profit after tax/Total assets X 100
Megginson (2007:52) defines ROA as:
Earnings available for common stockholders/total assets
Assets are used to produce income, which is why it is important to see whether it is
being used effectively. Companies use employees and funds to generate revenue from
assets. The effective use of the combination of funds and employees is expected to
be a key factor in maintaining sustainable long term profitability.
2.3.1.2 Return on equity (ROE)
ROE relates income to the starting equity of that specific financial year. Equity over
time is built up of the original investment of the owners of the company when created
and adding or subtracting the net retained income year on year. Growth in equity over
time indicates the actual value growth of the investment of the owners of the company.

28
However, there is a change in emphasis regarding the use of equity as measure of
growth in investors' value. In the case of a sole proprietorship, the equity directly
relates to the owners’ value, but in the case of companies, there is a disconnection
between equity and owners' value. While shares in a company trade at a specific value
after it changed ownership from the company to the shareholder, the value is not
directly connected to changes in equity.
Thus, although ROE as management ratio can say a lot about the profitability of the
company in terms of owners’ equity, it might not reflect acceptably in terms of the
capital invested by shareholders. When trading shares, the secondary owner of the
share, in other words, the investor purchasing the share from the first buyer of the
share after issue, does in fact not invest in the company but rather purchases a right to
the future yield of the share. The price at which it is purchased might or might not be
supported by underlying equity, but rather by the ability of the company to return a
profitable benefit to the owner.
The difference between owners' equity and the total trading value of the shares creates
a problem regarding the true contribution of ROE towards share value creation. A large
positive gap between equity and the market value of all shares, called the market gap
can have two meanings.
Either the company outperforms the value the equity should normally produces
or,
The equity of the company reflects below value assets or excessively valued
liabilities, depressing the equity to below realistic value.
The latter gap can create management pressure in terms of performance because,
while a 20% ROE could be acceptable for a sole owner, a shareholder who owns
shares at 120% of equity value will only earn 16.7% on his investment.
Managers, analysts and creditors use ROE to assess the effectiveness of the
company’s overall business performance. While nothing can be taken away from the
value of ROE as effectivity measure, as motivated by the argument of De Wet and Du
Toit below, there is a chance that ROE as measure of share value growth may fail.
29
Defined as
Net profit after tax/(Total assets – total liabilities) X100
In the literature study of De Wet & Du Toit (2007:60) it is argued why this is probably
the most popular measure used by analysts, managers, creditors and investors alike. It
was also concluded that its popularity might stem from the use of the Du Pont analysis
to compare certain efficiencies between companies.
ROE can be used as basis to start financial analysis and break it down in terms of the
Du Pont analysis to find the main drivers, and then further down into profitability, asset
utilisation and balance sheet structure or it can be the end result of detailed financial
analysis (De Wet & Du Toit, 2007:60). Coming from a book value base, the difficulty in
finding a link with share price is explained:
This measure ignores the value of the investment in terms of share price. Due to a
high market value add (high market to book), the return on share value may be
significantly lower than that of equity. This as such poses a considerable problem for
management of, particularly, long running companies with “old” assets. In terms of
accounting principles these assets should have low or even zero book value and have
a negative impact on equity. Thus, although the assets are recognised at depreciated
value, it still generates strong surpluses allowing for a high ROE. What needs to be
considered are the replacement cost of these assets and the impact of replacement on
ROE. Due to good results, the company performs well above market mean and
therefore generates a good picture for investors, creating a positive gap between net
asset value and share price. When assets reach replacement value, it may result in
below average ROE as soon as the replacement assets’ value is reflected in the
balance sheet. New assets have a double negative effect on ROE, impacting on
increased asset value and increased depreciation, both these items having reducing
effect on the ratio.
The relevance of the measure is again rather to determine the effectiveness as to how
capital, and more specifically the shareholders' interest, is utilised. Although it is a
necessary measure, one doubts its ability to predict share price movement. A study
done by De Wet & Du Toit in 2006 indicated what the research also expects, namely

30
that ROE fails to deliver a significant correlation with share price movement in the
industrial sector of the JSE (De Wet & Du Toit, 2007:64).
2.3.1.3 Return on investment
From a shareholder's point of view, return on investment will be the total cash yield in
terms of dividend as well as the growth in share price. Shareholders’ investment in the
company relates to the shareholders' equity at original share issue value. The concept
of total shareholders' return (TSR) is used to define this result. For the company, the
ROI will also be the ROA (Megginson, 2007:52).
Measuring the return on net assets will indicate the effectiveness at which capital is
employed. Again, being a profitability ratio, it is an indication of performance, which
relates to the ability of the company to generate profit in order to build up retained
earnings.
Ratios which will probably give a better representation of the rate of operating capital
movement in a company will be activity ratios:
2.3.2 Activity ratios
It is accepted that the correlation between activity ratios and eventual operating profit
will exclude these ratios from the initial model via the correlation matrix. This however
does not mean that the ratios do not contribute to value based management. Being
part of the finer detail of analysing the effective management of operating assets,
means that they will most certainly be part of the value based management process.
Activity ratios measure the rate at which companies are able to turn operating assets
into cash (Kew et al. 2006:47). Turning operating assets into cash at a fast rate
relieves pressure on financing requirements and allows the same invested capital to go
through more cycles op profit generation. As a result of increased cycles of profit
generation, return on invested capital increases.

31
The four most frequently used measures of effective utilisation of effective use of
capital are as follow:
2.3.2.1 Average collection period
Defined by (Thompson et al. 2010:105) as:
Accounts Receivable/(Total sales ÷ 365)
This ratio measures the effectiveness of credit extension and collection activities. A
company which can collect cash from its customers has good liquidity and does not tie
up funds in unproductive assets. A low ratio suggests effective collection activities.
However, a very low ratio may indicate an over-stringent credit policy that could cause
lost sales and profits. A high ratio suggests credit extension to poor credit risks and/or
ineffective collection efforts (Megginson et al. 2007:49).
Although debtors in arrears or not collected on time, in most cases earn an interest, this
interest earning is accepted never to compensate for the loss of profit on the capital not
utilized for operating activities. On the one side, it causes pressure on cash resources
and financing activities, worsening the gearing of the business and possibly drawing
financing cost and on the other side it is an opportunity cost for loss of profit. Poor
management of debtors, thus have a substantial effect on the net profit margin, return
on assets, return on equity and return on invested capital.
All the last mentioned variables are in one or more ways expected to have a significant
effect on share price, because it influences shareholders return. Again, the value
based management principles may suggest using activity ratios in order to have early
indications of meeting share value goals.

32
2.3.2.2 Total Asset Turnover Ratio
The asset turnover ratio is an indication of management’s effectiveness and its ability to
manage the assets efficiently. All assets in a company are financed either through
equity (owners’ capital) or liabilities (borrowed funds). Generating sales or revenue
from using all the company’s assets is accepted to be the key activity of a company.
As mentioned previously the more sales generated from use of assets, the less the
carriage cost of those assets are in relation to the total business activity, the higher the
return on shareholders capital is expected to be as long as the sales can be turned into
cash fast. Measuring sales to total assets is the first step in the du Pont analysis. The
du Pont analysis breaks down the sales activity to asset utilisation, brings it into context
of net profit margin and eventually breaks down sales, use of assets and profit, to the
area of importance and that is the owners’ portion of the profit. The balance of the
variables of the du Pont analysis is discussed in more detail after the balance sheet
measures.
Total asset turnover is defined as:
Sales/Total assets
Its significance is in its inclusion in the Du Pont analysis as being the measure of
efficient management of assets; a low asset turnover ratio signifies inefficient
management, seeing that the end result of turnover (sales) after expenses is the
determinant of the surplus available to service the carry cost of assets.
Assets are financed either through equity or debt and carry an opportunity cost as
explained later in this chapter.
2.3.2.3 Fixed Asset Turnover Ratio
The fixed asset turnover ratio is an indication of management’s effectiveness and its
ability to effectively utilise available resources. It is a more comprehensive measure
than asset turn over and explains the effective use of assets which are difficult to
liquidate to generate cash if not used effectively. Although, again the possibility exist
that it will not be added to the final regression models as such, it still remains

33
necessary to be included as a break down measure in the value based management
process.
2.3.2.4 Cash Coverage
The cash coverage ratio compares the cash generated by a company to its cash
obligation for the period (Megginson et al. 2007:50). Normally it is not the solvency of a
company which first indicates possible financial distress, but the availability of cash to
finance its operating activities. Cash coverage should be a very important determinant
for an investor in choosing the relevant investment, because it not only influences cash
available for operating activities, but also eventually the payment of external financiers
and dividends.
2.4 BALANCE SHEET CONDITION
The balance sheet is the core piece of information for the investor. The information
provided relates to the assets supporting the share value and the way in which it is
utilised and it changes from year to year (Megginson et al. 2007:49).
An indication of the types of financing used to acquire assets and the commitment that
can be incurred in terms of repayment is also provided in the balance sheet. External
debt has a repayment commitment and equity holders have to be satisfied that the
company, at all times, have the ability to service its external debt, thus the importance
of the mentioned information.
The balance sheet breaks down the sources of capital and the areas capital in
deployed and provides for the necessary information to assess the effective use of
assets and liabilities to generate shareholders profit.
34
2.4.1 Solvability and equity measures
Solvency refers to a company’s ability to meet its long-term obligations on a continuous
basis. Tests of solvency measure a company’s ability to meet these obligations. Three
ratios are used to measure solvency and equity position.
2.4.1.1 Debt-to-equity ratio
Above ratio expresses a company’s debt as a proportion of its owners’ equity and
illustrates the relationship between the amount of capital provided by the shareholders
and the amount provided by creditors. Debt to equity ratio is one of the ways to
measure the investors’ capital exposure to external finance. From an investor point of
view debt has a very positive outcome to the profitability of the company, due to the
fact that the total amount of assets used to generate revenue can be increased, without
investing more funds. The problem is however that the repayment of borrowed funds
has priority to the payment of shareholders return. As a result of the beneficial
treatment of debt, the investment risk increases for the investor. It is thus expected
that increased debt to equity, especially when it puts the investors’ funds at risk, may
have a negative effect on share price.
Debt to equity is the defining factor when it comes to effective balance sheet
management. With this ratio effectively controlling the cost of capital, expressed as
WACC or weighted average cost of capital, the effective use of owners’ equity versus
external debt will result in a low WACC - based on the assumption that the cost of debt
is cheaper than the cost of equity. (Megginson et al. 2007:158).
This is one of the areas where there is a conflict between the agency cost of debt and
the tax benefit. According to Megginson et al., (2007:460) high leverage increases the
probability of the firm encountering financial distress and its associated costs, but the
tax benefit of financing costs causes WACC to reduce, with an increase in debt finance.
The latter is only relevant up to the level where the external financiers will increase their
rate due to increased risk. There is thus an optimal point for a company, where the
WACC is at its lowest, given low interest on foreign debt and low agency cost (Correia
& Cramer, 2008:46). The Modigliani-Miller model allows for calculation of this point.

35
Debt interest pricing was found not to be consistent among financiers. There is no
consensus among banks and other financial institutions regarding the evaluation of the
company risk or the pricing relevant to finance that specific risk (own experience).
Therefore, although such an optimal debt ratio does exist, it is not easy to determine it
in practice. Common mistakes made by South African companies, as per the research
of Correia & Cramer (2008:85), is that it does not unlever and relever their beta
calculations for the calculation of WACC when doing capital structure adjustments.
This adds to lower correlation of a company’s performance, share price and expected
share price performance.
The benefit of using debt to increase assets is defined as the Equity Multiplier in the du
Pont analysis discussed later. The equity multiplier is the inverse of debt to equity, and
indicated the leverage obtained from finance.
2.4.2 Liquidity measures
Liquidity refers to a company’s ability to meet its current maturing debts (Megginson et
al. 2007, 46). Tests of liquidity focus on the relationship between current assets and
current liabilities. A company’s ability to pay its current liabilities is an important factor
in evaluating its short-term financial strength. Four ratios can be used to measure
liquidity.
2.4.2.1 Current ratio
This ratio measures the relationship between current assets and total current liabilities
on a specific date. It measures the cushion of working capital that companies maintain
to allow for the inevitable unevenness in the flow of funds through the working capital
accounts (Megginson et al. 2007:46).
Calculated as:
Current assets/current liabilities

36
2.4.2.2 Quick ratio
The quick ratio is a more stringent test of short-term liquidity than the current ratio.
Quick assets are per definition readily convertible into cash at approximately their book
value. The quick ratio is a measure of the safety margin that is available to meet a
company’s current liabilities.
Calculated as
(Current assets – inventory)/Current liabilities
None of the above measures as an exact benchmark, although companies would
prefer ratios of above 1:1 for the most sensitive of the ratios, it is industry dependent
and will be necessary to benchmark against concurrent companies (Megginson et al.,
2007:46). There is a fine balance between using creditors to finance stock purchases
and allowing debtors to repay at a later stage. The largest benefit can be obtained by
utilising as much as possible creditors days and try to reduce the debtors days to as
short as possible. The process of using the trade-off between debtors and creditor,
may allow for cash to be freed-up to invest in other projects. The risk of freeing up
cash may be allowing for funds not being utilized fully and cause an increase in the
total cost of funds.
Alexakis et al., (2010:5) concluded in their research that liquidity ratios like asset
turnover and current ratio as well as profitability ratios like operating profit margin and
return on equity had a positive relationship with changes in share prices. In the context
of value based management, these measures is expected to be included as
benchmarks for effectively managing the cost of capital and eventually net profit after
interest cost.

37
2.4.2.3 Du Pont Analysis
The building blocks of du Pont were discussed in previous sections. Although the du
Pont analysis is just another break down of the actual ROE, it is a fast way to measure
the efficiencies in a company. Being able to generating an acceptable-risk profit means
that the elements of the du Pont model should rather be in equilibrium and none of the
individual elements should be excessive.
Calculated as follow:
ROE = Profit margin [PM] X Total Asset Turnover [TATO] X Equity multiplier [EM]
Profit margin (PM) = Net income (NI)/Sales
Total Asset turnover (TATO) = Sales/Total assets
Equity Multiplier (EM) = Total assets/Equity
To generate a large profit margin, means that net income should be high and sales low,
but to generate an acceptable total asset turn over, it is assumed that sales should be
high and total assets low. Sales should not be high in the first equation except if net
income is even much higher. Net income can only be higher with the same amount of
sales if the operating cost is kept low, but this can cause sustainability problems due to
a chance of under spending on a certain key long term expense like research and
development or marketing.
The final element in reaching a high ROE is a large equity multiplier, but as discussed
earlier, this comes with a risk of not being able to deliver shareholders return, should
the company come under some sort of liquidity problem. Eventually the outcome will
be to evaluate the profitability of the owners’ originally invested capital, but it allows for
a bird's eye view on how the profit is reached.

38
2.5 INVESTMENT PERFORMANCE
The allocation of profit generated in the company is done per share in order to allow
investors to clearly understand their portion of the generated profit. This way,
comparing the profit with the initial investment in the share, will allow for an exact
indication of the shareholder’s investment performance.
2.5.1 Earnings per share
Earnings per share is viewed as the most common measure of share value, and as
discussed under the PE ratio EPS is mostly used for the most recent year and it is
calculated as the net profit after tax divided by the number of shares in issue at the end
of the year or the average number of shares in a particular year. This measure of
return on investment is based on the number of shares outstanding instead of the rand
amounts reported on the balance sheet and is the single most widely watched ratio.
Earnings per share, defined as
Net profit attributable to ordinary shareholders/No. of shares in issue
The number of shares in issue is calculated as the weighted average number of shares
on hand throughout the year, with the effect of any changes, equally distributed
throughout the year and across the shares (Kew, et al., 2006:523)
From a managerial point of view, it is expected that there is not a lot of direct influence
which can be effected on EPS, but it should be valuable to measure like-for-like
investment performance if the EPS values of different companies can be put to
perspective.
Although EPS says nothing about the underlying asset use, it can still be related to the
initial capital layout of the investor and enable the ability to calculate company return on
investment done by the investor. Whatever capital base the company used to produce
39
the profit, could be made irrelevant in terms of investor’s capital layout. It is expected
that earnings per share should exhibit a positive relationship to share price movement.
2.5.2 Cash and investments on hand
A term described for this by Megginson (2007:461) is financial slack, which indicates
large cash and marketable investments or shares, giving companies the ability to start
projects which it normally would not have done if it was necessary to issue further
shares or obtain external finance for such a project.
In a study done by Muller et al. (2009:27) to develop a model for predicting financial
distress in companies, one of the most important indicators of financial distress is a
lack of positive cash flow. Importantly Muller et al. (2009) refers to previous work it
reported on, pointing out that a company may survive a year or two with negative cash
flow, but will suffer financial distress in further years. Important to note is the reality
that all analyses on companies have one golden thread and that is that no single year
should be analysed in isolation.
Cash flow patterns can also be used successfully to determine the life cycle of a
company and as a result be used to interpret the state of the company’s financial
position (Steyn-bruwer & Hamman, 2005:16). This will unfortunately not work for
agricultural companies. Being mature companies, their cash flow patterns may vary
along the line of the crop expectation and finance requirement of farmers. As a result,
the financial position of most former co-operatives may be misread by investors.
2.6 TRENDS
Ratios are acceptable analysis tools but it does not provide for a view of the dynamics
of a company. Strategy is a long term process and needs to be assessed, looking at
the past and future. The only way to put a company’s performance into perspective is
to see where it came from.
40
2.6.1 Sales/revenue growth
This measures the revenue of the current year in relation to the previous.
Calculated as
(Sales or total revenue year 2) / (Sales or total revenue year 1) - 1
This ratio is expressed as percentage growth.
A positive sales growth is not necessarily good if it was done at the cost of sales
margins. Similarly, improved sales efficiency and lowering cost of sales may increase
the sales margin despite a decrease in revenue. Profit can be increased by changing
the sales mix to emphasise products delivering a high gross margin, without
necessarily increasing sales revenue.
The truth is also that, especially in the case of start-up companies and companies of
which strategy is built on sales growth, the rate at which its sales grow in relation to its
opposition is indicative of the change in market share. It is also true that the company
with the largest growth rate is probably increasing its share.
This has to be seen in context with gross and net margin growth. An effective market
share growth will mean that both gross profit margin and net profit margin are at least
maintained.
2.6.2 Profitability growth
Net profit, as percentage of revenue, gives a good indication of the total profitability of
the company.
The equation will look as follows:
Profitability = NPAT (Net profit after tax)/Revenue (sales) * 100
expressed as a percentage.

41
Profitability growth means the change in profitability over two or more sequential years.
Δ Profitability = (Profitability year 1/Profitability year 2) – 1
expressed as a percentage.
In this case it is extremely important to note the industry in which the company is
involved. A high profitability growth may be as damaging as a low one if the growth is
not sustainable.
Here the relevance of further diagnostic ratios is noted. Growth in profitability, being a
ratio, does not necessarily mean increased earnings. Profitability can increase with a
decrease in revenue as a result of increasing sales margins, but losing market share.
Putting profitability into perspective with equity will address the above shortfall and
allow it to be benchmarked.
Again, this is rather a measure of the efficiency and effectiveness with which the
company operates and does not say a lot about shareholders' return. It can, however,
influence the shareholders' return, given the fact that it evaluates the performance of
the company and thus the confidence shareholders have in the operating model and
management team.
2.6.3 EBITDA growth
This ratio is defined as:
Earnings before interest and tax excluding depreciation and amortisation, compared
between years. The only difference between this and the earnings per share measure
is the fact that it measures only cash related earnings and thus excludes the effect of
the asset value on the earnings. This is mostly done to enable analysts to measure the
true operating performance of the company.

42
2.6.4 Earnings per share growth
EPS growth will thus be calculated as
Δ EPS = (EPS year 2/EPS year 1) * 100%
Criticism against earnings per share is that it ignores changes in the share price and
share numbers between comparative years. This means that if a share price changed
in the relevant period (i.e. an investor bought the share at a different price than the
starting price of the measuring period), or further shares were issued, shareholders
revenue would be impacted. It also ignores the relevant capital used in generating the
earnings.
Growth in EPS is relevant in the sense that it gives an indication of the effective
execution of the business plan. Comparing it to a budgeted figure, it will relay the
operational efficiency of the business. De Wet (2004:26), however, found no real
significance between market value add (measure of share performance) and EPS.
However, this does not mean that there cannot be a correlation between change in
share price and EPS, thus its inclusion in the study. What needs to be noted though, is
that accounting data can be manipulated, for instance the way sales are recorded or
stock calculated (Kleiman, 2011:2).
2.7 GENERAL COMMENTS ON FINANCIAL VARIABLES
Koller (1994:90) is of the opinion that traditional financial performance measures, such
as earnings or earnings growth, not always manage to indicate value creation. In his
opinion discounted cash flow value should be used by companies in order to focus on
value creation. This should be used to set performance goals and has to be included in
short-term financial targets, which only measure performance. This agrees with other
researchers indicating that there is a lack of support for shareholder value creation
when using pure financial measures. De Wet & Du Toit (2007:59) also suggest that
traditional accounting measures of performance like earnings per share, return on
assets and dividends per share were perceived to be the correct determinants of share

43
value but other researchers found less than a significant correlation between these
measures and value. Bosman (2007:48)’s research added criticism to the use of
accounting based analysis, noting that it does not make provision for capital charge. It
is therefore impossible to determine the expected return for the shareholder.
However true Bosman’s argument may be, it is necessary to determine which of the
financial performance ratios or measures a company can use to best determine the
result of share price movement. At least it is possible for the company to promote its
performance as part of an investor drive if it can clearly state its comparative
performance and it is assumed that this can drive share price behaviour.
2.8 NON–FINANCIAL VARIABLES
In order to achieve the financial goals, a company is expected to have non–financial
objectives. These objectives can include, amongst others, customer satisfaction,
product innovation and employee satisfaction. The objective of the latter is to drive and
motivate the total staff complement and serve as guide, driving behaviour in other ways
and from a different angle than what is provided by the financial reports. Although with
a different impact, non-financial factors should still drive the company in line with value
adding financial goals (Koller, 1994:91). According to Koller (1994:91) the most
successful companies are the ones performing well in the non-financial areas. It goes
without saying that the specific set of non-financial goals is something requiring
considerable discourse and debate and has to take into account the company's
financial circumstances. An example Koller uses is of a contractor for the US Defence
Force, which should not include a "no layoffs"-policy in its objectives to increase the
staff morale, because it can cause inefficient staff utilisation when contracts are
completed or terminated and staff numbers cannot be reduced in line with necessity.
According to De Wet & Du Toit (2007:59) it is a more difficult task for managers to
determine if value adding goals are met than to set the goals. One of the reasons for
this difficulty can be expected to be an inability to see the impact of the implementation
of goals on the end result, namely share value.

44
2.8.1 Management credibility
The most important issue listed by Ernst & Young (2008) is that a company should
deliver on its promises. It must stay true to its projections and accurate on its budgets.
There is not a lot of empirical study regarding the change in investor behaviour in terms
of reaction to possible break-down in management credibility, but the media is full of
accounts of share price reaction on the verge of exposing management scandals.
Shareholders’ reaction should not be limited to scandalous behaviour, but can be
subtle at the discovery of certain commitments not being met or a change of direction,
deviating from the stated strategy. Thompson et al. (2010:102) notes that a company’s
performance and strategy goes hand-in-hand. When a company tends to perform
poorly, its strategy can be questioned. A weak strategy consistently leads to poor
financial performance.
2.8.2 Corporate strategy execution
Companies have to prove a strong strategy. The belief in the strategy will be reflected
in the market value add, after listing. Strategy is the road map of a company, indicating
the process of unlocking the value in the resources. As resources can be described as
assets, defined as the current value of future benefits, the strategy has a dire impact on
the value of the assets, thus the operational value of the company. The measuring of a
company’s key financial performance ratios, according to Thompson et. al (2010:102),
will provide sufficient insight into the effectiveness of the strategy and its execution. It
can thus be derived that, when a company has a large market value add, the investors
have confidence in its strategy.
2.8.3 Quality of corporate strategy
Not only must the strategy be executed successfully, but it has to have all the
characteristics of sustainable growth.
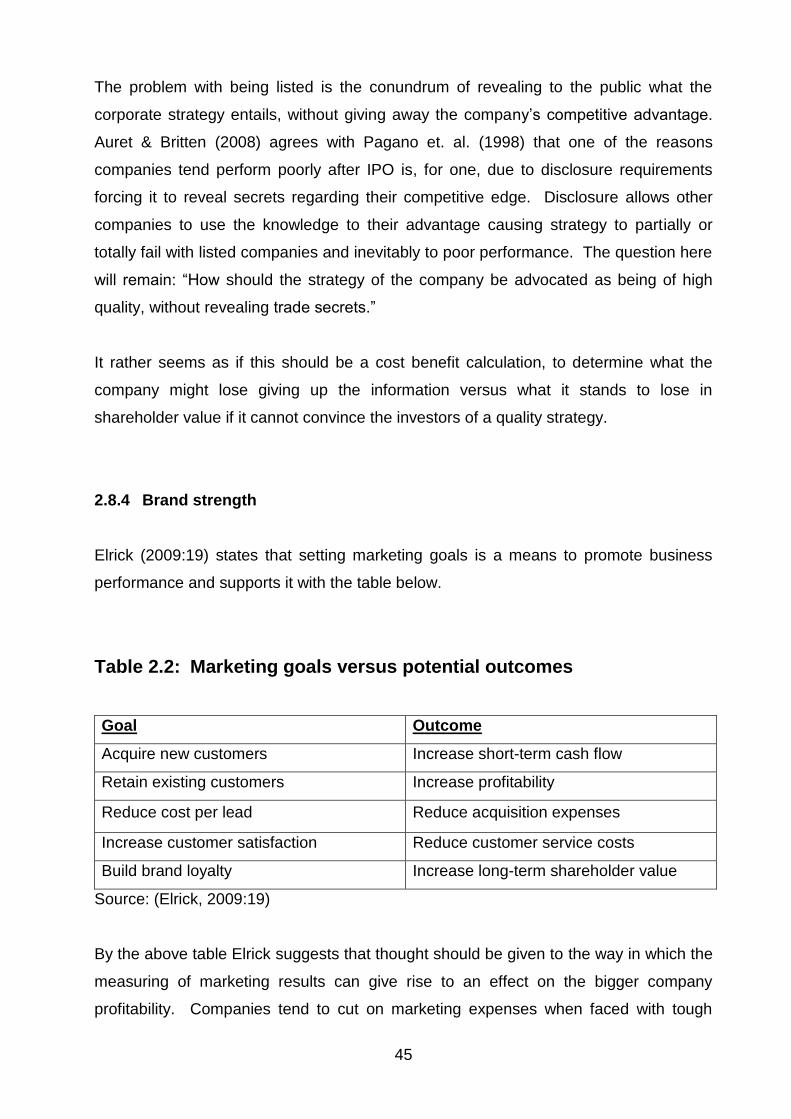
45
The problem with being listed is the conundrum of revealing to the public what the
corporate strategy entails, without giving away the company’s competitive advantage.
Auret & Britten (2008) agrees with Pagano et. al. (1998) that one of the reasons
companies tend perform poorly after IPO is, for one, due to disclosure requirements
forcing it to reveal secrets regarding their competitive edge. Disclosure allows other
companies to use the knowledge to their advantage causing strategy to partially or
totally fail with listed companies and inevitably to poor performance. The question here
will remain: “How should the strategy of the company be advocated as being of high
quality, without revealing trade secrets.”
It rather seems as if this should be a cost benefit calculation, to determine what the
company might lose giving up the information versus what it stands to lose in
shareholder value if it cannot convince the investors of a quality strategy.
2.8.4 Brand strength
Elrick (2009:19) states that setting marketing goals is a means to promote business
performance and supports it with the table below.
Table 2.2: Marketing goals versus potential outcomes
Goal Outcome
Acquire new customers Increase short-term cash flow
Retain existing customers Increase profitability
Reduce cost per lead Reduce acquisition expenses
Increase customer satisfaction Reduce customer service costs
Build brand loyalty Increase long-term shareholder value
Source: (Elrick, 2009:19)
By the above table Elrick suggests that thought should be given to the way in which the
measuring of marketing results can give rise to an effect on the bigger company
profitability. Companies tend to cut on marketing expenses when faced with tough

46
economic conditions, but do not realise that marketing is the front runner of revenue.
Reducing marketing expenses can be detrimental to future growth. Investors should
use this as indicator of company performance.
It is also acknowledged that the ability to measure the building of brand value via return
on investment is ineffective, but in order to maintain customer association a company
has to have a visible brand that is recognised as steady and well accepted. It is
suggested that although one needs to be careful about spending, it is necessary for the
market to see the name and to learn to recognise it. It is not interpreted well by
prospective investors and customers to stop doing brand visibility advertising in tough
times. Elrick (2009:19) suggests that there are cost-effective ways to investigate in
order to at least maintain the brand.
Elrick (2009:20) suggested certain drivers of brand value which can be visible in any
company. Using these measures and setting benchmarks with specific measures and
targets, like percentage increase in market share versus a specified expectation, will
allow for significant evaluation of brand value. When communicating with the market,
follow-up of the communication will ensure sensible measure (Elrick, 2009:20).
In summary it can be derived that the benefit of brand strength and marketing efforts
will be impacting in two major areas in the income statement, namely:
Revenue growth
Gross profit margin,
but similarly can impact negatively on the net profit margin. By comparing the net profit
ratio and gross profit ratio year-on-year and between companies, the impact and cost
of these efforts can be compared.
2.8.5 Corporate governance practices
Given the past experience of companies like Enron and a few locals, the focus is ever
increasing on the presentation of credible evidence to the company’s performance and
the controlling functions being done by independent “watch dogs” removed from the
opportunities to interfere with stated information.

47
The board of directors, in its capacity as representative of the shareholders, has a clear
function and mandate to watch over the making and implementation of strategy by the
appointed management.
In this, the board has four obligations (Thompson et al., 2010:49):
1. The board has to be inquisitive and be objectively critical when overseeing the
company’s direction, strategy, and business approaches.
2. The ability of executives of the company to create strategy and execute it must
be evaluated and their skills need to be tested and compared to the market.
3. Put together a sensible financial incentive and remuneration system for
executive management to ensure the correct behaviour and actions, aligned with
stakeholders, but importantly in the shareholders' interest.
4. Controlling the company’s accounting and financial reporting and the compliance
and integrity thereof.
According to Thompson et al. (2010) every company should have a strong,
independent board of directors (also prescribed by the JSE) that:
(1) stays informed about the total performance of the company,
(2) provides guidance to the CEO and other top executives and judges their
input
(3) has to be able to stand up to management if their actions appear not to be
appropriate and create or take unnecessary risk,
(4) provides certification to its appointees that the CEO and executives deliver
on the expectation of the board,
(5) be mentors to management and deliver advice when necessary, and
(6) is in frequent high level debate about the advantage or disadvantage of the
actions of key directors and executives.
Again, the above is prescribed by the King Commission (Engelbrecht, 2009), but in
cases where the board does not comply with these functions, the core value of
corporate governance is lost and allows for debacles as mentioned previously
(Thompson et al., 2010). In terms of King III (Engelbrecht, 2009) corporate governance
failures can be subject to civil and criminal action against failing board members.

48
2.8.6 Ability to recruit / retain talent
One of the most difficult aspects of a company’s value and performance to measure is
the quality of staff. Again, the only way to at least get an indication of staff value is to
analyse the income statement ratios and determine whether operational efficiencies are
reached and maintained. The effective execution of strategy lies firmly in the hands of
the management team and staff. The ability of the management to mobilise staff skills
and the level of skills at which staff operate in relation to their cost is probably not
clearly measurable, but a combination of staff turnover, cost per individual and spread
between management and operating staff, might shed some light on this valuable
resource.
Intuitively, strategy can only be executed effectively if the right skilled and job fit talent
is available and fully functional. Recruiting top talent will be dependent on the view
potential recruits have of the company. The company is valued by different people for
different reasons and when high quality people indicate there willingness to be part of
it, it indicates a vote of confidence. Similarly, it will reflect poorly on the company if it
loses what appears to be a top individual, especially on executive level.
2.8.7 Quality of internal relations guidance
The ability to operate in a conflict free (ideal world) environment will increase
productivity and stimulate intrapreneurship (entrepreneurs within corporates). Last
mentioned is something a company cannot expect to excel without. Focus is placed on
the development of team work and a positive working environment conducive to
smooth performance.
2.8.8 Market share
Closely coupled with brand strength, market share is an element of the larger
marketing strategy and should only be one of the measurements for evaluation of

49
effective strategy execution. Elrick (2009:20) suggests the following metrics to
consider when evaluating market share:
1. Growth in active customer numbers. Both the numbers and the rate of growth
should be measured.
2. More related to marketing is: What is the advertising and marketing expense per
active customer and how does it compare with reasonable competition? Elrick
(2009:20) suggests that marketing communication expense related to the number of
customers gained should be evaluated.
3. The ratio between active and non-active customers. This is to determine what
proportion of the total customer base is actually buying. Changes in this ratio can also
be indicative of the effectiveness of the advertising campaign.
4. “Customer churn rate”: What is the rate of customers leaving versus customers
joining? (Elrick, 2009:20)
The above metrics do not necessarily mean maximising market share as such, but
optimising it and creating a suitable structure to service the market may optimise profit
and sustainability. In line with the law of diminishing returns, there should be an
optimal point regarding marketing spend. As such, large corporates in the South
African environment are frequently challenged by the competition authorities when they
try to improve their already large share of an established market. Refer to the cases
recently concluded against well-known companies.
Interestingly, a study done by (Becker et al. 2009:8) on the impact of data quality of
banks, indicate that most businesses suffer from bad data quality. The result of this is
that even market share data tends to be incorrect, causing key drivers of performance
measures to follow suit. This may result in overstated growth prospects – one of the
facets identified as a key driver of share value.
In essence, the above means having reliable data is of the essence in all
measurements. Companies tend to focus purely on the accuracy of financial reporting,
mostly due to the highly regulated environment it is presented in, but failure to purify
the trading base and using incorrect data to build the strategy from can prove fatal to
strategy execution.

50
2.8.9 Customer satisfaction
Unless the product the company trades in, or the service it delivers is an absolute
necessity and there are no competitors, the ability to satisfy customer needs and
expectations is one of the key focus areas of any business. Customers are the
business platform of any firm generating sales, irrespective of what is being sold or the
service being delivered. Being the main driver of advertising and marketing, a large
portion of new business generated is not necessarily from expensive marketing drives
of ad campaigns, but is supported by a strong customer base. Changing sales revenue
is expected to be directly related to customer satisfaction.
2.8.10 CEO leadership style
The function of the CEO is to drive the strategy of the company. Using the team of
selected individuals to develop a sound strategy and to facilitate direction and urgency,
the ultimate responsibility vests with him/her to lead the process of making and
implementing strategy (Thompson et al., 2010:37)
2.9 VALUE–BASED MANAGEMENT
When evaluating firm performance, conventional measures tend to evaluate mostly
accounting performance. Share value differs from accounting performance in the
sense that investors evaluate the company’s performance based on what they could
earn on their investment should they have invested in an alternative company or
prospect (Magni, 2009:1). This is done by determining the future prospects and
possible growth of the value of the investment in that company accordingly. When an
investor sees a possible value investment, the price paid to purchase the shares will be
determined by the calculated prospective income of this investment and not necessarily
by the company equity or current book value. Harry Domash clearly says it is how
profitable investors think the company will be in future (Domash, 2010:12). The latter
51
creates a gap between the actual equity in the company and the market value of the
share equity.
Value based management is the process by which sense is made of the above-
mentioned gap in areas such as culture, performance measurement, financial
information systems and incentive design (Koller, 1994). The sum total of the use of
financial ratios as performance measures and non-financial measures is accepted to be
the value creating activities in a company.
While total shareholder return (TSR) is a key measure to focus on in order to maximise
shareholder value, this measure can be difficult to use internally. Factors like interest
rates, general economic conditions and terminal values in particular have a major
impact on share value and are not within a manager's control. There are timing issues
where share price is an indication of expected future and not historical performance.
There may be accountability issues, specifically if the inability exists to assess the
contribution of individual business units to TSR. Finally, there are decision-making
issues in trying to determine how individual managers can contribute directly to TSR.
Koller (1994:87) stated that a company should have performance measures which
have the ability to overcome the shortfalls of financial ratios, which focus on
shareholder return and which are in correlation with it. He lists some of the measures
in use at the time of writing as: economic spread, economic value added and cash flow
return on investment (CFROI). He recognises that most measures calculate only a
component of the bigger picture and none of it singularly has the ability to predict or
explain total shareholder return. The measured functionality also vary from company to
company and each company's management team should thoroughly investigate the
relevance of certain measures to determine its ability to predict total shareholder return
and that it does not cause undue pressure on administration.
It was touched on lightly in previous sections of this chapter, but due to the fact that
investors tend to choose investments by way of expected future benefits they generate,
most recent developments in financial management suggest the use of residual value
theories to determine share value. All of these theories have a few things in common:
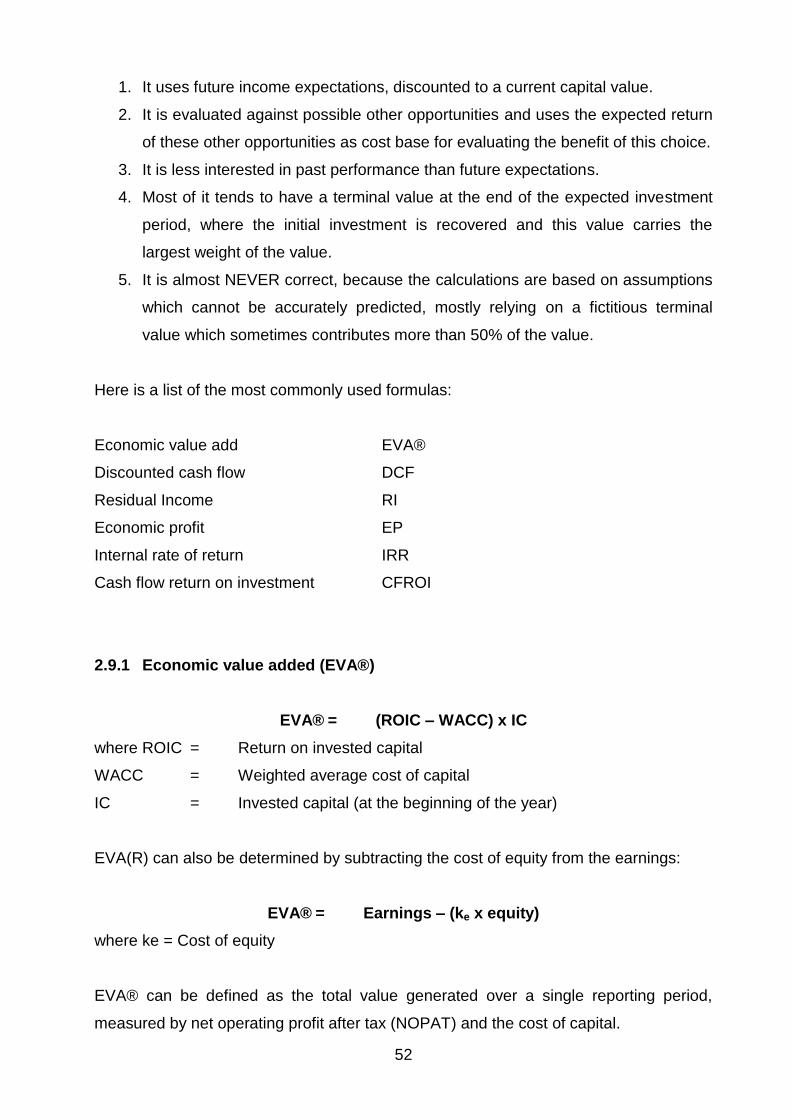
52
1. It uses future income expectations, discounted to a current capital value.
2. It is evaluated against possible other opportunities and uses the expected return
of these other opportunities as cost base for evaluating the benefit of this choice.
3. It is less interested in past performance than future expectations.
4. Most of it tends to have a terminal value at the end of the expected investment
period, where the initial investment is recovered and this value carries the
largest weight of the value.
5. It is almost NEVER correct, because the calculations are based on assumptions
which cannot be accurately predicted, mostly relying on a fictitious terminal
value which sometimes contributes more than 50% of the value.
Here is a list of the most commonly used formulas:
Economic value add EVA®
Discounted cash flow DCF
Residual Income RI
Economic profit EP
Internal rate of return IRR
Cash flow return on investment CFROI
2.9.1 Economic value added (EVA®)
EVA® = (ROIC – WACC) x IC
where ROIC = Return on invested capital
WACC = Weighted average cost of capital
IC = Invested capital (at the beginning of the year)
EVA(R) can also be determined by subtracting the cost of equity from the earnings:
EVA® = Earnings – (ke x equity)
where ke = Cost of equity
EVA® can be defined as the total value generated over a single reporting period,
measured by net operating profit after tax (NOPAT) and the cost of capital.
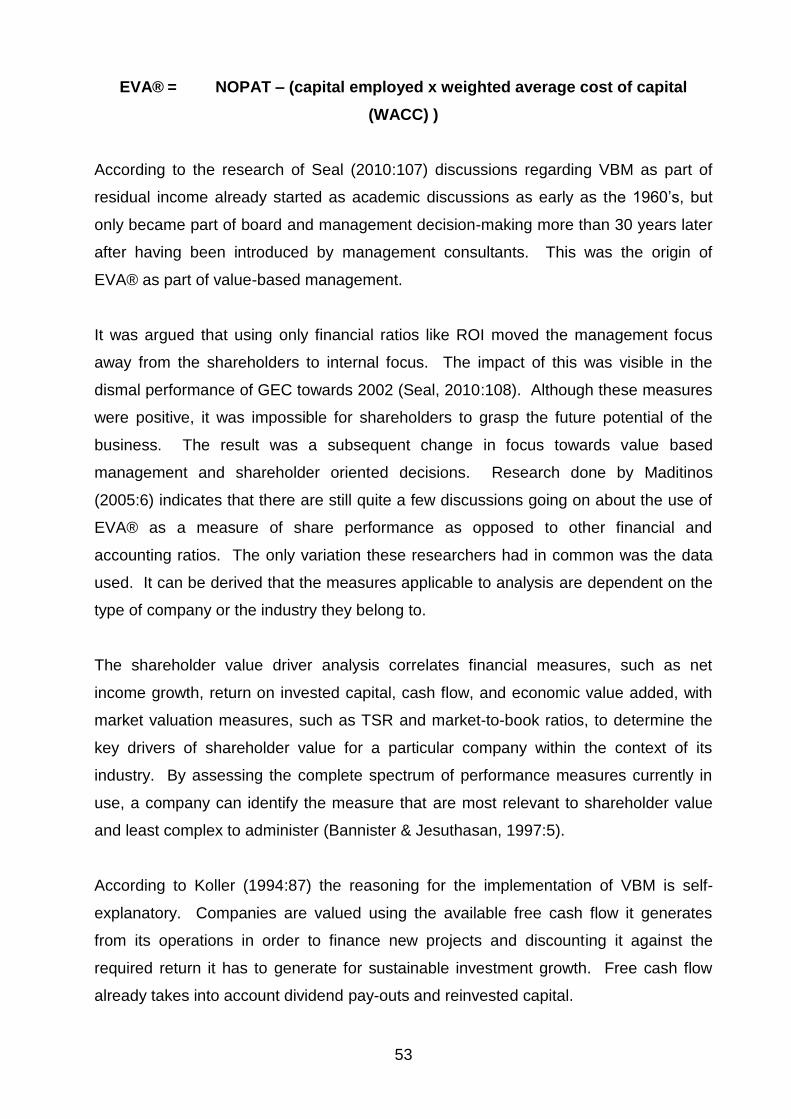
53
EVA® = NOPAT – (capital employed x weighted average cost of capital
(WACC) )
According to the research of Seal (2010:107) discussions regarding VBM as part of
residual income already started as academic discussions as early as the 1960’s, but
only became part of board and management decision-making more than 30 years later
after having been introduced by management consultants. This was the origin of
EVA® as part of value-based management.
It was argued that using only financial ratios like ROI moved the management focus
away from the shareholders to internal focus. The impact of this was visible in the
dismal performance of GEC towards 2002 (Seal, 2010:108). Although these measures
were positive, it was impossible for shareholders to grasp the future potential of the
business. The result was a subsequent change in focus towards value based
management and shareholder oriented decisions. Research done by Maditinos
(2005:6) indicates that there are still quite a few discussions going on about the use of
EVA® as a measure of share performance as opposed to other financial and
accounting ratios. The only variation these researchers had in common was the data
used. It can be derived that the measures applicable to analysis are dependent on the
type of company or the industry they belong to.
The shareholder value driver analysis correlates financial measures, such as net
income growth, return on invested capital, cash flow, and economic value added, with
market valuation measures, such as TSR and market-to-book ratios, to determine the
key drivers of shareholder value for a particular company within the context of its
industry. By assessing the complete spectrum of performance measures currently in
use, a company can identify the measure that are most relevant to shareholder value
and least complex to administer (Bannister & Jesuthasan, 1997:5).
According to Koller (1994:87) the reasoning for the implementation of VBM is self-
explanatory. Companies are valued using the available free cash flow it generates
from its operations in order to finance new projects and discounting it against the
required return it has to generate for sustainable investment growth. Free cash flow
already takes into account dividend pay-outs and reinvested capital.

54
Companies can only create value when the profit generated outstrips the cost of the
capital invested, thus the EVA® or EP reasoning. According to Kleiman (2011: 3)
accountants do not measure economic profit. They are only interested in the book
profit, without taking into consideration the capital charge. Value based management
extends the concept of residual income to a drive created in the company, both in
terms of strategy as well as operations in line with the required outcomes and vision.
The result of effective use of these measures by management is an alignment between
company vision, drives and strategic direction with total shareholders return.
For VBM to function successfully, the drivers of value in the organisation should be
found. This can be any variable which can affect the value of the company. Below is a
table extracted from the McKinsey report (1994) that depicts the levels of value drivers
as can be found in the average organisation.
Diagram 2.1: Levels of value drivers
LEVEL 1
Generic
LEVEL 2
Business unit-specific
Examples
LEVEL 3
Operational
(Grass roots level)
Examples
Customer mix
Sales force productivity
(expense against revenue)
Percentage of accounts
revolving
Dollars per visit
Unit revenues
Fixed cost/allocations
Capacity management
Operational yield
Billable hours to total payroll
hours
Percentage of capacity
utilised
Cost per delivery
Accounts receivable terms
and timing
Accounts payable terms and
timing
(Source: The McKinsey Quarterly 1994 no: 3, p. 91)
ROIC
Margin
Revenue
Costs
Invested capital
Working capital
Fixed capital

55
The drawback of valuation based measures is that it is stock market driven and as a
result it follows market movements directly in line with economic performance (Bloom et
al., 2002:16). Bloom questions the ability of the value ratios to function as forecast
mechanisms due to the above. However, Ryan & Trahan (2007:30), concludes that the
firms it analysed managed to increase their economic profit for longer periods. While
economic profit relates to value add to shares, it may mean that despite these external
factors, these firms would have been sought after and as a result would have incurred
increased prices.
De Wet & Du Toit (2007:64) found that the result of calculating the economic value add
as a spread between ROIC and WACC and multiplying it with the invested capital, was
a rand value which correlated better with share prices than ROE.
As most arguments about value based management and residual income pertain to all
measures, the balance of these value measures are only defined and it is expected that
different variations of the same base will feature through different time periods,
depending on the emphasis placed on it at that specific stage.
The following definitions are included for the sake of completeness.
2.9.2 Discounted cash flow (DCF)
Similar to the Gordon Growth model, using dividends to calculate the price of a share,
the DCF has its origins in the accrual of available cash for future investment.
2.9.3 Residual income (RI)
Net profit after tax less capital charge (Magni, 2009:1) The capital charge is usually
calculated as the required return on investment by investors or as defined via the
CAPM model. Basically it is similar to the calculation of economic profit (Inman:2011).

56
2.9.4 Economic profit (EP)
Economic profit = Accounting profit - Cost of equity.
(De Wet & Du Toit, 2007:61). The cost of equity can also be defined as the opportunity
cost of the invested funds (Drake, 2007).
2.9.5 Internal rate of return (IRR)
Future income stream, discounted to present value at a rate equal to capital charge
(refer to RI), with the initial outflow of the invested capital (Baker, 2006:1).
2.9.6 Cash flow return on investment (CFROI)
Internal rate of return of the inflation adjusted income stream (Magni, 2009:15). It can
be calculated as net operating cash flow as percentage of invested capital.
2.10 SUMMARY
Even within the realm of financial goals, managers are often confronted with many
choices: boosting earnings per share, maximising the price/earnings ratio or the
market-to-book ratio and increasing the return on assets, to name a few. Koller [We]
strongly believe that value is the only correct criterion.
In saying this, Koller actually means that using value as a bottom line derivative of all
above measures, will result in positive (or at least predictable) share price reaction and
the ability to manage financial as well as non-financial measures in terms of the effect it
will have on the value of the shares of a company. It should be noted that no company
can indefinitely outstrip its competitors on financial performance on an annual basis,
but much can be said about a company’s ability to maintain positive long-term earnings
yield. The return on invested capital (ROIC) combines these two sources of uncertainty
57
and its variability can be used to measure business risk on a stand-alone basis
(Brigham & Ehrhardt, 2005:550); (van den Heever, 2007).
Although care has been taken to include all the above ratios and analysis instruments
in the empirical studies, it needs to be noted that, especially the income statement
ratios, would highly correlate with one another. The most accurate and relevant
variables were deployed to ensure that all options were covered.
58
CHAPTER 3
Research method and data analysis
3.1 INTRODUCTION
A successful outcome of this study would mean that a food and agricultural company,
intending to list its shares on the JSE, will be able to understand which financial
measurements can be used to determine the factors which may influence the
movement of its share price and to what extent it can expect it to move. The fact that
all the companies in the study are listed on the JSE and have to adhere to IFRS and
GAAP accounting standards, makes it easier to compare and derive statistically
relevant information from the comparison.
There is, however, different ways of interpreting the standards, and for that matter the
data used, sourced from McGregor BFA, is standardised by McGregor BFA to reflect
similar asset reporting systems between companies. This allows for statistical analysis
to build a case for drawing up management decision guidelines for a JSE Limited Food
and Agricultural sector listed company.
As concluded in Chapter 2, there is still a lot of research to be done regarding
variances in the share price within years. Given that companies are obliged to submit
financial reports only once a year means that a company can only truly be evaluated by
investors upon presentation of its annual results. This is the only time at which it can
be established whether the share price is matched with company performance.
It is assumed that financials are usually only presented in the order of two and a half
months after year end. Usually the company issues at least a trading statement to
indicate whether its performance is in line with its projections, but it is only on
presentation of the financial figures that the real performance is reported.
59
In the months before and after the presentation, investors determine what to make of
the information and movement in the share price is expected. The reality is that the
only way to smooth out movement not related to financial performance is to use the
average share price for the last month before financial year-end. For this reason, year-
end share prices have been excluded from the analysis.
3.2 THE FOOD SECTOR
Due to the various operating models that exist for businesses and the various main
revenue generating sources, companies listed on securities exchanges worldwide get
grouped by exchanges into similar revenue sources and operating models. These
criteria usually give way a homogenised view on companies grouped together. These
views should be able to give the potential investors a picture of what trends can be
expected for a specific company. The external environment, consisting of the macro-
economy, politics, social interaction, legislature and technology, is constantly changing
and affecting an impact on business. (Mbuthia & Ward 2003) Grouping together
companies on the securities exchanges should result in largely similar drivers
impacting performance. These groupings are called sectors, referring to the industry
sector (JSE, 2011:1). At the respective financial year-end for companies listed on the
JSE Food Sector, there were 14 active companies. Due to the small population, all
companies listed in this sector since 1991 were included in the sample. The sample
thus consists of the full population from 1991 to 2009, a total of 19 years.
3.3 METHOD OF ANALYSIS
Multiple linear regression was done amongst all the companies listed in the food sector
of the JSE for each of the 19 years ending 2009. The reason for 2009 was to ensure
that the financial year-end figures of all companies were available. The variables
discussed in Chapter 2 were put to test against the average share price for each of the
19 years in succession. A multiple regression model was developed, which most
significantly described the dependent variable, in this case being the average share
price. Variables, most commonly occurring as playing a significant role in determining
60
the average share price, were identified as the most useful for establishing
management measures resulting in effectively predicting the share price in future. The
process was done in 4 phases:
Phase i
Defining the independent variables and motivating its inclusion in the research. This
was done by literature study in Chapter 2. Detail was provided to the building blocks of
the ratios, its practical use and arguments for and against it.
Phase ii
Calculation of the ratios from data received from McGregor BFA. Ratios were tested
and confirmed as correct.
Phase iii
A correlation matrix was drawn up for each of the years. The independent variables
with the highest correlation with the dependent variable were selected and all
independent variables correlating to these variables were removed. This was done at a
70% correlation or higher. The exercise was repeated for each of the 19 years. It is
noted that most of the variables removed were building blocks of variables entered.
The reason for including the building block variables was to test that it as such did not
provide for better prediction than the results of the calculation it was entered in.
Phase iv
The variables with the highest correlation to the dependant variables were modelled
through multiple regression analysis, by first determining the coefficients and then
removing the variables with the highest variance inflation factor (VIF). Only models
with variables having a VIF lower than 5 were accepted.
The statistical model for a multiple linear regression is:
Yi = 0 + 1x1i + 2x2i + … + kxki + єi for i = 1, 2, ..., n.
“The proportion of variation of the dependent variable Y that is explained by the
independent variables x1, x2, …, xk in a multiple linear regression is given by the
squared multiple correlation, R2(Levine et al., 2008:573).

61
The value of the coefficient of correlation for the sample can vary from -1 (perfect
negative correlation) to 1 (perfect positive correlation). A value of zero indicates that
there is no relationship between the variables. Values for the coefficient of
determination will always be positive and will be between zero and one. The coefficient
of determination can be expressed in percentage to indicate the measured proportion
of variation in the dependent variable that is explained by the changes in the
independent variable.
3.3.1 Key assumptions
The four key assumptions behind this regression model that need to be checked
according to Levine et al. (2008:529) are:
1. Linearity
There is a linear relationship between y and the x variables. This can be checked by
producing scatter plots before the regression process is started. These scatter plots
need to indicate that there is a linear relationship between y and the x variables by
confirming that the variables are evenly spread above and below zero deviation. No
other pattern is visible.
2. Independence
The requirement is that the errors (єi) are not dependent on one another, in other words
no autocorrelation exists. When data points collected in sequence and the data point
following the previous one is dependent on that previous point, independence does not
exist. This can be done by using residual plots or the Durbin-Watson test.
3. Normality
The regression errors (єi) are normally distributed from the mean for each value of X. A
frequency distribution of residual values will indicate whether normality exists.
4. Equal variance
The variance of the error (єi) must be similar in scale for lower as well as higher x
values, in other words the y values must not increase in variation from low x values to

62
high x value. When this is not the case hetero-scedasticity exists and a regression line
cannot be fitted with confidence. A scatter plot will indicate if a pattern exists.
As mentioned, the full set of data available for this sector was included in the research.
Unfortunately some years had less than 8 companies, while others had up to 14. The
result was an extremely high coefficient of multiple determination and difficulty in
confirming the above key assumptions.
3.3.2 Model significance
According to Levine et al. (2008:578) three methods can be used to evaluate the
overall usefulness of a multiple regression model:
The coefficient of multiple determination R2.
The adjusted R2; and
The overall F test.
The coefficient of determination, R2, measures the movement in Y, the dependent
variable that is explained by movement in X, the independent variable in the case of
linear regression. In a multiple regression model adjusted coefficient of multiple
determination is used as a measure of the proportion of variation in the dependent
variable that is explained by the set of independent variables.
The adjusted R2 reflects both the number of independent variables in the model as
well as the sample size used.
The F-test as defined by Levin et al., (2008:584) is used over all to test the significance
of the relationship between the dependent variable and the entire set of independent
variables.
63
F = MSR / MSE
Where:
MSR is the mean square of regression for the group; and
MSE is the mean square error.
The p-value or observed level of significance is the probability of getting a test statistic
equal to, or more extreme than the sample result.
Only variables with a variance inflationary factor (VIF) lower than 5 were left in the
model. The VIF is a measure for collinearity, meaning that two or more independent
variables may be correlated to one another. A VIF in excess of 5 will cause the
necessity to use other methods of model building than the least squares regression
model of regression. The formula for calculation of VIF is:
VIFj = 1 / (1 – Rj2)
R2 j being the coefficient of multiple - determination for independent variable Xj with
any of the other variables.
For each of the 19 years the data was evaluated for statistic relevance. All the
available data was included in the study and although certain anomalies were found, it
was accepted to be reasonable to the operating environment for these companies and
was not excluded.
3.4 RESULTS OF THE ANALYSIS
The full procedure of development of the regression model is only illustrated for year
one. The same procedure was followed for all of the 19 years.
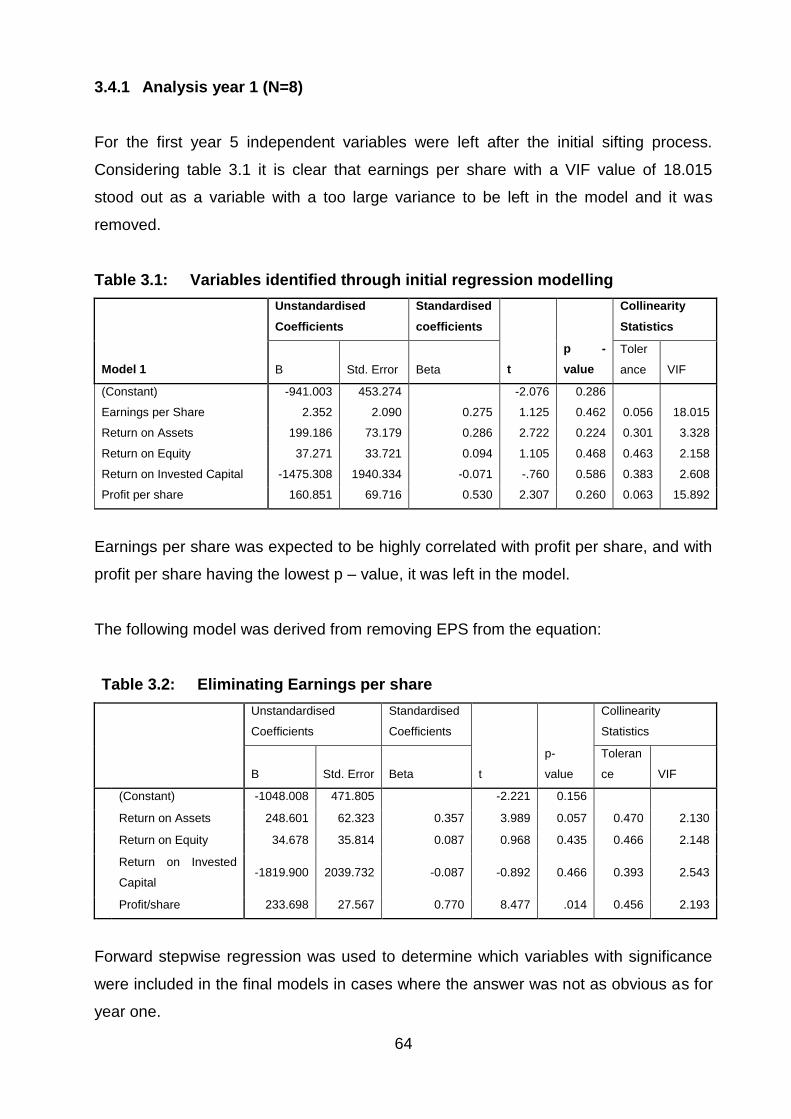
64
3.4.1 Analysis year 1 (N=8)
For the first year 5 independent variables were left after the initial sifting process.
Considering table 3.1 it is clear that earnings per share with a VIF value of 18.015
stood out as a variable with a too large variance to be left in the model and it was
removed.
Table 3.1: Variables identified through initial regression modelling
Model 1
Unstandardised
Coefficients
Standardised
coefficients
t
p -
value
Collinearity
Statistics
B Std. Error Beta
Toler
ance VIF
(Constant) -941.003 453.274 -2.076 0.286
Earnings per Share 2.352 2.090 0.275 1.125 0.462 0.056 18.015
Return on Assets 199.186 73.179 0.286 2.722 0.224 0.301 3.328
Return on Equity 37.271 33.721 0.094 1.105 0.468 0.463 2.158
Return on Invested Capital -1475.308 1940.334 -0.071 -.760 0.586 0.383 2.608
Profit per share 160.851 69.716 0.530 2.307 0.260 0.063 15.892
Earnings per share was expected to be highly correlated with profit per share, and with
profit per share having the lowest p – value, it was left in the model.
The following model was derived from removing EPS from the equation:
Table 3.2: Eliminating Earnings per share
Unstandardised
Coefficients
Standardised
Coefficients
t
p-
value
Collinearity
Statistics
B Std. Error Beta
Toleran
ce VIF
(Constant) -1048.008 471.805 -2.221 0.156
Return on Assets 248.601 62.323 0.357 3.989 0.057 0.470 2.130
Return on Equity 34.678 35.814 0.087 0.968 0.435 0.466 2.148
Return on Invested
Capital -1819.900 2039.732 -0.087 -0.892 0.466 0.393 2.543
Profit/share 233.698 27.567 0.770 8.477 .014 0.456 2.193
Forward stepwise regression was used to determine which variables with significance
were included in the final models in cases where the answer was not as obvious as for
year one.

65
The beta value is used to determine the level of influence of the independent variables
and in combination with significance the p-values, it is determined which variables stay
in the model. From table 2 it is clear that return on assets with p-value 0.057 and profit
per share with p-value 0.014 will be included in the regression equation. When tested
for validity the model comprising of the return on assets and profit per share yielded the
results in table 3.3
Table 3.3: Validity of model 1
Model F - value p - value
1 65.980 0.015
The F-value represents the significance of the relationship between the dependent and
the full set of independent variables, the higher the value, the better. The p-value
represents the level of significance, in this case the closer to zero the better. A p-value
of 0.015, thus smaller than 0.05, means the model is significant at a 95% confidence
interval.
The final model derived for year 1 is displayed in table 3.4.
Table 3.4: Final Model for year 1
Final Model, year 1
Adjusted R Square
0.977
Unstandardized
Coefficients
Standardised
Coefficients
t p-value
Collinearity
Statistics
B
Std.
Error Beta VIF
(Constant)
Return on Assets
Profit per share
-
1008.247
423.092
-2.383
0.076
266.042 46.376 0.382 5.737 0.005 1.379
224.216 20.217 0.739 11.091 0.000 1.379
66
With beta being the coefficient indicating magnitude of change in the dependent
variable for a unit change in the independent variable, it is clear that ROA has a larger
influence on the dependent than profit per share.
Multiple regression model for year one
Average share price (Y) = -1008.247 + 266.042 (ROA) + 224.216 (Profit per share)
The unstandardized coefficients are used in the final formula for the purpose of
validation, while standardising the coefficients express the variables as a sum total of
one in order to indicate which variable has the greater effect on the dependent variable,
when their unit of measurement varies (Schroeder et al., 2011). The interpretation of
the standardised beta is the change that will occur with the dependent variable as a
result of a 1 unit change in variation of the independent variable.
The importance of the variable is thus not based on its coefficient, but rather on its
standardised coefficient β, indicating its contribution to the prediction of the dependent
variable (Dallal, 2011).
To illustrate this, a graph was drawn, depicting the strength of the effect of changes in
certain variables to change the dependent variable.

67
Graph 3.1: Contribution of the variables to the model
Interpretation of the above graph is as follows:
1st tier - The independent variable appearing first in the regression equation.
First bar to the left of each year.
2nd tier - The independent variable appearing second in the regression equation.
Second bar to the left of each year.
3rd tier - The independent variable appearing third in the regression equation.
Third bar to the left of each year.
A frequency distribution of the independent variables occurring in the models is
discussed in the final chapter, but what is relevant to the above table is that with the
exception of 1994, the independent variables with the highest contribution to the model
had a larger than 0.6 to 1 effect on the dependent variable.
Due to the small number of companies listed in this sector, the number of observations
was too low in most cases to confirm linearity of the model.
It could, however, be confirmed that most of the data appeared linear, normally
distributed, was not dependent on one another and adhered to the equal variance
principle.
-.400
-.200
.000
.200
.400
.600
.800
1.000
1.200
19
91
19
92
19
93
19
94
19
95
19
96
19
97
19
98
19
99
20
00
20
01
20
02
20
03
20
04
20
05
20
06
20
07
20
08
20
09
Co
ntr
ub
uti
on
of
vari
able
to
mo
de
l (1
= 1
00
%)
Year
1st tier
2nd tier
3rd tier

68
3.3.2 Test for effective use of regression
Following the procedure discussed above, the multiple regression models for each of
the years were derived. In most of the years following year one forward stepwise
regression was used to narrow the amount of variables down to the most significant.
Table 3.5 provides detail of the models derived, the significance of the models (F-
value), the coefficient of multiple-determination R2 and the p-value.
Table 3.5: Multiple regression formulas for the period 1991 to 2009
YEAR FORMULA DERIVED F - value
R
Square
Adjusted
R Square p-value
1991
Average Share price = -1008.247 +
266.042(ROA) + 224.216(Economic Profit
per share)
153.460 .987 .981 .000a
1992
Average Share price = -469.478 +
575.864(Price to book) + 699.195(NOPAT
per share)
190.632 .987 .982 .000b
1993
Average Share price = 1219.894 –
260.942(Dividend yield) – 2508.804
(ROIC) + 719.853 (NOPAT PER SHARE)
+ 0.003 (Economic value added)
12595.45 1.000 1.000 .000b
1994
Average Share price = 3015.085 +
0.009(EVA) – 12320.662(Current ratio) +
636.640(ROE) -0.046(CEVA)
2.960 .689 .457 .161a
1995
Average Share price = -134.921 +
101.986(NOPAT per share)
117.308 .951 .943 .000a
1996
Average Share price = -1401.208 +
99.013(Price/Earnings) +
1085.182(NOPAT per share) – 97.722
(Economic Profit/share)
320.275 .997 .994 .000b
1997
Average Share price = -47.398 +
1214.033(NOPAT per share)
227.197 .987 .983 .000b
1998
Average Share price = -303.207 +
9.855(EPS) + 125.465( Economic Profit
per share)
355.548 .994 .992 .000c
1999
Average Share price = -108.867 +
1.017(NAV per share) +
115.884(Economic Profit per share)
104.899 .959 .950 .000a
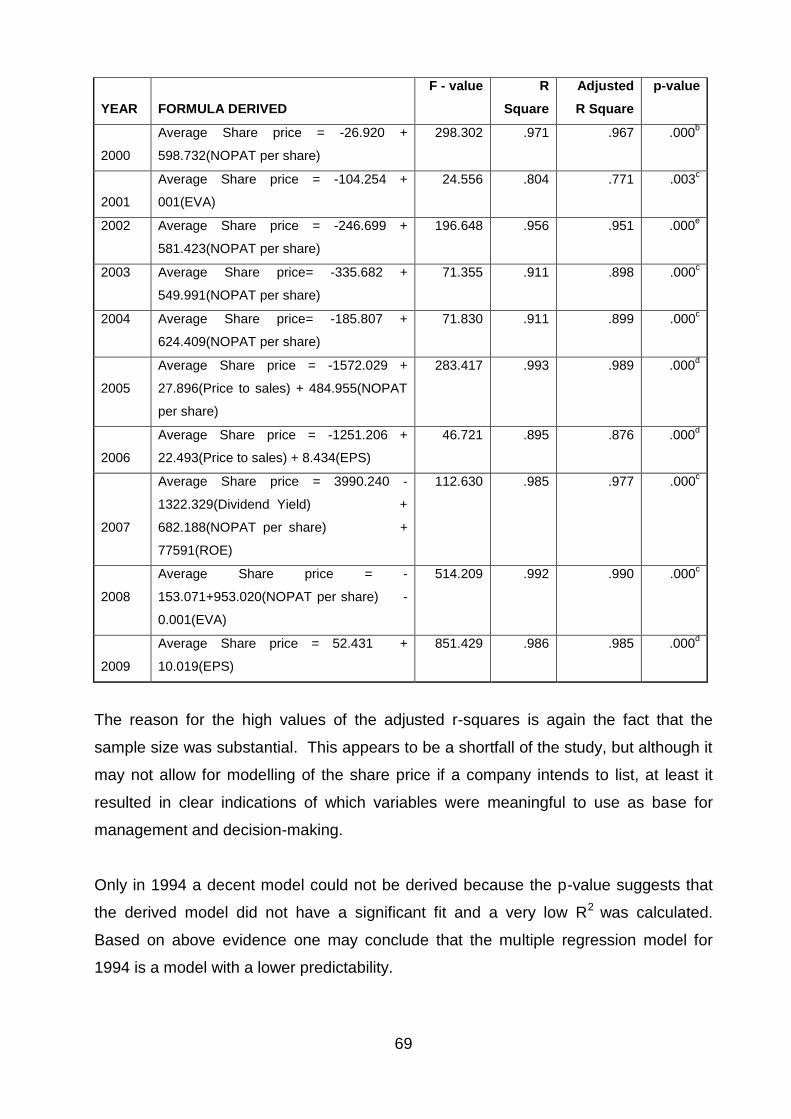
69
YEAR FORMULA DERIVED
F - value R
Square
Adjusted
R Square
p-value
2000
Average Share price = -26.920 +
598.732(NOPAT per share)
298.302 .971 .967 .000b
2001
Average Share price = -104.254 +
001(EVA)
24.556 .804 .771 .003c
2002
Average Share price = -246.699 +
581.423(NOPAT per share)
196.648 .956 .951 .000e
2003
Average Share price= -335.682 +
549.991(NOPAT per share)
71.355 .911 .898 .000c
2004
Average Share price= -185.807 +
624.409(NOPAT per share)
71.830 .911 .899 .000c
2005
Average Share price = -1572.029 +
27.896(Price to sales) + 484.955(NOPAT
per share)
283.417 .993 .989 .000d
2006
Average Share price = -1251.206 +
22.493(Price to sales) + 8.434(EPS)
46.721 .895 .876 .000d
2007
Average Share price = 3990.240 -
1322.329(Dividend Yield) +
682.188(NOPAT per share) +
77591(ROE)
112.630 .985 .977 .000c
2008
Average Share price = -
153.071+953.020(NOPAT per share) -
0.001(EVA)
514.209 .992 .990 .000c
2009
Average Share price = 52.431 +
10.019(EPS)
851.429 .986 .985 .000d
The reason for the high values of the adjusted r-squares is again the fact that the
sample size was substantial. This appears to be a shortfall of the study, but although it
may not allow for modelling of the share price if a company intends to list, at least it
resulted in clear indications of which variables were meaningful to use as base for
management and decision-making.
Only in 1994 a decent model could not be derived because the p-value suggests that
the derived model did not have a significant fit and a very low R2 was calculated.
Based on above evidence one may conclude that the multiple regression model for
1994 is a model with a lower predictability.

70
In order to get clarity on which ratios most commonly appeared in the regression
equations, a frequency table was created where each occurrence of the variables was
marked with an X for every company for every year. The total in respect of each
variable was then tallied and tabled as per table 3 below:
Table 3.6: Frequency of ratios appearing in the models
List of
ratios TO
TA
L
19
91
19
92
19
93
19
94
19
95
19
96
19
97
19
98
19
99
20
00
20
01
20
02
20
03
20
04
20
05
20
06
20
07
20
08
20
09
EVA 4 x x x x
Cash flow
dividend
cover 6 x x x x x x
Price to
sales 5 x x x x x
Dividend
Yield 2 x x
EPS 4 x x x x
Net asset
value per
share 5 x x x x x
Operating
profit
margin 2 x x
Price to
book 4 x x x x
Price
Earnings 1 x
ROA 3 x x x
ROE 3 x x x
Dividend
yield 1 x
CROIC 2 x x
Hamada
required
WACC 1 x
NOPAT
per share
1
3 x x x x x x x x x x x x x
Comp EVA 4 x x x x
CFROI 1 x
EP per
share 5 x x x x x

71
It is evident from the table that the most frequently appearing variable is NOPAT per
share (13 times), followed by cash flow dividend cover (6 times) in second and, in third
place, price to sales (5 times). After that, net asset value per share and economic profit
per share and all the others follow.
It is also clear that the emphasis shifted from Economic profit per share to Economic
value added in around 2000, which coincides with the introduction of the concept of
EVA® as financial management term by Stern and Steward to the market. Investors
are not really interested in return on assets and return on equity. They rather prefer to
link the performance, valuation and choice of share to invest in, in the ability of the
investment to outperform the opportunity cost of that invested capital. Cash flow return
on investment did not really make the cut but it is interesting to note that the cash
available to pay dividends is placed second.
3.5 SUMMARY
In this Chapter the process of modelling a multiple linear regression model was
explained and the data was modelled according to these procedures. A multiple linear
regression model was drawn up for each of the 19 years of the study similar to the
method elaborated on for year 1. The results were tabled, with the R squared, adjusted
R squared F test result and p-value and it was shown that it was possible to model all
years with the exception of one.
A further table was drawn up to indicate which independent variables occurred most
throughout the 19 years, with NOPAT per share being reflected as the most frequent
independent variable. The order of appearance of the 5 variables occurring most in the
regression equations derived for the 19 year period to explain change in share prices
are:
1. Net operating profit after tax 13 appearances.
2. Cash flow dividend cover 6 appearances
3. Economic profit per share 5 appearances
4. Net asset value per share 5 appearances
5. Price to sales 5 appearances

72
It has to be added though that variances of economic profit models, such as Economic
Value add, Economic profit and Company Economic value add, in total occurred
thirteen times as well, also placing further emphasis on residual income variables.
There is no apparent trend at which these variables entered into the equations. Some
of the appearances are earlier in the data and others fragmented throughout. It thus
carries value to take note of the capital charge of delivering profit and not only pure
profit.
The fact that the companies with the largest influence on the models are older, more
mature companies, may contribute to the fact that capital charge may play second
fiddle to NOPAT, but it also has to be borne in mind that these companies are running
at an extremely low debt ratio and as a result, low external debt repayment risk to the
investors.

73
CHAPTER 4
Results of Empirical study, attempt to model a share price trend for a
JSE Food Sector listed company and conclusion.
Objective of this chapter
The method and results of the multiple linear regression analysis were presented in
chapter 3. In this chapter a conclusion will be drawn of the results, the management
value will be discussed and it will be attempted to model the share price of a company
intending to list for at least five years, based on the performance information as per
financial results.
4.1 INTRODUCTION
After long deliberation and extensive advice from management advisory companies,
one particular agricultural business finally announced that it is preparing to offer its
shares to the public via the JSE Securities Exchange. To determine whether it will be
accepted by investors on the JSE as a company that will meet or exceed the
expectations of the shareholders, it is important to compare the performance of the
company and its shares, with companies it will be joining in the same sector.
When a company lists it shares, it will be compared to the companies in its peer group.
An analysis of the share price performance of the companies expected to be in the
company intending to list’s peer group, may give an indication of what to expect of the
share price in a listed environment.
The essential purpose of this dissertation was to find key performance measures from
which a share price could be derived in order to understand the effect of changes in
these measures on share prices in the JSE Food Sector. A successful outcome of this
study would at least entail a strong enough regression model to determine which
independent variables may have a strong influence on the dependent.

74
The independent variables being financial ratios and valuation metrics all expressed
per share, and the dependent being the average share price for the last month before
year- end of the same year as the ratios were derived.
Variables identified to be significant in respect of decision-making could then be used
as a management tool for the company in order to balance performance with the
expected share price, thus optimising management efficiency and value unlocking of
the company’s shares. The intention was to also identify the possible shortcomings
and advantages a company might have had in a non-listed environment.
Following from this research, will be to establish whether multiple linear regression
could be used for the same company over years.
4.2 RESULTS
By getting a correlation between performance measures and share price movement, it
was possible to establish whether key drivers can be identified on which shareholders
or potential investors will base their buying or selling decisions regarding the trading of
shares. For all but one year, strong relationships, well above the 95% significance,
were obtained.
To illustrate the importance of the different variables in terms of model prediction, a
graph was drawn up. Graph 4.1 indicates the number of times variables appeared over
the 19 year period:

75
Graph 4.1: Frequency of variable occurrence in the test sample
Graph 4.1 contains a graphic illustration of the frequency of occurrence of independent
variables as derived from the multiple regression modelling over the 19 year period.
Net operating profit after tax clearly stands out as being the most frequent occurrence,
followed by cash flow dividend cover and a mix of three
This means that the variables with the strongest influence on the average share price
are:
1. NOPAT per share, being the major contributor - 13 out of the 19 years
2. Earnings per share, as major contributor - 3 times in 19 years
3. Profit per share, EVA® (VAD) and Current ratio, being the final 3.
4.3 MODELLING OF A JSE FOOD SECTOR COMPANY SHARE PRICE
Efforts to model a company’s share price with the derived formulas resulted in a poor
return. This is mostly ascribed to the fact that there is no consistency regarding the
calculated weighted average cost of capital, which was a building block of economic
profit and EVA® (Auret & Britten, 2008).
0 2 4 6 8 10 12 14
NOPAT per shareCash flow dividend cover
Price to salesNet asset value per share
EP per shareEVAEPS
Price to bookComp EVA
ROAROE
Dividend YieldOperating profit margin
CROICPrice Earnings
Growth in salesHamada required WACC
CFROIEquity Multiplier

76
The formula for WACC contains a recordable interest cost on the finance portion, but
the cost of equity tends to be a biased amount. Using the CAPM model was not
possible due to the variance between the volatility of the over the counter market
versus the listed environment. The value of cost of equity from calculation of the peer
group had one coefficient namely the β or beta value which could not be derived.
Former agricultural co-operatives have a unique business model and method of
reporting of turnover as well, causing the price to sales ratio not to reflect a similar
result than the companies on the JSE. The grain sold as part of the commodity finance
process has to be included in turnover, according to international reporting rules, which
blows this figure out of proportion.
These two unique aspects were the main reasons for the failure of the modelling effort.
However, it presents a logical question as to whether other listed food companies do
not also contain such uniqueness, resulting in analysts not being able to accurately
determine its true performance.
4.4 MANAGEMENT VALUE
The actual goal was achieved in that key financial ratios could be derived to be used as
management tool in the value-based management process in order to ensure a positive
outcome on the share price and eventually shareholders value.
4.5 DISCUSSION AND FUTURE PROSPECTS
It is assessed that the most effective value measurement for companies in the food
sector is NOPAT per share, followed by cash flow dividend cover. It is accepted that
this is the basis that a JSE Food Sector listed company should use to evaluate its
performance going forward.
In order to effectively implement value-based management for the company, the
formula for NOPAT should be broken down to its key elements and the relevant areas
77
in the company these elements are clearly defined should be identified. Goals should
be set and a set of benchmarks should be created. If the company intending to list has
a specific share price target in mind, or a certain percentage growth, the measurements
can be quantified.
A separate document should be drafted to ensure a detail road map indicating what is
expected to be achieved, with target dates and reward/penalty clauses to drive the
correct behaviour. The use of a balanced score card for this purpose is advised.
4.6 CONCLUSION
Although the literature appears to be inconclusive about what measures correctly
predicted shareholders value and the change in share price of companies over time,
this study managed to achieve a positive result, which can be used by companies listed
in the Food Sector of the Johannesburg Securities Exchange. It is also expected that
these measures have relevance for most companies in a similar business environment
and with similar business drivers.
The results per company and for each year show significant similarities with the
findings of Moolman and Du Toit (2005:88) and in other studies NOPAT came out as
the preferred measure. It is also consistent with the findings of a study done on the
Oslo Stock Exchange (Hillestad & Bank, 2007:121), with the logical explanation that
with high (low) operating profits there will be more (less) wealth to distribute amongst
the investors. Further support is found in the research of Pablo Fernandez (Fernández,
2001:1) on 582 companies in the United States of America. It is suggested that EVA®
and cash value do not contribute to market value add results at similar levels than
NOPAT. The case for cash flow dividend cover is accepted in that most investors with
these companies in their investment portfolios are looking for sound dividend streams.
The result is that companies in this sector are seen as “Cash cows”, in other words,
mostly matured companies, with a steady revenue stream and profit base.
Maintaining an economical and profitable business, with good dividend streams and
acceptable growth, will thus ensure sustainable value creation.

78
BIBLIOGRAPHY
Alexakis, C., Patra, T. & Poshakwale, S., 2010. Predictability of stock returns using financial statement information : evidence on semi-strong efficiency of emerging Greek stock market. Applied Financial Economics, 20(911724993), pp.1321-1326.
Auret, C.J. & Britten, J.H.C., 2008. Post-issue operating performance of firms listing on the JSE. Investment Analysis Journal, (68), pp.21-30.
Baker, S.L., 2006. The Internal Rate of Return. Health (San Francisco), pp.1-16. Available at: http://hspm.sph.sc.edu/courses/Econ/irr/irr.html [Accessed May 2, 2011].
Bannister, R.J. & Jesuthasan, R., 1997. Is Your Company Ready For Value-based Management? Journal of Business Strategy, 18(2), pp.1-6.
Becker, J., Gloerfeld, F., Poeppelbuss, J., Bruhns,P., 2009. The Impact of Data Quality on Value Based Management of Financial Institutions,Association for Information systems, pp.1-13.
Bloom, J.Z., Lambrechts, I.J. & Roux, N.J., 2002. The behaviour of financial ratios for capital and labour intensive enterprises during the economic cycle. Journal for the study of Economics and Econometrics, 26(1), pp.51-70.
Bokpin, G.A. & Abor, J., 2009. Financial policy and corporate performance: Evicence from emerging market economies. Finance, 11, pp.24-36.
Bosman, P.W., 2007. Stakeholder value in South Africa: An empirical Study. North West University. M Com dissertation.
Carbaugh, R.J., 2007. An Applications approach to Contemporary Economics 4th ed. J. W. Calhoun & A. von Rosenburg, eds., Mason: Thomson South - Western.
Correia, C. & Cramer, P., 2008. An analysis of cost of capital , capital structure and capital budgeting practices : a survey of South African listed companies. Meditari Accountancy Researcy, 16(2), pp.31-52.
Dallal, G.E., 2011. No Title. , pp.1-2. Available at: http://www.jerrydallal.com/LHSP/importnt.htm [Accessed May 5, 2011].
de Wet, J.H. v H., 2004. EVA versus traditional accounting measures of performance as dirvers of Shareholder value. Available at: ssrn.com/abstract = 1656338.
de Wet, J.H.V.H. & du Toit, E., 2007. Return on equity : A popular , but flawed measure of corporate financial performance. South African Journal of Business Management, 38(1), pp.59-69.
Domash, H., 2010. Investing 102 : Pick a stock and buy it. MSN Money, pp.12-14.
Drake, P.P., 2007. The objective of financial management. James Madison University, pp.1-7.
79
Elrick, M., 2009. Measuring to demonstrate value in a tough economy. Communication World, 7(4), pp.16 - 20. Available at: www.iabc.com/cw.
Engelbrecht, L., 2009. King Report on Corporate Governance for South Africa - 2009, Institite of Directors, pp 1-118.
Fernández, P., 2001. EVA and Cash value added do NOT measure shareholder value creation. Source, pp.1-17.
Fox, M.B., Smith, A.F.,Durnev, A.,Morck,R.,Yeung, B., 2003. Law,share price accuracy and economic performance: The new evidence. American law and Economics association, pp 1-70.
Hillestad, O.-christian & Bank, N., 2007. An analysis of financial ratios for the Oslo Stock Exchange. Economic Bulletin, 77(3), pp.115 - 131.
Inman, M.L., 2011. Residual income. (May 1999), pp.1-8. Available at: http://www.acca.co.uk/archive/sa_oldarticles/43951?session=fffffffeffffffff0a0121384bdab979bf6e8a392ac6447124f204e1e7b89de9 [Accessed May 2, 2011].
Kew, J., Mettler, C., Walker, T., Watson, A., 2006. Accounting: an introduction 2nd ed. A. Pretorius, ed., Cape Town: Oxford University press.
Kleiman, R.T., 2011. Reference for Business. Encyclopedia of Business, pp.1-7. Available at: www.referenceforbusiness.com [Accessed March 27, 2011].
Koller, T., 1994. What is value-based management? McKinsey Quarterly, (3), pp.87-101.
Levine, D.M. et al., 2008. Statistics for Managers 5th ed., New Jersey: Pearson Education, Inc.
Maditinos, D.I., 2005. Performance measures : Traditional accounting measures versus modern The case of earnings and EVA ® in the Athens Stock Exchange ( ASE ). Accounting and Finance, (July), pp.1-20.
Magni, C.A., 2009. Splitting up value: A critical review of residual income theories. European Journal of Operational Research, 198(1), pp.1-22. Available at: http://linkinghub.elsevier.com/retrieve/pii/S0377221708007649.
Mbuthia, E. & Ward, M., 2003. The reliability of pre-listing earnings forecasts on the JSE. Investment Analysts Journal, (57), pp.33-40.
Megginson, W.L., Smart, S.B. & Gitman, L.J., 2007. Corporate Finance 2nd ed. J. W. Calhoun, ed., Mason: Thompson South Western. Available at: www.thomsonedu.com.
Muller, G.H., Steyn-bruwer, B.W. & Hamman, W.D., 2009. Predicting financial distress of companies listed on the JSE – A comparison of techniques. South African Journal of Business Management, 40(1), pp.21-32.

80
Pagano, M., Panetta, F. & Zingales, L., 1998. Why Do Companies Go Public ? An Empirical Analysis. The Journal of Finance, LIII(1), pp.27 - 64.
Prakash, A.J. Chang, C,. Davidson, L., Lee, C., 2003. Adoption of economic value added and financial ratios. International Journal of Finance, 15(2).
Ryan, H.E. & Trahan, E. a, 2007. Corporate Financial Control Mechanisms and Firm Performance: The Case of Value-Based Management Systems. Journal of Business Finance & Accounting, 34(1-2), pp.111-138. Available at: http://www.blackwell-synergy.com/doi/abs/10.1111/j.1468-5957.2006.00660.x.
Schroeder, L.D., Sjoquist, D.L. & Stephan, P.E., 2011. Standardized coefficient. Understanding Regression Analysis, (February), pp.31 - 32. Available at: http://en.wikipedia.org/wiki/Standardized_coefficient.
Seal, W., 2010. Managerial discourse and the link between theory and practice: From ROI to value-based management. Management Accounting Research, 21(2), pp.95-109. Available at: http://linkinghub.elsevier.com/retrieve/pii/S1044500510000259.
Somoye, R.O.C., Akintoye, I.R. & Oseni, J.E., 2009. Determinants of Equity Prices in the Stock Markets. Finance and Economics, 30(30), pp.1-13.
Steyn-bruwer, B.W. & Hamman, W.D., 2005. Cash flow patterns in listed South African industrial companies. Meditari Accountancy Research, 13(1), pp.1-17.
Temkin, B., 2010. PRIVATE INVESTOR : Tiger Brands record has been a mixed one. Business Day, pp.1-2.
Thompson, A.A. (Jr), Strickland, A.J. (III) & Gamble, J.E., 2010. Crafting and Executing Strategy: The quest for competitive advantage: Concepts and Cases 17th ed., New York: The Mc Graw - Hill Companies. Available at: www.mhhe.com.
van den Heever, E., 2007. The Relationship between Sustainable Value Creation and Dynamic Capital Structure management. North West University.

81
ANNEXURE A: LIST OF ALL VARIABLES USED
9 Operating Economic Value Added
11 Cash Flow Dividend Cover
12 Price Value Differential
13 Average Share Price
14 Price to Sale
15 Year End Share Price
16 Change Year End Share Price
17 Dividend Yield
18 EPS
19 Dividend per Share
20 Dividend Cover
21 Net Asset Value per Share
22 Earnings per Share
23 Operating Profit
24 Price to Book Value per Share
25 Inflation Adjust Return on Assets
26 Inflation Adjust Return on Equity
27 Interest Cover
28 ROA
29 ROE
30 Operating Profit Margin
31 Price to Inflation Adjusted Profit
32 Price to Book Value
33 Price to Cash Flow
34 Price to Earnings
35 Price to Net Asset Value
36 Price per Share
40 Quick Ratio
41 Retention Rate
42 Return on Assets
43 Return on Equity
44 Total Asset Turnover
45 NOPAT per Share
46 CEVA(R)
47 CFROI
48
Absolute Betas :
Average Real Market Beta
49 Real Market Beta

82
ANNEXURE B: CORRELATION MATRICES
Co
rrela
tio
ns
Year
= 1
19
11
12
13
14
15
16
17
18
19
20
21
22
23
24
25
26
27
28
29
30
31
32
33
34
35
36
40
41
42
43
44
45
46
47
48
49
50
51
Pe
ars
on
Co
rre
latio
n.4
56
.76
2.4
45
.06
0-.
32
2-.
37
1.2
78
.48
5-.
33
81
.21
0-.
29
4.9
60
**-.
10
8.2
35
.44
4-.
31
4.2
68
.06
0.6
45
.59
7.1
71
-.2
80
.a.a
.a.a
.a.0
54
-.3
13
.08
0.3
29
.05
4.9
50
**.7
30
.15
8.3
07
-.1
72
.97
2**
.98
8**
Sig
. (2
-ta
ile
d)
.25
6.1
34
.26
9.8
87
.43
7.4
13
.50
5.2
24
.45
9.6
52
.48
0.0
00
.79
9.5
76
.31
9.4
93
.56
1.8
87
.08
4.1
18
.68
6.5
02
..
..
..8
99
.45
0.8
51
.42
6.8
99
.00
0.0
62
.70
8.4
59
.71
2.0
00
.00
0
N8
58
88
78
87
87
88
88
77
78
88
88
00
00
08
88
88
87
88
77
7
Pe
ars
on
Co
rre
latio
n-.
17
9.9
49
*.4
51
.26
3-.
10
0-.
47
1.0
66
.45
0-.
12
6.6
45
.29
9-.
73
0*
.64
0-.
06
7.1
99
.53
5-.
23
9.4
17
.11
71
.73
1*
.58
1-.
67
2.a
.a.a
.a.a
.17
1-.
06
4.0
76
.51
9.1
71
.67
4.6
94
.52
1.3
84
.02
5.7
69
*.6
88
Sig
. (2
-ta
ile
d)
.67
1.0
14
.26
2.5
29
.81
4.2
86
.87
6.2
63
.78
8.0
84
.51
4.0
40
.08
7.8
75
.63
6.2
16
.60
6.3
52
.78
3.0
40
.13
1.0
68
..
..
..6
85
.88
0.8
58
.18
8.6
85
.06
7.0
83
.18
6.3
47
.95
7.0
43
.08
7
N8
58
88
78
87
87
88
88
77
78
88
88
00
00
08
88
88
87
88
77
7
Pe
ars
on
Co
rre
latio
n-.
00
3.5
58
.17
6-.
14
7-.
06
1.1
41
.15
1.6
54
.14
8.5
97
.43
9-.
24
9.4
28
.29
0.4
30
.72
5-.
70
6.6
92
-.2
46
.73
1*
1.3
75
-.3
15
.a.a
.a.a
.a.6
43
-.0
78
-.2
54
.52
6.6
43
.59
1.6
39
.27
7.3
80
.29
0.6
81
.60
3
Sig
. (2
-ta
ile
d)
.99
4.3
29
.67
7.7
28
.88
6.7
63
.72
1.0
79
.75
2.1
18
.32
5.5
51
.29
1.4
86
.28
8.0
65
.07
6.0
85
.55
7.0
40
.36
0.4
47
..
..
..0
86
.85
4.5
43
.18
1.0
86
.12
3.1
23
.50
7.3
53
.52
8.0
92
.15
2
N8
58
88
78
87
87
88
88
77
78
88
88
00
00
08
88
88
87
88
77
7
Pe
ars
on
Co
rre
latio
n-.
10
7.4
98
.46
3.5
51
-.3
33
-.5
19
.25
5.3
61
-.3
51
.32
9.1
05
-.2
77
.29
9-.
36
3-.
23
0.6
39
-.2
37
.53
1.5
07
.51
9.5
26
.88
8**
-.4
58
.a.a
.a.a
.a.0
99
-.1
97
.30
71
.09
9.4
81
.83
8*
.34
3.7
20
*-.
22
5.7
33
.74
6
Sig
. (2
-ta
ile
d)
.80
1.3
93
.24
8.1
57
.42
0.2
33
.54
1.3
80
.44
0.4
26
.82
3.5
07
.47
1.3
77
.58
3.1
22
.60
8.2
20
.20
0.1
88
.18
1.0
03
.25
4.
..
..
.81
5.6
40
.45
9.8
15
.22
7.0
19
.40
6.0
44
.62
8.0
61
.05
4
N8
58
88
78
87
87
88
88
77
78
88
88
00
00
08
88
88
87
88
77
7
Pe
ars
on
Co
rre
latio
n-.
10
4.6
65
.77
7*
.33
3-.
22
1-.
25
7.1
87
.50
0-.
31
7.3
07
-.0
21
-.0
68
.36
8-.
18
9-.
08
2.4
75
-.1
63
.29
4.2
38
.38
4.3
80
.57
1-.
14
6.a
.a.a
.a.a
-.1
04
-.0
49
.44
2.7
20
*-.
10
4.5
81
.81
6*
.13
11
-.2
50
.93
9**
.96
9**
Sig
. (2
-ta
ile
d)
.80
6.2
20
.02
3.4
20
.59
9.5
79
.65
7.2
07
.48
8.4
59
.96
5.8
73
.36
9.6
53
.84
6.2
81
.72
7.5
22
.57
0.3
47
.35
3.1
40
.73
0.
..
..
.80
6.9
08
.27
3.0
44
.80
6.1
31
.02
5.7
58
.58
9.0
02
.00
0
N8
58
88
78
87
87
88
88
77
78
88
88
00
00
08
88
88
87
88
77
7
Pe
ars
on
Co
rre
latio
n-.
09
7.8
47
.80
4*
.30
0-.
24
9-.
32
2.2
19
.66
2-.
30
3.9
72
**.1
39
-.3
06
.85
6*
-.1
65
.02
3.5
84
-.2
88
.41
3.1
52
.76
9*
.68
1.6
63
-.3
32
.a.a
.a.a
.a.0
62
-.1
40
.32
8.7
33
.06
2.9
61
**.8
29
*.2
46
.93
9**
-.1
74
1.9
90
**
Sig
. (2
-ta
ile
d)
.83
6.0
70
.02
9.5
14
.59
1.4
82
.63
7.1
05
.50
9.0
00
.76
6.5
04
.01
4.7
24
.96
2.1
69
.53
2.3
57
.74
5.0
43
.09
2.1
05
.46
8.
..
..
.89
4.7
65
.47
3.0
61
.89
4.0
01
.02
1.5
95
.00
2.7
09
.00
0
N7
57
77
77
77
77
77
77
77
77
77
77
00
00
07
77
77
77
77
77
7
Pe
ars
on
Co
rre
latio
n-.
00
3.8
09
.84
7*
.33
7-.
31
2-.
35
2.2
64
.65
6-.
37
3.9
88
**.0
94
-.2
34
.88
6**
-.2
43
-.0
57
.54
7-.
25
0.3
70
.20
8.6
88
.60
3.6
59
-.2
74
.a.a
.a.a
.a-.
00
1-.
20
2.3
84
.74
6-.
00
1.9
84
**.8
08
*.1
84
.96
9**
-.2
46
.99
0**
1
Sig
. (2
-ta
ile
d)
.99
5.0
97
.01
6.4
59
.49
6.4
39
.56
7.1
10
.41
0.0
00
.84
1.6
14
.00
8.6
00
.90
3.2
04
.58
9.4
14
.65
4.0
87
.15
2.1
08
.55
2.
..
..
.99
8.6
64
.39
5.0
54
.99
8.0
00
.02
8.6
93
.00
0.5
94
.00
0
N7
57
77
77
77
77
77
77
77
77
77
77
00
00
07
77
77
77
77
77
7
Year
= 2
19
11
12
13
14
15
16
17
18
19
20
21
22
23
24
25
26
27
28
29
30
31
32
33
34
35
36
40
41
42
43
44
45
46
47
48
49
50
51
Pe
ars
on
Co
rre
latio
n-.
02
9.8
25
-.0
13
.03
3-.
53
0.0
77
.49
8.4
25
-.5
11
.50
1.0
15
-.0
38
.30
7-.
22
6-.
15
11
.57
3.9
68
**-.
04
7.6
29
.51
1.6
35
.29
3.a
.a.a
.a.a
-.5
35
.26
7.2
67
.46
3-.
53
5.4
76
.51
2-.
32
5.4
96
-.1
28
.58
5.5
55
Sig
. (2
-ta
ile
d)
.94
5.0
86
.97
5.9
38
.17
6.8
55
.20
9.2
93
.19
6.2
06
.97
2.9
28
.46
0.5
91
.72
1.1
78
.00
0.9
11
.09
5.1
95
.09
1.4
81
..
..
..1
72
.52
2.5
23
.24
8.1
72
.23
3.1
94
.43
3.2
11
.76
2.1
27
.15
4
N8
58
88
88
88
88
88
88
87
88
88
88
00
00
08
88
88
88
88
88
8
Pe
ars
on
Co
rre
latio
n-.
19
8-.
88
9*
-.5
82
-.5
96
.52
7.4
37
-.4
93
-.1
48
.34
2-.
73
7*
.25
8.1
65
-.7
49
*.3
64
.26
0-.
53
5-.
00
7-.
32
2-.
57
0-.
22
4-.
26
6-.
56
9.3
90
.a.a
.a.a
.a1
.00
0**
.41
9-.
85
8**
-.4
36
1-.
77
1*
-.8
17
*.3
41
-.7
93
*.3
04
-.8
22
*-.
80
7*
Sig
. (2
-ta
ile
d)
.63
8.0
44
.13
0.1
19
.18
0.2
79
.21
5.7
26
.40
7.0
37
.53
7.6
96
.03
3.3
75
.53
4.1
72
.98
9.4
37
.14
1.5
94
.52
4.1
41
.33
9.
..
..
.00
0.3
02
.00
6.2
80
.02
5.0
13
.40
9.0
19
.46
3.0
12
.01
6
N8
58
88
88
88
88
88
88
87
88
88
88
00
00
08
88
88
88
88
88
8
Pe
ars
on
Co
rre
latio
n.0
56
.70
4.4
62
.61
8-.
26
5-.
22
1.2
06
.52
2-.
32
9.9
95
**.0
58
.06
3.9
61
**-.
13
9.0
10
.47
6-.
03
2.2
71
.58
8.4
21
.38
4.4
48
-.2
47
.a.a
.a.a
.a-.
77
1*
-.2
72
.42
1.5
61
-.7
71
*1
.62
4-.
07
2.9
68
**-.
04
3.9
85
**.9
89
**
Sig
. (2
-ta
ile
d)
.89
5.1
84
.25
0.1
02
.52
6.5
99
.62
4.1
84
.42
6.0
00
.89
1.8
82
.00
0.7
43
.98
1.2
33
.94
5.5
16
.12
5.2
99
.34
8.2
66
.55
6.
..
..
.02
5.5
15
.29
8.1
48
.02
5.0
98
.86
6.0
00
.91
9.0
00
.00
0
N8
58
88
88
88
88
88
88
87
88
88
88
00
00
08
88
88
88
88
88
8
Pe
ars
on
Co
rre
latio
n.0
31
.81
7.4
69
.57
5-.
29
9-.
18
8.2
49
.53
5-.
42
7.9
84
**.0
11
-.0
27
.94
0**
-.1
47
-.0
25
.58
5.0
36
.38
3.5
31
.47
1.4
10
.49
7-.
23
6.a
.a.a
.a.a
-.8
22
*-.
26
7.4
56
.52
8-.
82
2*
.98
5**
.66
6-.
15
9.9
48
**-.
10
91
.99
9**
Sig
. (2
-ta
ile
d)
.94
1.0
91
.24
2.1
36
.47
2.6
56
.55
2.1
72
.29
2.0
00
.98
0.9
49
.00
1.7
29
.95
3.1
27
.94
0.3
49
.17
6.2
39
.31
3.2
10
.57
3.
..
..
.01
2.5
22
.25
6.1
78
.01
2.0
00
.07
1.7
07
.00
0.7
98
.00
0
N8
58
88
88
88
88
88
88
87
88
88
88
00
00
08
88
88
88
88
88
8
Pe
ars
on
Co
rre
latio
n.0
29
.80
0.4
81
.57
4-.
27
7-.
18
6.2
24
.53
3-.
43
2.9
87
**.0
06
-.0
38
.95
3**
-.1
46
-.0
29
.55
5.0
36
.35
1.5
34
.44
5.3
80
.47
2-.
23
1.a
.a.a
.a.a
-.8
07
*-.
26
2.4
43
.50
6-.
80
7*
.98
9**
.63
8-.
14
7.9
49
**-.
11
4.9
99
**1
Sig
. (2
-ta
ile
d)
.94
6.1
04
.22
8.1
36
.50
7.6
59
.59
5.1
74
.28
5.0
00
.99
0.9
29
.00
0.7
31
.94
5.1
54
.93
8.3
94
.17
2.2
69
.35
3.2
38
.58
3.
..
..
.01
6.5
31
.27
1.2
01
.01
6.0
00
.08
9.7
28
.00
0.7
87
.00
0
N8
58
88
88
88
88
88
88
87
88
88
88
00
00
08
88
88
88
88
88
8
Year
= 3
19
11
12
13
14
15
16
17
18
19
20
21
22
23
24
25
26
27
28
29
30
31
32
33
34
35
36
40
41
42
43
44
45
46
47
48
49
50
51
Pe
ars
on
Co
rre
latio
n.2
54
-.9
54
*-.
12
0-.
21
1.3
20
.07
9-.
30
8-.
42
61
-.7
29
.48
0.4
71
-.6
97
.23
0.5
36
-.6
26
-.7
06
-.5
01
-.0
07
-.3
05
-.2
46
-.5
22
-.5
21
-.3
31
.a.a
.a.a
-.0
60
-.4
24
-.2
63
-.1
31
-.0
60
-.7
37
-.6
17
-.2
30
-.6
68
.60
8-.
80
6*
-.7
80
*
Sig
. (2
-ta
ile
d)
.58
3.0
12
.79
8.6
50
.48
4.8
67
.50
2.3
40
.06
3.2
75
.28
6.0
82
.62
0.2
15
.13
3.0
76
.25
2.9
88
.50
6.5
95
.23
0.2
30
.46
9.
..
..8
98
.34
3.5
69
.77
9.8
98
.05
9.1
40
.62
0.1
01
.14
7.0
29
.03
9
N7
57
77
77
77
77
77
77
77
77
77
77
70
00
07
77
77
77
77
77
7
Pe
ars
on
Co
rre
latio
n-.
14
4.6
84
-.3
39
.34
7-.
42
9.0
23
.39
5-.
10
2-.
62
6.5
95
-.4
52
.27
7.3
87
-.3
15
-.0
90
1.9
01
**.9
76
**.2
30
.57
0.5
03
.92
1**
.64
2.1
56
.a.a
.a.a
.25
8.6
15
.13
9.7
52
*.2
58
.61
8.6
77
.14
2.6
31
-.4
64
.66
1.6
56
Sig
. (2
-ta
ile
d)
.73
5.2
03
.45
7.4
00
.28
9.9
56
.33
3.8
28
.13
3.1
19
.26
1.5
47
.34
4.4
92
.83
2.0
06
.00
0.5
84
.14
0.2
04
.00
1.0
86
.71
1.
..
..5
37
.10
5.7
42
.03
1.5
37
.10
3.0
65
.73
7.0
93
.24
6.0
74
.07
7
N8
57
88
88
77
88
78
78
87
88
88
88
80
00
08
88
88
88
88
88
8
Pe
ars
on
Co
rre
latio
n.0
61
.14
1-.
34
6.6
65
-.1
68
.04
6.0
96
-.2
29
-.1
31
.54
2.0
14
.73
5.3
67
-.2
66
.40
8.7
52
*.5
62
.73
4*
.60
1.8
61
**.8
26
*.7
46
*.2
44
-.3
03
.a.a
.a.a
.24
4.2
98
.10
01
.24
4.5
38
.67
9.2
26
.55
1.0
47
.50
7.5
30
Sig
. (2
-ta
ile
d)
.88
6.8
21
.44
7.0
72
.69
0.9
14
.82
1.6
21
.77
9.1
65
.97
3.0
60
.37
2.5
65
.31
5.0
31
.18
9.0
38
.11
5.0
06
.01
1.0
34
.56
0.4
65
..
..
.56
0.4
73
.81
4.5
60
.16
9.0
64
.59
1.1
57
.91
2.2
00
.17
7
N8
57
88
88
77
88
78
78
87
88
88
88
80
00
08
88
88
88
88
88
8
Pe
ars
on
Co
rre
latio
n-.
01
3.6
81
.18
3.5
31
-.2
07
-.0
77
.13
7.4
88
-.7
37
.99
8**
-.0
94
-.0
07
.94
3**
-.2
38
.08
6.6
18
.50
4.4
49
.43
1.4
92
.48
5.5
32
.31
1-.
16
7.a
.a.a
.a.1
38
.27
2.3
13
.53
8.1
38
1.6
72
.15
4.9
73
**-.
14
0.9
93
**.9
97
**
Sig
. (2
-ta
ile
d)
.97
5.2
06
.69
4.1
76
.62
3.8
56
.74
5.2
66
.05
9.0
00
.82
5.9
88
.00
0.6
07
.84
0.1
03
.24
9.2
64
.28
6.2
15
.22
3.1
75
.45
3.6
93
..
..
.74
5.5
14
.45
1.1
69
.74
5.0
68
.71
6.0
00
.74
1.0
00
.00
0
N8
57
88
88
77
88
78
78
87
88
88
88
80
00
08
88
88
88
88
88
8
Pe
ars
on
Co
rre
latio
n.0
42
.64
0.1
75
.54
2-.
16
9.1
16
.20
1.3
36
-.6
17
.67
8.2
33
.02
6.5
70
-.1
02
.46
4.6
77
.55
3.5
54
.43
5.7
82
*.7
69
*.4
87
.21
9-.
42
9.a
.a.a
.a-.
06
5.2
36
.43
3.6
79
-.0
65
.67
21
.38
6.7
27
*.2
06
.69
7.6
91
Sig
. (2
-ta
ile
d)
.92
1.2
45
.70
8.1
65
.68
9.7
84
.63
3.4
62
.14
0.0
64
.57
8.9
56
.14
0.8
29
.24
7.0
65
.19
8.1
54
.28
1.0
22
.02
6.2
21
.60
3.2
88
..
..
.87
9.5
73
.28
4.0
64
.87
9.0
68
.34
5.0
41
.62
4.0
55
.05
8
N8
57
88
88
77
88
78
78
87
88
88
88
80
00
08
88
88
88
88
88
8
Pe
ars
on
Co
rre
latio
n-.
04
9.7
57
.18
0.4
87
-.2
40
-.0
67
.18
3.4
94
-.8
06
*.9
88
**-.
13
9-.
07
4.9
26
**-.
23
8.0
36
.66
1.5
63
.49
3.3
77
.47
1.4
58
.55
7.3
64
-.1
20
.a.a
.a.a
.12
3.3
16
.32
8.5
07
.12
3.9
93
**.6
97
.16
1.9
69
**-.
19
11
.99
9**
Sig
. (2
-ta
ile
d)
.90
9.1
39
.69
9.2
21
.56
7.8
74
.66
5.2
59
.02
9.0
00
.74
3.8
75
.00
1.6
08
.93
2.0
74
.18
8.2
14
.35
8.2
39
.25
4.1
51
.37
5.7
76
..
..
.77
1.4
46
.42
7.2
00
.77
1.0
00
.05
5.7
04
.00
0.6
50
.00
0
N8
57
88
88
77
88
78
78
87
88
88
88
80
00
08
88
88
88
88
88
8
Pe
ars
on
Co
rre
latio
n-.
04
4.7
28
.17
0.5
11
-.2
25
-.0
64
.16
3.4
86
-.7
80
*.9
93
**-.
12
9-.
03
5.9
30
**-.
23
5.0
57
.65
6.5
50
.49
0.4
05
.48
6.4
75
.55
9.3
51
-.1
34
.a.a
.a.a
.12
8.3
07
.31
4.5
30
.12
8.9
97
**.6
91
.15
9.9
72
**-.
17
9.9
99
**1
Sig
. (2
-ta
ile
d)
.91
8.1
63
.71
5.1
96
.59
2.8
80
.70
1.2
69
.03
9.0
00
.76
0.9
41
.00
1.6
11
.89
4.0
77
.20
0.2
18
.32
0.2
22
.23
4.1
50
.39
3.7
52
..
..
.76
2.4
60
.44
8.1
77
.76
2.0
00
.05
8.7
07
.00
0.6
72
.00
0
N8
57
88
88
77
88
78
78
87
88
88
88
80
00
08
88
88
88
88
88
8
*. C
orr
ela
tio
n is
sig
nific
an
t a
t th
e 0
.05
le
vel (2
-ta
ile
d).
**. C
orr
ela
tio
n is
sig
nific
an
t a
t th
e 0
.01
le
vel (2
-ta
ile
d).
b. Y
ea
r =
3
43
50
51
a. C
an
no
t b
e c
om
pu
ted
be
ca
us
e a
t le
as
t o
ne
of th
e v
ari
ab
les
is
co
ns
tan
t.
45
46
51
17
24
Co
rre
lati
on
sb
**. C
orr
ela
tio
n is
sig
nific
an
t a
t th
e 0
.01
le
vel (2
-ta
ile
d).
b. Y
ea
r =
2
*. C
orr
ela
tio
n is
sig
nific
an
t a
t th
e 0
.05
le
vel (2
-ta
ile
d).
a. C
an
no
t b
e c
om
pu
ted
be
ca
us
e a
t le
as
t o
ne
of th
e v
ari
ab
les
is
co
ns
tan
t.
44
45
50
51
*. C
orr
ela
tio
n is
sig
nific
an
t a
t th
e 0
.05
le
vel (2
-ta
ile
d).
24
a. C
an
no
t b
e c
om
pu
ted
be
ca
us
e a
t le
as
t o
ne
of th
e v
ari
ab
les
is
co
ns
tan
t.
**. C
orr
ela
tio
n is
sig
nific
an
t a
t th
e 0
.01
le
vel (2
-ta
ile
d).
b. Y
ea
r =
1
Co
rre
lati
on
sb
43
48
50
Co
rre
lati
on
sb
18
28
29
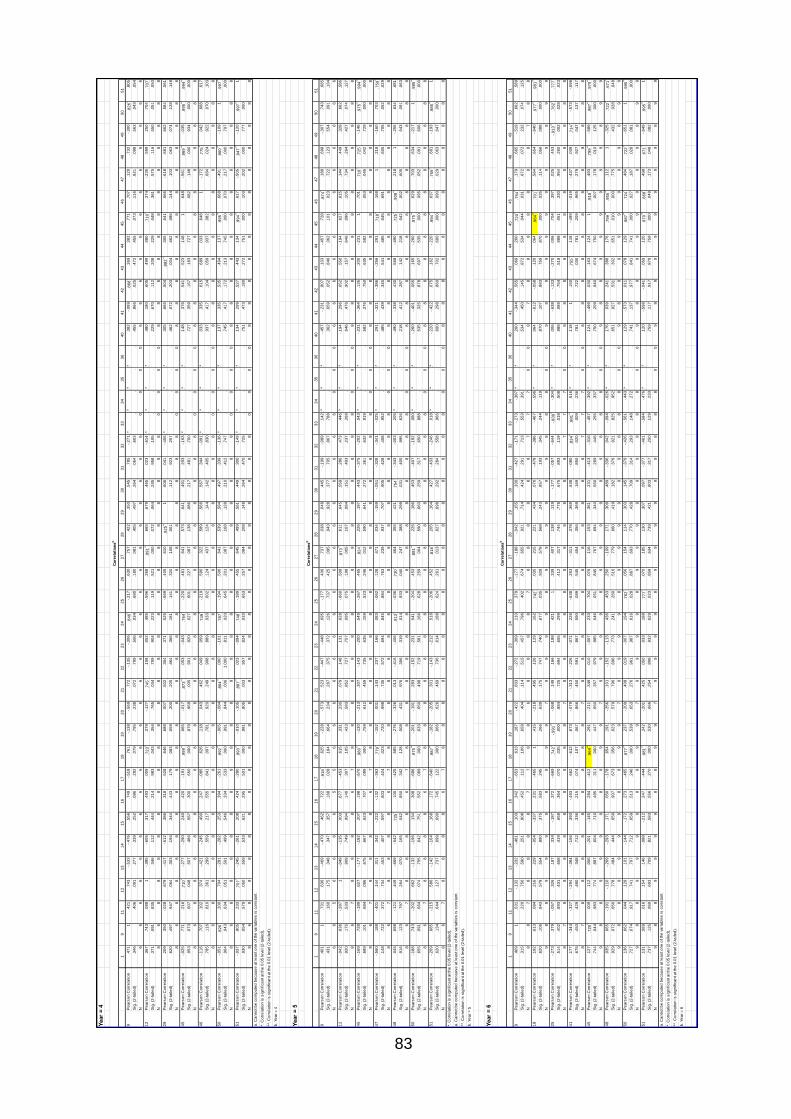
83
Year
= 4
19
11
12
13
14
15
16
17
18
19
20
21
22
23
24
25
26
27
28
29
30
31
32
33
34
35
36
40
41
42
43
44
45
46
47
48
49
50
51
Pe
ars
on
Co
rre
latio
n.4
71
1.4
21
.74
3-.
53
3-.
47
6.5
56
.74
9-.
51
8.7
61
-.1
38
-.5
69
.77
2-.
13
5-.
30
6.8
46
*-.
21
7.6
30
.75
7.4
22
.35
0.5
45
.78
5-.
27
1.a
.a.a
.a.3
82
-.0
89
.86
8*
.36
9.3
82
.77
1.7
07
.12
0.7
32
-.3
00
.82
6*
.80
5
Sig
. (2
-ta
ile
d)
.34
6.4
06
.09
1.2
77
.33
9.2
52
.08
6.2
92
.07
9.7
95
.23
8.0
72
.79
9.5
56
.03
4.6
80
.18
0.0
81
.40
5.4
97
.26
4.0
64
.60
3.
..
..4
55
.86
6.0
25
.47
2.4
55
.07
3.1
16
.82
1.0
98
.56
3.0
43
.05
4
N6
66
66
66
66
66
66
66
66
66
66
66
60
00
06
66
66
66
66
66
6
Pe
ars
on
Co
rre
latio
n.3
67
.74
3.0
88
1-.
38
5-.
60
5.3
17
.49
3.0
09
.72
3*
.37
9-.
12
7.7
45
*.1
58
.05
2.4
85
-.5
96
.26
8.9
91
**.6
65
.67
9.4
65
.02
3-.
61
4.a
.a.a
.a.4
80
.18
0.6
05
.49
9.4
80
.71
0*
.37
4-.
23
5.5
99
.25
0.7
04
.70
7*
Sig
. (2
-ta
ile
d)
.37
1.0
91
.83
5.3
46
.11
2.4
44
.21
4.9
83
.04
3.3
54
.76
5.0
34
.70
9.9
04
.22
3.1
19
.52
1.0
00
.07
2.0
64
.24
5.9
58
.10
5.
..
..2
29
.67
0.1
12
.20
8.2
29
.04
8.3
61
.57
5.1
16
.55
0.0
51
.05
0
N8
68
88
88
88
88
88
88
88
88
88
88
80
00
08
88
88
88
88
88
8
Pe
ars
on
Co
rre
latio
n.2
09
.35
0-.
02
8.6
79
-.4
17
-.5
12
.38
6.3
18
.52
8.6
46
.68
8.5
07
.50
2.3
04
.37
1.5
25
-.5
69
.40
5.6
10
.92
5**
1.6
06
.04
1-.
45
5.a
.a.a
.a.3
05
.66
5.5
04
.88
2**
.30
5.6
41
.56
6-.
61
8.6
81
.66
2.5
84
.56
1
Sig
. (2
-ta
ile
d)
.62
0.4
97
.94
7.0
64
.30
3.1
94
.34
4.4
43
.17
9.0
83
.05
9.2
00
.20
5.4
64
.36
6.1
81
.14
1.3
20
.10
8.0
01
.11
2.9
23
.25
7.
..
..4
62
.07
2.2
03
.00
4.4
62
.08
6.1
44
.10
3.0
63
.07
4.1
28
.14
8
N8
68
88
88
88
88
88
88
88
88
88
88
80
00
08
88
88
88
88
88
8
Pe
ars
on
Co
rre
latio
n-.
02
5.7
71
.21
6.7
10
*-.
27
7-.
29
0.2
40
.42
0-.
19
1.9
99
**.0
65
-.0
17
.87
3**
.05
3-.
04
3.7
64
*-.
22
0.4
81
.64
1.5
73
.64
1.4
91
.29
3-.
16
3.a
.a.a
.a.1
48
.37
6.5
41
.52
3.1
48
1.6
48
-.5
61
.96
9**
-.0
35
.99
5**
.99
4**
Sig
. (2
-ta
ile
d)
.95
3.0
73
.60
7.0
48
.50
7.4
86
.56
7.3
00
.65
0.0
00
.87
9.9
69
.00
5.9
01
.92
0.0
27
.60
1.2
27
.08
7.1
38
.08
6.2
17
.48
1.7
00
..
..
.72
7.3
59
.16
7.1
83
.72
7.0
82
.14
8.0
00
.93
4.0
00
.00
0
N8
68
88
88
88
88
88
88
88
88
88
88
80
00
08
88
88
88
88
88
8
Pe
ars
on
Co
rre
latio
n-.
11
6.7
07
.10
2.3
74
-.4
21
-.2
45
.49
0.2
47
-.0
85
.62
6.1
18
.04
3.4
62
.04
9.0
59
.74
9*
-.2
19
.59
0.3
22
.58
9.5
66
.56
7.3
44
-.0
91
.a.a
.a.a
.03
3.3
35
.61
5.6
89
.03
3.6
48
1-.
17
2.7
75
*.0
42
.66
8.6
17
Sig
. (2
-ta
ile
d)
.78
5.1
16
.81
0.3
61
.29
9.5
59
.21
7.5
55
.84
1.0
97
.78
1.9
20
.24
9.9
08
.88
9.0
33
.60
2.1
24
.43
7.1
24
.14
4.1
42
.40
5.8
30
..
..
.93
7.4
17
.10
4.0
59
.93
7.0
82
.68
4.0
24
.92
2.0
70
.10
3
N8
68
88
88
88
88
88
88
88
88
88
88
80
00
08
88
88
88
88
88
8
Pe
ars
on
Co
rre
latio
n-.
05
1.8
26
*.2
00
.70
4-.
28
1-.
28
2.2
53
.39
4-.
26
1.9
92
**-.
00
5-.
08
4.8
64
**.0
00
-.1
01
.78
7*
-.1
94
.50
6.6
41
.53
9.5
84
.49
7.3
39
-.1
36
.a.a
.a.a
.13
7.3
35
.53
5.4
94
.13
7.9
95
**.6
68
-.4
91
.96
0**
-.1
09
1.9
97
**
Sig
. (2
-ta
ile
d)
.90
4.0
43
.63
4.0
51
.50
1.4
99
.54
6.3
34
.53
3.0
00
.99
1.8
44
.00
61
.00
0.8
11
.02
0.6
45
.20
1.0
87
.16
8.1
28
.21
0.4
12
.74
7.
..
..7
45
.41
7.1
72
.21
3.7
45
.00
0.0
70
.21
7.0
00
.79
7.0
00
N8
68
88
88
88
88
88
88
88
88
88
88
80
00
08
88
88
88
88
88
8
Pe
ars
on
Co
rre
latio
n-.
03
7.8
05
.23
3.7
07
*-.
24
5-.
26
1.2
08
.42
4-.
28
0.9
93
**-.
01
0-.
10
5.8
87
**.0
23
-.0
94
.74
8*
-.1
89
.45
5.6
45
.49
9.5
61
.44
9.3
00
-.1
49
.a.a
.a.a
.13
4.2
99
.52
7.4
43
.13
4.9
94
**.6
17
-.5
05
.94
7**
-.1
20
.99
7**
1
Sig
. (2
-ta
ile
d)
.93
0.0
54
.57
9.0
50
.55
9.5
33
.62
1.2
95
.50
1.0
00
.98
1.8
05
.00
3.9
57
.82
4.0
33
.65
3.2
57
.08
4.2
08
.14
8.2
64
.47
0.7
25
..
..
.75
1.4
73
.18
0.2
72
.75
1.0
00
.10
3.2
02
.00
0.7
77
.00
0
N8
68
88
88
88
88
88
88
88
88
88
88
80
00
08
88
88
88
88
88
8
Year
= 5
19
11
12
13
14
15
16
17
18
19
20
21
22
23
24
25
26
27
28
29
30
31
32
33
34
35
36
40
41
42
43
44
45
46
47
48
49
50
51
Pe
ars
on
Co
rre
latio
n.4
01
1.7
31
.63
6-.
46
9-.
47
0.4
62
.72
2-.
91
8*
.62
5-.
22
8-.
57
3.5
23
-.4
47
-.4
48
.69
5-.
17
7.4
06
.73
7.0
38
.04
8.4
45
-.1
99
-.0
89
.14
2.a
.a.a
-.4
57
-.2
31
.80
7.1
03
-.4
57
.72
8.8
74
*.1
88
.69
8-.
30
7.7
43
.68
5
Sig
. (2
-ta
ile
d)
.43
1.1
60
.17
5.3
48
.34
7.3
57
.16
8.0
28
.18
4.6
64
.23
4.2
87
.37
5.3
72
.12
6.7
37
.42
5.0
95
.94
3.9
28
.37
7.7
05
.86
7.7
88
..
..3
62
.65
9.0
52
.84
6.3
62
.10
1.0
23
.72
2.1
23
.55
4.0
91
.13
4
N6
65
66
66
55
66
66
66
66
66
66
66
66
00
06
66
66
66
66
66
6
Pe
ars
on
Co
rre
latio
n-.
04
2.6
36
-.2
87
1-.
04
9-.
13
5.0
03
.67
7-.
45
3.6
15
.33
1.2
30
.07
9.1
48
.13
1.6
28
-.6
60
.50
8.8
73
**.6
11
.64
5.5
58
.28
6.4
73
.44
6.a
.a.a
-.1
94
.29
6.0
52
.55
0-.
19
4.6
27
.61
5.1
44
.44
9.3
28
.66
2.5
86
Sig
. (2
-ta
ile
d)
.92
0.1
75
.53
3.9
08
.74
9.9
94
.14
0.3
07
.10
5.4
23
.58
3.8
52
.72
7.7
57
.09
5.0
75
.19
8.0
05
.10
7.0
84
.15
1.4
93
.23
7.2
68
..
..6
46
.47
6.9
02
.15
7.6
46
.09
6.1
05
.73
4.2
64
.42
7.0
74
.12
7
N8
67
88
88
67
88
88
88
88
88
88
88
88
00
08
88
88
88
88
88
8
Pe
ars
on
Co
rre
latio
n-.
16
9.7
28
-.1
89
.62
7-.
17
7-.
18
2.2
07
.19
8-.
67
0.9
80
**-.
13
0-.
21
3.3
07
-.1
43
-.2
00
.54
9-.
26
7.4
65
.82
4*
.22
6.1
97
.44
3-.
37
5-.
20
2.0
43
.a.a
.a-.
23
1-.
36
4.1
35
.20
0-.
23
11
.70
1.7
18
*.7
25
*-.
14
6.9
75
**.9
94
**
Sig
. (2
-ta
ile
d)
.68
9.1
01
.68
4.0
96
.67
5.6
67
.62
3.7
07
.09
9.0
00
.75
9.6
12
.45
9.7
35
.63
5.1
59
.52
3.2
46
.01
2.5
90
.64
1.2
72
.36
1.6
32
.91
9.
..
.58
2.3
76
.75
0.6
35
.58
2.0
53
.04
5.0
42
.72
9.0
00
.00
0
N8
67
88
88
67
88
88
88
88
88
88
88
88
00
08
88
88
88
88
88
8
Pe
ars
on
Co
rre
latio
n-.
56
0.1
88
-.4
01
.14
4.3
11
.34
2-.
22
2-.
13
2-.
36
3.7
79
*-.
15
2.0
01
.14
3.2
37
.16
6.0
83
-.0
62
.12
8.4
71
.03
4-.
15
9-.
05
1-.
32
8-.
34
1-.
02
5.a
.a.a
.29
1-.
32
1-.
38
6-.
25
6.2
91
.71
8*
.16
81
.21
8-.
16
0.7
03
.75
9*
Sig
. (2
-ta
ile
d)
.14
8.7
22
.37
2.7
34
.45
3.4
07
.59
7.8
03
.42
4.0
23
.72
0.9
98
.73
5.5
72
.69
4.8
45
.88
4.7
63
.23
9.9
37
.70
7.9
05
.42
8.4
08
.95
2.
..
.48
5.4
39
.34
5.5
41
.48
5.0
45
.69
1.6
05
.70
5.0
52
.02
9
N8
67
88
88
67
88
88
88
88
88
88
88
88
00
08
88
88
88
88
88
8
Pe
ars
on
Co
rre
latio
n.0
45
.69
8-.
12
1.4
49
-.6
69
-.5
42
.72
5*
.10
0-.
42
5.5
85
-.2
76
-.3
26
.01
3-.
41
6-.
40
6.8
13
*-.
03
6.7
30
*.4
64
.35
5.4
21
.75
4*
-.3
43
-.0
03
.20
5.a
.a.a
-.4
90
-.3
38
.43
0.5
68
-.4
90
.72
5*
.90
8**
.21
81
-.2
55
.63
4.6
81
Sig
. (2
-ta
ile
d)
.91
6.1
23
.79
7.2
64
.07
0.1
65
.04
2.8
50
.34
2.1
28
.50
8.4
31
.97
6.3
06
.31
9.0
14
.93
3.0
40
.24
7.3
88
.29
9.0
31
.40
5.9
95
.62
6.
..
.21
8.4
12
.28
7.1
42
.21
8.0
42
.00
2.6
05
.54
3.0
91
.06
3
N8
67
88
88
67
88
88
88
88
88
88
88
88
00
08
88
88
88
88
88
8
Pe
ars
on
Co
rre
latio
n-.
18
8.7
43
-.2
02
.66
2-.
13
2-.
19
6.1
34
.30
8-.
68
6.9
75
**-.
20
1-.
19
1.2
83
-.1
52
-.2
31
.54
1-.
20
4.4
53
.88
1**
.22
6.1
86
.45
3-.
40
7-.
19
2.0
60
.a.a
.a-.
26
0-.
40
1.0
65
.16
5-.
26
0.9
75
**.6
29
.70
3.6
34
-.2
17
1.9
85
**
Sig
. (2
-ta
ile
d)
.65
5.0
91
.66
4.0
74
.75
5.6
42
.75
1.5
52
.08
9.0
00
.63
3.6
50
.49
8.7
19
.58
1.1
66
.62
8.2
59
.00
4.5
90
.66
0.2
59
.31
7.6
50
.88
8.
..
.53
5.3
25
.87
8.6
97
.53
5.0
00
.09
5.0
52
.09
1.6
06
.00
0
N8
67
88
88
67
88
88
88
88
88
88
88
88
00
08
88
88
88
88
88
8
Pe
ars
on
Co
rre
latio
n-.
20
9.6
85
-.2
15
.58
6-.
14
2-.
16
4.1
68
.17
2-.
64
0.9
87
**-.
18
2-.
20
5.3
01
-.1
43
-.2
12
.51
8-.
20
6.4
52
.81
8*
.20
5.1
64
.42
7-.
43
3-.
24
6.0
18
.a.a
.a-.
22
0-.
42
2.0
75
.16
2-.
22
0.9
94
**.6
37
.75
9*
.68
1-.
19
3.9
85
**1
Sig
. (2
-ta
ile
d)
.62
0.1
34
.64
4.1
27
.73
7.6
99
.69
0.7
45
.12
2.0
00
.66
6.6
26
.46
9.7
36
.61
4.1
88
.62
4.2
61
.01
3.6
27
.69
8.2
92
.28
4.5
58
.96
6.
..
.60
0.2
98
.86
0.7
02
.60
0.0
00
.09
0.0
29
.06
3.6
47
.00
0
N8
67
88
88
67
88
88
88
88
88
88
88
88
00
08
88
88
88
88
88
8
Year
= 6
19
11
12
13
14
15
16
17
18
19
20
21
22
23
24
25
26
27
28
29
30
31
32
33
34
35
36
40
41
42
43
44
45
46
47
48
49
50
51
Pe
ars
on
Co
rre
latio
n.4
09
1.5
31
-.1
32
-.2
32
-.4
61
.10
3.3
42
-.6
53
.61
3.1
87
-.4
22
.60
3-.
27
2-.
30
9.1
10
.37
9-.
17
7-.
18
8-.
04
2.1
55
.33
0-.
42
7-.
17
1-.
27
3-.
38
7.a
.a.2
60
-.3
44
.56
5.0
69
.26
0.7
20
*.7
54
*.1
79
.66
5-.
51
9.6
62
.58
9
Sig
. (2
-ta
ile
d)
.31
5.2
20
.75
6.5
80
.25
1.8
08
.45
2.1
12
.10
6.6
58
.40
4.1
14
.51
5.4
57
.79
6.4
02
.67
4.6
55
.92
1.7
14
.42
4.2
91
.71
3.5
53
.39
1.
..5
34
.45
0.1
45
.87
2.5
34
.04
4.0
31
.67
2.0
72
.23
2.0
74
.12
5
N8
87
88
88
77
88
68
88
87
88
88
88
77
70
08
78
88
88
88
78
8
Pe
ars
on
Co
rre
latio
n.1
92
.61
3.0
84
.21
6.2
29
-.0
54
-.3
37
.23
1-.
46
51
.41
5-.
21
8.4
95
.12
6.1
29
.16
2.7
42
*.0
35
.21
5.2
21
.43
4.0
70
-.4
78
-.3
86
-.4
67
-.5
96
.a.a
.06
4-.
61
2-.
05
8.1
20
.06
4.9
64
**.7
01
*.5
64
.65
4-.
64
0.9
77
**.9
81
**
Sig
. (2
-ta
ile
d)
.62
0.1
06
.84
3.5
78
.55
4.8
90
.37
5.5
83
.24
5.2
66
.63
9.1
75
.74
7.7
40
.67
7.0
35
.92
8.5
78
.56
8.2
43
.85
7.1
93
.34
5.2
44
.11
9.
..8
70
.10
7.8
83
.75
9.8
70
.00
0.0
35
.11
4.0
56
.08
8.0
00
.00
0
N9
88
99
99
88
99
79
99
98
99
99
99
88
80
09
89
99
99
99
89
9
Pe
ars
on
Co
rre
latio
n-.
27
3.3
79
-.0
57
.32
6.1
87
.33
4-.
18
7.3
72
-.6
69
.74
2*
-.9
91
**-.
06
8.1
49
.16
6.1
88
.42
11
.33
9.4
07
.13
8.1
19
-.1
77
-.0
57
-.6
44
-.8
39
*-.
30
4.a
.a.0
06
-.6
38
-.1
33
-.2
70
.00
6.7
04
.39
7.0
25
.45
3-.
91
3**
.76
2*
.77
7*
Sig
. (2
-ta
ile
d)
.51
4.4
02
.89
3.4
31
.65
8.4
19
.65
8.3
64
.07
0.0
35
.00
0.8
84
.72
5.6
94
.65
5.2
99
.41
2.3
17
.74
4.7
78
.67
5.8
93
.11
9.0
18
.50
8.
..9
88
.08
9.7
54
.51
8.9
88
.05
1.3
30
.95
4.2
60
.00
2.0
28
.02
3
N8
78
88
88
88
88
78
88
88
88
88
88
77
70
08
88
88
88
88
88
8
Pe
ars
on
Co
rre
latio
n.1
77
-.3
44
-.3
27
-.2
94
-.3
84
-.1
56
.39
3-.
49
3.6
62
-.6
12
.67
3-.
07
9-.
31
3-.
22
6-.
07
1.2
26
-.6
38
.25
3-.
31
1.3
78
.36
9.5
38
-.0
80
.83
4*
.88
1**
.51
6.a
.a.1
18
1.1
50
.75
5*
.11
8-.
49
9-.
01
9-.
43
7.0
39
.71
4*
-.5
73
-.5
98
Sig
. (2
-ta
ile
d)
.67
5.4
50
.42
9.4
80
.34
8.7
12
.33
6.2
15
.07
4.1
07
.06
7.8
66
.45
0.5
91
.86
7.5
90
.08
9.5
45
.45
4.3
56
.36
9.1
69
.85
0.0
20
.00
9.2
36
..
.78
1.7
22
.03
0.7
81
.20
9.9
65
.27
9.9
27
.04
7.1
37
.11
7
N8
78
88
88
88
88
78
88
88
88
88
88
77
70
08
88
88
88
88
88
8
Pe
ars
on
Co
rre
latio
n.1
27
.72
0*
.00
9.1
12
.05
6-.
20
1-.
14
5.2
84
-.4
12
.96
4**
.29
1-.
21
1.3
49
.01
0-.
00
7.2
33
.70
4.0
76
.11
6.1
53
.36
1.2
31
-.4
13
-.3
16
-.4
57
-.3
92
.a.a
.12
4-.
49
9.0
30
.16
3.1
24
1.8
18
**.4
93
.79
9**
-.5
89
.98
7**
.97
0**
Sig
. (2
-ta
ile
d)
.74
4.0
44
.98
3.7
74
.88
7.6
04
.71
0.4
95
.31
1.0
00
.44
7.6
50
.35
7.9
79
.98
5.5
46
.05
1.8
45
.76
7.6
94
.34
0.5
50
.26
9.4
46
.25
5.3
37
..
.75
0.2
09
.94
0.6
74
.75
0.0
07
.17
8.0
10
.12
5.0
00
.00
0
N9
88
99
99
88
99
79
99
98
99
99
99
88
80
09
89
99
99
99
89
9
Pe
ars
on
Co
rre
latio
n.0
35
.66
5-.
19
1-.
11
0-.
26
9-.
29
3.1
71
.05
0-.
17
8.6
54
.19
1-.
25
6.1
01
-.1
52
-.1
13
.43
6.4
53
.25
0-.
10
9.1
71
.30
9.4
89
-.3
36
.04
2-.
09
4-.
02
6.a
.a.1
76
.03
9.2
41
.38
8.1
76
.79
9**
.95
5**
.11
21
-.3
25
.72
2*
.67
1*
Sig
. (2
-ta
ile
d)
.92
9.0
72
.65
0.7
78
.48
4.4
44
.65
9.9
07
.67
3.0
56
.62
3.5
79
.79
6.6
96
.77
3.2
41
.26
0.5
16
.77
9.6
60
.41
9.1
82
.37
6.9
21
.82
5.9
52
..
.65
1.9
27
.53
1.3
02
.65
1.0
10
.00
0.7
75
.43
2.0
28
.04
8
N9
88
99
99
88
99
79
99
98
99
99
99
88
80
09
89
99
99
99
89
9
Pe
ars
on
Co
rre
latio
n.1
36
.66
2.0
44
.12
9.1
01
-.1
44
-.1
72
.27
3-.
46
5.9
77
**.2
37
-.2
09
.40
8.0
19
-.0
07
.19
4.7
62
*.0
56
.15
4.1
14
.30
3.1
45
-.3
79
-.4
26
-.5
61
-.4
43
.a.a
.12
9-.
57
3.0
11
.07
8.1
29
.98
7**
.72
4*
.48
4.7
22
*-.
65
11
.99
5**
Sig
. (2
-ta
ile
d)
.72
7.0
74
.91
7.7
41
.79
7.7
12
.65
9.5
13
.24
6.0
00
.53
9.6
53
.27
6.9
61
.98
7.6
16
.02
8.8
87
.69
3.7
70
.42
8.7
09
.31
4.2
93
.14
8.2
72
..
.74
1.1
37
.97
7.8
41
.74
1.0
00
.02
7.1
87
.02
8.0
81
.00
0
N9
88
99
99
88
99
79
99
98
99
99
99
88
80
09
89
99
99
99
89
9
Pe
ars
on
Co
rre
latio
n.1
31
.58
9.0
16
.15
4.1
46
-.0
88
-.2
12
.24
7-.
44
4.9
81
**.2
42
-.2
01
.42
5.0
50
.03
3.1
88
.77
7*
.07
0.1
85
.13
0.3
07
.09
7-.
37
7-.
46
1-.
58
4-.
47
6.a
.a.1
20
-.5
98
-.0
41
.05
9.1
20
.97
0**
.66
8*
.49
8.6
71
*-.
64
9.9
95
**1
Sig
. (2
-ta
ile
d)
.73
7.1
25
.96
9.6
93
.70
9.8
21
.58
3.5
56
.27
0.0
00
.53
0.6
66
.25
4.8
98
.93
2.6
29
.02
3.8
58
.63
4.7
39
.42
1.8
03
.31
7.2
50
.12
9.2
33
..
.75
9.1
17
.91
7.8
79
.75
9.0
00
.04
9.1
73
.04
8.0
82
.00
0
N9
88
99
99
88
99
79
99
98
99
99
99
88
80
09
89
99
99
99
89
9
a. C
an
no
t b
e c
om
pu
ted
be
ca
us
e a
t le
as
t o
ne
of th
e v
ari
ab
les
is
co
ns
tan
t.
*. C
orr
ela
tio
n is
sig
nific
an
t a
t th
e 0
.05
le
vel (2
-ta
ile
d).
**. C
orr
ela
tio
n is
sig
nific
an
t a
t th
e 0
.01
le
vel (2
-ta
ile
d).
b. Y
ea
r =
6
51
*. C
orr
ela
tio
n is
sig
nific
an
t a
t th
e 0
.05
le
vel (2
-ta
ile
d).
50
51
41
25
45
48
45
47
48
18
50
a. C
an
no
t b
e c
om
pu
ted
be
ca
us
e a
t le
as
t o
ne
of th
e v
ari
ab
les
is
co
ns
tan
t.
**. C
orr
ela
tio
n is
sig
nific
an
t a
t th
e 0
.01
le
vel (2
-ta
ile
d).
b. Y
ea
r =
5
Co
rre
lati
on
sb
9
Co
rre
lati
on
sb
946
12
50
51
a. C
an
no
t b
e c
om
pu
ted
be
ca
us
e a
t le
as
t o
ne
of th
e v
ari
ab
les
is
co
ns
tan
t.
*. C
orr
ela
tio
n is
sig
nific
an
t a
t th
e 0
.05
le
vel (2
-ta
ile
d).
**. C
orr
ela
tio
n is
sig
nific
an
t a
t th
e 0
.01
le
vel (2
-ta
ile
d).
b. Y
ea
r =
4
12
Co
rre
lati
on
sb
45
29
9

84
Year
= 7
19
11
12
13
14
15
16
17
18
19
20
21
22
23
24
25
26
27
28
29
30
31
32
33
34
35
36
40
41
42
43
44
45
46
47
48
49
50
51
Pe
ars
on
Co
rre
latio
n-.
06
71
-.2
32
-.1
82
-.0
89
-.2
91
-.0
53
-.2
96
-.4
04
.59
0.2
10
-.3
59
.67
3*
-.3
51
-.1
50
.09
6-.
00
4-.
04
1-.
21
9.1
48
.11
0.2
37
-.0
54
-.4
39
-.4
10
-.2
32
.a.a
-.2
04
-.4
87
-.0
41
-.0
60
-.2
04
.73
9*
.42
5.2
20
.64
4-.
15
1.6
43
.56
5
Sig
. (2
-ta
ile
d)
.86
5.5
81
.64
0.8
20
.44
7.8
93
.51
9.3
21
.09
4.5
88
.42
9.0
47
.39
4.6
99
.80
5.9
93
.91
7.5
71
.70
3.7
78
.54
0.8
91
.32
5.3
61
.61
6.
..6
28
.18
3.9
17
.87
8.6
28
.02
3.2
55
.57
0.0
61
.72
1.0
62
.11
3
N9
98
99
99
78
99
79
89
98
99
99
99
77
70
08
99
98
99
99
89
9
Pe
ars
on
Co
rre
latio
n.0
51
.67
3*
-.3
17
-.1
91
.21
0.4
02
-.3
36
-.3
92
-.3
75
.25
7.0
79
-.0
94
1.1
58
-.1
06
-.4
02
.21
2-.
35
8-.
15
4-.
19
4-.
21
5-.
33
8-.
24
1-.
72
5*
-.6
72
-.8
39
**.a
.a-.
31
1-.
67
0*
-.1
19
-.3
49
-.3
11
.41
0.2
69
.25
4.1
65
-.7
32
*.5
54
.55
8
Sig
. (2
-ta
ile
d)
.88
8.0
47
.40
7.5
97
.56
0.2
50
.34
2.3
37
.32
0.4
74
.82
9.8
25
.70
8.7
70
.24
9.6
15
.31
0.6
71
.59
1.5
51
.34
0.5
02
.04
2.0
68
.00
9.
..4
16
.03
4.7
44
.32
2.4
16
.23
9.4
52
.48
0.6
48
.02
5.0
97
.09
3
N1
09
91
01
01
01
08
91
01
08
10
81
01
08
10
10
10
10
10
10
88
80
09
10
10
10
91
01
01
01
09
10
10
Pe
ars
on
Co
rre
latio
n-.
25
3.7
39
*-.
23
4.0
22
.01
3.0
76
-.1
04
-.3
01
-.3
12
.93
8**
.30
9-.
06
0.4
10
-.0
53
.18
0.3
61
.20
4.3
63
.05
3.3
27
.30
4.2
14
-.1
26
-.2
28
-.2
90
-.0
17
.a.a
-.2
43
-.2
18
-.3
59
.05
9-.
24
31
.48
1.3
74
.78
6**
.04
5.9
73
**.9
40
**
Sig
. (2
-ta
ile
d)
.48
1.0
23
.54
4.9
51
.97
1.8
34
.77
5.4
69
.41
4.0
00
.38
5.8
88
.23
9.9
02
.61
8.3
06
.62
8.3
02
.88
4.3
57
.39
3.5
52
.72
9.5
87
.48
6.9
69
..
.52
9.5
45
.30
8.8
71
.52
9.1
60
.28
7.0
07
.90
9.0
00
.00
0
N1
09
91
01
01
01
08
91
01
08
10
81
01
08
10
10
10
10
10
10
88
80
09
10
10
10
91
01
01
01
09
10
10
Pe
ars
on
Co
rre
latio
n-.
28
9.6
44
-.2
77
-.1
97
-.1
07
-.2
59
.00
5-.
30
0-.
04
6.5
89
.13
7-.
14
1.1
65
-.2
70
-.0
28
.41
6.1
97
.32
2-.
19
9.3
06
.28
7.5
19
-.1
01
.11
4-.
01
9.2
32
.a.a
-.2
68
-.0
83
-.1
11
.15
6-.
26
8.7
86
**.6
39
*.3
23
1.0
77
.71
2*
.60
4
Sig
. (2
-ta
ile
d)
.41
9.0
61
.47
1.5
86
.76
8.4
70
.98
8.4
71
.90
7.0
73
.70
7.7
39
.64
8.5
18
.93
8.2
31
.64
1.3
64
.58
1.3
89
.42
2.1
24
.78
0.7
89
.96
5.5
80
..
.48
5.8
19
.76
1.6
67
.48
5.0
07
.04
7.3
63
.84
4.0
21
.06
5
N1
09
91
01
01
01
08
91
01
08
10
81
01
08
10
10
10
10
10
10
88
80
09
10
10
10
91
01
01
01
09
10
10
Pe
ars
on
Co
rre
latio
n-.
19
1.6
43
-.2
53
-.0
26
.04
3.1
85
-.1
45
-.3
15
-.3
16
.90
9**
.24
0-.
07
6.5
54
-.0
12
.12
3.2
72
.28
6.2
91
.02
7.2
05
.18
9.0
86
-.1
63
-.3
55
-.4
31
-.2
22
.a.a
-.2
60
-.2
69
-.3
30
-.0
50
-.2
60
.97
3**
.45
8.3
29
.71
2*
-.1
43
1.9
86
**
Sig
. (2
-ta
ile
d)
.59
7.0
62
.51
1.9
44
.90
6.6
08
.68
9.4
48
.40
7.0
00
.50
3.8
59
.09
7.9
78
.73
5.4
47
.49
2.4
15
.94
1.5
69
.60
2.8
14
.65
4.3
88
.28
7.5
97
..
.49
9.4
52
.35
2.8
91
.49
9.0
00
.18
3.3
54
.02
1.7
14
.00
0
N1
09
91
01
01
01
08
91
01
08
10
81
01
08
10
10
10
10
10
10
88
80
09
10
10
10
91
01
01
01
09
10
10
Pe
ars
on
Co
rre
latio
n-.
15
9.5
65
-.2
40
-.0
04
.05
9.2
36
-.1
61
-.2
95
-.2
97
.92
2**
.22
4-.
07
3.5
58
.03
7.1
31
.25
8.2
85
.30
4.0
56
.18
7.1
85
.04
6-.
17
2-.
38
6-.
46
2-.
26
5.a
.a-.
24
2-.
26
4-.
35
2-.
05
4-.
24
2.9
40
**.3
92
.30
6.6
04
-.1
40
.98
6**
1
Sig
. (2
-ta
ile
d)
.66
2.1
13
.53
5.9
91
.87
2.5
11
.65
6.4
78
.43
8.0
00
.53
3.8
63
.09
3.9
30
.71
9.4
72
.49
5.3
92
.87
7.6
05
.60
9.9
01
.63
6.3
44
.25
0.5
26
..
.53
0.4
62
.31
8.8
81
.53
0.0
00
.26
3.3
90
.06
5.7
19
.00
0
N1
09
91
01
01
01
08
91
01
08
10
81
01
08
10
10
10
10
10
10
88
80
09
10
10
10
91
01
01
01
09
10
10
Year
= 8
19
11
12
13
14
15
16
17
18
19
20
21
22
23
24
25
26
27
28
29
30
31
32
33
34
35
36
40
41
42
43
44
45
46
47
48
49
50
51
Pe
ars
on
Co
rre
latio
n.3
29
1-.
25
5-.
19
3-.
17
1-.
34
7.0
86
-.2
58
-.0
94
.74
9*
.27
2-.
39
0.7
87
*-.
38
5-.
06
1.0
92
.63
9-.
05
8-.
19
1.0
46
.09
2-.
02
6-.
45
8-.
23
8-.
30
8-.
38
9.a
.a-.
32
5-.
39
8.2
24
-.1
42
-.3
25
.79
2*
.60
6-.
06
9.5
46
-.0
48
.77
8*
.76
8*
Sig
. (2
-ta
ile
d)
.38
7.5
42
.61
9.6
60
.36
0.8
25
.53
8.8
25
.02
0.4
78
.38
7.0
12
.34
6.8
77
.81
5.0
88
.88
2.6
22
.90
7.8
14
.94
7.2
15
.57
0.5
01
.38
8.
..4
77
.28
9.5
63
.71
5.4
77
.01
1.1
49
.86
0.1
28
.91
1.0
14
.01
6
N9
98
99
99
88
99
79
89
98
99
99
99
87
70
07
99
97
97
99
89
9
Pe
ars
on
Co
rre
latio
n.2
21
.74
9*
-.2
18
-.0
28
-.1
31
.05
4.0
85
-.2
17
.13
01
.37
9-.
00
2.9
52
**.0
70
.25
8.1
90
-.0
88
.13
3.0
38
.21
9.2
84
-.1
06
.08
0.2
79
.26
0.1
76
.a.a
-.2
34
.09
7.0
78
.01
8-.
23
4.9
91
**.7
78
*.0
68
.60
0.3
15
.97
1**
.96
8**
Sig
. (2
-ta
ile
d)
.54
0.0
20
.57
2.9
40
.71
9.8
91
.81
6.5
75
.73
8.2
80
.99
7.0
00
.85
9.4
71
.60
0.8
22
.71
4.9
16
.54
4.4
27
.77
1.8
27
.46
7.5
33
.67
6.
..5
77
.79
0.8
30
.96
0.5
77
.00
0.0
23
.85
2.0
67
.40
8.0
00
.00
0
N1
09
91
01
09
10
99
10
10
81
09
10
10
91
01
01
01
01
01
09
88
00
81
01
01
08
10
81
01
09
10
10
Pe
ars
on
Co
rre
latio
n-.
08
2.6
06
-.2
32
-.4
18
-.4
67
-.0
22
.47
0-.
23
1.3
82
.77
8*
.26
0.0
70
.64
1.3
85
.27
5.3
84
-.2
26
.04
1-.
37
5.1
54
.33
6.0
90
.34
4.3
63
.49
0.3
89
.a.a
-.2
16
.35
3.5
72
-.0
63
-.2
16
.76
8*
1.2
49
.74
7*
.32
3.8
02
*.7
81
*
Sig
. (2
-ta
ile
d)
.84
7.1
49
.58
0.3
03
.24
3.9
62
.24
0.5
83
.35
0.0
23
.53
5.8
82
.08
7.3
46
.50
9.3
48
.59
1.9
23
.36
0.7
15
.41
6.8
32
.40
3.4
24
.32
4.4
46
..
.60
8.3
90
.13
9.8
81
.60
8.0
26
.55
2.0
33
.43
5.0
17
.02
2
N8
78
88
78
88
88
78
88
88
88
88
88
76
60
08
88
88
88
88
88
8
Pe
ars
on
Co
rre
latio
n.2
60
.54
6-.
17
1-.
23
1-.
38
3-.
13
5.3
80
-.1
71
.04
5.6
00
.15
6-.
18
8.4
50
-.2
65
-.0
34
.54
9-.
02
8.4
33
-.2
10
.24
3.2
92
.44
6.1
99
.07
7.2
07
.19
3.a
.a-.
18
5.1
99
.32
9.3
04
-.1
85
.57
0.7
47
*.2
69
1-.
13
3.7
18
*.7
08
*
Sig
. (2
-ta
ile
d)
.46
8.1
28
.66
0.5
20
.27
5.7
29
.27
9.6
61
.90
9.0
67
.66
6.6
55
.19
1.4
90
.92
5.1
00
.94
3.2
11
.56
1.4
99
.41
3.1
96
.58
1.8
44
.62
3.6
46
..
.66
0.5
81
.35
3.3
93
.66
0.0
85
.03
3.4
52
.73
3.0
19
.02
2
N1
09
91
01
09
10
99
10
10
81
09
10
10
91
01
01
01
01
01
09
88
00
81
01
01
08
10
81
01
09
10
10
Pe
ars
on
Co
rre
latio
n.2
23
.77
8*
-.2
41
-.1
13
-.0
94
.00
9.0
54
-.2
40
.01
7.9
71
**.2
97
-.0
64
.92
0**
-.0
31
.15
6.2
39
.07
7.1
68
-.0
38
.12
9.1
96
-.0
85
-.0
42
.10
5.1
10
.02
9.a
.a-.
25
4-.
02
8.0
68
-.0
34
-.2
54
.94
9**
.80
2*
-.0
08
.71
8*
.10
61
.99
9**
Sig
. (2
-ta
ile
d)
.53
6.0
14
.53
3.7
56
.79
7.9
82
.88
1.5
35
.96
5.0
00
.40
4.8
81
.00
0.9
36
.66
7.5
06
.84
4.6
42
.91
7.7
23
.58
8.8
16
.90
8.7
89
.79
5.9
46
..
.54
4.9
39
.85
3.9
26
.54
4.0
00
.01
7.9
83
.01
9.7
86
.00
0
N1
09
91
01
09
10
99
10
10
81
09
10
10
91
01
01
01
01
01
09
88
00
81
01
01
08
10
81
01
09
10
10
Pe
ars
on
Co
rre
latio
n.2
24
.76
8*
-.2
37
-.0
98
-.0
66
.02
5.0
26
-.2
35
-.0
09
.96
8**
.30
2-.
05
6.9
21
**-.
03
0.1
60
.23
4.1
04
.17
5-.
01
8.1
23
.18
7-.
10
5-.
07
0.0
81
.08
0-.
00
1.a
.a-.
24
9-.
05
6.0
35
-.0
41
-.2
49
.94
3**
.78
1*
-.0
30
.70
8*
.08
3.9
99
**1
Sig
. (2
-ta
ile
d)
.53
3.0
16
.54
0.7
89
.85
6.9
49
.94
3.5
42
.98
1.0
00
.39
7.8
96
.00
0.9
39
.65
8.5
15
.78
9.6
29
.96
0.7
36
.60
4.7
72
.84
8.8
36
.85
1.9
98
..
.55
2.8
79
.92
5.9
10
.55
2.0
00
.02
2.9
34
.02
2.8
32
.00
0
N1
09
91
01
09
10
99
10
10
81
09
10
10
91
01
01
01
01
01
09
88
00
81
01
01
08
10
81
01
09
10
10
Year
= 9
19
11
12
13
14
15
16
17
18
19
20
21
22
23
24
25
26
27
28
29
30
31
32
33
34
35
36
40
41
42
43
44
45
46
47
48
49
50
51
Pe
ars
on
Co
rre
latio
n.2
57
.77
4*
-.1
65
.05
1.0
72
.48
2.0
15
-.1
66
.02
21
.02
8.0
91
.90
8**
.07
0.1
87
.07
5-.
17
1-.
01
8.0
95
-.0
41
-.1
75
-.2
64
-.4
58
.07
6.0
23
.03
9-.
04
6.a
-.3
28
.07
1-.
20
4-.
23
0-.
32
8.9
38
**.4
44
.15
1.4
29
.08
8.9
70
**.9
85
**
Sig
. (2
-ta
ile
d)
.42
0.0
24
.64
9.8
75
.82
3.1
33
.96
5.6
48
.95
3.9
32
.79
1.0
00
.83
8.5
61
.82
6.6
15
.95
7.7
70
.89
9.5
87
.40
6.1
83
.83
6.9
53
.92
7.9
13
..3
24
.83
5.5
26
.47
1.3
24
.00
0.1
48
.64
0.1
64
.78
6.0
00
.00
0
N1
28
10
12
12
11
11
10
10
12
12
11
12
11
12
11
11
11
12
12
12
12
10
10
98
80
11
11
12
12
11
12
12
12
12
12
12
12
Pe
ars
on
Co
rre
latio
n.2
43
.51
0-.
24
7.1
09
.26
6.6
09
*-.
20
3-.
24
9.0
59
.90
8**
.02
1.3
17
1.1
33
.23
9-.
11
4-.
18
2-.
16
6.1
16
-.2
99
-.3
34
-.4
40
-.6
39
*-.
10
0-.
13
7-.
13
4-.
22
6.a
-.2
53
.01
8-.
27
0-.
33
5-.
25
3.7
38
**.0
73
.18
9.0
65
.09
3.8
18
**.8
85
**
Sig
. (2
-ta
ile
d)
.44
6.1
97
.49
1.7
35
.40
3.0
47
.54
9.4
87
.87
0.0
00
.94
8.3
43
.69
6.4
54
.73
8.5
93
.62
6.7
19
.34
5.2
89
.15
2.0
47
.78
3.7
26
.75
2.5
91
..4
52
.95
8.3
97
.28
7.4
52
.00
6.8
21
.55
7.8
42
.77
3.0
01
.00
0
N1
28
10
12
12
11
11
10
10
12
12
11
12
11
12
11
11
11
12
12
12
12
10
10
98
80
11
11
12
12
11
12
12
12
12
12
12
12
Pe
ars
on
Co
rre
latio
n.0
13
.79
5*
-.0
27
-.2
23
-.3
73
-.3
21
.43
8-.
02
6-.
25
8.4
29
-.1
42
-.5
23
.06
5-.
33
5-.
27
2.4
60
.02
3.3
47
-.1
64
.41
4.2
45
.35
1.2
08
.07
2.0
46
.05
4.0
75
.a-.
15
5-.
02
7.0
67
.18
5-.
15
5.6
56
*.8
52
**-.
10
31
-.1
63
.59
0*
.48
2
Sig
. (2
-ta
ile
d)
.96
8.0
18
.94
2.4
87
.23
2.3
35
.17
8.9
44
.47
2.1
64
.66
1.0
99
.84
2.3
14
.39
3.1
55
.94
7.2
96
.61
0.1
81
.44
3.2
63
.56
4.8
44
.90
7.9
00
.85
9.
.64
8.9
37
.83
5.5
66
.64
8.0
21
.00
0.7
51
.61
2.0
44
.11
2
N1
28
10
12
12
11
11
10
10
12
12
11
12
11
12
11
11
11
12
12
12
12
10
10
98
80
11
11
12
12
11
12
12
12
12
12
12
12
Pe
ars
on
Co
rre
latio
n.1
72
.85
4**
-.1
93
-.0
69
.01
2.3
78
.06
4-.
19
3-.
09
0.9
70
**-.
10
0-.
06
8.8
18
**.0
14
.13
0.1
57
-.0
84
.05
0-.
00
6.0
05
-.1
22
-.1
93
-.3
77
-.0
17
-.0
53
-.0
73
-.1
30
.a-.
21
9-.
01
1-.
14
9-.
19
7-.
21
9.9
61
**.5
74
.12
5.5
90
*-.
05
21
.98
7**
Sig
. (2
-ta
ile
d)
.59
3.0
07
.59
3.8
32
.97
0.2
51
.85
1.5
93
.80
4.0
00
.75
7.8
43
.00
1.9
66
.68
8.6
44
.80
6.8
84
.98
5.9
87
.70
6.5
49
.28
3.9
62
.89
2.8
63
.76
0.
.51
7.9
74
.64
5.5
39
.51
7.0
00
.05
1.6
98
.04
4.8
73
.00
0
N1
28
10
12
12
11
11
10
10
12
12
11
12
11
12
11
11
11
12
12
12
12
10
10
98
80
11
11
12
12
11
12
12
12
12
12
12
12
Pe
ars
on
Co
rre
latio
n.2
36
.79
9*
-.2
04
-.0
49
.02
0.4
75
.04
7-.
20
4-.
06
9.9
85
**-.
10
9-.
05
3.8
85
**.0
22
.13
1.1
26
-.0
81
.03
2.0
05
-.0
47
-.1
44
-.2
25
-.5
12
-.0
33
-.0
70
-.0
85
-.1
45
.a-.
22
9-.
06
8-.
15
4-.
20
9-.
22
9.9
25
**.4
52
.12
8.4
82
-.0
55
.98
7**
1
Sig
. (2
-ta
ile
d)
.46
0.0
17
.57
2.8
80
.95
2.1
40
.89
0.5
72
.85
1.0
00
.73
6.8
77
.00
0.9
49
.68
6.7
11
.81
2.9
24
.98
6.8
85
.65
5.4
83
.13
0.9
27
.85
9.8
41
.73
2.
.49
9.8
41
.63
3.5
15
.49
9.0
00
.14
0.6
93
.11
2.8
65
.00
0
N1
28
10
12
12
11
11
10
10
12
12
11
12
11
12
11
11
11
12
12
12
12
10
10
98
80
11
11
12
12
11
12
12
12
12
12
12
12
Year
= 1
0
19
11
12
13
14
15
16
17
18
19
20
21
22
23
24
25
26
27
28
29
30
31
32
33
34
35
36
40
41
42
43
44
45
46
47
48
49
50
51
Pe
ars
on
Co
rre
latio
n-.
07
1.8
81
**-.
23
8-.
48
6-.
79
7**
.08
3.9
98
**-.
25
2-.
26
7.6
77
*-.
06
1-.
18
4-.
18
7-.
24
2.2
00
.70
2*
.13
7.3
85
-.4
61
.57
8.8
73
**.2
78
-.2
54
.05
3.1
21
.21
5.2
13
.a-.
12
6-.
34
01
.16
1-.
12
6.7
94
**.9
45
**-.
79
7**
.94
7**
-.1
44
.83
3**
.79
9**
Sig
. (2
-ta
ile
d)
.83
6.0
04
.57
0.1
30
.00
3.8
20
.00
0.5
47
.52
3.0
22
.85
9.5
88
.58
1.5
01
.55
5.0
24
.70
5.3
06
.15
4.0
62
.00
0.4
08
.45
0.8
85
.74
0.6
09
.61
2.
.71
2.3
06
.63
6.7
12
.00
3.0
00
.00
3.0
00
.67
2.0
01
.00
3
N1
18
81
11
11
01
18
81
11
11
11
11
01
11
01
09
11
11
11
11
11
10
10
88
01
11
11
11
11
11
11
11
11
11
11
11
1
Pe
ars
on
Co
rre
latio
n.0
26
.89
5**
-.3
05
-.2
41
-.5
31
.24
3.7
92
**-.
38
1-.
14
5.9
71
**.2
08
-.0
70
.41
6-.
10
1.4
29
-.1
86
-.1
61
.13
9-.
21
5.4
94
.65
1*
-.0
38
-.1
44
-.1
07
.18
5.2
39
.22
1.a
-.1
03
-.1
15
.79
4**
-.0
83
-.1
03
1.7
44
**-.
56
4.6
98
*.1
18
.98
5**
.98
5**
Sig
. (2
-ta
ile
d)
.94
1.0
03
.46
3.4
75
.09
3.4
99
.00
4.3
52
.73
1.0
00
.54
0.8
38
.20
3.7
81
.18
7.6
07
.65
7.7
21
.52
5.1
23
.03
0.9
11
.67
3.7
69
.60
8.5
68
.59
9.
.76
3.7
36
.00
3.8
08
.76
3.0
09
.07
1.0
17
.72
9.0
00
.00
0
N1
18
81
11
11
01
18
81
11
11
11
11
01
11
01
09
11
11
11
11
11
10
10
88
01
11
11
11
11
11
11
11
11
11
11
11
1
Pe
ars
on
Co
rre
latio
n.0
18
.89
6**
-.3
26
-.3
00
-.5
26
.25
4.8
30
**-.
38
7-.
13
8.9
67
**.1
66
-.0
85
.37
2-.
10
5.3
28
-.1
82
-.1
26
.10
8-.
26
9.4
24
.67
3*
-.0
63
-.2
08
-.0
97
.08
2.1
44
.11
2.a
-.2
03
-.1
95
.83
3**
-.1
01
-.2
03
.98
5**
.78
1**
-.6
12
*.7
34
*.0
75
1.9
98
**
Sig
. (2
-ta
ile
d)
.95
8.0
03
.43
1.3
70
.09
7.4
78
.00
2.3
44
.74
5.0
00
.62
6.8
05
.26
0.7
74
.32
5.6
15
.72
9.7
81
.42
4.1
93
.02
3.8
55
.54
0.7
89
.82
1.7
34
.79
1.
.54
9.5
65
.00
1.7
68
.54
9.0
00
.00
5.0
46
.01
0.8
26
.00
0
N1
18
81
11
11
01
18
81
11
11
11
11
01
11
01
09
11
11
11
11
11
10
10
88
01
11
11
11
11
11
11
11
11
11
11
11
1
Pe
ars
on
Co
rre
latio
n.0
22
.88
4**
-.3
45
-.2
78
-.4
87
.27
2.7
96
**-.
41
0-.
12
3.9
80
**.2
07
-.0
69
.42
3-.
09
3.3
26
-.1
69
-.1
51
.14
3-.
24
2.4
04
.64
9*
-.0
82
-.1
96
-.1
15
.06
7.1
33
.10
0.a
-.2
24
-.1
70
.79
9**
-.1
08
-.2
24
.98
5**
.75
0**
-.5
81
.70
1*
.11
0.9
98
**1
Sig
. (2
-ta
ile
d)
.94
9.0
04
.40
2.4
07
.12
9.4
47
.00
3.3
13
.77
2.0
00
.54
2.8
40
.19
5.7
99
.32
7.6
40
.67
7.7
13
.47
3.2
18
.03
1.8
11
.56
4.7
51
.85
4.7
54
.81
5.
.50
8.6
17
.00
3.7
51
.50
8.0
00
.00
8.0
61
.01
6.7
47
.00
0
N1
18
81
11
11
01
18
81
11
11
11
11
01
11
01
09
11
11
11
11
11
10
10
88
01
11
11
11
11
11
11
11
11
11
11
11
1
**. C
orr
ela
tio
n is
sig
nific
an
t a
t th
e 0
.01
le
vel (2
-ta
ile
d).
a. C
an
no
t b
e c
om
pu
ted
be
ca
us
e a
t le
as
t o
ne
of th
e v
ari
ab
les
is
co
ns
tan
t.
**. C
orr
ela
tio
n is
sig
nific
an
t a
t th
e 0
.01
le
vel (2
-ta
ile
d).
b. Y
ea
r =
9
Co
rre
lati
on
sb
*. C
orr
ela
tio
n is
sig
nific
an
t a
t th
e 0
.05
le
vel (2
-ta
ile
d).
b
. Y
ea
r =
10
45
50
51
a. C
an
no
t b
e c
om
pu
ted
be
ca
us
e a
t le
as
t o
ne
of th
e v
ari
ab
les
is
co
ns
tan
t.
21
18
**. C
orr
ela
tio
n is
sig
nific
an
t a
t th
e 0
.01
le
vel (2
-ta
ile
d).
b. Y
ea
r =
8
Co
rre
lati
on
sb
42
48
50
51
*. C
orr
ela
tio
n is
sig
nific
an
t a
t th
e 0
.05
le
vel (2
-ta
ile
d).
*. C
orr
ela
tio
n is
sig
nific
an
t a
t th
e 0
.05
le
vel (2
-ta
ile
d).
a. C
an
no
t b
e c
om
pu
ted
be
ca
us
e a
t le
as
t o
ne
of th
e v
ari
ab
les
is
co
ns
tan
t.
18
b. Y
ea
r =
7
Co
rre
lati
on
sb
9 46
48
50
51
*. C
orr
ela
tio
n is
sig
nific
an
t a
t th
e 0
.05
le
vel (2
-ta
ile
d).
a. C
an
no
t b
e c
om
pu
ted
be
ca
us
e a
t le
as
t o
ne
of th
e v
ari
ab
les
is
co
ns
tan
t.
45
21
48
50
51
**. C
orr
ela
tio
n is
sig
nific
an
t a
t th
e 0
.01
le
vel (2
-ta
ile
d).
Co
rre
lati
on
sb
9

85
Year
= 1
1
19
11
12
13
14
15
16
17
18
19
20
21
22
23
24
25
26
27
28
29
30
31
32
33
34
35
36
40
41
42
43
44
45
46
47
48
49
50
51
Pe
ars
on
Co
rre
latio
n.1
52
1-.
05
1-.
41
2-.
58
2.4
35
.76
1*
-.0
90
-.2
40
.70
8*
-.6
96
*-.
36
7.2
33
.09
5.3
43
.76
5*
.76
7*
.02
9-.
45
6.4
79
.67
5*
-.0
76
-.2
46
-.3
76
-.4
51
-.4
42
-.4
75
-.4
42
-.2
38
-.3
55
.79
8**
.02
6-.
23
8.8
20
**.7
00
*.1
68
.69
7*
-.4
07
.80
7**
.79
8**
Sig
. (2
-ta
ile
d)
.69
6.9
04
.27
0.1
00
.24
2.0
17
.83
2.5
67
.03
3.0
37
.33
1.5
47
.80
7.3
66
.01
6.0
16
.94
5.2
17
.19
2.0
46
.84
5.5
24
.35
8.2
62
.32
1.3
41
.38
0.5
37
.34
9.0
10
.94
7.5
37
.00
7.0
36
.66
6.0
37
.27
7.0
08
.01
0
N9
98
99
99
88
99
99
99
99
89
99
99
88
76
69
99
99
99
99
99
9
Pe
ars
on
Co
rre
latio
n.3
54
.43
5-.
24
4.4
31
.27
91
-.2
71
-.3
43
-.0
59
.66
6*
-.6
16
*.2
31
.78
9**
.84
6**
.78
3**
.14
3.1
41
-.0
48
.41
1-.
05
7.0
14
-.7
05
*.1
43
-.4
13
-.4
74
-.3
35
-.2
29
-.5
72
-.3
65
-.3
94
-.2
45
-.4
76
-.3
65
.55
7.0
33
.37
3.0
37
-.2
24
.69
2*
.69
2*
Sig
. (2
-ta
ile
d)
.25
9.2
42
.52
7.1
62
.38
0.3
95
.36
6.8
80
.01
8.0
33
.46
9.0
02
.00
1.0
03
.65
7.6
63
.88
8.1
85
.86
0.9
66
.01
1.6
57
.23
5.1
98
.41
8.6
21
.17
9.2
43
.20
4.4
43
.11
7.2
43
.06
0.9
19
.23
3.9
08
.48
4.0
13
.01
3
N1
29
91
21
21
21
29
91
21
21
21
21
21
21
21
21
11
21
21
21
21
21
09
87
71
21
21
21
21
21
21
21
21
21
21
21
2
Pe
ars
on
Co
rre
latio
n.1
44
.70
8*
-.0
76
.04
4-.
17
4.6
66
*.2
05
-.1
23
-.2
51
1-.
32
2-.
07
9.7
08
**.4
72
.43
8.4
51
.04
6-.
11
1.1
05
.29
3.4
53
-.2
01
-.0
79
-.2
07
-.3
56
-.0
34
-.0
35
-.0
93
-.3
75
-.4
51
.21
8-.
25
6-.
37
5.9
49
**.3
58
.09
6.5
32
-.2
70
.97
7**
.97
8**
Sig
. (2
-ta
ile
d)
.63
8.0
33
.83
4.8
86
.57
0.0
18
.50
1.7
52
.48
5.2
83
.79
9.0
07
.12
2.1
34
.12
2.8
82
.73
1.7
33
.33
1.1
20
.51
0.7
98
.54
1.3
13
.93
1.9
35
.82
7.2
07
.12
2.4
74
.39
9.2
07
.00
0.2
30
.75
5.0
61
.37
3.0
00
.00
0
N1
39
10
13
13
12
13
91
01
31
31
31
31
21
31
31
31
21
31
31
31
31
31
11
09
88
13
13
13
13
13
13
13
13
13
13
13
13
Pe
ars
on
Co
rre
latio
n.1
31
.23
3-.
06
7.4
65
.32
1.7
89
**-.
31
6.0
27
-.2
58
.70
8**
-.1
15
.15
71
.78
2**
.56
3*
-.1
64
-.0
69
-.2
72
.40
0-.
30
9-.
19
7-.
56
1*
-.1
53
-.1
38
-.4
73
-.1
61
-.2
02
-.2
88
-.0
20
-.4
02
-.3
17
-.4
91
-.0
20
.48
9-.
31
9.0
58
-.1
92
-.1
49
.65
5*
.65
0*
Sig
. (2
-ta
ile
d)
.66
9.5
47
.85
4.1
10
.28
5.0
02
.29
4.9
45
.47
1.0
07
.70
7.6
08
.00
3.0
45
.59
2.8
22
.39
2.1
75
.30
5.5
20
.04
6.6
17
.68
7.1
67
.67
9.6
31
.48
9.9
48
.17
3.2
92
.08
8.9
48
.09
0.2
88
.85
1.5
30
.62
6.0
15
.01
6
N1
39
10
13
13
12
13
91
01
31
31
31
31
21
31
31
31
21
31
31
31
31
31
11
09
88
13
13
13
13
13
13
13
13
13
13
13
13
Pe
ars
on
Co
rre
latio
n-.
05
1.6
97
*-.
09
4-.
38
1-.
50
0.0
37
.62
3*
-.1
90
-.0
89
.53
2-.
21
9-.
16
6-.
19
2-.
18
3.0
72
.79
7**
.08
6.2
69
-.2
92
.65
1*
.81
9**
.25
5.0
24
-.1
95
.03
4.0
09
.07
2.0
74
-.4
95
-.2
01
.65
0*
.16
5-.
49
5.7
19
**.9
41
**.0
75
1-.
14
8.5
80
*.5
72
*
Sig
. (2
-ta
ile
d)
.87
0.0
37
.79
5.1
99
.08
2.9
08
.02
3.6
25
.80
6.0
61
.47
2.5
88
.53
0.5
69
.81
4.0
01
.77
9.3
98
.33
2.0
16
.00
1.4
01
.93
8.5
66
.92
6.9
81
.86
5.8
62
.08
5.5
11
.01
6.5
90
.08
5.0
06
.00
0.8
09
.62
8.0
38
.04
1
N1
39
10
13
13
12
13
91
01
31
31
31
31
21
31
31
31
21
31
31
31
31
31
11
09
88
13
13
13
13
13
13
13
13
13
13
13
13
Pe
ars
on
Co
rre
latio
n.1
64
.80
7**
-.0
65
.01
5-.
22
6.6
92
*.2
83
-.1
27
-.2
45
.97
7**
-.3
88
-.1
11
.65
5*
.46
1.4
40
.54
2.1
29
-.0
58
.07
5.3
34
.51
6-.
21
1-.
05
1-.
21
7-.
35
7-.
02
0-.
01
1-.
06
7-.
43
1-.
42
7.3
04
-.2
06
-.4
31
.94
4**
.44
0.1
55
.58
0*
-.3
26
1.9
98
**
Sig
. (2
-ta
ile
d)
.59
3.0
08
.85
9.9
60
.45
7.0
13
.34
8.7
45
.49
5.0
00
.19
0.7
19
.01
5.1
32
.13
2.0
56
.67
4.8
59
.80
7.2
65
.07
1.4
89
.86
7.5
22
.31
1.9
59
.98
0.8
75
.14
1.1
46
.31
2.5
00
.14
1.0
00
.13
3.6
13
.03
8.2
77
.00
0
N1
39
10
13
13
12
13
91
01
31
31
31
31
21
31
31
31
21
31
31
31
31
31
11
09
88
13
13
13
13
13
13
13
13
13
13
13
13
Pe
ars
on
Co
rre
latio
n.1
88
.79
8**
-.0
29
.00
7-.
25
1.6
92
*.2
89
-.1
30
-.2
21
.97
8**
-.4
16
-.1
18
.65
0*
.45
3.4
13
.54
4.1
40
-.0
29
.09
0.3
62
.52
6-.
18
1-.
05
0-.
20
6-.
35
0.0
18
.02
3-.
02
6-.
42
4-.
40
9.3
09
-.1
91
-.4
24
.94
9**
.42
8.1
63
.57
2*
-.3
35
.99
8**
1
Sig
. (2
-ta
ile
d)
.53
9.0
10
.93
7.9
83
.40
8.0
13
.33
8.7
39
.54
0.0
00
.15
7.7
01
.01
6.1
39
.16
0.0
55
.64
8.9
29
.77
0.2
25
.06
5.5
53
.87
1.5
43
.32
1.9
63
.95
7.9
52
.14
9.1
65
.30
5.5
32
.14
9.0
00
.14
5.5
96
.04
1.2
63
.00
0
N1
39
10
13
13
12
13
91
01
31
31
31
31
21
31
31
31
21
31
31
31
31
31
11
09
88
13
13
13
13
13
13
13
13
13
13
13
13
Year
= 1
2
19
11
12
13
14
15
16
17
18
19
20
21
22
23
24
25
26
27
28
29
30
31
32
33
34
35
36
40
41
42
43
44
45
46
47
48
49
50
51
Pe
ars
on
Co
rre
latio
n.2
83
1-.
07
9-.
44
3-.
57
4.2
36
.73
0*
-.4
56
-.6
18
.78
0*
-.5
04
-.3
52
.14
2-.
18
4.1
65
.79
0*
.46
0.7
59
*-.
53
2.6
77
*.5
97
.06
1.6
24
-.0
22
-.3
87
-.4
06
-.4
18
-.3
83
-.0
99
-.0
25
.79
7*
.15
5-.
09
9.7
35
*.8
76
**.1
73
.78
2*
-.5
47
.74
7*
.79
4*
Sig
. (2
-ta
ile
d)
.46
1.8
40
.23
2.1
06
.54
1.0
26
.21
7.0
76
.01
3.1
67
.35
3.7
16
.63
6.6
71
.01
1.2
13
.01
8.1
41
.04
5.0
89
.87
6.0
72
.95
8.3
44
.31
8.4
10
.45
4.8
00
.94
9.0
10
.69
0.8
00
.02
4.0
02
.65
6.0
13
.12
8.0
21
.01
1
N9
99
99
99
99
99
99
99
99
99
99
99
88
86
69
99
99
99
99
99
9
Pe
ars
on
Co
rre
latio
n-.
36
1-.
07
91
-.3
77
-.3
74
-.7
12
*.3
63
.87
7**
.28
5-.
48
0.8
19
**-.
22
2-.
53
0-.
48
3-.
61
0*
-.3
40
-.7
14
*-.
34
5-.
44
7-.
24
5.2
69
.56
2-.
32
4.6
39
*.5
64
.03
8.1
02
.08
9.3
45
.63
1*
.35
0.6
77
*.3
45
-.5
13
-.2
02
.36
3-.
09
9.7
89
**-.
53
4-.
52
7
Sig
. (2
-ta
ile
d)
.27
5.8
40
.25
3.2
57
.01
4.2
72
.00
0.3
95
.13
5.0
02
.51
2.0
94
.13
3.0
46
.30
7.0
14
.29
9.1
68
.46
8.4
23
.07
2.3
31
.04
7.0
89
.92
2.8
28
.85
0.2
98
.03
7.2
91
.02
2.2
98
.10
7.5
51
.27
2.7
71
.00
4.0
91
.09
6
N1
19
11
11
11
11
11
11
11
11
11
11
11
11
11
11
11
11
11
11
11
11
11
10
10
97
71
11
11
11
11
11
11
11
11
11
11
11
1
Pe
ars
on
Co
rre
latio
n.0
78
.23
6-.
71
2*
.41
7.6
18
*1
-.5
05
-.7
00
*-.
41
9.3
76
-.7
63
**.5
25
.62
5*
.85
7**
.94
0**
.21
5.8
28
**.1
88
.29
8.0
50
-.3
65
-.7
49
**.3
75
-.4
37
-.6
26
*-.
33
4-.
22
1-.
23
1-.
23
0-.
54
7-.
44
6-.
48
7-.
23
0.4
55
.18
0-.
38
9.0
22
-.6
99
*.5
04
.49
6
Sig
. (2
-ta
ile
d)
.80
9.5
41
.01
4.1
77
.03
2.0
94
.01
6.2
00
.22
8.0
04
.08
0.0
30
.00
0.0
00
.50
2.0
01
.55
9.3
48
.87
7.2
44
.00
5.2
29
.20
6.0
39
.37
9.6
34
.61
9.4
73
.06
6.1
46
.10
8.4
73
.13
7.5
76
.21
1.9
45
.01
1.0
95
.10
1
N1
29
11
12
12
12
12
11
11
12
12
12
12
12
12
12
12
12
12
12
12
12
12
10
11
97
71
21
21
21
21
21
21
21
21
21
21
21
2
Pe
ars
on
Co
rre
latio
n-.
01
5.1
42
-.5
30
.36
8.2
50
.62
5*
-.2
55
-.4
59
-.0
32
.47
9-.
42
3.1
50
1.4
68
.10
7-.
03
5.2
31
-.0
36
.10
3-.
00
4-.
16
8-.
48
1.1
56
-.1
43
-.1
14
-.0
10
.01
1.0
03
.04
5-.
34
7-.
25
5-.
36
2.0
45
.67
8*
-.0
76
-.4
04
-.0
58
-.3
38
.69
2**
.62
1*
Sig
. (2
-ta
ile
d)
.96
1.7
16
.09
4.2
16
.41
1.0
30
.40
0.1
55
.92
6.0
98
.15
0.6
25
.12
5.7
27
.90
9.4
47
.90
8.7
39
.99
0.5
83
.09
6.6
11
.67
6.7
25
.97
8.9
80
.99
5.8
83
.24
5.4
01
.22
4.8
83
.01
1.8
05
.17
1.8
51
.25
9.0
09
.02
4
N1
39
11
13
13
12
13
11
11
13
13
13
13
12
13
13
13
13
13
13
13
13
13
11
12
10
88
13
13
13
13
13
13
13
13
13
13
13
13
Pe
ars
on
Co
rre
latio
n-.
17
5.7
90
*-.
34
0-.
40
0-.
51
3.2
15
.57
2*
-.2
47
-.6
18
*.7
60
**-.
23
9-.
20
8-.
03
5-.
12
7-.
25
21
-.1
17
.99
7**
-.3
45
.78
8**
.58
7*
.30
2.6
88
**.1
12
.12
7.2
44
.31
2.3
47
-.6
23
*-.
01
5.6
12
*.1
19
-.6
23
*.6
34
*.8
93
**.3
61
.88
6**
-.2
53
.65
8*
.72
1**
Sig
. (2
-ta
ile
d)
.56
8.0
11
.30
7.1
76
.07
3.5
02
.04
1.4
64
.04
3.0
03
.43
2.4
95
.90
9.6
93
.40
6.7
03
.00
0.2
48
.00
1.0
35
.31
7.0
09
.74
3.6
93
.49
7.4
52
.39
9.0
23
.96
2.0
26
.69
8.0
23
.02
0.0
00
.22
6.0
00
.40
5.0
14
.00
5
N1
39
11
13
13
12
13
11
11
13
13
13
13
12
13
13
13
13
13
13
13
13
13
11
12
10
88
13
13
13
13
13
13
13
13
13
13
13
13
Pe
ars
on
Co
rre
latio
n-.
60
0*
.67
7*
-.2
45
-.4
61
-.7
01
**.0
50
.60
6*
-.1
81
-.6
15
*.5
73
*.0
40
-.1
93
-.0
04
-.2
93
-.7
07
**.7
88
**-.
57
0*
.79
5**
-.6
00
*1
.87
4**
.60
5*
.38
3.5
41
.59
5*
.67
2*
.74
5*
.77
6*
-.5
25
.00
4.6
26
*.2
43
-.5
25
.51
9.5
67
*.3
59
.59
0*
.04
7.4
89
.52
0
Sig
. (2
-ta
ile
d)
.03
0.0
45
.46
8.1
13
.00
8.8
77
.02
8.5
95
.04
4.0
41
.89
6.5
27
.99
0.3
55
.00
7.0
01
.04
2.0
01
.03
0.0
00
.02
8.1
96
.08
5.0
41
.03
3.0
34
.02
4.0
65
.98
9.0
22
.42
4.0
65
.06
9.0
43
.22
9.0
34
.88
0.0
90
.06
8
N1
39
11
13
13
12
13
11
11
13
13
13
13
12
13
13
13
13
13
13
13
13
13
11
12
10
88
13
13
13
13
13
13
13
13
13
13
13
13
Pe
ars
on
Co
rre
latio
n-.
18
5.6
24
-.3
24
-.1
39
-.1
34
.37
5.3
66
-.2
23
-.2
10
.77
3**
-.1
85
.35
1.1
56
.30
7-.
04
4.6
88
**-.
02
9.6
89
**-.
16
3.3
83
.30
6-.
06
91
-.0
50
-.0
51
.10
9.1
59
.17
5-.
23
9-.
14
5.3
84
-.0
79
-.2
39
.64
6*
.79
4**
-.1
56
.79
9**
-.1
57
.65
3*
.71
5**
Sig
. (2
-ta
ile
d)
.54
5.0
72
.33
1.6
51
.66
3.2
29
.21
9.5
10
.53
5.0
02
.54
6.2
39
.61
1.3
32
.88
6.0
09
.92
6.0
09
.59
6.1
96
.31
0.8
23
.88
4.8
76
.76
4.7
06
.67
8.4
32
.63
6.1
95
.79
8.4
32
.01
7.0
01
.61
1.0
01
.60
9.0
16
.00
6
N1
39
11
13
13
12
13
11
11
13
13
13
13
12
13
13
13
13
13
13
13
13
13
11
12
10
88
13
13
13
13
13
13
13
13
13
13
13
13
Pe
ars
on
Co
rre
latio
n-.
20
5.7
35
*-.
51
3-.
10
9-.
27
8.4
55
.31
2-.
44
0-.
26
8.9
62
**-.
31
9-.
09
2.6
78
*.1
60
-.1
51
.63
4*
-.0
08
.63
1*
-.2
70
.51
9.3
29
-.0
89
.64
6*
.03
9.0
24
.18
4.2
32
.25
2-.
26
2-.
16
0.3
40
-.1
79
-.2
62
1.6
33
*-.
07
1.6
59
*-.
24
7.9
76
**.9
74
**
Sig
. (2
-ta
ile
d)
.50
1.0
24
.10
7.7
23
.35
8.1
37
.29
9.1
76
.42
6.0
00
.28
8.7
66
.01
1.6
20
.62
2.0
20
.98
0.0
21
.37
3.0
69
.27
2.7
73
.01
7.9
10
.94
0.6
11
.58
0.5
47
.38
8.6
02
.25
6.5
58
.38
8.0
20
.81
8.0
14
.41
6.0
00
.00
0
N1
39
11
13
13
12
13
11
11
13
13
13
13
12
13
13
13
13
13
13
13
13
13
11
12
10
88
13
13
13
13
13
13
13
13
13
13
13
13
Pe
ars
on
Co
rre
latio
n-.
12
4.7
47
*-.
53
4-.
00
2-.
21
4.5
04
.27
4-.
41
8-.
37
6.9
31
**-.
38
4-.
10
6.6
92
**.1
77
-.0
70
.65
8*
.08
9.6
57
*-.
16
0.4
89
.26
9-.
14
2.6
53
*-.
04
7-.
02
3.1
19
.15
4.1
75
-.3
20
-.2
33
.29
8-.
17
0-.
32
0.9
76
**.6
26
*-.
02
7.6
54
*-.
33
11
.99
4**
Sig
. (2
-ta
ile
d)
.68
6.0
21
.09
1.9
96
.48
3.0
95
.36
5.2
00
.25
4.0
00
.19
5.7
30
.00
9.5
83
.81
9.0
14
.77
3.0
15
.60
2.0
90
.37
4.6
43
.01
6.8
90
.94
5.7
44
.71
5.6
78
.28
6.4
43
.32
4.5
79
.28
6.0
00
.02
2.9
30
.01
5.2
69
.00
0
N1
39
11
13
13
12
13
11
11
13
13
13
13
12
13
13
13
13
13
13
13
13
13
11
12
10
88
13
13
13
13
13
13
13
13
13
13
13
13
Pe
ars
on
Co
rre
latio
n-.
13
2.7
94
*-.
52
7-.
04
7-.
23
8.4
96
.31
2-.
41
5-.
40
1.9
57
**-.
37
8-.
09
1.6
21
*.1
71
-.0
80
.72
1**
.07
3.7
18
**-.
18
0.5
20
.30
3-.
11
6.7
15
**-.
04
4-.
03
2.1
22
.16
5.1
89
-.3
49
-.2
14
.34
0-.
15
8-.
34
9.9
74
**.7
02
**-.
00
9.7
22
**-.
32
7.9
94
**1
Sig
. (2
-ta
ile
d)
.66
7.0
11
.09
6.8
79
.43
4.1
01
.30
0.2
04
.22
2.0
00
.20
3.7
67
.02
4.5
95
.79
6.0
05
.81
3.0
06
.55
6.0
68
.31
4.7
06
.00
6.8
98
.92
2.7
37
.69
6.6
54
.24
3.4
83
.25
5.6
07
.24
3.0
00
.00
7.9
78
.00
5.2
75
.00
0
N1
39
11
13
13
12
13
11
11
13
13
13
13
12
13
13
13
13
13
13
13
13
13
11
12
10
88
13
13
13
13
13
13
13
13
13
13
13
13
Year
= 1
3
19
11
12
13
14
15
16
17
18
19
20
21
22
23
24
25
26
27
28
29
30
31
32
33
34
35
36
40
41
42
43
44
45
46
47
48
49
50
51
Pe
ars
on
Co
rre
latio
n.3
65
1-.
35
2-.
48
8-.
57
7.1
11
.72
4*
-.4
33
-.1
42
.61
8-.
24
0-.
45
5.0
32
-.2
07
.10
4.7
65
*.5
92
.72
7*
-.5
51
.53
6.2
97
.15
4-.
19
6-.
11
9-.
06
1-.
36
1-.
32
7-.
39
1.0
04
-.1
54
.79
0*
.26
1.0
04
.71
3*
.88
9**
-.1
51
.76
4*
-.1
46
.76
0*
.75
4*
Sig
. (2
-ta
ile
d)
.33
4.3
92
.18
3.1
04
.77
6.0
27
.39
1.7
38
.07
6.5
33
.25
7.9
34
.59
2.7
89
.01
6.1
22
.02
7.1
25
.13
7.4
37
.69
3.6
14
.76
1.8
86
.38
0.5
27
.44
4.9
91
.69
1.0
11
.49
7.9
91
.03
1.0
01
.69
8.0
17
.70
7.0
17
.01
9
N9
98
99
99
68
99
89
99
98
99
99
99
98
86
69
99
99
99
99
99
9
Pe
ars
on
Co
rre
latio
n.1
14
.03
2-.
23
0.0
00
.28
0.4
45
-.2
54
-.2
72
-.2
75
.00
7-.
68
6**
-.0
56
1.0
71
.04
4-.
04
0.4
04
-.0
39
-.0
50
-.2
18
-.4
01
-.4
46
.01
6-.
21
0-.
32
1-.
35
1-.
10
3-.
12
5.0
64
.01
8-.
25
4-.
43
0.0
64
.55
1-.
18
5-.
23
8-.
05
8-.
62
8*
.55
9*
.51
0
Sig
. (2
-ta
ile
d)
.71
1.9
34
.49
6.9
99
.35
3.1
48
.40
2.4
79
.41
3.9
82
.01
0.8
70
.81
8.8
86
.89
7.2
18
.90
0.8
72
.47
5.1
74
.12
7.9
59
.49
1.3
35
.32
0.8
08
.76
8.8
37
.95
3.4
02
.14
3.8
37
.05
1.5
45
.43
3.8
50
.02
2.0
47
.07
5
N1
39
11
13
13
12
13
91
11
31
31
11
31
31
31
31
11
31
31
31
31
31
31
31
11
08
81
31
31
31
31
31
31
31
31
31
31
31
3
Pe
ars
on
Co
rre
latio
n-.
23
2.7
13
*-.
37
4-.
41
8-.
28
2.3
86
.38
1-.
47
3-.
08
1.7
94
**-.
30
7-.
25
2.5
51
-.2
65
.33
7.7
24
**.6
08
*.7
19
**-.
39
1.3
86
.24
3-.
09
9-.
34
1.1
59
-.0
22
.05
1.2
83
.26
4-.
17
6-.
33
6.4
03
-.1
77
-.1
76
1.6
26
*-.
28
0.7
62
**-.
23
1.9
45
**.9
56
**
Sig
. (2
-ta
ile
d)
.44
6.0
31
.25
7.1
55
.35
0.2
15
.19
9.1
99
.81
2.0
01
.30
7.4
56
.05
1.3
81
.26
0.0
05
.04
7.0
06
.18
7.1
93
.42
4.7
48
.25
5.6
04
.94
9.8
89
.49
7.5
27
.56
6.2
62
.17
2.5
64
.56
6.0
22
.35
5.0
02
.44
8.0
00
.00
0
N1
39
11
13
13
12
13
91
11
31
31
11
31
31
31
31
11
31
31
31
31
31
31
31
11
08
81
31
31
31
31
31
31
31
31
31
31
31
3
Pe
ars
on
Co
rre
latio
n-.
17
6.7
64
*-.
06
2-.
31
4-.
46
9.1
06
.62
8*
-.3
05
-.1
51
.90
4**
.01
1-.
24
7-.
05
8-.
17
8.1
66
.91
5**
.60
5*
.91
7**
-.2
54
.47
8.6
12
*.2
38
-.2
12
.19
6.0
42
.15
5.1
70
.16
1-.
28
2-.
21
2.6
26
*.1
61
-.2
82
.76
2**
.87
0**
-.0
78
1.0
24
.77
2**
.81
5**
Sig
. (2
-ta
ile
d)
.56
5.0
17
.85
5.2
96
.10
6.7
44
.02
1.4
25
.65
9.0
00
.97
3.4
64
.85
0.5
60
.58
7.0
00
.04
8.0
00
.40
3.0
98
.02
6.4
34
.48
7.5
21
.90
3.6
69
.68
7.7
03
.35
0.4
86
.02
2.5
99
.35
0.0
02
.00
0.8
00
.93
8.0
02
.00
1
N1
39
11
13
13
12
13
91
11
31
31
11
31
31
31
31
11
31
31
31
31
31
31
31
11
08
81
31
31
31
31
31
31
31
31
31
31
31
3
Pe
ars
on
Co
rre
latio
n-.
03
8.7
60
*-.
27
9-.
25
4-.
22
8.3
94
.38
0-.
38
9-.
30
8.7
00
**-.
46
9-.
25
7.5
59
*-.
08
6.1
42
.76
1**
.69
9*
.75
8**
-.2
49
.23
8.2
16
-.1
67
-.1
49
-.0
25
-.2
02
-.1
08
.08
2.0
62
-.2
61
-.1
50
.39
0-.
20
5-.
26
1.9
45
**.6
39
*-.
32
2.7
72
**-.
43
31
.99
4**
Sig
. (2
-ta
ile
d)
.90
2.0
17
.40
6.4
02
.45
3.2
05
.20
0.3
01
.35
7.0
08
.10
6.4
46
.04
7.7
80
.64
3.0
03
.01
7.0
03
.41
1.4
33
.47
9.5
86
.62
7.9
36
.55
2.7
66
.84
7.8
84
.38
9.6
25
.18
7.5
02
.38
9.0
00
.01
9.2
83
.00
2.1
39
.00
0
N1
39
11
13
13
12
13
91
11
31
31
11
31
31
31
31
11
31
31
31
31
31
31
31
11
08
81
31
31
31
31
31
31
31
31
31
31
31
3
Pe
ars
on
Co
rre
latio
n-.
04
7.7
54
*-.
26
1-.
25
1-.
23
1.3
89
.38
1-.
39
9-.
28
9.7
62
**-.
42
9-.
24
6.5
10
-.0
86
.14
5.7
96
**.6
94
*.7
95
**-.
22
9.2
75
.29
0-.
13
4-.
16
0-.
01
3-.
20
5-.
09
6.0
88
.07
1-.
28
1-.
16
0.3
89
-.1
88
-.2
81
.95
6**
.66
6*
-.2
86
.81
5**
-.3
92
.99
4**
1
Sig
. (2
-ta
ile
d)
.87
9.0
19
.43
9.4
08
.44
7.2
11
.20
0.2
88
.38
9.0
02
.14
4.4
66
.07
5.7
80
.63
5.0
01
.01
8.0
01
.45
1.3
62
.33
6.6
63
.60
2.9
65
.54
6.7
91
.83
7.8
68
.35
3.6
02
.18
9.5
37
.35
3.0
00
.01
3.3
43
.00
1.1
86
.00
0
N1
39
11
13
13
12
13
91
11
31
31
11
31
31
31
31
11
31
31
31
31
31
31
31
11
08
81
31
31
31
31
31
31
31
31
31
31
31
3
**. C
orr
ela
tio
n is
sig
nific
an
t a
t th
e 0
.01
le
vel (2
-ta
ile
d).
a. Y
ea
r =
13
21
45
48
50
51
*. C
orr
ela
tio
n is
sig
nific
an
t a
t th
e 0
.05
le
vel (2
-ta
ile
d).
951
*. C
orr
ela
tio
n is
sig
nific
an
t a
t th
e 0
.05
le
vel (2
-ta
ile
d).
**. C
orr
ela
tio
n is
sig
nific
an
t a
t th
e 0
.01
le
vel (2
-ta
ile
d).
a. Y
ea
r =
12
Co
rre
lati
on
sa
50
45
31
21
24
28
48
50
51
**. C
orr
ela
tio
n is
sig
nific
an
t a
t th
e 0
.01
le
vel (2
-ta
ile
d).
14
*. C
orr
ela
tio
n is
sig
nific
an
t a
t th
e 0
.05
le
vel (2
-ta
ile
d).
a. Y
ea
r =
11
Co
rre
lati
on
sa
9 11
21
18
Co
rre
lati
on
sa
9 14

86
Year
= 1
4
19
11
12
13
14
15
16
17
18
19
20
21
22
23
24
25
26
27
28
29
30
31
32
33
34
35
36
40
41
42
43
44
45
46
47
48
49
50
51
Pe
ars
on
Co
rre
latio
n.3
03
1.3
36
-.1
86
-.5
59
.04
1.7
16
*.0
61
-.4
98
.68
5*
-.2
74
-.1
97
.12
4-.
06
0.2
21
.82
4**
.08
5.7
89
*-.
24
7.6
24
.51
4.2
91
.83
7**
-.0
55
.00
6-.
48
6-.
47
6-.
41
9.1
99
.22
4.7
60
*.2
83
.19
9.7
46
*.8
93
**.6
12
.79
3*
-.2
47
.76
9*
.74
4*
Sig
. (2
-ta
ile
d)
.42
9.4
16
.63
1.1
17
.91
6.0
30
.88
5.2
09
.04
2.4
76
.61
1.7
51
.87
7.5
68
.00
6.8
29
.01
1.5
21
.07
3.1
57
.44
8.0
05
.88
9.9
88
.22
2.2
81
.40
8.6
08
.56
3.0
18
.46
1.6
08
.02
1.0
01
.08
0.0
11
.52
1.0
15
.02
1
N9
98
99
99
88
99
99
99
99
99
99
99
99
87
69
99
99
99
99
99
9
Pe
ars
on
Co
rre
latio
n.0
43
.12
4.2
06
-.3
63
.12
6.6
44
*-.
09
5-.
15
5-.
25
0.3
94
-.1
76
-.1
63
1.2
12
.31
0.1
07
.91
4**
.11
1-.
38
9.0
54
.10
8-.
36
5-.
09
4-.
14
4-.
02
8-.
20
8.0
05
.02
9.1
12
-.1
65
-.0
99
-.0
90
.11
2.5
59
*-.
03
5-.
13
6.0
66
-.1
10
.63
4*
.64
8*
Sig
. (2
-ta
ile
d)
.88
9.7
51
.56
9.2
22
.68
1.0
24
.75
8.6
91
.48
6.1
83
.56
5.6
13
.50
9.3
03
.72
7.0
00
.71
9.1
89
.86
1.7
27
.22
1.7
59
.64
0.9
27
.54
0.9
90
.94
6.7
16
.59
0.7
47
.76
9.7
16
.04
7.9
09
.65
7.8
31
.72
1.0
20
.01
7
N1
39
10
13
13
12
13
91
01
31
31
21
31
21
31
31
11
31
31
31
31
31
31
31
31
19
81
31
31
31
31
31
31
31
31
31
31
31
3
Pe
ars
on
Co
rre
latio
n.3
11
.78
9*
.24
4-.
30
4-.
54
7.1
67
.66
8*
.15
5-.
04
8.8
36
**.0
63
-.1
29
.11
1.1
65
.16
0.9
97
**-.
04
11
-.3
01
.45
3.2
16
-.0
57
.63
4*
.03
5.0
19
-.2
87
-.1
51
-.0
10
-.2
05
.07
4.6
44
*.4
86
-.2
05
.78
6**
.84
6**
-.1
78
.93
1**
.09
7.8
00
**.7
88
**
Sig
. (2
-ta
ile
d)
.30
2.0
11
.49
7.3
13
.05
3.6
05
.01
3.6
90
.89
5.0
00
.83
9.6
89
.71
9.6
08
.60
2.0
00
.90
6.3
18
.12
0.4
78
.85
4.0
20
.90
9.9
50
.39
2.6
98
.98
1.5
02
.80
9.0
18
.09
2.5
02
.00
1.0
00
.56
0.0
00
.75
3.0
01
.00
1
N1
39
10
13
13
12
13
91
01
31
31
21
31
21
31
31
11
31
31
31
31
31
31
31
31
19
81
31
31
31
31
31
31
31
31
31
31
31
3
Pe
ars
on
Co
rre
latio
n-.
01
4.7
46
*.2
99
-.4
43
-.4
67
.32
3.5
52
.05
6-.
11
7.9
71
**.0
70
-.0
92
.55
9*
.15
0.3
44
.79
0**
.30
3.7
86
**-.
40
8.4
45
.40
8-.
11
9.3
32
-.2
44
.29
7-.
20
3.1
06
.16
4.0
25
-.2
49
.54
8.2
91
.02
51
.72
3**
-.0
51
.82
5**
.14
9.9
54
**.9
62
**
Sig
. (2
-ta
ile
d)
.96
5.0
21
.40
2.1
30
.10
8.3
06
.05
1.8
86
.74
7.0
00
.82
0.7
76
.04
7.6
42
.24
9.0
01
.36
5.0
01
.16
6.1
27
.16
6.6
99
.26
7.4
22
.32
4.5
49
.78
6.6
97
.93
7.4
12
.05
3.3
36
.93
7.0
05
.86
9.0
01
.62
8.0
00
.00
0
N1
39
10
13
13
12
13
91
01
31
31
21
31
21
31
31
11
31
31
31
31
31
31
31
31
19
81
31
31
31
31
31
31
31
31
31
31
31
3
Pe
ars
on
Co
rre
latio
n.1
19
.76
9*
.22
4-.
36
7-.
34
1.4
20
.46
2.0
34
-.2
71
.89
7**
-.0
83
-.1
72
.63
4*
.16
6.2
58
.80
0**
.45
4.8
00
**-.
36
0.3
18
.25
6-.
16
3.4
17
-.1
08
.12
7-.
27
2-.
02
7.0
36
-.0
20
-.1
16
.44
8.2
05
-.0
20
.95
4**
.69
3**
-.0
73
.80
6**
-.0
29
1.9
98
**
Sig
. (2
-ta
ile
d)
.69
8.0
15
.53
4.2
17
.25
5.1
74
.11
2.9
31
.44
9.0
00
.78
8.5
92
.02
0.6
06
.39
4.0
01
.16
0.0
01
.22
7.2
89
.39
8.5
95
.15
6.7
25
.68
0.4
18
.94
4.9
33
.94
8.7
07
.12
4.5
01
.94
8.0
00
.00
9.8
12
.00
1.9
25
.00
0
N1
39
10
13
13
12
13
91
01
31
31
21
31
21
31
31
11
31
31
31
31
31
31
31
31
19
81
31
31
31
31
31
31
31
31
31
31
31
3
Pe
ars
on
Co
rre
latio
n.1
03
.74
4*
.22
5-.
36
9-.
34
5.4
06
.46
4.0
49
-.2
61
.90
7**
-.0
70
-.1
58
.64
8*
.16
1.2
50
.78
6**
.45
1.7
88
**-.
35
9.3
19
.26
8-.
15
3.4
05
-.1
19
.13
8-.
25
1-.
01
7.0
38
.00
4-.
12
6.4
46
.20
6.0
04
.96
2**
.67
5*
-.0
68
.79
7**
-.0
15
.99
8**
1
Sig
. (2
-ta
ile
d)
.73
7.0
21
.53
1.2
15
.24
8.1
90
.11
0.9
00
.46
7.0
00
.82
0.6
23
.01
7.6
18
.40
9.0
01
.16
3.0
01
.22
9.2
88
.37
5.6
17
.17
0.6
99
.65
3.4
57
.96
5.9
28
.99
0.6
81
.12
7.5
00
.99
0.0
00
.01
1.8
24
.00
1.9
61
.00
0
N1
39
10
13
13
12
13
91
01
31
31
21
31
21
31
31
11
31
31
31
31
31
31
31
31
19
81
31
31
31
31
31
31
31
31
31
31
31
3
Year
= 1
5
19
11
12
13
14
15
16
17
18
19
20
21
22
23
24
25
26
27
28
29
30
31
32
33
34
35
36
40
41
42
43
44
45
46
47
48
49
50
51
Pe
ars
on
Co
rre
latio
n.2
36
1-.
10
2-.
28
4-.
53
8.7
13
*.6
91
*.1
68
-.1
78
.72
4*
-.2
39
-.0
42
.25
5.2
99
.72
5*
.88
4**
-.0
66
.87
1**
-.3
19
.55
9.6
17
.14
1-.
71
8*
-.7
21
*-.
70
3*
-.6
60
-.9
07
**-.
78
5.1
15
-.6
12
.42
8.3
39
.11
5.7
38
*.9
05
**.4
58
.82
4**
-.1
21
.84
5**
.86
3**
Sig
. (2
-ta
ile
d)
.51
2.8
10
.42
6.1
09
.02
1.0
27
.69
1.6
73
.01
8.5
06
.90
8.4
77
.40
2.0
18
.00
1.8
56
.00
1.3
69
.09
3.0
57
.69
8.0
19
.01
9.0
23
.07
5.0
02
.06
4.7
52
.06
0.2
17
.33
8.7
52
.01
5.0
00
.18
4.0
03
.74
0.0
02
.00
1
N1
01
08
10
10
10
10
88
10
10
10
10
10
10
10
10
10
10
10
10
10
10
10
10
88
61
01
01
01
01
01
01
01
01
01
01
01
0
Pe
ars
on
Co
rre
latio
n.2
97
.71
3*
-.4
00
-.5
05
-.1
70
1.3
18
-.1
82
-.2
92
.61
4*
-.2
97
-.2
71
.58
7*
.34
5.5
69
*.6
59
*.1
92
.68
7**
-.5
37
.42
9.3
60
-.5
36
-.2
80
.03
1-.
16
7-.
59
7-.
40
5-.
25
2-.
04
7-.
31
7.0
40
.31
9-.
04
7.6
49
*.5
95
*.3
38
.58
5*
-.3
73
.78
9**
.78
5**
Sig
. (2
-ta
ile
d)
.32
5.0
21
.25
2.0
78
.57
9.2
89
.61
5.4
13
.02
6.3
24
.39
4.0
35
.24
8.0
43
.01
4.5
29
.01
0.0
58
.14
4.2
28
.05
9.3
77
.92
4.6
03
.06
9.2
79
.58
5.8
79
.31
5.8
96
.28
8.8
79
.01
6.0
32
.25
8.0
36
.21
0.0
01
.00
1
N1
31
01
01
31
31
31
31
01
01
31
31
21
31
31
31
31
31
31
31
31
31
31
21
21
21
09
71
31
21
31
31
31
31
31
31
31
31
31
3
Pe
ars
on
Co
rre
latio
n.1
81
.25
5-.
40
4-.
31
4.1
44
.58
7*
-.0
96
-.2
55
-.1
40
.48
6-.
17
4-.
17
41
.21
5.3
40
.06
1-.
10
6.0
77
-.3
01
.17
0.1
07
-.3
12
.28
6-.
04
8-.
14
3-.
08
2.0
98
.16
1.1
67
.25
1-.
13
5-.
00
6.1
67
.57
6*
.02
9.1
77
.11
9-.
08
6.6
16
*.5
89
*
Sig
. (2
-ta
ile
d)
.53
6.4
77
.24
7.2
75
.62
3.0
35
.74
4.4
77
.69
9.0
78
.57
1.5
89
.48
0.2
35
.84
4.7
30
.80
2.2
96
.56
1.7
15
.27
8.3
43
.87
6.6
41
.81
1.7
87
.70
3.5
69
.40
9.6
45
.98
4.5
69
.03
1.9
25
.54
5.6
84
.77
9.0
25
.03
4
N1
41
01
01
41
41
31
41
01
01
41
31
21
41
31
41
31
31
31
41
41
41
41
31
31
31
11
08
14
13
14
14
14
14
13
14
14
13
13
13
Pe
ars
on
Co
rre
latio
n.0
87
.72
5*
-.2
47
-.5
68
*-.
70
0**
.56
9*
.62
8*
.07
6-.
11
8.6
30
*.5
07
-.1
18
.34
0.7
73
**1
.60
0*
-.4
85
.60
7*
-.5
85
*.9
30
**.8
42
**-.
21
8.3
09
-.4
35
-.5
93
*.2
86
.47
8.4
86
.34
5.2
70
.38
6.7
38
**.3
45
.63
8*
.63
1*
.41
4.5
74
*.2
60
.66
3*
.65
1*
Sig
. (2
-ta
ile
d)
.76
7.0
18
.49
2.0
34
.00
5.0
43
.01
6.8
34
.74
5.0
16
.07
7.7
15
.23
5.0
02
.03
0.0
93
.02
8.0
28
.00
0.0
00
.45
3.3
05
.13
8.0
33
.39
4.1
62
.22
2.2
27
.37
1.1
73
.00
3.2
27
.01
4.0
21
.14
1.0
32
.39
1.0
13
.01
6
N1
41
01
01
41
41
31
41
01
01
41
31
21
41
31
41
31
31
31
41
41
41
41
31
31
31
11
08
14
13
14
14
14
14
13
14
14
13
13
13
Pe
ars
on
Co
rre
latio
n-.
47
4-.
66
0-.
13
7-.
31
9-.
25
0-.
59
7.0
54
-.4
59
.20
8-.
32
9.0
66
.12
0-.
08
2-.
46
6.2
86
-.6
24
.03
7-.
66
1*
-.3
15
.16
1.2
37
.10
8.5
58
-.5
71
-.6
31
*1
.86
2**
.85
4**
.46
5.5
50
.18
3-.
00
6.4
65
-.2
89
-.6
34
*-.
46
0-.
33
3.1
37
-.7
00
*-.
67
5*
Sig
. (2
-ta
ile
d)
.14
1.0
75
.72
4.3
40
.45
8.0
69
.87
4.2
14
.59
2.3
23
.85
5.7
58
.81
1.1
74
.39
4.0
54
.91
9.0
37
.34
6.6
36
.48
4.7
51
.07
4.0
66
.03
7.0
01
.00
7.1
49
.07
9.5
91
.98
5.1
49
.38
9.0
49
.15
4.3
17
.70
5.0
24
.03
2
N1
18
91
11
11
01
19
91
11
09
11
10
11
10
10
10
11
11
11
11
11
11
11
11
10
81
11
11
11
11
11
11
01
11
11
01
01
0
Pe
ars
on
Co
rre
latio
n.1
64
.73
8*
-.3
41
-.3
46
-.4
57
.64
9*
.53
7*
-.0
87
-.1
47
.99
3**
.10
1-.
15
0.5
76
*.4
33
.63
8*
.75
0**
-.2
48
.76
5**
-.3
10
.62
5*
.58
0*
-.0
10
-.0
09
-.1
92
-.2
62
-.2
89
-.0
21
.06
1.1
76
-.0
02
.28
1.5
28
.17
61
.70
7**
.56
7*
.83
8**
.07
6.9
58
**.9
53
**
Sig
. (2
-ta
ile
d)
.57
5.0
15
.33
5.2
26
.10
0.0
16
.04
7.8
11
.68
5.0
00
.74
3.6
43
.03
1.1
39
.01
4.0
03
.41
4.0
02
.28
0.0
17
.03
0.9
74
.97
7.5
30
.38
7.3
89
.95
5.8
85
.54
7.9
94
.33
1.0
53
.54
7.0
07
.03
5.0
00
.80
6.0
00
.00
0
N1
41
01
01
41
41
31
41
01
01
41
31
21
41
31
41
31
31
31
41
41
41
41
31
31
31
11
08
14
13
14
14
14
14
13
14
14
13
13
13
Pe
ars
on
Co
rre
latio
n.1
11
.45
8.0
09
-.0
44
-.2
90
.33
8.3
50
.19
0-.
13
8.5
79
*.4
28
-.4
21
.17
7.6
29
*.4
14
.52
7-.
45
9.5
28
.03
5.4
68
.26
7-.
17
6-.
23
7.2
69
.22
8-.
46
0-.
47
7-.
48
2-.
33
7-.
25
1.1
97
.39
4-.
33
7.5
67
*.5
90
*1
.55
1*
.26
2.6
02
*.5
78
*
Sig
. (2
-ta
ile
d)
.70
5.1
84
.98
0.8
82
.31
4.2
58
.22
0.5
99
.70
5.0
30
.14
4.1
73
.54
5.0
21
.14
1.0
64
.11
5.0
63
.90
6.0
91
.35
5.5
47
.43
5.3
74
.45
3.1
54
.16
3.2
26
.23
8.4
09
.50
1.1
64
.23
8.0
35
.03
4.0
41
.38
8.0
30
.03
9
N1
41
01
01
41
41
31
41
01
01
41
31
21
41
31
41
31
31
31
41
41
41
41
31
31
31
11
08
14
13
14
14
14
14
13
14
14
13
13
13
Pe
ars
on
Co
rre
latio
n.2
88
.84
5**
-.3
61
-.2
94
-.3
76
.78
9**
.52
4-.
11
1-.
17
3.9
40
**-.
02
4-.
17
9.6
16
*.4
22
.66
3*
.80
4**
-.2
01
.81
5**
-.2
68
.54
3.6
04
*-.
14
2-.
28
5-.
09
7-.
29
2-.
70
0*
-.4
60
-.3
85
.04
3-.
26
2.2
51
.43
9.0
43
.95
8**
.77
5**
.60
2*
.84
0**
-.0
14
1.9
97
**
Sig
. (2
-ta
ile
d)
.34
0.0
02
.30
6.3
30
.20
6.0
01
.06
6.7
60
.63
2.0
00
.93
9.5
77
.02
5.1
51
.01
3.0
01
.51
0.0
01
.37
6.0
55
.02
9.6
43
.36
9.7
65
.35
7.0
24
.21
2.3
93
.89
0.4
10
.40
8.1
34
.89
0.0
00
.00
2.0
30
.00
0.9
64
.00
0
N1
31
01
01
31
31
31
31
01
01
31
31
21
31
31
31
31
31
31
31
31
31
31
21
21
21
09
71
31
21
31
31
31
31
31
31
31
31
31
3
Pe
ars
on
Co
rre
latio
n.3
04
.86
3**
-.3
76
-.2
70
-.3
95
.78
5**
.54
4-.
14
3-.
16
8.9
36
**-.
03
6-.
16
9.5
89
*.3
94
.65
1*
.82
3**
-.1
88
.83
4**
-.2
50
.53
0.5
88
*-.
12
3-.
31
1-.
12
3-.
31
2-.
67
5*
-.4
17
-.3
40
.03
5-.
28
6.2
65
.43
5.0
35
.95
3**
.78
5**
.57
8*
.85
5**
-.0
28
.99
7**
1
Sig
. (2
-ta
ile
d)
.31
2.0
01
.28
5.3
71
.18
2.0
01
.05
5.6
93
.64
4.0
00
.90
8.5
99
.03
4.1
83
.01
6.0
01
.53
8.0
00
.41
1.0
62
.03
5.6
88
.32
6.7
04
.32
4.0
32
.26
4.4
55
.90
9.3
68
.38
1.1
37
.90
9.0
00
.00
1.0
39
.00
0.9
27
.00
0
N1
31
01
01
31
31
31
31
01
01
31
31
21
31
31
31
31
31
31
31
31
31
31
21
21
21
09
71
31
21
31
31
31
31
31
31
31
31
31
3
Year
= 1
6
19
11
12
13
14
15
16
17
18
19
20
21
22
23
24
25
26
27
28
29
30
31
32
33
34
35
36
40
41
42
43
44
45
46
47
48
49
50
51
Pe
ars
on
Co
rre
latio
n-.
04
7.3
83
-.4
92
-.2
37
.35
01
-.1
43
-.4
01
-.0
04
.46
2.4
57
-.1
24
.63
9*
.60
3*
.62
1*
.06
1.4
68
.09
9-.
26
5.4
45
.51
9-.
55
7*
.10
1-.
11
0-.
08
2-.
06
0-.
35
4.0
32
-.1
95
.16
1-.
17
8.3
60
-.1
95
.47
1.4
36
.18
3.3
38
.48
0.6
06
*.6
44
*
Sig
. (2
-ta
ile
d)
.87
2.2
74
.17
9.4
14
.22
0.6
26
.28
5.9
93
.09
6.1
01
.67
3.0
14
.02
2.0
18
.84
3.0
91
.74
8.3
60
.11
1.0
57
.03
9.7
31
.72
0.7
90
.84
7.3
15
.93
5.5
05
.58
2.5
43
.20
6.5
05
.08
9.1
19
.53
1.2
38
.08
3.0
22
.01
3
N1
41
09
14
14
14
14
99
14
14
14
14
14
14
13
14
13
14
14
14
14
14
13
13
13
10
91
41
41
41
41
41
41
41
41
41
41
41
4
Pe
ars
on
Co
rre
latio
n-.
03
8.6
18
-.1
15
-.2
27
-.1
58
.46
2.2
57
-.1
77
-.1
53
1.4
38
.58
9*
.59
0*
.50
7.4
76
.39
6.3
56
.44
2-.
22
8.6
64
**.7
82
**.1
35
-.0
39
-.2
25
-.2
17
-.1
46
-.4
59
-.0
91
-.2
31
.01
7.1
75
.65
6*
-.2
31
.99
1**
.73
2**
.02
7.8
79
**.4
16
.92
5**
.91
3**
Sig
. (2
-ta
ile
d)
.89
8.0
57
.75
1.4
16
.57
5.0
96
.35
5.6
49
.67
3.1
03
.02
7.0
21
.06
4.0
85
.18
0.2
11
.13
1.4
13
.01
0.0
01
.64
5.8
94
.46
1.4
76
.63
5.1
82
.81
5.4
26
.95
3.5
33
.01
1.4
26
.00
0.0
02
.92
5.0
00
.12
3.0
00
.00
0
N1
41
01
01
51
51
41
59
10
15
15
14
15
14
14
13
14
13
15
14
14
14
14
13
13
13
10
91
41
51
51
41
41
51
51
51
51
51
51
5
Pe
ars
on
Co
rre
latio
n.2
25
.14
5-.
13
3-.
09
8.4
58
.63
9*
-.3
85
-.4
02
-.2
08
.59
0*
.31
4.2
25
1.3
78
.40
1.0
09
.37
4.0
49
-.1
50
.33
8.2
84
-.3
15
.25
1.1
17
.07
3.1
53
-.1
79
.03
1.1
28
.28
6-.
36
0.1
80
.12
8.6
66
**.1
53
-.0
47
.19
9.2
79
.63
1*
.69
9**
Sig
. (2
-ta
ile
d)
.44
0.6
90
.71
4.7
28
.08
6.0
14
.15
6.2
83
.56
5.0
21
.25
5.4
38
.18
2.1
55
.97
8.1
88
.87
5.5
94
.23
8.3
25
.27
3.3
88
.70
4.8
12
.61
9.6
21
.93
7.6
62
.30
1.1
87
.53
8.6
62
.00
7.5
85
.86
8.4
77
.31
4.0
12
.00
4
N1
41
01
01
51
51
41
59
10
15
15
14
15
14
14
13
14
13
15
14
14
14
14
13
13
13
10
91
41
51
51
41
41
51
51
51
51
51
51
5
Pe
ars
on
Co
rre
latio
n-.
34
6.3
64
-.1
51
-.0
61
-.0
55
.44
5.0
70
.01
7.4
33
.66
4**
.87
7**
.47
8.3
38
.83
9**
.88
4**
.44
6.7
38
**.3
84
.01
81
.90
8**
-.2
14
-.2
31
-.3
93
-.3
68
-.1
66
-.4
20
.45
2-.
36
5-.
14
5.1
42
.91
2**
-.3
65
.67
6**
.57
1*
.74
4**
.62
4*
.89
6**
.55
4*
.54
5*
Sig
. (2
-ta
ile
d)
.22
6.3
01
.69
8.8
35
.85
2.1
11
.81
1.9
66
.24
4.0
10
.00
0.0
84
.23
8.0
00
.00
0.1
26
.00
3.1
95
.95
0.0
00
.46
3.4
28
.18
4.2
16
.58
8.2
27
.22
2.1
99
.62
0.6
29
.00
0.1
99
.00
8.0
33
.00
2.0
17
.00
0.0
40
.04
4
N1
41
09
14
14
14
14
99
14
14
14
14
14
14
13
14
13
14
14
14
14
14
13
13
13
10
91
41
41
41
41
41
41
41
41
41
41
41
4
Pe
ars
on
Co
rre
latio
n-.
21
5.5
90
-.0
73
-.0
40
-.2
17
.36
0.2
45
.15
4.2
18
.65
6*
.84
2**
.43
7.1
80
.69
8**
.70
4**
.53
4.6
54
*.4
86
-.0
20
.91
2**
.94
0**
-.1
23
-.3
00
-.3
74
-.3
28
-.1
96
-.4
29
.11
6-.
41
1-.
22
1.2
88
1-.
41
1.6
33
*.6
84
**.5
74
*.7
38
**.8
58
**.5
94
*.5
61
*
Sig
. (2
-ta
ile
d)
.46
0.0
72
.85
2.8
91
.45
6.2
06
.39
8.6
92
.57
4.0
11
.00
0.1
19
.53
8.0
06
.00
5.0
60
.01
1.0
92
.94
7.0
00
.00
0.6
75
.29
8.2
07
.27
4.5
21
.21
6.7
66
.14
4.4
47
.31
7.1
44
.01
5.0
07
.03
2.0
03
.00
0.0
25
.03
7
N1
41
09
14
14
14
14
99
14
14
14
14
14
14
13
14
13
14
14
14
14
14
13
13
13
10
91
41
41
41
41
41
41
41
41
41
41
41
4
Pe
ars
on
Co
rre
latio
n.1
91
.80
8**
-.1
82
-.2
10
-.1
94
.60
6*
.34
9-.
25
2-.
16
2.9
25
**.3
29
.27
3.6
31
*.4
52
.42
1.3
22
.38
5.3
67
-.2
47
.55
4*
.75
5**
.03
7.0
28
-.2
03
-.1
76
-.2
00
-.4
61
-.1
90
-.2
74
.07
7.2
64
.59
4*
-.2
74
.90
9**
.81
8**
-.0
82
.85
7**
.32
21
.99
5**
Sig
. (2
-ta
ile
d)
.51
4.0
05
.61
4.4
52
.48
9.0
22
.20
3.5
12
.65
4.0
00
.23
1.3
45
.01
2.1
05
.13
4.2
84
.17
4.2
17
.37
4.0
40
.00
2.8
99
.92
4.5
06
.56
4.5
12
.18
0.6
24
.34
3.7
84
.34
2.0
25
.34
3.0
00
.00
0.7
72
.00
0.2
41
.00
0
N1
41
01
01
51
51
41
59
10
15
15
14
15
14
14
13
14
13
15
14
14
14
14
13
13
13
10
91
41
51
51
41
41
51
51
51
51
51
51
5
Pe
ars
on
Co
rre
latio
n.2
10
.77
7**
-.1
89
-.2
10
-.1
22
.64
4*
.27
7-.
28
3-.
16
9.9
13
**.3
31
.26
1.6
99
**.4
56
.43
3.2
65
.39
8.3
06
-.2
50
.54
5*
.72
6**
-.0
13
.06
8-.
16
7-.
14
7-.
16
5-.
44
2-.
17
3-.
23
2.1
19
.20
4.5
61
*-.
23
2.9
07
**.7
77
**-.
08
0.8
07
**.3
25
.99
5**
1
Sig
. (2
-ta
ile
d)
.47
1.0
08
.60
0.4
53
.66
6.0
13
.31
8.4
60
.64
0.0
00
.22
8.3
68
.00
4.1
01
.12
2.3
81
.15
8.3
09
.36
9.0
44
.00
3.9
66
.81
7.5
85
.63
2.5
89
.20
1.6
57
.42
6.6
73
.46
5.0
37
.42
6.0
00
.00
1.7
77
.00
0.2
37
.00
0
N1
41
01
01
51
51
41
59
10
15
15
14
15
14
14
13
14
13
15
14
14
14
14
13
13
13
10
91
41
51
51
41
41
51
51
51
51
51
51
5
a. Y
ea
r =
16
43
50
51
*. C
orr
ela
tio
n is
sig
nific
an
t a
t th
e 0
.05
le
vel (2
-ta
ile
d).
**. C
orr
ela
tio
n is
sig
nific
an
t a
t th
e 0
.01
le
vel (2
-ta
ile
d).
51
*. C
orr
ela
tio
n is
sig
nific
an
t a
t th
e 0
.05
le
vel (2
-ta
ile
d).
**. C
orr
ela
tio
n is
sig
nific
an
t a
t th
e 0
.01
le
vel (2
-ta
ile
d).
a. Y
ea
r =
15
28
18
21
14
21
Co
rre
lati
on
sa
23
14
9
Co
rre
lati
on
sa
50
34
45
47
**. C
orr
ela
tio
n is
sig
nific
an
t a
t th
e 0
.01
le
vel (2
-ta
ile
d).
a. Y
ea
r =
14
45
50
51
*. C
orr
ela
tio
n is
sig
nific
an
t a
t th
e 0
.05
le
vel (2
-ta
ile
d).
21
26
Co
rre
lati
on
sa
9

87
Year
= 1
7
19
11
12
13
14
15
16
17
18
19
20
21
22
23
24
25
26
27
28
29
30
31
32
33
34
35
36
40
41
42
43
44
45
46
47
48
49
50
51
Pe
ars
on
Co
rre
latio
n-.
00
3.2
87
.45
9-.
08
5.6
22
*1
-.5
27
.48
8-.
76
7*
.36
0.4
06
-.0
05
.66
0*
.64
9*
.77
6**
.26
7.3
87
.50
8-.
21
9.4
62
.58
7*
-.5
70
*.1
12
.21
2-.
08
1.0
65
-.3
47
-.1
95
-.1
96
.13
6-.
39
9.2
05
-.1
96
.40
9.3
26
-.1
62
.35
9.3
97
.59
5*
.59
4*
Sig
. (2
-ta
ile
d)
.99
1.4
21
.21
4.7
73
.01
7.0
53
.18
3.0
16
.20
7.1
50
.98
6.0
10
.01
2.0
01
.37
7.1
91
.06
4.4
52
.09
6.0
27
.03
3.7
03
.50
9.8
02
.84
1.3
25
.61
5.5
02
.64
2.1
57
.48
2.5
02
.14
7.2
56
.58
0.2
07
.16
0.0
25
.02
5
N1
41
09
14
14
14
14
99
14
14
14
14
14
14
13
13
14
14
14
14
14
14
12
12
12
10
91
41
41
41
41
41
41
41
41
41
41
41
4
Pe
ars
on
Co
rre
latio
n.7
48
*.5
52
.99
5**
.15
4-.
06
8.4
88
-.0
05
1-.
71
6*
.17
5-.
71
7*
-.2
38
.54
6.8
48
**.0
72
.41
2.8
06
**.4
95
-.1
15
.01
1.8
96
**-.
15
2-.
00
3.0
09
-.2
00
-.2
80
-.1
51
-.2
38
-.4
92
-.1
25
-.0
14
-.0
31
-.4
92
.35
1.2
49
-.4
58
.33
3-.
77
9*
.75
1*
.65
7
Sig
. (2
-ta
ile
d)
.02
1.1
24
.00
0.6
92
.86
2.1
83
.99
1.0
30
.65
2.0
30
.53
7.1
29
.00
4.8
53
.31
0.0
09
.17
5.7
68
.97
7.0
01
.69
6.9
94
.98
2.6
06
.46
6.7
20
.57
0.1
79
.74
8.9
71
.93
8.1
79
.35
4.5
19
.21
5.3
82
.01
3.0
20
.05
5
N9
99
99
99
99
99
99
99
89
99
99
99
99
98
89
99
99
99
99
99
9
Pe
ars
on
Co
rre
latio
n-.
46
6-.
68
3*
-.7
22
*.0
55
.03
3-.
76
7*
-.0
95
-.7
16
*1
-.1
20
.64
2.4
17
-.2
03
-.4
56
-.5
28
-.0
15
-.3
45
-.6
41
.46
0-.
02
4-.
47
6.4
21
-.1
71
.26
1.7
06
*.5
67
.51
4.4
39
.76
9*
-.0
03
-.0
22
-.0
02
.76
9*
-.1
31
-.5
07
.12
5-.
36
3.8
17
**-.
55
1-.
53
4
Sig
. (2
-ta
ile
d)
.20
7.0
43
.02
8.8
89
.93
4.0
16
.80
8.0
30
.75
9.0
62
.26
4.6
01
.21
8.1
44
.97
3.3
63
.06
3.2
13
.95
1.1
95
.25
9.6
61
.49
7.0
33
.11
1.1
93
.27
6.0
15
.99
4.9
55
.99
6.0
15
.73
7.1
64
.74
9.3
37
.00
7.1
24
.13
8
N9
99
99
99
99
99
99
99
89
99
99
99
99
98
89
99
99
99
99
99
9
Pe
ars
on
Co
rre
latio
n-.
14
0.0
92
.49
7-.
21
3.1
62
.66
0*
-.2
21
.54
6-.
20
3.6
40
**.2
94
-.1
17
1.7
09
**.2
95
.41
0.4
91
.34
1-.
21
4.3
63
.64
3**
-.2
27
-.2
30
.02
2.1
01
.01
0-.
07
1-.
00
6.0
39
.06
6-.
11
7.1
16
.03
9.7
68
**.2
42
-.3
62
.43
3.3
34
.79
6**
.77
2**
Sig
. (2
-ta
ile
d)
.60
6.8
00
.17
3.4
11
.53
5.0
10
.39
5.1
29
.60
1.0
06
.28
7.6
65
.00
3.2
68
.14
5.0
74
.21
4.4
11
.15
2.0
05
.39
7.3
91
.94
4.7
43
.97
5.8
35
.98
8.8
87
.81
6.6
54
.66
9.8
87
.00
0.3
85
.15
3.0
82
.22
4.0
00
.00
1
N1
61
09
17
17
14
17
99
17
15
16
17
15
16
14
14
15
17
17
17
16
16
13
13
13
11
10
16
15
17
16
16
17
15
17
17
15
16
15
Pe
ars
on
Co
rre
latio
n.5
14
.92
7**
.47
0.0
05
-.1
51
.50
8.0
88
.49
5-.
64
1.7
16
**.2
80
.00
1.3
41
.22
1.4
24
.94
3**
.07
21
-.0
01
.63
1*
.62
2*
-.0
28
.54
6*
-.1
27
-.5
10
-.3
81
-.7
34
*-.
63
1-.
60
0*
.54
5*
-.0
26
.71
4**
-.6
00
*.6
70
**.8
22
**-.
04
9.8
80
**.2
64
.77
9**
.81
6**
Sig
. (2
-ta
ile
d)
.06
0.0
00
.20
2.9
84
.59
0.0
64
.75
5.1
75
.06
3.0
03
.31
2.9
96
.21
4.4
48
.13
1.0
00
.80
6.9
97
.01
2.0
13
.92
5.0
43
.69
5.0
90
.22
2.0
16
.06
8.0
23
.04
4.9
26
.00
4.0
23
.00
6.0
00
.86
3.0
00
.34
1.0
01
.00
0
N1
41
09
15
15
14
15
99
15
15
15
15
14
14
14
14
15
15
15
15
14
14
12
12
12
10
91
41
41
51
41
41
51
51
51
51
51
51
5
Pe
ars
on
Co
rre
latio
n-.
07
4.5
61
-.0
29
-.1
46
-.1
76
.46
2.0
74
.01
1-.
02
4.6
16
**.6
12
*.0
13
.36
3.3
72
.88
2**
.60
2*
-.0
79
.63
1*
-.1
41
1.7
44
**.0
44
.12
7-.
68
5**
-.6
51
*-.
68
6**
-.7
45
**.1
48
.50
4*
.75
2**
.03
6.8
76
**.5
04
*.6
60
**.5
86
*-.
02
6.6
99
**.6
39
*.5
22
*.6
16
*
Sig
. (2
-ta
ile
d)
.78
6.0
92
.94
0.5
75
.49
9.0
96
.77
9.9
77
.95
1.0
09
.01
5.9
61
.15
2.1
73
.00
0.0
23
.78
8.0
12
.58
9.0
01
.87
1.6
39
.01
0.0
16
.01
0.0
09
.68
3.0
46
.00
1.8
92
.00
0.0
46
.00
4.0
22
.92
1.0
02
.01
0.0
38
.01
5
N1
61
09
17
17
14
17
99
17
15
16
17
15
16
14
14
15
17
17
17
16
16
13
13
13
11
10
16
15
17
16
16
17
15
17
17
15
16
15
Pe
ars
on
Co
rre
latio
n.1
05
.60
0.8
82
**-.
13
4-.
04
4.5
87
*-.
10
1.8
96
**-.
47
6.5
28
*.6
55
**-.
05
3.6
43
**.7
90
**.6
32
**.7
86
**.5
42
*.6
22
*-.
13
5.7
44
**1
-.2
93
.01
0-.
33
7-.
28
0-.
32
7-.
49
0-.
09
2.2
10
.55
1*
-.0
08
.61
3*
.21
0.6
65
**.4
53
-.4
22
.57
8*
.66
2**
.74
0**
.70
8**
Sig
. (2
-ta
ile
d)
.70
0.0
67
.00
2.6
08
.86
7.0
27
.69
9.0
01
.19
5.0
29
.00
8.8
46
.00
5.0
00
.00
9.0
01
.04
5.0
13
.60
5.0
01
.27
0.9
72
.26
0.3
54
.27
6.1
26
.80
1.4
34
.03
3.9
75
.01
2.4
34
.00
4.0
90
.09
1.0
15
.00
7.0
01
.00
3
N1
61
09
17
17
14
17
99
17
15
16
17
15
16
14
14
15
17
17
17
16
16
13
13
13
11
10
16
15
17
16
16
17
15
17
17
15
16
15
Pe
ars
on
Co
rre
latio
n-.
03
8.5
16
.29
9-.
16
6-.
18
2.4
09
.10
5.3
51
-.1
31
.95
7**
.28
4-.
06
6.7
68
**.3
29
.42
6.4
90
.09
8.6
70
**-.
16
5.6
60
**.6
65
**.1
10
-.1
17
-.2
54
-.2
43
-.2
84
-.5
90
-.1
75
.21
0.4
61
.05
8.5
45
*.2
10
1.6
18
*-.
16
9.8
67
**.3
17
.89
4**
.92
3**
Sig
. (2
-ta
ile
d)
.89
0.1
27
.43
5.5
24
.48
5.1
47
.68
7.3
54
.73
7.0
00
.30
4.8
08
.00
0.2
31
.10
0.0
75
.73
8.0
06
.52
6.0
04
.00
4.6
84
.66
6.4
03
.42
3.3
47
.05
6.6
28
.43
5.0
84
.82
6.0
29
.43
5.0
14
.51
6.0
00
.25
0.0
00
.00
0
N1
61
09
17
17
14
17
99
17
15
16
17
15
16
14
14
15
17
17
17
16
16
13
13
13
11
10
16
15
17
16
16
17
15
17
17
15
16
15
Pe
ars
on
Co
rre
latio
n.3
80
.70
0*
.71
1*
-.1
60
-.1
29
.59
5*
.05
2.7
51
*-.
55
1.8
21
**.2
06
-.1
41
.79
6**
.55
1*
.36
9.5
68
*.3
82
.77
9**
-.1
64
.52
2*
.74
0**
-.0
54
.27
3-.
13
2-.
17
8-.
17
2-.
42
6-.
27
5.0
36
.29
8.0
29
.45
0.0
36
.89
4**
.65
6**
-.2
49
.81
4**
.21
91
.99
1**
Sig
. (2
-ta
ile
d)
.16
3.0
24
.03
2.5
53
.63
5.0
25
.84
9.0
20
.12
4.0
00
.46
1.6
15
.00
0.0
41
.17
6.0
34
.17
8.0
01
.54
5.0
38
.00
1.8
49
.32
5.6
67
.56
0.5
73
.19
2.4
42
.89
9.2
80
.91
5.0
92
.89
9.0
00
.00
8.3
52
.00
0.4
34
.00
0
N1
51
09
16
16
14
16
99
16
15
15
16
14
15
14
14
15
16
16
16
15
15
13
13
13
11
10
15
15
16
15
15
16
15
16
16
15
16
15
Pe
ars
on
Co
rre
latio
n.3
86
.72
6*
.61
2-.
17
0-.
11
9.5
94
*.0
45
.65
7-.
53
4.8
75
**.2
23
-.1
33
.77
2**
.46
3.4
48
.55
3*
.26
3.8
16
**-.
17
5.6
16
*.7
08
**-.
07
8.2
94
.27
6-.
14
0-.
14
4-.
48
0-.
38
5-.
31
0.3
23
.00
9.5
27
-.3
10
.92
3**
.71
3**
-.1
81
.89
6**
.23
5.9
91
**1
Sig
. (2
-ta
ile
d)
.17
2.0
17
.08
0.5
44
.67
2.0
25
.87
4.0
55
.13
8.0
00
.42
5.6
35
.00
1.0
96
.10
8.0
40
.36
4.0
00
.53
3.0
15
.00
3.7
91
.30
8.3
85
.66
3.6
56
.16
1.3
07
.28
0.2
60
.97
6.0
53
.28
0.0
00
.00
3.5
18
.00
0.3
99
.00
0
N1
41
09
15
15
14
15
99
15
15
15
15
14
14
14
14
15
15
15
15
14
14
12
12
12
10
91
41
41
51
41
41
51
51
51
51
51
51
5
Year
= 1
8
19
11
12
13
14
15
16
17
18
19
20
21
22
23
24
25
26
27
28
29
30
31
32
33
34
35
36
40
41
42
43
44
45
46
47
48
49
50
51
Pe
ars
on
Co
rre
latio
n.2
62
-.2
16
1.1
07
.14
5.1
79
-.0
55
.70
6*
-.4
93
-.6
23
*-.
28
1.4
09
-.3
05
.10
2.0
97
-.4
30
.37
0-.
45
2.1
83
-.4
57
-.5
62
-.5
05
-.1
96
-.1
28
-.1
97
-.0
74
.53
7.1
37
-.3
14
-.2
87
-.0
09
-.4
57
-.3
14
-.6
41
*-.
39
2-.
16
5-.
60
0-.
44
2-.
61
7*
-.6
35
*
Sig
. (2
-ta
ile
d)
.43
6.5
77
.75
5.6
71
.59
8.8
72
.02
3.1
23
.04
1.4
03
.21
2.3
62
.76
5.7
78
.18
7.2
63
.16
3.5
90
.15
8.0
72
.11
3.5
64
.72
4.5
85
.84
0.1
36
.74
6.3
46
.39
1.9
80
.15
8.3
46
.03
4.2
33
.62
8.0
51
.17
4.0
43
.03
6
N1
19
11
11
11
11
11
10
11
11
11
11
11
11
11
11
11
11
11
11
11
11
11
10
10
10
98
11
11
11
11
11
11
11
11
11
11
11
11
Pe
ars
on
Co
rre
latio
n.0
95
.07
7-.
30
5-.
33
0.1
40
.34
2-.
27
5-.
32
2-.
03
8.6
67
**.2
75
-.1
62
1.3
80
.47
8.1
39
-.1
50
.09
2-.
45
9.3
65
.20
4-.
23
3.1
37
.11
6.0
08
-.0
20
-.1
67
-.3
49
.38
2.1
72
-.1
52
-.0
04
.38
2.7
45
**.1
87
.05
3.3
26
.30
0.7
73
**.7
30
**
Sig
. (2
-ta
ile
d)
.73
7.8
32
.36
2.2
12
.60
6.2
32
.30
3.3
64
.91
3.0
05
.32
2.5
48
.18
0.0
72
.62
1.5
94
.74
4.0
74
.16
5.4
66
.40
3.6
39
.70
5.9
79
.95
1.6
23
.32
2.1
45
.55
6.5
73
.98
9.1
45
.00
1.5
04
.84
5.2
18
.27
7.0
00
.00
2
N1
51
01
11
61
61
41
61
01
11
61
51
61
61
41
51
51
51
51
61
61
51
51
41
31
31
21
11
01
61
41
61
51
61
61
51
61
61
51
61
5
Pe
ars
on
Co
rre
latio
n.0
94
.87
8**
-.4
30
-.2
54
-.2
98
.33
1.1
46
-.3
29
-.1
84
.66
7**
.06
5-.
15
3.1
39
.11
9.2
16
1.2
09
.98
6**
-.4
18
.44
9.7
87
**.0
61
.49
5.2
92
.33
1.0
10
-.1
66
-.3
89
.16
7.5
29
.06
9.2
74
.16
7.6
11
*.7
23
**-.
29
9.7
73
**.0
56
.60
4*
.64
3**
Sig
. (2
-ta
ile
d)
.74
8.0
01
.18
7.3
61
.28
2.2
47
.60
4.3
53
.58
8.0
07
.81
8.5
86
.62
1.6
99
.45
9.4
56
.00
0.1
21
.09
3.0
01
.83
5.0
86
.35
7.2
93
.97
7.6
47
.30
1.5
51
.06
3.8
06
.34
3.5
51
.01
5.0
02
.27
9.0
01
.84
4.0
17
.01
0
N1
41
01
11
51
51
41
51
01
11
51
51
51
51
31
41
51
51
51
51
51
41
41
31
21
21
11
09
15
13
15
14
15
15
15
15
15
15
15
15
Pe
ars
on
Co
rre
latio
n.0
62
.81
4**
-.5
62
-.3
62
-.3
78
.09
4.1
82
-.1
92
.25
0.7
73
**.3
87
.01
2.2
04
.41
8.4
09
.78
7**
-.4
02
.77
9**
-.4
88
.91
9**
1.3
78
.19
4.1
44
-.4
80
-.5
26
-.6
06
*-.
55
8.3
35
.29
2.0
60
.69
3**
.33
5.7
10
**.7
72
**.1
68
.83
3**
.44
3.6
62
**.7
01
**
Sig
. (2
-ta
ile
d)
.83
3.0
04
.07
2.1
85
.16
5.7
59
.51
5.5
94
.45
8.0
01
.17
2.9
66
.46
6.1
37
.14
6.0
01
.15
4.0
01
.06
5.0
00
.18
3.5
26
.65
5.1
14
.07
9.0
48
.09
3.2
22
.33
4.8
32
.00
6.2
22
.00
3.0
01
.55
0.0
00
.11
3.0
07
.00
5
N1
41
01
11
51
51
31
51
01
11
51
41
51
51
41
41
41
41
41
51
51
51
41
31
21
21
21
11
01
51
31
51
41
51
51
41
51
51
41
51
4
Pe
ars
on
Co
rre
latio
n.0
46
.69
7*
-.6
41
*-.
34
9-.
14
6.1
67
-.0
05
-.4
62
.04
9.9
85
**.2
54
-.1
37
.74
5**
.30
2.4
04
.61
1*
-.1
89
.55
5*
-.4
90
.54
3*
.71
0**
.12
1.3
83
.29
1-.
11
3-.
19
8-.
39
6-.
44
0.3
34
.45
7.0
37
.38
0.3
34
1.7
19
**.0
38
.85
2**
.29
2.9
91
**.9
82
**
Sig
. (2
-ta
ile
d)
.87
1.0
25
.03
4.1
85
.58
8.5
68
.98
5.1
79
.88
6.0
00
.36
1.6
12
.00
1.2
94
.13
6.0
15
.49
9.0
32
.05
4.0
30
.00
3.6
68
.17
7.3
34
.71
4.5
36
.22
8.2
04
.20
6.1
00
.89
3.1
63
.20
6.0
03
.88
8.0
00
.29
1.0
00
.00
0
N1
51
01
11
61
61
41
61
01
11
61
51
61
61
41
51
51
51
51
61
61
51
51
41
31
31
21
11
01
61
41
61
51
61
61
51
61
61
51
61
5
Pe
ars
on
Co
rre
latio
n-.
02
6.9
00
**-.
39
2-.
14
6-.
30
1.0
42
.28
7-.
24
1-.
04
2.7
49
**.2
09
-.0
43
.18
7.0
80
.29
5.7
23
**-.
15
8.6
37
*-.
30
3.4
89
.77
2**
.04
2.4
84
.42
5.3
88
.00
6-.
14
7-.
09
7.2
89
.53
5.3
69
.59
8*
.28
9.7
19
**1
-.0
13
.87
9**
.23
4.6
60
**.6
85
**
Sig
. (2
-ta
ile
d)
.92
9.0
00
.23
3.6
04
.27
6.8
85
.30
0.5
02
.90
2.0
01
.45
4.8
79
.50
4.7
95
.30
6.0
02
.57
3.0
11
.27
2.0
64
.00
1.8
86
.09
4.1
69
.21
3.9
86
.68
5.8
03
.29
5.0
59
.17
6.0
24
.29
5.0
03
.96
4.0
00
.40
2.0
07
.00
5
N1
41
01
11
51
51
41
51
01
11
51
51
51
51
31
41
51
51
51
51
51
41
41
31
21
21
11
09
15
13
15
14
15
15
15
15
15
15
15
15
Pe
ars
on
Co
rre
latio
n.0
55
.65
4*
-.6
17
*-.
32
3-.
07
8.2
17
-.0
82
-.4
22
.02
7.9
77
**.2
30
-.1
49
.77
3**
.28
9.3
82
.60
4*
-.1
54
.55
7*
-.4
72
.51
1*
.66
2**
.12
4.3
71
.22
8-.
05
1-.
13
3-.
35
8-.
43
5.3
15
.43
8-.
05
6.3
06
.31
5.9
91
**.6
60
**.0
26
.83
2**
.26
61
.99
0**
Sig
. (2
-ta
ile
d)
.84
6.0
40
.04
3.2
22
.77
4.4
57
.76
2.2
24
.93
7.0
00
.40
9.5
82
.00
0.3
16
.16
0.0
17
.58
5.0
31
.06
5.0
43
.00
7.6
60
.19
2.4
54
.87
0.6
80
.27
9.2
08
.23
4.1
17
.83
8.2
67
.23
4.0
00
.00
7.9
25
.00
0.3
37
.00
0
N1
51
01
11
61
61
41
61
01
11
61
51
61
61
41
51
51
51
51
61
61
51
51
41
31
31
21
11
01
61
41
61
51
61
61
51
61
61
51
61
5
Pe
ars
on
Co
rre
latio
n-.
05
0.6
48
*-.
63
5*
-.3
56
-.0
17
.28
1-.
13
3-.
39
8-.
00
2.9
83
**.2
22
-.1
54
.73
0**
.29
5.3
87
.64
3**
-.1
30
.59
7*
-.4
81
.52
2*
.70
1**
.11
2.4
49
.26
3.4
75
.16
7-.
28
0-.
32
2.3
57
.50
7-.
09
6.3
07
.35
7.9
82
**.6
85
**.0
38
.85
0**
.25
7.9
90
**1
Sig
. (2
-ta
ile
d)
.86
4.0
43
.03
6.1
93
.95
1.3
30
.63
5.2
54
.99
6.0
00
.42
6.5
85
.00
2.3
28
.17
2.0
10
.64
4.0
19
.06
9.0
46
.00
5.7
03
.12
4.4
09
.11
9.6
23
.43
4.3
98
.19
1.0
77
.73
3.2
86
.19
1.0
00
.00
5.8
92
.00
0.3
55
.00
0
N1
41
01
11
51
51
41
51
01
11
51
51
51
51
31
41
51
51
51
51
51
41
41
31
21
21
11
09
15
13
15
14
15
15
15
15
15
15
15
15
Year
= 1
9
19
11
12
13
14
15
16
17
18
19
20
21
22
23
24
25
26
27
28
29
30
31
32
33
34
35
36
40
41
42
43
44
45
46
47
48
49
50
51
Pe
ars
on
Co
rre
latio
n-.
29
9.6
46
*.1
74
.07
4.2
73
.30
0.1
25
.29
3-.
34
71
.21
1-.
10
2.8
18
**.1
73
.36
6.6
00
*.4
31
.59
1*
-.2
21
.53
6*
.33
9.1
94
-.3
51
.50
9.4
54
.53
5.3
30
.46
4-.
17
7-.
34
9-.
26
6.2
30
-.1
77
.98
5**
.68
2**
.44
7.9
31
**.2
19
.99
3**
.99
6**
Sig
. (2
-ta
ile
d)
.27
9.0
44
.60
9.7
92
.36
7.2
98
.65
7.3
82
.32
6.4
70
.73
9.0
00
.59
2.1
80
.02
3.1
42
.02
6.4
29
.03
9.2
16
.48
9.2
18
.07
5.1
19
.06
0.2
71
.15
0.5
27
.22
1.3
79
.40
9.5
27
.00
0.0
07
.09
5.0
00
.45
1.0
00
.00
0
N1
51
01
11
51
31
41
51
11
01
51
41
31
51
21
51
41
31
41
51
51
51
51
41
31
31
31
31
11
51
41
31
51
51
51
41
51
51
41
51
4
Pe
ars
on
Co
rre
latio
n-.
53
6*
.76
5**
-.0
97
.29
1.0
63
.08
1.6
46
*.0
82
-.3
41
.60
0*
.47
2.0
21
.47
3-.
07
3.5
05
1.4
80
.99
5**
.07
0.7
83
**.1
49
.26
3-.
89
1**
.52
6.5
83
*.6
36
*.5
49
.48
6-.
65
9*
-.8
95
**-.
22
3.7
02
**-.
65
9*
.59
5*
.55
7*
.69
7**
.55
5*
.50
6.5
95
*.5
93
*
Sig
. (2
-ta
ile
d)
.04
8.0
10
.78
9.3
12
.84
6.7
83
.01
3.8
21
.33
5.0
23
.08
9.9
48
.08
8.8
32
.06
6.0
97
.00
0.8
11
.00
1.6
12
.36
4.0
00
.07
9.0
47
.02
6.0
64
.15
5.0
10
.00
0.4
85
.00
5.0
10
.02
5.0
39
.00
6.0
39
.06
5.0
25
.02
5
N1
41
01
01
41
21
41
41
01
01
41
41
21
41
11
41
41
31
41
41
41
41
41
31
21
21
21
21
01
41
31
21
41
41
41
41
41
41
41
41
4
Pe
ars
on
Co
rre
latio
n-.
53
3*
.59
1.1
99
.29
6.1
32
-.0
05
.31
6.2
67
-.0
89
.53
6*
.83
9**
.03
4.5
15
*.1
80
.83
4**
.78
3**
.74
8**
.75
2**
.17
11
-.0
56
-.0
55
-.8
87
**.4
51
.41
6.4
04
.32
8.3
43
-.8
33
**-.
87
7**
-.0
21
.87
1**
-.8
33
**.5
66
*.5
09
.90
2**
.47
9.8
41
**.5
20
*.5
20
Sig
. (2
-ta
ile
d)
.04
1.0
72
.55
7.2
84
.66
8.9
86
.25
1.4
27
.80
8.0
39
.00
0.9
13
.04
9.5
75
.00
0.0
01
.00
3.0
02
.54
1.8
43
.84
5.0
00
.12
2.1
58
.17
1.2
73
.30
1.0
00
.00
0.9
46
.00
0.0
00
.02
8.0
63
.00
0.0
71
.00
0.0
47
.05
6
N1
51
01
11
51
31
41
51
11
01
51
41
31
51
21
51
41
31
41
51
51
51
51
41
31
31
31
31
11
51
41
31
51
51
51
41
51
51
41
51
4
Pe
ars
on
Co
rre
latio
n-.
51
0.8
34
**.1
45
.11
0-.
18
0.0
76
.30
1.1
14
-.1
66
.68
2**
.29
4-.
22
9.3
66
-.1
31
.39
1.5
57
*.2
86
.50
6-.
13
4.5
09
.30
3.1
09
-.3
77
.62
1*
.58
0*
.60
2*
.32
1.4
32
-.1
90
-.3
76
.33
2.2
66
-.1
90
.68
5**
1.4
76
.77
5**
.31
1.6
46
*.6
52
*
Sig
. (2
-ta
ile
d)
.06
2.0
03
.69
0.7
09
.57
6.7
97
.29
6.7
53
.64
6.0
07
.30
7.4
74
.19
8.7
02
.16
7.0
39
.34
3.0
65
.64
7.0
63
.29
3.7
10
.20
4.0
31
.04
8.0
39
.30
9.2
12
.51
6.2
06
.29
2.3
59
.51
6.0
07
.08
6.0
01
.27
9.0
12
.01
1
N1
41
01
01
41
21
41
41
01
01
41
41
21
41
11
41
41
31
41
41
41
41
41
31
21
21
21
21
01
41
31
21
41
41
41
41
41
41
41
41
4
Pe
ars
on
Co
rre
latio
n-.
28
2.5
95
.15
2-.
00
1.2
95
.35
2.1
22
.28
8-.
37
2.9
93
**.1
79
-.1
27
.83
9**
.23
3.3
82
.59
5*
.45
1.5
87
*-.
25
4.5
20
*.3
21
.15
3-.
33
7.4
57
.40
7.4
97
.30
7.4
74
-.1
91
-.3
36
-.2
92
.22
5-.
19
1.9
79
**.6
46
*.4
18
.90
2**
.18
41
.99
9**
Sig
. (2
-ta
ile
d)
.30
9.0
70
.65
5.9
99
.32
8.2
17
.66
4.3
90
.28
9.0
00
.54
1.6
79
.00
0.4
65
.16
0.0
25
.12
2.0
27
.36
2.0
47
.24
3.5
85
.23
9.1
16
.16
7.0
84
.30
8.1
41
.47
7.2
40
.33
4.4
21
.47
7.0
00
.01
2.1
21
.00
0.5
29
.00
0
N1
51
01
11
51
31
41
51
11
01
51
41
31
51
21
51
41
31
41
51
51
51
51
41
31
31
31
31
11
61
41
31
51
61
51
41
51
51
41
61
5
Pe
ars
on
Co
rre
latio
n-.
31
6.6
10
.04
7.1
04
.33
4.3
33
.12
9.2
07
-.3
67
.99
6**
.18
1-.
10
4.8
29
**.1
37
.34
6.5
93
*.4
41
.58
4*
-.1
66
.52
0.3
08
.41
1-.
38
8.4
42
.38
5.4
78
.26
9.4
50
-.2
07
-.3
93
-.3
34
.24
9-.
20
7.9
82
**.6
52
*.4
32
.90
8**
.18
7.9
99
**1
Sig
. (2
-ta
ile
d)
.27
1.0
61
.89
8.7
24
.28
9.2
44
.66
0.5
66
.29
7.0
00
.53
5.7
47
.00
0.6
88
.22
5.0
25
.13
2.0
28
.57
0.0
56
.28
4.1
44
.19
0.1
50
.21
6.1
16
.39
8.1
92
.46
0.1
83
.28
8.3
90
.46
0.0
00
.01
1.1
23
.00
0.5
21
.00
0
N1
41
01
01
41
21
41
41
01
01
41
41
21
41
11
41
41
31
41
41
41
41
41
31
21
21
21
21
01
51
31
21
41
51
41
41
41
41
41
51
5
*. C
orr
ela
tio
n is
sig
nific
an
t a
t th
e 0
.05
le
vel (2
-ta
ile
d).
a. Y
ea
r =
19
46
50
24
28
51
**. C
orr
ela
tio
n is
sig
nific
an
t a
t th
e 0
.01
le
vel (2
-ta
ile
d).
18
51
*. C
orr
ela
tio
n is
sig
nific
an
t a
t th
e 0
.05
le
vel (2
-ta
ile
d).
**. C
orr
ela
tio
n is
sig
nific
an
t a
t th
e 0
.01
le
vel (2
-ta
ile
d).
a. Y
ea
r =
18
Co
rre
lati
on
sa
Co
rre
lati
on
sa
11
50
45
46
21
24
29
50
51
*. C
orr
ela
tio
n is
sig
nific
an
t a
t th
e 0
.05
le
vel (2
-ta
ile
d).
45
**. C
orr
ela
tio
n is
sig
nific
an
t a
t th
e 0
.01
le
vel (2
-ta
ile
d).
a. Y
ea
r =
17
26
28
29
16
17
21
Co
rre
lati
on
sa
14