vapour absorption system
DESCRIPTION
VAR system implemented on maruti 800 final year projectTRANSCRIPT
CHAPTER 1
CHAPTER 1
INTRODUCTION
With the rapid changing environment and atmospheric effect, the air conditioning of the moving vehicle has become a necessity. In the same time consumers are incapable to bear the increasing operating cost of the vehicles due to continuous raise in fuel prices, component costs and maintenance costs associated with vehicles. More recently, several new philosophies for manufacturing improvement have been developed and implemented in various sectors, be it manufacturing, service or other. Keep in mind in this paper, an exploration has been done to research the possibility of waste heat recovery and its subsequent utilization in air conditioning system of a vehicle without increasing the component cost, weight, number of component and bring improvement in vehicle by making luxurious.Industries are vying for various tools and techniques for competitive advantage over the competitors in an ever-changing global market by combining factors like quality, cost, flexibility, responsiveness, and innovation. In today’s global market, there is constantly increasing pressure to make products more quickly, with more variety, at the lowest possible cost. In the end, those companies that meet and exceed customers’ demands will succeed by remaining competitive. Then, the question is, how do companies become competitive and retain their competitiveness? This question may not be easy to answer because manufacturing systems are complex, and simple solutions to manufacturing problems may not exist. Therefore, companies must choose from available techniques to develop their own solutions in the existing products to attract the customers in their fold without adding extra cost. With the rapid changing environment and atmospheric effect, the air conditioning of the moving vehicle has become a necessity. Air conditioning of a vehicle can be done by Vapour Compression Refrigeration System (hereinafter VCRS) and Vapour Absorption Refrigeration System (VARS). Presently, in the vehicles VCRS is in use in most of the cases. In lieu of VCRS, if, VARS is used in vehicles the refrigeration system could be operable in a vehicle without adding running cost for air conditioning. There is a great impact on the running cost of a vehicle due to increasing cost of fuel. The A/C system adds nearly 35 % extra cost in fuel expenses. Alternately, it is a matter of investigation that waste recovery of an engine for application in A/C can reduce the fuel economy of vehicles to what maximum extent? It has\ been revealed that there is great potential to reduce A/C fuel consumption because A/C systems have traditionally been designed to maximize capacity, not efficiency. From the reviews of various literatures there is an indication that reducing the A/C load decreases A/C fuel consumption. In the same line, an automobile engine utilizes only about 35% of available energy and rests are lost to cooling and exhaust system. If one is adding conventional air conditioning system to automobile, it further utilizes about 5% of the total energy. Therefore automobile becomes costlier, uneconomical and less efficient. Additional of conventional air conditioner in car also decreases the life of engine and increases the fuel consumption. For very small cars compressor needs 3 to 4 bhp, a significant ratio of the power output. Keeping these problems in mind, a car air conditioning system is proposed from recovery of engine waste heat using radiator water as source / generator for VARS.
1.1 CONVENTIONAL A/C SYSTEM USED IN VEHICLES
1
CHAPTER 2
The air conditioning system used usually in a vehicle is a vapor compression refrigeration system. It consists of a compressor, condenser, expansion valve, an evaporator blower set and a refrigerant which is circulated through the system. This system works by compressing the refrigerant using a compressor, which increases the pressure and temperature of the refrigerant and it vaporizes. The refrigerant is then passed through the condenser where the latent heat of the refrigerant is removed and is liquefied. This refrigerant is then passed through the expansion valve where its pressure is reduced reducing the temperature. This chilled refrigerant is then passed through the evaporator to produce the cooling effect. The blower blows the air through the evaporator to produce the required cooling inside the cabin of the vehicle. The refrigerant absorbs the heat of the air and vaporizes, which is then passed through the compressor. Hence cooling effect is produced inside the vehicle.
The main disadvantage of such a system is that the required power to run the compressor is taken from the engine main shaft, hence to maintain the same power the engine has to produce more work consuming more fuel thereby reducing the mileage of the vehicle.
Fig 1. 1 Conventional refrigeration system used in automobiles
2

CHAPTER 3
1.1.1 Vapour compression cycle
All vapour compression refrigeration systems are designed and built around these basic thermodynamic principles.
• Fluids absorb heat while changing from a liquid phase to vapour phase and
reject heat in changing from a vapour phase to a liquid phase.
• The temperature at which a change in phase occurs is constant during the
change, but this temperature will vary with the pressure. At one fixed pressure
vaporization takes place only at fixed corresponding temperature. However, the
temperatures of vaporization at a particular pressure are different for different
fluids.
• Heat will flow from a body at higher temperature to a body at lower
temperature.
• In Selecting metallic parts of cooling and condensing units, metals are selected
which have high heat conductivity.
• Heat energy and other forms of energy are mutually convertible with
directional relationship imposed by second by second law of thermodynamics.
1.1.2 Pressure enthalpy diagram
A refrigerator thermodynamic cycle can be explained considering the process that the
refrigerant undergoes in the two heat exchangers, compressor and expansion device.
The most convenient diagram for such explanation and performance analysis is that of
a pressure vs. enthalpy coordinate system. The compressor receives low pressure and
low temperature refrigerant at state 1 and compresses it to a high pressure. This
compression process is associated with an increase of refrigerant temperature. At state
2, the high pressure, high temperature vapour enters the condenser. The refrigerant
passing through the condenser rejects heat to the high temperature reservoir and
changes to a saturated liquid at state 3. Then the refrigerant flows through the
expansion device undergoing a drop in pressure and temperature. Finally, the low
pressure, low temperature and low quality refrigerant at state 4 enters the evaporator,
where it picks up heat from the low temperature reservoir reaching a dry saturated
vapour state at the evaporator exit.
1.2 DRAWBACKS OF VAPOUR COMPRESSION REFRIGERATION
SYSTEM
Though this system is the most efficient of all the refrigeration system still it
has some disadvantages:
• A vapour compression system has more, tear and noise due to moving
parts of the compressor.
3

CHAPTER 4
• The amount of work required to compress the gas in the compressor is
very high.
• It strictly depends on electric power or mechanical power and cannot
be used at places where these recourses are not available.
• The capacity of vapour compression system drops rapidly with lowered
evaporator pressure.
• The performance of a vapour compression system at partial loads is
poor.
• In the vapour compression system, it is essential to superheat the
vapour refrigerant leaving the evaporator so that no liquid may enter
the compressor.
4
VAPOUR ABSORPTION REFRIGERATION SYSTEM
The vapour absorption refrigeration is one of the oldest methods of producing
refrigerating effect. The principle of vapour absorption was first discovered by
Michael Faraday in 1824 while performing a set of experiments to liquefy certain
gases. The first vapour absorption refrigeration machine was developed by a French
scientist Ferdinand Carre in 1860. This system may be used in both the domestic and
large industrial refrigerating plants. The refrigerant, commonly used in a vapour
absorption system is ammonia.
The vapour absorption system uses heat energy, instead of mechanical energy
as in vapour compression systems, in order to change the conditions of the refrigerant
required for the operation of the refrigeration cycle. The function of a compressor, in a
vapour compression system, is to withdraw the vapour refrigerant from the evaporator.
It then raises its temperature and pressure higher than the cooling agent in the
condenser so that the higher pressure vapours can reject heat in the condenser. The
liquid refrigerant leaving the condenser is now ready to expand to the evaporator
conditions again.
This refrigeration system consists of a condenser, an expansion valve and an
evaporator similar to a Vapour Compression Refrigeration System. But the compressor
of the Vapour Compression Refrigeration System is replaced by a generator, an
absorber and a small pump. A Vapour Absorption Refrigeration System utilizes two or
more than two fluids which has high affinity towards each other, in which one is the
refrigerant and the other is the absorbent.
The process of working of this refrigeration system is that a mixture of
refrigerant and an absorber (i,e. strong solution) is pumped from the absorber using a
small pump to the generator. The generator is the main unit of the whole refrigeration
system. This is the place where heat is supplied to the strong solution. Due to the
supplied heat to the mixture in the generator the refrigerant is separated from the
strong solution and forms vapour. The remaining weak solution flows back through a
restrictor in to the absorber. The refrigerant is then allowed to pass through a
5
condenser where the heat of the vapour is extracted and the refrigerant
temperature is brought to the room temperature. This cooled refrigerant is then
passed through an expansion device where during expansion the temperature of
the refrigerant falls below the atmospheric temperature. This cold refrigerant is
then passed through an evaporator from where the refrigerant absorbs heat and
produces refrigerating effect. The refrigerant coming from the evaporator is hot
and it is passed to the absorber. The weak solution coming from the generator
mixes with the refrigerant coming from the evaporator in the absorber due to high
affinity towards each other for the two fluids, hence forming a strong solution.
The formed strong solution is again pumped into the generator and the cycle
repeats itself.The power required for pumping is almost negligible and hence we get refrigerating effect from a Vapour Absorption Refrigeration System without any mechanical power being done on it. But the refrigerating effect produced from a Vapour Compression Refrigeration System is comparatively higher than that produced from a Vapour Absorption Refrigeration System of same capacity.
2.2 TYPES OF VAPOUR ABSORPTION SYSTEMS
There are different types of vapour absorption systems which employ different combination of refrigerant and absorbents to produce the refrigerating effect. Some of the basic vapour absorption systems are:
2.2.1 Aqua-Ammonia Vapour Absorption System.
This is the simplest of all the systems. This system employs water as the absorbent and ammonia as the refrigerant. Along with the generator it employs an analyzer and a rectifier to remove the components of water from the refrigerant, since the heat is high enough to vapourize both refrigerant and absorbent. Therefore the system employs too many components and hence the system is complicated.
2.2.2 LiBr-H2O Vapour Absorption System.
The lithium-bromide absorption refrigeration system uses a solution of lithium-bromide in water. In this system water is being used as a refrigerant whereas lithium bromide, which is a highly hyroscopic salt, as an absorbent. The lithium bromide solution has a strong affinity for water vapour because of its very low vapour pressure. Since lithium bromide solution is corrosive, therefore inhibitors should be added in order to protect the metal parts of the system against corrosion. Lithium chromate is often used as a corrosion inhibitor. This system is very popular for air conditioning in which low temperatures not below 0°C are required.
6
Table 2.1 Refrigerant - Absorber Pairs
2.2.3 Domestic Electrolux (Ammonia Hydrogen) Refrigerator.
This type of refrigerator is also called three fluids absorption system. The main purpose of this system is to eliminate the pump so that in the absence of moving parts, the machine becomes noise-less. The three fluids used in this system are ammonia, hydrogen and water. The ammonia is used as a refrigerant because it possesses most of the desirable properties. It is toxic, but due to absence of moving parts, there is very little chance for leakage and the total amount of refrigeration used is small. The hydrogen being the lightest gas is used to increase the rate of evaporation of the liquid ammonia passing through the evaporator. The hydrogen is also non-corrosive and insoluble in water. This is used in the low pressure side of the system. The water is used as a solvent because it has the ability to absorb ammonia readily.
2.3 REFRIGERANT - ABSORBER PAIRS
2.4 COMPONENTS
The basic components of a vapour absorption refrigeration system are:
2.4.1 Absorber
Weak solution from generator
7
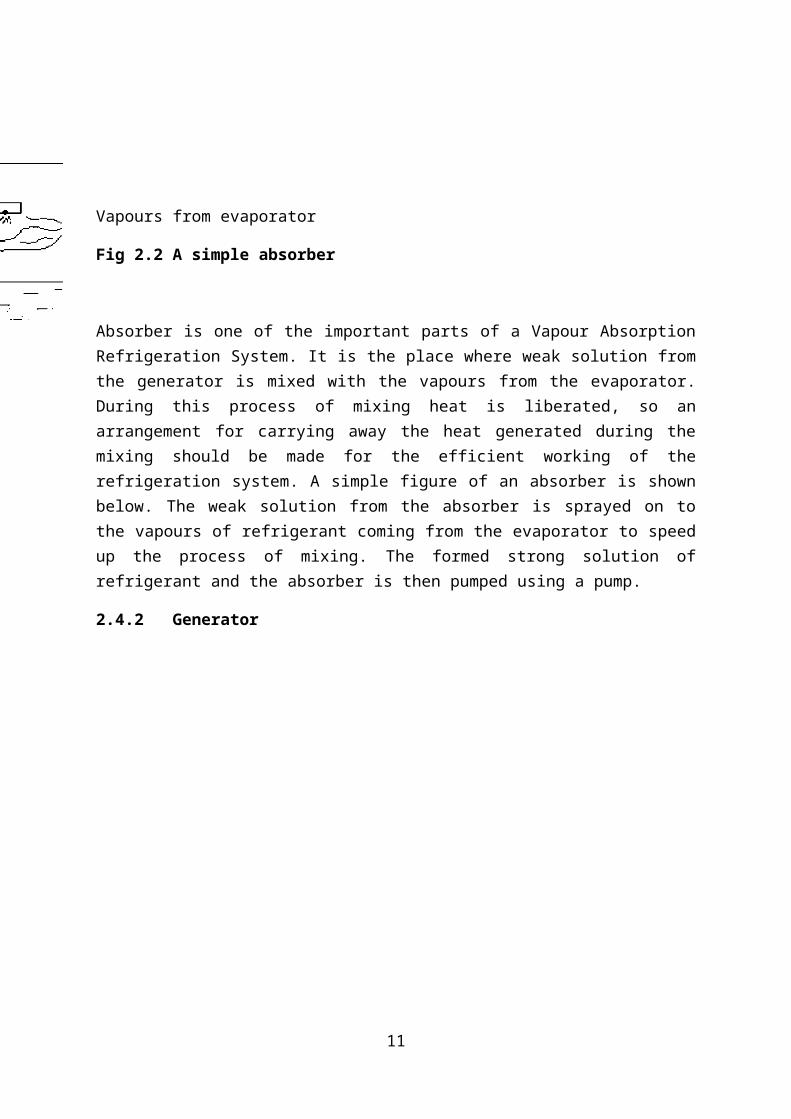
Vapours from evaporator
Fig 2.2 A simple absorber
Absorber is one of the important parts of a Vapour Absorption Refrigeration System. It is the place where weak solution from the generator is mixed with the vapours from the evaporator. During this process of mixing heat is liberated, so an arrangement for carrying away the heat generated during the mixing should be made for the efficient working of the refrigeration system. A simple figure of an absorber is shown below. The weak solution from the absorber is sprayed on to the vapours of refrigerant coming from the evaporator to speed up the process of mixing. The formed strong solution of refrigerant and the absorber is then pumped using a pump.
2.4.2 Generator
Fig 1.3 A generator
The generator of a Vapour Absorption Refrigeration System is the most important component of the whole system. This is the place where heat from the burned gases is supplied to the
8

strong solution of refrigerant and absorber. This heat energy supplied to the generator is absorbed by the mixture to liberate the refrigerant vapour. So it is nothing but a heat exchanger, and the whole working of the refrigeration system depends on this heat exchanger. A generator has to be designed according to the requirement of the refrigeration needed and the source of heat available.
Condenser
A condenser is used to remove the latent heat of the refrigerant coming from the generator. It consists of a number of tubes which is provided with a large number of fins to remove maximum amount of heat from the refrigerant. A condenser is usually made of copper tubes which increases the heat transfer rate from the refrigerant to the surrounding. This is designed based upon the amount of heat to be removed and the surrounding in which it is removed.
Evaporator
This is in the form of coils where heat is absorbed by the refrigerant from the surroundings when the cold refrigerant is passed through it. It is basically copper tubes (to have maximum heat absorbing capacity) having a number of turns.
Expansion device
It is a device to reduce the pressure of the refrigerant from high pressure to low pressure, thus reducing the temperature of the refrigerant.
Pump
Any pump which could discharge the solution from low pressure to high pressure could be used. The selection of the pump depends upon the amount of the solution to be pumped for producing the required effect from absorber to generator.
CHAPTER 2
LITERATURE REVIEW
2.1 VAPOUR ABSORPTION SYSTEMS IN IC ENGINES
9

There are only very few work done on this topic of using vapour
absorption refrigeration system as air conditioner for the automobile. Some of
them are:
2.2WORK DONE BY ANGELO CANTONI, ROME, ITALY
This invention comprises a vapour generator member connected to a
condenser which is itself connected, by way of a pressure reduction valve, to an
evaporator connected to an absorber which receives the liquid present in the
lower zone of the generator and from which liquid is fed to the upper zone of
the generator, there being provided in the generator a heat exchanger through
which the engine cooling liquid flows. Hence it uses heat of the cooling water
as the source of heat for the generator.
2.3 WORK DONE BY I HORUZ, BURSA, TURKEY
The work done by I Horuz consists of using exhaust heat of the
automobile as the heat source for the generator. He used two heat exchangers
one with insulation and the other without insulation for transferring heat to the
solution of the absorption system. He plotted the results obtained after
conducting various performance tests on the engine under different running
conditions.
CHAPTER 3
VAPOUR ABSORPTION REFRIGERATION SYSTEM INAUTOMOBILES
10
It is well known that an IC engine has an efficiency of about 35-40%,
which means that only one-third of the energy in the fuel is converted into
useful work and about 60-65% is wasted to environment. In which about 28-
30% is lost by cooling water and lubrication losses, around 30-32% is lost in the
form of exhaust gases and remainder by radiation, etc. In a Vapour Absorption
Refrigeration System, a physicochemical process replaces the mechanical
process of the Vapour Compression Refrigeration System by using energy in
the form of heat rather than mechanical work. The heat required for running of a
Vapour Absorption Refrigeration System can be obtained from the exhaust of
any vehicle working with an IC engine, which would otherwise be exhausted
into the atmosphere.
Hence using a Vapour Absorption Refrigeration System will not only
prevent the loss of power from the vehicles engine but will also produce
refrigeration using the low grade energy (i,e. exhaust) from the engine. The use
of a Vapour Absorption Refrigeration System will also reduce pollution by
reducing the amount of fuel burned while working the conventional vapour
compression refrigerating unit.
4.2METHODS OF IMPLEMENTATION IN AN AUTOMOBILE
For a road transport utilizing Vapour Absorption Refrigeration System heat
energy can be supplied in two ways:
4.2.1 Using heat of combustion of a separate fuel
By using a separate fuel for working the refrigeration system i,e. a fuel
for example natural gas can be used for the working of a Vapour Absorption
Refrigeration System. This can be achieved by burning the fuel in a separate
combustion chamber and then supplying the Generator of a Vapour Absorption
Refrigeration System with the products of its combustion to produce the
required refrigerating effect. However this prospect is eliminated since it
requires a separate fuel and a separate combustion chamber which makes it
uneconomical and the system becomes inefficient.
4.2.2 Using waste heat of the IC engine
11
Another method is by utilizing the heat of combustion which is wasted
into the atmosphere. By designing a generator capable of extracting the waste
heat of an IC engine without any decrease in engine efficiency, a Vapour
Absorption Refrigeration System can be brought to work. Since this
arrangement does not require any extra work expect a small amount of work
required for the pump, which can be derived from the battery, this system can
be used in automobiles where engine efficiency is the primary consideration.
EXPERIMENTAL IC ENGINE
In an IC engine, fuel (usually petrol or diesel) is combusted inside the
cylinder due to which the piston moves outward and rotates the crank, and
hence the engine produces work. In IC engines the combustion of the fuel
produces heat, which is converted to mechanical work using the piston and
crank arrangement. From the heat produced from combustion of fuel only 30%
(approx) of heat is converted into useful mechanical work. The remaining heat
energy is wasted into the atmosphere in the form of:
(i) heat carried away by the cooling water,
(ii) heat taken away by the exhaust gases,
(iii) heat carried away by the lubricating oil,
(iv) and, heat lost by radiation.
The cooling water and exhaust gases carry away the maximum amount of
heat from the engine, ie around 60% (approx). This heat is called the low grade
energy of the engine.
5.2THE ENGINE
Let us consider an engine of an automobile on which the vapour
absorption refrigeration system is to be implemented.
5.2.1 Engine parameters
The IC engine based on which the calculations are done is
Make - Maruthi Suzuki
Model - 800
12

No of cylinders, n - 3
Power, P - 40 bhp at 5000 rpm.
Capacity, V - 796 cc- 0.000796 m3
No of strokes - 4
Fuel used - Petrol
Torque - 57 Nm @ 2500 rpm
Max RPM - 7000 rpm
5.3 WASTE HEAT OF THE ENGINE
The main two areas through which the heat is exhausted into the
atmosphere from the engine are the cooling water and the exhaust gases. It is
necessary to calculate the amount of heat energy carried away by the exhaust
gases and the cooling water.
CHAPTER 4
MANUFACTURING AND MODAL ANALYSIS OF
BIDIRECTIONAL COMPOSITE BEAM WITH AND WITHOUT
CRACK
4.1 MANUFACTURING OF COMPOSITE BEAM
4.1.1 FIBRE PREPARATION
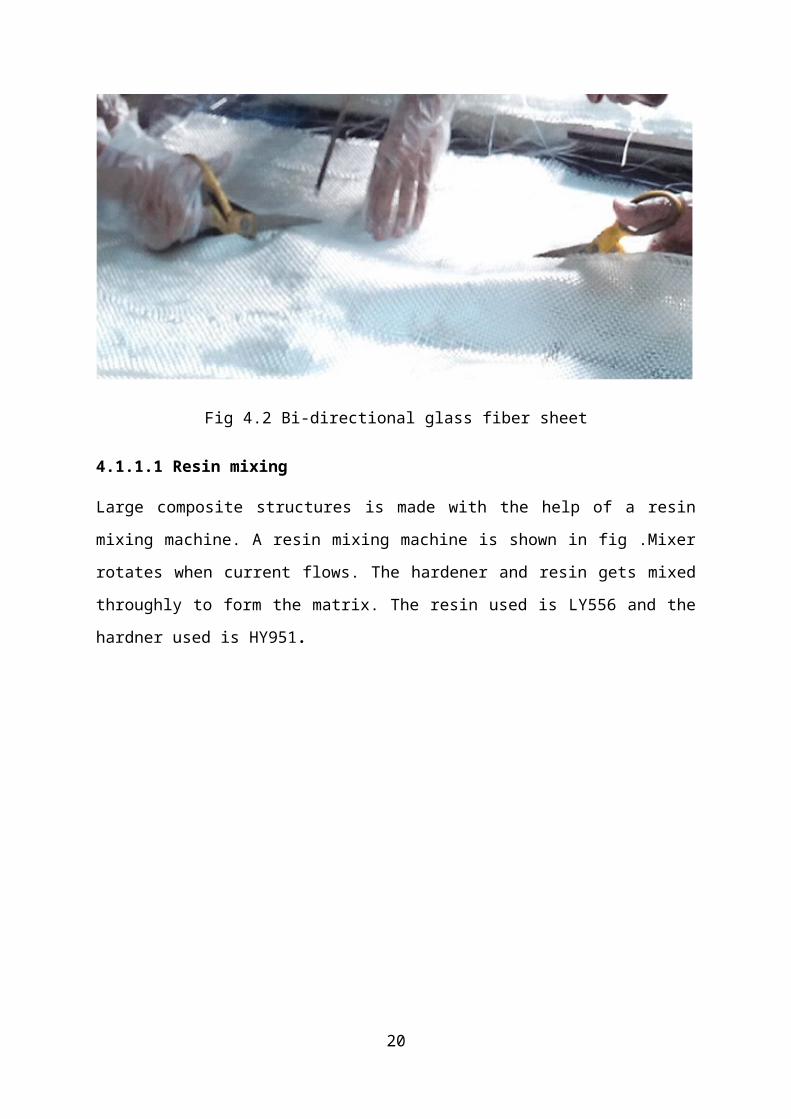
The scale available at Compression Moulding Machine was 300 mm x 300mm. The fibres
were cut to the required dimensions of 300 mm x 300 mm using scissors shown in Fig.4.2.
The fibre had a thickness of 0.5mm. The glass fibre was bi-directional glass fibre, 16 fibres
were cut to the required dimensions.The resin was mixed with a hardener in the ratio 9:1
using the a resin mixing machine for large quantity of the resin. For small qunatity, the resin
is taken in a bowl for mixing properly.
13

Fig 4.1 Cross sectional view of glass fiber sheet
Glass fibres are available in diiferent types. The glass fibres are available in the form of mats
or threads as shown in Fig 4.1. These mats are also of diiferent types. Those mats which are
wooven as shown in Fig 4.2, which is a bi-directional glass fibre in which glass fibres are
wooven both in X and Y direction.and those where the fibres are wooven randomly.
Fig 4.2 Bi-directional glass fiber sheet
14

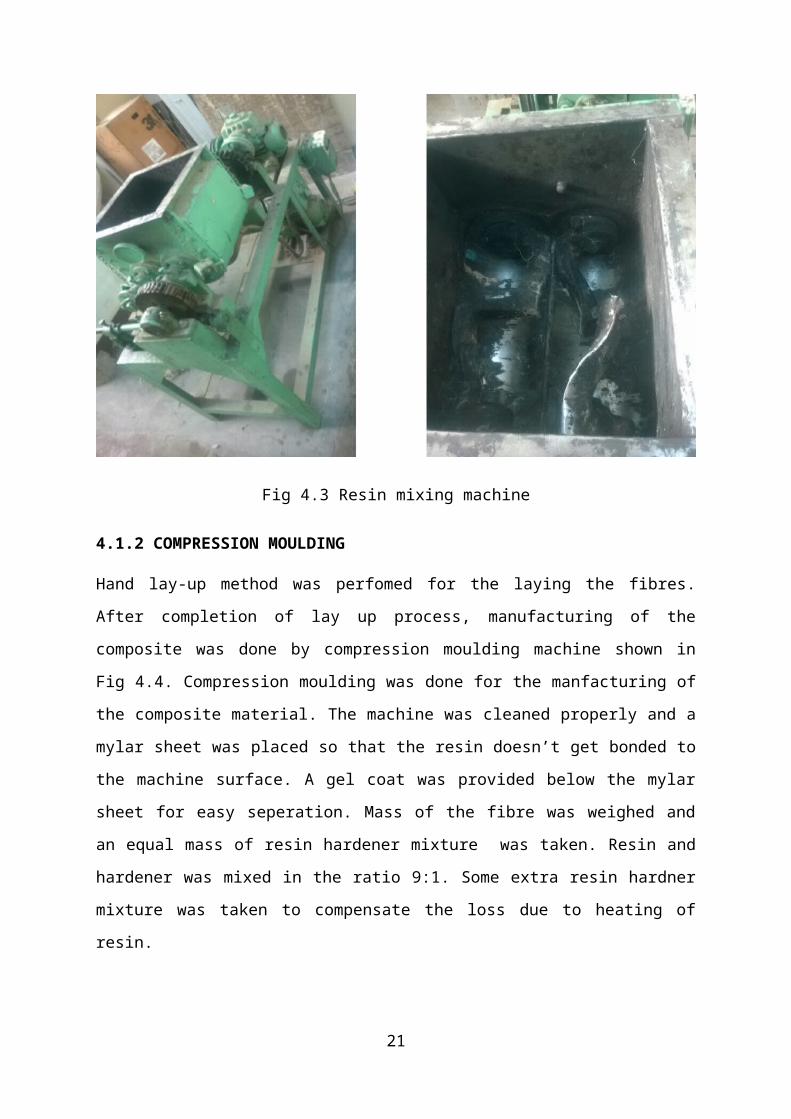
4.1.1.1 Resin mixing
Large composite structures is made with the help of a resin mixing machine. A resin mixing
machine is shown in fig .Mixer rotates when current flows. The hardener and resin gets
mixed throughly to form the matrix. The resin used is LY556 and the hardner used is HY951.
Fig 4.3 Resin mixing machine
4.1.2 COMPRESSION MOULDING
Hand lay-up method was perfomed for the laying the fibres. After completion of lay up
process, manufacturing of the composite was done by compression moulding machine shown
in Fig 4.4. Compression moulding was done for the manfacturing of the composite material.
The machine was cleaned properly and a mylar sheet was placed so that the resin doesn’t get
bonded to the machine surface. A gel coat was provided below the mylar sheet for easy
seperation. Mass of the fibre was weighed and an equal mass of resin hardener mixture was
taken. Resin and hardener was mixed in the ratio 9:1. Some extra resin hardner mixture was
taken to compensate the loss due to heating of resin.
15
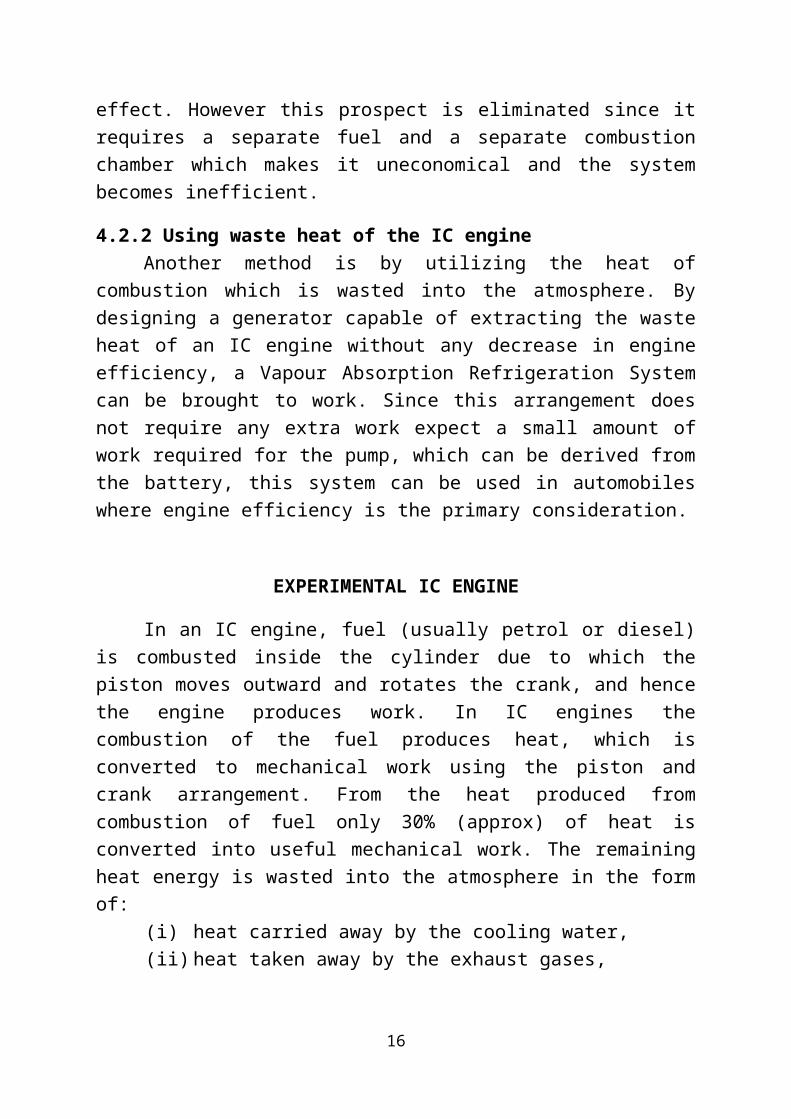
Fig 4.4 Compression Moulding Machine
Alternate layers of fibre and resin were stacked ome above the other. A fibre mat was placed
and resin was poured over it and was spread manually using a brush which has metal rollers.
The next layer of fibre mat was placed and the process was repeated for 16 sheets. Finally a
maylar sheet was placed on top.
The hardener used is HY951 which has low viscosity, unfilled epoxy casting resin system,
curing at room temperature and high filler addition possibility. The other properties are it has
good mechanical strength, good resistance to atmospheric to atmospheric and chemical
degradation and excellent electrical properties.
16
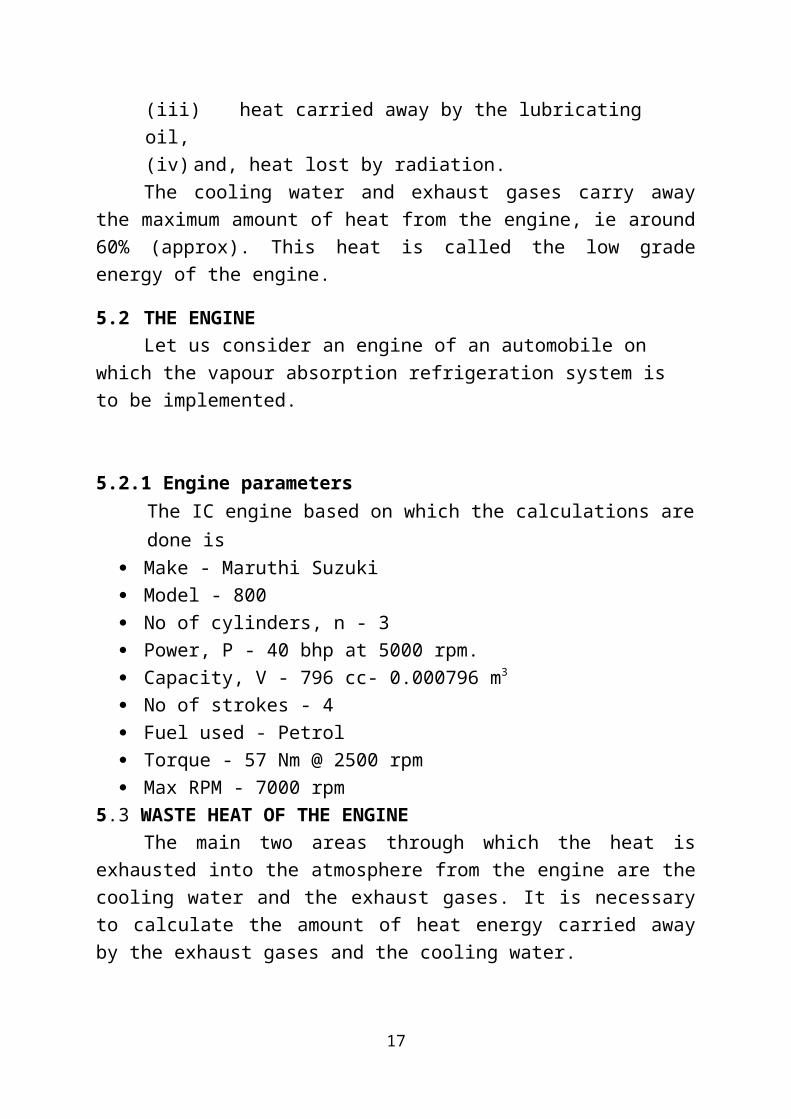
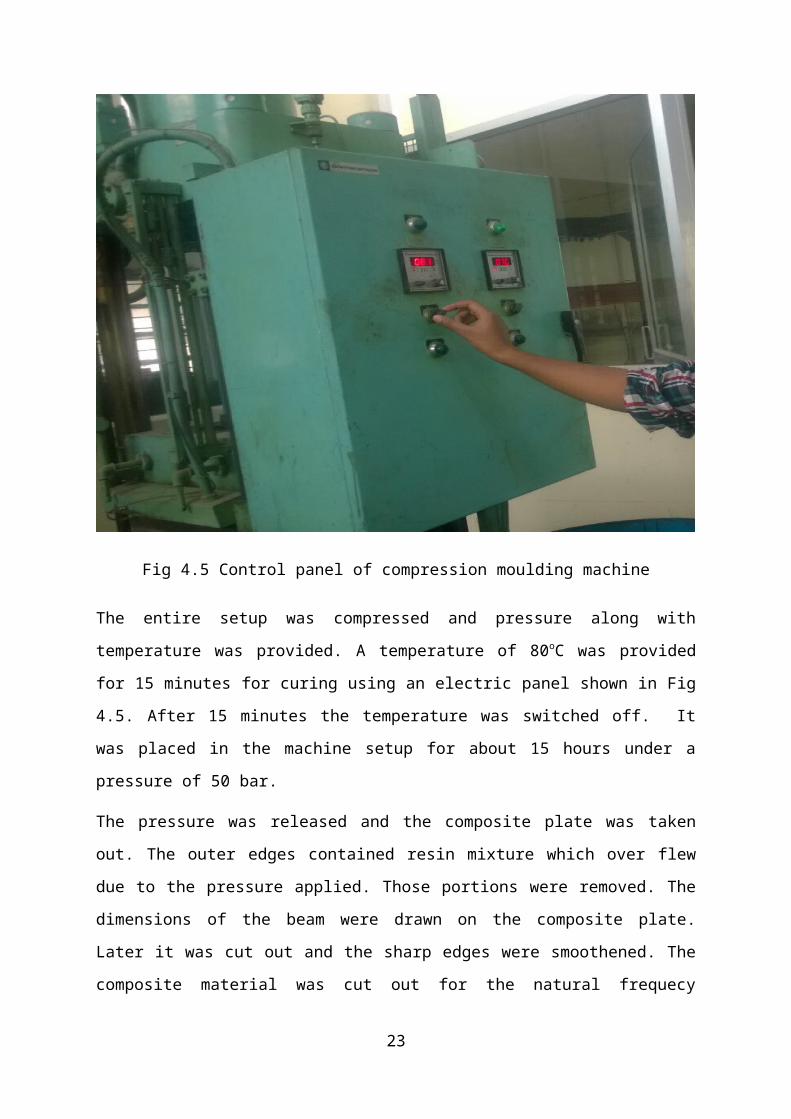
Fig 4.5 Control panel of compression moulding machine
The entire setup was compressed and pressure along with temperature was provided. A
temperature of 80oC was provided for 15 minutes for curing using an electric panel shown in
Fig 4.5. After 15 minutes the temperature was switched off. It was placed in the machine
setup for about 15 hours under a pressure of 50 bar.
The pressure was released and the composite plate was taken out. The outer edges contained
resin mixture which over flew due to the pressure applied. Those portions were removed. The
dimensions of the beam were drawn on the composite plate. Later it was cut out and the sharp
edges were smoothened. The composite material was cut out for the natural frequecy analysis
and other pieces were used to find the fibre volume fraction and Youngs Modulus in X and Y
directions.
17
4.2 NATURAL FREQUENCY CALCUATION OF ALUMINIUM BEAM
4.2.1 NATURAL FREQUENCY
Natural frequency is the frequency at which a system tends to oscillate in the absence of any
driving or damping force.
Free vibration of any elastic body is called natural vibration and happens at a frequency
called natural frequency. Natural vibration is different from forced vibration which happens
at frequency of applied force (forced frequency). If forced frequency is equal to the natural
frequency, the amplitude of vibration increases manifold. This phenomenon is known
as resonance.
4.2.2 ANALYTICAL CALCULATION OF NATURAL FREQUENCIES
Dimension the Aluminium beam considered for analysis is 300 mm x 30 mm x 3 mm. The
analysis was done using fixed free boundary condition. The natural frequency was found out
experimentally was validated and modelled in ANSYS software. The results obtained are
very close which implies the methodology used is correct.
E= 0.7 × 10⁵ N/mm2,
I = (bd3) ÷ 12 = (30*33) / 12 = 67.5 mm4
ρ = 2719 * 10-9 kg/mm3
A = b*d = 30 * 3 = 90 mm2
L = 300mm.
For a cantilever beam subjected to free vibration, and the system is considered as continuous
system in which the beam mass is considered as distributed along with the stiffness of the
shaft, the equation of motion (equation 4.1) can be written as,
Where, E is the modulus of rigidity of beam material, I is the moment of inertia of the beam
cross-section, Y(x) is displacement in y direction at distance x from fixed end, ω is the
circular natural frequency, m is the mass per unit length, m = ρA(x), ρ is the material
density, x is the distance measured from the fixed end.
18
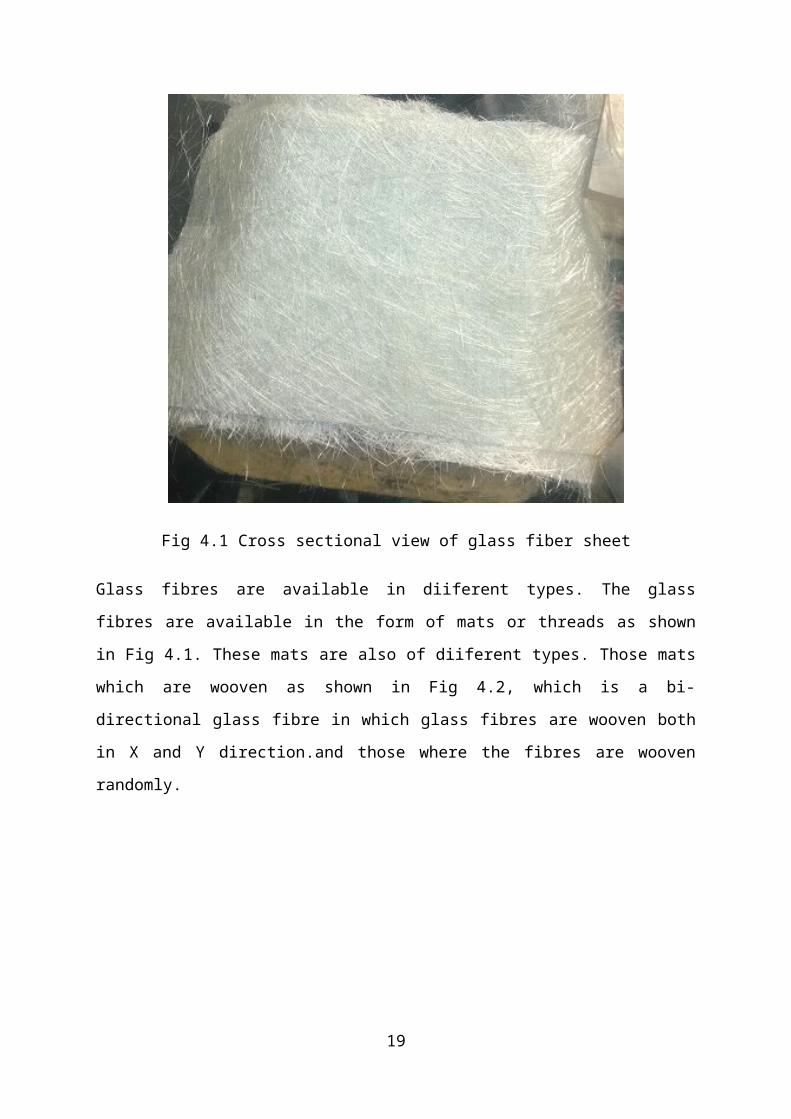
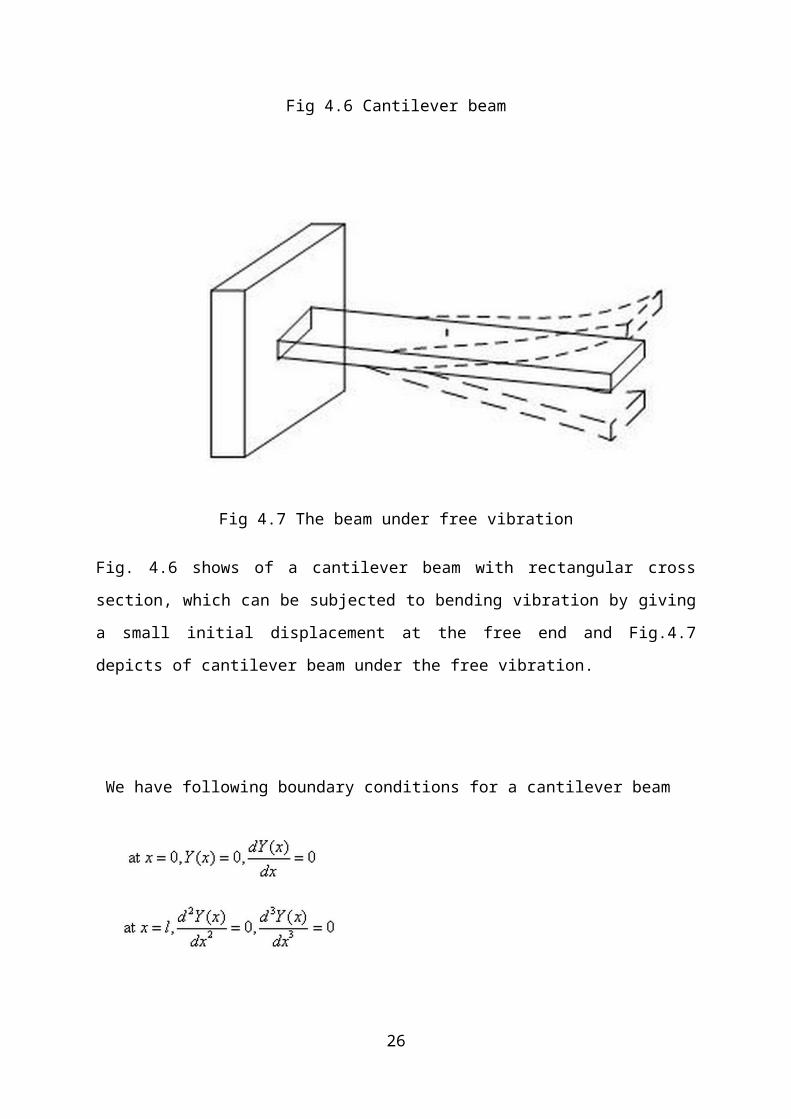
Fig 4.6 Cantilever beam
Fig 4.7 The beam under free vibration
Fig. 4.6 shows of a cantilever beam with rectangular cross section, which can be subjected to
bending vibration by giving a small initial displacement at the free end and Fig.4.7 depicts of
cantilever beam under the free vibration.
We have following boundary conditions for a cantilever beam
19
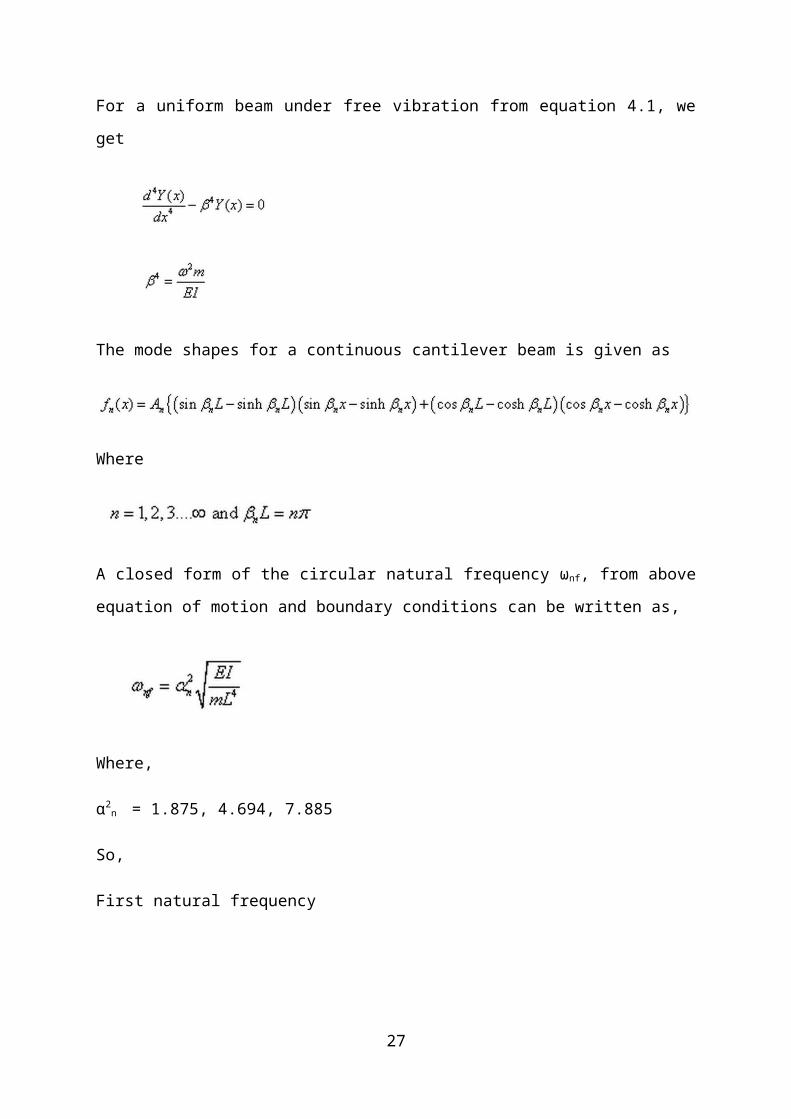
For a uniform beam under free vibration from equation 4.1, we get
The mode shapes for a continuous cantilever beam is given as
Where
A closed form of the circular natural frequency ωnf, from above equation of motion and
boundary conditions can be written as,
Where,
α2n = 1.875, 4.694, 7.885
So,
First natural frequency
20
Second natural frequency
Third natural frequency
The natural frequency is related with the circular natural frequency as
where I, the moment of inertia of the beam cross-section, for a circular cross-section it is
given as
I= πd 464
where, d is the diameter of cross section and for a rectangular cross section
I= bd 312
where b and d are the breadth and width of the beam cross-section as shown in the Fig. 4.8.
Fig 4.8 Cross-section of the cantilever beam
21

Fig 4.9 The first three undamped natural frequencies and mode shape of cantilever beam
First mode
ωn1 = 1.8752 √[EI / ρAL4]
= 1.8752√[(.7*10-9*67.5) /(2719*10-9*90*3004)]
=5.42 rad/sec.
fn1 = ωn1/2π = 5.42/2π
fn 1 =0.8638 Hz.
Second mode
ωn2 = 4.6942 √[EI / ρAL4]
22
= 4.6942√[(.7*10-9*67.5) /(2719*10-9*90*3004)]
=34.01 rad/sec.
fn2 = ωn2/2π = 34.01/2π
fn2 = 5.414 Hz
Third mode
ωn3 = 7.8552 √[EI / ρAL4]
=7.8552 √[(.7*10-9*67.5) /(2719*10-9*90*3004)]
=95.18 rad/sec
fn3 = ωn3/2π = 95.18/2π
fn3 = 15.16Hz.
4.2.2 RESULTS OBTAINED USING ANSYS SOFTWARE
(a)
23
(b)
(c)
Fig 4.10(a) First Mode, (b) Second Mode, (c) Third Mode of Aluminium beam
24

The Fig4.10 shows the first, second and third natural frequencies along with its mode shapes
obtained from ANSYS. The results obtained from ANSYS matches with the analytical
expression used.
4.2.3 EXPERIMENTAL DETERMINATION OF NATURAL FREQUENCY OF
ALUMINIUM BEAM
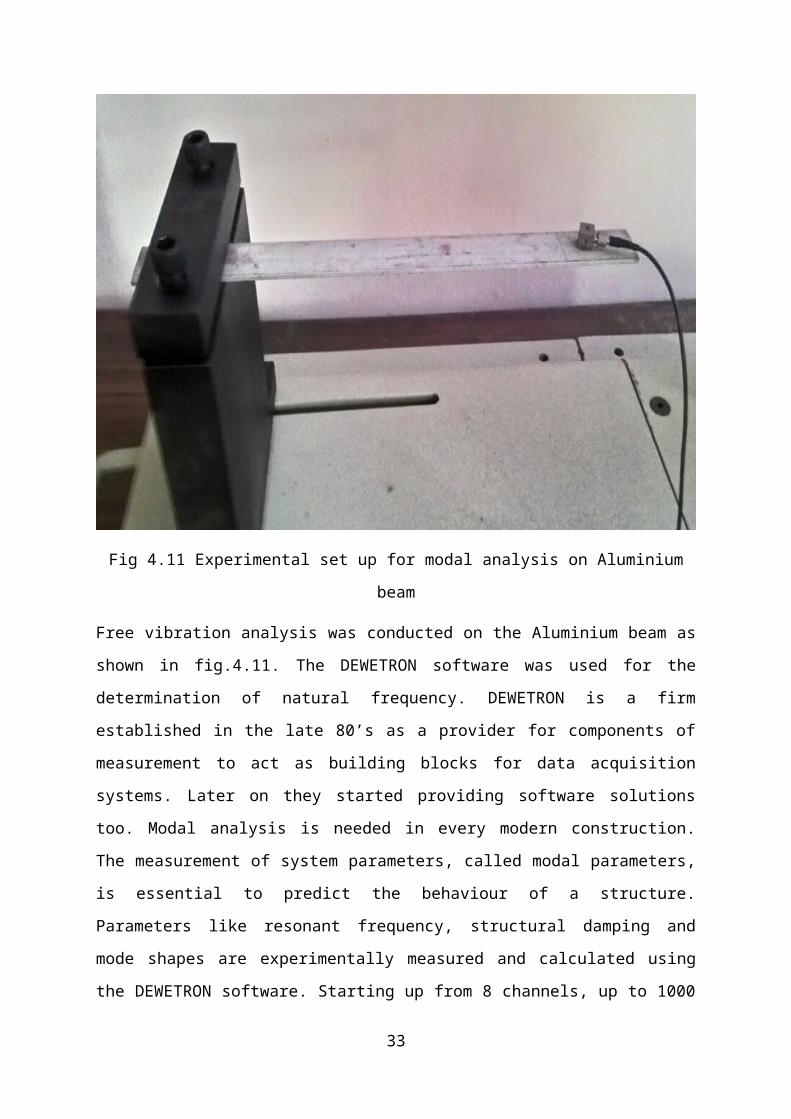
Fig 4.11 Experimental set up for modal analysis on Aluminium beam
Free vibration analysis was conducted on the Aluminium beam as shown in fig.4.11. The
DEWETRON software was used for the determination of natural frequency. DEWETRON is
a firm established in the late 80’s as a provider for components of measurement to act as
building blocks for data acquisition systems. Later on they started providing software
solutions too. Modal analysis is needed in every modern construction. The measurement of
system parameters, called modal parameters, is essential to predict the behaviour of a
structure. Parameters like resonant frequency, structural damping and mode shapes are
experimentally measured and calculated using the DEWETRON software. Starting up from 8
channels, up to 1000 channels could be used for complex structures. In this experiment a 12
channel box setup was used, out of which only 3 channels were used.
25
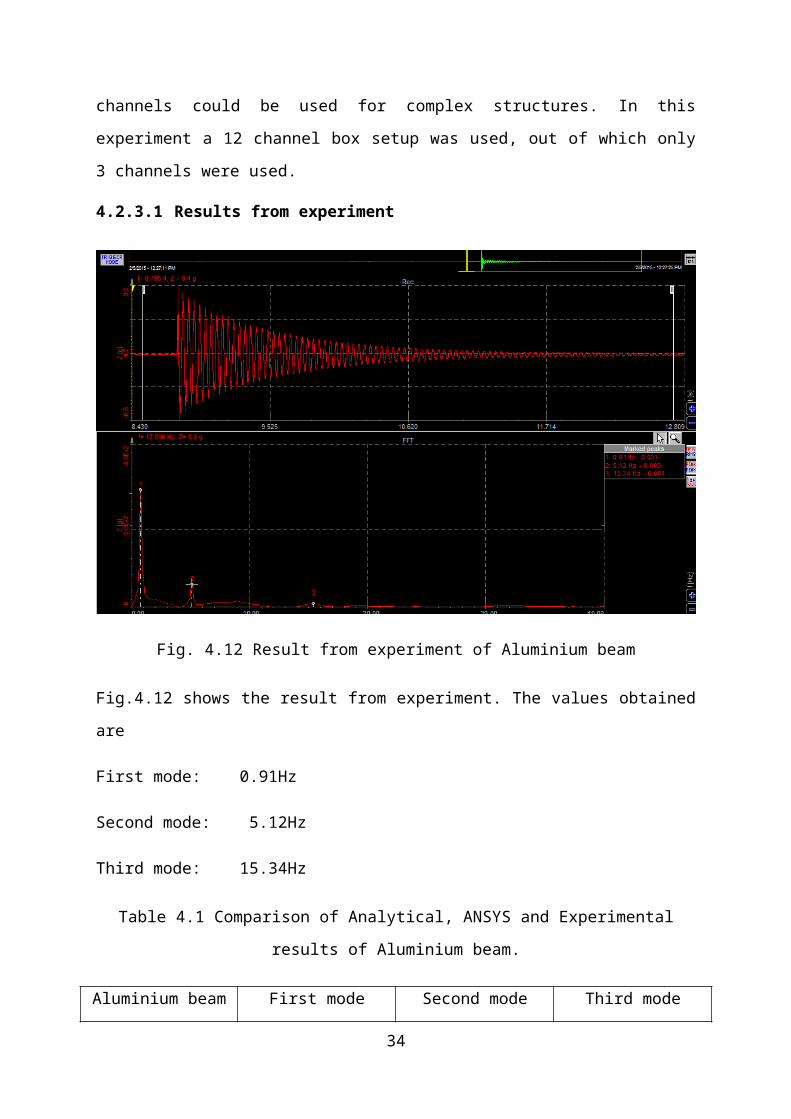
4.2.3.1 Results from experiment
Fig. 4.12 Result from experiment of Aluminium beam
Fig.4.12 shows the result from experiment. The values obtained are
First mode: 0.91Hz
Second mode: 5.12Hz
Third mode: 15.34Hz
Table 4.1 Comparison of Analytical, ANSYS and Experimental results of Aluminium beam.
Aluminium beam First mode (Hz) Second mode (Hz) Third mode (Hz)
Analytical 0.8638 5.414 15.16
ANSYS 0.8716 5.4583 15.2852
Experimental 0.91 5.12 15.34
The natural frequency of first, second and third mode of vibration is shown in Table 5.1.
26
4.3 DETERMINATION OF PROPERTIES OF COMPOSITE BEAM
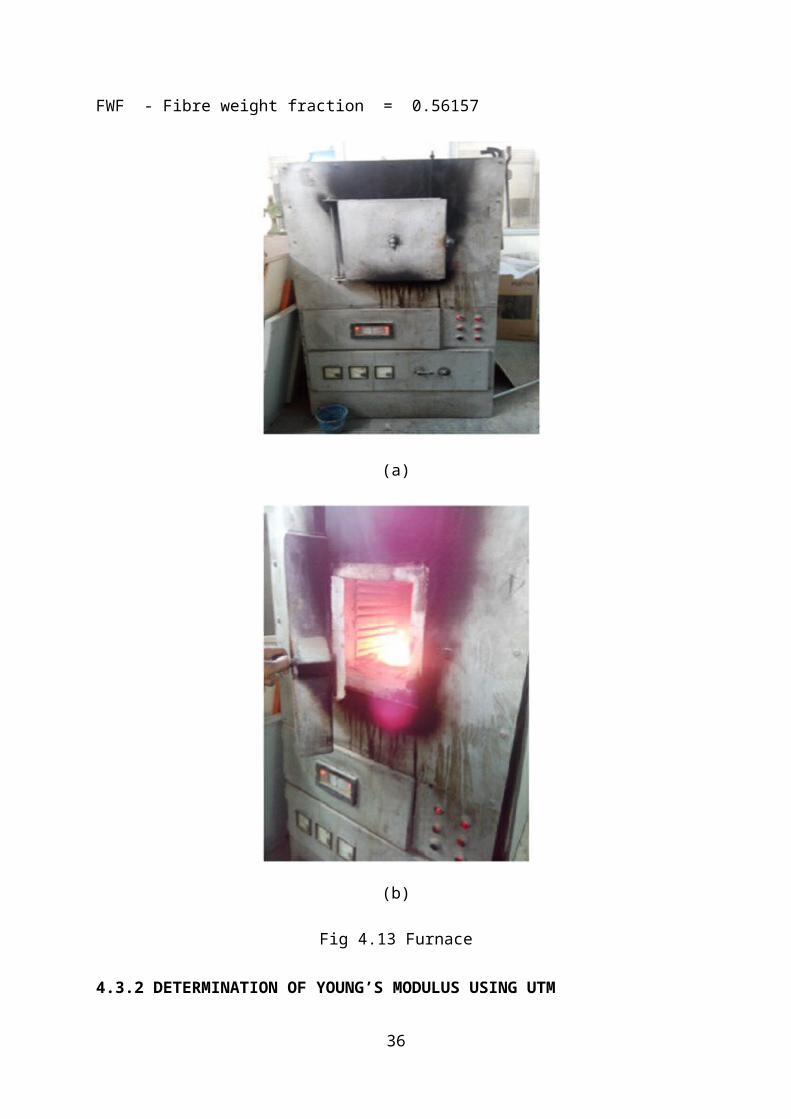
4.3.1 BURN-OUT TEST
To find the percentage of of resin and fibre in the manufactured component a volume fraction
test was conducted. The total weight of the composite was measured using a weiging balance
of least count 0.0001 grams. The composite was later placed in a furnace shown in Fig6.1 at a
temperature of more than 6000C and placed inside the furnace for 10-15 minutes. The resin
got burned and the remaining fibre only remained. The weight of the fibre was measured
again. By taking ratio, the volume fraction was found out.
Fibre weight in test sample = 14.1396 gram
Resin weight in test sample = 11.039 gram
FVF - Fibre volume fraction = 0.376
FWF - Fibre weight fraction = 0.56157
(a)
27

(b)
Fig 4.13 Furnace
4.3.2 DETERMINATION OF YOUNG’S MODULUS USING UTM
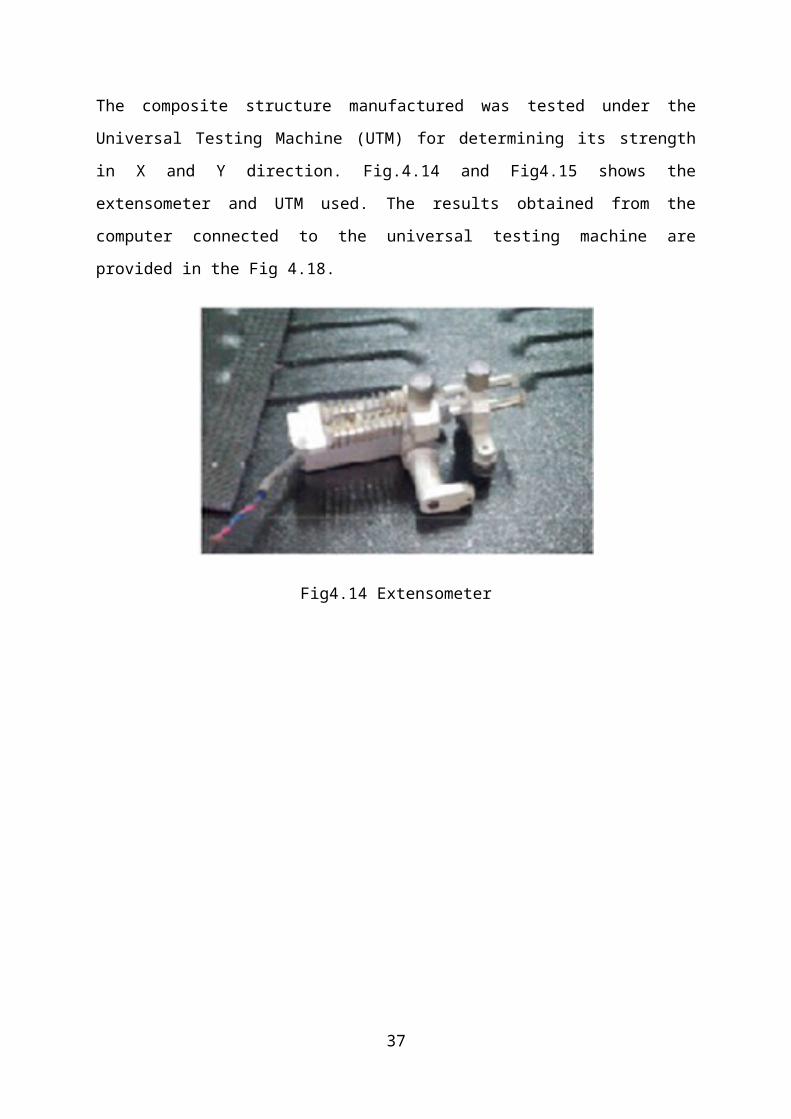
The composite structure manufactured was tested under the Universal Testing Machine
(UTM) for determining its strength in X and Y direction. Fig.4.14 and Fig4.15 shows the
extensometer and UTM used. The results obtained from the computer connected to the
universal testing machine are provided in the Fig 4.18.
Fig4.14 Extensometer
28
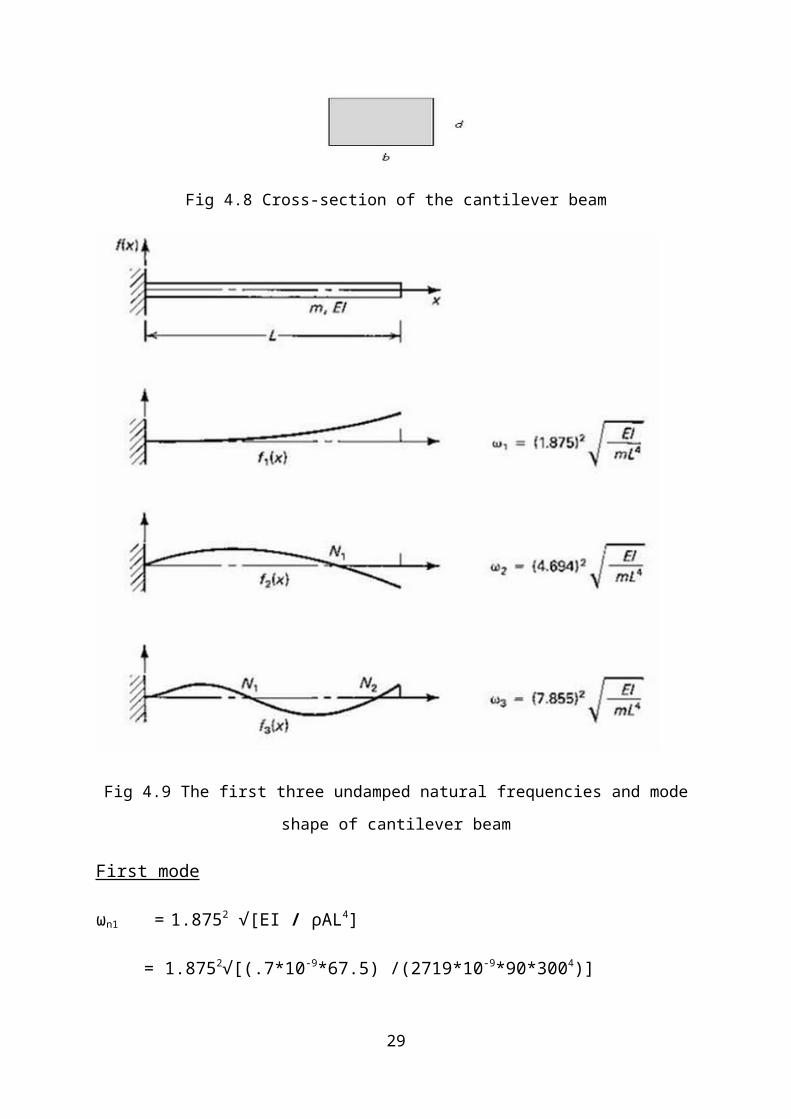
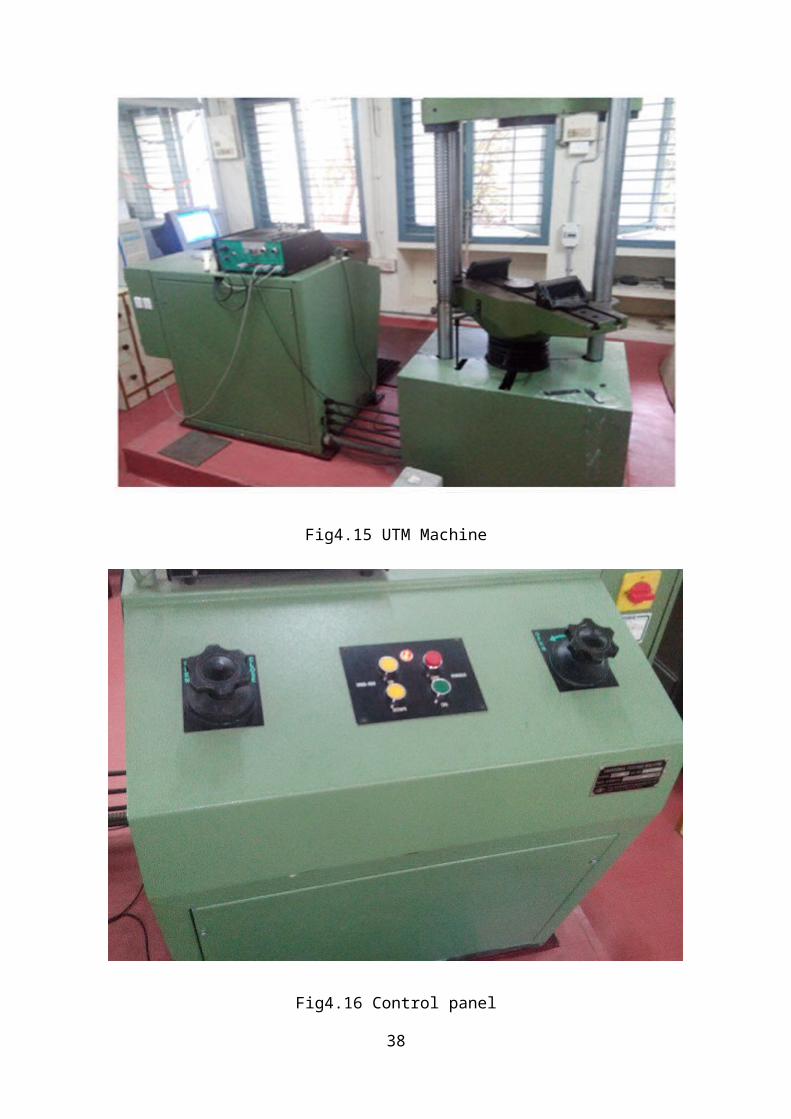
Fig4.15 UTM Machine
Fig4.16 Control panel
29

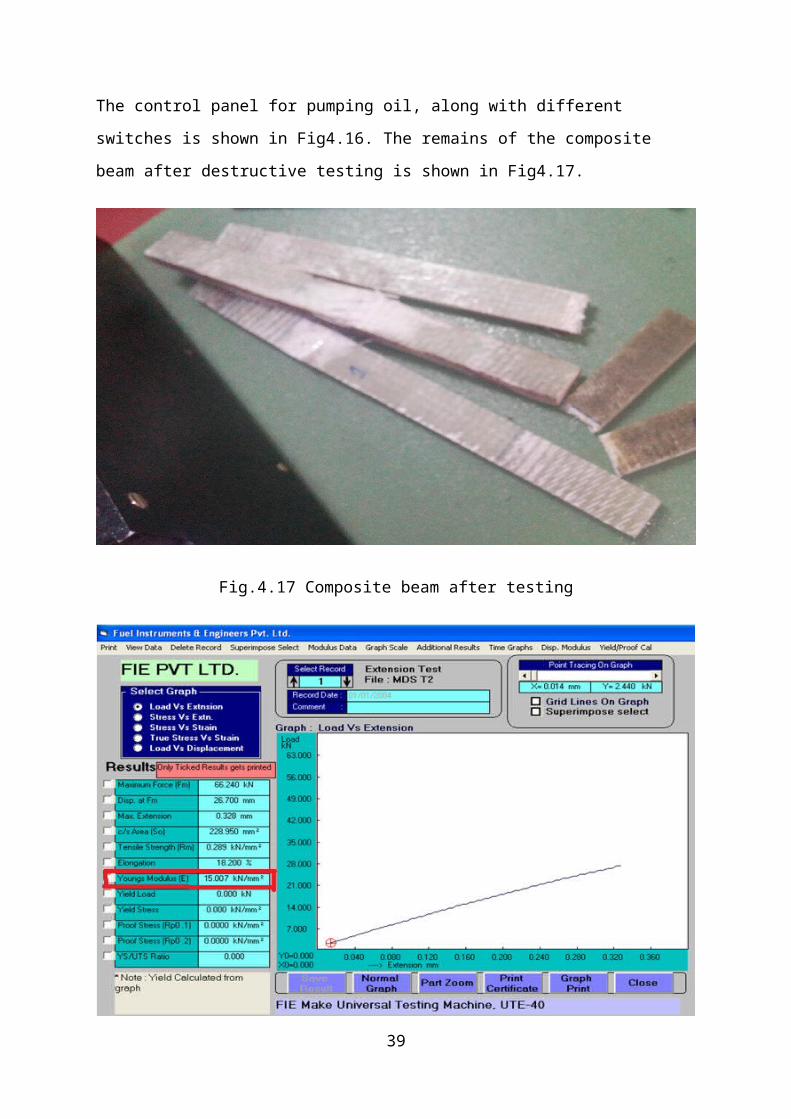
The control panel for pumping oil, along with different switches is shown in Fig4.16. The
remains of the composite beam after destructive testing is shown in Fig4.17.
Fig.4.17 Composite beam after testing
(a)
30

(b)
Fig.4.18 (a) Results in X direction, (b) Results in Y direction.
Young’s modulus in X direction Ex = 15.007 KN/mm2
Young’s modulus in Y direction Ey = 15.055 KN/mm2
These material properties obtained are used for natural frequency evaluation using ANSYS.
31

4.4 DETERMINATION OF NATURAL FREQUENCY OF COMPOSITE BEAM
WITHOUT CRACK
4.4.1 NATURAL REQUENCY USING ANSYS SOFTWARE
The natural frequency of the composite beam was found out using ANSYS software and
experimentally. The beam dimension used for the analysis was 214 mm x 27 mm x 10 mm.
The density of the material was found to be 1860 kg/m3.
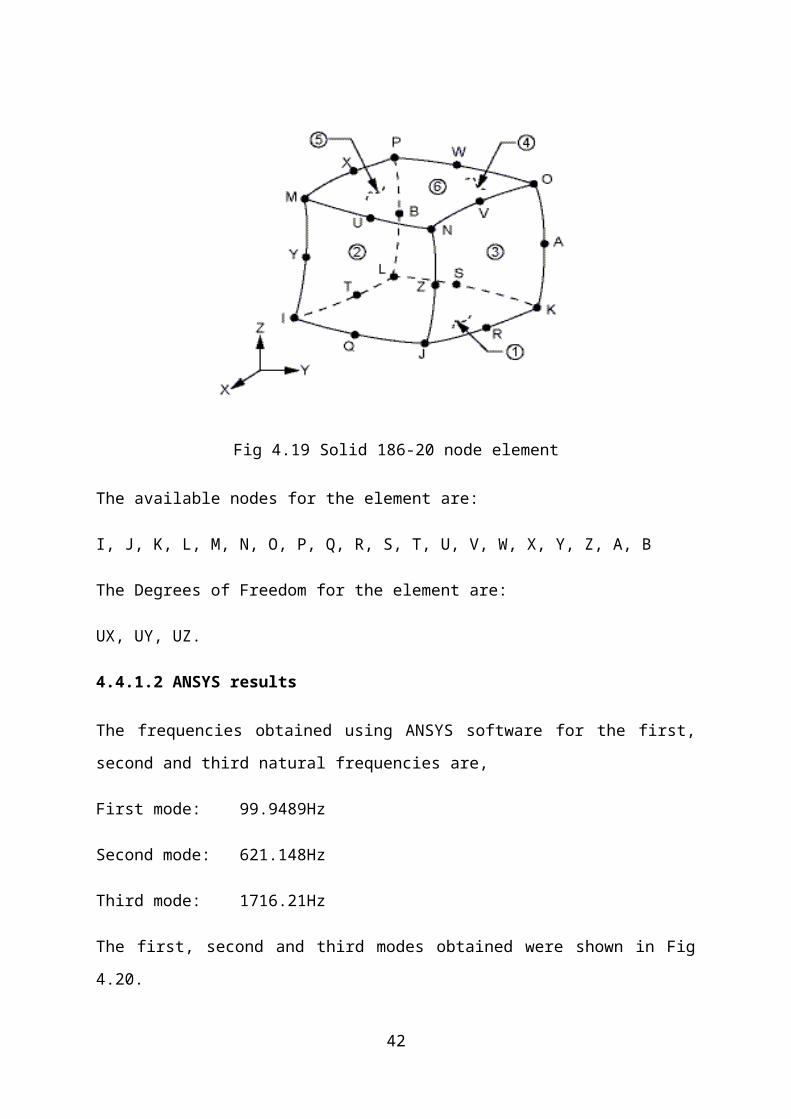
4.4.1.1 Element used
SOLID186 shown in Fig.4.19 is a higher order 3-D 20-node solid element that exhibits
quadratic displacement behaviour. The element is defined by 20 nodes having three degrees
of freedom per node: translations in the nodal x, y, and z directions. The element supports
plasticity, hyper elasticity, creep, stress stiffening, large deflection, and large strain
capabilities. It also has mixed formulation capability for simulating deformations of nearly
incompressible elasto-plastic materials, and fully incompressible hyper elastic materials. A
lower-order version of the SOLID186 element is SOLID185. SOLID186, the Homogeneous
Structural solid element is well suited for modelling irregular meshes. The element may have
any spatial orientation.
Fig 4.19 Solid 186-20 node element
The available nodes for the element are:
32
I, J, K, L, M, N, O, P, Q, R, S, T, U, V, W, X, Y, Z, A, B
The Degrees of Freedom for the element are:
UX, UY, UZ.
4.4.1.2 ANSYS results
The frequencies obtained using ANSYS software for the first, second and third natural
frequencies are,
First mode: 99.9489Hz
Second mode: 621.148Hz
Third mode: 1716.21Hz
The first, second and third modes obtained were shown in Fig 4.20.
(a)
33
(b)
(c)
Fig 4.20 (a) First Mode, (b) Second Mode, (c) Third Mode of composite beam without crack
34

4.4.2 NATURAL REQUENCY USING EXPERIMENTAL SET-UP
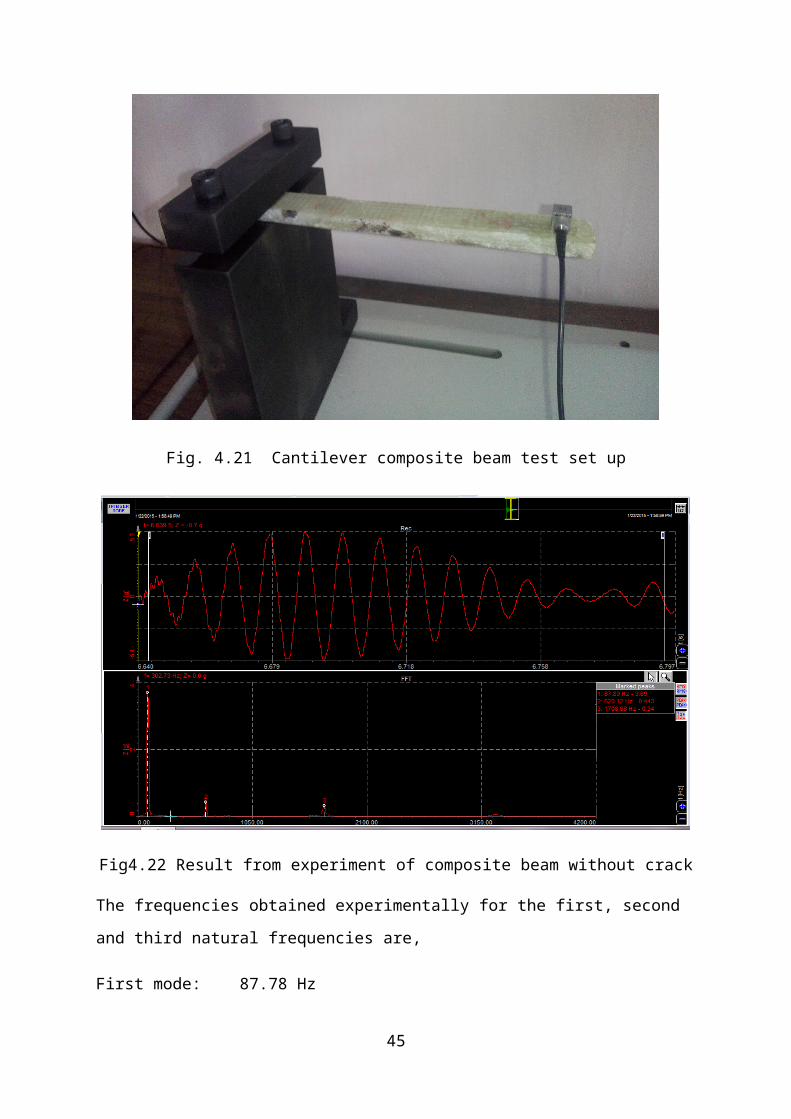
The natural frequency of the composite beam was found using Cantilever beam test using the
apparatus shown in Fig.4.21.
Fig. 4.21 Cantilever composite beam test set up
Fig4.22 Result from experiment of composite beam without crack
35
The frequencies obtained experimentally for the first, second and third natural frequencies
are,
First mode: 87.78 Hz
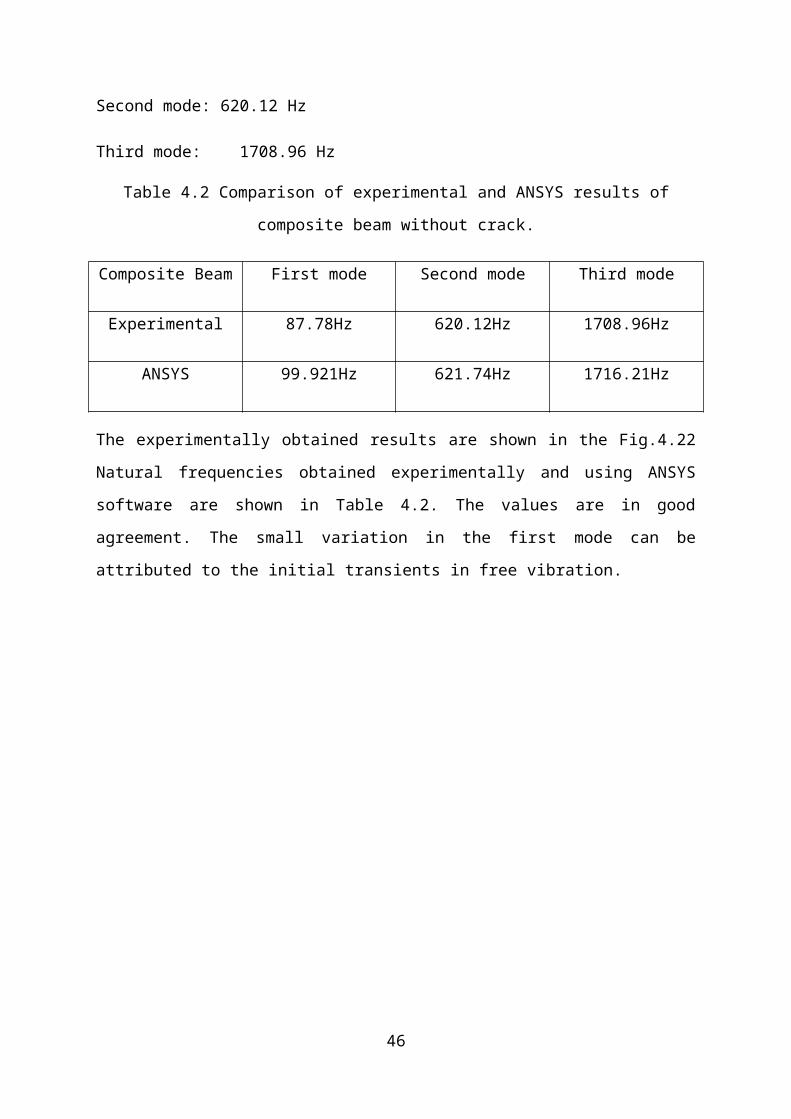
Second mode: 620.12 Hz
Third mode: 1708.96 Hz
Table 4.2 Comparison of experimental and ANSYS results of composite beam without crack.
Composite Beam First mode Second mode Third mode
Experimental 87.78Hz 620.12Hz 1708.96Hz
ANSYS 99.921Hz 621.74Hz 1716.21Hz
The experimentally obtained results are shown in the Fig.4.22 Natural frequencies obtained
experimentally and using ANSYS software are shown in Table 4.2. The values are in good
agreement. The small variation in the first mode can be attributed to the initial transients in
free vibration.
36
4.5 DETERMINATION OF NATURAL FREQUENCY OF COMPOSITE BEAM
WITH CRACK
This study is an investigation of the effects of cracks on the dynamical characteristics of a
cantilever composite beam, made of glass fibre-reinforced along with epoxy resin. The finite
element and the component mode synthesis methods are used to model the problem. The
cantilever composite beam was divided into several components from the crack sections. The
effects of the location and depth of the cracks, and the volume fraction and orientation of the
fibre on the natural frequencies and mode shapes of the beam with transverse non-
propagating open cracks, are explored. The results of the study lead to conclusions that,
presented method is adequate for the vibration analysis of cracked cantilever composite
beams, and by using the drop in the natural frequencies and the change in the mode shapes,
the presence and nature of cracks in a structure can be detected.
A crack of dimension 2mm x 27mm x 4mm was provided and two cases were analysed, one
with the crack closer to the fixed end and the other away from the fixed end.
4.5.1 CRACK CLOSER TO FIXED END
4.5.1.1 ANSYS Results
The ANSYS results for the first, second and third mode are shown in Fig 4.23.
(a)
37
(b)
(c)
Fig.4.23 (a) First mode, (b) second mode and (c) third mode of composite beam with crack
closer to the fixed end
38
The frequencies obtained using ANSYS software for the first, second and third natural
frequencies are,
First mode: 86.48 Hz
Second mode: 584.7 Hz
Third mode: 1675.01 Hz
4.5.1.2 Natural frequency using Experimental Set-Up
Fig4.24 Results from experiment of composite beam with crack closer to the fixed end
The experimental result is shown in figure 4.24.
The frequencies obtained experimentally for the first, second and third natural frequencies
are,
First mode: 78.13 Hz
Second mode: 537.11 Hz
Third mode: 1649.63 Hz
39
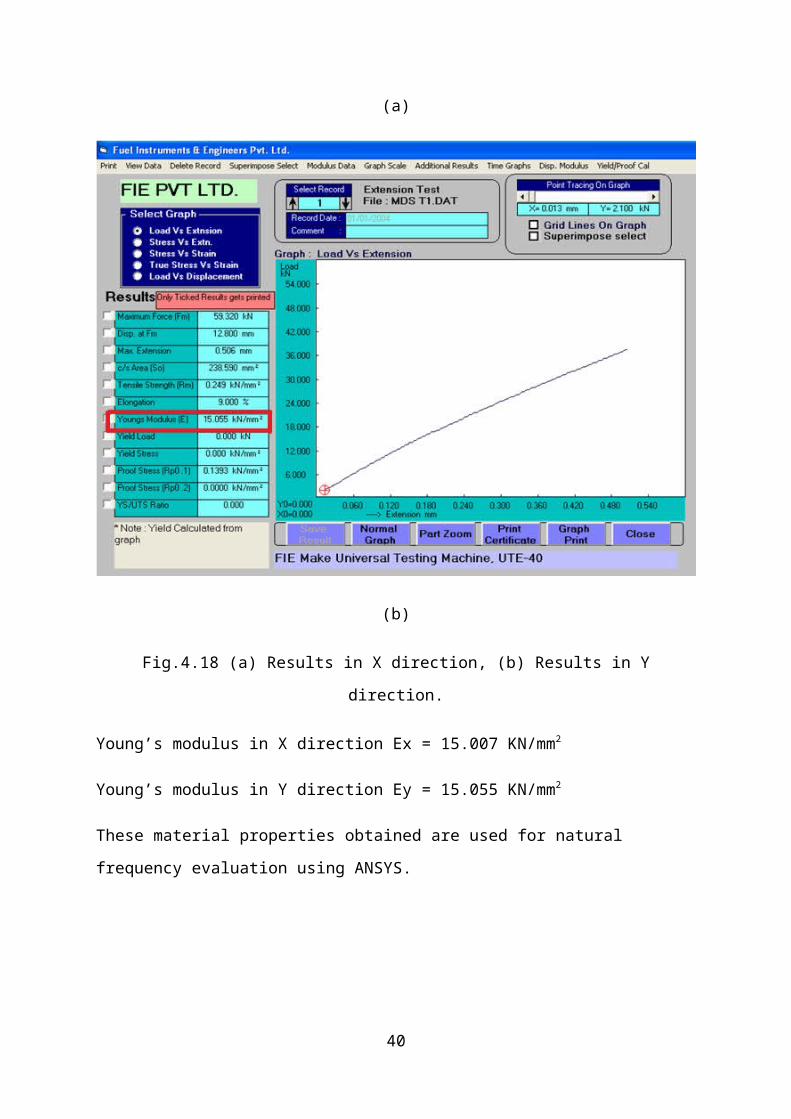
Table 4.3 Comparison of experimental and ANSYS results of composite beam with crack
closer to fixed end
Composite Beam First mode Second mode Third mode
Experimental 78.13Hz 537.11Hz 1649.63Hz
ANSYS 86.48Hz 584.7Hz 1675.01Hz
A comparison of the experimental and ANSYS is shown in Table 4.3. The results obtained by
both the methods are almost similar.
4.5.2 CRACK AWAY FROM THE FIXED END
4.5.2.1 ANSYS Results
The ANSYS result is shown in Fig. 4.25.
(a)
40
(b)
(c)
Fig. 4.25 (a) First Mode, (b) Second Mode and (c) Third Mode of composite beam with crack
away from the fixed end
41
The frequencies obtained using ANSYS software for the first, second and third natural
frequencies are,
First mode: 100.55 Hz
Second mode: 622.64 Hz
Third mode: 1711.52 Hz
4.5.2.2 Natural frequency using Experimental Setup
Fig.4.26 Results from experiment of composite beam with crack away from the fixed end
The experimental results obtained are shown in Fig.4.26.
The frequencies obtained using ANSYS software for the first, second and third natural
frequencies are,
First mode: 87.89 Hz
Second mode: 620.12 Hz
Third mode: 1694.34 Hz
42
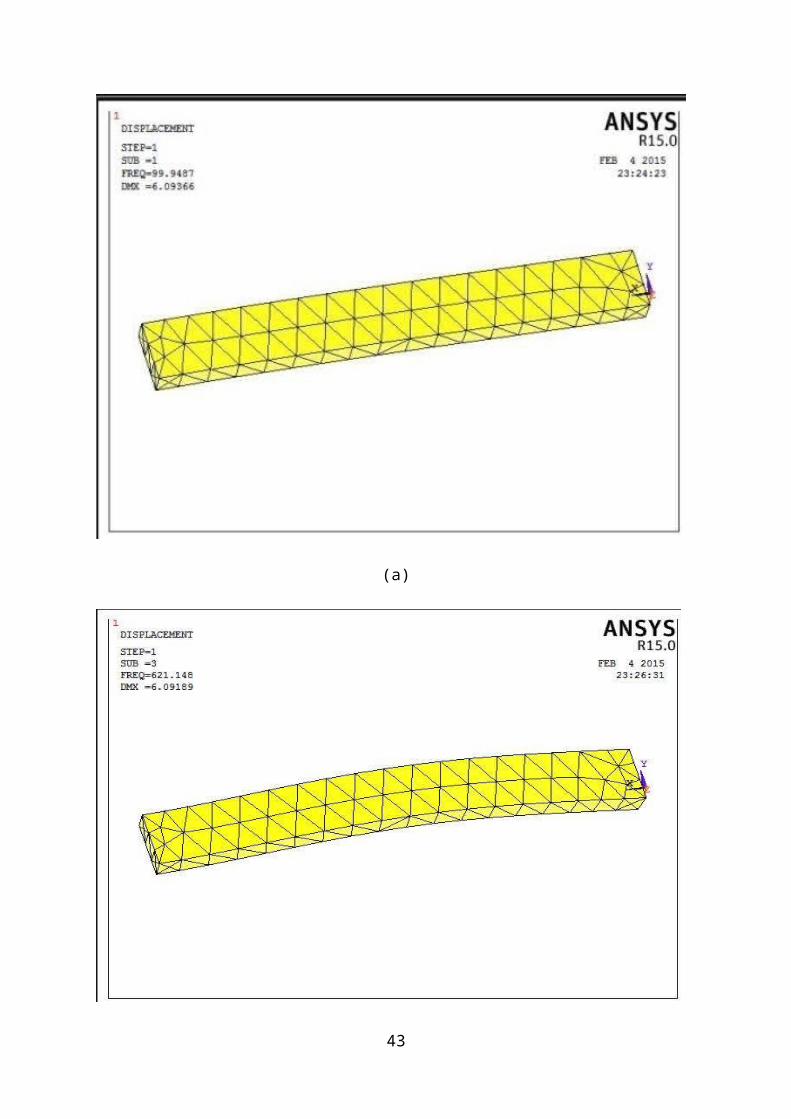
Table 4.4 Comparison of experimental and ANSYS results of composite beam with crack
away from fixed end
Composite Beam First mode Second mode Third mode
Experimental 87.89Hz 620.12Hz 1694.34Hz
ANSYS 100.55Hz 622.64 Hz 1711.52Hz
The comparison of the experimental and ANSYS results is shown in Table 4.4. The values
obtained using both the methods are similar.
43

CHAPTER 5
CONCLUSION
While in operation, all structures are subjected to vibrations from different sources, whose
effects may cause initiation of structural defects such as cracks which, as time progresses,
could ultimately lead to the catastrophic failure or breakdown of the structure. This calls out
for the timely inspection of the manufactured products in order to ensure standard quality.
Over the past few decades several methods, such as non-destructive testing, have come into
the array in order to meet this need which could be used to monitor the condition of a
structure. It is clear that new reliable and inexpensive methods to monitor structural defects
such as cracks should be explored.
Vibration analysis, which can be used to detect structural defects such as cracks, of any
structure offers an effective, inexpensive and fast means of nondestructive testing. What
types of changes occur in the vibration characteristics, how these changes can be detected and
how the condition of the structure is interpreted based on these data has been the topic of
study in this paper.
Bi- directional composite beam with epoxy resin as matrix along with glass fibers was
manufactured. Compression molding was the method used for the fabrication. The
mechanical properties of the composite were determined experimentally. Free vibration
analysis of composite beam was done both experimentally and using ANSYS software.
Initially the methodology was proven using an aluminum beam. Neglecting minor
experimental errors, the values were found to be in good agreement.
A crack was then introduced in the beam with two conditions: crack near to the fixed end and
crack away from the fixed end. Vibration analysis of the beam was done experimentally and
using ANSYS software and the natural frequencies of the beam corresponding to the first
three modes were determined. The frequencies corresponding to the beam without crack and
the beam with crack away from the fixed end are almost similar which indicates that the
presence of crack away from the point of consideration has got almost no effect on the
dynamics of the structure.
But there is a large variation in the frequency of the beam when the crack comes closer to the
fixed end. The variation in the frequency increases as the crack comes closer to the fixed end.
The change in natural frequency of the beam without crack to the beam with crack is greater
44
when the crack is closer to the fixed end. By measuring the natural frequency and finding the
variation, the position or location of the crack can be determined. It can also be said that if the
change in natural frequency is greater, the structure would be in greater danger. If the
variation is low, then the structure would be safe. This illustrates that the structure becomes
weak due to the presence of crack closer to the fixed end. The frequency variation could be
used to determine the position of the crack and with further analysis even its dimensions
could be determined. The application of these results lies in predicting the failure of a
structure which is subjected to internal defects by just measuring its frequencies.
45
REFERENCE
[1]. Dewey H Hodges et.al(1991), Free-Vibration Analysis of Composite Beams, AIAA
Journal vol.28 pp(3-12).
[2]. Ramesh K. Nayak et.al(2014), Effect of epoxy modifiers (Al2O3/SiO2/TiO2) on
mechanical performance of epoxy/glass fiber hybrid composites, procedia Material Science
pp(1-6).
[3]. Murat Kisa(2003), Free vibration analysis of a cantilever composite beam with multiple
cracks, Composite Science and Technology pp(1-12).
[4]. R. Murugan(2014), Investigation on Static and Dynamic Mechanical Properties of
Epoxy Based Woven Fabric Glass/Carbon Hybrid Composite Laminates, procedia
Engineering pp(1-10).
[5]. S.S. Rao(2004), Mechanical Vibrations, Vol 5,pp(1-30).
[6]. ANSYS 15.0 User Reference Manuel.
[7]. www.dewetron.com
[8] www.wikipedia.com
46

LIST OF PUBLICATIONS
1. Free Vibration Studies on Bi-Directional Composite Beam (Accepted for publishing).
2. Modal Analysis of Bi-Directional Composite with Transverse Crack (To be
communicated).
47